Embed Size (px)
Citation preview

This work is licensed under a
Creative Commons Attribution-NonCommercial-NoDerivatives 4.0 International licence
Newcastle University ePrints - eprint.ncl.ac.uk
Osuolale FN, Zhang J.
Energy efficiency optimisation for distillation column using artificial neural
network models.
Energy 2016, 106, 562-578.
Copyright:
© 2016. This manuscript version is made available under the CC-BY-NC-ND 4.0 license
DOI link to article:
http://dx.doi.org/10.1016/j.energy.2016.03.051
Date deposited:
18/03/2016
Embargo release date:
12 April 2017

1
Energy Efficiency Optimisation for Distillation Column Using Artificial Neural
Network Models
Funmilayo N. Osuolale, Jie Zhang*
School of Chemical Engineering and Advanced Materials, Newcastle University, Newcastle upon
Tyne NE1 7RU, UK
e-mail: [email protected] or [email protected]; [email protected]
Abstract
This paper presents a neural network based strategy for the modelling and optimisation of energy
efficiency in distillation columns incorporating the second law of thermodynamics. Real-time
optimisation of distillation columns based on mechanistic models is often infeasible due to the effort in
model development and the large computation effort associated with mechanistic model computation.
This issue can be addressed by using neural network models which can be quickly developed from
process operation data. The computation time in neural network model evaluation is very short making
them ideal for real-time optimisation. Bootstrap aggregated neural networks are used in this study for
enhanced model accuracy and reliability. Aspen HYSYS is used for the simulation of the distillation
systems. Neural network models for exergy efficiency and product compositions are developed from
simulated process operation data and are used to maximise exergy efficiency while satisfying products
qualities constraints. Applications to binary systems of methanol-water and benzene-toluene
separations culminate in a reduction of utility consumption of 8.2% and 28.2% respectively. Application
to multi-component separation columns also demonstrate the effectiveness of the proposed method with
a 32.4% improvement in the exergy efficiency.
Keywords: Bootstrap aggregated neural network, exergy, modelling, optimisation
1 Introduction
The importance of distillation columns continues to increase both in the traditional petro-chemical
industry and in the sustainable sector with renewable resources and energy. The key role they play in
the chemical and petrochemical industries and the quest to make them more energy efficient has made
distillation processes high priority for all stake holders in the industries. Distillation unit poses a great
challenge to process and control engineers because of its complexity. It comes in varieties of
configurations with different operating objectives, significant interactions among the control loops and
specialised constraints [1]. Usually the order of economic importance in the control and optimisation of
* Corresponding author

2
distillation columns is product quality, process throughput and utility reductions and often traded off
between them has to be made.
Optimisation of distillation column operations is essential in order to achieve energy efficiency while
meeting product quality constraints. Optimisation is a major quantitative tool in decision making for
the process industries. Rather than large scale expansion, most industries will maximise available
resources for maximum profitability. Optimisation of distillation columns requires accurate process
models. A number of distillation process models are available in the published literatures [2] but the
complexity of distillation processes has led to a number of assumptions that might limit the universality
of the models [3]. Most of the mechanistic models of distillation systems have assumed equilibrium
cases for the stages. Such models deviate from the reality and will not give a true representation. To
overcome this, non-equilibrium stages are assumed [4]. Non-equilibrium models however involve large
number of variables, leading to distillation models with differential equations that may exhibit high
differential index that could generate stiff dynamics. The development of such mechanistic models is
generally very effort demanding as they involve a large number of differential and algebraic equations
and a large number of model parameters. Furthermore, the solutions and calculations of such
mechanistic models are computationally demanding making them not suitable for real-time
optimisation. To overcome these problems, data driven models such as artificial neural network (ANN)
models can be utilised [5]. ANN has been recognised as a powerful tool that can facilitate the effective
development of data-driven models for highly nonlinear and multivariable systems [6]. ANN can learn
complex functional relations for a system from the input and output data of the system. Furthermore,
their evaluation is much less computationally demanding making them suitable for real-time
optimisation.
Most neural network applications to distillation systems target at modelling the product specification as
the model output [7]. Neural network has been applied to the simple cases of binary systems [8] and
sometimes targeted at inferential composition control [9] and model predictive control of the column
[10]. In some related works, applications to the control of multi-component systems are presented for
traditional column [11] and for dividing wall column [12]. Economic objective in terms of profitability
is often the focus in the optimisation of such distillation processes [13]. However, with the issues of
global warming, greenhouse gas effects, and depleting fossil energy resources, the issue of energy
efficiency of distillation processes has been brought to the limelight. The need therefore arise to focus
on energy efficiency of the column especially focusing on second law of thermodynamics (exergy
analysis) in lieu of first law of thermodynamics. Application of thermodynamics for process energy
improvement especially in terms of pinch analysis has been widely reported [14]. However, pinch
analysis is restricted to analysing for minimum utility consumption and or minimum number of heating
units for heat exchange equipments. Exergy analysis overcomes this restriction and encompasses the

3
total energy systems in processes. This work attempts to model the exergy efficiency of distillation
column using ANN. Previously ANN has been used to model distillation column, but there is a need
for robust and accurate model to represent the column within an optimisation frame work irrespective
of the complexities of the column. Bootstrap aggregated neural network is introduced in this study to
improve the prediction accuracy and reliability of the model. The model is then used for the optimisation
of exergy efficiency of the distillation column to reduce the energy consumption while satisfying
product quality specifications. Past studies on the exergy analysis of distillation column has been limited
to pinpointing and quantifying sources of inefficiencies in the column [15]. A further step away from
the usual is to use exergy analysis as a retrofit tool to present several practical options for process energy
improvement rather than as an analytical tool. This study develops an optimisation based methodology
incorporating exergy analysis for improving the energy efficiency of the column.
Quite a number of publications have been on ways to reduce the energy consumption of distillation
processes via alternate energy efficient arrangement. Of note amongst these are the heat integrated
distillation column (HIDC) [16], thermally coupled dividing wall column, petyluk column and
intensified distillation column [17]. In addition, previous works on the thermodynamic efficiency of the
crude distillation unit revealed a high energy and exergy loss of the column [18] with the overall
efficiency of the column ranging from 5-23% [19]. This shows that there is a lot of room for
improvement of the distillation column and indicates that a high entropy generation within column is
making the irreversibility of the column to be highly significant. In the past, there had been efforts at
devising methods of minimising entropy production rate in distillation columns, one of such attempt
was targeted at diabatic binary distillation systems [20]. Also most often, distillation columns are
optimised in terms of energy usage without paying particular attention to the reduction of entropy
generation within the column [21]. There is therefore a strong need to focus on reducing column’s
irreversibility by applying the second law of thermodynamics in column efficiency improvement.
In this work an attempt is made at improving the energy efficiency of distillation columns using the tool
of applied thermodynamics to determine the optimum operating conditions of the column with
consideration to energy efficiency and product quality. The energy efficiency is however on the basis
of reduction in the irreversibility of the column. Exergy analysis and optimisation are the major
qualitative and quantitative tools that are used in the decision making. In order to overcome the
difficulties in developing detailed mechanistic models for exergy efficiency calculation and using such
models in on-line optimisation, this paper proposes using neural networks to model exergy efficiency
in distillation columns from process operational data. The neural network models can be developed
quickly as long as process operational data are available and can be used effectively in real-time
optimisation. This work extends and modifies ANN model using bootstrap aggregated neural networks
to enhance model prediction accuracy and reliability.

4
The paper is structured as follows. Section 2 presents the second law analysis of distillation columns.
Neural network modelling of exergy efficiency is presented in Section 3. Applications of neural network
modelling and optimisation of exergy efficiency to binary and multi-component systems are presented
in Sections 4 and 5 respectively. Finally Section 6 gives the conclusions.
2 Thermodynamic Analysis
Exergy is from a combination of the 1st and 2nd laws of thermodynamics. It is a key aspect of providing
better understanding of the process and quantifying sources of inefficiency and distinguishing quality
of energy used [22]. Exergy analysis is a measure of the quality of energy. It is a tool for determining
how energy efficient a process is. Exergy analysis of processes gives insights into the overall energy
usage evaluation of the process, potentials for efficient energy usage of such processes can then be
identified and energy usage improving measures of the processes can be suggested.
The basis of the exergy concept was laid almost a century ago and was introduced as a tool for process
analysis in the 1950s by Keenan and Rant. Szargut [23] introduced the concept of chemical exergy and
its associated reference states. It is common to use ambient pressure and temperature as 0P = 101.325
kPa and 0T = 298.15 K.
The total exergy of a stream is calculated as
𝐸𝑥𝑡𝑜𝑡𝑎𝑙 = 𝐸𝑥𝑝ℎ𝑦 + 𝐸𝑥𝑐ℎ𝑒𝑚 (1)
where chemEx and Exphy are the chemical and physical exergy respectively.
For a multi-component system, the chemical and physical exergy are calculated as follows.
𝐸𝑥𝑐ℎ𝑒𝑚 = 𝑚(ℎ0 − ∑ 𝑧𝑖ℎ̅0𝑖 − 𝑇0(𝑠0 − ∑ 𝑧𝑖 �̅�0𝑖)) (2)
𝐸𝑥𝑝ℎ𝑦 = 𝑚(ℎ − ℎ0 − 𝑇0(𝑠 − 𝑠0)) (3)
where 𝑧𝑖 is the mole fraction of the ith component, ℎ̅0𝑖 and �̅�0𝑖 are the partial specific enthalpy and
entropy of the component at the reference condition respectively, h is the specific enthalpy, s is the

5
specific entropy, 0T is the reference temperature, 0h and 0s are specific enthalpy and entropy measured
at the reference conditions respectively.
The chemical exergy for a binary and non-reactive distillation system is assumed to be negligible. For
a heat source such as the reboiler, the work equivalent of the heat source is calculated as [24]
𝑊𝑍 = ∫ (1 −𝑇0
𝑇𝑍) 𝜕𝑄𝑍
𝑓𝑖𝑛𝑎𝑙
𝑖𝑛𝑡𝑖𝑎𝑙 (4)
where 𝜕𝑄𝑍 is an incremental heat transfer at absolute temperature 𝑇𝑍 and the integral is from initial state
to final state.
If the temperature of the heat source is constant, the work equivalent of heat is given by [24]
𝑊𝑍 = 𝑄𝑍 (1 −𝑇0
𝑇𝑍) (5)
Every real process has an element of irreversibility. Exergy analysis aims at minimising the
irreversibility by pinpointing the location of actual losses in processes and the magnitude of the losses.
The total exergy balance of the distillation column is
∑ 𝐸𝑥𝑖𝑛 = ∑ 𝐸𝑥𝑜𝑢𝑡 + 𝐼 (6)
where ∑ 𝐸𝑥𝑖𝑛 is the total exergy in to the system, ∑ 𝐸𝑥𝑜𝑢𝑡 is the total exergy out of the system and 𝐼 is
the quantified irreversibility of the system.
For a typical binary distillation system as shown in Fig. 1, [25]
∑ 𝐸𝑥𝑖𝑛 = 𝐸𝑥𝑓𝑒𝑒𝑑 + 𝐸𝑥𝑏𝑜𝑖𝑙𝑢𝑝 (7)
∑ 𝐸𝑥𝑜𝑢𝑡 = 𝐸𝑥𝑑𝑖𝑠𝑡𝑖𝑙𝑙𝑎𝑡𝑒 + 𝐸𝑥𝑏𝑜𝑡𝑡𝑜𝑚𝑠 + 𝐸𝑥𝑐𝑜𝑛𝑑𝑒𝑛𝑠𝑒𝑟 (8)
Essentially for a distillation column, Eq(7) and Eq(8) hold except to account for additional streams that
may be included due to the nature of the column. For instance, in the case of a multi-component system
with multiple feeds and side strippers, the feeds are included in the exergy in and the side strippers are
considered in the exergy out.

6
From Eq(6), the irreversibility of the system is calculated as:
𝐼 = ∑ 𝐸𝑥𝑖𝑛 − ∑ 𝐸𝑥𝑜𝑢𝑡 (9)
Efficiency of the system is then given as
𝜑 =∑ 𝐸𝑥𝑜𝑢𝑡
∑ 𝐸𝑥𝑖𝑛 (10)
Feed
Reflux
Boil up
Reboiler energy
Distillate
Condenser energy
Bottoms
Condenser
Reboiler
Figure 1: A typical binary distillation column with the in and out streams and the exergy analysis
boundary
3 Modelling of Exergy Efficiency
3.1 Artificial neural network modelling
Mechanistic models have been traditionally used in the past for control and optimisation studies.
However developing mechanistic models for complex processes especially to incorporate the second

7
law energy efficiency could be very difficult and time consuming. These difficulties can be readily
circumvented by developing neural network models from plant operational data. Neural network
models have been proved to be capable of approximating any continues non-linear functions. Here
neural networks are used to model exergy efficiency and product compositions in distillation columns.
The neural networks models are then used for exergy efficiency optimisation subject to product quality
constraints. In this study, data for neural network modelling are generated from simulation, which is
supposed to represent a real distillation column. For practical applications of the proposed method,
distillation column operational operation data can be used. The neural network model for exergy
efficiency is of the following form:
𝜑 = 𝑓(𝑥1, 𝑥2, 𝑥3 … 𝑥𝑘) (11)
where 𝜑 is exergy efficiency, x1 and x2 are feed rate and feed temperature respectively, while x3 to xk
are the most volatile composition in each of the outlet stream. Neural network models for the product
compositions use the same model inputs. Single hidden layer feed forward neural networks are used to
model exergy efficiency and product compositions. The quality of the neural network is dependent on
the training data and the training method [26]. The data were divided into training data (50%), testing
data (30%), and unseen validation data (20%). The training data is used for network training and the
testing data is used for network structure selection (number of hidden neurons) and “early stopping” in
network training. With the “early stopping” mechanism, neural network prediction errors on the testing
data are continuously monitored during training and training is terminated when the prediction errors
on the testing data do not futher reduce. A number of networks with different number of hidden neurons
are trained and the one giving the lowest sum of squared errors (SSE) on the testing data is considered
as having the appropriate number of hidden neurons. The final developed neural network model is
evaluated on the unseen validation data. The data for the network training, validation and testing were
scaled to the range [-1, 1] because of the different magnitudes of the model inputs and outputs.
Levenberg-Marquardt training algorithm is used to train the networks. For the pupose of comparison,
linear models are also built using partial least square (PLS) regression.
However, conventional neural networks can lack generalisation capability when applied to unseen data
due to over-fitting of noise in the data [27]. The objective in neural network modelling is to build a
network which can generalise and not to build a network which simply memorise the training data.
Several techniques have been reported for the enhancement of neural network model generalisation
capability such as Bayesian learning, regularisation, training with dynamic and static process data, early
stopping and combining multiple networks, and bootstrap aggregated neural networks [28].

8
3.2 Bootstrap aggregated neural network
When building neural network models from the same data set, there is possibility that different networks
perform well in different regions of the input space. Hence, prediction accuracy on the entire input space
could be improved when multiple neural networks are combined. In a bootstrap aggregated neural
network model, several neural network models are developed to model the same relationship. Individual
neural network models are developed from bootstrap re-sampling replications of the original training
data. Instead of selecting a single neural work that is considered to be the “best”, several networks are
combined together to improve model accuracy and robustness. These models can be developed on
different parts of the data set. A diagram of a bootstrap aggregated neural network is shown in Fig. 2.
A bootstrap aggregated neural network can be represented mathematically as
𝑓(𝑋) = ∑ 𝑤𝑖𝑓𝑖(𝑋)𝑛𝑖=1 (12)
where 𝑓(𝑋) is the aggregated neural network predictor, 𝑓𝑖(𝑋) is the ith neural network, 𝑤𝑖 is the
aggregating weight for combining the ith predicted neural network, 𝑛 is the number of neural networks
and 𝑋 is a vector of neural network inputs. The overall output of bootstrap aggregated network is a
combination of the weighted individual neural network output.
∑ X Y
Figure 2: A bootstrap aggregated neural network
The bootstrap aggregated neural network can also be used to calculate model prediction confidence
bounds from individual network predictions [26]. The standard error of the ith predicted value is
calculated as

9
𝜎𝑒 = {1
𝑛−1 ∑ [𝑦(𝑥𝑖; 𝑊𝑏) − 𝜑(𝑥𝑖; )]
2𝑛𝑏=1 }
1
2 (13)
where 𝜑(𝑥𝑖) = ∑ 𝜑(𝑥𝑖; 𝑊𝑏)𝑛𝑏=1 /𝑛 and 𝑛 is the number of neural networks. The 95% prediction
confidence bounds can be calculated as 𝜑(𝑥𝑖; ) ± 1.96𝜎𝑒. A narrower confidence bounds indicates the
associated model prediction is more reliable.
4 Application to Binary Distillation Systems
4.1 Modelling of the distillation systems
Two binary distillation systems of methanol-water and benzene-toluene separations are considered. The
methanol-water system is to be rectified into a distillate containing 90% methanol and a residue
containing 5% methanol [29]. The Benzene-toluene system is to be separated to 95% benzene in the
distillate and 5% benzene in the residue [30]. The nominal parameters for simulation are as given in
Table 1. At the steady state, based on the data generated in HYSYS, exergy analyses of the streams are
performed using Eq(3). Exergies of the reboiler and condenser are calculated using Eq(5). This is
because the data in HYSYS are obtained at the steady state and the temperature can safely be assumed
to be constant at the prevailing operating conditions. Careful considerations are made to compute the
exergy of each stream both at the prevailing operating conditions and at reference states.
In Tables 2 and 3, the data for the streams in and out of the column are given for methanol-water and
benzene-toluene respectively. The exergy efficiency and the irreversibility of the system are calculated
using Eq(7) to Eq(10). The exergy efficiencies are 83.93% and 82.34% for methanol-water and
benzene-toluene respectively while the exergy loss / irreversibility are 7.216×10⁵ and 3.691×10⁶
respectively for methanol-water and benzene toluene. This reveals that there is room for improvement
of energy efficiency in these separation processes.
Table 1: Nominal parameters for the base case simulations
Benzene-Toluene Methanol-Water Unit
Feed temperature
Feed pressure
Feed rate
Reflux ratio
Number of trays
Feed tray
Distillate rate
105
1
350
3.5
11
7
151.8
53
1
216.8
1.028
8
5
88.94
oC
atm
kmol/h
kmol/h

10
Table 2: Simulated data for exergy analysis of methanol-water system
h0(kJ/kmol) s0(kJ/kmoloC) h(kJ/kmol) s(kJ/kmoloC) m(kmol/h) Ex(kJ/h)
Feed -2.66×10⁵ 26.574 -2.64×10⁵ 46.21 216 4.53×10⁵
Distillate
out
-2.42×10⁵ 11.16 -2.39×10⁵ 42.83 88.93 1.39×10⁵
Bottom out -2.83×10⁵ 29.89 -2.77×10⁵ 71.863 127.06 5.54×10⁵
Reflux -2.42×10⁵ 11.16 -2.39×10⁵ 42.823 49.67 7.78×10⁴
Boilup -2.73×10⁵ 28.58 -2.28×10⁵ 175.73 138.44 5.63×10⁶
Reboiler 4.03×10⁶
Condenser 3.07×10⁶
Table 3: Simulated data for exergy analysis of benzene-toluene system
h0(kJ/kmol) s0(kJ/kmoloC) h(kJ/kmol) s(kJ/kmoloC) m(kmol/h) Ex(kJ/h)
Feed 29022.4 -103.739 73150.8 40.76 350 14181516
Distillate 47908.7 -122.424 55163.2 -83.9598 151.75 954911.8
Bottoms 14566.9 -96.5928 28547.7 -29.0841 198.24 2437092
Reflux 47908.7 -122.424 55163.2 -83.9598 497.9 3133213
Boil up 16856.3 -97.1049 63541.8 55.1096 261.2 11201230
Reboiler 6722074
Condenser 13820882
The emphasis is to increase exergy efficiency and increase profitability of existing plants rather than
plant expansion. Parametric analysis of the column is conducted to investigate the impacts of a number
of variables on the exergy efficiency of the column. For each variable perturbations of the size ±15%
of its initial value are added. The initial exergy efficiencies are 83.93% for methanol water and 82.34%
for benzene toluene as given for the base cases of the systems. The desired purity specifications of the
distillate are maintained for all the variations. The exergy of the material streams and energy streams
are calculated at each variation, the corresponding exergy efficiency and reboiler exergy are calculated.
Tables 4 and 5 show the sensitivity analysis of the two systems under consideration. For most cases
considered, improving exergy efficiency translates to reduction in reboiler energy. However, exception
is noticed for condenser pressure and the feed temperature in Tables 4 and 5. This is possibly because
there is a significant change in the reboiler energy at these variations without corresponding significant
change in the exergy of the streams.
From Tables 4 and 5, some of the variables fail to give a converged solution at the steady state when
changed from their initial values. They however give converged solutions in the dynamic state when
the distillate and bottom compositions are controlled to be at their reference values. These variables are

11
considered not feasible because the data to be generated for ANN training are to be taken from the
steady state. For most of the variables of the methanol-water system, the change in variable values alters
the composition of the bottoms from the initial reference value. This is not seriously considered as the
main focus of the sensitivity analysis is to check out the variables that have noticeable impact on the
overall exergy efficiency of the column. Reflux rate and reboiler energy even though have effects on
the exergy efficiency are not considered. This is because that they are typically used as manipulated
variables in the composition control systems [31]. The feed rate has no effect on the exergy efficiency
of the column but influences the reboiler energy. It has been previously considered as input in the
simulation of distillation column [13].
Table 4: Sensitivity analysis of the methanol-water system
-15% of initial values +15% of initial values
Exergy
eff (%)
Reboiler
duty (kJ/h)
Reboiler
exergy (kJ/h)
Exergy
eff (%)
Reboiler
duty (kJ/h)
Reboiler
exergy (kJ/h)
Reflux rate 82.15 5.320×10⁶ 3.905×10⁶ 85.20 5.700×10⁶ 4.183×10⁶
Feed rate 83.93 4.675×10⁶ 3.432×10⁶ 83.93 6.325×10⁶ 4.643×10⁶
Feed
temperature
84.14 5.632×10⁶ 4.135×10⁶ 83.66 5.367×10⁶ 3.940×10⁶
Reboiler
duty
97.5 4.675×10⁶ 3.430×10⁶ 77.32 6.325×10⁶ 4.640×10⁶
Condenser
pressure
80.92 5.459×10⁶ 4.008×10⁶ 86.37 5.536×10⁶ 4.064×10⁶
Reboiler
pressure
85 5.417×10⁶ 3.905×10⁶ 83.12 5.574×10⁶ 4.152×10⁶
Condenser
temperature
Not
feasible
Not
feasible
Reboiler
temperature
99.9 2.970 ×10⁶ 2.042×10⁶ Not
Feasible
Distillate
rate
97 4.684×10⁶ 3.335×10⁶ Not
feasible
Bottoms rate Not
feasible
98 4.366×10⁶ 3.081×10⁶
The variables that are then considered are the controlled variables (distillate and bottom compositions)
and external input variables which can be regulated (feed rates and feed temperatures). Subsequently,
data for neural network training are generated by varying these independent variables within their upper

12
and lower bounds. The bounds are determined from the sensitivity analysis. Corresponding values of
the exergy efficiency and irreversibility are calculated based on Eq.(3) to Eq.(10).
4.2 Linear models
PLS regression is used to build the linear models in this study. It is found that 4 latent variables give
the smallest SSE on the testing data and, hence, 4 latent variables should be used in the PLS models.
Plots of model prediction error (top left), model prediction error versus fitted values (top right),
histogram of prediction error (bottom left), and normal probability plots (bottom right) from the two
PLS models are given in Fig. 3 and Fig. 4. These plots indicate the linear model prediction errors of the
two systems are not normally distributed indicating that the models are not adequate. Table 6 gives the
SSE, mean square error (MSE), and the coefficient of determination (R2) for the models. The very large
SSE and MSE values of the linear models and their low R2 values indicate that there could be strong
non-linearity in the relationship between exergy efficiency and process operating conditions. This
justifies the need to build nonlinear models using ANN.
Table 5: Sensitivity analysis of the benzene-toluene system
-15% of initial values +15% of initial values
Exergy
eff (%)
Reboiler
duty (kJ/h)
Reboiler
exergy (kJ/h)
Exergy eff
(%)
Reboiler
duty (kJ/h)
Reboiler
exergy
(kJ/h)
Reflux rate 83.95 5.959×10⁶ 4.568×10⁶ 82.10 1.121×10⁷ 8.676×10⁶
Feed rate 82.34 7.393×10⁶ 5.704×10⁶ 82.34 1.01×10⁷ 7.721×10⁶
Feed temp. 91.53 1.435×10⁷ 1.107×10⁷ 82.01 8.491×10⁶ 6.551×10⁶
Reboiler duty 82.86 7.4×10⁶ 5.694×10⁶ 74.47 1.00×10⁷ 7.7296×10⁶
Condenser
pressure
80.07 8.596×10⁶ 6.632×10⁶ 84.14 8.823×10⁶ 6.807×10⁶
Reboiler
pressure
82.48 8.224×10⁶ 6.22×10⁶ 82.24 9.11×10⁶ 7.124×10⁶
Condenser
temp.
Not
feasible
Not
feasible
Reboiler temp. Not
feasible
Not
feasible
Distillate rate 85.66 4.477×10⁶ 3.414×10⁶ Not
feasible
Bottoms rate Not
feasible
86.9 3.640×10⁶ 2.768×10⁶

13
Table 6: Model performance indicators for linear models
Methanol-water Benzene-toluene
Training Testing Validation Training Testing Validation
SSE 186.68 63.86 50.41 109.82 43.42 37.11
MSE 0.4050 0.3414 0.3680 0.1489 0.1336 0.1405
R2 0.4701 0.3934 0.4871 0.6880 0.6215 0.6908
Figure 3: Linear model validation for the methanol-water system
4.3 ANN models
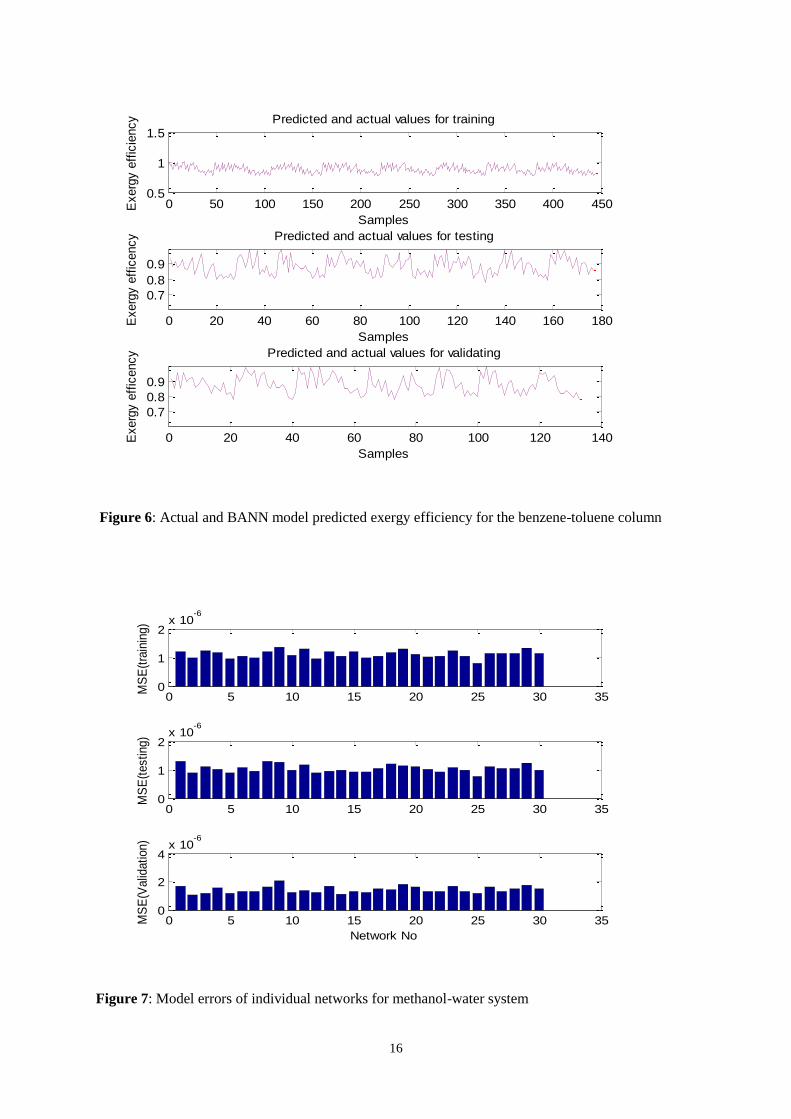
The neural network structure and training are as described in Section 3.1. Fig. 5 and Fig. 6 show the
actual exergy efficiencies (solid curves, blue) and neural network predictions (dashed curves, red) on
the training, testing, and unseen validation data sets for the methanol-water column and the benzene-
toluene column respectively. The SSEs on the training, testing and unseen validation data sets are given
in Table 7. The numbers of hidden neurons that gave the least SSE on the testing data are 21 for
methanol-water and 21 for benzene-toluene. The results in Figs. 5 and 6 and Table 7 show that the ANN
models give excellent prediction performance. The models can be conveniently used to determine the
exergy efficiencies of the distillation processes at different operating conditions. Usually in the
calculation of exergy efficiency, the enthalpies and entropies of all streams involved must be
determined. The ANN models can be used to predict the exergy efficiencies without the rigours of
calculating the enthalpies and entropies of the streams. This will be a valuable tool in the hand of process
0 200 400 600-2
-1
0
1
2
Pre
dict
ion
erro
r
Samples
-2 0 2 4-2
-1
0
1
2
Pre
dict
ion
erro
r
Model prediction
-2 -1 0 1 20
50
100
Fre
quen
cy
Prediction error
-1 0 10.0010.0030.010.020.050.100.250.500.750.900.950.980.99
0.9970.999
Prediction error
Pro
babi
lity
Normal Probability Plot

14
design engineers and operators in determining the effects of different operating conditions on the exergy
efficiency of the distillation process.
Figure 4: Linear model validation for the benzene-toluene system
Table 7: Model performance indicators for single ANN models
Methanol-water Benzene-toluene
Training Testing Validation Training Testing Validation
SSE 0.0089 0.0039 0.0026 0.0011 0.0010 0.0007
MSE 8×10⁻⁶ 7×10⁻⁶ 1.35×10⁻⁶ 2.95×10⁻⁶ 4.15×10⁻⁶ 4.66×10⁻⁵
R2 0.9990 0.9988 0.9987 0.9976 0.9913 0.9913
4.4 Bootstrap Aggregated Neural Network
A bootstrap aggregated neural network (BANN) containing 30 neural networks is developed to predict
the exergy efficiency of each system. Each individual network has one hidden layer. The Levenberg-
Marquardt training algorithm is used to train the networks. Training data for the individual networks
differs. This is due to bootstrap re-sampling to ensure that different individual networks are obtained
and their combination lead to that the entire input space being well predicted. A problem in neural
0 200 400 600-1
0
1
2
Pre
dic
tion e
rror
Samples
-4 -2 0 2-1
0
1
2
Pre
dic
tion e
rror
Model prediction
-1 0 1 20
50
100
Fre
quency
Prediction error
-0.5 0 0.5 10.0010.0030.010.020.050.100.250.500.750.900.950.980.99
0.9970.999
Prediction error
Pro
babili
tyNormal Probability Plot

15
network is over-fitting which means a trained neural network can give excellent performance on the
training data but performs poorly when applied to unseen validation data. A combination of multiple
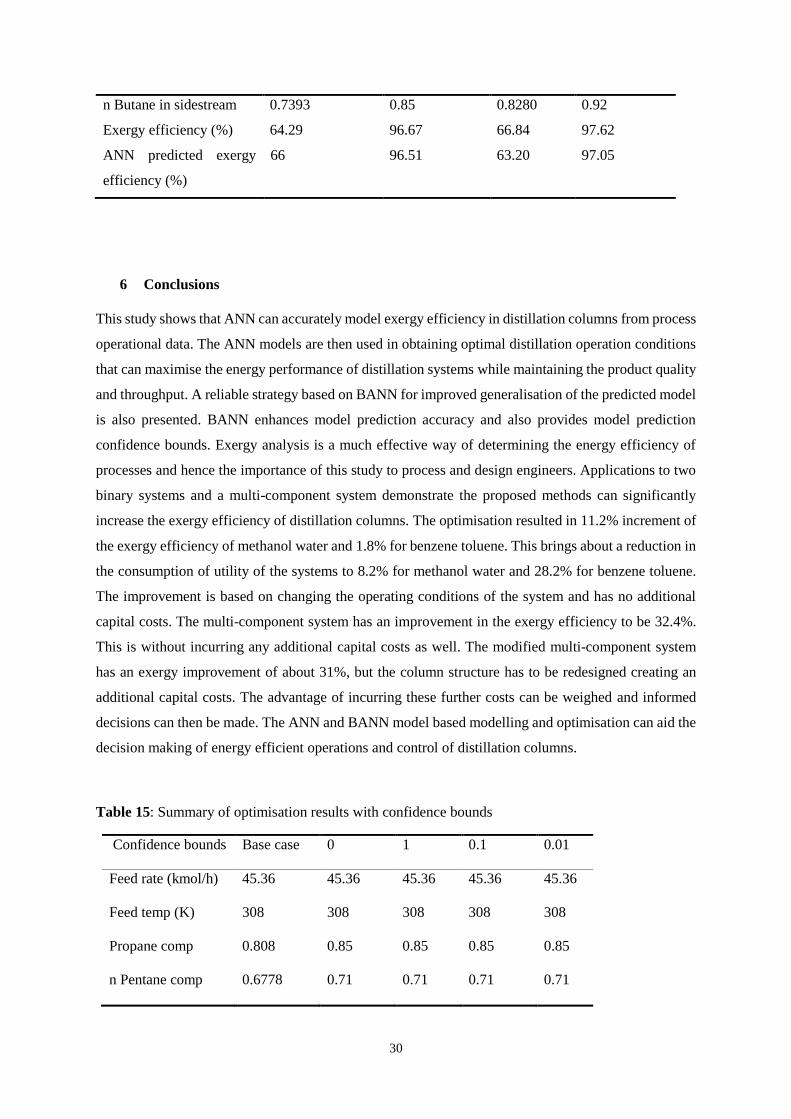
non-perfect models improves the prediction accuracy on the entire input space. Figs. 7 and 8 show the
MSE of individual network on training, testing and validation data sets. It can be seen that the
performances of individual networks on different data sets are inconsistent. A network with low MSE
on the training data could have a large MSE on the unseen validation data. This shows the non-robust
nature of a single neural network. The MSE values for the aggregated neural networks with different
numbers of constituent networks are shown in Fig. 9 and Fig. 10 for the methanol-water column and
the benzene-toluene column respectively. The MSE for BANN models on training and validation data
sets are 1.20×10⁻⁶ and 1.00×10⁻⁶ respectively for the methanol-water system and 2.51×10⁻⁶ and 2.83×10-
6 respectively for the benzene-toluene system. This is an improvement on the minimum MSE for the
single neural networks given in Table 7. The model accuracy is seen being improved by using bootstrap
aggregated neural network model.
Figure 5: Actual and BANN model predicted exergy efficiency for the methanol-water column
0 100 200 300 400 500 600 700 800 900 10000.5
1
1.5Predicted and actual values for training
Samples
Exerg
y e
ffic
iency
0 50 100 150 200 250 300 3500.5
1
1.5Predicted and actual values for testing
Samples
Exerg
y e
ffic
ency
0 50 100 150 200 2500.5
1
1.5Predicted and actual values for validating
Samples
Exerg
y e
ffic
ency
16
Figure 6: Actual and BANN model predicted exergy efficiency for the benzene-toluene column
Figure 7: Model errors of individual networks for methanol-water system
0 50 100 150 200 250 300 350 400 4500.5
1
1.5Predicted and actual values for training
Samples
Exerg
y e
ffic
iency
0 20 40 60 80 100 120 140 160 180
0.7
0.8
0.9
Predicted and actual values for testing
Samples
Exerg
y e
ffic
ency
0 20 40 60 80 100 120 140
0.7
0.8
0.9
Predicted and actual values for validating
Samples
Exerg
y e
ffic
ency
0 5 10 15 20 25 30 350
1
2x 10
-6
MS
E(t
rain
ing)
0 5 10 15 20 25 30 350
1
2x 10
-6
MS
E(t
esting)
0 5 10 15 20 25 30 350
2
4x 10
-6
MS
E(V
alid
ation)
Network No

17
Figure 8: Model errors of individual networks for benzene-toluene system
Figure 9: Model errors of aggregated networks for methanol-water system
0 5 10 15 20 25 30 350
1
2x 10
-5
MS
E(t
rain
ing)
0 5 10 15 20 25 30 350
1
2x 10
-5
MS
E(t
esting)
0 5 10 15 20 25 30 350
0.5
1x 10
-5
MS
E(V
alid
ation)
Network No
0 5 10 15 20 25 30 350
1
2x 10
-6
MS
E(t
rain
ing)
0 5 10 15 20 25 30 350
1
2x 10
-6
MS
E(t
esting)
0 5 10 15 20 25 30 350
1
2x 10
-6
MS
E(V
alid
ation)
Number of networks

18
Figure 10: Model errors of aggregated networks for benzene-toluene system
4.5 Optimisation of exergy efficiency
The optimisation problem can be stated as
JX
min (14)
s.t.
),,,( 4321 xxxxf
99.08.0 3 x
1.001.0 4 x
where J is the objective function, x=[x1,x2,x3,x4] is a vector of neural network model inputs which are
feed rate, feed temperature, distillate composition and bottom composition respectively; and is the
exergy efficiency. As changing feed temperature would require pre-heating of the feed which can have
impact on the overall energy efficiency, in this study the feed temperature is kept constant, i.e. removed
from decision variable list. Thus the decision variables in this case are feed rate, distillate composition
and bottom composition.
The sequential quadratic programming (SQP) method is used for the optimisation. The exergy
efficiency is maximised subject to the distillate composition constraints. Table 8 and Table 9 give the
results of the optimisation procedure for the two systems. In Tables 8 and 9, case 1 refers to the solution
0 5 10 15 20 25 30 350
2
4x 10
-6
MS
E(t
rain
ing)
0 5 10 15 20 25 30 350
2
4x 10
-6
MS
E(t
esting)
0 5 10 15 20 25 30 350
5x 10
-6
MS
E(V
alid
ation)
Number of networks

19
of Eq(14). It can be seen that exergy efficiency is improved with the bottom composition at its upper
bound. When the bounds on the product compositions are altered (cases 2 and 3), the optimal exergy
efficiencies increases when the bounds are narrowed and it reduces when the bounds are widen.
However, there is a limit for the purity specification of the products beyond which increasing the exergy
efficiency has the added clause of increase in energy of the reboiler. This is shown in case 4 and gives
a caution on placing consideration on the exergy efficiency while specifying the product purity.
Table 8: Summary of optimisation results for methanol-water system
Base case Optimum
case 1
Optimum
case 2
Optimum
case 3
Optimum
case 4
Feed rate (kmol/h) 216.8 216.8 216.79 180.7 216.79
Feed temp.(oC) 53 53 53 53 53
Distillate composition 0.90 0.90 0.90 0.90 0.92
Bottom composition 0.05 0.1 0.08 0.01 0.05
ANN predicted
efficiency (%)
83.95 93.28 89.77 74.98 85.59
HYSYS validated
efficiency (%)
83.93 93.31 89.29 77.9 85.59
Reboiler energy
(kJ/hr)
5.5×10⁶ 5.02×10⁶ 5.23×10⁶ 6.74×10⁶ 5.77×10⁶
Reboiler exergy(kJ/hr) 4.04×10⁶ 3.61×10⁶ 3.78×10⁶ 5.05×10⁶ 4.24×10⁶
Utility cost ($/yr) 1.70×10⁴ 1.56×10⁴ 1.62×10⁴ 2.09×10⁴ 1.79×10⁴
The optimum efficiency as given in each case shows that there is a reduction of entropy generation
within the systems at these operating conditions and that is why there are corresponding increases in
the exergy efficiencies of the systems. The distillate composition is not compromised for the first case
showing that the desired purity can be maintained with a corresponding increase in the exergy efficiency
of the system. This increment translates to an increase in the energy efficiency of the systems
considering the fact that there is a decrease in the reboiler energy even though the feed rate is
maintained. Other varying compositions specifications are shown with their corresponding exergy
efficiencies.
Taking the optimum case 1 as an example, the improvement in the exergy efficiency of the system is
11.17% for methanol-water system and 1.79% for benzene-toluene system when compared to the base
case. The utility cost of the cases based on the assumption of 8600 h per year are calculated and shown
in Tables 8 and 9. For the optimum case 1, the increase in exergy efficiency translates to 8.2% reduction

20
in utility cost for methanol water and 28.2% reduction in utility cost for benzene toluene over a year
period. The cumulative effect of this could be of great economic value.
Table 9: Summary of optimisation results for benzene-toluene system
Base case Optimum
case 1
Optimum
case 2
Optimum
case 3
Optimum
case 4
Feed rate (kmol/h) 350 350 350 350 350
Feed temp.(oC) 105 105 105 105 105
Distillate composition 0.95 0.95 0.90 0.90 0.97
Bottom composition 0.05 0.1 0.08 0.01 0.05
ANN predicted
efficiency (%)
82.34 83.82 83.22 80.86 82.88
HYSYS validated
efficiency (%)
82.34 83.86 83.15 81.78 83.25
Reboiler energy
(kJ/hr)
8.712×10⁶ 6.05×10⁶ 6.92×10⁶ 1.87×10⁷ 2.07×10⁷
Reboiler exergy(kJ/hr) 6.72×10⁶ 4.64×10⁶ 5.31×10⁶ 1.44×10⁷ 1.71×10⁷
Utility cost ($/yr) 2.94×10⁴ 2.11×10⁴ 2.38×10⁴ 3.04×10⁴ 3.68×10⁴
The optimum operating conditions given by the optimisation procedures are simulated in HYSYS. It
can be seen from Tables 8 and 9 that actual (HYSYS simulated) exergy efficiencies are very close to
the BANN model predicted values. This shows that the optimal predicted conditions of the BANN
model can give the optimal operating conditions on the actual process. This further demonstrates the
suitability of the Bootstrap aggregated neural network models at the modelling and optimisation of the
exergy efficiency of the distillation columns. The method as applied on the binary system might seem
trivial but the accuracy of the predictability of BANN model of the exergy efficiency cannot be over
emphasised. For a much complex system, the relevance of the method will be much more pronounced.
As seen in Tables 8 and 9, BANN model is able to predict what the exergy efficiency of the system will
be at different quality specifications. In a processing plant, the relevance of this cannot be over
emphasised especially in the area of decision making for the most energy efficient operating conditions
of the system. This could serve as guide for process operators and process engineers. It could also find
relevance in the design of a new system. The caution in the application is that the system to be
investigated should be fully trained. A BANN model for a particular system, might not work for another.

21
5 Application to multi-component system
5.1 The system
A multi-component system as depicted in Fig. 11 [32] is simulated in HYSYS. The 3 products from the
fractionation process are a vapor distillate rich in C2 and C3, vapor side stream rich in nC4 and bottoms
rich in nC5 and nC6. SRK equation of state is used for the K values and enthalpy departure.
The enthalpy and entropy at the stream conditions and at reference conditions are shown in Table 10.
The physical exergy of the inlet and outlet streams as calculated using Eq.(3) are shown in Table 11.
The system being a multi-components system with 5 components necessitate the calculation of the
chemical exergy of each stream to determine the contribution of the chemical exergy to the total exergy
the stream. Eq.(2) is used in calculation of the chemical exergy. Exergy of the component at reference
states of 298 K and 101.325 kPa are taken from the literature for each of the component [23].
Total condenser
E-1
Feed:saturated liquid at 260 psia;
45.36kmol/hr
Distillate:10.43kmol/hr
Sidestream:16.79kmol/hr
Bottom:18.14kmol/hr
7
9
13
1
17
Ethane: 0.1299Propane: 0.8080nButane: 0.0621
nPentane: 0.0000nHexane: 0.0000
Ethane: 0.0300Propane: 0.2000nButane: 0.3700
nPentane: 0.3500nHexane: 0.0500
Ethane: 0.0000Propane: 0.0378nButane: 0.7393
nPentane: 0.2135nHexane: 0.0094
Ethane: 0.0000Propane: 0.0000nButane: 0.2057
nPentane: 0.6778nHexane: 0.1165
Figure 11: The multi-component separation system
The total exergy in and out of the system is given by Eq(15) and Eq(16).
∑ 𝑬𝒙𝒊𝒏 = 𝑬𝒙𝒇𝒆𝒆𝒅 + 𝑬𝒙𝒓𝒆𝒃𝒐𝒊𝒍𝒆𝒓 (15)
∑ 𝑬𝒙𝒐𝒖𝒕 = 𝑬𝒙𝒅𝒊𝒔𝒕𝒊𝒍𝒍𝒂𝒕𝒆 + 𝑬𝒙𝒃𝒐𝒕𝒕𝒐𝒎𝒔 + 𝑬𝒙𝒔𝒊𝒅𝒆𝒔𝒕𝒓𝒆𝒂𝒎 + 𝑬𝒙𝒄𝒐𝒏𝒅𝒆𝒏𝒔𝒆𝒓 (16)

22
Each stream exergy is a sum of the physical and chemical exergy. The exergy efficiency and the
irreversibility of the unit is calculated using Eq(9) and Eq(10).
In Table 11, the exergy efficiency, exergy loss and the reboiler energy of the unit is shown. Two
measures of efficiency are presented. Efficiency 1 is based on the physical exergy of the streams and
efficiency 2 is a combination of the physical and chemical exergy of the streams. As can be seen in
Table 11, the reboiler energy and reboiler exergy for the two measured efficiencies are the same. There
is a slight difference in the exergy loss. The contribution of the chemical exergy to the total exergy of
the unit is 0.53%. This is attributed to the fact that the distillation process as described here is a physical
process. A reactive distillation column might possibly have a significant contribution from the chemical
exergy. The contribution of chemical exergy to this process can be reasonably assumed to be negligible
[33].
Table 10: Simulated data for exergy analysis of multi-component system
h0 (kJ/kmol) s0 (kJ/kmol0C) h (kJ/kmol) s (kJ/kmol0C) m (kmol/h) Ex (kJ/h)
Feed -129865 160.51 -150891 84.12 45.36 7.88×10⁴
Distillate -102864 168.95 -115493 104.36 10.43 5.75×10⁴
Side stream -130216 141.87 -121966 139.39 16.79 1.19×10⁵
Bottom -171395 74.984 -147889 143.99 18.14 7.89×10⁴
Reflux -102864 168.95 -115493 104.36 68.03 3.75×10⁵
Boilup -160416 96.11 -129710 177.29 117.8 1.02×10⁶
Reboiler
duty
1.865×10⁶
Condenser
duty
9.932×10⁵
Table 11: Exergy analysis of the multi-component system
Efficiency 1 (%) Efficiency 2 (%)
64.29 64.63
Reboiler energy (kJ/hr) 1.983×10⁶ 1.983×10⁶
Reboiler Exergy (kJ/hr) 1.865×10⁶ 1.865×10⁶
Exergy loss (kJ/hr) 6.940×10⁶ 6.885×10⁶
As discussed in Section 4.1, the decision variables are the feed temperature, the feed rate and the key
component in each of the product stream which are propane in the distillate, npentane in the bottom and
nbutane in the side stream. The decision variables are varied in their upper and lower bounds and the

23
corresponding exergy analysis of the inlet and outlet streams are calculated both at the prevailing
operating conditions and at reference conditions. Subsequently data generated in HYSYS simulation
are used in the ANN modeling of the column. The software generated data can be easily replaced with
plant operating data over a period of time for an industrial column. The methodology as developed
could be generic.
5.2 Bootstrap aggregated neural network modelling
A bootstrap aggregated neural network is developed from process operational data based on the
simulated data from HYSYS. The BANN contains 30 neural networks for predicting the exergy
efficiency of the system. Each individual network has a single layer with 30 hidden neurons. Hidden
neurons use sigmoid activation function and the output neuron uses the linear activation function.
Levenberg-Marquardt training algorithm is used to train the individual networks. Fig. 12 shows the
predicted and actual values of the exergy efficiency as well as the confidence bounds. The prediction
error lies between -4×10⁻³ and 6×10⁻³ as shown in Fig. 13. An advantage of BANN model is that it can
offer model prediction confidence bound. A narrower confidence bound indicates that the associated
model prediction is more reliabile.
Figure 12: Actual values, predictions, and confidence bounds of multi-component BANN model
5.3 BANN model of a modified multi-component system
A further modification of the system is made based on the given specification in Fig. 14. The number
of stages is increased to 25, the feed stage at stage 7 and the sidestream is drawn from stage 17. The
0 50 100 150 200 2500.55
0.6
0.65
0.7
0.75
0.8
0.85
0.9
0.95
samples
Exerg
y e
ffic
iency
o:actual values; +:predictions; --:95%confidence bounds

24
modifications are intended for a change in the design of the column to investigate the contribution it
could have on the exergy efficiency.
Figure 13: Error of prediction of multi-component BANN model
The subsequent thermodynamic analysis of the modified system is made as described in Section 5.1.
Table 12 shows the simulated data and the exergy calculation of the streams in and out of the modified
system. Exergy efficiency, exergy loss and reboiler exergy of the system are shown in Table 13. As is
the case for the previous multicomponent system, the reboiler exergy and exergy loss for the two
measured efficiencies are the same. The contribution of the chemical exergy to the total exergy of the
system is 0.25% and hence can be considered negligible here as well. There is an increment in the
exergy efficiency of the modified system by 2% corresponding to an improvement of 3.2% as compared
to the initial system. There is a corresponding decrease in the reboiler energy and the exergy loss of the
system. This signifies a reduction in entropy generation within the column resulting from increasing the
stage number. It should however be noted that the improvement in efficiency comes with the added
expenses of capital cost.
Fig. 15 shows the predictions of the BANN against the true energy efficiency on the training, testing,
and unseen validation data sets. It can be seen that the model predictions are very accurate.
0 50 100 150 200 250-4
-2
0
2
4
6
8x 10
-3
samples
Err
or
of
Pre
dic
tion

25
Figure 14: Modified multi-component system
Table 12: Simulated and thermodynamic data of the modified system
h0 (kJ/kmol) s0 (kJ/kmol0C) h (kJ/kmol) s (kJ/kmol0C) m (kmol/h) Ex (kJ/h)
Feed -129865 160.5106 -150891 84.12 45.36 7.88×10⁴

26
Distillate -102864 168.9596 -115491 104.36 10.20 7.03×10⁴
Side stream -130216 141.8794 -121965 139.38 16.86 1.56×10⁵
Bottom -171395 74.98403 -147889 143.99 18.30 5.44×10⁴
Reflux -102864 168.9599 -115491 104.36 77.62 5.35×10⁵
Boilup -160416 96.10724 -129710 177.30 124.2 8.12×10⁵
Reboiler
duty 1.95×10⁶
Condenser
duty
1.06×10⁶
Table 13: Exergy analysis of the modified multi-component system
Efficiency 1 (%) Efficiency 2 (%)
66.52 66.84
Reboiler energy (kJ/hr) 2.072×10⁶ 2.072×10⁶
Reboiler Exergy (kJ/hr) 1.949×10⁶ 1.949×10⁶
Exergy loss (kJ/hr) 6.788×10⁵ 6.733×10⁵
0.55 0.6 0.65 0.7 0.75 0.8 0.85 0.9 0.950.55
0.6
0.65
0.7
0.75
0.8
0.85
0.9
0.95
Actual energy efficiency
Pre
dic
ted e
nerg
y e
ffic
iency
+:training data;--:testing data o:validation data

27
Figure 15: Predicted and actual exergy efficiency
5.4 Optimisation using neural network models
The optimisation objective is to maximise the exergy efficiency of the column subject to products
composition constraints. The products are the most volatile in the distillate, side stream and bottom
composition.
JX
min (17)
s.t.
),,,,( 54321 xxxxxf
95.075.0 3 x
9.06.0 4 x
95.07.0 3 x
where 1x is the feed rate, 2x is the feed temperature, 3x is propane composition in the distillate, 4x is
n pentane composition in the bottom and 5x is n butane composition in the side stream.
In addition to the process operation objective, minimising the model prediction confidence bounds can
be incorporated as an addition optimisation objective. To improve the reliability of the optimisation
strategy, a modified objective function is proposed. The optimisation problem can be stated as
JX
min = −( − 𝛽𝜎)
s.t.
),,,,( 54321 xxxxxf (18)
ubxlb prod
where J is the objective function, x=[x1,x2,x3,x4,x5] is a vector of decision variables, i.e. neural network
model inputs, y is the exergy efficiency, σ is standard prediction error, and β is a weighting factor for
σ.
The optimisation problem was solved using the SQP method implemented by the function “fmincon”
in MATLAB Optimisation Toolbox. The optimisation framework presented in this work is illustrated
in Figure 16. Exergy analysis is carried out on distillation column operation data (or simulated
distillation column operation data). Then the nonlinear relationship between process operating
conditions and exergy efficiency is modelled by a neural network using the exergy analysis data. The

28
neural network model is used in an optimisation framework to find the distillation column operating
conditions leading to the highest exergy efficiency subject to product quality constraints. The optimised
operating conditions are further validated on the distillation columns or their simulation.
Table 14 shows the optimum results without confidence bounds for the initial system and the modified
system. The prediction errors of the optimum results and the HYSYS validated exergy efficiency are
0.00165 and 0.0058 for the initial and modified cases respectively. The results further confirm the
predictability accuracy of BANN. Also without modifying the design, optimum operating conditions
that led to 32.38% increment in exergy efficiency of the system were found using the proposed methods.
This is without sacrificing the purity of the product specifications. This further justifies the suitability
of the method in determining energy efficient operating conditions for the distillation column.
However, with the modification, the exergy efficiency has increased from 64.29% to 66.52% this is just
about 2% increment in the exergy efficiency as compared to 32.38% from the method proffered here.
This increment for the modified case is at an additional capital cost (increasing number of trays and
change in location of feed and side stream). The tools described here can aid in decision making of what
trade off should be made in the design and operation of energy efficient column. The modified system
is further improved as shown in Table 14 and there is an increase in its exergy efficiency of about 31%
of its initial value.
In Table 15, the results of the optimisation of the base case with model prediction confidence bounds
are shown. The effects of some values of the weighting factor of the standard prediction error on exergy
efficiency are also investigated. Narrowing the confidence bound to a weighting factor of 0.01 improves
the prediction accuracy and reliability of the model. Incorporating confidence bound in the optimisation
can ensure the reliability and the generalisation of the associated model especially for complex cases.

29
Distillation Column (Process operation data or
simulated data)
Exergy analysis
Sensitivity analysis
Economic analysis
Exergy lossExergy
efficiencyModel
variablesEnergy cost
Model input and output data preparation
ANN model training and validation
Exergy efficiency optimisation
Optimised operating conditions
Implementation(Plant / simulation)
Initial conditions
Objective function
Optimisation constraints
Figure 16: Description of the optimisation procedure
Table 14: Summary of optimisation results for multi-component systems
Multi-component System Modified System
Base case Optimum case Base case Optimum case
Feed rate (kmol/h) 45.36 45.36 45.36 45.36
Feed temperature (K) 308.1 308.1 308.1 308.1
Propane in distillate 0.8080 0.85 0.8562 0.85
n Pentane in Bottom 0.6778 0.71 0.7310 0.82
30
n Butane in sidestream 0.7393 0.85 0.8280 0.92
Exergy efficiency (%) 64.29 96.67 66.84 97.62
ANN predicted exergy
efficiency (%)
66 96.51 63.20 97.05
6 Conclusions
This study shows that ANN can accurately model exergy efficiency in distillation columns from process
operational data. The ANN models are then used in obtaining optimal distillation operation conditions
that can maximise the energy performance of distillation systems while maintaining the product quality
and throughput. A reliable strategy based on BANN for improved generalisation of the predicted model
is also presented. BANN enhances model prediction accuracy and also provides model prediction
confidence bounds. Exergy analysis is a much effective way of determining the energy efficiency of
processes and hence the importance of this study to process and design engineers. Applications to two
binary systems and a multi-component system demonstrate the proposed methods can significantly
increase the exergy efficiency of distillation columns. The optimisation resulted in 11.2% increment of
the exergy efficiency of methanol water and 1.8% for benzene toluene. This brings about a reduction in
the consumption of utility of the systems to 8.2% for methanol water and 28.2% for benzene toluene.
The improvement is based on changing the operating conditions of the system and has no additional
capital costs. The multi-component system has an improvement in the exergy efficiency to be 32.4%.
This is without incurring any additional capital costs as well. The modified multi-component system
has an exergy improvement of about 31%, but the column structure has to be redesigned creating an
additional capital costs. The advantage of incurring these further costs can be weighed and informed
decisions can then be made. The ANN and BANN model based modelling and optimisation can aid the
decision making of energy efficient operations and control of distillation columns.
Table 15: Summary of optimisation results with confidence bounds
Confidence bounds Base case 0 1 0.1 0.01
Feed rate (kmol/h) 45.36 45.36 45.36 45.36 45.36
Feed temp (K) 308 308 308 308 308
Propane comp 0.808 0.85 0.85 0.85 0.85
n Pentane comp 0.6778 0.71 0.71 0.71 0.71

31
n Butane comp 0.7393 0.85 0.85 0.85 0.85
HYSYS validated
efficiency (%)
64.29 96.67 96.68 96.66 96.66
Optimum efficiency
from ANN (%)
66 96.51 95.78 96.44 96.60
Error of prediction 0.0265 0.00165 0.009 0.0022 0.0006
Acknowledgement
The work was supported by the Commonwealth scholarships commission in the UK and partially
supported by the EU FP7 (Ref: PIRSES-GA-2013-612230).
Nomenclature
Ex Exergy rate, kJhr-1
h Specific enthalpy, kJkmol-1
m Molar flow, kmolhr-1
P0 Reference pressure, kPa
Qz Heat, kJhr-1
s Specific entropy, kJkmol-1K-1
SRK Soave Redlich Kwong (equation of state)
T0 Reference temperature, K
xji The mole fraction of ith component in the liquid state on stage j
yji The mole fraction of ith component in the vapour state on stage j
Zj Mole fraction of component j
φ Exergy efficiency, %
Superscript
k Number of inputs
n Number of neural networks
Subscript
0 Reference conditions
phy Physical
chem Chemical
References
[1] White DC. Optimise energy use in distillation. Chem Eng Prog 2012; 35-41.
[2] Gadalla MA, Abdelaziz OY, Kamel DA, Ashour FH. A rigorous simulation-based procedure
for retrofitting an existing Egyptian refinery distillation unit. Energy 2015; 83:756-65.

32
[3] Ochoa-Estopier LM, Jobson M, Smith R. The use of reduced models for design and
optimisation of heat-integrated crude oil distillation systems. Energy 2014; 75: 5-13.
[4] Liang YC, Zhou Z, Wu YT, Geng J, Zhang ZB. A nonequilibrium model for distillation
processes. AIChE J 2006; 52 : 4229-39.
[5] Uzlu E, Kankal M, Akpınar A, Dede T. Estimates of energy consumption in Turkey using
neural networks with the teaching–learning-based optimization algorithm. Energy 2014; 75:
295-303.
[6] Osuolale FN, Zhang J. Energy efficient control and optimisation of distillation column using
artificial neural network. Chem Eng Trans 2014; 39: 37-42.
[7] Ochoa-Estopier LM, Jobson M, Smith R. Operational optimization of crude oil distillation
systems using artificial neural networks. Comput Chem Eng 2013; 59: 178-85.
[8] Singh AK, Tyagi B, Kumar V. Application of neural network based control strategies to binary
distillation column. Control Eng App Informatics 2013; 15, 47-57.
[9] Osman M, Ramasamy M. Neural network based soft sensor for inferential control of a binary
distillation column. J Appl Sci 2010; 10: 2558-64.
[10] de Canete JF, Gonzalez S, del Saz-Orozco P, Garcia I. A harmonic balance approach to robust
neural control of MIMO nonlinear processes applied to a distillation column. J Process Control
2010; 20: 1270 -77.
[11] Bahar A, Özgen C, Leblebicioǧlu K, Halıcı U. Artificial neural network estimator design for
the inferential model predictive control of an industrial distillation column. Ind Eng Chem Res
2004; 43: 6102-11.
[12] Ge XL, Yuan XG, Ao C, Yu KK. Simulation based approach to optimal design of dividing wall
column using random search method. Comput Chem Eng 2014; 68: 38-46.
[13] Amit KS, Barjeev T, Vishal K. Application of Feed Forward and Recurrent Neural Network
Topologies for the Modeling and Identification of Binary Distillation Column. IETE J Res
2013; 59: 167-175.
[14] Ochoa-Estopier LM, Jobson M. Optimization of heat-integrated crude oil distillation systems.
Part III: Optimization framework. Ind. Eng. Chem. Res. 2015; 54 : 5018-36. [15] Oni AO, Waheed MA. Methodology for the thermoeconomic and environmental assessment of
crude oil distillation units. Int J Exergy 2015; 16(4):504-32.
[16] Suzuki Y, Yamaki T, Matsuda K, Takahashi K, Endo A, Nakaiwa M. Energy saving
performance of internal heat-integrated batch distillation. Chem Eng Trans 2012; 29 : 277-82.
[17] Kiss AA, Flores Landaeta SJ, Infante Ferreira CA. Towards energy efficient distillation
technologies – Making the right choice. Energy 2012; 47: 531-42.
[18] Araujo BA, Brito RP, Vasconcelos LS. Exergetic analysis of distillation processes-A case
study. Energy 2007; 32: 1185-93.
[19] Al-Muslim H, Dincer I. Thermodynamic analysis of crude oil distillation systems. Int J Energy
Res 2005; 29: 637- 55.
[20] De Koeijer GM, Kjelstrup S, Salamon P, Siragusa G, Schaller M, Hoffmann KH. Comparison
of entropy production rate minimization methods for binary diabatic distillation. Ind Eng Chem
Res 2002; 41: 5826-34.
[21] Kamela D, Gadallaa M, Ashourb F. New retrofit approach for optimisation and modification
for a crude oil distillation system. Chem Eng Trans , 2013; 35:1363-68
[22] Rosen MA, Dincer I. On exergy and environmental impact. Int J of Energy Res 1997; 21: 643-
54.
[23] Szargut J, Morris DR, Steward FR. Exergy analysis of thermal, chemical and metallurgical
processes. , New York, Hemisphere Publishing Corporation; 1988.
[24] Dincer I, Rosen MA. Exergy:energy, environment and sustainable development. 2nd ed.
London: Elsevier science; 2012.
[25] Le Goff P, Cachot T, Rivero R. Exergy analysis of distillation processes. Chem. Eng.Technol.
1996; 19: 478-485.
[26] Zhang J. Developing robust non-linear models through bootstrap aggregated neural networks.
Neurocomputing 1999; 25: 93-113.

33
[27] Zhang J. A reliable neural network model based optimal control strategy for a batch
polymerization reactor. Ind Eng Chem Res 2004; 43: 1030-1038.
[28] Mukherjee A, Zhang J. A reliable multi-objective control strategy for batch processes based on
bootstrap aggregated neural network models. J Process Control 2008; 18, 720-34.
[29] Treybal RE. Mass-transfer operations, New York, McGraw-Hill; 1980.
[30] Mccabe WL, Smith JC. Unit operations of chemical engineering, Dubuque, Iowa, McGraw-
Hill; 2005.
[31] Skogestad S. The Dos and Don’ts of Distillation Column Control. Chem Eng Res Des 2007;
85: 13-23.
[32] Green DW, Perry RH. (eds.) Perry's chemical engineering handbook, China, McGraw-Hill;
2006.
[33] Anozie AN, Osuolale FN, Osunleke AS. Exergy analysis of binary plate distillation column
operations. Int J Exergy 2009; 6: 715-28.