Embed Size (px)
Citation preview

Introduction The epidermal growth factor receptor (EGFR; also known as ERBB1 and HER1) is a mem-brane-bound tyrosine kinase that contributes to signaling cascades with multiple pro-carcinogenic effects including cell proliferation, motility, adhesion, invasion, cell survival, and angiogenesis [1]. EGFR overexpression has been detected in several human cancers, in-cluding breast, lung, ovarian, prostate, and pan-creatic cancers [reviewed in [1]]; EGFR overex-
pression is observed in aberrant crypt foci [2], colorectal adenomas [3, 4], and colorectal can-cer [3-5], and correlates with progression and metastasis [6, 7]. Several therapies targeting EGFR have been investigated and approved by the FDA for treatment of metastatic colorectal cancer, including cetuximab and panitumumab, (monoclonal antibodies against EGFR), and ge-fitinib and erlotinib, (tyrosine kinase inhibitors) [reviewed in [8]]. Treatment of mice with EGFR inhibitors, such as gefitinib, results in de-creased polyp formation [9-11], indicating that
Int J Mol Epidemiol Genet 2011;2(4):300-315 www.ijmeg.org /ISSN1948-1756/IJMEG1107003
Original Article Genetic variability in EGFR, Src and HER2 and risk of colorectal adenoma and cancer Elizabeth M Poole1,2,3, Karen Curtin4, Li Hsu1, Richard J Kulmacz5, David J Duggan6, Karen W Makar1, Liren Xiao1, Christopher S Carlson1, Martha L Slattery4, Bette J Caan7, John D Potter1,8, Cornelia M Ulrich1,8,9
1Fred Hutchinson Cancer Research Center, Seattle, Washington, 98109; 2Department of Epidemiology, Harvard School of Public Health, Boston, Massachusetts, USA; 3Channing Laboratory, Department of Medicine, Brigham and Women's Hospital, Harvard Medical School, Boston, Massachusetts, USA; 4University of Utah Health Sciences Cen-ter, Salt Lake City, UT, 84108; 5Departments of Internal Medicine and Biochemistry and Molecular Biology, University of Texas Health Science Center at Houston, Houston, Texas, 77030; 6Translational Genomics Research Institute, Phoenix, AZ, 85004; 7Division of Research, Kaiser Permanente Medical Care Program, Oakland, CA 94612; 8Depart-ment of Epidemiology, University of Washington, Seattle, Washington, 98195; 9National Center for Tumor Diseases and German Cancer Research Center, Heidelberg, Germany, D-69120 Received July 17, 2011; accepted October 3, 2011; Epub December 3, 2011; Published December 15, 2011 Abstract: The EGFR signaling pathway is involved in carcinogenesis at multiple sites, particularly colorectal cancer, and is a target of colorectal cancer chemotherapy. EGFR signaling is linked to pro-carcinogenic mechanisms, includ-ing cell proliferation, survival, angiogenesis, and more recently prostaglandin synthesis. Genetic variability in this pathway has not yet been studied in relation to colorectal carcinogenesis. In three case-control studies of colorectal adenoma (n=485 cases/578 controls), colon cancer (n=1424 cases/1780 controls) and rectal cancer (n=583 cases/775 controls), we investigated associations between candidate SNPs, tagSNPs and haplotypes in EGFR signal-ing (EGFR, Src, and HER2) and risk. We also examined associations with tumor subtypes: TP53 and KRAS2 muta-tions, CpG island methylator phenotype, and microsatellite instability. All three studies were genotyped using an iden-tical Illumina GoldenGate assay, allowing thorough investigation of genetic variability across stages and locations of colorectal neoplasia. The EGFR tagSNP 142572T>C (rs3752651) CC genotype was associated with a suggested in-creased risk for both colon (OR: 1.40; 95% CI: 1.00-1.96; p-trend=0.04) and rectal cancer (OR: 1.39; 95% CI: 0.81-2.41; p-trend=0.65). In tumor subtype analyses, the association was limited to TP53-mutated colon tumors. Using the Chatterjee 1 df Tukey test to assess gene-gene interactions, we observed a statistically significant (p<0.01) interac-tion between SNPs in EGFR and Src for colorectal adenoma risk. The association with EGFR 142572 should be inves-tigated in additional studies and the significant gene-gene interaction between EGFR and Src in relation to adenoma risk suggests that these two genes are jointly affecting early stages in colorectal carcinogenesis and requires further follow-up. Keywords: EGFR, colorectal cancer, colorectal polyps, genetics

Genetics in EGFR signaling and colorectal neoplasia risk
301 Int J Mol Epidemiol Genet 2011:2(4):300-315
overexpression of EGFR may be an early event in colon carcinogenesis. In addition, egfr knock-down mice have shown a 10-fold reduction in adenomas [9]. Taken together, these studies indicate that EGFR plays a key role in colorectal cancer development and progression, and that inhibition of EGFR may be a promising treat-ment for colorectal neoplasia. HER2 (also known as ERBB2 or neu) is structur-ally and functionally similar to EGFR [12]. HER2 overexpression or gene amplification has been observed in multiple cancer types, including breast [13], ovarian [14], and gastric tumors [15]. As with EGFR, HER2 overexpression has been observed in aberrant crypt foci in human colon [2]. However, studies of HER2 expression in colorectal cancer have been mixed, with some, but not all studies reporting HER2 RNA or protein overexpression [reviewed in [16]]. Src is a non-receptor tyrosine kinase involved in the EGFR signaling cascade [17]; among many downstream effects, Src signaling affects cell growth and differentiation in the intestine [18]. Src kinase activity or protein levels are elevated in several cancers, including colon, breast, lung, skin, ovarian, endometrial, and head and neck malignancies [19] and were associated with tumor recurrence in one study [20]. Src kinase activity is also elevated in colorectal adenomas [21] and in ulcerative colitis [22], indicating that Src may play a role in the early stages of colo-rectal cancer development. Although polymorphisms and point mutations in EGFR have been studied for survival in many cancer types [23-29] and HER2 has been inves-tigated for its role in breast cancer risk [30-35], no study has yet assessed the role of genetic variability in EGFR signaling in relation to risk of colorectal neoplasia, nor specifically in tumor subtypes. Using a linkage disequilibrium (LD)-based tagSNP approach, we have comprehen-sively assessed genetic variation in EGFR, Src, and HER2 in three independent case-control studies of colorectal adenoma or cancer, includ-ing tumors with specific alterations (TP53 or KRAS2 mutations, CpG island methylator phe-notype (CIMP), and miscrosattelite instability (MSI)) using identical genotyping methods. In addition, we explored potential gene-gene inter-actions using the Chatterjee 1df Tukey test. Thus, we were able to thoroughly evaluate the roles of genetic variability in EGFR signaling
throughout the stages of colorectal carcino-genesis, as well as in different tumor locations. Materials and methods Study populations Adenoma study Colorectal adenoma cases (n=485) and polyp-free controls (n=578) were recruited through a large multiclinic gastroenterological practice in the Twin Cities area of Minnesota from April 1991-April 1994, as previously described [36]. All participants received a colonoscopy. Cases were diagnosed with a first colonoscopy; con-trols were polyp-free. Eligibility criteria have been described elsewhere [36]; participants were aged 30-74 years, English-speaking resi-dents of the Twin Cities metropolitan area with no known genetic syndrome associated with increased risk of colon neoplasia and no individ-ual history of cancer (except non-melanoma skin cancer), prior colorectal polyps, or inflam-matory bowel disease. The participation rate for all colonoscoped patients was 68%. Colon and rectal cancer studies Colon and rectal cancer cases and controls were recruited from the northern California Kai-ser Permanente Medical Care Program (KPMCP), Utah, and the Twin Cities metropolitan area of Minnesota (colon cancer only), as de-scribed previously [37]. Two study populations are included in these analyses. The first study includes cases (n=1424) and controls (n=1780) from a population-based case-control study of colon cancer recruited between October 1, 1991 and September 30, 1994 [37]. The sec-ond study, with identical data collection, in-cludes cases with cancer of the rectosigmoid junction or rectum (n=583) and controls (n=775) who were identified between May 1997 and May 2001 in Utah and KPMCP [38]. Eligible cases were between 30 and 79 years
old at time of diagnosis, English speaking, men-tally competent to complete the interview, had no previous history of colorectal cancer, and no known (as indicated on the pathology report) familial adenomatous polyposis, ulcerative coli-tis, or Crohn's disease. Controls were matched to cases by sex and by 5-year age group. At KPMCP, controls were ran-

Genetics in EGFR signaling and colorectal neoplasia risk
302 Int J Mol Epidemiol Genet 2011:2(4):300-315
domly selected from membership lists; in Utah, controls 65 years and older were randomly se-lected from the Health Care Financing Admini-stration lists and controls younger than 65 years were randomly selected from driver's license
lists. In Minnesota (colon cancer only), controls were selected from driver’s license and state-ID lists. For the colon study, 75.6% of contacted cases and 63.7% of contacted controls were interviewed; for the rectal study, 73.2% of con-tacted cases and 68.8% of contacted controls were interviewed. Response proportions (the number interviewed over all persons identified) were 61.4% for colon cancer cases and 52.5% for controls selected for the colon cancer study and 65.2% of cases and 65.3% of controls for the rectal cancer study. Tumor markers Tumor DNA was obtained from paraffin-embedded tissue as described [39]. As de-scribed in previous publications [40-43], tumors were characterized by their genetic profile that included: sequence data for exons 5 through 8, the mutation hotspots of the TP53 gene; se-quence data for KRAS2 codons 12 and 13; mi-crosatellite instability (MSI) status based on BAT26, TGFBR2, and a panel of 10 tetranucleo-tide repeats; methylation specific PCR of so-dium-bisulfite-modified DNA for five CpG Island markers, CDKN2A, MLH1 and methylated in tumors (MINT) 1, 2 and 31. Tumors with two or more methylated CpG islands were scored as CIMP+. At the time we undertook the methyla-tion-status analysis, there was no consensus CpG-island panel or method of detection to de-termine CIMP. However, we have used our panel to demonstrate relationships between CIMP and numerous clinicopathologic variables [40, 44], indeed, this work has supported the legitimacy of the CIMP concept in colorectal cancer [45, 46]. TagSNP selection An identical tagSNP selection and genotyping procedure was used in all three studies. The coding regions and 2 kB beyond the 5’ and 3’ ends of EGFR and HER2 were resequenced in 23 individuals of European descent by the In-nate Immunity Program for Genomic Applica-tions (http://www.pharmgat.org/IIPGA2/index_html) and the UW-NIEHS Environmental Genome Project (http://egp.gs.washington.edu
respectively). TagSNPs in EGFR and HER2 were selected from these resequenced individuals using the LD Select algorithm developed by Carlson and colleagues [47], with a cutoff minor allele frequency (MAF) of 4% (i.e., any variant that occurred twice) and an r2 value of 0.90. Src has not yet been resequenced by any groups, so tagSNPs were selected from polymorphisms genotyped in HapMap’s CEPH population, using the same criteria as described for EGFR above. This resulted in the selection of 38 tagSNPs in EGFR, 5 tagSNPs in HER2, and 17 in Src, which were estimated by the Genome Variation Server http://gvs.gs.washington.edu/GVS/index.jsp) to cover ≥ 85% of the common (≥4% MAF) varia-tion at these loci (see Supplemental Table S1 for a list of the polymorphisms selected). A total of 55 SNPs were successfully converted to the Illumina™ GoldenGate genotyping platform. All polymorphisms that failed to convert were “singleton” SNPs, not tagging for any other poly-morphisms; we did not pursue these further. Genotyping and QC An identical set of SNPs were genotyped in all three studies. All SNPs were genotyped using the Illumina™ GoldenGate bead-based genotyp-ing technology at the Translational Genomics Institute (TGen, Phoenix, Arizona). Intraplate and interplate replicates at a rate of ~5% were in-cluded on all plates and in all batches. Blinded duplicates were also included on all plates as another QC measure. Genotype data from 30 CEPH trios (Coriell Cell Repository, Camden, NJ) that were genotyped by the HapMap project were used to confirm reliability and reproducibil-ity of the genotyping. Genotypes were excluded from analyses by TGen if any of the following were true: GenTrain Score <0.4, 10%GC Score <0.25, AB T Dev >0.1239, Call Frequency <0.85, Replicate Errors >2, P-P-C Errors >2. Additionally, further exclusions were made for SNPs that had <85% concordance with blinded or non-blinded duplicates (see Supplemental Table S1) and for Hardy-Weinberg Equilibrium p-values <0.0001. Six SNPs failed in all three study populations, mainly due to low call rates or Hardy-Weinberg disequilibrium; four addi-tional SNPs failed in at least one study, and two EGFR tagSNPs were in high LD (r2>0.90), leav-ing 44 SNPs in three genes included in the analyses presented here. Of these, one (EGFR -216G>T), was a candidate SNP.

Genetics in EGFR signaling and colorectal neoplasia risk
303 Int J Mol Epidemiol Genet 2011:2(4):300-315
Questionnaire data Adenoma study Information on lifestyle factors and diet, anthro-pometry, demographics, and medical informa-tion, including family history of cancer and pol-yps, were obtained by questionnaire as de-scribed previously [36]. Colon and rectal cancer studies Data collection has been described previously [37, 38]. The referent period was the calendar year 2 years prior to date of diagnosis or inter-view. Questionnaire data included information
on physical activity, diet, medication use, family history of cancer, smoking history, and recalled
height and weight 2 years prior to interview. Statistical analysis Single SNP analyses Unconditional logistic regression was used to estimate odds ratios (ORs) and corresponding 95% confidence intervals (CIs) for the associa-tions between genotypes in EGFR, HER2, and Src and risk of colorectal adenoma or cancer. Most genotypes were modeled using indicator variables for the heterozygous and the homozy-gous variant genotypes (unrestricted or co-dominant model). If fewer than ten cases or controls had the homozygous variant genotype, we grouped the homozygous variant genotypes with the heterozygous genotypes for analysis (dominant model). Due to racial differences in genotype frequencies, our analyses were re-stricted to Caucasian individuals >82% in all three studies). Likelihood ratio tests were used to assess the association of each SNP with dis-ease risk. To obtain tests for trend, the geno-types were treated as continuous variables. Pooled analyses of the two cancer studies were conducted using a categorical variable that indi-cated both which study and the study site, be-cause the Minnesota site contributed only colon cancer cases. SNP-SNP interactions were explored only for genes that showed statistical significance in gene-gene interactions from Chatterjee testing (see below). All models were adjusted for age and sex; the
analyses of colon and rectal cancers were addi-tionally adjusted for study site. All SNP analyses were carried out using SAS v.9. P-values < 0.05 are considered statistically significant. Multiple comparison adjusted p-values were also ob-tained, taking into account the correlation be-tween tagSNPs using the method by Conneely and Boehnke [48]. To ease the presentation for the tables, we only present p-values that are not adjusted for multiple comparison. Adjusted p-values indicated by adj.p or adj.p trend are pro-vided in the text. Haplotype and principal components analyses Haplotype analysis was conducted using a modified version of HaploStats (Version 1.3.8) which allows adjustment for potential confound-ers in R (Version 2.7.1). All haplotypes predicted to occur with more than 5% frequency among controls were analyzed separately. Haplotypes with frequency < 5% were grouped together for analyses. The most common haplotype among the controls was used as the referent group. We used the score test to evaluate whether a haplo-type was associated with disease risk. For prin-cipal components analysis (PCA) [49], we chose the number of principal components that ex-plained at least 80% of the variance in a gene and performed logistic regression using those components. Gene-level significance was deter-mined using a likelihood-ratio test, comparing a model that contained the principal components and one that did not. Tumor marker analyses Tumors were defined by specific alterations de-tected; any TP53 mutation, any KRAS2 muta-tion, or CIMP+ defined as at least 2 of 5 mark-ers methylated. As the proportion of MSI+ tu-mors in the rectal cases was <3% [50], there was insufficient power to examine rectal MSI. Population-based controls were used to assess associations for the population overall, while examining multiple outcomes defined by tumor status. To compare specific types of mutations to controls while adjusting for the other tumor mutations simultaneously in cases, a general-ized estimating equation (GEE) with a multino-mial outcome was used as case subjects could contribute to more than one outcome observa-tion depending upon the number of mutations or alterations (TP53, KRAS2, CIMP+, and addi-tionally MSI+ for colon cases) detected in an individual’s tumor DNA expressed [51]. The GEE

Genetics in EGFR signaling and colorectal neoplasia risk
304 Int J Mol Epidemiol Genet 2011:2(4):300-315
accounts for correlation introduced by including subjects multiple times and was implemented in SAS using the GENMOD procedure as de-scribed by Kuss and McLerran [52]. All GEE models were adjusted for sex, age at diagnosis or selection, and study center. A co-dominant model with three genotype categories was ana-lyzed with molecular subtypes when minor allele frequencies provided sufficient power to exam-ine the minor-allele homozygous genotype; oth-erwise, a dominant model was assumed. A re-cessive model was analyzed in addition to the co-dominant, when indicated by co-dominant ORs. P for linear trend was assessed using three ordered genotype categories and compar-ing the likelihood ratio of a model with the geno-type variable (as continuous) to the likelihood ratio of a model without the variable using a chi-squared test with 1 degree of freedom. Gene-gene interaction We evaluated gene-gene interactions using the Tukey 1 degree of freedom (1df) interaction test proposed by Chatterjee et al [53]. The 1df Tukey test is a method that tests for gene-gene inter-actions with multiple SNPs within each gene in one model, using a 1df test, rather than a test with many more degrees of freedom or multiple 1df tests of interaction that require correction for multiple testing. All gene-gene interaction analyses were conducted in R (version 2.7.1). Results Characteristics of the study populations are shown for the genotyped subset in Table 1. Briefly, the full study populations were mostly Caucasian (97.2% for the adenoma study; 91.3% for the colon cancer study; and 82.3% for the rectal cancer study – data not shown); adenoma cases tended to be older and were more likely to be male than controls; the cancer case-control studies were frequency-matched on age and sex. Genotype associations Multiple single SNP associations were observed in one or more of the colorectal carcinogenesis studies. However, after adjusting for multiple comparisons, none of the associations re-mained statistically significant. Below, we focus on those results that show similar associations across multiple study populations in direction
and magnitude, which may indicate a possible association of the SNPs with disease risk. Asso-ciations with all analyzed SNPs can be seen in Supplemental Tables S2-S4. In both the colon and rectal cancer populations, the EGFR 142572T>C (rs3752651) CC geno-type was associated with an approximate 40% increase in risk compared to the TT genotype (colon OR: 1.40; 95% CI: 1.00-1.96; p-trend=0.04; adj. p-trend=0.55; rectal OR: 1.39; 95% CI: 0.81-2.41; p-trend=0.65; adj. p-trend=1.00). When the cancer populations were pooled, the association was also statistically significant (OR: 1.39; 95% CI: 1.05-1.86; p-trend=0.13; adj. p-trend=0.90; Table 2). How-ever, the significant association did not remain after adjustment for multiple testing. For rectal cancer, EGFR -759C>A (rs759171) was associated with an increased risk (het OR: 1.26; 95%CI: 0.99-1.61; hzv OR: 1.54; 95% CI: 0.67-3.53; p-trend=0.04; adj. p-trend=0.55). A similarly increased risk of colon cancer was sug-gested among the heterozygous genotypes. When both cancer populations were pooled, results were statistically significant, but only prior to multiple test correction (OR: 1.16; 95% CI: 1.02-1.32, p=0.03 adj. p=0.53). In Src, we observed a consistently decreased risk for -34985A>G (rs6017944) (Table 2). The pooled analysis of colon and rectal cancers yielded het OR: 0.86; 95% CI: 0.76-0.98; hzv OR: 0.91; 95% CI: 0.71-1.17; p=0.06, p-trend=0.05; adj. p=0.47, adj. p-trend=0.40). Associations with adenoma risk appeared to be often opposite to those for colon and rectal can-cer, for example for EGFR 172479C>T (rs17290559) and 141202T>C (rs759162). There were no statistically significant associa-tions with the candidate SNP Arg521Lys (rs2227983) in EGFR, nor with the candidate and tagSNPs in HER2 (Supplemental Table S3). Haplotype and principal components analysis (PCA) associations Haplotype associations are shown in Supple-mental Tables S5-S7. Among colon cancers, Src block 2 was associated with colon cancer risk. This haplotype block was comprised of -33208C>G (rs12106024) and -29667A>G (rs747182), neither of which was independently associated with colon cancer risk. Compared to

Genetics in EGFR signaling and colorectal neoplasia risk
305 Int J Mol Epidemiol Genet 2011:2(4):300-315
Table 1. Characteristics of the three study populationsa Colorectal adenoma study Colon cancer study Rectal cancer study
Cases (N=485) Controls (N=578) p-value Cases (N=1424) Controls (N=1780) p-value Cases (N=583) Controls (N=775) p-value
Mean (SD) Mean (SD) Mean (SD) Mean (SD) Mean (SD) Mean (SD) Age 58 (9.6) 52.9 (11.0) <0.01 65.2 (9.7) 65.1 (10.3) NAc 62.3 (10.8) 62.6 (10.5) NAc Caloric Intake (kcal) 2101.6 (760.0) 2019.8 (733.1) 0.07 2427.9 (1116.6) 2306.5 (1017.4) <0.01 2702.5 (1294.7) 2592.7 (1203.7) 0.11 Dietary Fiber Intake (gm) 21.8 (9.4) 21.8 (9.6) 0.95 24.8 (11.8) 24.9 (11.3) 0.84 26.0 (13.0) 26.7 (13.0) 0.35
Location N (%) N (%) N (%) N (%) N (%) N (%) Proximal 104 (21.6) NA NA 688 (49.6) NA NA NA NA NA Distal 300 (62.4) NA 700 (50.4) NA NA NA Rectal 77 (16.0) NA NA NA 583 775
Sex Male 304 (62.7) 227 (39.3) <0.01 797 (56.0) 946 (53.2) NAc 346 (59.4) 428 (55.2) NAc Female 181 (37.3) 351 (60.7) 627 (44.0) 834 (46.9) 237 (40.7) 347 (44.8)
Study Site
Kaiser Northern California NA NA NA 617 (43.3) 647 (36.4) <0.01 349 (59.9) 449 (57.9) 0.48
Minnesota 485 (100) 578 (100) 565 (39.7) 791 (44.4) NA NA Utah NA NA 242 (17.0) 342 (19.2) 234 (40.1) 326 (40.1) Regular Use of NSAIDs (Ever vs. Never)
Yes 180 (37.1) 257 (44.5) 0.02 562 (39.5) 865 (48.6) <0.01 263 (45.1) 417 (53.8) <0.01 No 305 (62.9) 321 (55.6) 862 (60.5) 915 (51.4) 320 (54.9) 358 (46.2) Smoking in pack-years (amt per day)b
0 163 (34.4) 276 (49.0) <0.01 840 (47.3) 581 (41.0) <0.01 271 (46.5) 401 (51.7) 0.05 1-25 (≤20) 152 (32.1) 171 (30.4) 336 (18.9) 250 (17.6) 106 (18.2) 133 (17.2) >25 (21+) 159 (33.5) 116 (20.6) 599 (33.8) 586 (41.4) 206 (35.3) 241 (31.1) Post-menopausal Hormone Use (Women only)
Yes 71 (40.6) 181 (53.2) 0.01 130 (23.9) 221 (31.0) 0.006 110 (56.7) 132 (45.2) 0.01 No 104 (59.4) 159 (46.8) 414 (76.1) 493 (69.1) 84 (43.3) 160 (54.8) a Numbers may not total to 100% due to rounding and missing values; b For adenoma and rectal cancers, pack-years are reported. For colon cancer, number of cigarettes per day is reported.; c NA – this was a matching factor.
Genetics in EGFR signaling and colorectal neoplasia risk
306 Int J Mol Epidemiol Genet 2011:2(4):300-315
Table 2. Genetic variability in selected EGFR and Src SNPs and risk of colorectal neoplasiaa Colorectal Adenomab Colon Cancerc Rectal cancerc Colorectal cancerd
Gene SNPd Cases/ Controls OR 95%CI p p-trend Cases/
Controls OR 95%CI p p-trend Cases/ Controls OR 95%CI p p-
trend Cases/ Controls OR 95%CI p p-trend
EGFR rs759171 (-759C>A) CC 353/411 1.00 (ref.) 1021/1315 1.00 (ref.) 407/579 1.00 (ref.) 1428/1894 1.00 (ref.) CA 117/149 0.95 (0.70-1.27) 375/427 1.12 (0.96-
1.32) 163/184 1.26 (0.99-1.61) 538/611 1.16 (1.02-1.33)
AA 10/18 0.62 (0.27-1.41) 0.50 0.36 28/36 0.98 (0.59-1.62) 0.37 0.26 12/11 1.54 (0.67-3.53) 0.12 0.04 40/47 1.10 (0.72-1.70) 0.09 0.04
CA/AA 127/168 0.91 (0.68-1.21) 0.51 NA 403/463 1.11 (0.95-1.30) 0.19 NA 175/195 1.28 (1.00-1.63) 0.05 NA 578/658 1.16 (1.02-1.32) 0.03 NA
rs759162 (141202T>C) TT 242/307 1.00 (ref.) 764/900 1.00 (ref.) 308/426 1.00 (ref.) 1072/1326 1.00 (ref.) TC 200/231 1.06 (0.81-1.39) 550/706 0.92 (0.80-
1.07) 235/290 1.13 (0.90-1.41) 785/996 0.98 (0.87-1.11)
CC 40/40 1.34 (0.82-2.20) 0.51 0.29 105/171 0.73 (0.56-0.95) 0.05 0.02 40/59 0.94 (0.61-1.44) 0.51 0.67 145/230 0.78 (0.63-0.98) 0.09 0.10
rs3752651 (142572T>C) TT 313/358 1.00 (ref.) 900/1178 1.00 (ref.) 369/468 1.00 (ref.) 1269/1646 1.00 (ref.) TC 150/198 0.90 (0.68-1.19) 446/529 1.11 (0.95-
1.29) 183/278 0.83 (0.66-1.05) 629/807 1.01 (0.89-1.15)
CC 19/21 1.04 (0.53-2.05) 0.75 0.63 75/70 1.40 (1.00-1.96) 0.09 0.04 29/26 1.39 (0.81-2.41) 0.11 0.65 104/96 1.39 (1.05-1.86) 0.08 0.13
rs10277413 (151493T>G) TT 211/232 1.00 (ref.) 626/792 1.00 (ref.) 247/365 1.00 (ref.) 873/1157 1.00 (ref.) TG 221/271 0.86 (0.66-1.14) 611/775 0.98 (0.85-
1.14) 272/313 1.28 (1.02-1.62) 883/1088 1.06 (0.94-1.21)
GG 49/75 0.64 (0.41-0.98) 0.11 0.04 182/206 1.10 (0.88-1.38) 0.62 0.59 61/94 0.97 (0.67-1.39) 0.07 0.40 243/300 1.06 (0.88-1.28) 0.59 0.37
rs17290559 (172479C>T) CC 442/546 1.00 (ref.) 1344/1655 1.00 (ref.) 552/720 1.00 (ref.) 1896/2375 1.00 (ref.) CT/TT 35/27 1.55 (0.90-2.66) 0.11 NA 67/108 0.77 (0.56-
1.05) 0.10 NA 27/43 0.82 (0.50-1.35) 0.74 NA 94/151 0.78 (0.60-1.02) 0.07 NA

Genetics in EGFR signaling and colorectal neoplasia risk
307 Int J Mol Epidemiol Genet 2011:2(4):300-315
Table 2. (continued) Genetic variability in selected EGFR and Src SNPs and risk of colorectal neoplasiaa Colorectal Adenomab Colon Cancerc Rectal cancerc Colorectal cancerd
Gene SNPd Cases/ Controls OR 95%CI p p-trend Cases/
Controls OR 95%CI p p-trend Cases/ Controls OR 95%CI p p-
trend Cases/ Controls OR 95%CI p p-trend
rs17337331 (172977C>G) CC 277/338 1.00 (ref.) 833/1003 1.00 (ref.) 354/429 1.00 (ref.) 1187/1432 1.00 (ref.) CG 170/208 1.00 (0.76-1.31) 473/648 0.88 (0.76-1.02) 201/306 0.80 (0.64-1.01) 674/954 0.86 (0.75-
0.97)
GG 30/27 1.30 (0.73-2.31) 0.65 0.57 80/93 1.03 (0.75-1.41) 0.23 0.33 27/39 0.84 (0.51-1.40) 0.15 0.08 107/132 0.98 (0.75-1.27) 0.05 0.08
Src rs6017944 (-34985A>G) AA 284/350 1.00 (ref.) 831/992 1.00 (ref.) 346/425 1.00 (ref.) 1177/1417 1.00 (ref.)
AG 171/191 1.16 (0.88-1.52) 494/660 0.88 (0.76-1.02) 204/302 0.82 (0.65-1.03) 698/962 0.86 (0.76-0.98)
GG 26/37 0.90 (0.52-1.58) 0.49 0.65 90/116 0.94 (0.70-1.25) 0.24 0.18 31/45 0.85 (0.53-1.38) 0.22 0.12 121/161 0.91
(0.71-1.17) 0.06 0.05
a Only SNPs with p<0.10 in Table 2. The associations with all SNPs can be seen in Supplemental Tables S2-4; b Adjusted for age and sex; c Adjusted for age, sex, and study center; d Pooled analysis of the colon and rectal cancer studies, adjusted for age, sex, study center, and study; e The heterozygous and homozygous variant genotype groups are combined if the homozygous variant group had < 5 study participants.
Genetics in EGFR signaling and colorectal neoplasia risk
308 Int J Mol Epidemiol Genet 2011:2(4):300-315
Table 3A. Associations between selected SNPs and risk of colon cancer molecular subtypesa
Controls TP53 mutation KRAS mutation CIMP+ MSI+
Gene SNP N N OR (95% CI) p N OR (95% CI) p N OR (95% CI) p N OR (95% CI) p
EGFR 141202 T>C (rs759162)
TT 898 253 1.00 (ref.) 156 1.00 (ref.) 116 1.00 (ref.) 83 1.00 (ref.)
TC 705 181 0.89 (0.73-1.07) 129 1.05 (0.83-1.32) 115 1.22 (0.95-1.56) 74 1.10 (0.81-1.50)
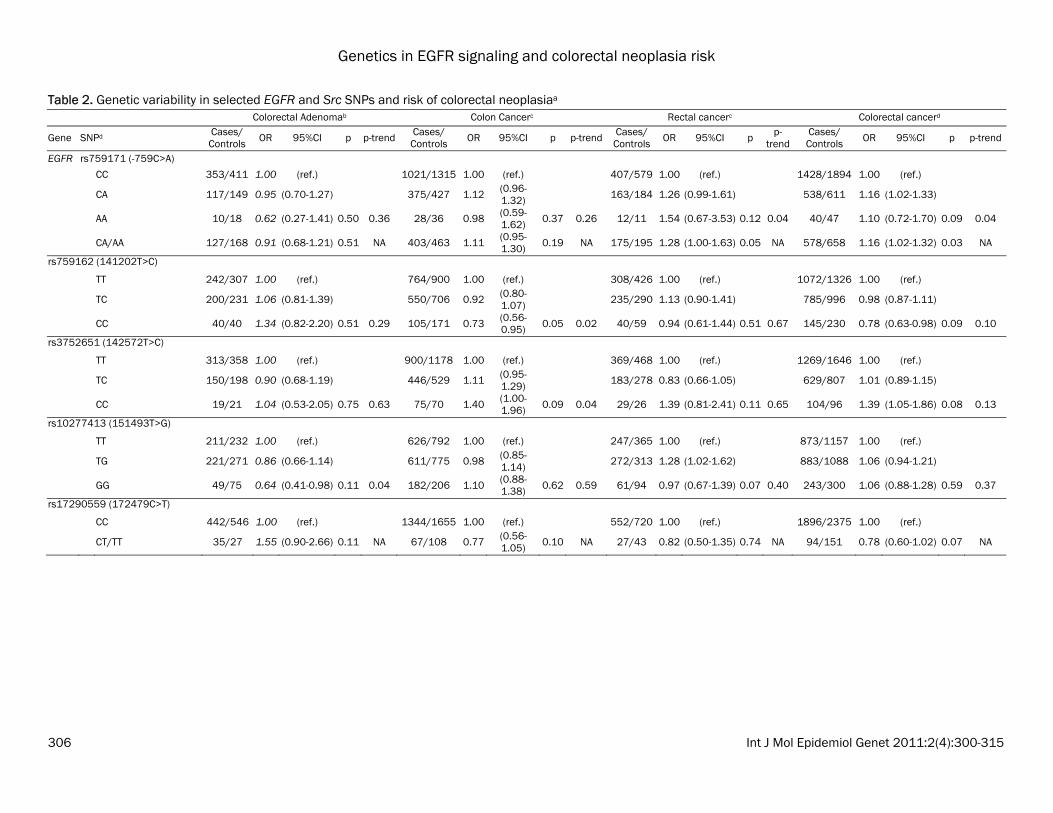
CC 170 28 0.64 (0.43-0.94) 0.03 22 0.87 (0.56-1.36) 0.63 16 0.84 (0.51-1.39) 0.85 12 0.85 (0.47-1.53) 0.77
142572 T>C (rs3752651)
TT 1176 280 1.00 (ref.) 199 1.00 (ref.) 167 1.00 (ref.) 112 1.00 (ref.)
TC 528 158 1.27 (1.04-1.55) 85 0.91 (0.71-1.18) 68 0.87 (0.67-1.15) 52 1.02 (0.74-1.41)
CC 69 25 1.35 (0.87-2.08) 0.02 22 1.70 (1.09-2.65) 0.22 11 0.98 (0.53-1.80) 0.86 6 0.80 (0.35-1.83) 0.82
154784 G>A (rs17337107)
GG 1624 407 1.00 (ref.) 273 1.00 (ref.) 225 1.00 (ref.) 154 1.00 (ref.)
GA or AA 145 53 1.38 (1.03-1.84) 0.03 33 1.25 (0.88-1.77) 0.12 22 0.99 (0.65-1.51) 0.71 15 0.99 (0.59-1.67) 0.80
161260 G>A (rs12532468)
GG 596 177 1.00 (ref.) 104 1.00 (ref.) 76 1.00 (ref.) 58 1.00 (ref.)
GA 853 220 0.86 (0.70-1.06) 143 0.98 (0.76-1.26) 133 1.23 (0.94-1.61) 83 1.00 (0.71-1.39)
AA 316 65 0.70 (0.53-0.94) 0.03 58 1.16 (0.84-1.60) 0.76 37 0.97 (0.67-1.42) 0.91 27 0.92 (0.59-1.44) 0.61
Src -25903 G>A (rs6017996)
GG 1293 312 1.00 (ref.) 206 1.00 (ref.) 176 1.00 (ref.) 133 1.00 (ref.)
GA 440 134 1.22 (0.99-1.49) 92 1.25 (0.98-1.59) 65 1.02 (0.78-1.34) 34 0.71 (0.49-1.02)
AA 38 15 1.61 (0.96-2.72) 0.03 6 0.86 (0.38-1.93) 0.16 6 1.19 (0.54-2.63) 0.51 2 0.51 (0.12-2.12) 0.13
9597 A>G (rs6018256)
AA 1483 376 1.00 (ref.) 244 1.00 (ref.) 207 1.00 (ref.) 153 1.00 (ref.)
AG or GG 291 88 1.19 (0.94-1.51) 0.19 64 1.33 (1.01-1.76) 0.06 40 0.93 (0.67-1.29) 0.96 17 0.52 (0.32-0.86) 0.02
9982 A>G (rs6018257)
AA 1379 353 1.00 (ref.) 221 1.00 (ref.) 192 1.00 (ref.) 145 1.00 (ref.)
AG 357 100 1.10 (0.88-1.37) 76 1.35 (1.04-1.75) 49 0.95 (0.70-1.28) 21 0.53 (0.34-0.83)
GG 21 6 1.26 (0.55-2.87) 0.45 4 1.33 (0.50-3.55) 0.06 1 0.33 (0.05-2.12) 0.58 1 0.43 (0.06-2.89) 0.01 aAdjusted for age, sex, and study center.
Genetics in EGFR signaling and colorectal neoplasia risk
309 Int J Mol Epidemiol Genet 2011:2(4):300-315
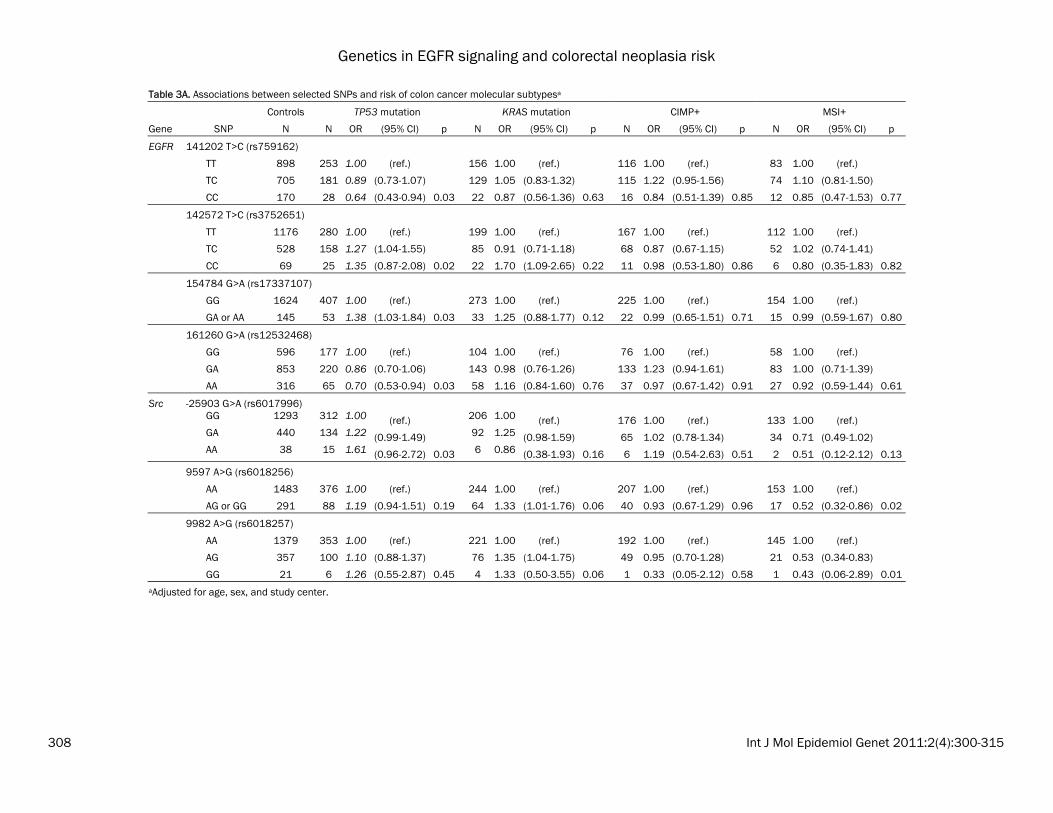
Table 3B. Associations between selected SNPs and risk of rectal cancer molecular subtypesa Controls TP53 mutation KRAS mutation CIMP+ Gene SNP N N OR (95% CI) p N OR (95% CI) p N OR (95% CI) p
EGFR -759 C>A (rs759171) CC 579 148 1.00 (ref.) 81 1.00 (ref.) 34 1.00 (ref.) CA 184 54 1.05 (0.76-1.44) 46 1.73 (1.20-2.50) 12 1.00 (0.52-1.93) AA 11 6 1.48 (0.71-3.07) 0.19 7 3.64 (1.69-7.82) 0.0002 1 0.98 (0.14-6.99) 0.65
154784 G>A (rs17337107) GG 686 191 1.00 (ref.) 117 1.00 (ref.) 46 1.00 (ref.)
GA/AA 87 18 0.76 (0.47-1.23) 0.27 17 1.26 (0.76-2.09) 0.64 1 0.18 (0.03-1.28) 0.02
HER2 Pro1140 Ala (rs1058808) GG 361 83 1.00 (ref.) 59 1.00 (ref.) 19 1.00 (ref.) GC 337 94 1.19 (0.88-1.61) 60 1.04 (0.72-1.49) 22 1.18 (0.64-2.17) CC 73 30 1.70 (1.09-2.64) 0.03 14 1.01 (0.56-1.81) 0.57 6 1.37 (0.55-3.37) 0.33
aAdjusted for age, sex, and study center.
Table 4. Chatterjee 1df Tukey tests for gene-gene interaction Colorectal Adenomaa Colon Cancerb Rectal cancerb Gene 1 Gene 2 Permutation p Asymptotic p Permutation p Asymptotic p Permutation p Asymptotic p EGFR HER2 0.71 0.77 0.24 0.26 0.47 0.50 EGFR Src <0.01 <0.01 0.60 0.59 0.14 0.17 HER2 Src 0.67 0.68 0.99 0.99 0.39 0.36 a Adjusted for age and sex; b Adjusted for age, sex, and study center.

Genetics in EGFR signaling and colorectal neoplasia risk
310 Int J Mol Epidemiol Genet 2011:2(4):300-315
Table 5. Selected interactions between tagSNPs in EGFR and Src and risk of colorectal adenomaa
Src -29667A>G AA AG or GG
snp genotype Cases Controls OR 95% CI Cases Controls OR 95% CI p-interactionb EGFR 179446C>T (Thr903Thr) CC 275 345 1.00 (ref.) 98 96 1.30 (0.92-1.82)
CT or TT 89 98 1.12 (0.80-1.59) 20 43 0.62 (0.35-1.12) 0.02 Src -41278A>C AA AC or CC
snp genotype Cases Controls OR 95% CI Cases Controls OR 95% CI p-interactionb EGFR 179446C>T (Thr903Thr) CC 196 252 1.00 (ref.) 176 187 1.24 (0.93-1.67)
CT or TT 72 72 1.21 (0.81-1.80) 37 69 0.78 (0.49-1.24) 0.04 Src -34985A>G AA AG or GG
snp genotype Cases Controls OR 95% CI Cases Controls OR 95% CI p-interactionb EGFR 122960T>G TT 79 101 1.00 (ref.) 45 73 0.70 (0.43-1.16)
TG or GG 206 249 0.96 (0.66-1.39) 152 158 1.24 (0.84-1.83) 0.04 Src -25903G>A GG GA or AA
snp genotype Cases Controls OR 95% CI Cases Controls OR 95% CI p-interactionb EGFR 122960T>G TT 99 127 1.00 (ref.) 26 47 0.70 (0.39-1.25)
TG or GG 247 298 1.03 (0.74-1.44) 110 107 1.37 (0.92-2.04) 0.04 Src 9982A>G AA AG or GG
snp genotype Cases Controls OR 95% CI Cases Controls OR 95% CI p-interactionb EGFR 151493T>G TT 168 187 1.00 (ref.) 44 46 1.20 (0.74-1.97)
TG or GG 232 270 0.92 (0.69-1.23) 38 79 0.53 (0.33-0.85) 0.03 Src -3411G>A GG GA or AA
snp genotype Cases Controls OR 95% CI Cases Controls OR 95% CI p-interactionb EGFR 124345G>A GG 396 469 1.00 (ref.) 36 51 0.87 (0.54-1.40)
GA or AA 43 59 0.87 (0.56-1.35) 8 3 3.40 (0.84-13.74) 0.04 EGFR 140539G>A GG 302 370 1.00 (ref.) 25 44 0.71 (0.42-1.23)
GA or AA 137 158 1.09 (0.81-1.46) 19 10 2.61 (1.15-5.93) 0.02 Src -4395A>G AA AG or GG
snp genotype Cases Controls OR 95% CI Cases Controls OR 95% CI p-interactionb EGFR 142044A>G AA 186 230 1.00 (ref.) 84 91 1.17 (0.81-1.71)
AG or GG 161 175 1.05 (0.77-1.43) 52 85 0.68 (0.45-1.03) 0.04 a.Adjusted for age and sex; only statistically significant interactions are shown; b Uncorrected for multiple comparisons. After Bonferroni correction, none of the interactions are statistically significant.

Genetics in EGFR signaling and colorectal neoplasia risk
311 Int J Mol Epidemiol Genet 2011:2(4):300-315
the most common haplotype (CA), the GA haplo-type was associated with a statistically signifi-cant decrease in colon cancer risk (OR: 0.81; 95% CI: 0.69-0.96); whereas the GG haplotype was not associated with risk (OR: 1.03; 95% CI: 0.90-1.19). No statistically significant haplotype associations were observed for colorectal ade-nomas and rectal cancers, nor were there sig-nificant associations using PCA (data not shown). Associations with tumor subtypes We evaluated whether polymorphisms in EGFR, Src, and HER2 were associated with specific colon and rectal cancer subtypes (MSI+, CIMP+, TP53 mutation, or KRAS2 mutation). Because these were exploratory analyses, we did not adjust for multiple comparisons. In the colon cancers, we observed that four EGFR SNPs and one Src SNP was associated with risk of colon cancer with a TP53 mutation (Table 3A). Of note, the increased risk of colon cancer for EGFR 142572T>C (rs3752651), which was as-sociated with risk of both colon and rectal can-cers above, was only observed for TP53-mutated colon cancers (het OR: 1.27; 95% CI: 1.04-1.55; hzv OR: 1.35; 95% CI: 0.87-2.08; p=0.02). In rectal cancer, in which MSI+ tumors are too rare to analyze, we observed a striking associa-tion between EGFR -759C>A (rs759171) and risk of KRAS-mutated rectal cancer (Table 3B; p=0.0002). The CA genotype was associated with a 73% increased risk (95% CI: 1.20-2.50) and the AA genotype was associated with an almost 4-fold increase in risk (OR: 1.69-7.82). This SNP was observed with risk of rectal cancer overall (as described above), but the associa-tions for TP53-mutated or CIMP+ rectal cancers were not significant. Although no associations were observed between HER2 SNPs and rectal tumor markers overall, HER2 -658C>A (rs4252596) was associated with a ~50% de-creased risk of TP53 or KRAS2 tumor mutation in women and an interaction term for sex was nominally significant at the 0.01 level (data not shown). Gene-gene interactions Results from the 1df Tukey test are shown in Table 4. For adenomas, SNPs in EGFR and Src showed a significant interaction (p<0.01). To
follow-up on this finding, SNP-SNP interactions between tagSNPs in EGFR and Src were ex-plored (see below). No statistically significant interactions were detected for colon or rectal cancer. SNP-SNP interactions Prior to correcting for multiple testing, we de-tected 8 statistically significant interactions be-tween tagSNPs in EGFR and Src and adenoma risk (Table 5). However, when these interactions were corrected for multiple testing, none re-mained statistically significant. It is worth noting that two EGFR SNPs, EGFR 179446C>T (rs1140475; Thr903Thr) and EGFR 122960T>G (rs6964705), each interacted with two Src SNPs. EGFR 179446C>T showed statistically signifi-cant interactions with both Src -29667A>G (rs747182) and -41278A>C (rs6017916), which are in moderate LD (r2=0.46, Supplemen-tal Figure). In both cases, the combination of variants in Src and EGFR resulted in the rela-tively lowest risk, combined to all other groups (p-interaction=0.02 and 0.04, respectively). EGFR 122960T>G (rs6964705) showed inter-actions with both Src -34985A>G (rs6017944) and -25903G>A (rs6017996), which are not in LD (r2=0.08, Supplemental Figure). For both of these, those with at least one variant Src and EGFR allele were at increased polyp risk (p-interaction=0.04 for both). Discussion In this comprehensive study of genetic variabil-ity in EGFR signaling across the continuum of colorectal carcinogenesis, we observed several associations between SNPs in EGFR and Src and risk of colorectal cancer; specifically, the EGFR 142572T>C CC genotype was associated with an approximately 40% increase in both colon and rectal cancer risk, compared to the wildtype. This replication of findings across these two tumor locations is interesting and potentially important. However, because we did not have access to an independent study popu-lation for replication, we performed multiple comparison adjustment which attenuated the p-values. We also observed several SNP-SNP in-teractions, indicating that these tagSNPs may need to be considered within a wider context.

Genetics in EGFR signaling and colorectal neoplasia risk
312 Int J Mol Epidemiol Genet 2011:2(4):300-315
Several polymorphisms in EGFR have previously been associated with cancer outcomes. The Arg521Lys polymorphism has been associated with colorectal cancer survival in a small study (n=318) [23]. In that study, opposite associa-tions were observed for men and women, indi-cating that EGFR polymorphisms may interact with hormone status in colorectal cancer, al-though this pattern of findings could also have been the result of small numbers. The Arg521Lys polymorphism has also been associ-ated with response to the EGFR inhibitor cetuxi-mab in a study of 32 colorectal cancer patients [24]. In the present study, we observed no asso-ciation between Arg521Lys and colorectal neo-plasia risk overall or when stratified by sex (data not shown), indicating that this EGFR variant may be more important for colorectal cancer progression or response to treatment than for cancer development. Another EGFR SNP, -216G>T, has been associ-ated with changes in promoter activity [54] and with overall survival among non-small cell lung cancer patients [25], especially among those treated with the EGFR inhibitor gefitinib [26]. This SNP did not pass QC measures in our study. A third polymorphism, a CA-repeat poly-morphism in intron 1, in which higher numbers of repeats results in lower EGFR expression, has been associated with risk of breast cancer risk [27] and with survival in head and neck [28], lung [29], colorectal [23] and non-small cell lung cancer [26]. Taken together, these results suggest that genetic variability in EGFR may be associated with increased risk of several cancer types and may predict response to EGFR inhibi-tors. Given that several EGFR inhibitors have been approved for cancer treatment, it will be important in the future to determine whether the observed associations with cancer survival or response to treatment can be confirmed, and whether a pattern of polymorphisms can identify those most or least likely to benefit from treat-ment with EGFR inhibitors. As KRAS mutation is a predictor of response to anti-EGFR antibody therapy in colorectal cancer [55], the association of EGFR -759C>A with in-creased risk of KRAS-mutated rectal tumors is intriguing and further studies are needed to elucidate the role of common variants in EGFR in relation to KRAS mutations. To our knowledge, no study has investigated the
role of HER2 polymorphisms in colorectal neo-plasia risk. However, several studies have inves-tigated the role of Ile655Val in breast cancer development, with mixed results. Several stud-ies have shown increased risk with the variant genotypes [30-32] [reviewed in [34]], whereas others have shown decreased risk [33, 34], or no association [35], reviewed in [34], indicating that the role of this polymorphism, if any, re-quires further elucidation. A small study of gas-tric cancer patients and hospital-based controls in Japan found an increased risk associated with the variant genotypes [56], but this re-quires confirmation in a larger study. We ob-served no association with this polymorphism in our study populations; thus genetic variability HER2 may be less important for colorectal neo-plasia. An exploratory analysis indicated HER2 may influence risk differentially in men and women. In Src, we observed a decreased risk of colorectal cancer with -34985A>G. No other epidemiologic studies of Src polymorphisms have been conducted to date. In one small study, a rare coding mutation in Src was ob-served in a subset of advanced colorectal tu-mors [57]; however, two subsequent studies did not observe this mutation [58, 59]. Due to the number of statistical tests that were performed in this study, the likelihood of false positives is high. However, because we con-ducted a parallel investigation of identical can-didate and tagSNPs in three independent study populations, we decided to present uncorrected as well as corrected p-values and evaluate whether the associations with any of these SNPs were consistent across the three study populations. SNPs that are associated with colo-rectal neoplasia risk in multiple study popula-tions are more likely to be true positives. Fur-ther, this is the first study that has comprehen-sively examined common EGFR, HER2, and Src genetic variability in relation to colorectal ade-noma and cancer risk; thus, we report any ob-served associations to inform future studies. This study has several strengths. By using both tagSNPs and candidate polymorphisms in this pathway, we achieved comprehensive coverage of genetic variability in the EGFR signaling. For EGFR and HER2, we had access to resequenc-ing data, ensuring that we captured all common variants that are likely to exist among Cauca-sians. Further, we have comprehensively as-sessed genetic variation in EGFR, Src, and

Genetics in EGFR signaling and colorectal neoplasia risk
313 Int J Mol Epidemiol Genet 2011:2(4):300-315
HER2 in three independent case-control studies of colorectal adenoma or cancer (including tu-mor markers), using identical genotyping meth-ods, thus allowing us to replicate any promising findings. It is, however, important to consider that the outcomes in the three study popula-tions were not identical: colon and rectal cancer share some, but not all epidemiologic risk fac-tors, and adenoma are precursors that occur years prior to invasive cancer. In summary, our study provides a thorough in-vestigation, not only of genetic variability in EGFR signaling, but also of the spectrum of the colorectal carcinogenic process. We provide some evidence that EGFR 142575T>C may be important in both colon and rectal cancer, but this should be confirmed in future studies. Given that genetic variants in EGFR may be re-lated to colorectal cancer survival or responsive-ness to treatment with EGFR inhibitors, further study of the impact of genetic variability in the EGFR signaling pathway, specifically replication of the tumor subtype analyses, should be con-ducted. Acknowledgements The authors would like to thank Dr. Roberd Bos-tick and Lisa Fosdick for their contributions to the initial establishment of the adenoma study. We also gratefully acknowledge Sandie Edwards for her contributions to the colon and rectal can-cer studies. Sources of financial support: Grants R01 CA114467, R03 CA123577, R25 CA094880, T32 DK007742, and T32 CA009001. Address correspondence to: Dr. Cornelia Ulrich, Divi-sion of Preventive Oncology, German Cancer Re-search Center, Im Neuenheimer Feld 280, G110, D-69120, Heidelberg, Germany Tel: +49 6221 42-2263; Fax: +49 6221 42-1619; E-mail: [email protected] References [1] Grandis JR, Sok JC. Signaling through the epi-
dermal growth factor receptor during the devel-opment of malignancy. Pharmacol Ther 2004; 102: 37-46.
[2] Cohen G, Mustafi R, Chumsangsri A, Little N, Nathanson J, Cerda S, Jagadeeswaran S, Dougherty U, Joseph L, Hart J, Yerian L, Treti-akova M, Yuan W, Obara P, Khare S, Sinicrope FA, Fichera A, Boss GR, Carroll R, Bissonnette M. Epidermal growth factor receptor signaling is
up-regulated in human colonic aberrant crypt foci. Cancer Res 2006; 66: 5656-64.
[3] Malecka Panas E, Kordek R, Biernat W, Tureaud J, Liberski PP, Majumdar AP. Differen-tial activation of total and EGF receptor (EGF-R) tyrosine kinase (tyr-k) in the rectal mucosa in patients with adenomatous polyps, ulcerative colitis and colon cancer. Hepatogastroenterol-ogy 1997; 44: 435-40.
[4] Porebska I, Harlozinska A, Bojarowski T. Expres-sion of the tyrosine kinase activity growth factor receptors (EGFR, ERB B2, ERB B3) in colorectal adenocarcinomas and adenomas. Tumour Biol 2000; 21: 105-15.
[5] Messa C, Russo F, Caruso MG, Di Leo A. EGF, TGF-alpha, and EGF-R in human colorectal ade-nocarcinoma. Acta Oncol 1998; 37: 285-9.
[6] Tong WM, Ellinger A, Sheinin Y, Cross HS. Epi-dermal growth factor receptor expression in primary cultured human colorectal carcinoma cells. Br J Cancer 1998; 77: 1792-8.
[7] Radinsky R, Risin S, Fan D, Dong Z, Bielenberg D, Bucana CD, Fidler IJ. Level and function of epidermal growth factor receptor predict the metastatic potential of human colon carcinoma cells. Clin Cancer Res 1995; 1: 19-31.
[8] Ng K, Zhu AX. Targeting the epidermal growth factor receptor in metastatic colorectal cancer. Crit Rev Oncol Hematol 2008; 65: 8-20.
[9] Roberts RB, Min L, Washington MK, Olsen SJ, Settle SH, Coffey RJ, Threadgill DW. Importance of epidermal growth factor receptor signaling in establishment of adenomas and maintenance of carcinomas during intestinal tumorigenesis. Proc Natl Acad Sci USA 2002; 99: 1521-6.
[10] Torrance CJ, Jackson PE, Montgomery E, Kin-zler KW, Vogelstein B, Wissner A, Nunes M, Frost P, Discafani CM. Combinatorial chemo-prevention of intestinal neoplasia. Nat Med 2000; 6: 1024-8.
[11] Fichera A, Little N, Jagadeeswaran S, Dougherty U, Sehdev A, Mustafi R, Cerda S, Yuan W, Khare S, Tretiakova M, Gong C, Tallerico M, Cohen G, Joseph L, Hart J, Turner JR, Bissonnette M. Epidermal growth factor receptor signaling is required for microadenoma formation in the mouse azoxymethane model of colonic carcino-genesis. Cancer Res 2007; 67: 827-35.
[12] Baselga J, Swain SM. Novel anticancer targets: revisiting ERBB2 and discovering ERBB3. Nat Rev Cancer 2009; 9: 463-75.
[13] Owens MA, Horten BC, Da Silva MM. HER2 amplification ratios by fluorescence in situ hy-bridization and correlation with immunohisto-chemistry in a cohort of 6556 breast cancer tissues. Clin Breast Cancer 2004; 5: 63-9.
[14] Vermeij J, Teugels E, Bourgain C, Xiangming J, in 't Veld P, Ghislain V, Neyns B, De Greve J. Genomic activation of the EGFR and HER2-neu genes in a significant proportion of invasive epithelial ovarian cancers. BMC Cancer 2008; 8: 3.

Genetics in EGFR signaling and colorectal neoplasia risk
314 Int J Mol Epidemiol Genet 2011:2(4):300-315
[15] Jaehne J, Urmacher C, Thaler HT, Friedlander Klar H, Cordon Cardo C, Meyer HJ. Expression of Her2/neu oncogene product p185 in correla-tion to clinicopathological and prognostic fac-tors of gastric carcinoma. J Cancer Res Clin Oncol 1992; 118: 474-9.
[16] Roskoski R Jr. The ErbB/HER receptor protein-tyrosine kinases and cancer. Biochem Biophys Res Commun 2004; 319: 1-11.
[17] Dehm SM, Bonham K. SRC gene expression in human cancer: the role of transcriptional acti-vation. Biochem Cell Biol 2004; 82: 263-74.
[18] Mathew S, George SP, Wang Y, Siddiqui MR, Srinivasan K, Tan L, Khurana S. Potential mo-lecular mechanism for c-Src kinase-mediated regulation of intestinal cell migration. J Biol Chem 2008; 283: 22709-22.
[19] Irby RB, Yeatman TJ. Role of Src expression and activation in human cancer. Oncogene 2000; 19: 5636-42.
[20] de Heer P, Koudijs MM, van de Velde CJ, Aal-bers RI, Tollenaar RA, Putter H, Morreau J, van de Water B, Kuppen PJ. Combined expression of the non-receptor protein tyrosine kinases FAK and Src in primary colorectal cancer is associated with tumor recurrence and metasta-sis formation. Eur J Surg Oncol 2008; 34: 1253-61.
[21] Cartwright CA, Meisler AI, Eckhart W. Activation of the pp60c-src protein kinase is an early event in colonic carcinogenesis. Proc Natl Acad Sci USA 1990; 87: 558-62.
[22] Cartwright CA, Coad CA, Egbert BM. Elevated c-Src tyrosine kinase activity in premalignant epithelia of ulcerative colitis. J Clin Invest 1994; 93: 509-15.
[23] Press OA, Zhang W, Gordon MA, Yang D, Lurje G, Iqbal S, El Khoueiry A, Lenz HJ. Gender-related survival differences associated with EGFR polymorphisms in metastatic colon can-cer. Cancer Res 2008; 68: 3037-42.
[24] Goncalves A, Esteyries S, Taylor Smedra B, Lagarde A, Ayadi M, Monges G, Bertucci F, Esterni B, Delpero JR, Turrini O, Lelong B, Viens P, Borg JP, Birnbaum D, Olschwang S, Viret F. A polymorphism of EGFR extracellular domain is associated with progression free-survival in metastatic colorectal cancer patients receiving cetuximab-based treatment. BMC Cancer 2008; 8: 169.
[25] Gregorc V, Hidalgo M, Spreafico A, Cusatis G, Ludovini V, Ingersoll RG, Marsh S, Steinberg SM, Vigano MG, Ghio D, Villa E, Sparreboom A, Baker SD. Germline polymorphisms in EGFR and survival in patients with lung cancer receiv-ing gefitinib. Clin Pharmacol Ther 2008; 83: 477-84.
[26] Liu G, Gurubhagavatula S, Zhou W, Wang Z, Yeap BY, Asomaning K, Su L, Heist R, Lynch TJ, Christiani DC. Epidermal growth factor receptor polymorphisms and clinical outcomes in non-small-cell lung cancer patients treated with
gefitinib. Pharmacogenomics J 2008; 8: 129-38.
[27] Brandt B, Hermann S, Straif K, Tidow N, Buer-ger H, Chang Claude J. Modification of breast cancer risk in young women by a polymorphic sequence in the egfr gene. Cancer Res 2004; 64: 7-12.
[28] Bandres E, Barricarte R, Cantero C, Honorato B, Malumbres R, Zarate R, Alcalde J, Garcia-Foncillas J. Epidermal growth factor receptor (EGFR) polymorphisms and survival in head and neck cancer patients. Oral Oncol 2007; 43: 713-9.
[29] Nie Q, Wang Z, Zhang GC, An SJ, Lin JY, Guo AL, Li R, Gan B, Huang Y, Mok TS, Wu YL. The epi-dermal growth factor receptor intron1 (CA) n microsatellite polymorphism is a potential pre-dictor of treatment outcome in patients with advanced lung cancer treated with Gefitinib. Eur J Pharmacol 2007; 570: 175-81.
[30] Siddig A, Mohamed AO, Kamal H, Awad S, Has-san AH, Zilahi E, Al Haj M, Bernsen R, Adem A. HER-2/neu Ile655Val polymorphism and the risk of breast cancer. Ann N Y Acad Sci 2008; 1138: 84-94.
[31] Lee SC, Hou MF, Hsieh PC, Wu SH, Hou LA, Ma H, Tsai SM, Tsai LY. A case-control study of the HER2 Ile655Val polymorphism and risk of breast cancer in Taiwan. Clin Biochem 2008; 41: 121-5.
[32] Millikan RC, Hummer AJ, Wolff MS, Hishida A, Begg CB. HER2 codon 655 polymorphism and breast cancer: results from kin-cohort and case-control analyses. Breast Cancer Res Treat 2005; 89: 309-12.
[33] Nelson SE, Gould MN, Hampton JM, Trentham Dietz A. A case-control study of the HER2 Ile655Val polymorphism in relation to risk of invasive breast cancer. Breast Cancer Res 2005; 7: R357-64.
[34] Cox DG, Hankinson SE, Hunter DJ. The erbB2/HER2/neu receptor polymorphism Ile655Val and breast cancer risk. Pharmacogenet Ge-nomics 2005; 15: 447-50.
[35] Qu S, Cai Q, Gao YT, Lu W, Cai H, Su Y, Wang
SE, Shu XO, Zheng W. ERBB2 genetic polymor-phism and breast cancer risk in Chinese women: a population-based case-control study. Breast Cancer Res Treat 2008; 110: 169-76.
[36] Potter JD, Bostick RM, Grandits GA, Fosdick L, Elmer P, Wood J, Grambsch P, Louis TA. Hor-mone replacement therapy is associated with lower risk of adenomatous polyps of the large bowel: the Minnesota Cancer Prevention Re-search Unit Case-Control Study. Cancer Epide-miol Biomarkers Prev 1996; 5: 779-84.
[37] Slattery ML, Potter JD, Duncan DM, Berry TD. Dietary fats and colon cancer: assessment of risk associated with specific fatty acids. Int J Cancer 1997; 73: 670-7.
[38] Slattery ML, Caan BJ, Benson J, Murtaugh M.
Genetics in EGFR signaling and colorectal neoplasia risk
315 Int J Mol Epidemiol Genet 2011:2(4):300-315
Energy balance and rectal cancer: an evalua-tion of energy intake, energy expenditure, and body mass index. Nutr Cancer 2003; 46: 166-71.
[39] Spirio LN, Samowitz W, Robertson J, Robertson M, Burt RW, Leppert M, White R. Alleles of APC modulate the frequency and classes of muta-tions that lead to colon polyps. Nat Genet 1998; 20: 385-8.
[40] Samowitz WS, Albertsen H, Herrick J, Levin TR, Sweeney C, Murtaugh MA, Wolff RK, Slattery ML. Evaluation of a large, population-based sample supports a CpG island methylator phe-notype in colon cancer. Gastroenterology 2005; 129: 837-45.
[41] Samowitz WS, Curtin K, Ma KN, Edwards S, Schaffer D, Leppert MF, Slattery ML. Prognostic significance of p53 mutations in colon cancer at the population level. Int J Cancer 2002; 99: 597-602.
[42] Samowitz WS, Curtin K, Schaffer D, Robertson M, Leppert M, Slattery ML. Relationship of Ki-ras mutations in colon cancers to tumor loca-tion, stage, and survival: a population-based study. Cancer Epidemiol Biomarkers Prev 2000; 9: 1193-7.
[43] Slattery ML, Curtin K, Anderson K, Ma KN, Bal-lard L, Edwards S, Schaffer D, Potter J, Leppert M, Samowitz WS. Associations between ciga-rette smoking, lifestyle factors, and microsatel-lite instability in colon tumors. J Natl Cancer Inst 2000; 92: 1831-6.
[44] Samowitz WS, Albertsen H, Sweeney C, Herrick J, Caan BJ, Anderson KE, Wolff RK, Slattery ML. Association of smoking, CpG island methylator phenotype, and V600E BRAF mutations in co-lon cancer. J Natl Cancer Inst 2006; 98: 1731-8.
[45] Issa JP, Shen L, Toyota M. CIMP, at last. Gastro-enterology 2005; 129: 1121-4.
[46] Samowitz WS. The CpG island methylator phe-notype in colorectal cancer. J Mol Diagn 2007; 9: 281-3.
[47] Carlson CS, Eberle MA, Rieder MJ, Yi Q, Kruglyak L, Nickerson DA. Selecting a maxi-mally informative set of single-nucleotide poly-morphisms for association analyses using link-age disequilibrium. Am J Hum Genet 2004; 74: 106-20.
[48] Conneely KN, Boehnke M. So Many Correlated Tests, So Little Time! Rapid Adjustment of P Values for Multiple Correlated Tests. Am J Hum Genet 2007; 81: 1158-68.
[49] Gauderman WJ, Murcray C, Gilliland F, Conti DV. Testing association between disease and multiple SNPs in a candidate gene. Genet Epi-demiol 2007; 31: 383-95.
[50] Slattery ML, Curtin K, Wolff RK, Boucher KM, Sweeney C, Edwards S, Caan BJ, Samowitz W. A comparison of colon and rectal somatic DNA alterations. Dis Colon Rectum 2009; 52: 1304-11.
[51] Burton P, Gurrin L, Sly P. Extending the simple linear regression model to account for corre-lated responses: an introduction to generalized estimating equations and multi-level mixed modelling. Stat Med 1998; 17: 1261-91.
[52] Kuss O, McLerran D. A note on the estimation of the multinomial logistic model with corre-lated responses in SAS. Comput Methods Pro-grams Biomed 2007; 87: 262-9.
[53] Chatterjee N, Kalaylioglu Z, Moslehi R, Peters U, Wacholder S. Powerful multilocus tests of ge-netic association in the presence of gene-gene and gene-environment interactions. Am J Hum Genet 2006; 79: 1002-16.
[54] Liu W, Innocenti F, Wu MH, Desai AA, Dolan ME, Cook EH Jr, Ratain MJ. A functional common polymorphism in a Sp1 recognition site of the epidermal growth factor receptor gene pro-moter. Cancer Res 2005; 65: 46-53.
[55] Watanabe T, Kobunai T, Yamamoto Y, Matsuda K, Ishihara S, Nozawa K, Iinuma H, Ikeuchi H, Eshima K. Differential gene expression signa-tures between colorectal cancers with and with-out KRAS mutations: Crosstalk between the KRAS pathway and other signalling pathways. Eur J Cancer 2011; 47: 1946-54.
[56] Kuraoka K, Matsumura S, Hamai Y, Nakachi K, Imai K, Matsusaki K, Oue N, Ito R, Nakayama H, Yasui W. A single nucleotide polymorphism in the transmembrane domain coding region of HER-2 is associated with development and malignant phenotype of gastric cancer. Int J Cancer 2003; 107: 593-6.
[57] Irby RB, Mao W, Coppola D, Kang J, Loubeau JM, Trudeau W, Karl R, Fujita DJ, Jove R, Yeat-man TJ. Activating SRC mutation in a subset of advanced human colon cancers. Nat Genet 1999; 21: 187-90.
[58] Laghi L, Bianchi P, Orbetegli O, Gennari L, Ron-calli M, Malesci A. Lack of mutation at codon 531 of SRC in advanced colorectal cancers from Italian patients. Br J Cancer 2001; 84: 196-8.
[59] Daigo Y, Furukawa Y, Kawasoe T, Ishiguro H, Fujita M, Sugai S, Nakamori S, Liefers GJ, Tolle-naar RA, van de Velde CJ, Nakamura Y. Ab-sence of genetic alteration at codon 531 of the human c-src gene in 479 advanced colorectal cancers from Japanese and Caucasian pa-tients. Cancer Res 1999; 59: 4222-4.

Genetics in EGFR signaling and colorectal neoplasia risk
316 Int J Mol Epidemiol Genet 2011:2(4):300-315
Table S1. TagSNPs and candidate polymorphisms in EGFR, HER2 and Src Colorectal adenoma Colon Cancer Rectal Cancer
Gene SNPa dbSNP
identifier Location
within gene Tag or
Candidate
Successfully converted to
Illumina? Passed
QC? MAFb Passed
QC? MAFbPassed
QC? MAFb
EGFR 142284G>A Arg521Lys rs2227983 exon 13
candidate and bin 9 yes yes 0.26 yes 0.25 yes 0.24
-216G>T rs712829 5' UTR candidate and singleton yes
no – duplicate concordance NA
no – duplicate concordance NA
no – HWE p<0.0001 NA
127377C>T Asn158Asn rs2072454 exon 4 bin 1 yes yes 0.37 yes 0.39
no – duplicate concordance NA
151493A>C rs10277413 intron 15 bin 2 yes yes 0.36 yes 0.33 yes 0.33 161260G>A rs12532468 intron 19 bin 3 yes yes 0.42 yes 0.42 yes 0.40 -759C>A rs759171 5 'UTR bin 4 yes yes 0.16 yes 0.14 yes 0.13 134196A>G rs11760524 intron 6 bin 5 yes yes 0.13 yes 0.12 yes 0.11
179446C>T Thr903Thr rs1140475 exon 23 bin 6 yes yes 0.13 yes 0.13 yes 0.12
124345G>A rs4947984 intron 3 bin 7 yes yes 0.05 yes 0.06 yes 0.06 135784G>A rs17172451 intron 7 bin 8 yes yes 0.24 yes 0.24 yes 0.24 151006T>C rs17336974 intron 15 bin 10 yes yes 0.03 yes 0.03 yes 0.03 187113A>G rs884225 3' UTR bin 11 yes yes 0.09 yes 0.09 yes 0.09 -1225G>A rs41359546 5 'UTR singleton yes yes 0.01 yes 0.01 yes 0.01 122960T>G rs6964705 intron 1 singleton yes yes 0.46 yes 0.47 yes 0.48 127472G>A rs7801956 intron 4 singleton yes yes 0.09 yes 0.09 yes 0.09 132621CAA/- rs17336556 intron 5 singleton no — — — — — —
138169G>C rs13222549 intron 10 singleton yes no – duplicate concordance NA
no – low call rate NA
no – HWE p<0.0001 NA
134684G>A rs4947986 intron 6 singleton yes no – HWE p<0.0001 NA
no – HWE p<0.0001 NA
no – HWE p<0.0001 NA
138199C>G rs4947987 intron 10 singleton no — — — — — — 140539G>A rs17289984 intron 11 singleton yes yes 0.16 yes 0.17 yes 0.15
141082T>A rs1558544 intron 12 singleton yes
NA – high LD with
141202T>C NA
NA – high LD with
141202T>C NA
NA – high LD with
141202T>C NA 141408G>A rs17336765 intron 12 singleton no — — — — — — 141202A>G rs759162 intron 12 singleton yes yes 0.27 yes 0.29 yes 0.26
142231C>T Gly503Gly rs17336800 exon 13 singleton yes
no – low call rate NA
no – low call rate NA
no – low call rate NA
142572T>C rs3752651 intron 13 singleton yes yes 0.21 yes 0.19 yes 0.21 145755C>A rs17336919 intron 14 singleton yes yes 0.21 yes 0.21 yes 0.22 151116G>A rs10258429 intron 15 singleton yes yes 0.07 yes 0.07 yes 0.09 154784G>A rs17337107 intron 18 singleton yes yes 0.04 yes 0.04 yes 0.06 155811G>A rs712831 intron 19 singleton yes yes 0.19 yes 0.21 yes 0.23
161955T>C rs10241451 intron 19 singleton yes no – low call
rate NA no – HWE p<0.0001 NA
no – low call rate NA
172479C>T Arg836Arg rs17290559 exon 21 singleton yes yes 0.02 yes 0.03 yes 0.03

Genetics in EGFR signaling and colorectal neoplasia risk
317 Int J Mol Epidemiol Genet 2011:2(4):300-315
Table S1 continued. TagSNPs and candidate polymorphisms in EGFR, HER2 and Src Colorectal adenoma Colon Cancer Rectal Cancer
Gene SNPa dbSNP
identifier Location
within gene Tag or
Candidate
Successfully converted to
Illumina? Passed
QC? MAFb Passed
QC? MAFbPassed
QC? MAFb EGFR 172792G>A rs6970262 intron 21 singleton yes yes 0.38 yes 0.39 yes 0.36 172977C>G rs17337331 intron 21 singleton yes yes 0.23 yes 0.24 yes 0.25 179786G>A rs2293348 intron 23 singleton yes yes 0.31 yes 0.31 yes 0.31
180487T>G rs2740764 intron 23 singleton yes no – duplicate concordance NA yes 0.27
no – low call rate NA
180504C/- rs17290650 intron 23 singleton no — — — — — —
181945G>A Asp994Asp rs2293347 exon 25 singleton yes yes 0.10 yes 0.09 yes 0.12
182881G>A rs17290727 intron 26 singleton yes yes 0.002 yes 0.005 yes 0.003
HER2 27567 G>C/- Pro1140Ala rs1058808 exon 27
bin 1 and candidate yes yes 0.33 yes 0.34 yes 0.31
-658 C>A rs4252596 5’ UTR singleton yes yes 0.13 yes 0.14 yes 0.15
-374 C>T rs4252599 5’ UTR singleton yes yes 0.002 yes 0.001 no – low call
rate NA 7225 C>T rs4252612 intron 2 singleton yes yes 0.07 yes 0.07 yes 0.06
23106 A>G Ile655Val rs1136201 exon 17
singleton and candidate yes yes 0.24 yes 0.23 yes 0.24
Src -6776G>A rs6018148 intron 2 bin 1 yes yes 0.17 yes 0.18 yes 0.18 -2899A>C rs6018199 intron 2 bin 2 yes yes 0.15 yes 0.16 yes 0.16 9597A>G rs6018256 intron 5 bin 3 yes yes 0.09 yes 0.08 yes 0.09 -29667A>G rs747182 intron 1 singleton yes yes 0.13 yes 0.14 yes 0.14 4783A>C rs754626 intron 5 singleton yes yes 0.24 yes 0.23 yes 0.25
-31605G>C rs1547836 intron 1 singleton yes no – low call
rate NA no- HWE p<0.0001 NA
no- HWE p<0.0001 NA
-41278A>C rs6017916 5' UTR singleton yes yes 0.26 yes 0.28 yes 0.28 -34985A>G rs6017944 intron 1 singleton yes yes 0.23 yes 0.25 yes 0.25 -25903G>A rs6017996 intron 1 singleton yes yes 0.15 yes 0.15 yes 0.15 -21764A>G rs6018027 intron 1 singleton yes yes 0.25 yes 0.25 yes 0.25 9982A>G rs6018257 intron 6 singleton yes yes 0.12 yes 0.11 yes 0.12 -19229G>A rs6063022 intron 1 singleton yes yes 0.16 yes 0.16 yes 0.16 -3411G>A rs6090585 intron 2 singleton yes yes 0.05 yes 0.06 yes 0.05
-7281A>G rs6094509 intron 2 singleton yes no – HWE p<0.0001 NA yes 0.18 yes 0.18
-4395A>G rs7269342 intron 2 singleton yes yes 0.17 yes 0.16 yes 0.17 -7241T>G rs6090575 intron 2 singleton no — — — — — — -33208C>G rs12106024 intron 1 singleton yes yes 0.22 yes 0.25 yes 0.24 a Counting begins at the start codon. Variants located 5’ of the start codon are counted backwards from the base preceding the start codon and begin with a “-“ sign. In Src, the start codon occurs in exon 4.
b Among controls only

Genetics in EGFR signaling and colorectal neoplasia risk
318 Int J Mol Epidemiol Genet 2011:2(4):300-315
Table S2. Genetic variability in EGFR and risk of colorectal neoplasia (all genotyped tagSNPs) Adenomaa Colon Cancerb Rectal cancerb Colorectal cancerc
SNP Cases/
Controls OR 95%CI p p-
trendCases/
Controls OR 95%CI p p-trendCases/
Controls OR 95%CI p p-trendCases/
Controls OR 95%CI p p-trend rs41359546 (-1225G>A) GG 474/561 1.00 ref. 1391/1721 1.00 ref. 569/762 1.00 ref. 1960/2483 1.00 ref. GA/AA 8/17 0.49 (0.20-1.19) 0.26 NA 25/44 0.70 (0.43-1.16) 0.16 NA 12/13 1.24 (0.56-2.74) 0.87 NA 37/57 0.82 (0.54-1.25) 0.36 NA rs759171 (-759C>A) (shown in Table 2) CC 353/411 1.00 ref. 1021/1315 1.00 ref. 407/579 1.00 ref. 1428/1894 1.00 ref. CA 117/149 0.95 (0.70-1.27) 375/427 1.12 (0.96-1.32) 163/184 1.26 (0.99-1.61) 538/611 1.16 (1.02-1.33) AA 10/18 0.62 (0.27-1.41) 0.50 0.36 28/36 0.98 (0.59-1.62) 0.37 0.26 12/11 1.54 (0.67-3.53) 0.12 0.04 40/47 1.10 (0.72-1.70) 0.09 0.04
rs6964705 (122960T>G) TT 125/171 1.00 ref. 398/503 1.00 ref. 149/204 1.00 ref. 547/707 1.00 ref. TG 244/280 1.19 (0.88-1.61) 705/895 0.99 (0.84-1.17) 311/395 1.09 (0.84-1.41) 1016/1290 1.02 (0.89-1.17) GG 113/126 1.21 (0.84-1.73) 0.48 0.29 317/380 1.05 (0.86-1.28) 0.82 0.66 121/175 0.95 (0.69-1.30) 0.60 0.80 438/555 1.02 (0.86-1.21) 0.96 0.82 rs4947984 (124345G>A) GG 431/516 1.00 ref. 1218/1553 1.00 ref. 516/676 1.00 ref. 1734/2229 1.00 ref. GA/AA 51/62 1.00 (0.66-1.51) 0.99 NA 191/210 1.16 (0.94-1.44) 0.16 NA 67/99 0.89 (0.64-1.24) 0.49 NA 258/309 1.08 (0.90-1.29) 0.42 NA rs7801956 (127472G>A) GG 400/481 1.00 ref. 1171/1473 1.00 ref. 469/635 1.00 ref. 1640/2108 1.00 ref. GA/AA 82/97 1.04 (0.74-1.46) 0.83 NA 248/302 1.05 (0.87-1.26) 0.61 NA 113/140 1.10 (0.83-1.45_ 0.50 NA 361/442 1.07 (0.91-1.24) 0.42 NA rs11770531 (133934C>T) CC 376/437 1.00 ref. 1104/1371 1.00 ref. 448/621 1.00 ref. 1552/1992 1.00 ref. CT/TT 106/141 0.80 (0.59-1.08) 0.34 NA 306/397 0.95 (0.80-1.13) 0.58 NA 131/154 1.18 (0.91-1.54) 0.21 NA 436/548 1.02 (0.88-1.17) 0.70 NA rs11760524 (134196A>G) AA 376/436 1.00 ref. 1113/1378 1.00 ref. 452/621 1.00 ref. 1565/1999 1.00 ref. AG/GG 105/141 0.78 (0.58-1.06) 0.12 NA 306/397 0.95 (0.80-1.13) 0.56 NA 131/153 1.18 (0.91-1.54) 0.22 NA 437/550 1.01 (0.88-1.17) 0.86 NA rs17172451 (135784G>A) GG 288/330 1.00 ref. 814/1023 1.00 ref. 336/445 1.00 ref. 1150/1468 1.00 ref. GA 160/216 0.91 (0.69-1.19) 534/635 1.06 (0.92-1.23) 210/289 0.97 (0.77-1.21) 744/924 1.03 (0.91-1.17) AA 34/30 1.52 (0.87-2.63) 0.20 0.61 66/103 0.81 (0.59-1.12) 0.26 0.82 34/41 1.09 (0.67-1.75) 0.88 0.99 100/144 0.89 (0.68-1.16) 0.55 0.85

Genetics in EGFR signaling and colorectal neoplasia risk
319 Int J Mol Epidemiol Genet 2011:2(4):300-315
Table S2 continued. Genetic variability in EGFR and risk of colorectal neoplasia (all genotyped tagSNPs) Adenomaa Colon Cancerb Rectal cancerb Colorectal cancerc
SNP Cases/
Controls OR 95%CI p p-
trendCases/
Controls OR 95%CI p p-trendCases/
Controls OR 95%CI p p-trendCases/
Controls OR 95%CI p p-trend rs17289984 (140539G>A) GG 326/412 1.00 ref. 1026/1233 1.00 ref. 419/553 1.00 ref. 1445/1786 1.00 ref. GA 141/152 1.20 (0.90-1.60) 356/481 0.90 (0.76-1.05) 153/205 0.98 (0.77-1.26) 509/686 0.92 (0.81-1.05) AA 15/14 1.45 (0.66-3.19) 0.33 0.14 35/58 0.74 (0.48-1.13) 0.18 0.07 11/16 0.88 (0.40-1.92) 0.94 0.79 46/74 0.77 (0.53-1.12) 0.22 0.09 rs759162 (141202T>C) (shown in Table 2) TT 242/307 1.00 ref. 764/900 1.00 ref. 308/426 1.00 ref. 1072/1326 1.00 ref. TC 200/231 1.06 (0.81-1.39) 550/706 0.92 (0.80-1.07) 235/290 1.13 (0.90-1.41) 785/996 0.98 (0.87-1.11) CC 40/40 1.34 (0.82-2.20) 0.51 0.29 105/171 0.73 (0.56-0.95 0.05 0.02 40/59 0.94 (0.61-1.44) 0.51 0.67 145/230 0.78 (0.63-0.98) 0.09 0.10 rs2227983 (142284G>A/Arg521Lys) GG 270/321 1.00 ref. 802/1003 1.00 ref. 320/453 1.00 ref. 1122/1456 1.00 ref. GA 182/211 0.94 (0.72-1.23) 520/656 0.98 (0.85-1.14) 223/269 1.18 (0.94-1.48) 743/925 1.04 (0.91-1.17) AA 29/46 0.70 (0.41-1.17) 0.38 0.23 98/118 1.03 (0.77-1.37) 0.94 0.98 39/51 1.09 (0.70-1.70) 0.38 0.26 137/169 1.05 (0.82-1.33) 0.83 0.56 rs3752651 (142572T>C) (shown in Table 2) TT 313/358 1.00 ref. 900/1178 1.00 ref. 369/468 1.00 ref. 1269/1646 1.00 ref. TC 150/198 0.90 (0.68-1.19) 446/529 1.11 (0.95-1.29) 183/278 0.83 (0.66-1.05) 629/807 1.01 (0.89-1.15) CC 19/21 1.04 (0.53-2.05) 0.75 0.63 75/70 1.40 (1.00-1.96) 0.09 0.04 29/26 1.39 (0.81-2.41) 0.11 0.65 104/96 1.39 (1.05-1.86) 0.08 0.13 rs17336919 (145755G>T) GG 303/362 1.00 ref. 872/1103 1.00 ref. 365/461 1.00 ref. 1237/1564 1.00 ref. GT 153/192 0.99 (0.75-1.30) 498/587 1.08 (0.93-1.25) 193/284 0.86 (0.68-1.08) 691/871 1.01 (0.89-1.14) TT 26/24 1.48 (0.80-2.73) 0.44 0.48 52/78 0.84 (0.58-1.20) 0.33 0.87 23/29 1.00 (0.57-1.76) 0.43 0.34 75/107 0.88 (0.65-1.20) 0.70 0.70

Genetics in EGFR signaling and colorectal neoplasia risk
320 Int J Mol Epidemiol Genet 2011:2(4):300-315
Table S2 continued. Genetic variability in EGFR and risk of colorectal neoplasia (all genotyped tagSNPs) Adenomaa Colon Cancerb Rectal cancerb Colorectal cancerc
SNP Cases/
Controls OR 95%CI p p-
trendCases/
Controls OR 95%CI p p-
trend
Cases/ Control
s OR 95%CI p p-
trendCases/
Controls OR 95%CI p p-
trend rs17336974 (151006T>C)
TT 460/545 1.00 ref. 1333/167
8 1.00 ref. 546/726 1.00 ref. 1879/240
4 1.00 ref.
CT/CC 22/33 0.82 (0.46-1.46) 0.50 NA 91/99 1.15(0.85-1.54) 0.37 NA 36/48 1.00 (0.64-1.57) 0.99 NA 127/147 1.10
(0.86-1.40) 0.45 0.53
rs10258429 (151116C>T)
CC 412/499 1.00 ref. 1213/152
7 1.00 ref. 490/636 1.00 ref. 1703/216
3 1.00 ref.
CT/TT 67/76 1.13 (0.7701.64) 0.53 NA 195/236 1.05(0.86-1.29) 0.62 NA 89/127 0.92 (0.68-1.23) 0.56 NA 284/363 1.01
(0.85-1.19) 0.94 NA
rs10277413 (151493T>G) (shown in Table 2) TT 211/232 1.00 ref. 626/792 1.00 ref. 247/365 1.00 ref. 873/1157 1.00 ref.
TG 221/271 0.86 (0.66-1.14) 611/775 0.98(0.85-1.14) 272/313 1.28 (1.02-1.62) 883/1088 1.06
(0.94-1.21)
GG 49/75 0.64 (0.41-0.98) 0.11 0.04 182/206 1.10(0.88-1.38) 0.62 0.59 61/94 0.97 (0.67-1.39) 0.07 0.40 243/300 1.06
(0.88-1.28) 0.59 0.37
rs17337107 (154784G>A)
GG 436/528 1.00 ref. 1284/162
8 1.00 ref. 530/686 1.00 ref. 1814/231
4 1.00 ref.
GA/AA 46/47 1.21 (0.76-1.90) 0.72 NA 135/145 1.19(0.93-1.53) 0.16 NA 52/87 0.77 (0.54-1.11) 0.16 NA 187/232 1.04
(0.85-1.27) 0.72 NA
rs712831 (155811C>T)
CC 299/382 1.00 ref. 876/1075 1.00 ref. 360/461 1.00 ref. 1236/153
6 1.00 ref.
CT 165/176 1.17 (0.89-1.55) 467/605 0.96(0.82-1.12) 194/264 0.95 (0.75-1.20) 661/869 0.96
(0.84-1.08)
TT 15/17 1.15 (0.54-2.45) 0.51 0.28 57/72 0.98(0.69-1.41) 0.86 0.65 26/44 0.77 (0.46-1.27) 0.57 0.34 83/116 0.90
(0.67-1.21) 0.66 0.36
Genetics in EGFR signaling and colorectal neoplasia risk
321 Int J Mol Epidemiol Genet 2011:2(4):300-315
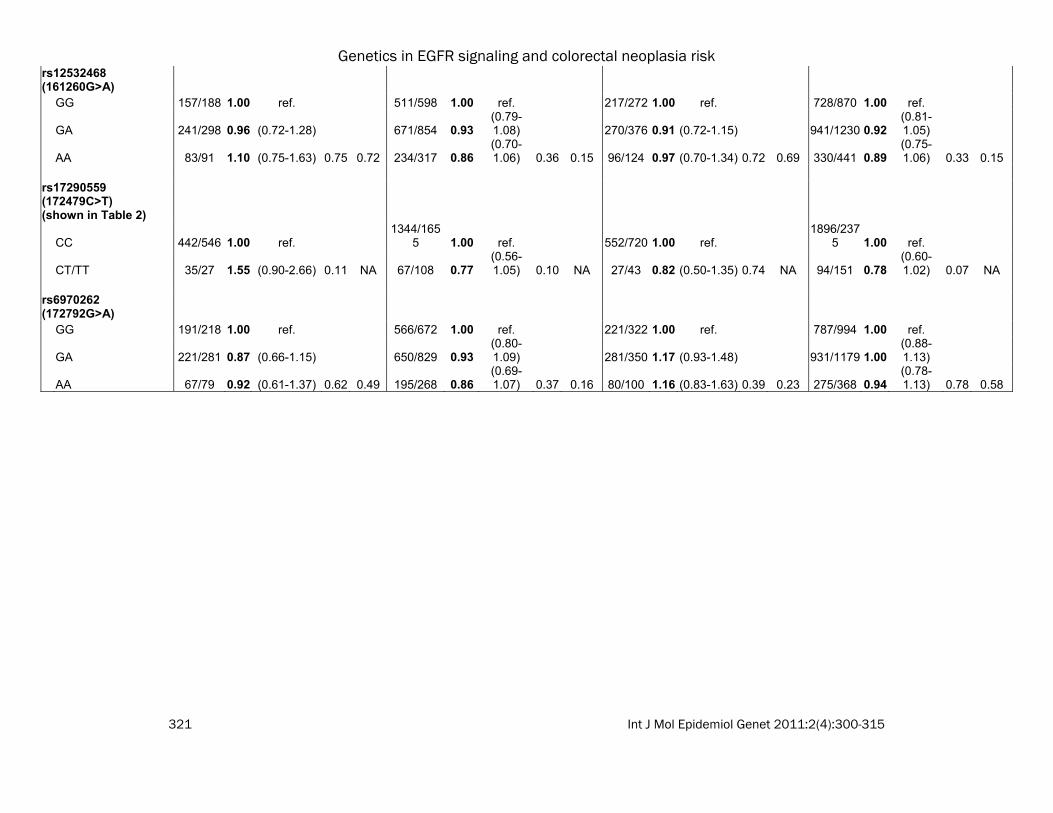
rs12532468 (161260G>A) GG 157/188 1.00 ref. 511/598 1.00 ref. 217/272 1.00 ref. 728/870 1.00 ref.
GA 241/298 0.96 (0.72-1.28) 671/854 0.93(0.79-1.08) 270/376 0.91 (0.72-1.15) 941/1230 0.92
(0.81-1.05)
AA 83/91 1.10 (0.75-1.63) 0.75 0.72 234/317 0.86(0.70-1.06) 0.36 0.15 96/124 0.97 (0.70-1.34) 0.72 0.69 330/441 0.89
(0.75-1.06) 0.33 0.15
rs17290559 (172479C>T) (shown in Table 2)
CC 442/546 1.00 ref. 1344/165
5 1.00 ref. 552/720 1.00 ref. 1896/237
5 1.00 ref.
CT/TT 35/27 1.55 (0.90-2.66) 0.11 NA 67/108 0.77(0.56-1.05) 0.10 NA 27/43 0.82 (0.50-1.35) 0.74 NA 94/151 0.78
(0.60-1.02) 0.07 NA
rs6970262 (172792G>A) GG 191/218 1.00 ref. 566/672 1.00 ref. 221/322 1.00 ref. 787/994 1.00 ref.
GA 221/281 0.87 (0.66-1.15) 650/829 0.93(0.80-1.09) 281/350 1.17 (0.93-1.48) 931/1179 1.00
(0.88-1.13)
AA 67/79 0.92 (0.61-1.37) 0.62 0.49 195/268 0.86(0.69-1.07) 0.37 0.16 80/100 1.16 (0.83-1.63) 0.39 0.23 275/368 0.94
(0.78-1.13) 0.78 0.58

Genetics in EGFR signaling and colorectal neoplasia risk
322 Int J Mol Epidemiol Genet 2011:2(4):300-315
Table S2 continued. Genetic variability in EGFR and risk of colorectal neoplasia (all genotyped tagSNPs) Adenomaa Colon Cancerb Rectal cancerb Colorectal cancerc
SNP Cases/
Controls OR 95%CI p p-
trendCases/
Controls OR 95%CI p p-trendCases/
Controls OR 95%CI p p-trendCases/
Controls OR 95%CI p p-trend rs17337331 (172977C>G) (shown in Table 2) CC 277/338 1.00 ref. 833/1003 1.00 ref. 354/429 1.00 ref. 1187/1432 1.00 ref. CG 170/208 1.00 (0.76-1.31) 473/648 0.88 (0.76-1.02) 201/306 0.80 (0.64-1.01) 674/954 0.86 (0.75-0.97) GG 30/27 1.30 (0.73-2.31) 0.65 0.57 80/93 1.03 (0.75-1.41) 0.23 0.33 27/39 0.84 (0.51-1.40) 0.15 0.08 107/132 0.98 (0.75-1.27) 0.05 0.08 rs1140475 (179446C>T) CC 372/438 1.00 ref. 1085/1359 1.00 ref. 444/599 1.00 ref. 1529/1958 1.00 ref. CT/TT 109/140 0.92 (0.68-1.25) 0.60 NA 327/410 1.01 (0.85-1.19) 0.94 NA 139/175 1.06 (0.82-1.37) 0.64 NA 466/585 1.02 (0.89-1.18) 0.74 NA rs2293348 (179446C>T) CC 243/285 1.00 ref. 662/837 1.00 ref. 261/359 1.00 ref. 923/1196 1.00 ref. CT 194/226 1.04 (0.79-1.37) 614/766 1.02 (0.88-1.18) 265/344 1.06 (0.84-1.33) 879/1110 1.03 (0.91-1.16) TT 44/67 0.78 (0.50-1.20) 0.42 0.48 135/158 1.06 (0.83-1.37) 0.89 0.65 53/69 1.06 (0.71-1.56) 0.88 0.65 188/227 1.06 (0.86-1.31) 0.82 0.53 rs2293347 (181945C>T) CC 392/467 1.00 ref. 1148/1462 1.00 ref. 471/608 1.00 ref. 1619/2070 1.00 ref. CT/TT 89/111 1.03 (0.74-1.44) 0.85 NA 270/314 1.09 (0.91-1.31) 0.34 NA 112/166 0.87 (0.66-1.13) 0.29 NA 382/480 1.02 (0.88-1.18) 0.83 NA rs17290727 (182881G>A) GG 478/575 1.00 ref. 1414/1760 1.00 ref. 578/771 1.00 ref. 1992/2531 1.00 ref. GA/AA 4/2 3.69 (0.61-22.22) 0.34 NA 8/16 0.62 (0.26-1.45) 0.53 NA 3/4 0.98 (0.22-4.39) 1.00 NA 11/20 0.69 (0.33-1.44) 0.60 NA rs884225 (187113T>C) TT 407/471 1.00 ref. 1165/1461 1.00 ref. 486/646 1.00 ref. 1651/2107 1.00 ref. TC/CC 75/106 0.88 (0.62-1.24) 0.46 NA 255/313 1.03 (0.85-1.23) 0.79 NA 97/129 1.00 (0.75-1.34) 0.98 NA 352/442 1.02 (0.87-1.19) 0.82 NA rs1136201 (23106A>G/Ile655Val) AA 284/331 1.00 ref. 821/1035 1.00 ref. 342/447 1.00 ref. 1163/1482 1.00 ref. AG 171/217 0.88 0.67-1.15 522/653 1.02 0.88-1.18 202/283 0.93 0.74-1.17 724/936 0.99 0.88-1.12 GG 27/33 1.14 0.65-2.01 0.51 0.71 80/90 1.12 0.82-1.54 0.77 0.56 38/45 1.08 0.69-1.70 0.76 0.87 118/135 1.11 0.86-1.44 0.70 0.69 a Adjusted for age and sex b Adjusted for age, sex, and study center c Pooled analysis of the colon and rectal cancer studies, adjusted for age, sex, study center, and study.
Genetics in EGFR signaling and colorectal neoplasia risk
323 Int J Mol Epidemiol Genet 2011:2(4):300-315
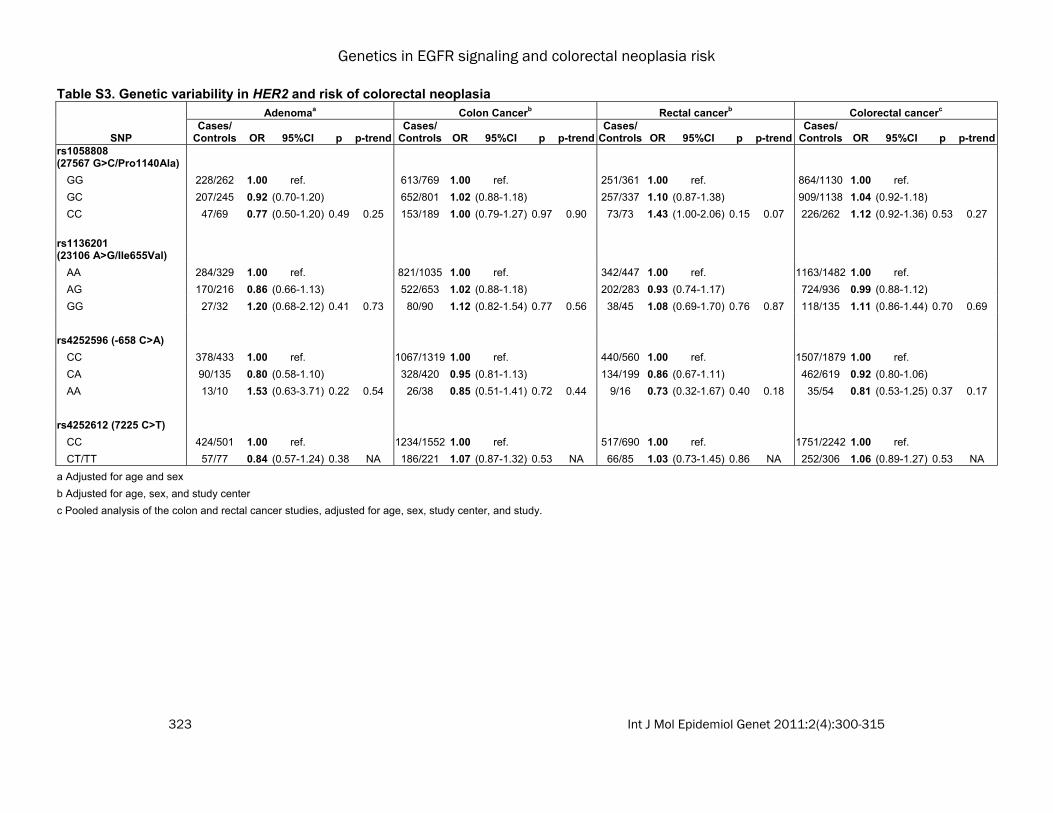
Table S3. Genetic variability in HER2 and risk of colorectal neoplasia Adenomaa Colon Cancerb Rectal cancerb Colorectal cancerc
SNP Cases/
Controls OR 95%CI p p-trendCases/
Controls OR 95%CI p p-trendCases/
Controls OR 95%CI p p-trendCases/
Controls OR 95%CI p p-trend rs1058808 (27567 G>C/Pro1140Ala) GG 228/262 1.00 ref. 613/769 1.00 ref. 251/361 1.00 ref. 864/1130 1.00 ref. GC 207/245 0.92 (0.70-1.20) 652/801 1.02 (0.88-1.18) 257/337 1.10 (0.87-1.38) 909/1138 1.04 (0.92-1.18) CC 47/69 0.77 (0.50-1.20) 0.49 0.25 153/189 1.00 (0.79-1.27) 0.97 0.90 73/73 1.43 (1.00-2.06) 0.15 0.07 226/262 1.12 (0.92-1.36) 0.53 0.27 rs1136201 (23106 A>G/Ile655Val) AA 284/329 1.00 ref. 821/1035 1.00 ref. 342/447 1.00 ref. 1163/1482 1.00 ref. AG 170/216 0.86 (0.66-1.13) 522/653 1.02 (0.88-1.18) 202/283 0.93 (0.74-1.17) 724/936 0.99 (0.88-1.12) GG 27/32 1.20 (0.68-2.12) 0.41 0.73 80/90 1.12 (0.82-1.54) 0.77 0.56 38/45 1.08 (0.69-1.70) 0.76 0.87 118/135 1.11 (0.86-1.44) 0.70 0.69 rs4252596 (-658 C>A) CC 378/433 1.00 ref. 1067/1319 1.00 ref. 440/560 1.00 ref. 1507/1879 1.00 ref. CA 90/135 0.80 (0.58-1.10) 328/420 0.95 (0.81-1.13) 134/199 0.86 (0.67-1.11) 462/619 0.92 (0.80-1.06) AA 13/10 1.53 (0.63-3.71) 0.22 0.54 26/38 0.85 (0.51-1.41) 0.72 0.44 9/16 0.73 (0.32-1.67) 0.40 0.18 35/54 0.81 (0.53-1.25) 0.37 0.17 rs4252612 (7225 C>T) CC 424/501 1.00 ref. 1234/1552 1.00 ref. 517/690 1.00 ref. 1751/2242 1.00 ref. CT/TT 57/77 0.84 (0.57-1.24) 0.38 NA 186/221 1.07 (0.87-1.32) 0.53 NA 66/85 1.03 (0.73-1.45) 0.86 NA 252/306 1.06 (0.89-1.27) 0.53 NA a Adjusted for age and sex b Adjusted for age, sex, and study center c Pooled analysis of the colon and rectal cancer studies, adjusted for age, sex, study center, and study.

Genetics in EGFR signaling and colorectal neoplasia risk
324 Int J Mol Epidemiol Genet 2011:2(4):300-315
Table S4. Genetic variability in Src and risk of colorectal neoplasia Adenomaa Colon Cancerb Rectal cancerb Colorectal cancerc
SNP Cases/
Controls OR 95%CI p p-trendCases/
Controls OR 95%CI p p-trendCases/
Controls OR 95%CI p p-trendCases/
Controls OR 95%CI p p-trend rs6017916 (-41278A>C) AA 267/323 1.00 ref. 769/921 1.00 ref. 314/400 1.00 ref. 1083/1321 1.00 ref. AC 177/210 1.11 (0.84-1.45) 535/695 0.91 (0.78-1.05) 226/320 0.89 (0.71-1.12) 761/1015 0.90 (0.80-1.02) CC 37/43 1.07 (0.65-1.75) 0.76 0.54 111/152 0.88 (0.68-1.15) 0.36 0.17 40/54 0.95 (0.61-1.46) 0.61 0.44 151/206 0.90 (0.72-1.12) 0.23 0.11
rs6017944 (-34985A>G) (shown in Table 2) AA 284/350 1.00 ref. 831/992 1.00 ref. 346/425 1.00 ref. 1177/1417 1.00 ref. AG 171/191 1.16 (0.88-1.52) 494/660 0.88 (0.76-1.02) 204/302 0.82 (0.65-1.03) 698/962 0.86 (0.76-0.98) GG 26/37 0.90 (0.52-1.58) 0.49 0.65 90/116 0.94 (0.70-1.25) 0.24 0.18 31/45 0.85 (0.53-1.38) 0.22 0.12 121/161 0.91 (0.71-1.17) 0.06 0.05
rs12106024 (-33208 C>G) CC 274/350 1.00 ref. 822/992 1.00 ref. 325/446 1.00 ref. 1147/1438 1.00 ref. CG 173/196 1.19 (0.90-1.56) 511/657 0.93 (0.80-1.08) 224/285 1.07 (0.85-1.34) 735/942 0.97 (0.86-1.10) GG 35/32 1.48 (0.87-2.51) 0.22 0.09 86/117 0.89 (0.66-1.19) 0.53 0.26 31/39 1.09 (0.66-1.78) 0.81 0.54 117/156 0.94 (0.73-1.21) 0.83 0.54
rs747182 (-29667A>G) AA 364/440 1.00 ref. 1047/1323 1.00 ref. 433/570 1.00 ref. 1480/1893 1.00 ref. AG 108/127 1.07 (0.79-1.46) 335/413 1.01 (0.86-1.19) 139/191 0.96 (0.74-1.23) 474/604 0.99 (0.86-1.14) GG 10/11 1.07 (0.43-2.69) 0.90 0.67 39/36 1.39 (0.88-2.21) 0.37 0.39 11/13 1.10 (0.49-2.49) 0.91 0.86 50/49 1.31 (0.88-1.96) 0.41 0.54
rs6063022 (-19229G>A) GG 344/412 1.00 ref. 1023/1249 1.00 ref. 385/545 1.00 ref. 1408/1794 1.00 ref. GA 126/148 1.01 (0.75-1.35) 365/488 0.92 (0.78-1.08) 179/209 1.21 (0.96-1.54) 544/697 1.00 (0.88-1.14) AA 12/18 0.78 (0.36-1.69) 0.81 0.76 29/36 0.96 (0.58-1.58) 0.57 0.34 19/18 1.48 (0.76-2.86) 0.17 0.06 48/54 1.12 (0.75-1.66) 0.85 0.79
rs6017996 (-25903G>A) GG 345/422 1.00 ref. 1024/1297 1.00 ref. 405/561 1.00 ref. 1429/1858 1.00 ref. GA/AA 136/154 1.13 (0.85-1.51) 0.39 NA 393/478 1.03 (0.88-1.20) 0.74 0.79 176/208 1.16 (0.92-1.48) 0.21 0.29 569/686 1.07 (0.94-1.22) 0.34 NA
rs6018027 (-21764A>G) AA 284/332 1.00 ref. 807/984 1.00 ref. 309/438 1.00 ref. 1116/1422 1.00 ref. AG 172/211 0.96 (0.73-1.25) 515/682 0.91 (0.78-1.05) 231/284 1.15 (0.91-1.44) 746/966 0.97 (0.86-1.10) GG 25/34 0.80 (0.45-1.42) 0.74 0.49 85/100 1.02 (0.75-1.38) 0.40 0.42 39/46 1.16 (0.74-1.83) 0.46 0.24 124/146 1.06 (0.82-1.36) 0.78 0.98

Genetics in EGFR signaling and colorectal neoplasia risk
325 Int J Mol Epidemiol Genet 2011:2(4):300-315
Table S4 continued. Genetic variability in Src and risk of colorectal neoplasia
Adenomaa Colon Cancerb Rectal cancerb Colorectal cancerc
SNP Cases/
Controls OR 95%CI p SNP Cases/
Controls OR 95%CI p SNP Cases/
Controls OR 95%CI p SNP Cases/
Controls OR 95%CI p SNP rs6018148 (-6776G>A) GG 324/401 1.00 ref. 953/1201 1.00 ref. 405/519 1.00 ref. 1358/1720 1.00 ref. GA 143/157 1.18 (0.88-1.56) 412/501 1.02 (0.87-1.19) 161/227 0.91 (0.72-1.16) 573/728 0.98 (0.86-1.12) AA 15/20 1.07 (0.52-2.23) 0.54 0.34 43/64 0.83 (0.56-1.23) 0.61 0.70 16/29 0.71 (0.38-1.33) 0.46 0.24 59/93 0.79 (0.57-1.10) 0.38 0.32
rs7269342 (-4395A>G) AA 347/402 1.00 ref. 997/1246 1.00 ref. 389/534 1.00 ref. 1386/1780 1.00 ref. AG 122/159 0.90 (0.67-1.20) 382/474 1.01 (0.86-1.18) 173/219 1.08 (0.85-1.38) 555/693 1.03 (0.90-1.18) GG 13/16 0.83 (0.38-1.81) 0.71 0.41 35/49 0.89 (0.57-1.38) 0.85 0.85 18/21 1.15 (0.61-2.20) 0.75 0.45 53/70 0.97 (0.67-1.39) 0.87 0.79
rs6090585 (-3411G>A) GG 439/524 1.00 ref. 1260/1574 1.00 ref. 523/697 1.00 ref. 1783/2271 1.00 ref. GA/AA 43/54 0.98 (0.63-1.53) 0.95 NA 158/199 0.97 (0.78-1.22) 0.82 NA 59/78 1.00 (0.70-1.43) 0.99 NA 217/277 0.98 (0.81-1.19) 0.84 NA
rs6018199 (-2899A>C) AA 345/425 1.00 ref. 1023/1267 1.00 ref. 432/554 1.00 ref. 1455/1821 1.00 ref. AC 125/139 1.15 (0.85-1.54) 355/450 0.96 (0.82-1.13) 140/198 0.90 (0.70-1.16) 495/648 0.94 (0.82-1.08) CC 11/12 1.42 (0.58-3.45) 0.52 0.26 36/49 0.89 (0.57-1.38) 0.80 0.51 11/23 0.62 (0.30-1.29) 0.34 0.19 47/72 0.80 (0.55-1.17) 0.40 0.20
rs754626 (4783A>C) AA 289/335 1.00 ref. 799/1033 1.00 ref. 327/439 1.00 ref. 1126/1472 1.00 ref. AC 163/212 0.91 (0.69-1.19) 536/645 1.07 (0.92-1.24) 223/280 1.06 (0.85-1.33) 759/925 1.07 (0.94-1.21) CC 30/31 1.13 (0.64-1.98) 0.67 0.83 79/87 1.15 (0.84-1.59) 0.52 0.25 31/49 0.85 (0.53-1.37) 0.64 0.94 110/136 1.05 (0.80-1.36) 0.58 0.36
rs6018256 (9597 T>C) TT 413/484 1.00 ref. 1185/1486 1.00 ref. 491/637 1.00 ref. 1676/2123 1.00 ref. TC/CC 66/91 0.90 (0.63-1.30) 0.58 NA 238/292 1.02 (0.84-1.23) 0.87 NA 92/137 0.86 (0.65-1.15) 0.32 NA 330/429 0.97 (0.83-1.13) 0.69 NA
rs6018257 (9982 T>C) TT 400/454 1.00 ref. 1103/1383 1.00 ref. 465/610 1.00 ref. 1568/1993 1.00 ref. TC/CC 82/124 0.81 (0.58-1.12) 0.20 NA 304/378 1.01 (0.85-1.20) 0.93 NA 118/165 0.93 (0.71-1.22) 0.60 NA 422/543 0.99 (.85-1.14) 0.85 NA
a Adjusted for age and sex; b Adjusted for age, sex, and study center; c Pooled analysis of the colon and rectal cancer studies, adjusted for age, sex, study center, and study.

Genetics in EGFR signaling and colorectal neoplasia risk
326 Int J Mol Epidemiol Genet 2011:2(4):300-315
Table S5. Haplotypes in EGFR, Src, and HER2 and risk of colorectal adenomaa Gene Haplotype Cases (%) Controls (%) OR 95% CI p-valueEGFR block 1b AAGAAA 21.3% 20.5% 1.00 ref. AGGAGC 19.5% 20.6% 0.90 0.67-1.19 AGAGAC 17.3% 15.2% 1.08 0.81-1.45 AGGAAC 16.6% 15.4% 0.93 0.69-1.25 GGGAAC 11.7% 13.1% 0.78 0.56-1.07 AGGGAC 11.2% 11.3% 0.87 0.62-1.22 rare 2.4% 3.7% 0.67 0.37-1.21 0.40 EGFR block 2c CTGC 46.8 45.5 1.00 ref. CGGC 32.9 36.1 0.82 0.67-1.01 CTGT 12.8 11.5 1.03 0.76-1.38 <5% 7.5 6.9 1.05 0.73-1.53 0.23 EGFR block 3d GC 39.0 39.3 1.00 ref. AC 36.9 37.9 0.94 0.77-1.16 GG 24.1 22.8 1.04 0.82-1.32 <5% 0 0 — — 0.74 EGFR block 4e CCT 52.7 49.2 1.00 ref. TCT 29.4 31.3 0.91 0.74-1.11 CTT 9.6 10.1 0.94 0.68-1.29 CCC 8.4 9.4 0.91 0.66-1.27 <5% 0 0 — — 0.81 HER2f GACC 39.8 36.7 1.00 ref. CACC 18.5 18.9 0.92 0.70-1.22 GGCC 16.9 16.8 0.99 0.73-1.33 GAAC 12.1 13.4 0.87 0.65-1.16 CGCC 6.4 7.5 0.74 0.48-1.13 CACT 6.2 6.7 0.85 0.58-1.25 <5% 0 0 — — 0.70 Src block 1g AA 73.9 74.3 1.00 ref. CG 23.0 23.0 1.04 0.84-1.28 <5% 3.1 2.7 1.26 0.72-2.19 0.71 Src block 2h CA 74.8 77.4 1.00 ref. GG 13.3 12.8 1.09 0.84-1.43 GA 11.9 9.7 1.32 0.99-1.76 <5% 0.0 0.1 — — 0.25 Src block 3i GG 66.4 67.3 1.00 GA 18.0 16.9 1.14 0.90-1.46 AG 15.6 15.8 1.01 0.79-1.30 <5% 0.0 0.0 — — 0.57 Src block 4j AA 90.7 88.5 1.00 ref. GG 7.1 8.0 0.92 0.65-1.30 <5% 2.2 3.5 0.73 0.42-1.26 0.44 a.Adjusted for age and sex. b.SNPs included in block: 134196A>G, 135784G>A, 140539G>A, 141202A>G, 142572T>C, 145755G>T c.SNPs included in block: 151493T>G, 151116C>T, 154784G>A, 155811C>T d.SNPs included in block: 172792G>A, 172977C>G e.SNPs included in block: 179786C>T 181945C>T (Asp994Asp), 187113T>C f. SNPs included in block: 27567 G>C/- (Pro1140Ala), 23106 A>G (Ile655Val), -658 C>A, 7225 C>T g. SNPs included in block: -41278A>C, -34985A>G h. SNPs included in block: -33208C>G, -29667A>G i. SNPs included in block: -19229G>A, -6776G>A j. SNPs included in block: 9597A>G, 9982A>G
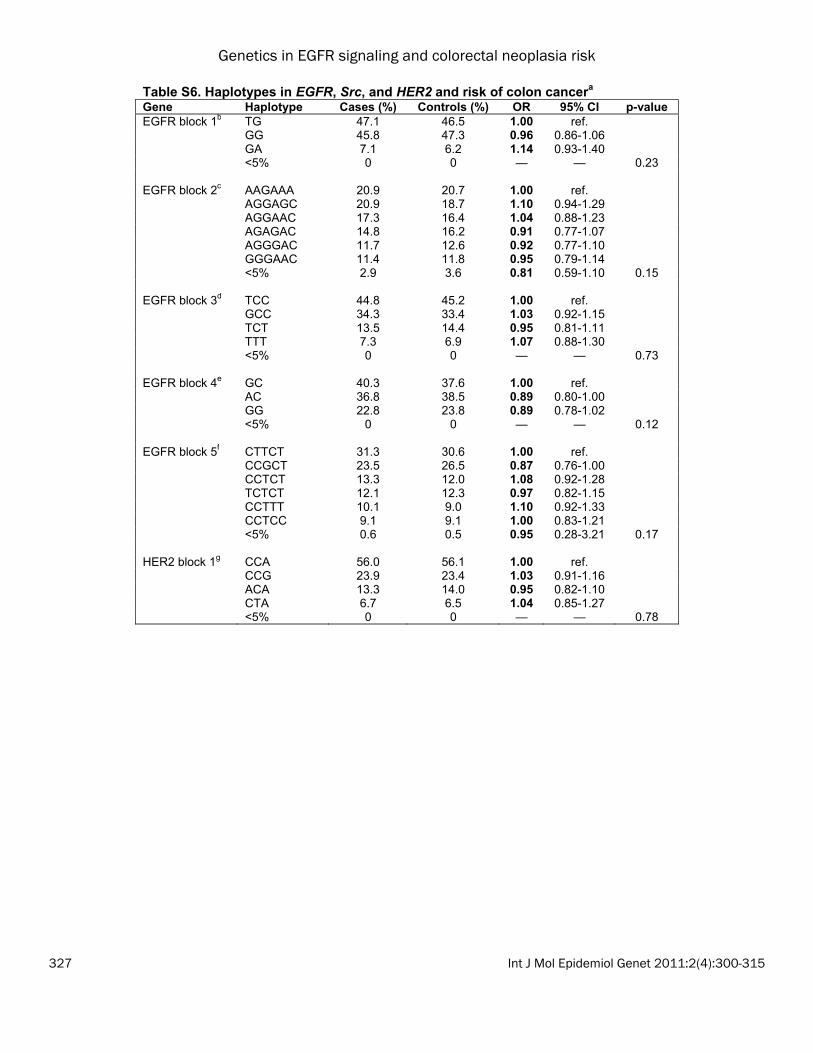
Genetics in EGFR signaling and colorectal neoplasia risk
327 Int J Mol Epidemiol Genet 2011:2(4):300-315
Table S6. Haplotypes in EGFR, Src, and HER2 and risk of colon cancera Gene Haplotype Cases (%) Controls (%) OR 95% CI p-valueEGFR block 1b TG 47.1 46.5 1.00 ref. GG 45.8 47.3 0.96 0.86-1.06 GA 7.1 6.2 1.14 0.93-1.40 <5% 0 0 — — 0.23 EGFR block 2c AAGAAA 20.9 20.7 1.00 ref. AGGAGC 20.9 18.7 1.10 0.94-1.29 AGGAAC 17.3 16.4 1.04 0.88-1.23 AGAGAC 14.8 16.2 0.91 0.77-1.07 AGGGAC 11.7 12.6 0.92 0.77-1.10 GGGAAC 11.4 11.8 0.95 0.79-1.14 <5% 2.9 3.6 0.81 0.59-1.10 0.15 EGFR block 3d TCC 44.8 45.2 1.00 ref. GCC 34.3 33.4 1.03 0.92-1.15 TCT 13.5 14.4 0.95 0.81-1.11 TTT 7.3 6.9 1.07 0.88-1.30 <5% 0 0 — — 0.73 EGFR block 4e GC 40.3 37.6 1.00 ref. AC 36.8 38.5 0.89 0.80-1.00 GG 22.8 23.8 0.89 0.78-1.02 <5% 0 0 — — 0.12 EGFR block 5f CTTCT 31.3 30.6 1.00 ref. CCGCT 23.5 26.5 0.87 0.76-1.00 CCTCT 13.3 12.0 1.08 0.92-1.28 TCTCT 12.1 12.3 0.97 0.82-1.15 CCTTT 10.1 9.0 1.10 0.92-1.33 CCTCC 9.1 9.1 1.00 0.83-1.21 <5% 0.6 0.5 0.95 0.28-3.21 0.17 HER2 block 1g CCA 56.0 56.1 1.00 ref. CCG 23.9 23.4 1.03 0.91-1.16 ACA 13.3 14.0 0.95 0.82-1.10 CTA 6.7 6.5 1.04 0.85-1.27 <5% 0 0 — — 0.78

Genetics in EGFR signaling and colorectal neoplasia risk
328 Int J Mol Epidemiol Genet 2011:2(4):300-315
Table S6 continued. Haplotypes in EGFR, Src, and HER2 and risk of colon cancera
Gene Haplotype Cases (%) Controls (%) OR 95% CI p-valueSrc block 1h AA 73.0 71.6 1.00 ref. CG 23.6 25.1 0.92 0.82-1.03 CA 3.3 3.2 1.03 0.78-1.36 <5% 0.1 0 — — 0.35 Src block 2i CA 75.8 74.7 1.00 ref. GG 14.4 13.7 1.03 0.90-1.19 GA 9.7 11.6 0.81 0.69-0.96 <5% 0.2 0 — — 0.04 Src block 3j GAG 67.4 66.5 1.00 ref. GGA 17.7 17.7 0.97 0.85-1.10 AAG 14.8 15.7 0.93 0.80-1.07 <5% 0.1 0.1 — — 0.79 Src block 4k AGA 69.0 68.4 1.00 ref. GGA 16.0 16.1 0.98 0.85-1.12 AGC 9.4 9.7 0.94 0.80-1.11 AAC 5.7 5.7 0.96 0.77-1.20 <5% 0 0.1 — — 0.96 Src block 5l AA 88.2 88.3 1.00 ref. GG 8.5 8.1 1.05 0.87-1.26 <5% 3.3 3.5 0.94 0.72-1.24 0.82 a. Adjusted for age and sex. b. SNPs included in block: 122960T>G, 124345G>A c. SNPs included in block: 134196A>G, 135784G>A, 140539G>A, 141202A>G, 142572T>C 145755G>T d. SNPs included in block: 151493T>G, 151116C>T, 155811C>T e. SNPs included in block: 172792G>A, 172977C>G f. SNPs included in block: 179446C>T (Thr903Thr), 179786C>T, 180487T>G, 181945C>T (Asp994Asp), 187113T>C g. SNPs included in block: -658 C>A, 7225 C>T, 23106 A>G (Ile655Val) h. SNPs included in block: -41278A>C, -34985A>G i. SNPs included in block: -33208C>G, -29667A>G j. SNPs included in block: -19229G>A, -7281A>G, -6776G>A k. SNPs included in block: -4395A>G, -3411G>A, -2899A>C l. SNPs included in block: 9597A>G, 9982A>G
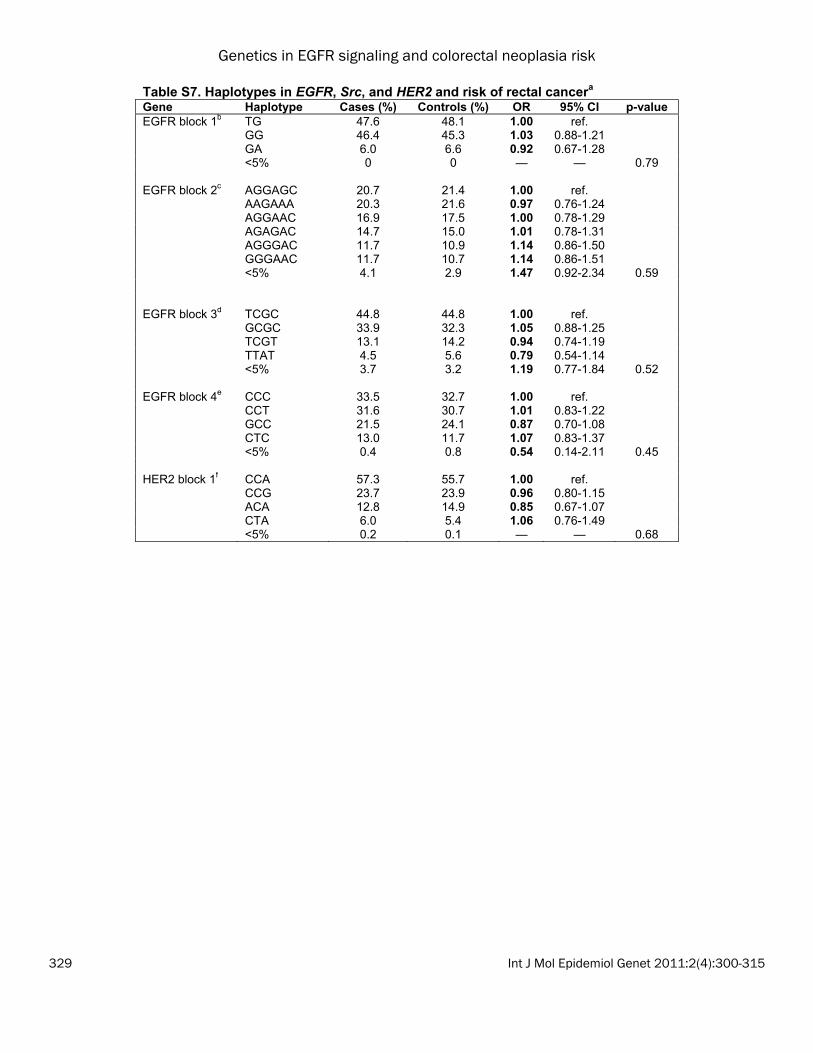
Genetics in EGFR signaling and colorectal neoplasia risk
329 Int J Mol Epidemiol Genet 2011:2(4):300-315
Table S7. Haplotypes in EGFR, Src, and HER2 and risk of rectal cancera Gene Haplotype Cases (%) Controls (%) OR 95% CI p-valueEGFR block 1b TG 47.6 48.1 1.00 ref. GG 46.4 45.3 1.03 0.88-1.21 GA 6.0 6.6 0.92 0.67-1.28 <5% 0 0 — — 0.79 EGFR block 2c AGGAGC 20.7 21.4 1.00 ref. AAGAAA 20.3 21.6 0.97 0.76-1.24 AGGAAC 16.9 17.5 1.00 0.78-1.29 AGAGAC 14.7 15.0 1.01 0.78-1.31 AGGGAC 11.7 10.9 1.14 0.86-1.50 GGGAAC 11.7 10.7 1.14 0.86-1.51 <5% 4.1 2.9 1.47 0.92-2.34 0.59 EGFR block 3d TCGC 44.8 44.8 1.00 ref. GCGC 33.9 32.3 1.05 0.88-1.25 TCGT 13.1 14.2 0.94 0.74-1.19 TTAT 4.5 5.6 0.79 0.54-1.14 <5% 3.7 3.2 1.19 0.77-1.84 0.52 EGFR block 4e CCC 33.5 32.7 1.00 ref. CCT 31.6 30.7 1.01 0.83-1.22 GCC 21.5 24.1 0.87 0.70-1.08 CTC 13.0 11.7 1.07 0.83-1.37 <5% 0.4 0.8 0.54 0.14-2.11 0.45 HER2 block 1f CCA 57.3 55.7 1.00 ref. CCG 23.7 23.9 0.96 0.80-1.15 ACA 12.8 14.9 0.85 0.67-1.07 CTA 6.0 5.4 1.06 0.76-1.49 <5% 0.2 0.1 — — 0.68

Genetics in EGFR signaling and colorectal neoplasia risk
330 Int J Mol Epidemiol Genet 2011:2(4):300-315
Table S7 continued. Haplotypes in EGFR, Src, and HER2 and risk of rectal cancera Gene Haplotype Cases (%) Controls (%) OR 95% CI p-valueSrc block 1g AA 73.5 71.9 1.00 ref. CG 22.8 25.0 0.89 0.74-1.06 <5% 3.7 3.1 1.17 0.77-1.79 0.28 Src block 2h CA 75.2 76.2 1.00 ref. GG 13.6 13.9 1.00 0.79-1.25 GA 11.0 9.7 1.13 0.88-1.46 <5% 0.2 0.2 0.86 0.14-5.19 0.83 Src block 3i GAG 65.0 65.7 1.00 ref. GGA 16.3 18.4 0.90 0.73-1.10 AAG 18.3 15.9 1.17 0.95-1.45 <5% 0.4 0 — — 0.07 Src block 4j GA 86.1 84.3 1.00 ref. GC 8.8 10.6 0.82 0.63-1.06 AC 5.2 5.2 0.96 0.68-1.36 <5% 0 0 — — 0.33 Src block 5k AA 88.8 88.2 1.00 ref. GG 8.0 9.2 0.86 0.65-1.12 <5% 3.3 2.7 1.23 0.79-1.93 0.36 a. Adjusted for age and sex. b. SNPs included in block: 122960T>G, 124345G>A c. SNPs included in block: 134196A>G, 135784G>A, 140539G>A, 141202A>G, 142572T>C, 145755G>T d. SNPs included in block: 151493T>G, 151116C>T, 154784G>A, 155811C>Te. SNPs included in block: 172977C>G, 179446C>T (Thr903Thr), 179786C>Tf. SNPs included in block: -658 C>A, 7225 C>T 23106 A>G (Ile655Val) g. SNPs included in block: -41278A>C, -34985A>Gh. SNPs included in block: -33208C>G, -29667A>G i. SNPs included in block: -19229G>A, -7281A>G, -6776G>Aj. SNPs included in block: -3411G>A, -2899A>C k. SNPs included in block: 9597A>G, 9982A>G

Genetics in EGFR signaling and colorectal neoplasia risk
331 Int J Mol Epidemiol Genet 2011:2(4):300-315
Figure S1. Linkage disequilibrium among controls in the three study populations; a-c=colon cancer controls; d-f=rectal cancer controls; g-i=adenoma controls. a, d, g=EGFR;