Embed Size (px)
Citation preview

1
Organizational Diagnosis in Practice: A Cross-Classification Analysis Using the DEL-Technique
Theo J.B.M. Postma 1 and Robert A.W. Kok 2
1 Faculty of Economics,Department of Management & Organization
Tel.: (31)-50 363 36 84Fax: (31)-50 363 72 07
E-mail: [email protected]
2 Faculty of Management and Organization,Department of Marketing,Tel.: (31)-50 363 39 67Fax.: (31)-50-363 21 74
E-mail: [email protected]
University of GroningenP.O. Box 800
9700 AV GroningenThe Netherlands
SOM theme A: Intra-firm coordination and change
March 23, 1998
AbstractIn this paper, an empirical research about organizational diagnosis in The Netherlands ispresented. Organizational diagnosis is seen as a strategic activity which is determined by theidiosyncrasies of the decision maker. The main research question is whether the usage of thekind of conceptual organizational diagnosis model and computer support in diagnosing problemsituations is contingent upon background characteristics of management consultants and theiragencies. The DEL-technique was applied to test a number of propositions among 72respondents of a random sample of 300 Dutch consulting agencies. This cross-classificationanalysis technique is especially suitable for dealing with small samples. The results indicate thatsize of an agency, educational specialization, and work experience are important characteristicswith respect to the usage of conceptual organizational diagnosis models. Computer support was

2
not found to be dependent on management consultant and agency characteristics in the specifichypothesized relationships.
1 Introduction1
Organizations are confronted with ever increasing turbulence and uncertainty in their
external and internal environments. Organizations have to be flexible, innovative, and
competitive in order to stay in business. In practice, different kinds of methods,
techniques, rules, and heuristics, combined with theories and theoretical concepts are
available for the recognition, diagnosis, and solution of problems in various
organizational contexts. Sometimes, management is not able to either carry out
organizational inquiry activities or interpret and respond to change signals. In these
circumstances, managers can be supported by management consultants (MCs). MCs
usually apply theories, models, and theoretical concepts to problem situations in a
pragmatic way (Buchanan and Boddy, 1992). Especially, those concepts used in the
context of organizational diagnosis activities of MCs are interesting, because there seems
to exist a difference between the management consultant practice and the conceptual
literature in this field. For instance, Wichard (1994) showed that MCs (especially
turnaround and crisis managers) rely more on their previous experience than on formal
models.
Organizational change usually involves a research process consisting of different
stages. One of the most important stages is organizational diagnosis. Organizational
diagnosis can be considered as a special branch of organizational research leading to a set
of statements about design options and recommendations for change. Research in this
field comprises a range of activities, from organizational assessment (Furnham & Gunter,
1993), aspect-oriented audits and diagnoses (Hofstede et al., 1990), performance
measurement (Kaplan & Norton, 1996), to organizational inquiry (Argyris & Schön,
1995). In this paper, these kinds of comparable research activities are referred to as
organizational diagnosis (Harrison, 1987; Weisbord, 1993; Howard et al., 1994; Burton
1 The authors would like to acknowledge the helpful suggestions of Ton de Leeuw, HansVrolijk, and Eugene Westerhof for the preparation of this report. The usual disclaimerapplies.
3
& Obel, 1995). Organizational diagnosis contains a research approach leading to a
statement about the functioning of the organization or a part of the organization related to
the problem area of interest. Often, such a statement leads to recommendations to
improve the organizational efficiency, organizational effectiveness, or flexibility.
Organizational diagnosis activities are generally carried out by specialized internal or
external MCs. They use the results of organizational diagnosis to initiate interventions
leading to organizational change, for example reorganizations, business process
redesigns, outplacements, management buy-outs, strategic alliances, or mergers. Less
encompassing organizational improvements, such as internal communication
improvements and reduction in absenteeism, may also result from organizational
diagnosis. Finally, organizational diagnosis as a research activity contributes to change
processes and to learning processes within organizations (Harrison, 1987). A diagnosis
research project consists of one or more MCs who use an instrument. This can be ‘off the
shelf’ (general instrument) or ‘tailored’ to a specific change situation. The instrument
may vary from simple checklists to more advanced instruments, such as methods,
techniques, models and databases, incorporated into computer systems.
A conceptual organizational diagnosis model2 usually is the core of an
organizational diagnosis instrument (cf. Leavitt, 1965; Weisbord, 1978; Shaw and
Woodward, 1990; Gaines et al, 1993; Kaplan and Norton, 1996). The conceptual model
is the most important element of an instrument, because it guides the research activities of
a practitioner in certain directions. A conceptual model contains components (e.g. task,
strategy, people, structure, culture, and technology) and their relationships. The
components are directive for search activities. The relationships between these
components can be grounded in chosen organizational theories (e.g. see Nadler and
Tushman, 1990), in the experience of an MC (a MC-specific model) or a combination of
both (e.g. 7-Ss model of Peters and Waterman, 1982). In this respect, a distinction can be
made between standard (general) models and customized (problem specific) models
(Burke, 1994). The possibilities of computers to support the change-activities of MCs
have been recognized (Keen, 1981; Courtney et al., 1987; Benjamin and Scott Morton,
2 In the following, we use the term conceptual model in stead of conceptual organizationaldiagnosis model.
4
1988; Huber, 1990; Volonino et al., 1992; Baligh et al., 1990, 1992; Burton and Obel,
1995). In addition to existing software packages (e.g. statistical software or
spreadsheets), developments in the field of information systems such as Decision Support
Systems (DSS) and Knowledge Based Systems (KBS) facilitate the design and selection
of diagnosis components for an MCs toolbox (see table 1 for some examples of these
systems).
Information systems
OrgCon (The Organizational Consultant; Baligh et al., 1992) can be characterized as an expertsystem, based on several contingency theories, that operates as a managementconsultant.
FarSys (Flexibility Audit and Re-design System; Bouma et al., 1992) is a DSS that supportsthe management consultant in diagnosing organizational flexibility and, if needed, inre-designing the organization according to the FAR-methodology.
SuSyFIM (Support System for Interim Managers; Frowein and Postma, 1992) is a DSS thatsupports the diagnosis process of interim managers. It is developed in cooperation withan interim management agency and is aimed at small- and medium-sized industrialbusinesses.
LOES (Logistic Expert System) and INES (Innovation Expert System) are expert systems forsupporting logistic diagnoses in manufacturing companies respectively for judgingfactors that stimulate or impede the innovation potential of a manufacturing company(Hundman et al., 1990).
DeS (Diagnosis Expert System; Tulp, 1992) is an expert system that is part of a researchmethod developed for integral, preventive diagnoses of regional police units.
Table 1: Examples of existing information systems that support organizational diagnosis
Research questions
In a large number of studies,3 the relationship between organizational diagnosis on the
one hand and organizational theories and concepts and the use of computer support on
the other has been discussed. Much of this literature focuses especially on theoretical
aspects. Only a few studies are empirically oriented. Hardly any papers or studies deal
with the actual use of diagnosis models and related computer support by MCs, and the
factors which determine this use, such as the problem situation, agency characteristics
and MC-characteristics. For example, only in problem situations that are characterized as
3 See for instance Huber, 1982; Tichy, 1983; Keen, 1987; Weisbord, 1987; Masuch & LaPotin,1989; Huber, 1990; Gazendam, 1993; Howard et al., 1994; Burton and Obel, 1995.
5
important, complex, and of a repetitive nature, researchers and MCs are prepared to
invest in the development of diagnosis instruments and computer systems. In this
research, we focus on the characteristics of the agency and the MC. The objective is to
make an effort to bridge this perceived gap between academic research and existing
management consultant practices. This paper deals with three research questions:
1. Do management consultants use conceptual organizational diagnosis model(s)
and computer support in diagnosing a problem situation?
2. What kinds (type and nature) of conceptual organizational diagnosis model(s)
and computer support do management consultants apply in diagnosing a
problem situation?
Empirical research in related fields shows that characteristics are relevant measures for
strategic choices of professionals comparable to MCs, such as accountants, marketers,
and top managers (see next section). According to Wiersema and Bantel, (1992) an
individual’s cognitive base evolves from experience including training and background.
Therefore, we expect that choices regarding conceptual models and computer support are
contingent upon background characteristics of MCs and their agencies. This leads to the
final research question.
3. Is the usage of the kind of conceptual organizational diagnosis model and
computer support for diagnosing a problem situation contingent upon
background characteristics of management consultants and their agencies?
2 Literature review
Hambrick and Mason (1984) have developed a theoretical model which has been used as
a starting point in our research. Their main assumption is that managerial decisions
influence organizational outcomes, in contrast to the view of the population ecologists (p.
194). In this respect (and following Child), they introduced the term ‘strategic choice’.
The strategic choice reflects the idiosyncrasies of decision makers and the exposure to
stimuli both within and outside the organization. Analogously, the decisions of MCs to
use a specific kind (type and/or nature) of conceptual model and computer support are
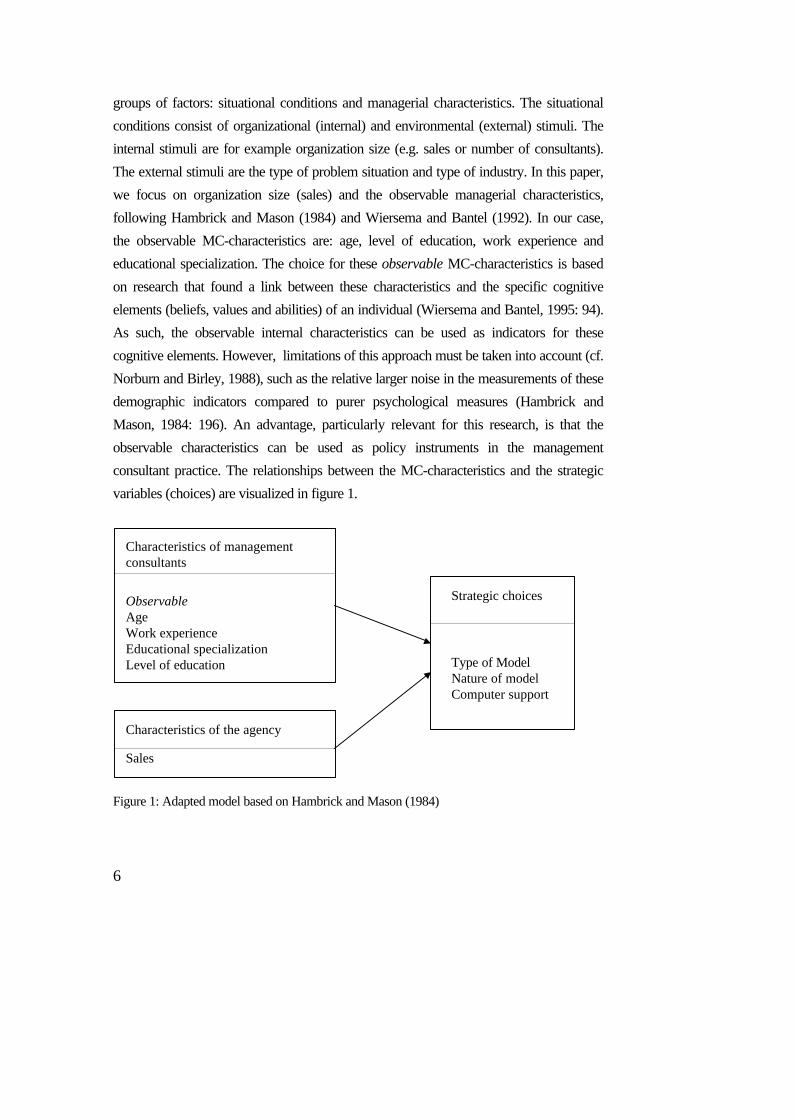
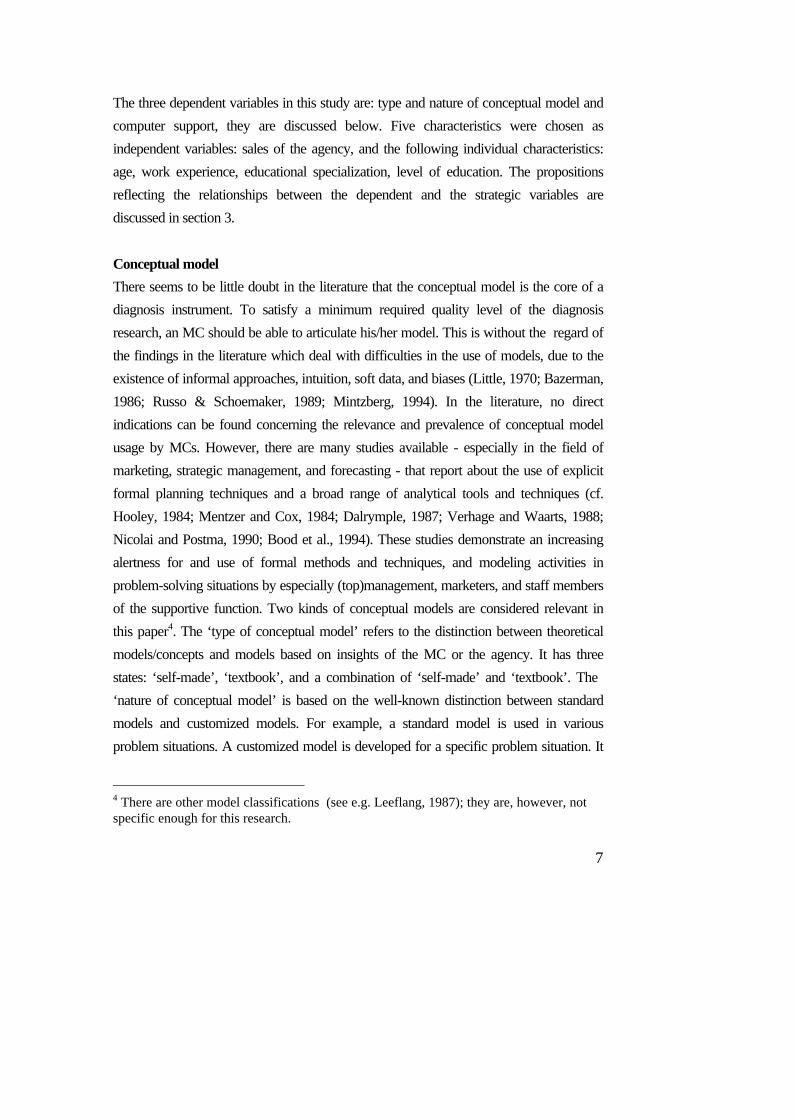
regarded as strategic in nature. In this paper, strategic choices are determined by two
6
groups of factors: situational conditions and managerial characteristics. The situational
conditions consist of organizational (internal) and environmental (external) stimuli. The
internal stimuli are for example organization size (e.g. sales or number of consultants).
The external stimuli are the type of problem situation and type of industry. In this paper,
we focus on organization size (sales) and the observable managerial characteristics,
following Hambrick and Mason (1984) and Wiersema and Bantel (1992). In our case,
the observable MC-characteristics are: age, level of education, work experience and
educational specialization. The choice for these observable MC-characteristics is based
on research that found a link between these characteristics and the specific cognitive
elements (beliefs, values and abilities) of an individual (Wiersema and Bantel, 1995: 94).
As such, the observable internal characteristics can be used as indicators for these
cognitive elements. However, limitations of this approach must be taken into account (cf.
Norburn and Birley, 1988), such as the relative larger noise in the measurements of these
demographic indicators compared to purer psychological measures (Hambrick and
Mason, 1984: 196). An advantage, particularly relevant for this research, is that the
observable characteristics can be used as policy instruments in the management
consultant practice. The relationships between the MC-characteristics and the strategic
variables (choices) are visualized in figure 1.
Figure 1: Adapted model based on Hambrick and Mason (1984)
Characteristics of managementconsultants
ObservableAgeWork experienceEducational specializationLevel of education
Strategic choices
Type of ModelNature of modelComputer support
Characteristics of the agency
Sales
7
The three dependent variables in this study are: type and nature of conceptual model and
computer support, they are discussed below. Five characteristics were chosen as
independent variables: sales of the agency, and the following individual characteristics:
age, work experience, educational specialization, level of education. The propositions
reflecting the relationships between the dependent and the strategic variables are
discussed in section 3.
Conceptual model
There seems to be little doubt in the literature that the conceptual model is the core of a
diagnosis instrument. To satisfy a minimum required quality level of the diagnosis
research, an MC should be able to articulate his/her model. This is without the regard of
the findings in the literature which deal with difficulties in the use of models, due to the
existence of informal approaches, intuition, soft data, and biases (Little, 1970; Bazerman,
1986; Russo & Schoemaker, 1989; Mintzberg, 1994). In the literature, no direct
indications can be found concerning the relevance and prevalence of conceptual model
usage by MCs. However, there are many studies available - especially in the field of
marketing, strategic management, and forecasting - that report about the use of explicit
formal planning techniques and a broad range of analytical tools and techniques (cf.
Hooley, 1984; Mentzer and Cox, 1984; Dalrymple, 1987; Verhage and Waarts, 1988;
Nicolai and Postma, 1990; Bood et al., 1994). These studies demonstrate an increasing
alertness for and use of formal methods and techniques, and modeling activities in
problem-solving situations by especially (top)management, marketers, and staff members
of the supportive function. Two kinds of conceptual models are considered relevant in
this paper4. The ‘type of conceptual model’ refers to the distinction between theoretical
models/concepts and models based on insights of the MC or the agency. It has three
states: ‘self-made’, ‘textbook’, and a combination of ‘self-made’ and ‘textbook’. The
‘nature of conceptual model’ is based on the well-known distinction between standard
models and customized models. For example, a standard model is used in various
problem situations. A customized model is developed for a specific problem situation. It
4 There are other model classifications (see e.g. Leeflang, 1987); they are, however, notspecific enough for this research.
8
has two states: ‘standard’ and ‘customized’. In terms of Hambrick and Mason (1984),
the specific choices of the states of these two model variables are expected to be
contingent upon the five characteristics.
Computer support
Our literature research gave no explicit indications about computer use by MCs. For
comparable professional/organizational groups, however, there are sources indicating the
relevance and prevalence of computer support. Especially in the DSS-literature, some
empirical results can be found. Sanders and Courtney (1985) performed a field study,
relating organizational factors and DSS success. Their main findings were that the level
of top management support, the user training, and the length of DSS use are important
indicators for DSS success. This study shows that personal and organizational
characteristics are important indicators for DSS success. A study conducted in 1992 on
the use of software applications, planning methods and forecasting methods for strategic
management in the Netherlands (Bood et al., 1994) indicated that 82 percent of the
respondents used software for strategic management activities (such as net discounted
value method: 47 percent; scenario-analysis, simulation, and trend analysis all 38
percent). De Jong et al. (1994) studied marketing decision support systems (MDSS)
usage by top management and marketing managers (also other occupational groups were
part of the study). One of the main results is that 44 percent of top management and 89
percent of marketing managers uses MDSS. The researchers also considered the impact
of personal and organizational characteristics on the use of MDSS.
Furthermore, different case studies are found that report on the development, the
characteristics and the usage of specific information systems (e.g. Oral, 1987; Ruohonen
& Salmela, 1992). Case findings are, however, of limited value for our purpose. In
general, the computer support literature suggests a certain amount of consensus about the
support capabilities and potential of computers for different professional or
organizational user groups. The future prospects are even better (c.f. Keen, 1987;
McNurlin and Sprague, 1989).
The states for the variable ‘computer usage’, are non-usage, and in case of
usage: ‘existing software packages’ only (e.g. spreadsheets) and ‘existing software
combined with information systems’.
9
3 Development of propositions
To answer research question three, propositions were developed on the basis of
theoretical plausible relationships. The following variables are considered in relation to
three dependent variables: size, age, level of education, educational specialization, and
work experience.
Size
Two dimensions of size are the ‘quantity of available resources’ and the
‘organizational complexity’. With regard to ‘organizational complexity’, Wiersema
and Bantel (1992: 100) state that “largeness should be associated with a low
likelyhood of major changes in corporate strategy”. This has no implication for
conceptual model usage; for computer usage this may mean that larger agencies are
less likely to adopt new computer support systems. The resources-argument,
however, is more compelling for conceptual model usage. Analogous to medium-
and small-sized enterprises, smaller agencies are expected to have less resources
compared to the bigger ones (cf. Nooteboom, 1994). If size increases, it may be
expected that the number of resources grows in terms of available time to perform
innovative research in order to develop new diagnosis concepts, theories or
instruments. Sales is chosen as indicator of the quantity of available resources (size).
The proposition is that smaller agencies in terms of sales, compared to the larger
ones, rely more on textbook models and less on computer support. More generally,
size is associated with type of model usage (proposition 1) and computer support
(proposition 2). For nature of model no support for a plausible proposition was
found in the literature.
Age
Managerial age as a characteristic is expected to influence strategic variables. For
instance, Norburn and Birley (1988) and Hitt and Tyler (1991) found that age as a
personal characteristic influences strategic decision-making performance. Age
10
influences information search and processing in decision-making. Taylor (1975)
reported that older decision makers seek relatively large quantities of information
and process it adequately, but they tend to have difficulty to integrate it to make
accurate decisions. Mental and physical capacities seem to be a function of age.
Hambrick and Mason (1984) indicate another important aspect of age: “older
executives have greater psychological commitment to organizational status quo”
(p.198). This has also been suggested by Wiersema and Bantel (1992: 97), who
argue that flexibility decreases and rigidity and resistance to change increase as
people age. Both aspects of age suggest that older consultants are inclined to stick to
their standard models. The proposition accordingly is that older consultants use
standard models and younger consultants use customized models. As far as
computer support is concerned, the following proposition was developed: older
consultants in contrast to younger consultants are resistant to change and are
therefore less inclined to use computer support. More generally, age is associated
with nature of model usage (proposition 3) and computer support (proposition 4).
For the type of model no plausible proposition could be developed.
Level of education
To a certain extent someone’s educational background is indicative for a person’s
knowledge and skill base (Hambrick and Mason, 1984: 200). Hambrick and Mason
state that: “the level of education (either of a CEO or other central actors) is
positively related to receptivity of innovation”, noting subsequently that we must be
very careful, because of lacking controls for age in the studies they used. Also,
Wiersema and Bantel indicate that: “high levels are associated with a high capacity
for information processing and ability to discriminate among a variety of stimuli
(1992: 99). The educational background (of leaders) has consistently been found to
be related to adoption behavior (Kimberly and Evanisko, 1981: 696). These findings
indicate different plausible propositions. The receptivity to and adoption of
innovative developments is more related to the usage of computer support. Level of
information processing and discriminating ability determine both type and nature of
model usage. The proposition is that MCs with an higher level of education are more
likely to use self-made models, customized models, and computer support. More
11
generally, education is associated with type of model usage (proposition 5), nature
of model (proposition 6), and computer support (proposition 7).
Educational specialization
Not only the level of education, but also the educational specialization is important.
Educational specialization refers to the different disciplines in which the MC has been
educated (such as economics/business administration, psychology/sociology, information
sciences/technical sciences, and law/public administration). Hitt and Tyler (1991)
indicate that the type of education influences strategic decision-making. According to
Wiersema and Bantel “certain academic fields are more oriented towards change than
others” (1992: 99/100). Hambrick and Mason (1984: 200) argue that a person’s
knowledge and skills are affected by the type of education. For instance, “a person
educated in engineering can generally be expected to have a somewhat different cognitive
base from someone educated in history or law”. The proposition is that MCs specialized
in economics, business administration, sociology and psychology (have knowledge of and
therefore) use textbook or a combination of textbook and self-made models; they also use
customized models, because their knowledge of the relevant models allows them to adjust
them. MCs specialized in information sciences/technical sciences, and law and public
administration use self-made models and use standard models. Kimberly and Evanisko
(1981) indicated that they did not find a relationship between educational substance and
adoption of administrative innovations. Therefore, a proposition, regarding the
relationship between educational specialization and computer support, is omitted. More
generally, MCs with different educational specialization make different choices regarding
the type of model (proposition 8) and nature of model usage (proposition 9).
Work experience
The duration of work experience, as a management consultant, can be expected to have a
significant effect on strategic variables. Kimberley and Evanisko (1981), Hambrick and
Mason (1984), Norburn and Birley (1988), Zenger and Lawrence (1989), Hitt and Tyler
(1991), and Wiersema and Bantel (1992) indicated experience or a related concept (such
as career experience, functional track, organizational tenure) as a relevant characteristic.
In this respect, the specific work experience related to the consultancy, and not to the
12
functional track, is considered relevant. The proposition is that MCs with less work
experience use textbook models or a combination of textbook and self-made models and
standard models. When they have more work experience, they can use self-made models
and customized models (proposition 10 and 11). MCs with less work experience use
computer support compared to more experienced MCs to compensate for the lack of
knowledge (proposition 12).
4 Methodology
A survey research was conducted to empirically test the propositions. To that aim, a
questionnaire was developed, tested, adapted, and subsequently sent to a sample of
MC-agencies. In this chapter, the collection, description, and analysis of the data
obtained from the returned questionnaires is discussed.
4.1 Data collection
In testing the propositions, a random sample of 300 MC-agencies, located in The
Netherlands, was drawn from a listing of 15.000 Dutch management consultant
agencies by the Dutch Chamber of Commerce (N.V. Databank). Each agency’s
managing partner/contact person received one questionnaire. The total number of
reactions was 83 (28 percent) of which 72 (24 percent) could be used5. The group of
respondents corresponds with a cross section of the non-response, and consequently
represents the total population of Dutch MC-agencies, with respect to the
dimensions spatial differentiation and sales revenues.
4.2 Data description
5 This difference is a result of incompletely answered questionnaires.

13
Table 2 displays the independent variables and the strategic (dependent) variables,
which describe the research population. These variables are all categorically
(nominally or ordinally) scaled.
Variables States Frequency/percentage
Variables States Frequency/percentage
Independent variables Dependent (strategic) variables
Averageannual salesof theagency inDFL:
1. < 250,0002. 250,000 - 500,0003. 500,000 - 1,000,0004. 1,000,000 - 5,000,0005. 5,000,000 >
in Dutch guilders (DFL)
47 67.114 20.0 4 5.7 4 5.7 1 1.4-- -----
70 100.0
Conceptualmodelusage
1. no model usage
2. in some cases
3. often
4. almost always
5. always
14 19.7
10 14.1
20 28.2
19 26.7
8 11.3
-- -----
71 100.0
Level ofeducation ofMC
1. Intermediate vocational education
2. Higher vocational education
3. University education
5 6.9
28 38.9
39 54.2-- -----
72 100.0
Nature ofmodel
1. standard model
2. customized model
15 60
10 40
-- -----
25 100.0
Educationalspecializationof MC
1. Economics/Business Administration2. Psychology/ Sociology3. Information Sciences/ Technical Sciences4. Law/Public Administration
20 33.3
11 18.3
20 33.3
9 15.0-- -----
60 100.0
Type ofmodel
1. self-made model2. combination of self-made and textbook model3. textbook model
13 23.2
27 48.216 28.6-- -----
56 100.0
Workexperienceof MC inyears
1. 1 - 5 years2. 6 - 103. 11 - 154. 16 - 205. 21 >
37 51.415 20.8 7 9.7 6 8.3 7 9.7-- -----
72 100.0
Computersupport
1. no computer support2. existing software packages3. existing software packages and information systems
27 38.0
36 50.7
8 11.3-- -----
71 100.0
Age of MCin years
1. 24 - 33 years2. 34 - 433. 44 - 534. 54 - 635. 64 >
8 11.123 31.925 34.714 19.4 2 2.8-- -----
72 100.0
Table 2 : Frequencies of the independent and the dependent variables
The sample consists of many small agencies with an average annual turnover of less
than DFL 250,000. The MCs in this sample are mostly higher or university
educated, are educated in different disciplines, largely have less than 10 years work
experience in consulting activities, and are approximately normally distributed about
14
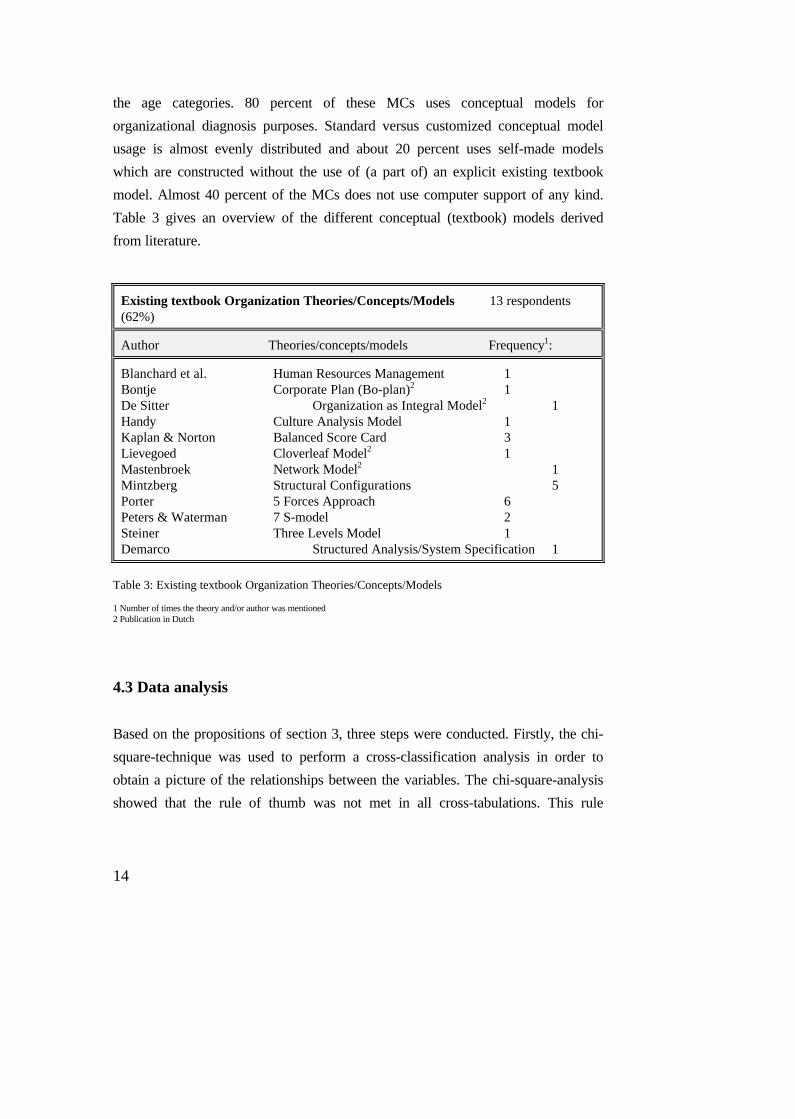
the age categories. 80 percent of these MCs uses conceptual models for
organizational diagnosis purposes. Standard versus customized conceptual model
usage is almost evenly distributed and about 20 percent uses self-made models
which are constructed without the use of (a part of) an explicit existing textbook
model. Almost 40 percent of the MCs does not use computer support of any kind.
Table 3 gives an overview of the different conceptual (textbook) models derived
from literature.
Existing textbook Organization Theories/Concepts/Models 13 respondents(62%)
Author Theories/concepts/models Frequency1:
Blanchard et al. Human Resources Management 1Bontje Corporate Plan (Bo-plan)2 1De Sitter Organization as Integral Model2 1Handy Culture Analysis Model 1Kaplan & Norton Balanced Score Card 3Lievegoed Cloverleaf Model2 1Mastenbroek Network Model2 1Mintzberg Structural Configurations 5Porter 5 Forces Approach 6Peters & Waterman 7 S-model 2Steiner Three Levels Model 1Demarco Structured Analysis/System Specification 1
Table 3: Existing textbook Organization Theories/Concepts/Models
1 Number of times the theory and/or author was mentioned2 Publication in Dutch
4.3 Data analysis
Based on the propositions of section 3, three steps were conducted. Firstly, the chi-
square-technique was used to perform a cross-classification analysis in order to
obtain a picture of the relationships between the variables. The chi-square-analysis
showed that the rule of thumb was not met in all cross-tabulations. This rule
15
requires a minimum expected cell frequency of cij ≥ 5 in at least 90 % of the cells.
As a result, the Chi-square-results were not used. Secondly, as suggested by Drazin
and Kazanjian (1993), the DEL-technique was used as an alternative technique, in
which a relationship between the two variables a and b is considered by using a
weighting scheme, taking into account the different states of the variables. In that
way, patterns of association between the states of the variables could be tested
(Kazanjian and Drazin, 1989; Drazin and Kazanjian, 1990).
The DEL-technique is especially suitable for analyzing bivariate data in
which a dependent variable's state is predicted from an independent variable’s state.
Hildebrand et al. (1977) developed the DEL-technique as a statistical procedure for
analyzing cross-classification data as an alternative to classical statistical
approaches. They concluded that DEL "satisfies those design criteria that pertain
to the measurement of prediction success attained in a population by a bivariate
proposition" (p.104). Drazin and Kazanjian (1993, p.1380) state that the DEL-
technique allows a researcher to develop an a priori customized hypothesis that can
test a theory of the relationship between the states of two categorical variables.
Furthermore, it is independent of sample size and robust for small samples. In this
respect, the DEL-technique is superior to other test methods such as Chi-square,
Lambda and Tau (Kazanjian and Drazin, 1989: 1496). The essence of the DEL-
value is that it can be interpreted as the proportionate reduction in error of knowing
the specific hypothesis over not knowing that rule. Drazin and Kazanjian state that
DEL provides a measure of strength of association comparable with R2 (coefficient
of determination) in regression analysis and that R is comparable with the
correlation coefficient between the variables. See appendix A for a more technical
explanation of the DEL-technique.
A number of activities was performed in the DEL-analysis. To apply the
DEL-technique and to test the general propositions involving the bivariate relationship
between the variables, specific prediction rules were developed, taking into account the
categorical nature of nominally scaled variables. A decision had to be made about the
specific form of the relationship (prediction rule) which could be used to test the
proposition. To underpin this decision, a sensitivity-analysis was performed to choose
16
the feasible prediction rules within the theoretical proposition6. This sensitivity-
analysis was also used to get insight into the DEL-technique and to refine the
prediction rules. In most cases, dichotomization was needed to theoretically account
for the assignment of the weight classification schemes. These prediction rules were
tested in a DEL-mode. Thirdly, another chi-square-analysis was used to compare the
Chi-square results with the DEL-results. Also, in this dichotomized case, the chi-
square-results did not meet the cell frequency requirements.
5 Results of empirical research
The DEL-mode requires that a rule of thumb is satisfied for using the normal
approximation. In this research, the analysis performed with the DEL-technique,
satisfies this requirement (the formulas used to compute DEL and its significance
are given in appendix A). A positive and significant DEL-value is a good predictor,
and a negative DEL-value or a DEL with the value 0 means no predictive value for
the proposed prediction rule (Drazin and Kazanjian, 1993).
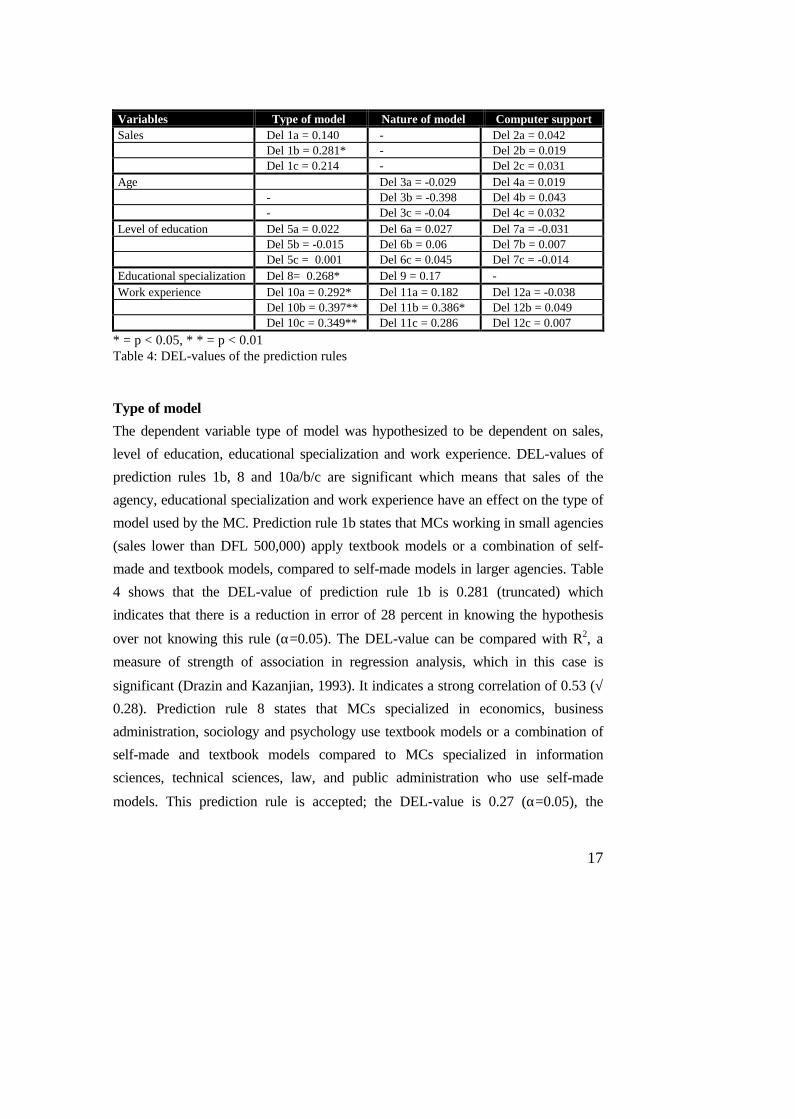
Table 4 presents the results of the DEL-analysis. Three different weighting
schemes (prediction rules) were used for the relationships involving the independent
variables: sales, age, level of education, and work experience, resulting in different
DEL-values. A DEL-value was calculated based on the prediction rule in which the
middle state had no effect (weight of 0.5). Two adjusted DEL-values were
calculated to take into account the effect of the assignment of the middle state to
either the lower or the higher category. For educational specialization one weighting
scheme (representing one straight forward relationship) is tested. Appendix B
presents the specific prediction rules.
6 A specific prediction rule was developed that related the states of the two variables, to capturethe richness of this variable and arrive at a meaningful proposition. Sensitivity analysis was usedin the cases no theoretical argument was available to assign the middle states of the variablessales, age, work experience, and level of education to either the lower or the upper states of thesame variable.
17
Variables Type of model Nature of model Computer supportSales Del 1a = 0.140 - Del 2a = 0.042
Del 1b = 0.281* - Del 2b = 0.019Del 1c = 0.214 - Del 2c = 0.031
Age Del 3a = -0.029 Del 4a = 0.019- Del 3b = -0.398 Del 4b = 0.043- Del 3c = -0.04 Del 4c = 0.032
Level of education Del 5a = 0.022 Del 6a = 0.027 Del 7a = -0.031Del 5b = -0.015 Del 6b = 0.06 Del 7b = 0.007Del 5c = 0.001 Del 6c = 0.045 Del 7c = -0.014
Educational specialization Del 8= 0.268* Del 9 = 0.17 -Work experience Del 10a = 0.292* Del 11a = 0.182 Del 12a = -0.038
Del 10b = 0.397** Del 11b = 0.386* Del 12b = 0.049Del 10c = 0.349** Del 11c = 0.286 Del 12c = 0.007
* = p < 0.05, * * = p < 0.01Table 4: DEL-values of the prediction rules
Type of model
The dependent variable type of model was hypothesized to be dependent on sales,
level of education, educational specialization and work experience. DEL-values of
prediction rules 1b, 8 and 10a/b/c are significant which means that sales of the
agency, educational specialization and work experience have an effect on the type of
model used by the MC. Prediction rule 1b states that MCs working in small agencies
(sales lower than DFL 500,000) apply textbook models or a combination of self-
made and textbook models, compared to self-made models in larger agencies. Table
4 shows that the DEL-value of prediction rule 1b is 0.281 (truncated) which
indicates that there is a reduction in error of 28 percent in knowing the hypothesis
over not knowing this rule (α=0.05). The DEL-value can be compared with R2, a
measure of strength of association in regression analysis, which in this case is
significant (Drazin and Kazanjian, 1993). It indicates a strong correlation of 0.53 (√
0.28). Prediction rule 8 states that MCs specialized in economics, business
administration, sociology and psychology use textbook models or a combination of
self-made and textbook models compared to MCs specialized in information
sciences, technical sciences, law, and public administration who use self-made
models. This prediction rule is accepted; the DEL-value is 0.27 (α=0.05), the

18
correlation is 0.52. Prediction rule 10c, which states that MCs with 1-10 years of
work experience use textbook models or a combination of self-made and textbook
models compared to MCs with more than 16 years work experience who use self-
made models, is accepted. Both prediction rules 10a and 10b are accepted as well,
but the DEL-value of 10b is higher, indicating that MCs in the middle state (11-14
years of work experience) use self-made models.
Nature of model
The dependent variable, nature of model, was expected to be dependent on age, level
of education, educational specialization and work experience. Only prediction rule
11b has a significant effect, which means that work experience determines the nature
of model usage. MCs with 1 to 10 years of work experience use standard models
compared to MCs with more than 10 years work experience who use customized
models.
Computer support
The dependent variable computer support was expected to be determined by sales,
age, level of education, and work experience. All these relationships, specified in the
three different forms, are not significant, contrary to the effect proposed in the
prediction rules.
6 Conclusion and discussion
While much research about organizational diagnosis is conceptual of nature, this
study is empirically oriented. We considered conceptual model usage and computer
support as strategic variables in the toolbox of the management consultants who
perform organizational diagnosis. To be able to get insight into determinants of the
strategic variables, we developed a research model in the tradition of Hambrick and
Mason (1984).
19
Research questions
With respect to the first research question of this paper regarding conceptual model
usage, it can be concluded that about 80 percent of the management consultants uses
these models. This practical finding is in line with the theoretical notion that the
conceptual organizational diagnosis models are a core element of an organizational
diagnosis research (Burke, 1994). Also, our study showed that almost 40 percent of
the MCs do not use computer support in organizational diagnosis. This is due to (in
order of importance): i) no need for computer support/not necessary, ii) no
knowledge on/experience with computer, iii) high costs of computer equipment. The
figure is, to a certain extent, comparable with the findings of Bood et al. (1994) and
De Jong et al. (1994).
The second research question concerns the kinds of conceptual models and
computer support used. The results show that standard versus customized
conceptual model usage is almost evenly distributed and about 20 percent of the
MCs uses self-made models, which are constructed without the use of (a part of) an
explicit existing textbook model. With regard to computer support it can be
concluded that about 50 percent uses existing software packages (such as
spreadsheets, text processors, database management software, and statistical
software). Only about 10 percent of the MCs also uses custom-made information
systems (such as Decision Support Systems and Knowledge Based Systems).
The third research question concerns the research model. It can be
concluded that patterns of association exist between type of model and the
characteristics sales, educational specialization and work experience, and between
nature of model and the characteristic work experience. These general relationships
of the research model are confirmed. However, computer support as a dependent
(strategic) variable seems not to be associated with any of the characteristics. No
significant pattern of association showed up. This indicates that for the prediction
rules the chosen characteristics do not differentiate for the different computer
support states. This is in line with the mixed results of Dyck and Al-Awar Smither
(1994) and Colley et al. (1994). To arrive at these results, it was necessary, in our
opinion to consider two adjusted DEL-values. Although the DEL-method asks for a
priori prediction rules to be tested, we allowed for minor variation in the prediction
20
rules within the theoretical proposition. In general, it can be concluded that
insignificant results do not necessarily mean that no relationship exists between two
variables, however, it does mean that the specific prediction rule is rejected.
These findings implicate that size of an agency, educational specialization,
and work experience are important characteristics regarding the usage of conceptual
models for organizational diagnosis. Especially, educational specialization and work
experience are potential policy instruments for MC-agencies. The choice of specific
MCs (as model-users) and job tenure influences the way conceptual models are
used. This research also underline the basic theoretical proposition of Hambrick and
Mason (1984) that strategic choices reflect the idiosyncrasies of the decision maker.
Methodological remarks
Firstly, a remark can be made on both Chi-square analyses. These analyses showed
that for all bivariate relations tested in the cross-tables more than 10 percent of the
cells in every single cross-table has a theoretical frequency which is lower than 5.
The results of the Chi-square analyses therefore, can not be considered reliable. This
is a consequence of the relatively small sample. Secondly, as stated in section 4 the
DEL-technique is more robust for small samples and more specific hypotheses can
be tested. In general, when the null hypothesis is rejected, it may be concluded that
the variables are not independent, a specific relationship exists. By performing a
sensitivity analysis of the DEL-results (especially by varying the weighting schemes
and by recoding the variables) we found that it is important to precisely formulate
the relationship between the states of the variables in the hypothesis. Within the
context of the propositions the variables could be recoded in varying ways to
combine the different states in different ways. In most cases, the variables were
dichotomized. On the one hand, this resulted to a certain extent in a loss of
information. On the other hand, we were able to arrive at significant and more
reliable results. By using these sensitivity analyses, however, we were able to find
different theoretically plausible relations. In this way, it was possible to refine the
original (general) propositions. However, a slightly different relationship resulting in
a slightly different weighting scheme has implications for the strength of the
proposed hypothesis and its significance. For example, the strength of the
21
relationship between work experience of MCs and nature of model can be enhanced
and becomes significant, by changing the weights only in a minor way (e.g. from
DEL = 0.286 and p = 0.087 to DEL = 0.386 and p = 0.036). In our opinion this is a
very important feature of the DEL-technique which seems to be neglected by Drazin
and Kazanjian (1990; 1993). This also means that when (using a certain weighting
scheme) the null hypothesis is not rejected, it can not be concluded that no (other)
relationship exists at all between the variables (reflecting a different weighting
scheme and concomitant prediction rule).
Limitations and future research
This research is based on a questionnaire that partly measures judgments of MCs.
As such the obtained ‘expertise’ is of course subjective and personal (see Vickers,
1983). Another limitation of this kind of research is the risk that ‘espoused’ theory
or socially accepted behavior is measured. However, we tried to reduce this by not
asking any information on performance. The current study has also some limitations
with respect to construct validity, internal validity, and reliability. The independent
and strategic variables are all specified as stated in table 2. Their choice and
different states, which are based on face validity, reflect to a certain extent some
subjectivity. However, sensitivity analyses (e.g. by dichotomizing variables) were
performed to minimize the problems related to the states of the variables. The
research model is based on a number of direct relationships between independent and
strategic variables. The internal validity of the research model as measured by these
relationships needs to be established more thoroughly, for instance by gaining insight
into the way the various independent variables are clustered and/or influence each
other. In future research also these mutual relations between the independent
variables could be taken into account. With respect to reliability, we conclude that
although the DEL-method can be used and generates representative results, we
would like to have more data to be able to use other methods and obtain more robust
results.
22
References
Argyris, C., Schön, D.A. Organizational learning ll (Mass, Reading: Addison-Wesley, 1995).
Benjamin, R.I. & Scott Morton, M.S. Information Technology, Integration, andOrganizational Change. Interfaces (1988), 18: 86-98.
Baligh, H.H., Burton, R.M. & Obel, B. Devising Expert Systems in OrganizationTheory: The Organizational Consultant. In Masuch, M. (Ed.), Organization,Management and Expert Systems (Berlin: De Gruyter, 1990).
Baligh, H.H., Burton R.M. & Obel, B. Organizational Consultant: Learning byDoing. In Masuch, M. & Warglien, M. (Eds.), Artificial Intelligence inOrganization and Management Theory (Amsterdam: North-Holland, 1992).
Bazerman, M.H., Judgment in Managerial Decision Making (New York: Wiley,1986).
Bood, R.P. Frowein, J.C. Postma, Th.J.B.M., Het gebruik van software in hetstrategisch management (the use of software in strategic management),Maandblad voor Accountancy en bedrijfshuishoudkunde (1994), 68 (11): 649-657.
Bouma, F., Rutges, A. & Volberda, H.W. FARSYS, An Object Oriented Tool for Management Consultancy Support (Research Report 1992-02, Faculty ofManagement and Organization, Groningen University, 1992).
Buchanan, D., Boddy, D. The Expertise of the Change Agent (New York: PrenticeHall, 1992).
Burke, W.W., Diagnosis Models for Organization Development, In: A. Howard &Associates (Eds.), Diagnosis for Organizational Change: Methods and Models,(The Guilford Press, New York, 1994).
Burton R.M., & Obel, B. Strategic Organizational Diagnosis and Design (Boston:Kluwer Academic Publishers, 1995).
Colley, A.M., Gale, M.T., Harris, T.A., Effects of Gender Identity and Experienceon Computer Attitude Components, Journal of Educational ComputingResearch (1994) 10: 129-137.
Courtney, J.F., Paradice, D.B. & Ata Mohammed, N.H. A Knowledge-Based DSSfor Managerial Problem Diagnosis. Decision Sciences (1987), 18: 373-399.
Dalrymple, D.J., Sales Forecasting Practices, Results from a United States Survey,International Journal of Forecasting (1987), 3:379-391.
Drazin, R., Kazanjian, R.K. Research Notes and Communications; A Reanalysis ofMiller and Friesen's Life Cycle Data. Strategic Management Journal (1990), 11:319-325.
Drazin, R., Kazanjian, R.K. Applying the Del technique to the Analysis of Cross-classification Data: a Test of CEO Succession and Top Management TeamDevelopment. Academy of Management Journal (1993), 36 (6): 1374-1399.
23
Dyck, J.L. & Al-Awar Smither, J., Age Differences in Computer Anxiety: The Roleof Computer Experience, Gender and Education, Journal of EducationalComputing Research (1994) 10: 239-248.
Frowein, J.C. & Postma, Th.J.B.M. DSS For Organizational Diagnosis. In Jelassi,T., Klein, M.R. & Mayon-White, W.M. (Eds.), Decision Support Systems:Experiences and Expectations (Amsterdam: North-Holland, 1992), 167-181.
Furnham, A. & Gunter, B. Corporate Assessment: Auditing a Company's Perso-nality (London: Routledge, 1993).
Gaines, B.R., Shaw, M.L.G., Woordward, J.B. Modeling as Framework forKnowlegde Acquisition Methodologies and Tools. International Journal ofIntelligent Systems (1993), 8: 155-168.
Gazendam, H.W.M. Variety Controls Variety: On the Use of OrganizationTheories in Information Management (The Netherlands, Groningen:Dissertation, 1993).
Hambrick, D.C., & Mason, P.A., Upper Echelons: The Organization as a Reflectionof Its Top Managers, Academy of Management Review (1984), 9: 193-206.
Harrison, M.I., Diagnosing Organizations: Methods, Models, and Processes(Newbury Park: Sage, 1987).
Hildebrand, D.K., Laing, J.D., Rosenthal, H. Prediction Analysis of CrossClassifications. (U.S.A., New York: John Wiley & Sons, 1977).
Hitt, M., Tyler, B., Strategic Decision Models: Integrating different perspectives,Strategic Management Journal (1991), 12: 327-352.
Hofstede, G., Neuijen, B., Ohayv, D.D. & Sanders, G. Measuring OrganizationalCultures: A Qualitative and Quantitative Study Across Twenty Cases. Admini-strative Science Quarterly (1990), 35: 286-316.
Hooley, G.J., The Implementation of Strategic Marketing Planning Techniques inBritish Industry, International Journal of Research in Marketing (1984), 153-162.
Howard, A., & Associates. Diagnosis for Organizational Change; Methods &Models. (New York/London: The Guilford Press, 1994).
Huber, G.P. Decision Support Systems: Their Present Nature and FutureApplications. In: Ungson, G.R. & Braunstein, D.N. (eds.), Decision Making: anInterdisciplinary Inquiry (Boston: Kent Publ. Company, 1982).
Huber, G.P. A Theory of the Effects of Advanced Information Technologies onOrganizational Design, Intelligence, and Decision Making. Academy of Manage-ment Review (1990), 15 (1): 47-71.
Hundman, R., Meeberg, D. van de & Verstegen, M.F.G.M. Expertsystemen enOrganisatiediagnose (Expert Systems and Organizational Diagnosis). M en O(1990), 44: 529-543.
24
Jong, C.M. de, Huizingh, K.R.E., Oude Ophuis, P.A.M., Wierenga, B., Kritischesuccesfactoren voor marketing decision support systemen (critical successfactors for marketing decision support systems) (Delft: Eburon, 1994).
Kaplan, R.S., Norton, D.P. Linking the Balanced Scorecard to Strategy. CaliforniaManagement Review (1996), Vol.39, No.1: 53-79.
Kazanjian, R.K. & Drazin, R, An Empirical Test of a Stage of Growth ProgressionModel, Management Science (1989), 35 (12): 1489-1503.
Keen, P.G.W. Information Systems and Organizational Change. In: Communicati-ons of the ACM (1981), 24 (1): 24-33.
Keen, P.G.W. Decision Support Systems: The Next Decade. Decision SupportSystems (1987), 3: 253-265.
Kimberley, J.R. & Evanisko, M.J., Organizational Innovation: The Influence ofIndividual, Organizational, and Contextual factors on Hospital Adoption ofTechnological and Administrative Innovations, Academy of ManagementJournal (1981), 24 (4): 689-713.
Leavitt, H.J. Applying Organizational Change in Industry: Structural, Technologicaland Humanistic Approaches. In March, J.G. (Ed.), Handbook of Organizations(Illinois, Chicago: Rand McNally, 1965).
Leeflang, P.S.H. & Beukenkamp, P.A., Probleemgebied Marketing, eenManagement-benadering, (Leiden: Stenfert Kroese, 1987).
Little, J.D.C., Models and Managers, The Concept of a Decision Calculus.Management Science (1970), 16:8, B466-484.
Masuch, M. & LaPotin, P. Beyond Garbage Cans: An AI Model of OrganizationalChange. Administrative Science Quarterly (1989), 34: 38-67.
McNurlin, B.C., Sprague, R.H., Information Systems Management in Practice.(Englewood Cliffs: Prentice-Hall, 1989).
Mentzer, J.T., Cox, J.E, Familiarity, Application and Performance of SalesForecasting Techniques, International Journal of Forecasting (1984), 3: 27-36.
Mintzberg, H., The Rise and Fall of Strategic Planning (New York: Prentice Hall,1994).
Nadler, D.A. & Tushman, M.L. A General Diagnostic Model for OrganizationalBehavior: Applying a Congruence Perspective. In: Daft, R.L. & Sharfman, M.P.,Organization Theory: Cases and Applications (St. Paul: West, 1990).
Nicolai, D.J., & Postma, Th.J.B.M., Strategische planning- en voorspellings-methoden in het Nederlandse bedrijfsleven, , Maandblad voor Accountancy enbedrijfshuishoudkunde (1990), 64 (1): 37-45.
Nooteboom, B., Innovation and Diffusion in Small Firms: Theories and Evidence,Small Business Economics (1994), 6: 985-1010.
Norburn, D. & Birley, S., The Top Management Team and Corporate Performance,Strategic Management Journal (1988), 9: 225-237.
25
Oral, M., A DSS design framework for competitive strategy formulation. EuropeanJournal of Operational Research (1987), 28: 132-145.
Peters, T. & Waterman, R. In Search of Excellence (New York: Harper & Row,1982).
Ruohonen, M. & Salmela, H. From Control to Consultation: An OrganizationalDSS for the Inspector Work. In Jelassi, T., Klein, M.R. & Mayon-White, W.M.(Eds.), Decision Support Systems: Experiences and Expectations (Amsterdam:North-Holland, 1992), 167-181.
Russo, J.E., Schoemaker, P.J.H., Decision Traps (New York: Simon & Schuster,1989).
Sanders, G.L., Courtney, J.F. A Field Study of Organizational Factors InfluencingDSS Success. MIS Quarterly (1985), March, 77-89.
Shaw, M.L.G., Woodward, J.B. Modeling Expert Knowledge. Knowledge Acquisi-tion (1990), 2: 179-206.
Taylor, R.N., Age and Experience as Determinants of Managerial InformationProcessing and Decision Making Performance, Academy of ManagementJournal (1975), 18 (1): 74-81.
Tichy, N.M. Managing Strategic Change: Technical, Political and CulturalDynamics (New York: John Wiley, 1983).
Tulp, J.J.M. Organisatiedoorlichting van basiseenheden binnen de politie met behulpvan een kennissysteem (Organizational Diagnosis of Operational Police UnitsUsing a Knowledge Based System). In: Van der Spek, B.R. & Hoog, R. de(Eds.), Proceedings Kennistechnologie '92; De Praktijk: toepassingen,methoden, technieken; Operationele toepassingen (Den Haag: StamTijdschriften, 1992), 39-50,
Verhage, B.J., Waarts, E., Marketing Planning for Improved Performance: AComparative Analysis, International Marketing Review (1988), 20-30.
Vickers, G., The Art of Judgement, (Harper & Row, 1983).Volonino, L., Robinson, S., Watson, H.J. EIS and Organizational Change. Decision
Support Systems: Experiences and Expectations (North-Holland: ElsevierScience Publishers B.V., 1992).
Weisbord, M.R. Organizational Diagnosis: a Workbook of Theory and Practice(Mass, Reading: Addison-Wesley, 1978).
Weisbord, M.R. Productive Workplaces: Organizing and Managing for Dignity,Meaning, and Community (San Francisco: Jossey-Bass, 1987).
Weisbord, M.R. Diagnosing Your Organization: Six Places to Look for Troublewith or without Theory. In Golembiewski, R.T. (Ed.), Handbook of Organizatio-nal Consultation (Marcel Dekker: New York, 1993), 753 - 773.
Wichard, G.M. Interimmanagement. Dissertation. (The Netherlands, Assen: VanGorcum, 1994).

26
Wiersema, M.F. & Bantel, K., Top Management Team Demography and CorporateStrategic Change, Academy of Management Journal (1992), 35 (1): 91-121.
Zenger, T.R. & Lawrence, B.S., Organizational Demography: The DifferentialEffects of Age and Tenure Distribution on Technical Communication, Academyof Management Journal (1989), 32: 353-376.
27
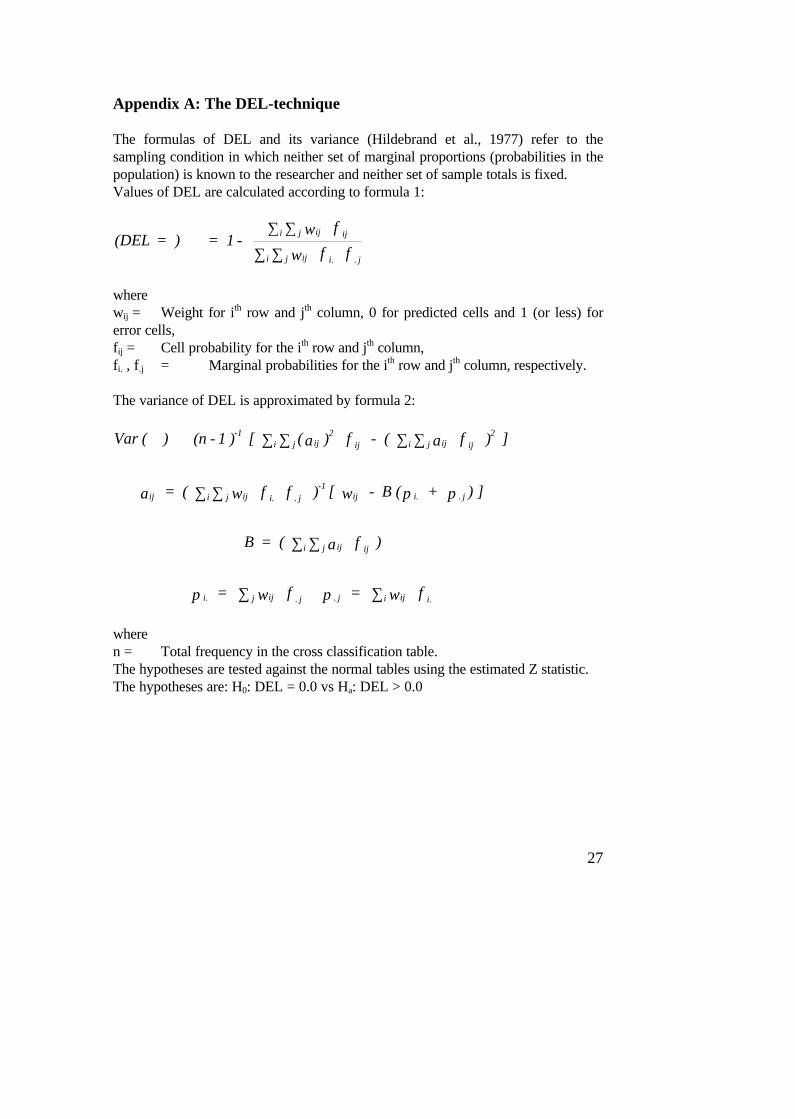
Appendix A: The DEL-technique
The formulas of DEL and its variance (Hildebrand et al., 1977) refer to thesampling condition in which neither set of marginal proportions (probabilities in thepopulation) is known to the researcher and neither set of sample totals is fixed.Values of DEL are calculated according to formula 1:
(DEL = ) = 1 - w f
w f f
i j ij ij
i j ij i. . j
∇ ∑ ∑
∑ ∑
wherewij = Weight for ith row and jth column, 0 for predicted cells and 1 (or less) forerror cells,fij = Cell probability for the ith row and jth column,fi. , f.j = Marginal probabilities for the ith row and jth column, respectively.
The variance of DEL is approximated by formula 2:
Var ( ) (n - 1 ) [ ( a ) f - ( a f ) ]
a = ( w f f ) [ w - B ( + ) ]
B = ( a f )
= w f = w f
-1i j ij
2ij i j ij ij
2
ij i j ij i. . j-1
ij i. . j
i j ij ij
i. j ij . j . j i ij i.
∇ ≅ ∑ ∑ ∑ ∑
∑ ∑
∑ ∑
∑ ∑
π π
π π
wheren = Total frequency in the cross classification table.The hypotheses are tested against the normal tables using the estimated Z statistic.The hypotheses are: H0: DEL = 0.0 vs Ha: DEL > 0.0

28
In this research the hypotheses consist of 0s and 1s which implies that the numeratorof the expression of DEL has a binomial distribution. The probability distribution ofDEL which is a linear function of the numerator is also binomial. A rule of thumbfor using the normal approximation of the binomial distribution safely with small- ormoderate-sized samples is presented by formula 3:
5n
( w f ) 1 - 5ni j ij ij≤ ∑ ∑ ≤
To improve the quality of the normal approximation of the binomial situation acontinuity correction is used. The corrected expression is represented by formula 4:
est.Z = [ est.var ( ) ]
= 1 - ( w f ) +
0,5
n w f f
+
1/ 2
+i j ij ij
i j ij i. . j
∇∇
∇∑ ∑
∑ ∑
29
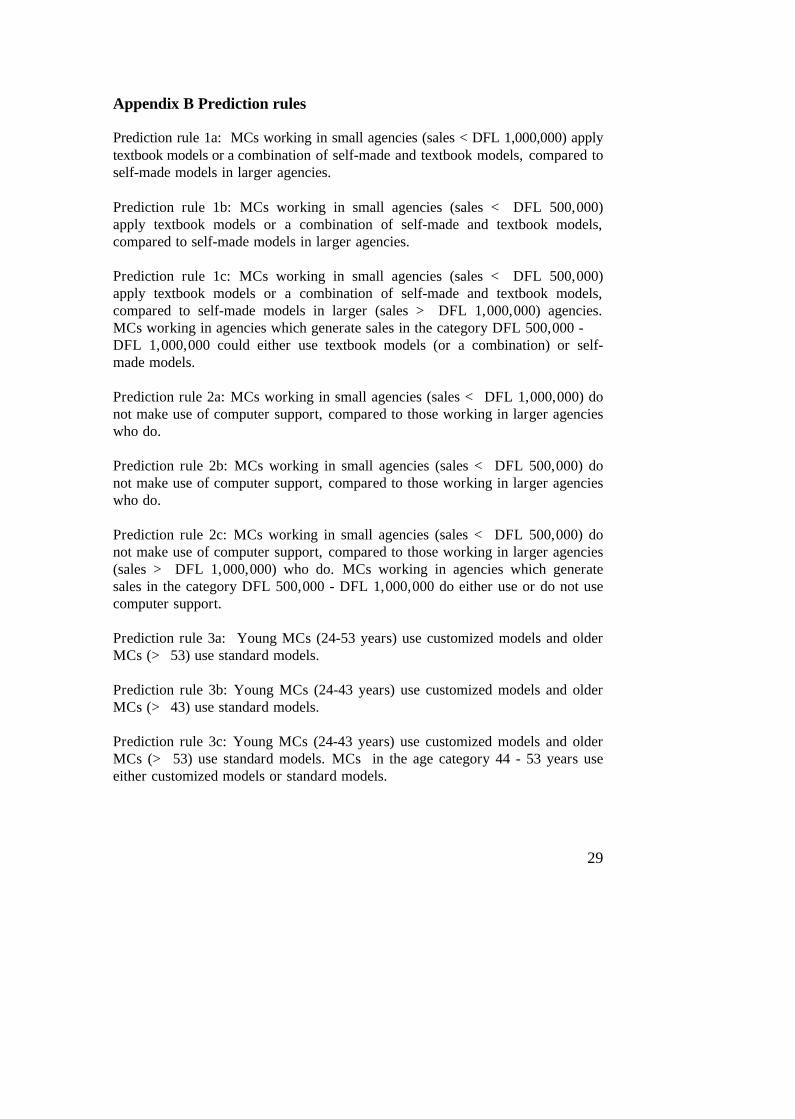
Appendix B Prediction rules
Prediction rule 1a: MCs working in small agencies (sales < DFL 1,000,000) applytextbook models or a combination of self-made and textbook models, compared toself-made models in larger agencies.
Prediction rule 1b: MCs working in small agencies (sales < DFL 500,000)apply textbook models or a combination of self-made and textbook models,compared to self-made models in larger agencies.
Prediction rule 1c: MCs working in small agencies (sales < DFL 500,000)apply textbook models or a combination of self-made and textbook models,compared to self-made models in larger (sales > DFL 1,000,000) agencies.MCs working in agencies which generate sales in the category DFL 500,000 -DFL 1,000,000 could either use textbook models (or a combination) or self-made models.
Prediction rule 2a: MCs working in small agencies (sales < DFL 1,000,000) donot make use of computer support, compared to those working in larger agencieswho do.
Prediction rule 2b: MCs working in small agencies (sales < DFL 500,000) donot make use of computer support, compared to those working in larger agencieswho do.
Prediction rule 2c: MCs working in small agencies (sales < DFL 500,000) donot make use of computer support, compared to those working in larger agencies(sales > DFL 1,000,000) who do. MCs working in agencies which generatesales in the category DFL 500,000 - DFL 1,000,000 do either use or do not usecomputer support.
Prediction rule 3a: Young MCs (24-53 years) use customized models and olderMCs (> 53) use standard models.
Prediction rule 3b: Young MCs (24-43 years) use customized models and olderMCs (> 43) use standard models.
Prediction rule 3c: Young MCs (24-43 years) use customized models and olderMCs (> 53) use standard models. MCs in the age category 44 - 53 years useeither customized models or standard models.
30
Prediction rule 4a: Young MCs (24-53 years) make use of computer support andolder MCs (> 53) do not.
Prediction rule 4b: Young MCs (24-43 years) make use of computer support andolder MCs (> 43) do not.
Prediction rule 4c: Young MCs (24-43 years) make use of computer support andolder MCs (> 53) do not. MCs in the age category 44 years - 53 years eitheruse or do not use computer support.
Prediction rule 5a: MCs with intermediate or higher vocational education usetextbook models or a combination of self-made and textbook models, and MCswith university education use self-made models.
Prediction rule 5b: MCs with intermediate vocational education use textbookmodels or a combination of self-made and textbook models, and MCs withhigher vocational education or university education use self-made models.
Prediction rule 5c: MCs with intermediate vocational education use textbookmodels or a combination of self-made and textbook models, and MCs withuniversity education use self-made models. MCs with higher vocationaleducation use either textbook models (or a combination) or self-made models.
Prediction rule 6a: MCs with intermediate or higher vocational education usestandard models and MCs with a university degree use customized models.
Prediction rule 6b: MCs with intermediate vocational education use standardmodels and MCs with higher vocational education or university degree usecustomized models.
Prediction rule 6c: MCs with intermediate vocational education use standardmodels and MCs with university degree use customized models. MCs withhigher vocational education either use standard models or customized models.
Prediction rule 7a: MCs with intermediate vocational or higher vocationaleducation do not make use of computer support, compared to MCs with auniversity degree who do.
Prediction rule 7b: MCs with intermediate vocational education do not make useof computer support, compared to MCs with a higher vocational education or auniversity degree who do.
31
Prediction rule 7c: MCs with intermediate vocational education do not make useof computer support, compared to MCs with a university degree who do. MCswith higher vocational education do either use or do not use computer support.
Prediction rule 8: MCs specialized in economics, business administration,sociology and psychology use textbook models or a combination of self-madeand textbook models compared to MCs specialized in information sciences,technical sciences, law, and public administration who use self-made models.
Prediction rule 9: MCs specialized in economics, business administration,sociology and psychology use customized models compared to MCs specializedin information sciences, technical sciences, law, and public administration whouse standard models.
Prediction rule 10a: MCs with 1-15 years of work experience use textbookmodels or a combination self-made and textbook models, compared to MCs with> 15 years of work experience who use self-made models.
Prediction rule 10b: MCs with 1-10 years of work experience use textbookmodels or a combination self-made and textbook models, compared to MCs with> 10 years of work experience who use self-made models.
Prediction rule 10c: MCs with 1-10 years of work experience use textbookmodels or a combination self-made and textbook models, compared to MCs with> 15 years of work experience who use self-made models. MCs with 11 - 15years of work experience either use textbook models (or a combination) or self-made models.
Prediction rule 11a: MCs with 1-15 years of work experience use standardmodels compared to MCs with > 15 years work experience who use customizedmodels.
Prediction rule 11b: MCs with 1-10 years of work experience use standardmodels compared to MCs with > 10 years work experience who use customizedmodels.
Prediction rule 11c: MCs with 1-10 years of work experience use standardmodels compared to MCs with > 15 years work experience who use customizedmodels. MCs with 10 - 15 years of work experience either use standard modelsor customized models.

32
Prediction rule 12a: MCs with 1-15 years of work experience do not make use ofcomputer support, compared to MCs with > 15 years of work experience whodo not use computer support.
Prediction rule 12b: MCs with 1-10 years of work experience do not make use ofcomputer support, compared to MCs with > 10 years of work experience whodo not use computer support.
Prediction rule 12c: MCs with 1-10 years of work experience do not make use ofcomputer support, compared to MCs with > 15 years of work experience whodo not use computer support. MCs with 10-15 years of work experience doeither use or do not use computer support.