Embed Size (px)
Citation preview

FACTORS INFLUENCING THE EFFECTIVENESS OF
ENTERPRISE RISK MANAGEMENT (ERM) IN PUBLIC
LISTED COMPANIES
SALINAH HAJI TOGOK
THESIS SUBMITTED IN FULFILMENT OF THE
REQUIREMENTS FOR THE DEGREE OF DOCTOR OF
PHILOSOPHY
FACULTY OF BUSINESS AND ACCOUNTANCY
UNIVERSITY OF MALAYA
KUALA LUMPUR
2016

ii
UNIVERSITI MALAYA
ORIGINAL LITERARY WORK DECLARATION
Name of Candidate : Salinah Binti Haji Togok
Registration/Matric No. : CHA 120017
Name of Degree : Doctor of Philosophy
Title of Project Paper/Research Report/Dissertation/Thesis (“this Work”): Factors
Influencing the Effectiveness of Enterprise Risk Management (ERM) in Public
Listed Companies
Field of Study : Risk Management
I do solemnly and sincerely declare that:
(1) I am the sole author/writer of this Work;
(2) This Work is original;
(3) Any use of any work in which copyright exists was done by way of fair dealing
and for permitted purposes and any excerpt or extract from, or reference to or
reproduction of any copyright work has been disclosed expressly and
sufficiently and the title of the Work and its authorship have been acknowledged
in this Work;
(4) I do not have any actual knowledge nor do I ought reasonably to know that the
making of this work constitutes an infringement of any copyright work;
(5) I hereby assign all and every rights in the copyright to this Work to the
University of Malaya (“UM”), who henceforth shall be owner of the copyright
in this Work and that any reproduction or use in any form or by any means
whatsoever is prohibited without the written consent of UM having been first
had and obtained;
(6) I am fully aware that if in the course of making this Work I have infringed any
copyright whether intentionally or otherwise, I may be subject to legal action or
any other action as may be determined by UM.
Candidate’s Signature Date:
Subscribed and solemnly declared before,
Witness’s Signature (1) Date:
Name:
Designation:

iii
ABSTRACT
Using the theory of contingency as the anchor theory alongside the theories of power
and empowerment, the current study seeks to investigate into the level of enterprise risk
management (ERM) maturity among public listed companies and thereafter the
relationship between organisational factors and actors on the perceived effectiveness of
ERM in managing risks. In addition, this study aims to examine the mediating influence
of tone from the top and the moderating influence of chief risks officer (CRO) and ERM
unit. Consistent with earlier propositions, data from 144 Malaysian public listed
companies shows significant direct associations between tone from the top, culture and
enterprise system with ERM effectiveness in managing risks. There is also evidence of
partial mediating influence of tone from the top on the relationship between culture and
ERM effectiveness as well as between enterprise systems and ERM effectiveness.
However, data from the survey shows no evidence of direct link between structure and
ERM effectiveness. Neither is there any statistically significant relationship between
strategic role of ERM Champion and ERM effectiveness nor employee involvement and
ERM effectiveness. Additionally, findings indicate that the presence of CRO has
moderating influence on the relationship between tone from the top and ERM
effectiveness. In contrast, the establishment of a separate ERM unit shows no
moderating effects at all on the relationship between the variables in the study and the
effectiveness of ERM in managing risks. Further examination using qualitative
approach of semi-structured interviews and the content analysis of publicly available
data suggests that lack of power and empowerment as the possible explanation for such
non-association.

iv
ABSTRAK
Berdasarkan teori kontingensi sebagai teori utama dengan disokong oleh teori kuasa dan
pemberian kuasa, kajian ini melihat tahap kematangan perusahaan perngurusan risiko
(ERM) di kalangan syarikat-syarikat tersenarai awam di Malaysia dan menyiasat
persepsi keberkesanan ERM. Kajian ini juga mengkaji peranan faktor organisasi dan
kemanusiaan ke atas keberkesanan ERM dalam menguruskan risiko. Selain itu, kajian
ke atas pengaruh nada dari pihak atasan sebagai mediator serta pengaruh moderator
daripada Ketua Pegawai Risiko (CRO) dan unit ERM juga termasuk di dalam skop
penyelidikan ini. Selaras dengan ramalan sebelum ini, data daripada 144 responden kaji
selidik menunjukkan bahawa, ada hubungan langsung yang signifikan antara nada dari
pihak atasan, budaya dan sistem perusahaan teknologi dengan keberkesanan ERM
dalam menguruskan risiko. Terdapat juga bukti separa pengaruh mediator nada dari
pihak atasan ke atas hubungan antara budaya dan keberkesanan ERM serta antara sistem
perusahaan technology dan keberkesanan ERM. Walau bagaimanapun, hasil kajian
menunjukkan tiada bukti hubungan langsung antara struktur dan keberkesanan ERM.
Walaubagaimanapum, tiada hubungan statistik yang signifikan antara peranan strategik
Juara ERM dan keberkesanan ERM mahupun penglibatan pekerja dan keberkesanan
ERM. Hasil kajian juga menunjukkan bahawa kehadiran CRO mempunyai pengaruh
moderator ke atas hubungan antara nada dari pihak atas dan keberkesanan ERM.
Sebaliknya, penubuhan unit Pengurusan Risiko tidak menunjukkan kesan moderator
pada hubungan antara faktor yang dikaji dengan keberkesanan ERM dalam
menguruskan risiko. Pemeriksaan lanjut secara kualitatif iaitu temu bual separa
berstruktur dan analisis kandungan dokumen umum menunjukkan bahawa kekurangan
kuasa dan pemberian kuasa boleh menerangkan ketiadaan hubungan tersebut.

v
ACKNOWLEDGEMENTS
In the name of Allah, the Most Merciful and the Most Compassionate. Praises to Allah
Almighty for the perseverance and strength granted upon me. After years of hardwork,
struggles yet fulfilling journey, I am able to present this piece of work, finally. In the
process, I encountered many individuals of various kinds - those who in their own
special ways have made the journey profoundly fascinating as well as enduring. You
know who you are, and I wish to thank all of you.
Without belittling the importance of others, there are also those whom I need to
mention. First of all, this work is the product of many long discussions and
consultations with my supervisors, Prof Dr Che Ruhana and Dr Suria who have been
very supportive, encouraging and understanding. My deepest appreciation goes to my
mother, Fatimah Zainah, who has been the GRANDmother cum governess to my
children as I get immersed in my research. Hugs and kisses to my angelic brood,
Aisyah, Amirah, Ameer, Ammar, and my PhD baby, Arifah -thank you for being the
sweetest challenges to the completion of this thesis. Of utmost importance is my
significant other, Tahir without whom, this piece of work is almost impossible. Thank
you for being by my side throughout the struggles.
If ever this piece of work is useful to the body of knowledge, it would owe its credit to
these special individuals, families and friends who have always been close as I sail and
manoeuvre along the curvy journey. For all your support, understanding, guidance, and
unconditional never-ending love, allow me to present this humble work to all of you.

vi
TABLE OF CONTENTS
ABSTRACT iii
ABSTRAK iv
ACKNOWLEDGMENTS v
TABLE OF CONTENTS vi
LIST OF FIGURES x
LIST OF TABLES xi
LIST OF ABBREVIATIONS xiii
LIST OF APPENDICES xiv
CHAPTER 1 INTRODUCTION………………………………………………...……1 1.1 Background of Study ............................................................................................. 1 1.2 Motivation of the Study ......................................................................................... 4 1.3 Statement of the Problem ...................................................................................... 7 1.4 Research Questions and Objectives .................................................................... 10
1.5 Contributions of the Study .................................................................................. 13 1.6 Scope of the Study ............................................................................................... 19
1.7 Research Methodology ........................................................................................ 20 1.8 Thesis Structure ................................................................................................... 22
CHAPTER 2 LITERATURE REVIEW…….…………………….…...…………...24 2.1 What is ERM? ..................................................................................................... 24
2.2 The Evolution of Risk Management and ERM ................................................... 32
2.3 ERM Regulatory Framework .............................................................................. 35
2.4 Malaysian Regulatory Landscape on Risk Management .................................... 40 2.5 Past Studies ......................................................................................................... 42 2.6 Factors Influencing the Effectiveness of ERM in managing risks….. ................ 51
2.6.1 Contingent Variables ............................................................................. 51
2.6.1.1 OganisationalCulture……………..………………….…….…....51 2.6.1.2 Organisational Structure.............................................................53 2.6.1.3 Enterprise Systems……………….....……………………........54 2.6.1.4 Strategic Role of ERM Champions ........................................... 56 2.6.1.5 Employee Involvement ............................................................. 58
2.6.2 Contingent and Mediating Variable – Tone from the Top ..................... 59 2.6.3 Moderating Variable – Presence of CRO and a Separate ERM Unit ..... 60 2.6.4 Dependent Variable – Perceived ERM Effectiveness ………………...61 2.6.5 Control Variable – Regulatory Environment, Size and ERM
Adoption Status……………………………………..…………………63 2.7 Research Gap………………………………………………...…….……………..64 2.8 Summary…………………………………………………………….……………67

vii
CHAPTER 3 CONCEPTUAL FRAMEWORK AND HYPOTHESIS
DEVELOPMENT………………………………………………………….…….70 3.1 Introduction……………………………………………………………………...70 3.2 Common Theoretical Framework in ERM Research............................................70 3.3 Theoretical Framework for Current Research………………………....…….…..74 3.4 Conceptual Framework………………………………………………………….80
3.5 Development of Hypotheses…………………………………………….………82 3.5.1 Organisational Culture............………..…………………....…….……..82 3.5.2 Organisational Structure…………...……………………….……..……84 3.5.3 Enterprise Systems (ES)………………………………...…..…….……86 3.5.4 Tone from the Top……………………………………………….….….89
3.5.5 The Strategic Role of ERM Champion……………………...….……....91 3.5.6 Employee Involvement……………………...…………...……………..92
3.5.7 Mediating and Moderating Variables…...………………...…..……..…94
3.5.7.1 Influence of Tone from the Top………..……………...………..94
3.5.7.2 Moderating Influence of the CRO and an ERM unit ................. 96
3.6 Control Variables ................................................................................................ 98 3.6.1 Regulatory Environment and Size ........................................................... 98 3.6.2 ERM Adoption Status ........................................................................... 100
3.7 Summary ........................................................................................................... 100
CHAPTER 4 RESEARCH DESIGN AND
METHODOLOGY……………………………………………….………….....101 4.1 Introduction ....................................................................................................... 101 4.2 Research Design – Mixed Method Approach ................................................... 101
4.3 Data Collection Procedures ............................................................................... 104 4.4 Quantitative Design ........................................................................................... 107
4.4.1 Respondents to the Online Questionnaire .............................................. 107 4.4.2 Questionnaire Design ............................................................................. 109 4.4.3 Pre-tests and Pilot Tests ........................................................................ 110
4.4.4 Operationalisation of the Research Variables ....................................... 111
4.4.4.1 Contingent Variables ................................................................ 112 4.4.4.2 Dependent Variable – Perceived ERM Effectiveness .............. 126 4.4.4.3 Moderating Variables – Presence of CRO and a Separate
ERM Unit..................................................................................132
4.4.4.4 Control Variables – Regulatory Environment, Size and ERM
Adoption...................................................................................133 4.5 Qualitative Design ............................................................................................... 133
4.5.1 Interview Participants ............................................................................... 134 4.5.2 Interview Guide ........................................................................................ 134
4.6 Mode of Data Analysis ........................................................................................ 135 4.6.1 Data from Quantitative Design ................................................................. 135
4.6.1.1 Coding and Labelling .................................................................. 135
4.6.1.2 Preliminary Data Analysis .......................................................... 136 4.6.1.3 Hypotheses Testing ..................................................................... 137 4.6.1.4 Partial Least Squares (PLS) Analysis ......................................... 138
4.6.2 Data from Qualitative Design .................................................................... 140
4.7 Summary .............................................................................................................. 140

viii
CHAPTER 5 FINDINGS AND DISCUSSION ....................................................... 145 5.1 Introduction ....................................................................................................... 142
5.2 Results of the Quantitative Tail – Online Survey Campaign ............................ 143 5.2.1 Analysis of Respondents ..................................................................... 143 5.2.2 Analysis of Response Bias .................................................................. 144 5.2.3 Preliminary Analysis of Data ............................................................. 145
5.2.3.1 Demographic Profile of Respondents .................................... 145 5.2.3.2 ERM Profile of Respondents ................................................. 146 5.2.3.3 Descriptive Statistics of the Variables .................................... 149
5.2.4 Analysis between Groups (T-test and ANOVA) ................................. 151 5.2.4.1 T-tests ..................................................................................... 151
5.2.4.2 ANOVA ................................................................................. 155 5.2.5 Common Method Bias ......................................................................... 156 5.2.6 Systematic Evaluation of PLS Measurement Model ........................... 158 5.2.7 Assessing PLS_SEM Results of the Structural Model ........................ 170
5.2.7.1 Hypotheses Testing ................................................................ 171
5.2.7.2 The Overall Model ................................................................. 175 5.2.7.3 Test of Mediation ................................................................... 177 5.2.7.4 Test of Moderation ................................................................. 179
5.2.8 Summary of Results ............................................................................ 180 5.3 Research Questions and Objectives for the Qualitative Tail of the Study ........ 185 5.4 Results of the Qualitative Tail – Content Analysis and Interviews .................. 187
5.4.1 Background Information .................................................................... 188 5.4.2 Profile of the Interview Participants’ Companies .............................. 189 5.4.3 Profile of the Interview Participants ................................................... 190
5.4.4 Findings from the Qualitative Data .................................................... 192 5.4.4.1 ERM Practices and its Effectiveness Within Organisations .. 192
5.4.4.2 Factors Which Can Influence Perceived ERM Effectiveness 194 5.4.4.3 The Strategic Role of ERM Champion and ERM
Effectiveness ......................................................................... 197
5.4.4.4 Employee Involvement and ERM Effectiveness……..…..…201
5.5 Summary ........................................................................................................... 205
CHAPTER 6 DISCUSSION AND CONCLUSIONS……………………………....210 6.1 Introduction ....................................................................................................... 207
6.2 Discussions of Findings .................................................................................... 208 6.2.1 Summary of Hypotheses ................................................................... ..210 6.2.2 Research Objectives (Quantitative and Qualitative) Revisited ........... 214
6.2.2.1 Research Objective 1............................................................... 215 6.2.2.2 Research Objective 2............................................................... 218
6.2.2.3 Research Objective 3............................................................... 218 6.2.2.4 Research Objective 4............................................................... 225 6.2.2.5 Research Objective 5............................................................... 227
6.2.2.6 Research Objective 1 (Qualitative) ......................................... 229 6.2.2.7 Research Objective 2 (Qualitative) ......................................... 230
6.3 Implications of Study ........................................................................................ 230 6.3.1 Knowledge Implications ...................................................................... 230
6.3.2 Practical and Policy Implications ........................................................ 234 6.4 Limitations of Study .......................................................................................... 236 6.5 Suggestions for Future Research ....................................................................... 237
6.6 Conclusions ....................................................................................................... 238

ix
REFERENCES………………………………………………………………………...240
LIST OF PUBLICATIONS AND PAPERS ARE PRESENTED……….………........270

x
LIST OF FIGURES
Figure 1.1: Analysis of Empirical Research Conducted on ERM from 2003 to 2014
Based on Regional Coverage ......................................................................... 6 Figure 2.1: COSO ERM “Cube” Model ......................................................................... 37
Figure 2.2: ISO 31000 – Risk Management.................................................................... 39 Figure 2.3: Main Themes in ERM Research ................................................................... 44 Figure 2.4: Analysis of ERM Empirical Research from 2003 to 2014 by the Research
Methodology used in the Research .............................................................. 48 Figure 3.1: Hierarchical Structure of Different Forms of Contingency Fit used in
Strategy-Management Accounting Systems Research ................................. 78 Figure 3.2: Conceptual Framework................................................................................. 80 Figure 4.1: Structural Model Assessment Procedure .................................................... 139 Figure 5.1: PLS Path Model Estimation ....................................................................... 158
Figure 5.2: Bootstrapping Results ................................................................................. 171 Figure 5.3: High-Low Dimension - Strategic Role of ERM Champion vs ERM
Effectiveness and Employee Involvement vs ERM Effectiveness ............ 189
Figure 6.1: The Research Model of the Study .............................................................. 214

xi
LIST OF TABLES
Table 1.1: Outline of the Research Methodology ........................................................... 21 Table 2.1: ERM Definitions and Descriptions from Academic Publications ................. 27 Table 2.2: ERM Definitions and Descriptions from Standards Setting Organisations,
Industry Publications, Industry Associations, Consulting Firms and Rating
Agencies ....................................................................................................... 29 Table 2.3: Differences between ERM and Traditional Risk Management ..................... 32 Table 4.1: Analysis of ERM Adopters (by Industry) .................................................... 109 Table 4.2: Wallach’s (1983) Model of Organisational Culture .................................... 114
Table 4.3: Instruments Used to Measure Organisational Culture ................................ 116 Table 4.4: Instruments Used to Measure Organisational Structure .............................. 119 Table 4.5: Instruments Used to Measure Enterprise Systems ....................................... 121 Table 4.6: Instruments Used to Measure Tone from the Top ....................................... 122
Table 4.7: Instruments Used to Measure the Strategic Role of ERM Champion ......... 124 Table 4.8: Instruments Used to Measure Employee Involvement ................................ 125 Table 4.9: Instruments Used to Measure Level of ERM adoption ............................... 126
Table 4.10: Instruments Used to Measure ERM Effectiveness Based on ISO 31000 .. 131
Table 4.11: Instruments Used to Measure ERM Effectiveness Based on Objectives .. 132 Table 4.12: Operationalisation of Control Variables .................................................... 133 Table 5.1: Response Rate .............................................................................................. 144
Table 5.2: Test of Non-Response Bias .......................................................................... 145 Table 5.3: Profile of Respondents (n = 156) ................................................................. 146
Table 5.4: ERM Profile of the Respondents (n=156) ................................................... 148 Table 5.5: Descriptive Statistics of the Variables (n=144) ........................................... 151 Table 5.6: T-test Results across Presence of CRO ........................................................ 153
Table 5.7: T-test Results across Separate ERM Unit .................................................... 154 Table 5.8: One-way ANOVA Test Results across Department .................................... 156
Table 5.9: Common Method Bias ................................................................................. 157 Table 5.10: Internal Consistency, Composite Reliability (CR) .................................... 160
Table 5.11: Outer Loadings of all Latent Variables ...................................................... 161 Table 5.12: Average Variance Extracted (AVE) .......................................................... 163 Table 5.13: Composite Reliability (CR) and Average Variance Extracted (AVE) ...... 164 Table 5.14: Cross Loadings of all Indicators ................................................................ 165 Table 5.15: Fornell-Lacker Criterion ............................................................................ 167
Table 5.16: Heterotrait-Monotrait Ratio (HTMT) ........................................................ 167 Table 5.17: Result Summary for Reflective Measurement Model ............................... 168 Table 5.18: Variance Inflation Factor (VIF) Results .................................................... 170
Table 5.19: Hypotheses Testing for Direct Relationship Between the Variables ......... 172 Table 5.20: Results of Direct Effects ............................................................................ 172
Table 5.21: Results of the Direct Effect of the Culture Dimensions ............................ 173
Table 5.22: PLS Algorithm Default Report - Path Coefficients ................................... 176
Table 5.23: Hypothesis for Mediating Relationship Between Variables ...................... 177 Table 5.24: Significance Analysis of Path Coefficients with the Mediator .................. 178 Table 5.25: Variance Accounted For (VAF)................................................................. 178 Table 5.26: Significance Analysis of Path Coefficients with the Mediator .................. 179 Table 5.27: Variance Accounted For (VAF)................................................................. 179 Table 5.28: Hypotheses for Moderating Effect ............................................................. 179 Table 5.29: PLS-MGA Results for Presence of CRO ................................................... 180
Table 5.30: PLS-MGA Results for Separate ERM Unit ............................................... 180

xii
Table 5.31: PLS Algorithm Default Report - Total Effects – Sizes.............................. 181 Table 5.32: Summary of Hypotheses Testing and Findings ......................................... 182
Table 5.33: Profile of the Companies Participating in the Interviews .......................... 190 Table 5.34: Profile of the Interview Participants .......................................................... 191 Table 6.1: Summary of Research Objectives, Hypotheses and Findings ..................... 210 Table 6.2: Comparative Analysis on the Level of ERM Adoption ............................... 216

xiii
LIST OF ABBREVIATIONS
CAS – Casualty Actuarial Society
CB – SEM – Covariance Based – Structural Equation Modelling
CFO – Chief Financial Officer
CIA – Chief Internal Auditor
COSO – Committee of Sponsorship Organisation of the Treadway Commission
CRO – Chief Risk Officer
ES – Enterprise Systems
ERM – Enterprise Risk Management
IIA – Institute of Internal Auditors
ICAEW – The Institute Chartered Accountants in England and Wales
OCI – Organisational Culture Index
OCP – Organisational Culture Profile
OLS - Ordinary Least Squares
PLCs – Public listed companies
PLS-SEM – Partial Least Square – Structural Equation Modelling
RIMS – Risk and Insurance Management Society
S&P – Standards and Poor
TRM – Traditional Risk Management

xiv
LIST OF APPENDICES
Appendix A: Research Process flow……………………..…………….……….……..276
Appendix B: List of Empirical Studies on ERM Published in Academic Journals
from 2003 to 2014 ...............…………………………….……………....278
Appendix C: Summary of ERM Effectiveness Studies ………………..….…………..284
Appendix D: Online Questionnaire……………………………………...……….……286
Appendix E: Interview Protocol…………………………………………………..…...296
Appendix F: Summary of ERM Practices.………………………………………..…...299

1
CHAPTER 1 INTRODUCTION
1.1 Background of Study
The highly dynamic and competitive business landscape in recent times has seen
numerous corporate calamities due to natural and man-made disasters ranging from
floods and earthquakes to frauds and scandals. The increasing dynamics shift risk
management, a discipline that has in the past focused on mostly hazardous insurable
risks, into a new paradigm of discipline.
Organisations worldwide confront new faces of challenges in managing risks
which is beyond what traditional risk management can swallow. On the whole,
deregulation, intense competition, changing consumer demographics, and the “enabling
power” of technology have altered the business landscape, exacerbating the traditional
risks faced by banks while adding new ones (Cornwell, 2001).
As business processes get more and more complex, scope of risks and
uncertainties broadens, leading to increased duplication of efforts in understanding and
managing those risks faced by businesses. For fear that risks and uncertainties are being
overlooked and are not managed appropriately, additional functions and responsibilities
are created which gradually leads to redundancies, inefficiencies and eventually
increase in costs and time affecting the bottom-line of the entities (Nocco & Stulz,
2006).
Additionally, those involved in managing risks find it more and more difficult to
cope with the increasing of risks and uncertainties. They lack the necessary capabilities
to withstand the increased volume of information around the various sources of risks,
and the multidisciplinary nature of the problems associated with them – which go well
beyond what one can handle.

2
The changing landscape, coupled with the increasing dynamics, both external and
internal, warrant a paradigm shift in the companies’ approach towards risk management.
Instead of looking at risks from a silo-based perspective, businesses now look at risks
more holistically – hence the birth of a new terminology in the risk management field
called Enterprise Risk Management (ERM) (Connair, 2013).
ERM considers and manages all sources of risk, regardless of the type. According
to Banham (2004), ERM is a rigorous and integrated approach where companies assess
and address all types of risks from all sources within an organisation engaging everyone
within the entire organisation, starting from the very top, at the management level, right
down to the very bottom employees. It involves managing the risk of a potential loss
(downside) as well as the opportunity (upside) created from a systematic risk. It
addresses not just hazard risk, but also financial, strategic and operational risks – all in a
single portfolio of risk.
The alignment and integration of the risk functions across organisations helps to
ensure the best possible risk mitigation strategies and coverage to manoeuvre against
duplications and ‘blindspots’. ERM enables companies to manage their risks more
effectively, efficiently and holistically, focusing on significant ones to analyse core risk
management competencies and evaluating how to best utilise the limited resources
whilst achieving their business objectives without neglecting completely the trivial
ones. Having risks under control gives companies the flexibility and agility to survive
competitively.
Since its introduction, ERM is fast gaining in popularity and interest from the
industry and regulators. The Harvard Business Review listed ERM as one of the
“breakthrough ideas for 2004” (Buchanan, 2004). In parallel, various bodies and
agencies in the likes of rating agencies, professional associations, legislative bodies,

3
regulators, stock exchanges, international standards organisations and consultants have
vigorously issued standards, guidance and frameworks for ERM implementation in their
quest to encourage firms to adopt ERM (Arena, Arnaboldi, & Azzone, 2010).
In more developed counterpart countries, regulations on ERM are much more
matured and advanced as compared to less developed ones. In the US, the ERM
framework published by the Committee of Sponsorship Organisation of the Treadway
Commission (COSO) 2004 has been suggested to become a world level template for
best practice in ERM (Power, 2007). COSO is a coalition of the main accounting and
finance trade associations in the United States and formed in the light of concerns about
fraudulent financial reporting in the mid-1980s. The sponsors of COSO include: The
American Institute of Certified Public Accountants; the Institute of Internal Auditors;
the Financial Executives International, the Institute of Management Accountants and the
American Accounting Association. ERM is also guided by ISO 31000 which is claimed
to be the first globally accepted standard on the practice of risk management (Purdy,
2010).
In the Asia Pacific region, ERM was first formalised as a framework in 1995 by
the joint Australian/New Zealand Standard for Risk Management (AS/NZS 4360, 1995)
and later on, in 2004 became New Zealand Standard for Risk Management (AS/NZS
4360, 2004) as a guide to ERM practices.
Here in Malaysia, Bursa Malaysia issued the Statement on Risk Management &
Internal Control (Guideline for Directors of Listed Issuers) in 2013. Bursa Malaysia is
an exchange holding company and a fully-integrated exchange of listed companies in
Malaysia, offering the complete range of exchange-related services including trading,
clearing, settlement and depository. The 2013 Guidelines superseded the Statement on
Internal Control (Guidance for Directors of Public Listed Companies) issued in 2000.

4
The distinction between the Guidelines, pre- and post-2013 is that prior to 2013, the
emphasis was solely on internal controls whereas post-2013, the Guidelines added
another emphasis of ensuring appropriate and sound risk management practices are in
place (Bursa Malaysia, 2013).
1.2 Motivation of the Study
“The security provided by ERM is at best limited to certain states of the
world and at worst it is illusory – the risk management of nothing.”
(Power, 2009, p. 849)
The inspirations to undertake this research is mainly sparked by the above
statement by Professor Michael Power, a scholar in the field of risk management.
Risk management is too often treated as a ‘tick box exercise’. Despite all the hype
surrounding it and resources invested in it, very few people believe in its effectiveness
in managing risks (Bromiley, McShane, Nair, & Rustambekov, 2015) and many even
question the need for its existence.
The recent financial crisis is seen as many as a failure of modern risk management
actually aimed at preventing the worst consequences of risks. This failure to effectively
manage risks especially in time of dire need, has subjected risk management practices to
sharp criticism post-crisis (Lewis, 2008; Millo & MacKenzie, 2009; Sorkin, 2010). The
lack of understanding of what is involved in implementing and managing a workable,
effective and successful ERM (Kasim, Abdul Aziz, & Kasim, 2011) could be as much
to be blamed for the failure of ERM.
After almost two decades of its introduction, businesses and scholars are still
skeptical about the effectiveness of ERM in managing risks. In his lecture at the

5
ICAEW’s Chartered Accountants’ Hall on 23 June 2004, Professor Power submits that
globalisation and the changing landscape has revolutionalise the nature and sources of
risks and uncertainties faced by businesses warranting the need to manage the “risk of
everything” (Power, 2004) which impeccably refers to ERM. However a few years
after, in 2009, Professor Michael Power questioned the effectiveness of ERM in
managing everything and instead viewed this new approach to risk management as the
symptoms “of where we have been rather than the cure for the future” (Power, 2009).
He goes on to claim that ERM is the “risk management of nothing” (Power, 2009).
This critical view is further fuelled by series of natural and man-made catastrophic
events in the start of 21st century, such as the attacks on the World Trade Center, the
earthquake in Japan in 2011, thereafter the radiation leakage at Fukushima Nuclear
Power Plant, flash floods in Bangkok in 2011, the 2012 crisis in the Eurozone, Greece’s
bankruptcy, etc.
Corporate collapses which led to economic crisis and recession have been
attributed partly to risk management deficiencies. It was further argued that the greatest
risk to an organisation is the lack of an effective ERM programme itself, on the basis
that an ineffective ERM programme will only lead to weak performance and eventually
fall into crisis (Heng, Jifeng, & Jared, 2011; Aebi, Sabato, & Schmid, 2012).
Without doubt, an effective ERM is key to reaping its benefits. Nocco and Stulz
(2006) suggests that ERM adds value by ensuring that all material risks and risk-return
tradeoffs are thoroughly and deliberately evaluated by managers and employees
throughout the firm.
ERM effectiveness has always been the essence of COSO ERM Framework
(2004) and ISO 31000 – Risk management Principles and Guidelines (2009), the two
most widely recognized risk management frameworks in use today. It is said that the

6
COSO (2004) framework has at least 100 principles of an effective ERM system
(Schanfield, 2009). Similarly, the risk framework issued under ISO 31000 stipulates the
11 principles for an effective ERM.
60%
29%
5%6%
US, UK, Canada, Germany,North America and otherEuropean countries
Asia
MiddleEast Countries
Others
Figure 1.1: Analysis of Empirical Research Conducted on ERM from 2003 to 2014
Based on Regional Coverage
The statement by Power (2009) that ERM is only operational in certain parts of
the world can be rationalised based on the account of the existing empirical studies
conducted in ERM between the period of 2003 to 2014 whereby 60% of these studies
were conducted in the developed countries like the US, UK, Germany, etc. (see Figure
1.1).
Such heavyweight from certain parts of the world leaves us with little room to
refute as well as imply a couple of possibilities. First, one may be led to believe that
ERM is more mature in the developed countries and second, the security of ERM only
applies to developed markets.
In sum, the above doubts surrounding ERM effectiveness in managing risks and
the lack of empirical evidence to support the position of ERM effectiveness, in

7
particular based on the experience from developing markets, are the main inspirations
for the study.
1.3 Statement of the Problem
Despite all the rhetoric and money invested in ERM implementation and the
alleged losses associated for not implementing it, risk management is too often treated
as a compliance issue (Kaplan & Mikes, 2012). Very few people believe in its
effectiveness in managing risks. The recent financial crisis is quoted by the skeptics as a
failure of ERM in preventing the worst outcome of uncertainties (Bromiley et al., 2015).
Not to mention that companies are still vulnerable to losses, wrong business decisions
or even miscalculated risks despite adopting ERM.
The persistent losses for the last consecutive three years suffered by Malaysian
Airline Systems (MAS), whose aircraft disappeared in 2014 followed by another
devastating tragedy of its aircraft being shot down later in the same year, is indeed a
devastating episode. On the other hand, Malaysian Airports Holding Berhad (MAHB),
the take-off grounds for MAS aircrafts, reported stable profitability for the same three-
year period. Both implemented ERM for many years, yet embracing contrasting and
extreme consequences, triggering the desire to investigate into the effectiveness of ERM
in managing risks.
The Enron and dotcom scandals, the corporate losses from earthquakes and
tsunami only makes the case for an effective risk management programme stronger than
ever before. Jin (2001) in his report cited that poor corporate governance and poor risk
management were among the major contributors to the failure of one tenth of the 800
Malaysian public-listed companies during the 1997 East Asian financial crisis. Indeed,
much of the East Asian financial crisis has been attributed partly to the risky financial
structures of corporates themselves (Claessens, Djankov, & Lang, 1998).

8
Corporate failures, fraud, scandals, mismanagement or even business misfortune
due to wrong business ventures and catastrophic events, warrant for the need to
implement a full-proof risk management approach. At the same time, shareholders, due
to fear of losing out on their investment, demand for the management to implement a
holistic risk management system.
Further examinations show that ERM practices among Malaysian companies are
still in their infancy relative to their counterparts from the developed countries. Based
on a survey done in 2008 among companies listed on the main board of Bursa Malaysia,
only 42% (or 37 companies) confirmed complete adoption of ERM followed by 36%
(or 33 companies) partial adoption. The remaining 18% (or 16 companies) are still
planning to adopt or investigating ERM. The other 3% (or 3 companies) announced that
they do not have any plans to implement ERM at all (Wan Daud, 2011; Wan Daud,
Haron, & Ibrahim, 2011).
Such an adoption rate is somewhat low compared to the statistics on ERM
adoption in other developed economies. A survey conducted among all property-
liability insurance companies in Germany showed that already in 2007 (just a year
before the same survey in Malaysia), 93% of the companies surveyed had implemented
ERM (Altuntas, Berry-stölzle, & Hoyt, 2011). This statistics and the overwhelming
number of corporate failures clearly indicate a good understanding of the factors which
can influence the perceived effectiveness of ERM is somewhat lacking.
The implementation of an effective ERM programme is essential to reaping its
benefits. Literature suggests that companies which implemented ERM achieve better
firm value. For example, Nocco and Stulz (2006) submits that ERM adds value by
ensuring that all material risks and risk-return tradeoffs carefully evaluated by operating
managers and employees throughout the firm (Nocco & Stulz, 2006). There are also

9
evidence to the value adding benefits of ERM (Hoyt & Liebenberg, 2011; Waweru &
Kisaka, 2013). ERM aids in decision making and improves business performance
(Gordon, Leob, & Tseng, 2009; Gates, Nicolas, & Walker, 2012; Baxter, Bedard,
Hoitash, & Yezegel, 2013; Nickmanesh, Zohoori, Musram, & Akbari, 2013; Obalola,
Akpan, & Olufemi, 2014).
The factors which are considered in this study include organisational factors
namely, culture (Martin, 1992; Miccolis, Kevin Hively, & Merkley, 2001; Kimbrough
& Componation, 2009; Muralidhar, 2010), structure (Kleffner, Lee, & McGannon,
2003; Arnold, Benford, Canada, Kuhn Jr., & Sutton, 2007; Arnold, Benford, Canada, &
Sutton, 2011), enterprise systems (Lam, 2000) as well the internal human factors
namely, tone from the top (Leonard-Barton & Deschamps, 1988; Yetton, Sharma, &
Southon, 1999), strategic role of ERM champion (Lam, 2000; Kleffner et al., 2003;
Aabo, Fraser, & Simkins, 2005; Beasley, Clune, & Hermanson, 2005a; Mikes, 2008;
Wan Daud, Yazid, & Hussin, 2010; Pagach & Warr, 2011; Yazid, Hussin, & Wan
Daud, 2011; Mikes, 2014) and the extent of employee involvement (Milani, 1975; Mia,
1988; Aranya, 1990).
To the best of the researcher’s knowledge, this is the first attempt to investigate
the influence of interaction among the organisational factors alongside human actors on
the effectiveness of ERM in managing risks.
The choice of the variables in the study is rationalised from litrerature review and
supported by pre-survey interviews with industry practitioners. In addition to the
organisational factors of culture, structure and technology, numerous frameworks on
ERM emphasize the importance of the ‘tone from the top‘ for an ERM programme to be
effective and successful.
Although a few of the variables in the study, have somewhat been the subject of

10
research in ERM, they have not been examined in the context of ERM effectiveness.
Specifically, none of the studies actually investigates its influence on the perceived
effectiveness of ERM in managing risks. As a result, the findings drawn from the
existing studies are insufficient to draw sound conclusions on its influence on ERM
effectiveness.
To address the above research problem, this research undertakes to provide an
updated level of maturity of ERM implementation and to investigate the perceived
effectiveness of ERM in managing risks and the factors associated with it. Essentially,
this research aims to offer insight into this very area of ERM based on the experience of
the Malaysian public listed companies.
1.4 Research Questions and Objectives
This section describes the research questions and objectives the current study
seeks to address in response to the research problems discussed in the foregoing section.
Analysis shows that the only data on ERM adoption rate among Malaysians is
available from a study which was conducted back in 2008. The study which generated
78% adoption rate is obviously outdated given the fast changing regulatory and business
landscape. The 2008 study also suffers from the limitation in the generalisation of the
findings due to the low response rate of only 18% as compared to the current norm of
35.7% (Baruch & Holtom, 2008). It also lacks the applicability to industries such as
finance and insurance industry because of their exclusion from the samples. The
possible obsolete data coupled with the limitations warrant for an updated statistics to
be obtained and hence, the first research question for the current study.
RQ1: What is the level of ERM adoption and maturity in Malaysia?
Once the level of ERM maturity in Malaysia is determined, the next question that

11
comes to mind is on the perceived effectiveness of ERM in managing risks among the
adopters. Firms, compelled by the regulatory requirements, seem to invest resources
(Curkovic, Scannell, Wagner, & Vitek, 2013) in implementing ERM but not so much
the processes to review the effectiveness of such programme (Crawford & Stein, 2004).
Implementation of ERM is deemed by many as a ‘tick-in-a-box’ exercise more than
anything else. If such a compliant environment is indeed true, ERM implemented in the
organisation is doubtful to achieve the objective it sets out to fulfill.
According to Nocco and Stulz (2006), ERM adds value to the firm provided that it
is effective and the mitigating plans are carried out correctly. Drawing from the sharp
criticisms confronting risk management practices post-crisis due to its ability to
effectively manage risks especially in time of (Lewis, 2008; Millo & MacKenzie, 2009;
Sorkin, 2010) and the aroused curiousity surrounding the effectiveness of ERM in
managing risks, this study seek to address the following research question on the
perceived ERM effectiveness among Malaysian companies.
RQ2: How is ERM perceived to be effective in managing risks?
Organisation theorists recognise that there are numerous organisational factors
and actors of the organisation which can influence behaviour and motivation behind the
success or effective implementation of any programme or system (Cameron, 1986b;
Mia, 1988; Nicolaou, 2000; Arena & Azzone, 2009). The organisational facets consist
of culture, structure and enterprise systems whereas the actors consist of top
management, ERM Champion alongside other members of the organisation.
Specifically, how does the organisational culture, structure and enterprise systems
impact ERM effectiveness? And how does tone from the top, the strategic role of ERM
Champion and employee involvement indeed influence the effectiveness of ERM in
managing risks? These intriguing questions lead us to ascertain the organisational
factors and behaviour of the actors which can influence the effectiveness of ERM in

12
managing risks. Thus the next question this research seeks to address is,
RQ3: To what extent is the perceived effectiveness of ERM in managing risks is
contingent upon the organisational factors, namely the organisational culture,
structure and enterprise systems and the actors, namely tone from the top, the
strategic role of ERM Champion and employee involvement?
Additionally, by virtue of the leadership role and the authority vested within them,
support from the management can be ascertained from the allocation of resources and
the creation of a conducive environment for the system to nurture and ultimately to be
effective (Lucas, 1981). Recognising this importance of tone from the top, the current
research seeks to address the following question.
RQ4: How does tone from the top mediate the relationship between culture and
the perceived ERM effectiveness in managing risks?
The presence of CRO and the establishment of a separate ERM unit are among the
indications that the organisations take ERM seriously. This is because there tend to be
huge costs involved in ERM implementation which includes consultancy fees
(Makarova, 2014), recruitment of a dedicated risk officer and the establishment a
separate unit for ERM, where applicable. The next research question is therefore to
investigate the moderating effects of the CRO’s presence and the separate ERM unit on
the relationship between the variables under study and perceived ERM effectiveness.
RQ 5: To what extent does the CRO presence and establishment of a separate
ERM unit moderate the relationship between the organisational factors and actors
and perceived ERM effectiveness in managing risks?
The research objectives associated with the research questions are stated as
follows:
RO1: To investigate the level of ERM adoption and maturity in Malaysia.

13
RO2: To evaluate the level of perceived ERM effectiveness in managing risks.
RO3: To investigate whether there is any direct relationship between the organisational
factors, namely culture, structure and enterprise systems and actors, namely tone from
the top, the strategic role of ERM Champion and employee involvement and perceived
ERM effectiveness in managing risks.
RO4: To examine whether tone from the top mediates the relationship between culture
and perceived ERM effectiveness and between enterprise systems and perceived ERM
effectiveness.
RO5: To examine whether CRO presence and the establishment of a separate ERM unit
moderate the relationship between the organisational factors and actors and the
perceived ERM effectiveness in managing risks.
1.5 Contributions of the Study
Like any other, this study aims to contribute to the body of knowledge in general
and theoretical framework in particular.
The contribution to knowledge is especially prominent given the fragmented
nature of the existing research. The findings of the web-based survey whose
respondents are members of the Strategic Risk Council of the Conference Board of
Canada, uncovered gaps in ERM, especially in the detailed information on integrating
risks, the impact of corporate culture (J. Fraser, Schoening-Thiessen, & Simkins, 2008).
A further analysis show that attempts to narrow this gap is by a few (Beasley, Chen,
Nunez, & Wright, 2006; Gordon et al., 2009; Xin, 2011) barely fulfil the gap due the
fragmented nature of the existing ERM studies.
To illustrate the fragmented nature of these study, (Gordon et al., 2009), for
example only look at whether the effectiveness of ERM programmes depends on an

14
appropriate match with the level of board monitoring. Similarly, another study by
Beasley et al. (2009) only examine at the performance measurement and incentive
system as the drivers for an effective ERM programme. Alongside these studies, another
research which uses an experimental approach only investigates two out of eight
components of COSO (2004) ERM framework for an effective ERM programme, i.e
internal environment and information and communication (Xin, 2011).
Additionally, the human behavioural element is too relevant to be ignored on the
basis that whilst ERM is motivated by the top, it is also motivated from underneath
which builds the ERM processes and systems. Literature on the influence of top
management’s support and eventually its participation in the effectiveness of any
project implementation (Leonard-Barton & Deschamps, 1988; Thong, Yap, & Raman,
1996; Wixom & Watson, 2001) and in the assimilation of enterprise systems
(Chatterjee, Grewal, & Sambamurthy, 2002; Huigang, Saraf, Qing, & Yajiong, 2007) is
abundant. The role of project champion is critical to derive consensus and oversee the
entire life cycle of implementation. The project champion has the power to set goals and
legitimate change (Bingi, Sharma, & Godla, 1999) and ensure that challenges faced
during implementation are addressed accordingly (Jarvenpaa & Ives, 1991). In addition
to the strategic role of ERM Champion, the involvement and engagement from the risk
owners and employees are equally important to ERM effectiveness in managing risks.
Drawing on the account of the foregoing research, this research posits that employee
involvement throughout the risk management process and activities will improve ERM
effectiveness in managing risks as it facilitates the input, flow and exchange of
information from the employees who are closest to the risk points and across the
organisation. To the best of the researcher’s knowledge, none of the existing ERM
studies looked into the whole spectrum of the internal human element in the framework.
After all, Latour (1987) in order to understand how risk rationalities are being reflected

15
in practices, we need to follow the actors such as the risk champion who were
responsible for bringing ERM live in those organisations.
That said, this study essentially contributes by investigating the effectiveness of
ERM in managing risks and beyond that fills the gap by also examining a wider
spectrum of internal organisational settings. On the whole, instead of investigating the
technical aspects of risk management, this research looks into the perceived
effectiveness in managing risks and undertakes the research in the wider social,
institutional and organisational context in which it operates (Soin & Collier, 2013). This
area of importance in ERM research is simply a response to the proposition that risk
management ultimately is a social construct shaped by the contexts they inhabit and not
merely a mechanical construct suggesting that the particularity of risk management
characteristics in specific organisational settings offers an opportunity for vast research
(Bhimani, 2009).
In regards to theoretical contribution, building on the theory of contingency as its
anchor theory and theories of power and empowerment, this piece of work goes beyond
the commonly accepted contingent variables of culture, structure and enterprise systems
(Hofer, 1975) by integrating the internal human element in the contingent framework
designed for the study. The organisational contingent factors, no matter how strong they
are, will have no effect on the organisational behaviour without the influence of the
behaviour of the human agents within the organisations, namely the top management,
the champion and the employees. Indeed for any change or initiative to become real,
durable and sustainable, action is required throughout the organisation, through culture,
structure, technology and people (Schneider, Brief, & Guzzo, 1996). Specifically, the
organisational actors consist of those at the top, the initiative drivers or champion and
the employees.

16
The current study seeks to examine the varying degree of interaction between the
contingent organisational factors and the internal human elements, thereafter the
resultant influence on its effectiveness in managing risks. Ultimately, this inclusion of
the internal human element and ERM effectiveness as the contingent and criterion
variables, respectively, distinguished the current study from the majority of others
which only examined the organisational contingent factors for ERM adoption.
The application of contingency theory in risk management systems is not new
although much is dominated by the traditional approach of examining the direct
relationship between the variables. This study, however, seeks to apply the more
advanced contingency theory by applying the congruence-fit contingency approach and
examining the interaction of the multiple contingent variables which ultimately is tested
against its influence on the outcome, i.e. the perceived effectiveness of ERM in
managing risks.
Specifically, the application of contingency theory and the alignment (or fit) of the
organisational factors in particular culture, structure, enterprise systems, tone from the
top, the strategic role of ERM Champion with involvement from the employees in the
ERM activities contributes to the main highlight of the study. It is hoped that the current
study will fill this gap by examining not only the relationship among the organisational
factors but also the relationship among the actors within the organisation to ensure that
the ERM implemented fufils the purpose it is set to serve i.e. managing risks.
In terms of geographical coverage for the research, this research adds to the
overall geographical state of knowledge and practices on ERM. It contributes by
providing insight into the level of ERM adoption, in general, and more critically
emphasises the perceived effectiveness of ERM based on the Malaysian experience.
Existing studies are mainly based on the experience from developed countries like the

17
US, UK, Germany, Canada etc. (Kleffner et al., 2003; Liebenberg & Hoyt, 2003; Aabo
et al., 2005; Beasley et al., 2005a; Gates et al., 2012; Paape & Speklé, 2012; Quon,
Zeghal, & Maingot, 2012; Curkovic et al., 2013). Research found that despite ERM
being a concept accepted worldwide, it is always implemented and interpreted in local
ways (Mikes, 2009; Arena et al., 2010; Mikes, 2011; Tekathen & Dechow, 2013).
Another contribution which makes the findings distinct and probably more
meaningful from others is in terms of the mixed methodology used in the research. The
current research used a dual approach of content analysis which is to be complemented
by the survey to identify ERM adopters. Past researchers either relied on evidence of the
existence of ERM programmes, such as the creation of a specialized managerial
position, i.e. Chief Risk Officer (CRO), who is tasked to implement and coordinate
ERM programme or to search for evidence of ERM activity in the financial reports,
newswire or any other media (Gordon et al., 2009; Hoyt & Liebenberg, 2011; Lin, Wen,
& Yu, 2012) or used the survey method (Beasley et al., 2005a; Wan Daud, 2011; Wan
Daud et al., 2011; Yazid et al., 2011). Those methods when used independently posed
some shortcomings to the legitimacy of the results obtained hence limiting the strength
of the conclusion derived. For example, an organisation may be misidentified as an
ERM adopter if the firm discloses that one of the board members was previously a chief
risk officer of another firm (Type I measurement error) or an ERM adopter may be
missed out when the firm’s ERM practices are not disclosed using the keywords defined
in this paper (Type II measurement error). Additionally, the extent of the risk disclosure
itself poses a limitation to this approach to identify ERM adopters. Although there was a
high degree of risk disclosure intensity in the reports, it lacks uniformity, clarify and
quantification (Lajili & Zéghal, 2005). Studies also found that disclosure on ERM is
more voluntary than mandatory in most circumstances (Liebenberg & Hoyt, 2003; Hoyt
& Liebenberg, 2011).

18
Content analysis, on the one hand, while enjoying at least one undeniable strength
that it is doable and is economical both in time and money (Babbie, 2015), its findings
are subject to the reliability of the coding procedure itself (Aaron, 2001) – in this case,
the reliability and completeness of the list of keywords used in the current research as a
proxy to ERM being implemented in the organisation. The survey method, on the other
hand, may turn out to be catastrophic to researchers, particularly if the response rate is
low. Most studies conducted gained less than 20% response rate which depletes the
generalizability of the findings. Based on the analysis of all the survey-type studies
published between 2000 and 2005 in 17 refereed academic journals, it was found that
the average response rate for those studies was reported at only 35.7% with a standard
deviation of 18.8 suggesting a somewhat low response with a very wide variation
(Baruch & Holtom, 2008).
From the regulatory standpoint, the study seeks to offer a basis for the formulation
of policies and guidelines to encourage effective ERM implementation and eventually
minimise the losses from business failures if not prevent collapses completely.
From the macro perspective, it is hoped the study will encourage businesses to
implement an effective ERM programme which will increase the firms’ values and
improve performances. Given the benefits of ERM, it is hoped that the current piece of
work will aid practitioners and professional bodies by offering insights into what makes
a conducive environment for an effective and successful ERM in managing risks. The
empirical evidence of the effectiveness of ERM in managing risks is also hoped to
change the motivation for ERM implementation from compliance or a ‘tick-in-a-box’
exercise to a business exercise with commercial sense.
In the long run, the economy should prosper and the standard of living should
eventually improve.

19
1.6 Scope of the Study
The study is essentially a single-country study that looks at the level of ERM
adoption and maturity among the public listed companies and investigates perceived
ERM effectiveness. The contingent influence of organisational and human factors on
perceived ERM effectiveness in managing risks is also examined in this paper.
The contingent variables consists of organisational factors – culture, structure and
enterprise systems – and actors – tone from the top, strategic role of ERM Champion
and employee involvement. These variables were identified from existing literature and
subsequently validated through the pre-survey interviews conducted with the academics
and industry practitioners.
Whilst much of the work done on contingency theory considered the external
elements such as environmental uncertainty, competitive strategy, product life cycle etc,
such elements are outside the scope of the current study. The reasons for the exclusion
are doublefold. First, unlike organisational performance which can be influenced by
external factors such as market competitiveness, the perception on the effectiveness of
ERM in managing risks is clearly an internal affair. Using this rationale, the uncertainty
and competitive environment are deemed irrelevant for the current framework.
Secondly, the scope of the study is limited to ERM adopters which are defined as those
which already have evidence of ERM adoption. Such prerequisites imply that the
external environment is already fit for those organisations to adopt ERM and hence
irrelevant for the current study.
Data and information collected for the purpose of the study were obtained from
the official website of Bursa Malaysia, corporate annual reports, surveys as well as
interviews with the relevant people in the industry.

20
1.7 Research Methodology
The research methodology for the current research is mixed method of
explanatory sequential design which is a quantitative approach to be followed by a
qualitative approach. The research was designed systematically as shown in Table 1.1 to
ensure that the data collected achieved the objectives and the timeline set for the
research. Phase 1 to 3 constitute the quantitative part of this study while phase 5 and 6
constitute the qualitative part. Please also see Appendix A for the Research Process
Flow.

21
Table 1.1: Outline of the Research Methodology
Phase Objectives Tasks
Phase 1:
Content
analysis
To identify Malaysian public
listed companies (PLCs) listed
on the main board of Bursa
Malaysia which has evidence
of ERM adoption based on the
use of certain keywords in the
annual reports as a proxy of
ERM adoption.
The preliminary phase entails a content analysis
of the annual reports of the Malaysian PLCs.
During the exercise, a few keywords in the
annual reports indicating the presence of ERM
are used as a proxy of ERM adoption.
Phase 2:
Pre-survey
interview
To ascertain the
organisational factors
influencing the effectiveness
of ERM in managing risks
and to gain insights as to how
the practitioners measure the
effectiveness of ERM in their
organisation.
The second phase of the research involves
formulating a testable conceptual framework for
the research through pre-survey interviews with
chief risk officers, chief internal auditors and
chief financial officers. A semi-structured
interview protocol was prepared for the purpose.
Phase 3:
Online
survey
To distribute online
questionnaire survey.
The third phase of the research is to distribute
questionnaire to the ERM adopters identified
from phase 1 of the study. Online survey is used
as a platform for the survey with the hope to
increase the response rate from the potential
respondents.
Phase 4:
Quantitative
data
analysis
To analyse the data collected. Data is analysed using SPSS and SmartPLS 3.0.
The demographic and ERM profile of the
repondents and the organisations they represent
are summarised and presented. Thereafter,
hypotheses are tested using SmartPLS 3.0 and
findings discussed.
Phase 5:
Content
analysis and
interview
To contextualise the scope for
the qualitative part of the
research and to identify the
potential candidates for the
interview.
Based on the results of the survey, the scope of
the qualitative method for the study is
determined. Content analysis of the audited
accounts of the potential organisation,
particularly the Statement of Risks and Internal
Controls are carried out followed by semi-
structured interviews with selected participants
among survey respondents.
Phase 6:
Qualitative
data
analysis
To analyse the data from the
interviews.
The sixth phase is to review the transcribed
interview and triangulate the data with the
content analysis findings. Common themes were
identified and reported.
Phase 7:
Analysis of
both
findings
To discuss the findings based
on triangulation of data
collected from the qualitative
and quantitative part of the
research.
Finally, findings from the quantitative and
qualitative design of the current study are
discussed and presented. Conclusion is drawn
based on the findings from both parts of the
research.

22
1.8 Thesis Structure
This thesis has a six-chapter structure as follows.
Chapter 1: Introduction
Chapter One emphasises the background of the study and the inspiration for the
research. The problem statements and the research gaps are discussed soon after,
followed by the questions and objectives this research seeks to address. The significance
of the study in terms of contribution to knowledge, to the industry as well as to the
regulatory bodies is also discussed in this chapter. The chapter also discusses the scope
of the study and the research methodology in brief before ending with the general
organisation of the thesis.
Chapter 2: Literature review
The objective of Chapter Two is to review and examine the existing theoretical and
empirical evidence conducted on ERM as well as the regulatory landscape surrounding
the implementation of ERM both internationally and locally. The first section provides
the various definitions for ERM followed by the regulatory climate, in particular the
framework issued on ERM. The following section discusses the current state of the
body of knowledge on ERM and the existing studies on the variables selected in the
study. The research gap which is the main outcome of the literature review is presented
just before the conclusion section.
Chapter 3: Conceptual framework and hypothesis development
Chapter Three discusses the common conceptual and theoretical framework applied in
the existing studies on ERM. The underlying theories for this research, i.e contingency
theory complemented by theories of power and empowerment, are then identified and
explained.

23
Chapter 4: Research design and methodology
The reliability and validity of any research findings stands on the application of
appropriate methodological procedures. Chapter Four is dedicated to explaining the
research methodology undertaken in this study, the instruments and statistical methods
used and the rationale behind the choices. The chapter also describes the organisation
plan of the research including the plan for data analysis.
Chapter 5: Findings and discussion
Chapter Five presents the statistical results and discusses the findings of the analysis
and their interpretation. It also discusses the findings of the semi-structured interview is
also discussed in this chapter.
Chapter 6: Conclusions
Chapter Six is the concluding chapter. Here, the main findings are presented,
implications and limitations of the study are discussed and lastly, direction for future
research is outlined.

24
CHAPTER 2 LITERATURE REVIEW
The objective of the chapter is to review and discuss the current state of
knowledge on enterprise risk management (ERM). In this section, we look at the
various definitions and the important concepts of ERM.
The chapter is structured as follows. The first four sections discuss the various
definitions of ERM, its evolution, the related governing framework and the Malaysian
guidelines in regards to ERM. The fifth section reports the literature review of past
studies conducted on ERM. The subsequent section discusses the factors that can
influence ERM effectiveness in managing risks and the underpinning variables in the
study. The factors considered in the study consist of culture, structure, enterprise
systems, tone from the top, strategic role of ERM Champion and employee
involvement. In addition, the mediating effect of tone from the top in the relationship
between the variables is also examined in this study.
The current study also submits to investigate the moderating influence of the CRO
and a separate ERM unit. To make the results more meaningful, the regulatory
environment and size of the company (specifically main board listed and non-main
board listed) and level of ERM maturity are controlled in the framework designed for
the study. Thereafter, gaps in knowledge identified from the existing literature are
presented followed by the chapter summary.
2.1 What is ERM?
There are various attempts to define ERM as there are equally diverse schools of
thoughts and framework governing the implementation of ERM. Such diversity is
driven by the background and discipline of the authors and bodies issuing the
framework. Bromiley et al. (2015) identify the approach to risks and the firm objectives

25
as among the dimensions and distinctions in the definition of ERM. Others include
value maximisation (e.g.Tillinghast-Towers Perrin (2001) and Casualty Actuary Society
(2003)) as one of the dimensions. Most of the definitions of ERM, in fact, use the
approach to risk management (e.g., Dreyer and Ingram (2008) and RIMS. (2011)) to
describe and define risk management, followed by the achievement of the firm’s
objectives (e.g. COSO 2004 framework) and ISO 31000).
COSO (2004), which is one of the more commonly used frameworks on ERM,
sets out the following to define ERM.
ERM is a process, affected by an entity’s board of directors, management and
other personnel, applied in strategy setting and across the enterprise, designed to
identify potential events that may affect the entity, and manage risk to be within
its risk appetite, to provide reasonable assurance regarding the achievement of
entity objectives.
(COSO, 2004, p. 2)
ISO 31000, which is the other common standard used for ERM implementation,
offers a much more straightforward definition:
Risk management is coordinated activities to direct and control an organisation
with regard to risk. The risk management process aids decision making by
taking into account of uncertainty and the possibility of future events or
circumstances (intended or unintended) and their effects on agreed objectives.
(ISO 31000:2010)
The foregoing definitions of risk management bring to surface the two common
themes of ERM – first, its role towards the achievement of organisational objectives and
second, the integrated approach to risk management. Both are distinct from one another
in that the former emphasises on the wider organisational setting in which it operates by

26
stating the involvement of management and other personnel as well as its application in
the formulation of the organisational strategy, while the latter emphasises the essence of
ERM being the process of coordinating the various risk-managing activities.
Academics have described ERM as an integrated and comprehensive assessment
of uncertainties and a few distinguished it with the traditional isolated approach.
Examples of definitions that took great efforts in such distinction include:
Unlike the traditional “silo-based” approach to corporate risk management,
ERM enables firms to benefit from an integrated approach to managing risk that
shifts the focus of the risk management function from primarily defensive to
increasingly offensive and strategic. ERM enables firms to manage a wide array
of risks in an integrated, holistic fashion.
(Liebenberg & Hoyt, 2003, p. 37)
In contrast to the traditional “silo” based approach to managing risk, the ERM
approach requires a company-wide approach to be taken in identifying, assessing
and managing risk.
(Kleffner et al., 2003, p. 54)
There are also other schools of thought that advocate that ERM greatly influenced
the firm’s value. These value maximisation benefits are included in the definition of
ERM (for example DeLoach & Andersen, 2000; Verbrugge et al., 2003). A review of 28
(twenty eight) definitions of ERM offered by scholars and experts from the industry and
the regulators, as tabulated in Table 2.1 and Table 2.2, exhibited three different ERM
themes in terms of its approach to risk management, achievement of organisational
objectives and the firm value maximisation.

27
Table 2.1: ERM Definitions and Descriptions from Academic Publications
Source Definition Approach Objectives Value
maximisation
(Miller, 1992) Integrated risk management is an alternative to the suboptimal approach to treating
uncertainties in isolation from one another. It offers a basis for comprehensive assessment of
uncertainty exposures and explicit consideration of the uncertainty trade-offs associated with
alternative firm strategies.
√
(Schneier &
Miccolis, 1998)
ERM is a systematic and proactive approach to managing risks, which means that risks, risk
factors and mitigation programmes are considered on a business-wide basis, internally and
externally.
√
(DeLoach &
Andersen, 2000)
Enterprise-wide risk management is a truly holistic, integrated, forward looking and process-
orientated approach is taken to manage all key business risks and opportunities – not just
financial ones – with the intent of maximising shareholders value for the enterprise as a whole.
√ √
(Dickinson,
2001)
ERM is a systematic and integrated approach of the management of the total risks a company
faces. √
(Mottershead &
Godfrey, 2001)
Enterprise-wide risk management is an approach that looks across the whole organisation rather
than through the traditional functions [and] aligns risk management activities to shareholder
value levers’.
√ √
(Hodgkinson,
2001)
Enterprise-wide risk management is a philosophy that is positive and proactive; value based
and broadly focused, embedded in processes; integrated into strategy and total operations; and
continuous.
√
(D’Arcy &
Brogan, 2001)
ERM is the process by which organisations in all industries assess, control, exploit, finance and
monitor risks from all sources for the purpose of increasing the organisation’s short and long
term value to its stakeholders.
√
(Harrington,
Niehaus, &
Risko, 2002)
ERM is the idea that emerged in the late 1990s that a firm should identify and (when possible)
measure all of its risk exposures – including operational and competitive risks – and manage
them within a single unified framework in contrast to the silo approach to risk management.
√
S
27

28
Table 2.1: RM Definitions and Descriptions from Academic Publications (continued)
Source Definition Approach Objectives Value
maximisation
(Meulbroek,
2002)
Integrated risk management is the identification and assessment of the collective risks that
affect firm value, and the implementation of a firm-wide strategy to manage those risks. √ √
(T. L. Barton,
Shenkir, &
Walker, 2002)
Enterprise-wide risk management shifts risk management from a fragmented, ad hoc, narrow
approach to an integrated, continuous, and broadly-focused approach. √
(Verbrugge et al.,
2003)
ERM is corporate-wide, as opposed to departmentalised, efforts to manage all the firm’s
risks—in fact, its total liability structure—in a way that helps management to carry out its goal
of maximising the value of the firm’s assets. It amounts to a highly coordinated attempt to use
the right-hand side of the balance sheet to support the left-hand side—which, as finance theory
tells us, is where most of the value is created.
√ √ √
(Liebenberg &
Hoyt, 2003)
Unlike the traditional “silo-based” approach to corporate risk management, ERM enables firms
to benefit from an integrated approach to managing risk that shifts the focus of the risk
management function from primarily defensive to increasingly offensive and strategic. ERM
enables firms to manage a wide array of risks in an integrated, holistic fashion.
√
(Kleffner et al.,
2003)
In contrast to the traditional “silo” based approach to managing risk, the ERM approach
requires a company-wide approach to be taken in identifying, assessing, and managing risk. √
(Miller & Waller,
2003)
Integrated risk management is consideration of the full range of uncertain contingencies
affecting business performance. √
(Sobel & Reding,
2004)
ERM is a structured and disciplined approach to help management understand and manage
uncertainties and encompasses all business risks using an integrated and holistic approach. √
(Banham, 2004) ERM is a strategy, organisations can use to manage the variety of strategic, market, credit,
operational and financial risks they confront. It calls for high-level oversight of risks on a
portfolio basis rather than a discrete management by different risk overseers.
√
S
28

29
Table 2.2: ERM Definitions and Descriptions from Standards Setting Organisations, Industry Publications, Industry Associations, Consulting
Firms and Rating Agencies Source Definition Approach Objectives Value
maximisation
(AS/NZS 4360,
1995)
Risk management is the culture, processes and structures that are directed towards the effective
management of potential opportunities and adverse effects. √
(Holton, 1996) ERM is about optimising the process with which risks are taken. √
(Banham, 1999) The goal of ERM is to identify, analyse, quantify, and compare all of a corporation’s exposures stemming from operational, financial, and strategic activities.
√
Arthur Andersen
(Described in
(DeLoach &
Andersen, 2000))
ERM is a structured and disciplined approach [that] aligns strategy, processes, people,
technology and knowledge with the purpose of evaluating and managing the uncertainties the
enterprise faces as it creates value….It is a truly holistic, integrated, forward looking and
process-oriented approach to managing all key business risks and opportunities – not just
financial ones – with the intent of maximising shareholder value for the enterprise as a whole
√ √
(Miccolis, 2000) ERM is a rigorous approach to assessing and addressing the risks from all sources that threaten
the achievement of an organisation’s strategic objectives. √ √
(Deragon, 2000) ERM simply seeks to manage interrelationships systemically, in order to minimise variation,
reduce inherent risks, and increase positive synergies. √
(Tillinghast-
Towers Perrin,
2001)
ERM is generally defined as assessing and addressing risks, from all sources, that represent
either material threats to business objectives or opportunities to exploit for competitive
advantage.
√ √
S
29

30
Table 2.2: ERM Definitions and Descriptions from Standards Setting Organisations, Industry Publications, Industry Associations,
Consulting Firms, and Rating Agencies (continued)
Source Definition Approach Objectives Value
maximisation
(Casualty Actuary
Society, 2003)
ERM is the process by which organisations in all industries assess, control, exploit, finance
and monitor risks from all sources for the purpose of increasing the organisation’s short- and
long-term value to its stakeholders.
√ √
(COSO, 2004) ERM is a process, affected by an entity’s board of directors, management and other
personnel, applied in strategy setting and across the enterprise, designed to identify potential
events that may affect the entity, and manage risk to be within its risk appetite, to provide
reasonable assurance regarding the achievement of entity objectives.
√ √
(Dreyer & Ingram,
2008)
We see ERM as an approach to assure the firm is attending to all risks; a set of expectations
among management, shareholders, and the board about which risks the firm will and will not
take; a set of methods for avoiding situations that might result in losses that would be outside
the firm’s tolerance; a method to shift focus from “cost/benefit” to “risk/reward”; a way to
help fulfil a fundamental responsibility of a company’s board and senior management; a
toolkit for trimming excess risks and a system for intelligently selecting which risks need
trimming; and a language for communicating the firm’s efforts to maintain a manageable risk
profile.
√
(ISO 31000:2010,
2010)
Risk management is coordinated activities to direct and control an organisation with regard to
risk. The risk management process aids decision making by taking into account uncertainty
and the possibility of future events or circumstances (intended or unintended) and their
effects on agreed objectives.
√ √
Risk and Insurance
Management
Society (RIMS.,
2011)
ERM is a strategic business discipline that supports the achievement of an organisation’s
objectives by addressing the full spectrum of its risks and managing the combined impact of
those risks as an interrelated risk portfolio.
√ √
S
30

31
Based on the common themes identified in the foregoing definitions on ERM, in
essence, ERM calls for a centralised and holistic approach (Gordon et al., 2009) to
managing risks under a common function or committee within the organisation. This
function or committee manages the individual overseers, also known as risk owners,
who are tasked to trigger the alarm button and execute the agreed action plans whenever
risks occur. It is the whole process to assess risks in a systematic, consistent and
efficient way. ERM activities includes identifying, and deciding how much risk the
entity can tolerate, assessing mitigation actions or otherwise turning around risks into
opportunities. The process offers the benefits of warehousing a comprehensive register
of key risk area and to segregate critical from less critical key risk area. In doing so, it
determines authority and responsibility and allocates resources accordingly to eliminate,
mitigate and manage those identified risks (Banham, 2004).
In simpler words, ERM integrates risks and adopts an enterprise-wide view of risk
management for the whole organisation. ERM considers all the factors and actors of the
entity providing more effective risk management at lower costs (T. L. Barton et al.,
2002) as well as offering a more holistic approach to lowering the overall risk and
hazard and, in turn, increases the value of an organisation.
Ultimately, the aspiration of ERM is twofold. First, like any managerial
innovation, it warrants for mistakes of the past to be mitigated, if not avoided, by a more
rational and synthetic conception of a “canopy-like” risk management view of the
organisation (Drori, 2006) with efficient use of scarce resources. Second, ERM also
embodies an aspiration for enterprising risk management, explicitly aimed towards
value creation. After all, ‘risks are no longer the dark side of opportunities, they are
also market opportunities’ (Beck, 1992).
Prominent differences between traditional risk management and ERM according

32
to COSO (2004) are summarised in Table 2.3 below:
Table 2.3: Differences between ERM and Traditional Risk Management
Traditional Risk Management Enterprise Risk Management
Risk as individual hazards Risk viewed in context of business strategy
Risk identification & assessment Risk portfolio development
Focus on discrete risks Focus on critical risks
Risk mitigation Risk optimisation
Risks with no owners Defined risk responsibilities
Haphazard risk quantification Monitoring & measurement of risk
“Risk is not my responsibility” “Risk is everyone’s responsibility”
Source: KPMG LLP
2.2 The Evolution of Risk Management and ERM
The history of risk management has been traced back as early as the Renaissance
period from the 14th to 17th century which saw the birth of scholars such as Leonardo
Da Vinci and Michelangelo. It all started when a French gambler and mathematician
who was also a nobleman dared the famed mathematician Blaise Pascal to solve a
puzzle about how to divide the stakes of an incomplete game of chance between two
game players, one of whom was ahead. The solution to the puzzle turned out to be the
origin of the probability theory which is among the fundamental quantitative tools in
risk management. In 1703, Jakob Bernoulli invented the law of large numbers and the
process of statistical inferences followed by the development of mortality tables by
mathematician scholars in 1725. In 1730, the structure of normal distribution was
suggested and the measurement of risk, standard deviation and a much wider use of
sampling were discovered.
Later, during the period between World War II and the mid-1960s, the risk

33
management function evolved and eventually gained its title and core definition. In the
beginning, the scope of risk management was narrower and was administered by the
Insurance Buyer. The rising loss experience as the business grows then triggered the
need to consolidate the input from other departments. The scope then expanded and the
title was subsequently ‘upgraded’ to Insurance Manager. In 1955, the role was again
rebranded to a Risk Manager on the rationale that the role is no longer limited to
purchasing insurance rather identifying risks and suggesting ways to mitigate them.
A year later, the term risk management was introduced to business organisers
setting the beginning of risk management as a discipline (Barlow, 1993). The concept of
risk, then, is very much mathematical in principle. Where factors can not be accurately
quantified, input from the risk managers is sought. Types of risks then, were limited to
pure risks and losses and were managed through controlling and financing statistical
tools. Insurance has been the most popular approach in managing corporate risk. This
approach is commonly known as Traditional Risk Management (TRM) where risks are
managed in silos by independent departments. Each department possesses its own skills
and procedures as well as sets of attitude towards risk (D’Arcy & Brogan, 2001) and
focused solely on the risks within its own domain.
Only during the later part of the 1990s did some managers start to question the
efficiency and effectiveness of managing pure and financial risk separately. They began
to consider risk exposures that were not handled by pure risk or financial risk managers.
In parallel, along with the era of globalisation, the scope of risks and uncertainties faced
by organisations broadened with each creating its own risk management experts, its own
term, its own methodology and its own tools. For example, the treasury department
dealt with treasury risks through instruments like swaps and derivatives, the insurance
department ensured that all assets and risks were insured, the recovery department
managed credit risks. Each department reported to a different senior management

34
member leading to inefficiencies. It then became apparent that a common approach to
risk management was preferable to an individual approach and an integrated approach
preferable to a separatist. There are also other new breeds of risks emerging such as
operational risks and reputational risks warranting the need to manage the “risk of
everything” (Power, 2004). This need to identify all risk exposures and address them
using a consistent and holistic framework is what triggered the birth of a new
philosophy in risk management which came to be known as enterprise risk management
(ERM) (Harrington & Niehaus, 2003).
This new focus on the concept of ERM provides an opportunity for risk managers
to apply the utmost effective and robust approach to risk management with a canopy
view of managing a broader scope and nature of risk faced by the organisation (D’Arcy
& Brogan, 2001).
The September 11th event only reinforced the precarious need for this new
evolution of integrating and enterprising risk management functions within an entity, in
particular, financial services entities. In a report issued by Speer & Associates, an
Atlanta-based financial services consulting firm, it was reported that few banks had
taken steps to build an Enterprise Risk Management (ERM) infrastructure which went
beyond the traditional approach of looking at credit, fraud, and liquidity risk
measurements and considered market risk, reputational risk, operational risk, and other
factors that were unfavourable to shareholders’ value (Cornwell, 2001).
The above sequence of events and milestones generally described the evolution in
the risk management field from where risk management originated, was progressed and
eventually enterprised.

35
2.3 ERM Regulatory Framework
The body of risk management framework consists of at least 15 professional risk-
related bodies such as the COSO Treadway Commission, the Federation of European
Risk Management Associations, the Casualty Actuarial Society, the Global Association
of Risk Professionals, and the Institute of Internal Auditors. As a result, there are at least
15 risk-related frameworks, including COSO (2004) ERM framework, ISO 31000 and
AS/NZS (Australian/New Zealand standard) 4360:2004. Some other ERM
frameworks/standards include the Federation of European Risk Management
Association (FERMA), British Standard, AIRMIC, Risk and Insurance Management
Society (RIMS), Risk Maturity Model and FAA Safety Risk Management. For the
purpose of the current paper, the discussion on the regulatory framework is confined to
ERM framework. For clarity, general risk management activities are outside the scope
of the current study.
ERM as a formal framework was first established during 1995 by the Joint
Australian/New Zealand Standard for Risk Management (AS/NZS 4360, 1995). In
2004, on the back of high-profile business failures such as Enron, World dotcom,
Satyam etc, the Treadway Commission’s Committee of Sponsoring Organisation
(COSO) 2004 ERM framework was published.
Among all the guidance on ERM, the two most widely and commonly recognised
risk management frameworks in use today are the COSO (2004) Enterprise Risk
Management Framework and ISO 31000 Risk Management, Principles and Guidelines
(2009).
COSO was originally formed in 1985 to sponsor the National Commission on
Fraudulent Financial Reporting, an independent private sector initiative often referred to

36
as the Treadway Commission. COSO stands for the Committee of Sponsoring
Organisations of the Treadway Commission, a coalition of the main accounting and
finance trade associations in the United States. The Treadway Commission published
guidance on internal control in 1992 which provides the antecedent conceptual building
blocks for the 2004 framework for ERM. COSO (2004) ERM framework among other
standards is issued as a guidance “to management to evaluate and improve their
organisations’ ERM.
The Framework suggests a three-dimensional matrix block of the:
Eight components for an effective ERM; to be evaluated at each of the
dimensions;
Four organisation’s business objectives categories across the top – strategic,
operations, reporting and compliance;
Four organisational structure of – entity, division, business unit and the
subsidiary level.
The COSO ERM “cube” model (see Figure 2.1) is intended to display the
relationship between the 3 (three) dimensions and is claimed to be a robust model,
especially in portraying a complete “end point” picture of ERM. The three-dimensional
matrix of the COSO cube addresses parts of the framework during implementation. For
example, by taking one slice through the cube, you could construct a plan focused on
risk processes related to just one of the strategic objectives or take a different slice and
construct a plan to develop risk processes for one business unit.

37
Figure 2.1: COSO ERM “Cube” Model
In November 2009, another standard on ERM called ISO 31000 was published by
the International Organisation for Standardisation (ISO). ISO 31000 is claimed to be the
first globally accepted standard on the practice of risk management (Purdy, 2010). The
standard can be used by all organisations, in any country, throughout the life of an
organisation and applies to a wide range of activities as well as to any type of risk. It
also recognises the need to take into account the varying needs of a specific
organisation. ISO 31000, which was drafted on the premise of the Australia/New
Zealand risk management standard (AS/NZS 4360:2004), was created by a working
group of technical advisors from 29 countries in a series of meetings with strong
attendance ranging from 40 to 60 delegates over several years (Knight, 2010). This core
group which was ably supported by the expert delegates as well as the national
committees earns ISO 31000 the very best of contemporary thought on the management
of risk. The Australian & New Zealand Joint Technical Committee unanimously
resolved to adopt it as AS/NZS ISO 31000:2009, ultimately sending the AS/NZS 4360
(Knight, 2010) to archive.
Similar to the COSO (2004) ERM Framework, compliance to ISO 31000 is not

38
intended to be mandatory. The standard in particular outlines the principles that make
risk management effective, the risk management framework and the process for
managing risk. There are 11 principles of an effective risk management as follows:
1. Creates and protects value;
2. Integral part of all organisational processes;
3. Part of decision making;
4. Explicitly addresses uncertainty;
5. Systematic, structured, and timely;
6. Based on the best available information;
7. Tailored;
8. Takes human and cultural factors into account;
9. Transparent and inclusive;
10. Dynamic, iterative, and responsive; and
11. Facilitates continual improvement of the organisation.
ISO notes that “the adoption of consistent processes within a comprehensive
framework can help to ensure that risk is managed effectively, efficiently and coherently
across an organisation.” Some managers see the ISO 31000 risk management model as
intuitive because it moves from principles to framework to processes. The standards
strongly emphasises the need to tailor the risk processes to individual organisations.
Figure 2.2 demonstrates the relationships between principles, framework, and the
supporting risk processes.

39
Figure 2.2: ISO 31000 – Risk Management
According to the standard, an effective risk management increases the awareness
to identify threats (and opportunities) and treat risk (or leverage on opportunities)
throughout the organisation. It improves controls, operational effectiveness and
efficiency and helps organisations comply with relevant legal and regulatory
requirements and international norms. Additionally, the risk management process
establishes a reliable basis for decision making and planning, and appropriately
allocates and uses resources for risk treatment ("Standards Developments," 2010).
Despite numerous frameworks and standards guiding the concept, the findings
from the “2008 ERM Benchmarking Survey” conducted by the Institute of Internal
Auditors (IIAs) and IIA Research Foundation’s Global Audit Information Network
suggests that COSO’s Enterprise Risk Management – Integrated Framework is the most
commonly used framework to guide the ERM processes. The Framework published by
COSO came to be one of the top ten books in one of the surveys conducted to
investigate the most useful literature read by risk executives (J. Fraser et al., 2008).
For the purpose of the current study, references are made to both the COSO

40
(2004) framework as well as the ISO 31000. The rationale of seeking reference from
both is that each framework has its own strengths with no one superior to the other.
Each is a complement to the other and is capable on its own merit to give this research a
more robust knowledge base in ERM (Frigo & Anderson, 2014).
The differences between COSO (2004) ERM framework and ISO 31000 are
reflected in the extent of the details, the time when it was published as well as in its
applicability. COSO (2004) ERM framework which was published in 2004 provides the
detailed processes involved in ERM implementation to the extent that it and can be
quite ambiguous and cumbersome to the readers (Schanfield, 2009). On the other hand,
ISO 31000 published in 2009 offers a more straightforward and simple version for
implementation (Frigo & Anderson, 2014). ISO 31000 which was only introduced in
2009 has the benefit of being more up-to-date while the COSO (2004) framework,
which has been around for more than a decade, enjoys the benefits of being more
commonly referred to in the market (Power, 2007). COSO framework is also more
prevalent among financial services companies as compared to the universal nature of
ISO 31000 (Knight, 2010; Purdy, 2010) which made the latter more suited and
applicable to all types of risks and organisations.
2.4 Malaysian Regulatory Landscape on Risk Management
The Malaysian regulatory landscape on risk management was further streamlined
in January 2013 by the Statement on Risk Management & Internal Control (Guideline
for Directors of Listed Issuers) issued by Bursa Malaysia. The 2013 Bursa Malaysia
Guideline superseded the Statement on Internal Control (Guidance for Directors of
Public Listed Companies) issued in 2000. The former introduced new emphasis on
ensuring that risk management practices are in place while retaining the emphasis on
internal controls which is more prominent in the latter Guidance (Bursa Malaysia,

41
2013).
The 2013 Bursa Malaysia Guideline among other things:
provides guidance concerning the disclosures concerning risk management and
internal control
sets out obligations of management and the board of directors with respect to
risk management and internal control
provides guidance on the key elements needed to maintain a sound system of
risk management and internal control
describes the process that should be considered in reviewing its effectiveness.
Whilst the frameworks issued in other parts of the world including Asian
countries are more explicit in adopting the leading international ERM framework, the
2013 Bursa Malaysia Guideline takes a more naïve position when it comes to these
frameworks. To begin with, the guideline is not expressive in acknowledging ERM as
the new approach to integrating risk management practices. There is no mention of
ERM in the Guidance rather it refers to risk management activities in much broader
term. Nevertheless, it is worth highlighting that the new Guideline did include guidance
on risk appetite, which is an extract from: ERM – Understanding and Communicating
Risk Appetite – Research Commissioned by COSO (2004) in its Appendix 1. The 2013
Bursa Malaysia Guideline’s reference to the COSO (2004) ERM framework is further
evident in Appendix 2 of the Guideline which offers some suggested questions in
assessing the effectiveness of the company’s risk processes. The Guideline also adapts
three of the eight components of effective ERM namely control activities, information
and communication and monitoring.
The new Bursa Malaysia Guidelines requires companies to disclose their risk
policies in their statement of disclosures, and set out the obligations of management and

42
the board of directors with respect to risk management and internal control. It provides
guidance on the key elements needed in maintaining a sound system of risk
management and describes the process that should be considered in reviewing its
effectiveness.
Other guidelines with regard to risk disclosure that is applicable to listed firms in
Malaysia include the Malaysian Financial Reporting Standard (MFRS) 7 (Financial
Instruments: Disclosures), MFRS 101 (Presentation of Financial Statements) and MFRS
132 (Financial Instruments: Presentation) issued by the Malaysian Accounting
Standards Board (MASB), the accounting body in Malaysia that is responsible for
setting the accounting standards. There are also guidelines related to risk management
issued by Bank Negara Malaysia (BNM) which are made applicable only to financial
institutions. Examples of the guidelines issued by BNM are “Risk Weighted Capital
Adequacy Framework (RWCAF) – Disclosure Requirements (Pillar 3)” and “Guidelines
on Financial Reporting for Banking Institutions”.
These standards and guidelines normally emphasise risks that are more
quantifiable such as financial and credit risks and are lacking when it comes to
operational risks. Unlike the 2013 Bursa Malaysia Guideline which is voluntary in
nature, these FRSs 101 and 132 as well as the Basel II requirements are mandatory, to
which non-compliance can lead to qualification of accounts and a hefty penalty by the
relevant governing bodies.
2.5 Past Studies
ERM as a field of research began in the 1990s and has evolved since then
alongside the maturity and the advancement of ERM in practice. The first academic
article on ERM is believed to be one by Miller (1992), “A Framework for Integrated

43
Risk Management in International Business”. In this conceptual article, Miller defined
risks exclusively as the unpredictability or uncertainty in corporate outcome variables.
Miller put forward his idea to supersede the singular approach of treating risk in
isolation of the other. He introduced the integrated approach to risk management which
gives explicit consideration to numerous uncertainties. He argues that the integrated risk
management perspective provides a framework for identifying and assessing the many
types of uncertainties relevant to strategy formulation as opposed to an isolated
approach to managing risks. In 1998, Robert Schneier and Jerry Miccolis, strategy and
risk consultants, respectively, at Tillinghast Towers Perrin, introduced a new term in the
risk lexicon – Enterprise Risk Management – on the basis that these new tenets of
managing risks holistically address all the company’s key risks at an enterprise level
(Schneier & Miccolis, 1998).
Since then, research interest in ERM has grown exponentially leading to a new era
of ERM in academe. Among the common research themes in the ERM literature are the
determinants for ERM adoption, the financial characteristics of ERM adopter, ERM
practices, its impact on firms’ value and performance and to a certain extent, the
effectiveness of ERM in managing risks. Another area examined is the role of senior
management such as the Board of Directors (BOD), Chief Risk Officer (CRO) and
internal audit. See Figure 2.3.

44
Figure 2.3: Main Themes in ERM Research
The following paragraphs illustrate the nature of research design common in ERM
studies and finally the development of ERM studies in Malaysia. Please also refer to
Appendix B for the summary of ERM empirical studies published in journals from 2003
to 2014.
In the early phase, ERM studies are mainly exploratory and seek to identify the
financial characteristics of ERM adopters (Lam, 2000; Kleffner et al., 2003; Liebenberg
& Hoyt, 2003; Pagach & Warr, 2007; Lin et al., 2012). For example, the study by
Liebenberg and Hoyt (2003) found that highly leveraged firms are more inclined to
appoint CROs. This in turn implies that higher risk companies are more inclined to
adopt ERM. Similarly, Pagach and Warr (2007) find that firms which are highly
leveraged, volatile and have exhibited poorer stock market performance are more likely
to implement ERM. Lin et al. (2012) find that insurers with a higher reinsurance ratio
and greater geographical diversification are more likely to implement ERM. The study
also found that these ERM insurers appear to decrease reinsurance purchase and reduce

45
asset portfolio volatility but increase derivatives positions implying that after ERM
adoption, the insurers reduce cost of reinsurance and increase cost of financial risks via
more derivative usage and less volatile asset portfolios.
Another group of researchers looked at the other determinants for ERM adoption
which include various factors of regulatory influences (Paape & Speklé, 2012),
ownership (Liebenberg & Hoyt, 2003), appointment of big four audit firms (Beasley et
al., 2005a), firm and industry-related characteristics as well business complexity
(Gordon et al., 2009), Board of Directors (Gordon et al., 2009; Muralidhar, 2010; Wan
Daud et al., 2011), country of origin – US based vs non-US based (Liebenberg & Hoyt,
2003; Beasley et al., 2005a) and firm size (Gordon et al., 2009). Among the early
studies on the drivers to ERM implementation within organisations is one by Kleffner et
al. (2003). The study finds that almost a third of the respondents have adopted ERM and
a larger portion of the remainder is moving towards that direction. The reasons cited for
adopting ERM includes the influence of Risk Manager, encouragement from BOD and
compliance with Stock Exchange requirements with major deterrents being
organisational structure and overall resistance to change. In a later study by Beasley et
al. (2005a), it was suggested that board and senior management leadership on ERM is
critical to extensive ERM deployment. According to the study, other organisational
characteristics such as size, auditor type, industry and country of domicile are also
relevant to explain the extent of ERM implementation.
There were also studies conducted to examine how ERM is being rolled out in the
actual organisational setting, for example (Arena et al. (2010); Muralidhar (2010);
Arena, Arnaboldi, & Azzone, 2011; Tekathen & Dechow, 2013). Most of these studies
were case studies and interviews seeking to understand ERM practices in depth in the
actual business environment. The most recent case study on a manufacturing company
in Germany suggests that popular risk management concepts – such as COSO, for

46
example – are never real and that all ERM implementations are localized (Tekathen &
Dechow, 2013) adding to the insight that ERM is always implemented in local ways
(Mikes, 2009; Arena et al., 2010, 2011).
In the context of ERM effectiveness, previous research has shown that there is
inconclusive evidence on whether ERM is effective in managing risks and on what
makes up the organisational contingent variables favourable for ERM to function and
operate effectively. Study on ERM effectiveness has been identified as a research gap
for this study and is discussed further in Section 2.7. The summary of ERM
effectiveness studies is included in Appendix C.
Another cluster of studies examines the strong link between a company’s level of
ERM implementation and its value (Waweru & Kisaka, 2013; Lai, 2014; Li, Wu,
Ojiako, Marshall, & Chipulu, 2014) and performance (Hoyt & Liebenberg, 2011;
Mwangi, 2014; Nyagah, 2014; Obalola et al., 2014; Rasid, Isa, & Ismail, 2014). These
studies mainly rely on secondary data in evaluating the value of the company. For
example, Waweru and Kisaka (2013), find evidence that an increase in the level of
ERM implementation in companies had a positive contribution to the value of the
companies under study. By contrast, Pagach and Warr (2011) find little evidence of any
significant changes in various key firm variables among ERM adopters. Specifically,
they find limited evidence of risk reduction in the firm’s earnings even among firms that
are expected to benefit more from ERM (as proxied for by a positive CRO abnormal
announcement return).
The indifferent relationship between ERM and firm’s value is somewhat
consistent with the findings of a couple more recent studies done on insurance
companies. Using Standard and Poor’s newly available risk management rating of
insurance companies in the US, another group of authors find no additional increase in

47
value for firms achieving a higher ERM rating evidence despite the positive association
between increasing levels of Traditional Risk Management capability and firm value
(McShane, Nair, & Rustambekov, 2011). The unexpected direction in the results of the
study raises a few questions, one of which concerns the reliability and credibility of the
newly implemented ERM rating by Standard and Poor. This lack of association is
almost similar to that of the recent study on listed companies in Malaysia which uses
Corporate Governance Codes as the proxy for ERM adoption. Specifically, results
shows evidence of a decline in the firm’s value since the Code implementation (Ghazali
& Abdul Manab, 2013).
With regard to ERM’s positive impact on organisational performance, a study
among internal and management executives suggests that ERM implementation can
help companies improve performance by enabling executives to manage the company
better. The results of the survey submit that firm’s value comes from implementing the
ERM process, which then enables the company to make better decisions (Gates et al.,
2012). Research also finds positive association between ERM and accounting
performance (Baxter et al., 2013; Obalola et al., 2014).
In terms of research design, drawing on the accounts of 62 empirical studies on
ERM published from 2003 to 2014, these indicated that 74% of these studies are
quantitative using survey (34%), secondary data (39%) and experiement (1%). The
remaining are made up of qualitative (16%) and mixed methods (10%). The qualitative
studies in the analysis consist of case studies (13%) and interviews (3%) – see Figure
2.4 below. The earliest case study on actual ERM implementation was conducted in
2002 at the United Grain Growers (UGG), an agricultural company based in Winnipeg,
Manitoba. UGG was among the first companies in Canada to implement ERM
(Harrington & Niehaus, 2003). A few more single case studies were performed on a
single organisation to explore the aspects of ERM implementation in various

48
organisations, for example the electricity delivery company in Canada, Hydro One
(Aabo et al., 2005).
Figure 2.4: Analysis of ERM Empirical Research from 2003 to 2014 by the
Research Methodology used in the Research
Mikes (2009) conducted a field-based study in two banks in the UK to explore the
forms and uses of ERM and the roles that risk managers have come to play in actual
organisational settings. The field study showed how these two banks maneuvered risk
management within the respective organisational culture – one case demonstrates the
interactive use of certain risk controls whilst the other shows how risk controls became
significant in a diagnostic capacity in a context where no risk controls were used
interactively.
Muralidhar (2010) conducted case studies in six organisations in the Gulf
Cooperation Council countries. The study offers insight into the existing ERM models
while identifying the determinants of ERM adoption and the most significant challenges
for its implementation.
In the meantime, Arena et al. (2010) and Arena et al. (2011) used a seven-year

49
longitudinal case study on three private Italian companies to examine the organisational
dynamics of ERM. The outcome of the cases show how ERM was realised differently
across the organisations which reflects the fluid nature of ERM and its ongoing
reciprocal interactions with other, pre-existing, practices for controlling uncertainty
(Arena et al., 2010, 2011).
In a case study of six listed large to medium-sized general insurance companies in
the UK, Jabbour (2011) used semi-structured interviews and documentary evidence to
investigate the link between the motives for ERM adoption and ERM use within
insurance companies. The study also examines the relation between ERM determinants
and its use and to what extent change in the capital allocation process is driven by ERM
(Jabbour, 2011).
Of the six mixed method studies conducted on ERM – four are mixed methods of
explanatory design, i.e. survey questionnaire followed by case study/interview while the
remaining two are mixed methods of exploratory design, i.e. case study/interviews
followed by survey questionnaire.
An example of a mixed method study of explanatory design is Kleffner et al.
(2003). Using a survey distributed to Canadian Risk and Insurance Management Society
members followed by interviews with 19 of the respondents, it is believed to be the first
mixed method study done on ERM. The objectives of the study, among others, are to
examine the characteristics associated with the use of ERM and to identify the obstacles
companies face in implementing ERM hence explaining the need for in-depth
understanding which can only be achieved through an interview method (Kleffner et al.,
2003).
Similarly, Mikes (2008) conducted a survey and over 50 interviews to investigate
the roles that risk departments and senior risk officers play in fifteen large international

50
banks. The study found that the role of chief risk officers (CROs) had expanded
dramatically, with more than half of them involved in firm-level strategic decisions
(Mikes, 2008).
A study by Jie (2012) is an example of a mixed method study of exploratory
design. The study which examined the importance of risk-oriented internal audit and
expanded its applications in organisations so as to ensure the effectiveness of the
enterprise risk management.
With regards to ERM practices in Malaysia, although still in its infancy, it appears
to be growing fast. In a 2010 study on ERM adoption, already 37 out of 89 respondents
confirmed complete adoption of ERM, 33 companies had partially adopted ERM, 4
companies planned to adopt ERM, 12 were still investigating adoption of ERM leaving
only the remaining three companies with no intention to implement ERM (Wan Daud,
2011; Wan Daud et al., 2011). The findings of a nationwide survey on risk management
practices, conducted a year later in 2011 by the Internal Audit Association of Malaysia
(IIAM) and Ernst & Young (EY), revealed that companies began to place importance on
the identification, understanding and management of risk because it could help in
business decision making, improve business performance and enhance shareholder
value (Ernst & Young & Institute of Internal Auditors of Malaysia, 2011).
Malaysian experience in ERM can be traced in a series of studies conducted on
ERM from 2010 to 2014 on the various aspects of ERM, namely: (i) the factors
affecting the level of ERM adoption within organisations such as (a) the role of CRO
(Yazid et al., 2011; Yazid, Razali, & Hussin, 2012); (b) the quality of Board of Director
(Wan Daud et al., 2011); and (c) internal auditors (Wan Daud, 2011), (ii) its impact on
the values (Ghazali & Abdul Manab, 2013); and (iii) performance of the firm
(Nickmanesh et al., 2013) as well as (iv) ERM disclosure practices .

51
In terms of disclosure practices among Malaysian companies, the findings by
Ismail and Rahman (2011) demonstrate that there is more room for improvement on the
level of risk disclosure. Findings show that the level of risk management disclosure in
Malaysia from 2006 to 2008 was quite consistent each year suggesting that most of the
companies perform the same level of risk management disclosure practices from year to
year (Ismail & Rahman, 2011).
2.6 Factors Influencing the Effectiveness of ERM in Managing Risks
The factors which are considered in this study include organisational culture
(Martin, 1992; Miccolis et al., 2001; Kimbrough & Componation, 2009; Muralidhar,
2010), structure (Kleffner et al., 2003; Arnold et al., 2007; Arnold et al., 2011),
enterprise systems (Lam, 2000), tone from the top (Leonard-Barton & Deschamps,
1988; Yetton et al., 1999), strategic role of ERM champion (Lam, 2000; Kleffner et al.,
2003; Aabo et al., 2005; Beasley et al., 2005a; Mikes, 2008; Wan Daud et al., 2010;
Pagach & Warr, 2011; Yazid et al., 2011; Mikes, 2014) and the extent of employee
involvement (Milani, 1975; Mia, 1988; Aranya, 1990). In addition, tone from the top is
tested as the mediating variable in this research. The presence of CRO and a separate
ERM unit as the moderating variables are also examined. This section presents each
factor in detail including the findings from the relevant existing effectiveness studies.
2.6.1 Contingent Variables
2.6.1.1 Organisational Culture
Organisational culture is a form of socio-psychological setup and is defined as the
collective values, beliefs and principles shared among the members of the same

52
organisation guiding the thinking and behaviour of members (Cooke & Lafferty, 1989;
Cameron & Quinn, 1999). Culture is the underlying shared values and beliefs that are
the soul to the entity and is reflected in the behavioural norms or expectations that exert
significant influence on employee behaviour and attitudes (Wilkins & Ouchi, 1983;
Cooke & Rousseau, 1988).
The inclusion of culture in contingency-based research is not uncommon. It
represents the evolution of organisational technical foundations into more sociological
concerns (Chenhall, 2003). Culture is a principal aspect of an organisation’s function
and a critical driver of effectiveness in various studies (Schein, 1983, 1984). Empirical
studies have characterised the organisational culture phenomenon and its impacts,
particularly on effectiveness (Cooke & Rousseau, 1988; O'Reilly, Chatman, &
Caldwell, 1991; Carmeli & Tishler, 2004). Among others, these studies offer invaluable
insights pertaining to the roles of specific cultural traits as predictors of effectiveness.
Despite the importance given to culture as an element in an organisation,
empirical research with regard to culture and ERM remains somewhat limited. A few
studies suggested that cultural barriers are the most critical challenges to ERM
implementation (Acharyya & Johnson, 2006; Muralidhar, 2010; Altuntas et al., 2011).
Another study on a group of executives from around the globe found that an
inappropriate organisational culture and difficulties with organisational turf were among
the top barriers to effective ERM implementation (Miccolis et al., 2001).
Kimbrough and Componation (2009) find a positive correlation between
organisational culture and the degree of ERM implementation. The study, which was
conducted on internal audit executives in the US, found evidence of positive correlation
between an organisation’s score on OCA and its score on metrics reflecting the degree
of ERM implementation with organic culture being more likely to boost the speed of

53
ERM deployment and effectiveness.
Organisational culture is given a prominent place in ERM frameworks. COSO
(2004) ERM framework describes the internal environment based on cultural attributes.
It is described as encompassing ethical values, oversight practices and management
approaches of the entity. It further includes people competency and how they are
developed and organised. These cultural attributes are seen as drivers for risk
consciousness within the entity and as such represent a critical factor influencing the
effectiveness of ERM in managing risks.
2.6.1.2 Organisational Structure
Structure is the second organisational factor in the study. Organisational structure
is defined as the internal pattern of roles, communication, authority and relationships
within the organisation.
Otley (1980) submits that organisational structure has a positive relationship with
the effectiveness of accounting systems. More recently, C. L. Lee and Yang (2011) find
that the use of integrated measures has a stronger favourable influence on organisational
performance in mechanistic organisations as compared to organic ones.
Kleffner et al. (2003) has also identified organisational structure as one of the
major obstacles for companies to implement ERM. Subsequently, Arnold et al. (2011)
examined the influence of ERM on the ex-ante development of organisation structures
(i.e. information technology systems compatibility and organisational strategic
flexibility). The study found a strong link between the effectiveness of ERM processes
and organisational structure namely its strategic flexibility which refers to
organisational reactiveness to new regulatory mandates. The study, which was a sequel

54
to Arnold et al. (2007), addressed the questions raised from the earlier study as to
whether there are structural differences between the four firms that contributed to
differing experiences in ERM implementation difficulty and the impact towards
organisational flexibility.
2.6.1.3 Enterprise Systems
In general terms, technology is defined as how the organisation’s work processes
operate (the way tasks transform inputs into outputs) and includes tangible (hardware,
materials, people) and intangible (software and knowledge) elements (Chenhall, 2003).
In the old days, organisations operated on “islands of automation” (McKenney &
McFarlan, 1982) whereby each application system within the organisation was
developed to meet the requirements of a single specific function and they operated
independently of one another. Only from the 1980s onwards, trends are seen towards
developing single integrated information systems to overcome the problems associated
with legacy challenges, cope with Y2K bugs to deliver greater strategic and competitive
advantages to support the growing business (Markus & Tanis, 2000; Loonam &
McDonagh, 2005).
The focus on enterprise-wide data availability is indicative of the need for high IT
compatibility (O'Leary, 2000). Byrd and Turner (2000) define IT compatibility as the
ability to share any type of information across any type of technology component. In
essence, it promotes transparency which allows access to critical data from anywhere
within the organisation through linked and integrated information systems.
According to the Treasury Board (2001), in building an organisation’s risk profile,
relevant information on the business and processes must be aggregated across the

55
strategic and operational levels to understand the risks spectrum better (internally and
externally) and the related opportunities faced by the organisations. To facilitate such
aggregation across the organisation, the Treasury Board further asserts the requirements
for technological support that facilitate risk awareness and management through
information warehousing (Treasury Board, 2001). On the other hand, for the
achievement of ERM objectives, relevant information must be “identified, captured,
and communicated in a form and timeframe that enables people to carry out their
responsibilities” (COSO 2004). This need for data is further highlighted in Ernst and
Young’s (2008) prescribed approach for developing an effective ERM (Ernst and
Young, 2008).
A study on the effectiveness of risk management guidance issued for local
authorities in the UK suggests that in view of the large amount of data involved, use of
computer-based system would be ideal (Crawford & Stein, 2004). Levine (2004) asserts
that from an implementation perspective, the information needs of ERM necessitate the
availability of IT systems that provide a true, unified picture of risk across the
organisation (Levine, 2004). Information and knowledge must be aggregated across
strategic and operational levels of the enterprise to assist managers in understanding and
assessing the existing range of internal and external risks (Treasury Board, 2001). Thus,
one of the fundamental challenges of implementing ERM is aggregating the underlying
data required to monitor the various components of organisational risk (Lam, 2000).
Davenport (1998) illustrates how a few companies exploited their enterprise
systems as levers for control and risk management and as a vehicle to operate and
monitor their operations more efficiently and effectively. For example, the adoption of
enterprise systems at Owen Corning not only led the company to grow internationally
but also cost-effectively through the coordination of order-management, financial
reporting and supply chain processes. Another company, Elf-Atochem, benefits from

56
ES through the consolidation of customer orders and issuance of a single receipt which
reduce the risks of missing billing (Davenport, 1998).
2.6.1.4 Strategic Role of ERM Champions
One of the organisational actors included in the current research is the strategic
role of ERM Champion. The role of a champion is to promote, support and drive the
project he or she is championing. Specifically, he or she provides political support,
facilitates information flow for the project, obtains resources required for the project as
well as overcoming any resistance which may exist within the organisation (Howell &
Higgins, 1990).
Indeed, the appointment of Chief Risk Officer (CRO), which more often than not
is tasked to be the ERM champion, is acknowledged as one of the strongest indicators of
ERM employment in the organisation (Lam, 2000; Kleffner et al., 2003; Aabo et al.,
2005; Beasley et al., 2005a; Mikes, 2008; Wan Daud et al., 2010; Pagach & Warr, 2011;
Yazid et al., 2011; Mikes, 2014). For example, Wan Daud et al. (2010) investigated the
effect of CROs on ERM practices and, based on this study, confirmed the positive
association between quality of CRO and level of ERM adoption. The study, as in other
studies, however, restricted the task of ERM champion to CRO and imposed limitations
to the findings considering that the tasks can be carried out by someone other than the
CRO.
Past studies suggests that responsibility as ERM champion does not necessarily lie
with the CRO. The role can also be undertaken by the chief executive officer (CEO)
(Beasley et al., 2005a; Muralidhar, 2010) or by internal auditors (P. L. Walker, Shenkir,
& Barton, 2003; Beasley, Clune, & Hermanson, 2005b; Kasim, 2011; Wan Daud, 2011;

57
Jie, 2012) and in certain cases, the chief financial officer (CFOs) (Altuntas et al., 2011)
or report to one (Beasley et al., 2005a). While ERM researchers and COSO (2004)
identify CRO as being the one who works with other managers to set up an effective
and efficient risk management system and for helping other managers to give risk
information between entire entities (Lam, 2000; Liebenberg & Hoyt, 2003), there is
evidence which suggests that not all companies have a full time dedicated risk manager
(or CRO) to oversee the risk function in their organisation (Aabo et al., 2005). In
Kenya, only 45% of the companies surveyed indicated that ERM implementation in
their companies is championed by a CRO while 36% is championed by the head of
internal audit. ERM implementation in the remaining 19% are driven by other functions
within the organisation (Waweru & Kisaka, 2013).
Mikes (2009) developed a typology of risk managers or risk specialists as the
drivers for calculative risk management activities. Additionally, a study found that CFO
could also be an affluent person when it comes to ERM implementation (Bloxham &
Borge, 2006). Management accountants or CFOs have in recent times been encouraged
by their professional associations (IMA – Institute of Management Accountants, 2006;
Pollara, 2008) to take on a pro-active role in risk management, so that risks are
embedded within the finance department.
Building on this premise, the current study instead of narrowing the champion of
risk management to only CRO, also considers other roles such as the CEO, the CFO or
the CIA as the possible ERM Champion based on their level of involvement in risk
management activities in the organisation.
The appointment of a top executive to champion ERM implementation will not
generate the outcome intended if such role does not have sufficient influence and
autonomy. Individuals who are higher in rank and/or affiliated with at least one of the

58
high-status departments tend to possess greater autonomy than individuals lower in rank
or affiliated with a lower category (Ibarra & Andrews, 1993). The findings from the
study by Beasley et al. (2005b) further suggests that majority of the designated risk
officers report directly to the top management team or to the risk management
committee which reflects the relatively high organisational position for the role.
Research has shown that companies which failed in the 2008 crisis tend to limit
the access of their risk managers to senior management and their boards of directors
(Robert & Anette, 2012). In short, the research suggests that the unlimited access,
authority and autonomy of the ERM Champion is critical to ERM effectiveness.
2.6.1.5 Employee Involvement
For the purpose of the current study, employee involvement refers to employees’
involvement in the design and implementation of the ERM programme. Generally,
employee involvement is defined as employees’ active involvement in planning and
implementation of any intervention embarked on by the organisation (Nielsen &
Randall, 2012). One study find a direct positive relationship between employee
involvement in the planning and implementation of organisational change interventions
to intervention outcomes (Nielsen & Randall, 2012). Similarly, it has also been argued
that the likelihood of changes in procedures being appropriate and useful is higher if
employees participated in that change (Rosskam, 2009).
The common terms for employee involvement include collective management,
worker empowerment, worker involvement, participatory decision-making, discrete
management, open-book administration, or industrialised equality (Steinheider, Bayerl,
& Wuestewald, 2006).

59
Employee involvement is profound in management accounting research, for
example in the field of budgeting (Milani, 1975; Mia, 1988; Aranya, 1990) and transfer
pricing (Chen, Pan, & Wang, 2008). The role of employee involvement is also
emphasised in the COSO (2004) ERM framework. According to the framework, while
the ultimate responsibility lies with the person at the top, everyone who matters within
an organisation should participate to some degree in the ERM implementation process.
It states that managers “support the entity’s risk management philosophy, promote
compliance with its risk appetite and manage risks within their spheres of responsibility
consistent with risk tolerances”. In simple words, the statement implies that identifying
employees who are keys to risks and gaining their buy-in and support is critical to
successful ERM implementation. The Proviti Guide to ERM further suggests that the
process to implement ERM works best when all the key managers of the organisation
contribute (Protiviti Inc., 2006).
2.6.2 Contingent and Mediating Variable – Tone from the Top
“I may have the title, but [CEO] Jamie Dimon is the chief risk officer of the
company.”
Barry Zubrow, CRO at JP Morgan Chase in (Kaplan & Mikes, 2012)
The above statement by the CRO of one of the firms which survived the 2008
financial crisis has a very important implication on the risk function. The statement
means – in layman terms, that the CRO gets such strong support from the CEO that he
overshadows the CRO himself.
Tone from the top in the current study is defined as the support from the top
management of the company. Indeed, management support is one of the most studied

60
variables in studies on implementation success (Sharma & Yetton, 2003). There is
extensive evidence in the literature which suggests that tone from the top is crucial in
any change of implementation initiatives such as technology (Leonard-Barton &
Deschamps, 1988; Yetton et al., 1999) and data warehousing (Wixom & Watson, 2001).
Kotter (1995), for example, emphasises the need to create a conducive ambience
that is receptive to changes and offers the necessary resources for those initiatives to
take effect successfully. Similarly, studies in enterprise systems implementation also
support the notion that management support is one of the critical success factors for the
systems implementation (Holland, Light, & Gibson, 1999; Nah, Lau, & Kuang, 2001).
A survey done on Malaysian companies by Yusuwan, Adnan, Omar, and
Kamaruzaman (2008) find that lack of management support is identified as the reason
for any defect in the implementation of risk management. The data collected from the
survey indicates that ERM resistance came mainly from the management (63.0% of the
respondents) instead of from the employees (29.6% of the respondents).
2.6.3 Moderating Variable – Presence of CRO and a Separate ERM Unit
Corporate management initiatives to ensure that an effective ERM programme is
in place include establishing the organisational structure and defining the roles and
responsibilities for risk management, such as the role of CROs (Lam, 2000). Indeed, the
hiring of a CRO is one of the strongest indicators of ERM employment in the
organisation (Kleffner et al., 2003; Beasley et al., 2005a; Wan Daud et al., 2010; Pagach
& Warr, 2011; Yazid et al., 2011).
Wan Daud et al. (2010) investigates the adoption level of ERM in Malaysia and
the effect of CROs on ERM practices. In this study, the task of the CRO, explained by

61
COSO (2004) Framework, was investigated. The outcome of the study confirms the
earlier studies that found a positive relationship between quality of CRO and level of
ERM adoption.
Additionally, COSO (2004) framework recommends for a separate dedicated
function to handle strategy – and external-risk management for ERM implementation to
be effective. Among other things, the framework outlines that although the size of the
risk function may vary from company to company, the function must report directly to
the top team implying the importance of such a function within the organisation. Lam
(2009) calls for greater impartiality for the risk management function which is
independent from the corporate and business unit management. Ultimately, risk
management must have an independent voice to be effective. A direct communication
channel to the board is one way to ensure that this voice is heard. According to the
author, it is only with an independent voice that the risk management functions in the
organisation will be effective.
2.6.4 Dependent Variable – Perceived ERM Effectiveness
The dependent variable in the study – perceived ERM effectiveness in managing
risks is the crux of COSO (2004) framework. According to the Framework, an effective
risk management addresses the upside opportunity associated with any events and
mitigates the downside of the negative outcomes which comes with it. It also maintains
that ERM is an important process or means and not an end in itself.
In terms of research, ERM effectiveness has been presented as a necessary
dependent variable in contingency research to determine the appropriate fit with
organisational variables (Otley, 1980; Merchant & Simons, 1986). Beasley et al. (2006)

62
discusses the conditions necessary for a successful ERM programme. The authors posit
that an effective ERM programme should be aligned with performance measurement
and incentive systems. In the following year, a guide book on the best practices in
implementing an effective ERM programme was published (Collier, Berry, & Burke,
2007) reinforcing the need for an effective ERM in managing risks. Work by Paape and
Speklé (2012), Jalal, AlBayati, and AlBuainain (2011), Arnold et al. (2011), Gordon et
al. (2009) and Collier et al. (2007) are among the very few studies on the effective
implementation of an ERM programme.
For example, Gordon et al. (2009) argues that the relationship between ERM
effectiveness and firm performance is contingent upon the appropriate match between
ERM and a few contingency factors affecting a firm.
Collier et al. (2007) examines effective risk management practices at a high level
of aggregation, using broad categories of practices as independent variables. The study
that investigates the effectiveness of risk management guidance issued for the local
authorities reveals that the will to implement an effective risk management can be
developed if the concepts are sufficiently embedded in the operational procedures.
Paape and Speklé (2012) narrowed the scope of their study by looking at the
relationship between specific risk management design choices and their effect on
perceived effectiveness of risk management processes and found a positive relationship
between the two.
Arnold et al. (2011), on the other hand, examined how the effectiveness of ERM
processes from a strategic benefits perspective impacts organisational structure and its
ability to respond to changes in the volatile business environment. The findings shows
that the effectiveness of ERM processes is very predictive of organisations’ strategic
flexibility with the relationship being partially mediated by IT compatibility – the ability

63
to access and utilise enterprise-wide data from across all organisational systems (Arnold
et al., 2011). The study draws on the account of the chief internal audit executives hence
suffers the bias element of a single respondent (of only the chief audit executives) which
may not be reflective of the masses and lack the diverse perspective on the experiences
of other chief executives. On the whole, the study concluded that organisations with
effective ERM processes and flexible organisational structures already in place incurred
little difficulty in implementing new regulatory mandate (in this case SOX 404). On the
other hand, organisations that lacked effective ERM processes prior to any publication
of new regulatory mandate had weaker implementation processes and had a more
difficult experience in complying with the mandates.
The other study by Jalal et al. (2011) seeks to provide empirical evidence that the
eight components of COSO (2004) ERM framework are indeed the antecedents for an
effective and successful ERM programme (COSO 2004). However, they only apply
four out of eight successful factors of good ERM in their study (Jalal et al., 2011).
2.6.5 Control Variable – Regulatory Environment, Size and ERM Adoption
Status
By virtue of its potential influence on the study findings, a couple of variables –
type of company, i.e. listed or non-listed on the main board of Malaysia, size and the
state of ERM adoption – were identified as the control variables in the current study.
According to a study conducted on risk management cost effectiveness, due to
economies of scale larger firms tend to have lower risks management costs than smaller
firms (Schmit & Roth, 1990).

64
2.7 Research Gap
Based on literature review undertaken for the purpose of this research, there is not
much empirical guidance available on perceived ERM effectiveness. Ironically, this is
not surprising. A study by Lecy, Schmitz, and Swedlund (2012) suggests that the
scholarship on effectiveness is dominated by conceptual and theoretical works and
rarely on empirical work. This condition is in the area of ERM (Hoyt & Liebenberg,
2011). The state of ERM effectiveness studies appear to suffer from the same
catastrophic dilemma as organisational effectiveness studies and remains as an
underexplored ‘black box’ with only a handful of ERM studies looking at this aspect of
ERM.
Despite the vast amount of research done on ERM, very few have looked at ERM
effectiveness. Those which looked at ERM effectiveness each deployed their own
instruments to measure such effectiveness. To the best of the author’s knowledge, work
by (Laisasikorn & Rompho, 2014), (Makarova, 2014), Paape and Speklé (2012), Jalal et
al. (2011), Arnold et al. (2011), Gordon et al. (2009) and Collier et al. (2007) are among
the very few studies on the effective implementation of an ERM programme in an
organisation. The following paragraphs summarise these existing studies on ERM
effectiveness and how it differs from the current research.
The earliest study on ERM effectiveness can be traced to Collier et al. (2007). The
study examined the effectiveness of a guidance issued for the local authorities on risk
management instead of ERM itself.
Another study that followed a couple of years later by Gordon and associates is
the closest equivalent to the current study. Unlike the current study which uses primary
data, Gordon and his associates used secondary data and developed a set of indices to

65
measure ERM’s effectiveness as the criterion variable and the predictor variables
consisting of environmental uncertainty, industry competition, firm complexity, firm
size, and board of directors’ monitoring (Gordon et al., 2009).
Unlike other ERM effectiveness studies, Arnold et al. (2011) and Laisasikorn and
Rompho (2014) investigate ERM effectiveness as the independent variable in their
studies. Arnold et al. (2011) examined how the effectiveness of ERM processes from a
strategic benefits perspective impacts organisational structure and its ability to respond
to changes in the volatile business environment. Laisasikorn and Rompho (2014)
investigates the impact of a successful ERM system and a performance measurement
system on the financial performance of Thai listed companies. This study suggests that
the success of an ERM system can be operationalised based on four components
consisting of culture, processes, structure and infrastructure.
Another study on ERM effectiveness was carried out in Russia. The study uses the
traditional classification of risks namely, strategic risks, legal and compliance risks,
operational risks and financial risks in its questionnaire. According to the survey of 120
directors in Russia, 30% of the respondents spent a hefty amount on ERM while the
remainder spent nothing on the basis that ERM implementation was economically
unfeasible. However, the study is mainly descriptive and vague in terms of its
contribution (Makarova, 2014).
While the foregoing studies shed some light on the effectiveness of ERM
implementation and processes, save for one by Gordon et al. (2009), none of them
actually investigates the effectiveness of ERM in managing risks. Furthermore, none of
them actually examined the influence of both the organisational factors and internal
human agencies on ERM effectiveness in managing risks. In terms of the
operationalisation ERM effectiveness, none of these studies used ISO 31000 as the

66
guiding framework. COSO (2004) ERM framework appears to be more common among
the existing literature on ERM. For example Jalal et al. (2011) and Gordon et al. (2009)
with the former using COSO (2004) ERM components as the antecedents for an
effective and successful ERM whereas the latter use COSO (2004) ERM objectives to
measure effectiveness. On the whole, the fragmented nature of these studies, coupled
with the mixed results derived from each, only restrict the conclusion and generalisation
of the findings drawn from these studies.
Another prominent feature of the existing ERM studies is the strong domination
of the technical aspects of ERM adoption and implementation. Common research
themes are namely the financial characteristics of firms which adopted ERM (for
example Pagach & Warr, 2011; Lin et al., 2012), the determinants for adoption (for
example Beasley et al., 2005a; Paape & Speklé, 2012), the ERM impact on firm’s value
and performance (for example Gordon et al., 2009; Gates et al., 2012) and the support
of senior management such as the Chief Risk Officer (CRO) (for example Beasley,
Pagach, & Warr, 2007; Mikes, 2008), Board of Directors (BOD) (for example Wan
Daud et al., 2011; Yazid et al., 2011) and internal audit (for example I. Fraser & Henry,
2007; de Zwaan, Stewart, & Subramaniam, 2011) and the implementation of ERM in
organisation (for example Arena et al., 2010; Tekathen & Dechow, 2013). Without
belittling the contribution of these studies, which offer important insights into the extent
of ERM adoption and its value proposition, they do not necessarily imply that ERM
implementation is effective in managing risks.
Drawing from the above analysis, the lack of research on ERM effectiveness
followed by the research on the social aspects of ERM are among the gaps identified.
Firms, owing to the regulatory requirements, seem to invest resources (Curkovic et al.,
2013) in implementing ERM but are not so enthusiastic in putting in place processes to
review the effectiveness of the risk management programme (Crawford & Stein, 2004)

67
particularly, in managing risks.
In response to this, the main agenda of the current study seeks to narrow these
pronounced gaps which are found in the literature. Although there is growing awareness
of ERM and its effectiveness being one of the prerequisites to reaping its benefits, there
has been scant research on the area of ERM particularly in its effectiveness in managing
risks. Specifically, the existing literature on the organisational factors and internal
human agencies which has influence on the effectiveness of ERM is scarce and almost
non-existent as highlighted in the preceding discussions.
2.8 Summary
The choice of contingent variables is based on a review of contingency-based
literature. Literature on organisational effectiveness, in general and ERM in particular
provide additional theoretical support in the development of the contingent framework
for this study.
The first contingent variable considered in the study is culture. A group of studies
suggested that cultural barriers are the most critical challenges in ERM implementation
(Miccolis et al., 2001; Acharyya & Johnson, 2006; Muralidhar, 2010; Altuntas et al.,
2011). However, to the best of the author’s knowledge, only one study, by Kimborough
& Componation (2009), has looked at culture and found a positive correlation between
organisational culture and the degree of ERM implementation. However, the study in
2009 examined the relationship of culture and the degree of ERM implementation and
not on its influence on the effectiveness of ERM in managing risks (Kimbrough &
Componation, 2009).
Similarly, the influence of organisational structure on ERM implementation has
not been the subject of research particularly in understanding its influence on the

68
effectiveness of ERM in managing risks. A study by Kleffner et al. (2003) identified
organisational structure and resistance to change as the major obstacles for companies to
implement ERM and this is followed by Arnold and associates in 2011 which found a
strong link between effective ERM processes and organisational structure namely its
flexibility in reaction to new regulatory mandates (Arnold et al., 2011).
In parallel, an enterprise technology system, which integrates and aggregates the
information and knowledge across strategic and operational levels of the enterprise to
assist managers in understanding and assessing the existing range of internal and
external risks to provide a true, unified picture of risk across the organisation, is critical
in the implementation process of ERM.
Tone from the top is another contingent actor examined in the current study.
Management support is considered as one of the fundamentals in the implementation of
any management initiatives. This is because such implementation requires investment of
resources (Makarova, 2014) and sometimes has to be taken as priority over other
competing business initiatives, therefore support from management is crucial to put this
initiative into real business practices or policies (Holland et al., 1999; Sharma & Yetton,
2003).
Additionally, the power and authority of the risk champion is paramount to the
effective implementation of any system or programme. The role needs to be positioned
within the organisation in a manner that his objectivity and influence is pronounced.
While there is this traditional belief that the role of risk champion is being carried out by
the CRO, more recent studies indicate that there could be other roles within the
organisation which may be the champion of ERM, especially for smaller set-up entities.
When employees involves themselves in the process, they enhance their
appreciation and awareness among social groups and seniors, and improve employees’

69
value in the firm and ultimately have lower negative consequences of job insecurity in
relation with employees with fewer participative decision-making opportunities (Probst,
2005). When members of the organisation are involved in the decision-making process,
business communication becomes more efficient and as a results more well-organised
outcomes (G. B. Walker, 2007). Employees who were involved in the process of
decision-making ultimately attained organisational goals that influenced them. In this
procedure, involvement may be exercised as a device that develops business relations,
discovers motivations of the workforce and enhances the pace of information
transmission across the company.
By virtue of its influence on perceived ERM effectiveness, a couple of variables –
type of company, i.e. listed or non-listed on the main board of Malaysia (which define
the regulatory framework and size of the company) and the ERM adoption status – were
identified as the control variables in the current study.
Although a few of the variables in the study, namely culture, presence of CRO
and to a certain extent, employee involvement, have somewhat been the subject of
research in ERM, all these studies examine them in the context of its influence on either
ERM adoption or to the least effective ERM implementation process. None of the
studies actually investigates its influence on the perceived effectiveness of ERM in
managing risks. As a result, the findings drawn from the existing studies are insufficient
to draw sound conclusions, on its influence on the perceived ERM effectiveness in
Malaysia. Thus, it is not known if there are any differences in their influence on the
effectiveness of ERM in managing risks as much as they influence the effectiveness of
ERM implementation triggering the need for the current study to be carried out.

70
CHAPTER 3 CONCEPTUAL FRAMEWORK AND HYPOTHESIS
DEVELOPMENT
3.1 Introduction
Building upon the principles of contingency theory complemented by theories of
power and empowerment, the current research proposes that the effectiveness of ERM
in managing risks is contingent upon the appropriate interaction between the
organisational context and the internal human elements within which it operates.
This chapter has seven distinct sections, including the introduction. The following
section 3.2 describes the common theoretical framework in ERM research. In this
section, major theoretical foundation in ERM studies will be discussed. Section 3.3
describes the underlying theory to be applied in the current study. The rationale for such
choice is also explained in this section. Subsequently, in section 3.4 the conceptual
framework for this study is presented and discussed. The development of hypotheses in
relation to the influence of the six contingent variables (namely organisational culture,
structure, enterprise systems, tone from the top, strategic role of ERM Champion and
the degree of employee involvement) on ERM effectiveness is discussed in section 3.5.
The mediating influence of the tone from the top and the moderating influence of the
CRO presence and a separate ERM unit are also hypothesised in the same section.
Description of the control variables follows thereafter in section 3.6 before we conclude
the chapter.
3.2 Common Theoretical Framework in ERM Research
Review of existing literature on ERM shows that diversification and portfolio
theory (Beasley et al., 2007; Hoyt & Liebenberg, 2011; McShane et al., 2011; Tahir &

71
Razali, 2011; Kanhai, Ganesh, & Muhwandavaka, 2014) dominate this field, followed
by agency theory which is found in three instances (Kasim et al., 2011; and Wan Daud,
2011; Nickmanesh et al., 2013).
Others include construal and psychological ownership theory (Xin, 2011), value
maximisation theory of corporate risk management (Woon, Azizan, & Samad, 2011) as
well as contingency and stewardship theory (Gordon et al., 2009). There are also a few
attempts to apply theories which are less common in management control system
research such as dynamic capabilities theory (Musig & Kunsrison, 2012), theory of
cooperative games (Altuntas et al., 2011), resource based view and resource capability
theory (Arnold et al., 2011), TQM theory building (Curkovic et al., 2013) and
absorptive capacity (Arnold, Hampton, & Sutton, 2012). The following discussion
provides some examples of how these theories are being applied in ERM research.
The unique characteristic of ERM in managing risks on aggregate basis is akin to
the portfolio theory of advocating the same aggregation of assets in the portfolio in
order to minimise/maximise the expected costs/return for a given amount of portfolio
risk/assets (Beasley et al., 2007; Hoyt & Liebenberg, 2011). ERM calls for a canopy or
umbrella concept in which risks are to be managed in the form of a portfolio rather than
in silos to allow for better understanding and leverage of inter-risk diversifications and
correlations. A group of researchers applies this theory of portfolio to explain the value-
creation potential of ERM (Beasley et al., 2007; McShane et al., 2011; Tahir & Razali,
2011; Waweru & Kisaka, 2013). Building on Stultz’s work (Stulz, 1996, 2003), Beasley
et al. (2007) suggest that the value-creation of ERM works on a portfolio basis. The
study finds that the perceived value of ERM adopters by the shareholders is dependent
upon the shareholders’ cash holdings which can be used to compensate the cost or value
associated with ERM. Shareholders of large firms with little cash, value ERM more
than those who have more cash. Similarly, shareholders of firms with volatile earnings,

72
low amounts of leverage and cash on hand attach more values to ERM compared to
shareholders of small firms with stable earnings, high amount of leverage and cash on
hand. These relatioship supports the portfolio theorists that the costs of ERM will
compensate the benefits it offer in managing risks, hence lowering the losses (Beasley
et al., 2007).
The investigation on banks in Zimbabwe by Kanhai et al. (2014) finds empirical
evidence to support that the principle of portfolio view of risks is the most important
principle in ERM implementation practices (Kanhai et al., 2014).
Another common theory is agency theory. Agency theory explains the
relationship between principals (commonly the shareholders) and agents (commonly the
company management team) whereby the principal delegates or hires an agent to
perform work in return for reward. The theory posits that the goals of the principal and
agent are aligned such that the principal and agent reconcile different tolerances for risk.
The use of agency theory in ERM research is found in recent work by Wan Daud (2011)
and Nickmanesh et al. (2013). Wan Daud (2011) identifies shareholders as the principal
while the chief risk officer, board of directors and internal auditor as the agent to carry
out ERM activities more effectively (Wan Daud, 2011). Recognising the important role
played by the board of directors, using the same theory of agency and supplemented by
the stewardship theories, Nickmanesh et al. (2013) look at the impact of the principal-
agent relationship by narrowing the scope to only the board of directors and extending
the framework to include organisational performance (Nickmanesh et al., 2013).
Value maximisation theory has also been applied in the study which asserts that
ERM implementation maximises firm’s value through the tangible and intangible
benefits of ERM. In essence, ERM optimises the risk/return profile of the company,
lower costs and increase business performance (Woon et al., 2011).

73
Construal level theory is a theory in social psychology that describes the
relationship between psychological distance and people’s thoughts to generate certain
forms of behaviour. According to the theory, the closer the relationship, the more
abstract it will be thought of, and vice versa. High level of construal results in broad-
mindedness where people look at the bigger picture and not focusing on details. On the
other hand, low level of construal results in narrow-mindedness where people focus on
the present in great detail. According this theory, the integrated approach of ERM will
be more operational by emphasising the desirability among the employees instead of the
feasibility of ERM in the risk management philosophy. Such desirability may improve
employees’ perceived responsibility for risk management which then stimulates
proactive behaviours towards risk management initiatives in the organisation (Xin,
2011).
Using contingency and stewardship theories as the underpinning framework,
Gordon et al. (2009) confirm the general proposition that the positive relationship
between ERM and firm performance is contingent upon the appropriate match between
ERM and the independent variables of ERM environmental uncertainty, competition
within industry, firm complexity and firm size as well as monitoring by board of
directors (Gordon et al., 2009). This form of contingency fit is what was termed as the
congruence form of contingency fit.
Whilst the remaining ERM studies, particularly on the drivers for ERM adoptions
(Beasley et al., 2005a; Beasley, Branson, & Hancock, 2009; Paape & Speklé, 2012;
Yazid et al., 2012), are silent on the underlying theoretical framework; upon reading the
reports, one tends to believe that the studies are very much contingency-based studies of
a Cartesan-Congruence form (Gerdin & Greve, 2004).

74
3.3 Theoretical Framework for Current Research
The current study, which investigates the predictors to ERM effectiveness, seeks
to apply the premises of contingency theory as the anchor theory alongside power and
empowerment theories to explain the interaction fit between the organisational and
internal human factors and ERM effectiveness in managing risks.
Contingency theory of management accounting suggests that there is no
universally applicable system of management control that fits all. Rather the choice of
appropriate (or fit) systems which are effective is contingent upon the circumstances
surrounding a specific organisation (Otley, 1999). Drawing on the same rationale, this
study submits that ERM effectiveness is akin to any management system will also
depend on the context of the organisation in which it operates. The contingent nature of
ERM effectiveness is also acknowledged in COSO (2004) ERM Framework. Here, the
framework suggests that organisation has to choose a system which is most
approppriate and fitting given the organisational contingent factors which shape the
environment within which it operates. To further support the notion, the COSO (2004)
framework states that two organisations should not have similar internal control system
unless the organisations are identical. These statements in the framework imply that the
need for, and the specifics of, ERM may vary in organisational contexts.
Applying contingency theory, this study advances that perceived ERM
effectiveness in managing risks is the outcome of (or contingent upon) the perfect fit of
the contingent variables consisting of organisational culture, structure and the adequacy
of the enterprise systems. On the same footing, the current study seeks to apply the
same theoretical foundation to argue that the perfect interaction between the tone from
the top, strategic role of ERM Champion and employee involvement also have a
positive influence on the perceived ERM effectiveness in managing risks.

75
Further analysis reveals that the application of such theory in effectiveness studies
is not uncommon. It has been used as the theoretical foundation in various fields of
organisational, managerial and economic effectiveness research. It is suggested that an
effective budgeting process is contingent upon the characteristics of the organisation,
environmental circumstances, the technical adequacy of the control system, and the way
in which members of the organisation use the information provided by the system
(Otley, 1978). Additionally, literature on budgeting shows that inaccuracy of budget
estimates are contingent upon the: (1) imperfect forecasting models and (2) divergence
between individual and organisational goals leading to distorted, or biased, information
input to the accounting system (Otley, 1985).
Contingency theory is also used as the basis to explain the relationship between
the degree of fit between organisational requirements for coordination and control with
the design of an accounting information system and perceptions of effectiveness about
the system (Nicolaou, 2000). Contigency framework can also be traced in the research
on business unit effectiveness studies. The study by Jermias and Gani (2004), which
uses the fitness landscape approach to test contingency hypotheses about the
relationship between business strategy, organisational configurations, management
accounting systems, and business unit effectiveness. The empirical evidence from the
study finds a positive relationship between the contingent fit, defined as the weighted
sum of independent fitness contributions of each variable, with business unit
effectiveness (Jermias & Gani, 2004).
Among the most frequently researched external contingency variables is size,
typically defined as the number of work-unit members (Fry & Slocum, 1984).
Environment, the second external contingency factor, has typically been discussed in
contingency theory in terms of a “task” or “technical” environment. This factor is often
thought of as the context immediately surrounding the organisation within which the

76
work unit functions. It is often defined along the axis of “stable” versus “dynamic” and
“simple” versus “complex”.
Building beyond that foundation, modern contingency theorists introduce other
human contingent variables such as suppliers and distributors, consumer interest groups,
customers and competitors, government and unions (Hofer, 1975; Fry & Slocum, 1984;
Hambrick & Lei, 1985; Cameron, 1986b; Souder, Sherman, & Davies-Cooper, 1998; F.
G. H. Hartmann & Moers, 1999; Jermias & Gani, 2004). For example, Hofer (1975)
proposes 54 possible contingency factors followed by Hambrick and Lei (1985) who
suggest a few other contingent factors that may affect strategy.
Thereafter, a study by Jokipii (2010) examines the relationship between the
contingent characteristics and the internal control structure of 741 Finnish firms and
whether it results in a more favourable assessment that firms adapt their internal control
structure to deal with environmental uncertainty and to achieve observed control
effectiveness.
In the early years, proponents of contingency theory apply it mainly to explain the
extent of how organisational structures or management control and design systems are
contingent upon organisational contextual factors such as size, strategy, technology and
environment (Hofer, 1975; Waterhouse & Tiessen, 1978; Otley, 1980; Langfield-Smith,
1997). Recently, contingency theory goes beyond the direct contingent relationship and
distinguishes itself from the traditionalist by emphasising the form of fit or matching
between the contingent variables to result in a certain state of the dependent variable,
such as increased performance (Fisher, 1998) or effectiveness (Cameron & Quinn,
1999; Carmeli & Tishler, 2004; Arnold et al., 2011).
This approach asserts that neither the type of strategy nor the organisational
configuration will directly affect performance. Rather, this approach suggests that the

77
most important determinant of performance is the contingent fit or the interaction
between the chosen strategy and its contextual variables.
Gerdin and Greve (2004) advance the different forms of contingency interaction
among variables. According to them, unlike the congruence approach which ignores
organisational performance in its equation, the contingency approach assumes varying
degrees of fit or interaction and therefore goes on to examine its impact on the
organisational performance. Advocates of contingency theory advance that there are
three alternative forms of fit in contingency theory, namely the selection, interaction
and system approaches (Gerdin & Greve, 2004).
For the purpose of the current research, the interaction approach will prevail and
the data collected from the survey are analysed using interaction statistical tools as
recommended in established contingency-based literature (Schoonhoven, 1981; Drazin
& Van de Ven, 1985; F. G. H. Hartmann & Moers, 1999; Gerdin & Greve, 2008).
Contingency-based studies have had a longstanding footprint in the research
domain. Gerdin and Greve (2004) developed a hierarchical structure of the many forms
of contingency fit found in strategy-based literature (see Figure 3.1 below). The current
study takes the form of cartesian-contingency of both moderation and mediation.
Specifically, the contingency type of fit assumes a positive association between the
organisational factors and internal human elements on the effectiveness of ERM in
managing risks. The mediating role of tone from the top and the moderating role of
CRO presence and a separate ERM unit is also examined in this study.

78
(Adapted from “Forms of contingency fit in management accounting research—a critical review” by Gerdin &
Greve, 2004, Accounting, Organisations and Society, 29, p. 304. Copyright 2004 by Gerdin & Greve)
Figure 3.1: Hierarchical Structure of Different Forms of Contingency Fit used in
Strategy-Management Accounting Systems Research
Despite the merits, contingency theory is not without critics. Among others, there
are claims that the theory failed to address the issue of power and conflict (Hopper &
Powell, 1985). This issue of power is particularly relevant for this research especially in
trying to understand the nature of interaction and fit between the organisational actors
(namely the top management, ERM champion and the employees) and ERM
effectiveness. To address such shortcomings, this study employs the leadership theories
of power and empowerment to examine and also to understand the association and the
atypical non-association between the organisational actors and ERM effectiveness.
Analysis of power (Tannenbaum, 1962; Smith & Tannenbaum, 1963; Kanter, 1989) and

79
empowerment (Spreitzer, Kizilos, & Nason, 1997; Bennis & Nanus, 2004) are among
the principal elements of organisational effectiveness studies.
Power is theorised as the relational concept used to describe the perceived power
of an organisational actor over others (Dahl, 1957; Hickson, Hinings, Lee, Schneck, &
Pennings, 1971; Hinings, Hickson, Pennings, & Schneck, 1974; Enz, 1988). From the
organisational point of view, a person is deemed to have power based on his or her
ability (a) to generate outcome or resources which is valuable to the organisation or (b)
to address and manage the challenges and uncertainties faced by the organisation
(Pfeffer, 1982). From the personal point of view, an actor’s power is manifested in his
or her (a) structural position in the organisation or legitimate power (b) personality or
referent power (c) skills and competencies or expert power (French, Raven, &
Cartwright, 1959) and (d) access to specialised knowledge or information (Bacharach &
Lawler, 1980). The theory of power is very relevant in the examination of power
bestowed upon those at the top of the organisational hierarchy namely the top
management as well as the ERM champion.
Empowerment on the other hand can be defined in the sense of delegating the
power between the superior and the subordinates (Burke, 1986; Spreitzer, De Janasz, &
Quinn, 1999) as well as in the sense of enabling or enhancing the feelings of self-
efficacy among organisational members in situations of possible powerlessness
(McClelland, 1975; Conger & Kanungo, 1988). According to Conger and Kanungo
(1988), there are five phases in the empowering process one of which is employee
involvement. Employee involvement will lead to empowering experience among the
employees and thereafter arouse the continuing behaviour to accomplish the task
objectives. Theory of empowerment is approriate in the investigation into the
involvement of employees in realising the benefits of ERM which is to manage risks
effectively. In this regard, the empowering employees to get involved in ERM processes

80
will ultimately enable the companies to attain the set ERM objectives of managing
risks.
3.4 Conceptual Framework
Figure 3.2: Conceptual Framework
Drawing on the literature on the theory of continency mainly and to a certain
degree the theories of power and empowerment, the current research develops a
conceptual model to explain how ERM effectiveness is being influenced by the
contingent organisational factors and behaviour of the actors.
Figure 3.2 above presents the conceptual framework for the current study. The
identification of the contingent variables for the study is based on the review of
contingency-based literature, organisational effectiveness in general and ERM in
particular. The choice of these variables was further validated by the pre-survey
interviews carried out during the design phase of the framework.
As depicted in Figure 3.2, the six contingent variables for the study consist of the

81
organisational factors of culture, structure, enterprise systems as well as the element of
internal human agencies, namely tone from the top, strategic role of ERM Champions
and employee involvement. The framework further envisages a mediating relationship
of tone from the top between culture and enterprise systems and the perceived
effectiveness of ERM in managing risks.
The moderating influence of CRO and ERM unit is also depicted in the
framework. These contingencies are likely to create risk awareness within the
organisation, facilitate the flow of risk information and encourage openness in
discussing and reporting it as well as commitment in implementing the related risks
policies. The contingency formulation advanced in this study is that the appropriate fit
and interaction between the contingent variables will encourage an effective
compilation and warehousing of risk information which in turn will facilitate an
effective management of risks.
The identified variables for this study are found to have contingent effects on
similar control system effectiveness, thereby justifying the applicability of such
variables for the current study on effectiveness of ERM. For example, the contingent
variables of structure and technology (Hofer, 1975; Waterhouse & Tiessen, 1978; Otley,
1980; Langfield-Smith, 1997) are common in contingency-based research. They have
not, however, been the subject of intense research in ERM studies. In addition,
recognising the dominant influence of culture that shapes the behaviour of top
management and the members in the organisation, the less common contingent
variables of culture, tone from the top, strategic role of ERM Champion and employee
involvement are also introduced into the current contingent framework.

82
3.5 Development of Hypotheses
The current research investigates the extent to which ERM effectiveness is
contingent upon the interaction between the organisational factors (culture, structure,
enterprise systems) and actors (tone from the top, the strategic role of ERM and
employee involvement). To facilitate the investigations, a number of hypotheses are
developed and discussed in the following paragraphs.
3.5.1 Organisational Culture
Contingency-based research in management control systems shows strong
association between cultural dimensions and elements of a system - such as
standardisation, decentralisation) and control system characteristics - such as formality
on controls, reliance of accounting performance measures (Carmeli & Tishler, 2004; S.
K. J. Lee & Yu, 2004) and organisational effectiveness (Yilmaz & Ergun, 2008; Zheng,
Yang, & McLean, 2010)
Organisational culture has been described as an essential predictor of
organisational effectiveness (Cooke & Rousseau, 1988; Denison & Mishra, 1995;
Cameron & Quinn, 1999; Carmeli & Tishler, 2004; Yilmaz & Ergun, 2008). Similarly,
Yilmaz & Ergun (2008) using Denison’s theory of culture find that the cultural traits of
involvement, consistency, adaptability and mission are positively associated with firm
effectiveness. Another study by Carmeli and Tishler (2004) conducted among 93
industrial enterprises hypothesised that internal intangible resources and capabilities
(which includes organisational culture) have more influence on firm performance as
opposed to environmental and structural factors. The findings of the study show that
organisational culture is the third (after perceived organisational reputation and skills of

83
top management) most influencial variable for firm performance.
This leads to the proposition that the ability of ERM in managing risks is
contingent upon the perfect interaction with the organisational culture. An imperfect
interaction may lead to failure or inability of any initiatives (Schwartz & Davis, 1981)
or in this case ERM, to achieve its objectives. Schneider et al. (1996) suggest that there
is no single climate or culture that is best for achieving sustained change. What
determines the right culture to nurture the subject depends on the industry, markets and
the nature of their work force. The role of organisational culture as a contingent factor
to ERM effectiveness is evidenced in various organisational effectiveness studies. For
example, findings by Carmeli and Tishler (2004) exhibit the positive influence of
culture in generating the competitive advantage and above-normal organisational
performance. From the COSO (2004) framework standpoint, cultural attributes are
recognised as the drivers for risk-awareness and risk-conscious mindset which
ultimately represent a critical factor for ERM effectiveness in managing risks. On a
similar note, a group of researchers identify cultural barriers as a restraint to ERM
effectiveness (Acharyya & Johnson, 2006; Muralidhar, 2010; Altuntas et al., 2011).
Based on contingency theory, we therefore propose that:
H1 – There is a positive significant relationship between organisational culture and
perceived ERM effectiveness in managing risks.
The prominent influence of organisational culture on ERM effectiveness goes
beyond doubts as it defines the values and shapes the behaviour of the employees as
well as the degree of interaction among the organisational actors (Barney, 1986)
including the top management team. Smircich (1983) further demonstrates the
intersection by comparing the concepts of culture from both the organisation and
theoretical perspectives. He suggests that bureaucratic cultures respond more favourably

84
to monitoring than supportive cultures. Involving employees in designing the system,
monitoring groups, and restricting monitoring to performance-related activities may
improve attitudes toward monitoring in supportive cultures. In fact, organisational
culture is considered in the literature as one of the key factors that can stimulate
behaviour among members of the organisation towards change or new initiatives.
Culture motivates desire in employees to eventually embrace and get engaged in the
changes (A. Hartmann, 2006).
Drawing on the intersection and the ability of culture to stimulate behaviour, the
current research proposed that there is an implied relationship between culture and the
tone from the top and thereby hypothesises that:
H2 – There is a positive significant relationship between organisational culture and
tone from the top.
3.5.2 Organisational Structure
A study by Damanpour (1991) on the relationship between organisational
structure and innovation shows that the latter influences the capability of an
organisation to adopt and implement successfully any innovative initiatives undertaken.
In literature, structure has been commonly conceptualised to take the extremes of
mechanistic to organic structure (Burns & Stalker, 1961). On one extreme are the
mechanistic organisations that are characterised by more layers in the hierarchy, higher
centralisation, more formalised, micro controls, and a top-down communication. On the
the other are the organic structures that are characterised by fewer layers in the
hierarchy, greater decentralisation, less formalised, macro controls, and a horizontal
communication (Tosi & Carroll, 1976; Hage, 1980; Nahm, Vonderembse, & Koufteros,
2003).

85
Past studies find interesting distinctions between mechanistic and organic
structure with regard to its relationship with system effectiveness. For example, Chia
(1995) found that the need for an integration approach in performance measurement
systems (PMSs) is higher in organic structures yet the effectiveness of using such PMSs
is better achieved in mechanistic structures. The rationale behind such odd relationship
can be explained by the better coordination of the varying roles which facilitate a
decision-making process in the latter. In other words, while it is easier to adopt an
innovation within an organic structure, successful implementation is more achieavable
in a mechanistic one (Rogers, 2010). Such phenomena can also be explained by the
decentralisation nature of the organic structure coupled with a high degree of interaction
and flexibility between departments. The lack of coordination whereby different
departments have different systems defeats the very fundamental nature of the
integration. In support of this notion, the study by Gosselin (1997) finds that an
innovative costing system is only partially implemented in organic organisations but is
embeded and becomes an integral part in mechanistic organisations. This evidence
supports the views that the implementation of innovation is more difficult in organic
organisations, due to the lack of formality and standardisation (Burns & Stalker, 1961).
Gouldner (1954) further suggests that procedural specification which is a
synonym for mechanistic organisations would be an efficient means of supervision.
Similarly, Waterhouse and Tiessen (1978) argue that mechanistic structures (as opposed
to organic) is more akin to formalised and specified procedures and there is a greater
likelihood that such organisations implement evaluations based on specified procedures.
The less formalised the procedures (which is the case in the organic structures), the
more costly it will be to implement any initiatives based on measures of specified
procedures compared to mechanistic structures. The centralisation of decision-making
fosters the flow of information and ultimately improves efficiency and effectiveness

86
(Jansen, Van Den Bosch, & Volberda, 2006). It can therefore be argued that the
effectiveness of using integrated measures such as ERM is higher in mechanistic
structures than in organic ones.
Additionally, mechanistic organisation tend to rely more on the level of
integration compared to organic structure as it integrates and coordinates various
departments with different functions across the organisations. More specifically, the use
of integrated measures is more relevant with respect to performance in mechanistic
organisations than in organic. The study which among others examines the contingent
effect of organisation structure on the design of performance measurement systems
(PMSs) find empirical evidence to support that the positive relation between the use of
integrated performance measures and organisational performance is lower in organic
structures as compared to in mechanistic structure (C. L. Lee & Yang, 2011).
Based on the theory of contingency, the current study therefore proposes that an
integrated risk management approach such as ERM would enhance a mechanistic firm’s
ability to manage risks effectively through the holistic approach of its complex risk
management and requirements. It is therefore hypothesised that:
H3 – There is a positive significant relationship between organisational
mechanistic structure and perceived ERM effectiveness in managing risks.
3.5.3 Enterprise Systems (ES)
Enterprise systems refers to the integrated software packages of multiple
functional applications with a common database (Davenport, 1998). It is a
comprehensive warehousing of all business information – sales, inventory, supply
chain, customer, financial and accounting information – all in a single repository. Once

87
data is entered at its source point, the relevant information is updated across the system.
The distinct character of enterprise systems is the real time availability of a
comprehensive database which allows management to respond and react effectively in
the risk events. It allows an end-to-end solution in such a way that a single transaction
can “flow through” the entire applications suite, from the source to the end of an
automated update of financial and inventory records without additional data entry
efforts. In some systems, the integration is further enhanced by linking up to the
administrative processes (human resources) and management accounting (Fahy &
Lynch, 1999; Granlund & Malmi, 2000; Rom & Rohde, 2006; O'Mahony & Doran,
2008).
The benefits associated with enterprise systems are aplenty. The systems offer
universal and realtime access to operating and financial data leading to a streamlined
organisational structure, creating flatter, more flexible organisations as well as
centralised control of the vast amount of information (Davenport, 1998). Enterprsie
systems can also be the lever for controls. Some executives incorporate some form of
discipline to put the business in order (Davenport, 1998). Holsapple and Sena (1999)
suggest that decision-making is improved with enterprise systems implementation.
Subsequent study by the same researchers further investigated the perception of the
decision-support feature of enterprise systems among the adopters and found that
enterprise systems adopters strongly associate the decision-support characteristics with
their enterprise systems (Holsapple & Sena, 2003). Spathis (2006) listed a number of
accounting benefits of enterprise systems which include flexibility in information
generation, increased integration of applications as well as improved quality of financial
reporting.
Such a new phenomenon in technology certainly warrants a reshape in the way
risk is being managed. The vast amount of information flowing electronically across the

88
organisation and in cyberspace creates the necessities for risks to be integrated and
assessed electronically (Khazanchi & Sutton, 2001; Sutton, 2006). In building an
organisation’s risk profile, information and knowledge must be aggregated across the
strategic and operational levels to assist managers in understanding the range of risks
(internally and externally) and the related opportunities (Treasury Board, 2001). Indeed,
one of the fundamental challenges of implementing ERM is aggregating the underlying
data required to monitor the various components of organisational risk (Lam, 2003;
Ernst & Young, 2011, 2013).
The above discussions lead to the general beliefs that the effectiveness ERM is
contingent upon the presence of enterprise systems. It is therefore hypothesised that:
H4 – There is a significant positive relationship between enterprise systems and
perceived ERM effectiveness in managing risks.
There are various tactics undertaken by behavioural scientists to stimulate change
in organisations. Among others, these tactics include the interventions deliberated to
enhance the relationships between functions and across levels (Schneider et al., 1996).
Using the decomposed theory of planned behaviour, in particular the attitudinal
belief structures, a study by Mahoney (2011) shows that the strategic, transactional and
informational benefits offered by the enterprise system is one of the determinants to
motivate the top management to support the enterprise systems project.
Additionally, based on the presumption that the top management’s primary goal
ultimately is to maximise stakeholder wealth through the long-term performance of the
organisation (Jensen & Meckling, 1976) and that an integrated systems is associated
with high performance, we are proposing that the enterprise system (due to its
integrated nature) has a positive contingent influence on the tone from the top. Anthony

89
(1965), top management will feel more secure with a robust and integrated system
which gives them access to information in seconds. It is implied that the enterprise
systems and the resulted knowledge on the strategic benefits of ERM offers are a
powerful determinant of a top manager’s attitude toward supporting the project.
Accordingly, the study hypothesises the contingent relationship that:
H5 –There is a significant positive relationship between enterprise systems and
tone from the top.
3.5.4 Tone from the Top
The main human element in the current study is tone from the top also known as
management support. Based on Abraham Maslow's Hierarchy of Needs, people need
trust, support, and cooperate to function effectively. Schneider et al. (1996) find that the
sustainable effects from a training programme are negligible unless their superior also
accepted into the new training. The findings of a study on a data warehousing project by
Wixom and Watson (2001) identify significant positive relationship between
management support and the success of any project as it helps to address organisational
issues which may hinder its success.
Kaplan and Mikes (2012) and Lam (2000) argue that support from the
management team one of the contingent factors for an effective risk management. A
company’s ability to weather storms is subject to how executives, especially those who
are directly responsible for risks, take their risk-management function responsibilities
seriously. Kaplan and Mikes (2012) suggest that companies that survive crisis are those
where top management are serious about their risk-management function. Their article
submits that the degree of autonomy (in line with the theory of power) associated with
risk management function is the main element that distinguished the banks that failed in

90
the financial crisis from those that survived. According to the authors, failed companies
have the tendency to relegate their risk management to a compliance function and to
their risk managers who have limited access to senior management and their boards of
directors.
Lam (2000) suggests that one of the seven critical components of ERM which
needs to be addressed by organisations warrants the setting of appropriate tone from the
top both in actions and words. Tone from the top not only supports any implementation
of new initiatives but can also become the main barrier or the obstacles to an effective
programme. For example, TQM models of organisational effectiveness identified ‘weak
management’ as the principal barrier to the successful implementation of a TQM
programme (Schneider et al., 1996).
Similarly, lack of management support is also found to be one of the challenges in
ERM implementation (Yusuwan et al., 2008). According to the survey findings, there
are other challenges which point towards lack of management support. For example,
these include lack of expertise to lead the risk management teams/departments, absence
of set procedure in risk management as well as lack of training to groom risk experts
from within. Although the respondents admitted that they lacked knowledge on risk
management, ultimately the responsibility lies with the top management to create such
awareness and invest in risk management training. Building upon the theory of power,
the study therefore proposes that:
H6 – There is a significant positive relationship between tone from the top and
perceived ERM effectiveness in managing risks.

91
3.5.5 The Strategic Role of ERM Champion
A number of items ERM literature establish the importance of Chief Risk Officer
(CRO) as one of the key drivers to ERM adoption (Lam, 2000; Thiessen, Hoyt, &
Merkley, 2001; Liebenberg & Hoyt, 2003; Beasley et al., 2007; Wan Daud et al., 2010;
Pagach & Warr, 2011). Findings of Mikes (2008) further suggest that the role of a CRO
has evolved dramatically from its traditional role of a compliance officer to a business
partner. The findings from 15 financial institutions show that CROs are involved in the
strategic role within the organisation. Subsequently, Mikes (2014) find that the role of
the CRO has evolved beyond ERM implementation to the creation and internalisation
risk culture within the organisation.
Although the above suggests that the CRO is the key person driving the
implementation of ERM, there were instances where ERM has been successfully
implemented without the presence of CRO (Aabo et al., 2005) especially in smaller
organisations (Gramling & Myers, 2006). In these instances ERM implementation is
driven by other key executives in the organisation, such as the internal auditor (de
Zwaan et al., 2011; Boyle & Boyle, 2013) and the CFO (Bloxham & Borge, 2006).
Drawing on these notions, the current study instead of limiting the champion role to
CRO (as other studies) generalise the role of ERM Champion as one of the contingent
variables for effective ERM.
Building upon critical literature on risk management and the theory of power by
Huber and Scheytt (2013), we argue that the strategic role of the person(s) who
champion the ERM implementation is a contingent factor for an effective ERM
programme in managing risks (Huber & Scheytt, 2013). It gives the actor, in this case,
the risk champion, some power to augment, extend, or disnormalise the risk activities as
it opens up a loophole for fears, panics and anticipations of actors inside the

92
organisations. Findings from a study conducted among internal audit executives in
Malaysia revealed that despite having a separate ERM unit headed by a CRO, only 60%
reported that the CRO was primarily responsible for ERM. It is further revealed that
other functions such as the CFO, CIA or the Audit Committee were instead primarily
responsible for ERM within the remaining 40% of the organisations surveyed (Kasim et
al., 2011). This finding reflects the fact that despite leading the ERM unit, the CRO did
not necessarily have full control or authority of ERM the implementation programme.
The following hypothesis therefore proposes that the strategic role of ERM
Champion affects the perceived effectiveness of ERM in managing risks.
H7 – There is a significant positive relationship between the strategic role of ERM
Champion and perceived ERM effectiveness in managing risks.
3.5.6 Employee Involvement
The third human element included in the current research is employee
involvement. Employee involvement in contingency-based research can be traced some
decades back, for example, Tiller (1983) and Vroom (1959). A more recent study on a
data warehousing project implementation identified a significant positive relationship
between user participation and the likelihood that the project would finish within the
specified timeline, budget and specifications (Wixom & Watson, 2001).
Employees perform an absolutely essential function in creating the climate to
sustain implemented change. The employees from across the organisation are the glue
that holds the change efforts together, the medium for communication, substance of the
change, and eventually the means by which the change becomes enacted behaviourally.
Mikes (2014) suggests that commitment from others in the organisation to accept

93
a relevant and situationally contingent version of risk management is key to an effective
ERM, implying the importance of employee involvement to be considered in the scope
of this study.
Ambrose and Alder (2000), which investigates the influence of employee
involvement on an employee monitoring system, suggests that employees are more
receptive towards an employee-monitoring system if the monitored employees are
involved in the design and implementation of the system (DeTienne & Abbott, 1993;
Ambrose & Alder, 2000). In the same way, Aiello and Kolb (1995) argued that if
employees are involved from the initial phase of a monitoring system implementation
and feel that their input is considered in the system development, they may feel greater
ownership of their work and more motivated. Similarly, using theory of empowerment,
Ottensmeyer and Heroux (1991) demonstrates that when workers are empowered to
participate in the design and implementation of computer monitoring systems, chances
of buy-in by the workers on the new systems is much higher.
Consistent with the existing literature, the current study posits that employee
involvement throughout the risk management process and activities will improve ERM
effectiveness. Involvement from employees facilitates the input, flow and exchange of
information from the employees who are closest to the risk points to other across the
organisation. Drawing upon the theory of empowerment, employees are motivated,
through the involvement process, to convey appropriate risk information to the relevant
authorities who are presumably the risk owners. Based on this information, the well-
informed risk owners together with the ERM Champion then develop an optimal risk
strategy to mitigate risks. Employees will also be more receptive towards such risk
strategies and activities, knowing that it has their elements of input, which further
motivates an even higher level of engagement in the implementation or operational of
such strategies. Hence, it is proposed that:

94
H8 – There is a positive significant relationship betweem employee involvement in
risk management activities and perceived ERM effectiveness in managing risks.
3.5.7 Mediating and Moderating Variables
A mediator specifies how (or the mechanism by which) a given effect occurs
(Baron & Kenny, 1986). Specifically, according to Baron and Kenny (1986), a mediator
is the generative mechanism through which the focal independent variable is able to
influence the dependent variable of interest. A strong relation between the predictor and
criterion variable needs to be established first for a mediating influence to occur
effectively. On the other hand, moderator variables are typically introduced when there
is an unexpectedly weak or inconsistent relation between a predictor and a criterion
variable (Baron & Kenny, 1986). The following Sections 3.5.7.1 and 3.5.7.2 justify the
choice of mediating and moderating variables identified for this study followed by the
hypotheses development.
3.5.7.1 Mediating Influence of Tone from the Top
The words expressed and actions taken by the top management always serves as a
powerful tool in sending the message across the organisational community. According
to Chatterjee et al. (2002) top management championshiop or in the context of this
study, tone from the top, is a “metastructuring action” which can further define values
and norms of how managers should participate in web technological initiatives. The
study further suggests that the metastructuring enabling nature of top management
shapes the direction of the company and in legitimises the influence and structures the
actions of the individual managers and groups.
Empirical evidence further show that top management has strong influence on

95
organisational culture which in turn impacts shapes employees' attitudes towards and
perceived behavioral control over compliance with information security policies (Hu,
Dinev, Hart, & Cooke, 2012). Using theory of planned behaviour, the study which
integrates the role of top management and organisational culture further report that top
management participation in information security initiatives has significant direct and
indirect influences on employees' attitudes towards, subjective norm of, and perceived
behavioral control over compliance with information security policies.
Along the same vein, this current study submits to introduce tone from the top as
the mediating variable in the research model. The investigation into the mediating role
of tone from the top or management support is not new in management research.
Attempts by Huigang et al. (2007) to explain how top management mediates the impact
of external institutional pressures on the degree of usage of enterprise resource planning
(ERP) systems highlights the important role of top management in mediating the effect
of institutional pressures on IT assimilation.
Ultimately, tone from the top has been found to have a disproportionate influence
on organisational outcomes (Child, 1972). Based on this understanding, the current
study proposes that top management support can mediate the relationship between
culture and ERM effectiveness in managing risks. As such, the study proposes that:
H9 - Tone from the top mediates the relationship between organisational culture
and perceived ERM effectiveness in managing risks.
Oh and Teo (2009) finds that enterprise systems play significant roles in building
up IT-enabled ERM capabilities. The empirical findings of the study which was
conducted on organisations in Singapore also suggest that IT-enabled ERM improves
organisational resilience. The potential exploitation of enterprise systems for business
assurance which includes enterprise systems-enabled audit-monitoring and risk

96
management capabilities is huge. Studies show how enterprise systems can be exploited
to monitor customers' profitability and incorporate a threshold to trigger action should
the profitability experience an alarming downtrend (Davenport, 1998). It is also useful
to automate an audit monitoring-surveillance for continuous assurance as well as fraud
detection (Best, Rikhardsson, & Toleman, 2009). The potential of enterprise systems-
ERM functionality as information enabler offers huge benefits to risk management
processes. Its use as an information feeder can be seen through the integration of the
enterprise-wide systems to work seamlessly (Protiviti Inc., 2006) with the ERM system.
While there is overwhelming evidence on the positive influence of enterprise
systems on organisational effectiveness (Gupta, 2000; Poston & Grabski, 2000; Scapens
& Jazayeri, 2003; Rom & Rohde, 2006; Spathis, 2006) and a few on ERM effectiveness
in managing risks (Sutton, 2006), the mediating role of tone from the top on the
relationship between enterprise systems and ERM effectiveness is rarely examined or
non-existent. To the best of the author’s knowledge, to date there is no published study
that examines whether tone from the top interacts with enterprise systems and
eventually improves the effectiveness of ERM in managing risks. In this study, it is
proposed that tone from the top may have a mediating effect in the previously identified
association between enterprise systems and ERM effectiveness as follows:
H10 - Tone from the top mediates the relationship between enterprise systems and
perceived ERM effectiveness in managing risks.
3.5.7.2 Moderating influence of CRO Presence and a Separate ERM unit
Experts suggest that for risk management practices to be effective, a separate
function to handle strategic and external risks management is necessary. In addition,
theory of power further submits that this function should report directly to the highest
authority (Kaplan & Mikes, 2012). The important role of CRO is paramount in ERM

97
programmes on the basis that the impetus for ERM arose when the traditional risk
manager and the financial risk manager began reporting to the same individual in a
corporation (D’Arcy & Brogan, 2001). Appointment of Chief Risk Officer (CRO) is
indeed acknowledged as one of the strongest indicators of ERM employment in the
organisation (Kleffner et al., 2003; Beasley et al., 2005a; Wan Daud et al., 2010; Pagach
& Warr, 2011; Yazid et al., 2011). Wan Daud et al. (2010) investigated the adoption
level of ERM in Malaysia and the effect of CROs on ERM practices. In this study, the
task of CRO, explained by COSO (2004) was considered and it further confirmed the
earlier studies which found a positive relationship between quality of CRO and level of
ERM adoption.
While there are studies which emphasise on CRO presence and the establishment
of a separate ERM unit on the level of ERM adoption, research has yet to investigate
the moderating effect of the two variables on the relationship between the contingent
variables and ERM effectiveness in managing risks. Moderating variable is deemed
relevant for the current research model due to the unexpected lack of relationship
between some of the contingent variables, namely strategic role of ERM champion and
employee involvement and the criterion variable i.e ERM effectiveness (Baron &
Kenny, 1986).
Drawing upon the notion put forward by Baron and Kenny (1986) on the rationale
for a moderating variable, the lack of relationship based on the analysis of the survey
data justifies for a moderator to be introduced. On this basis, the study therefore
proposes that:
H11 - Presence of CRO moderates the relationship between the organisational
variables and perceived ERM effectiveness in managing risks.
H12 - A separate ERM unit moderates the relationship between the organisational
variables and perceived ERM effectiveness in managing risks.

98
3.6 Control Variables
3.6.1 Regulatory Environment and Size
Due to the costly outlays and resources required for ERM implementation to take
place effectively (Makarova, 2014), the likelihood of firms in regulated industries
(Kleffner et al., 2003; Liebenberg & Hoyt, 2003; Beasley et al., 2005a; Gordon et al.,
2009) to implement ERM is much higher compared to those which are not regulated.
In addition, the size of the organisation is also likely to affect the extent of ERM
adoption (Collquit, Hoyt, & Lee, 1999; Thiessen et al., 2001; Beasley et al., 2005a;
Hoyt & Liebenberg, 2011). Beasley et al. (2005) and Hoyt and Liebenberg (2009) found
firm size to be positively related to the adoption of ERM. A study by Gordon et al.
(2009) further shows a statistically significant positive relationship between company
size and the ERM effectiveness which is measured by a special ERM index among the
high performing companies.
COSO (2004) framework further acknowledges the importance of firm size when
designing an ERM system. Larger firms tend to be more formalised and possess
considerable economies of scale to implement ERM. Big firms tend to be more capable
to implement a fully functional ERM system. Similarly, larger companies are likely to
have higher ERM scores (Desender, 2011) although this notion is not supported by a
few (Liebenberg & Hoyt, 2003; Beasley, Branson, & Hancock, 2008; Paape & Speklé,
2012).
Bearing this in mind, the current study which seeks to investigate the
effectiveness of ERM in managing risks defined the companies which are listed on the
main board of Bursa Malaysia to be the sampling frame for data collection. The
rationale behind the sample selection is the main board regulatory and listing

99
requirements which fulfil the criteria of large and regulated organisations. Among
others, the listing requirements for the main board listing require:
A minimum paid-up capital of RM60 million,
5 years profit
Aggregate profit after tax (PAT) of RM30 million
Minimum profit after tax of the latest year of RM8 million
Has business operations (not dormant) in the last 5 years.
In other words, by virtue of the above requirements, one would easily associate
the listing on the main board of Bursa Malaysia as an indication that the companies are
large and have easy access to funds which can eventually be invested in ERM
implementation (Laisasikorn & Rompho, 2014).
Being the frontline regulator of the Malaysian capital market, Bursa Malaysia has
issued various sets of rules to stipulate the requirements that need to be met by the listed
companies either upon admission and/or on a continuing basis. It administers and
monitors compliance with these rules and takes strict, prompt and objective
enforcement action for breaches of these rules. In fact, Bursa Malaysia prides itself as
being an active supervisor and surveillance body for the Malaysian capital market
(source: Bursa Malaysia website).
That said, one would agree that pre-defining the size and the regulatory
environment of companies by identifying the main board-listed companies as the target
respondents for the current study is most appropriate to generate more meaningful and
accurate findings.
100
3.6.2 ERM Adoption Status
To further improve the quality of responses in regards to ERM effectiveness, the
other variable which is controlled in the current research is the ERM adoption status.
This is consistent with the approach undertaken by a study on ERM effectiveness by
Makarova (2014) which sent out questionnaires to companies which had already
implemented some form of risk management standards.
The current study seeks to evaluate the effectiveness of ERM based on self and
subjective assessment of the key functions within the organisation. For better judgment
and assessment of how ERM is effective in managing risks, the organisation needs to
implement ERM. The instruments used to identify the respondents is adopted from
established ERM literature (Beasley et al., 2005a; Wan Daud, 2011; Wan Daud et al.,
2011; Yazid et al., 2011).
3.7 Summary
This chapter highlighted the common theoretical frameworks underlying the
research on ERM as well as organisational effectiveness. The theoretical frameworks
common to ERM research, among others, are portfolio theory, agency theory,
stewardship theory, construal level theory, etc. Thereon, the theoretical foundation for
the current study is identified, i.e. contingency theory as the anchor aided by power and
empowerment theories are identified and discussed in detail. The chapter also elaborates
how the interaction among the variables is developed into hypotheses to be tested in the
current study.

101
CHAPTER 4 RESEARCH DESIGN AND METHODOLOGY
4.1 Introduction
The current study aims to investigate the outcome of six identified organisational
and human factors on ERM effectiveness in managing risks in the presence of CRO and
a separate ERM unit as the moderating variables. In the cases of culture and enterprise
systems, the impact of tone of the top as the intervening variable is also examined.
This chapter outlines the research design and methodology of the mixed method
approach undertaken by the current study. The following section explains the rationale
behind the choice of methodology. The description of the two methods of data
collections namely the online questionnaire and the semi-structured interview formed
the subsequent parts of the chapter.
The two main parts of the study i.e. quatitative and qualitative are explained in
Section 4.4 and Section 4.5, respectively. In Section 4.4 – Quantitative Design, the
population of the study is defined followed by the development of the research
instruments, the pre- and pilot-tests and finally the statistical tools used for data
analysis. In Section 4.5 – Qualitative Design, (the semi-structured interview section),
the interview participants, the interview guide and the method for the interview process
are detailed out. Finally, the data analysis tools are outlined before we conclude the
chapter.
4.2 Research Design – Mixed Method Approach
As implied by the title of this research, the methodology for the current research is
a mixed-methods approach of explanatory sequential design which is a quantitative
approach to be followed by a qualitative approach. The current research aims to add to

102
the existing limited number of mixed-method studies on ERM.
The mixed methods approach which has had its roots over the last 20 years is seen
by many as the “multiple ways of hearing and seeing” (Creswell & Plano Clark, 2007;
Greene, 2007). This mode of research was chosen partly in response to the
recommendation for future studies to opt for a qualitative research method such as case
study, in-depth interviews or a combination with a survey questionnaire to have deeper
understanding of the subject (J. Fraser et al., 2008; Wan Daud et al., 2010; Yazid et al.,
2011).
Quantitative data provides a more general understanding of a problem whilst
qualitative data provide a detailed understanding of a problem. Each provides different
degrees of understanding and generalisability with own sets of limitations. When
researchers quantitatively examine many respondents, the depth of understanding of any
one respondent is diminished. On the other hand, when only a small sample is
examined, the ability to generalise the results to many is lost. Both are complementary
of each other; the limitations of one method can be offset by the strengths of the other.
In other words, the combination of both has the potential of providing a more complete
understanding of the research problem than either approach by itself (Creswell & Plano
Clark, 2007).
Mixed methods research has been defined by Creswell and Plano Clark (2007) –
page 5 as:
“…a research design with philosophical assumptions as well as methods of
inquiry. As a methodology, it involves philosophical assumptions that guide the
direction of the collection and analysis and the mixture of qualitative and
quantitative data in a single study or series of studies. Its central premise is that
the use of quantitative and qualitative approaches, in combination, provides a

103
better understanding of research problems than either approach alone.”
In terms of the current state of ERM as a body of knowledge, quantitative
approach appears to be more prominent compared to other approaches. Most of the
literature found on ERM is conducted empirically, mainly primary data collected
through survey questionnaires (Beasley et al., 2005a; Wan Daud et al., 2010; Jalal et al.,
2011; Wan Daud, 2011; Wan Daud et al., 2011; Yazid et al., 2011; Gates et al., 2012)
followed by secondary data sourced from annual reports, press announcements, stock
prices, and data provided by government and non-government bodies such as the
National Association of Insurance Commissioners, COSO, SIC, etc. (Liebenberg &
Hoyt, 2003; Pagach & Warr, 2007; Gordon et al., 2009; Lin et al., 2012). A handful
number of studies used a case study approach (eight) and a mixed methods approach
(six).
The area of ERM being the subject of research in the existing mixed method
studies varies. Acharyya and Johnson (2006) believed to be the first mixed method
study of explanatory design done on ERM, was to look at the development of ERM at
four major European Insurance Companies. The study, which consists of 62 semi-
structured face-to-face interviews and a structured survey, finds that despite the call for
a holistic approach to managing risks, there was no such approach in the four companies
studied. Rather, they approach ERM in parts. CEO leadership and regulations are found
to be the most important drivers in ERM implementation, whilst communication and
cultural barriers are the most important challenges in ERM implementation. A later
study by Mikes (2008) using survey and over 50 interviews seeks to assess the roles that
risk functions and, in particular, senior risk officers play in fifteen large international
banks. The study found that the role of chief risk officers (CROs) had expanded
dramatically, with more than half of them frequently involved in firm-level strategic
decisions.

104
4.3 Data Collection Procedures
For the purpose of this study, three distinct steps of collecting data are designed:
The first phase is the content analysis of annual reports aimed towards identifying
companies that have adopted ERM (termed hereinafter as ERM adopters). This
identification process has been acknowledged as a major obstacle to ERM-empirical
research because firms do not in general, publicly announce the adoption of ERM and
tend to disclose only minimal details of their risk management programmes (Liebenberg
& Hoyt, 2003; Pagach & Warr, 2010; Hoyt & Liebenberg, 2011). Past researchers,
therefore, resorted either to rely on evidence of existence of ERM programme, such as
the creation of a specialised managerial position, i.e. Chief Risk Officer (CRO) who is
tasked to implement and coordinate ERM programme, or to search for evidence of ERM
activity in the financial reports, newswire or any other media. An early study by
Liebenberg and Hoyt (2003) argue that a CRO appointment signals the initiation of
ERM because CROs are generally appointed to implement and manage ERM
programmes. Based on these studies, ERM adopters were identified through a search for
keywords such as enterprise risk management, strategic risk management, corporate
risk management, consolidated risk management, holistic risk management, integrated
risk management, risk management committee, risk committee, and chief risk officer in
the company’s audited financial statement (Gordon et al., 2009; Hoyt & Liebenberg,
2011; Lin et al., 2012).
The above keywords in general reflect the consolidated and centralised approach
to managing risks as opposed to the traditional, silo-based perspective. This is reflected
in the used of adjectives such as enterprise, strategic, consolidated, holistic and
integrated to describe the risk management activities in the entity (D’Arcy & Brogan,
2001). Analyses of interviews from six case studies in the Gulf Co-operation Council

105
(GCC) oil and gas entities found three emerging themes/trends in the GCC oil
companies namely, standardisation, integration, and centralisation (Muralidhar, 2010) in
support of those adjectives to describe ERM. Keywords such as risk management
committee, and chief risk officer generally indicate the presence of a dedicated unit or
role to oversee all the risk topics in the organisation which is the impetus to ERM
(D’Arcy & Brogan, 2001).
On a separate note, companies’ annual reports are accredited documents disclosing
company’s corporate information. The data contained therein is supposed to be of
authoritative and of credible value because it has passed the scrutiny of the audit
process. It has been widely acknowledged as a public document more than a private one
and that it is a means by which the company uses to communicate with the public. In a
study on annual reports which discusses the various perspectives of annual reports from
the lens of researchers, the authors argue that annual reports can be viewed from their
legitimacy and accountability, which implies that disclosures in the annual reports are
driven by the concerns of external parties beyond shareholders (Stanton & Stanton,
2002). In this regard, ERM could well be one of the top concerns of the stakeholders
given the value maximisation benefits of ERM (Hoyt & Liebenberg, 2011; Waweru &
Kisaka, 2013).
The disclosure via content analysis method is not without its flaws. Among others,
the content analysis method suffers from the lack of mandatory disclosure requirement
for CRO appointment under Rule 9.04 of the Listing Requirements (LR) by Bursa
Malaysia. While Rule 9.04 of the LR states that change of management should be
disclosed accordingly, often the role of Chief Risk Officer is not considered as part of
the management team. Additionally, there are Type I and Type II measurement errors to
be addressed. Type I measurement error occurs when non adopters are misidentified as
ERM adopters particularly if such firm discloses that one of the board members was

106
previously a chief risk officer of another firm, whereas the Type II measurement error is
failure to identify ERM adopters when the firm’s ERM practices are not disclosed using
the keywords defined in this paper.
Recognising the limitations of the content analysis approach and the tendency to
overdisclose, the identified ERM adopters from the content analysis are further
validated by questionnaire survey (Beasley et al., 2005a; Wan Daud, 2011; Wan Daud
et al., 2011; Yazid et al., 2011). Specifically, companies with evidence of ERM
adoption are invited to participate in an online survey which includes a question on the
state of ERM adoption or level of ERM maturity in the company. A web-based survey
method was therefore developed to collect data in the second phase of the research
methodology.
The choice of survey type is particularly critical to minimise the incidences of low
response. A web-based questionnaire approach has proved to generate higher response
rate (Jokipii, 2010; Jalal et al., 2011) as it allows the researcher to monitor the response
rate on a regular basis and send reminders to non-respondents. The real time status of
the respondent also facilitates for an efficient follow-up strategy to encourage response.
Feedback from a pre-survey interview with the industry practitioner is incorporated in
the design of the instruments for the research.
The question used to further verify the ERM adopters is adapted from established
ERM literature which asked respondents to state the the level of ERM maturity in the
company (Beasley et al., 2005a; Wan Daud, 2011; Wan Daud et al., 2011; Yazid et al.,
2011).
The third phase is the conduct of semi-structured interviews to enhance the
understanding of the survey results. The semi-structured interview was guided by
semistructured interview protocol. The targeted interviewees were identified based on

107
their scores of perceived ERM effectiveness, strategic role of ERM champion and
employee involvement.
4.4 Quantitative Design
4.4.1 Respondents to the Online Questionnaire
Being the focus of this study, the most appropriate unit of analysis is the
organisation itself (Hopwood, 1972; Birnberg, 2011).
The target respondents for the survey consist of all ERM adopters listed on the
main board of Bursa Malaysia. The rationale behind the choice of public listed
companies (PLCs) are (1) regulated environment, (2) company size, (3) easy access to
information from Bursa Malaysia, (4) easy access to complete and updated list of PLCs
and (5) the likelihood of ERM adoption among PLCs are much higher due to Bursa’s
guidelines. ERM requires huge amount of investment (Makarova, 2014) and PLCs due
to their size are assumed to have higher likelihood of implementing ERM. All industries
are included in the study although a number of studies opted to exclude financial
services (Jokipii, 2010; Wan Daud et al., 2010; Wan Daud, 2011; Wan Daud et al.,
2011) due to the highly specialised nature of the industry.
The population for the study is identified by carrying out phase 1 as discussed in
the previous section.
First, the list of all the 818 PLCs as of January 2014 was generated.
Then, the annual reports (pdf format) for the period ended 2012 or 2013,
whichever applicable, were downloaded from the company’s website. Out of the
exercise, a total of 14 companies whose annual report is not available on the
website was omitted, leaving to 804 annual reports (in pdf file) to be analysed.
Next, we developed special software to look for the keywords in those

108
documents. The software works to find the pre-defined keywords in the
uploaded pdf files.
The report generated by the software displayed for each of the annual reports part
of the sentences where the keyword was detected and highlighted those keywords. Ten
pdf files were were further removed from the sample set due to compatability issues.
Based on the keyword search, a total of 416 out of 794 companies (or 52%) were
identified as ERM adopters and qualified to be included in the sampling definition for
the survey (see Table 4.1). Finance, industrial products and constructions are among the
top three industries disclosing the ERM keywords in their annual reports. The finance
industry topped the list with 68% disclosing the ERM terms. This is followed by the
industrial products industry with 58% and constructions industry with 54%. All these
had occurred due to the high regulated nature of the finance industry and the high risks
nature of the industrial products and constructions industries. On the other hand, the
lowest three industries demonstrating disclosures are trade services (48%), consumer
products (47%) and REIT (31%). Overall, these findings are consistent with the existing
empirical studies made by Collquit et al. (1999), Kleffner et al. (2003) , Beasley et al.
(2005a) and Soltanizadeh, Rasid, Golshan, Quoquab, and Basiruddin (2014) which find
that ERM implementation level varies according to industries.
Next, each of the 416 companies was contacted via telephone to obtain the e-mail
addresses of the chief risk officers (CROs), the chief internal auditors (CIAs) and the
chief financial officers (CFOs). The chief executive officers (CEOs) are intentionally
excluded from the respondent lists to minimise the element of bias because risk
management is ultimately the responsibility of the CEO (Bursa Malaysia, 2013).
Although the CROs can also pose bias because of their direct involvement in the ERM
implementation, the researchers are of the view that the value of their response

109
outweighs the potential of bias they might have when giving their feedback. As an
additional precautionary measure, the data collected from the CROs can be easily
identified, truncated and excluded from the analysis to detect any form of ‘bias”. Out of
the 416 companies, 86 companies were either not reachable or opted not to participate
in the survey. The remaining 330 companies generated a list of 502 e-mail addresses of
potential respondents which consisted of 78 CROs, 136 CIAs and 288 CFOs.
Table 4.1: Analysis of ERM Adopters (by Industry)
4.4.2 Questionnaire Design
Recognising that most of the ERM variables studied in past literature are
measured using single item metrics (Paape & Speklé, 2012), the instruments for the
current research is designed to have multiple items to minimise the risk of bias and the
inaccurate reflection of the actual contribution of ERM (Ittner & Larcker, 2001).
The questionnaire is broken down into six sections with a total of 19 main
questions and 86 items. Types of measurement scale are either nominal or interval.
Nominal scale is mainly applicable to questions on demographic information while the
Industry
Number of
companies
by industry
A
% by
industry
A/794
Evidence
of ERM
adoption
B
% ERM
adopters by
industry
B/A
Finance 28 4 19 68
Industrial Products 265 33 155 58
Constructions 50 6 27 54
Technologies 21 3 11 52
IPC / Mining / Hotel 10 2 5 50
Plantations 41 5 20 49
Properties 82 10 40 49
Trade/Services 169 21 81 48
Consumer Products 115 14 54 47
REIT 13 2 4 31
794 100 416 52

110
interval scale is made up of a seven-point scale with strongly disagree and strongly
agree endpoints (Hage & Aiken, 1969).
Section 1 of the questionnaire aims to get the background information of the
respondents. Section 2 seeks to identify the ERM Champion for the organisation and his
strategic role based on his involvement in the strategic discussions and decision making
in the organisation. Section 3 captures the respondents᾿ views on the statements related
to culture, structure and the enterprise systems of the organisation which the
respondents represent. Section 4 seeks to gain insights on the tone from the top and
employee involvement. Section 5 is related to the extent of ERM implementation in the
organisation. Finally, the respondents’ perception on the effectiveness of ERM in
managing risks is sought in Section 6. Please see Appendix D for the complete set of the
questionnaire.
4.4.3 Pre-tests and Pilot Tests
Prior to launching the survey campaign, the questionnaire was pre-tested for
validity and reliability. Face and content validity exercise was carried out through a pre-
test by seven experts in the relevant fields of ERM and statistics, two professionals from
the field of audit and finance as well as one audit consultant – each with more than 15
years of experience in their respective area of specialty. Pre-testers were asked to
comment on the readability of the instrument, clarity of instructions and/or any other
feedback to improve the face and content validity of the questionnaire. They were asked
whether or not the questions were clear and measured what they were intended to
measure. The feedback from the pre-testers was addressed and incorporated in the
questionnaire. One of the major modifications made from the pre-test feedback is on the
instrument to measure culture. Initially, the research intended to measure culture based

111
on Denison’s competing value approach. Upon feedback that the instrument was too
complex and confusing and could easily be misunderstood by respondents which may
lead to low reliability and high number of unusable responses, the instrument was
eventually replaced with Wallach’s (1983).
Next, the final version of the questionnaire was uploaded into SurveyGizmo, the
online survey platform. The platform was chosen due to its flexibility. A pilot test was
performed to test the online process and the functionality of the application. The test run
involved tests on the workability and the flow of the questionnaire as well as the
functionality of the reminder and the reporting features.
The respondents for the pilot tests consisted of risks, internal audit and finance
managers of non-listed organisations that have implemented ERM. This is to ensure that
the pilot data replicates the actual data collection environment. A total of 30 respondents
participated in the pilot tets.
The data collected from the pilot tests was then analysed using SPSS (Statistical
Package for Social Science). Based on SPSS reliability analysis, the Cronbach’s alpha
was well above the appropriate range of 0.8 indicating that the questionnaire was
reliable and usable for the current research.
4.4.4 Operationalisation of the Research Variables
There are six main contingent variables in the study. Those are culture, structure,
enterprise systems, tone from the top, strategic role of ERM Champion and employee
involvement in risk management activities. Placed on the other side of the framework is
the dependent variable, namely the effectiveness of ERM in managing risks. This
section discusses how the research variables are being operationalised into valid and

112
reliable research instruments. The instruments to operationalise the variables were
developed based on established literature and frameworks governing ERM, namely
COSO 2004 and ISO 31000. Where necessary the existing instruments are modified to
fit the scope and content of the current study. The complete set of the online instruments
is appended on Appendix D.
4.4.4.1 Contingent Variables
4.4.4.1.1 Culture
Being one of the widest and oldest researched variable, instruments for cultural
exploration is aplenty. Jung et al. (2009) identified at least 70 instruments for cultural
assessment from its electronic searches of 11 bibliographic databases. Among the oldest
were the Critical Incident Technique and Wallach’s Organizational Culture Index which
can be traced back to the mid-twentieth century.
The more recent ones include Hofstede (1980), Schein (1985) and Denison
(1990). Hofstede (1980) stresses that there are national and regional cultural groupings
that affect the behaviour of organisations. He contends that culture is examined in five
dimensions of national influences which consists of power distance; uncertainty
avoidance; individualism versus collectivism; (4) masculinity versus femininity; and
long-term versus short-term orientation.
Schein (1985), on the hand, classifies culture into three dimensions of
assumptions at the first level, values at the second level, followed by artefacts at the
third level. Meanwhile, Denison (1990) explains culture in four distinct hypotheses: (1)
the consistency hypothesis, (2) the mission hypothesis – the notion that a communal
sense of purpose, direction, and strategy can synchronise and move organisational
members toward collective goals; (3) the involvement/participation hypothesis – the

113
notion that involvement and participation will contribute to a sense of responsibility and
ownership, and organisational commitment and loyalty; and (4) the adaptability
hypothesis – the notion that customs and beliefs that enhance an organisation’s ability to
receive, construe, and translate information from the various sources into internal
organisational and behavioural changes will promote its survival, growth, and ultimately
its development. Each of these intstruments is developed to suit the climate, complexity
and multidimensionality of the subject under research. From their massive review of the
existing cultural instruments, Jung et al. (2009) concludes that there is no ideal
instrument for cultural exploration and that any measure is seen as “fit for purpose”
subject to the intent of use as well as the context within which it is to be applied.
The current study therefore adapts the model proposed by Wallach (1983) which
enjoys the impression of being simple and concise (Delobbe, Haccoun, &
Vandenberghe, 2002). The model which consists of only three dimensions, enjoys the
impression of being simple and concise (Delobbe et al., 2002). Schein’s model suffers
from too broad explanatory framework while Hofstede model is applicable when
national culture is the prominent focus. Wallach’s index used in this study is the refined
version of the original one proposed in 1968 which was further modified in 1979.
Although it is one of the oldest theories, it has survived the test of time (Alder, 2001).
Its relevance to current times is evidenced in the application of the index in recent
organisational studies (Koberg & Chusmir, 1987; Kanungo, Sadavarti, & Srinivas,
2001; Lok & Crawford, 2004; Zehra & Bukhari, 2015).
Denison’s more recent competing value approach was initially considered in this
study to measure culture. However, the feedback from pre-tests suggests that it is too
complex and confusing and can easily be misunderstood by respondents which may lead
to low reliability and high number of unusable responses.

114
According to Wallach (1983), culture can be defined as the common beliefs,
values and norms among employees of an organisation. She further advanced that
organisational culture comprises three separate, measurable traits of bureaucratic,
innovative, and supportive – see Table 4.2.
Table 4.2: Wallach’s (1983) Model of Organisational Culture
Type of
culture
Bureaucratic Innovative Supportive
Environment Characterised with clear
lines of authority and
responsibility,
hierarchical and
compartmentalised
Work is organised and
systematic
Characterised by
exciting, dynamic
and creative,
exciting
environment
Characterised by
open, friendly and
harmonious
environment akin to
an extended family
Nature of
company
Large market share in a
stable market, mature and
cautious
Creative and full of
challenges and risks
Warm and fuzzy
place to work
Adjectives
to describe
the
companies
power-oriented
established
solid
regulated
ordered
structured
procedural
hierarchical
sound structure
efficient system
driving
enterprising
challenging
stimulating
creative
results-oriented risk-
taking
trusting
safe
equitable
sociable
encouraging
open
relationship-oriented
collaborative
Adjectives
to describe
the
employees
well trained
monotonous
stable
saturated
followers
Suitable for less creative
and content individuals or
those who are in the
comfort zone and like to
be controlled
constant pressure
burn out and stress
hard to balance
family-work-play
time
Suitable for
entrepreneurial and
ambitious
individuals
friendly
fair
helpful towards each
other.
Suitable for family
oriented individuals
or someone who
places importance
on work-life
balance.
Bureaucratic cultures are characterised by clear segregation of duties and
responsibilities, highly organised and compartmentalised. Adjectives to describe
bureaucratic organisations are hierarchical, structured, regulated, and procedural.
Workers in a bureaucratic environment are described as structured and liking to follow

115
orders. Organisations with innovative cultures are commonly risk-takers and results-
oriented and welcome creativity. The company culture is described as driving,
enterprising and challenging. Workers in an innovative organisation are described as
highly stressed and are constantly under pressure. The core of supportive culture is in its
humanistic principles. The company is considered supportive through its attitudes
towards the employees that are trusting, equitable, encouraging, relationship-oriented
and collaborative. In supportive cultures, workers are described as friendly, fair, and
helpful to each other and to the organisation. Supportive cultures promote ‘‘family
values’’ such as harmony, openness, friendship, collaboration, and trust (Wallach,
1983).
In the survey, the respondents were asked to describe the culture of their
organisations by indicating the rating ranging from seven (best describe my
organisation) to one (least describe my organisation) for the 24 items as shown on Table
4.3.

116
Table 4.3: Instruments Used to Measure Organisational Culture
Please indicate how each of the following statement describes your organisational culture.
Least
describe Best
describe
1. Risk taking 1 2 3 4 5 6 7
2. Collaborating 1 2 3 4 5 6 7
3. Hierarchical 1 2 3 4 5 6 7
4. Procedural 1 2 3 4 5 6 7
5. Relationship Oriented 1 2 3 4 5 6 7
6. Results oriented 1 2 3 4 5 6 7
7. Creative 1 2 3 4 5 6 7
8. Encouraging 1 2 3 4 5 6 7
9. Sociable 1 2 3 4 5 6 7
10. Structured 1 2 3 4 5 6 7
11. Pressurised 1 2 3 4 5 6 7
12. Ordered 1 2 3 4 5 6 7
13. Stimulating 1 2 3 4 5 6 7
14. Regulated 1 2 3 4 5 6 7
15. Personal Freedom 1 2 3 4 5 6 7
16. Equitable 1 2 3 4 5 6 7
17. Safe 1 2 3 4 5 6 7
18. Challenging 1 2 3 4 5 6 7
19. Enterprising 1 2 3 4 5 6 7
20. Established, Solid 1 2 3 4 5 6 7
21. Cautious 1 2 3 4 5 6 7
22. Trusting 1 2 3 4 5 6 7
23. Driving 1 2 3 4 5 6 7
24. Power-oriented 1 2 3 4 5 6 7

117
4.4.4.1.2 Structure
Structure is defined as the internal organisation’s pattern of relationships,
authority and communication (Thompson, 1967).
The most commonly studied dimension for structure is centralisation (Rapert &
Wren, 1998). It has been used as a proxy for organisational structure in most empirical
studies in management accounting for example Gordon and Narayanan (1984),
Chenhall and Morris (1986) and Govindarajan (1988) and indeed proved to be a key
factor in the design of management accounting systems. Centralisation refers to “the
extent to which decision-making power is concentrated at the top levels of the
organisation” (Caruana, Morris, & Vella, 1998, p. 18) as opposed to decentralisation
which is the extent to which key decisions are made by divisional managers.
Weber (1947) however describes organisational structure as multidimensional
instead of unidimensional. He later conceptualised structure into 5 dimensions of
specialisation, standardisation, formalisation, centralisation and configuration (Pugh,
Hickson, Hinings, & Turner, 1968). 64 scales were developed based on these
dimensions and administered to 52 personnel in England. Their findings suggested four
dimensions of specialisation, standardisation, formalisation and centralisation to be
considered in the operationalisation of structure for research purposes.
The dimensions used to measure structure in this research was adapted from the
more recent instruments by Gosselin (1997) which applied the organisational organic
and mechanistic continuum developed by Burns and Stalker (1961). Three dimensions
based on Gosselin (1997), comprising nature of formalisation, hierarchy and
decentralisation were used to distinguish organic and mechanistic structure for the
current study. The following paragraphs define each dimension in detail.

118
Formalisation is defined as the degree to which rules, procedures, instructions,
and communications are documented and formalised. Formalisation helps organisations
to regulate behaviour of its employees and brings about a situation of predictability in
the organisation (Pugh et al., 1968). Decentralisation refers to the level of autonomy
delegated to managers. Decentralisation provides managers with greater responsibility
over planning and control activities and greater access to information not available to
the corporate body (Waterhouse & Tiessen, 1978). On the other hand, hierarchy refers
to the depth of the structure reflecting the number of layers in the organisation
(Gosselin, 1997).
Mechanistic organisations are characterised by many organisational levels, heavy
centralisation, high degree of formalisation, a narrower control range, and higher
dependency on vertical communication. On the other hand, organic structures are
identified by lesser layers in the hierarchy, greater decentralisation, fewer formal rules,
a wider control range, and a horizontal communication (Tosi & Carroll, 1976; Hage,
1980; Nahm et al., 2003). In other words, the higher the scores for the dimension of
formalisation and the lower the scores for hierarchical and decentralisation, the more
mechanistic is the organisation.
The use of these three multi-dimensions (Gordon & Narayanan, 1984; Chia, 1995)
for organisation structure as opposed to a single dimension variable allows for a more
comprehensive consideration of structure particularly where the population involves
companies from different industries (C. L. Lee & Yang, 2011). The dimensions used in
the current study are also common in the investigation of management accounting
systems (Gordon & Narayanan, 1984; Chenhall & Morris, 1986; Chia, 1995; Gosselin,
1997) and internal control systems (Jokipii, 2010).
Furthermore, this instrument developed by Gosselin (1997) who investigated the

119
relationship between structure and the adoption and implementation of activity-based
costing (ABC) in manufacturing firms is deemed appropriate because of the similarities
shared between the dependent variables in the earlier study and the current one, as both
ABC and ERM share the common character of being a new and innovative approach to
improve the firm’s performance. See Table 4.4. for the instruments.
Table 4.4: Instruments Used to Measure Organisational Structure
Nature of formalisation
1. My organisation establishes rules and procedures to show how employees can make
suggestions for changes.
2. My organisation establishes rules and procedures to reflect the experience learned from the
past.
3. My organisation establishes rules and procedures to guide employees to implement
improvement at work.
4. My organisation establishes rules and procedures to encourage employees to be creative in
dealing with problems at work.
5. The employees in my organisation can share opinions with their superior and get involved
in making decisions.
Hierarchy
1. There are only few layers in my organisational hierarchy.
2. My organisation is a lean organisation.
3. My organisation has only few management layers between staff at the basic level and CEO.
Decentralisation
1. The employees in my organisation have the authority to correct problems when they occur.
2. The employees in my organisation are empowered and have control over their job.
3. My superiors are supportive of the decisions made by their team.
The instrument has a total of 11 items, consisting of five items on the nature of
formalisation, three items on the hierarchy and three items on the level of
decentralisation. The respondents were asked to rate the 11 statements given on a seven-
point rating scale ranging from one (strongly disagree) to seven (strongly agree)
(Gosselin, 1997; C. L. Lee & Yang, 2011)

120
4.4.4.1.3 Enterprise Systems
Enterprise systems refers to a single software solution which integrates an
organisation’s business processes (Loonam & McDonagh, 2005). Such systems
“seamlessly integrate business processes and information flows up and down, across
value chains” (Davenport, 2000) and more recently, in and out of the organisation
extending its functionality to include business and supply chain partners (Sutton, 2006;
Woosang & Hokey, 2013). Other terms used to describe enterprise systems includes
enterprise resource planning (ERP), enterprise-wide information systems (EWIS) and
enterprise information systems (EIS). The distinct characteristics of an enterprise
systems are the interlinked nature of business transactions, i.e. the high degree of
automation and integration (Gupta, 2000) as well as real-time information (Nah et al.,
2001).
In this study, enterprise systems are operationalised predominantly based on the
instruments used in the study by Woosang and Hokey (2013). Three dimensions of
integration, adaptation and configuration were adapted. Another dimension i.e. training,
was not included in the current research because it is not within the scope of the current
research. A few items were removed and some wordings were replaced to fit into the
multi-industry nature (as opposed to manufacturing industry) of the current sampling
frame. Three items were added to assess the extent of IT-enabled ERM capabilities
within the organisation. Overall, there are 14 items (see Table 4.5) used to measure
enterprise stystems (see Table 4.5) with a seven-point measurement scale ranging from
one (strongly disagree) to seven (strongly agree).

121
Table 4.5: Instruments Used to Measure Enterprise Systems
General
1. All kinds of business information flow electronically across the organisation.
2. The systems for financial and accounting information, human resource information, supply
chain information, where applicable, are fully integrated.
Integration
1. We seamlessly integrate all business modules in the enterprise system technology.
2. We seamlessly integrate all internal business transactions in the enterprise system
technology.
3. We seamlessly integrate the enterprise system technology with customer and supplier
system, using communication protocols and standards.
Configuration
1. The enterprise system technology in my organisation meets all my organisational needs.
2. The enterprise system technology in my organisation accommodates the relevant changes
required.
3. The enterprise system technology in my organisation supports the business processes and
practices of my organisation (data fit).
Adaptation
1. We can easily alter the enterprise system technology data items, to fit into changing
organisational needs.
2. We can easily alter the enterprise system technology input/output screens, to fit into
changing organisational needs.
3. We can easily alter the enterprise system technology reports, to fit into changing
organisational needs.
Software for ERM
1. My organisation implements risk management software to capture all risk information
which includes the risk events, response and status of each response.
2. The risk management software used in my organisation is accessible to all the applicable
risk owners, line management and the dedicated risk team.
3. The risk management software used in my organisation is integrated with all the other
operating systems in the organisation.
4.4.4.1.4 Tone from the Top
Tone from the top can be defined as “the level of commitment of the senior
management in the organisation to the project in terms of their own involvement and
the willingness to allocate valuable organisational resources” (Holland et al., 1999, p.

122
4). Management support or tone from the top is also described as a widespread
sponsorship for a project across the management team (Wixom & Watson, 2001).
According to Markus (1983), tone from the top overcomes political resistance as well as
encourages involvement from across the organisation. The study which premised
around theories of resistance illustrates through case studies that employees are more
likely to embrace the changes or initiatives supported by the management team given
their high status, authority and autonomy within the organisation.
The three items used to operationalise tone from the top are derived from a COSO
(2004) framework. A seven-point measurement scale ranging from one (strongly
disagree) to seven (strongly agree) is used for the instrument which is shown on Table
4.6.
Table 4.6: Instruments Used to Measure Tone from the Top
1. The internal environment in my organisation provides an appropriate foundation for
ERM.
2. The ‘tone from the top’ sends an appropriate level of emphasis on the importance of
ERM in my organisation.
3. A Board of directors or committee of the board in my organisation is actively involved in
the risk management activities.
4.4.4.1.5 Strategic role of ERM Champion
Project champion is someone who actively supports and promotes the project,
provides information, resource materials as well as political support. The role of project
champion who is responsible for overseeing the entire implementation process is critical
to the success of the project. He/she is one who has the power to set goals and legitimise
change (Bingi et al., 1999; Nah et al., 2001) and ensure that problems arising during the
implementation are tackled effectively (Jarvenpaa & Ives, 1991).
This study, instead of limiting the scope to CRO, uses ERM Champion so as to

123
allow other executives who carries the same responsibility to also be considered in the
study and to determine the necessity of engaging a full time CRO to improve the ability
of the ERM in managing risks.
On the presumption that the role of ERM Champion is akin to that of CRO, the
variable is operationalised based on COSO (2004) definition of the latter. According to
COSO (2004) framework, as the champion of ERM, the CRO facilitates the execution
of the ERM process and infrastructure. His or her role supports the Board or the
designated risk management committee and business unit heads. Using the same
inference, ERM Champions are not necessarily experts in calculating risks, but advisors
who support managers in taking responsibility for risks (Power, 2007). In other words,
the CRO (on the context of this study, ERM Champion) is directly responsible among
others for the overall leadership, vision and direction of ERM, establishing an integrated
framework for all aspects of risks in the organisation and improving the overall risk
management readiness of the organisation.
In the instruments used, the respondents were first asked to identify the ERM
Champion in the organisation based on the three main roles of (1) establishing an
effective risk management programme, (2) reporting the relevant risk information as
well as (3) monitoring all the risk management activities for the organisation. Those
roles are adapted from Mikes (2008). Respondents can choose out of the pre-defined
roles of chief executive officer, chief risks officer, chief financial officer and chief
internal auditor. If it is none of the above, they can choose others (with the specific
function to be specified by respondents).
Once the identity of the ERM Champion has been established, the respondents
were asked to answer four questions regarding the strategic power of the ERM
Champion and his or her involvement in board-level strategic decision making. The four

124
items were developed to measure the extent of power based on potential-enacted power
model by Provan (1980). The first two items measure the position of the champion and
his or her reporting line which represent the potential power dimension of the Champion
(Provan, 1980). The remaining two items indicate his or her involvement in the projects
as well as involvement in board-level strategic decision-making which represent the
enacted power dimension (Mikes, 2008). These items were modified from its original
version to fit into the current scope and format of the study. The respondents were asked
to rate the statements regarding the power of ERM Champion on a seven-point rating
scale ranging from one (strongly disagree) to seven (strongly agree) as indicated on
Table 4.7.
Table 4.7: Instruments Used to Measure the Strategic Role of ERM Champion
An ERM Champion is primarily responsible for the following tasks in relation to
the implementation and coordination of ERM programme.
Establishing effective risk management programme for the organisation.
Reporting the relevant risk information up, down and across the organisation.
Monitoring all the risk management activities within the organisation
Please choose one of the following role in your organisation who has the
responsibility for all or most of the above tasks.
A. Chief Executive Officer
B. Chief Risk Officer
C. Chief Internal Auditor
D. Chief Financial Officer
E. Others. Please specify ___________________
The following statements refer to the power of the ERM Champion whom you have
identified above. Please indicate your agreement to each of the following statement by
circling ONE of the number/rating below regarding the power of ERM Champion in your
organisation.
1. The ERM Champion is a member of the Management team.
2. The ERM Champion reports directly to the CEO or the Board of Directors
or the Audit and Risk Committee.
3. The ERM Champion is involved in the setting up of new ventures or new
projects.
4. The ERM Champion participates in board-level strategic decision making
(i.e. M&A, portfolio rebalancing, etc.).

125
4.4.4.1.6 Employee Involvement
Employee involvement as a variable in research is common in a behavioural-type
of research. Numerous amounts of literature provide evidence of employee involvement
in the successful planning and implementation of organisational initiatives and change
(Rosskam, 2009; Nielsen & Randall, 2012) especially in the field of budgeting. There
are studies that document the positive relationship between involvement and job
satisfaction (for example Kenis, 1979; Hofstede, 2001). According to the studies, the
positive association subsequently generates favourable attitudes towards budgeting
among employees - the results of increased motivation which is the outcome of
involvement (Stedry & Kay, 1966; Brownell & McInnes, 1986).
Three items were developed to measure the extent of employee involvement in
ERM activities carried out in the respondent’s organisation. The items were adapted
from Randall, Nielsen, and Tvedt (2009) with some modifications to fit into the subject
of the research. The respondents were asked to rate the statements regarding employee
involvement on a seven-point rating scale ranging from one (strongly disagree) to seven
(strongly agree) as per Table 4.8.
Table 4.8: Instruments Used to Measure Employee Involvement
Please indicate your agreement to each of the following statement regarding the extent of
employee involvement in ERM activities in your organisation.
1. Employees are involved in identifying the key risk area.
2. Employees are involved in defining the risk mitigating initiatives.
3. Management put in great efforts to involve employees in ERM processes/activities.

126
4.4.4.2 Dependent Variable – Perceived ERM Effectiveness
Prior to measuring the effectiveness of ERM in the workplace, the respondents
were asked to choose the statement which BEST described the level of ERM
implementation and the level of ERM adoption in their organisation. This measurement
on the extent of ERM implementation is adopted from Paape and Speklé (2012). They
added additional descriptive detail regarding manifest ERM practices to the original
scale developed by Beasley et al. (2005a). The respondents were also asked to indicate
the number of years ERM has been implemented at their workplace – see Table 4.9.
Table 4.9: Instruments Used to Measure Level of ERM adoption
Please choose the statement which BEST described the level of ERM implementation in
your organisation.
A. We identify, assess, and control strategic, financial, operational, and compliance risks;
ERM is an integral part of the (strategic) planning & control cycle. B. We identify, assess, and control strategic, financial, operational, and compliance risks;
we are in the process of implementing a complete ERM. C. We identify, assess and control risk in specific area; we are planning to implement a
complete ERM. D. We actively control risk in specific areas (e.g. health & safety, financial risk); we are
considering to implement a complete ERM.
Please indicate the number of years ERM has been implemented in your organisation.
A. In the first year of ERM
B. In the year 2 – 3 of ERM implementation
C. In the year 4 – 5 of ERM implementation
D. Beyond the fifth year of ERM implementation
E. Not implementing ERM
Thereafter, respondents are asked on their perceived effectiveness of ERM which
is based on the ability in achieving the objectives of ERM as well as the eleven
principles for an effective ERM as stipulated in ISO 31000. The following discussion
justifies the choice.
Chambers (1992) defines effectiveness as “doing the right thing”. According to
oxforddictionaries.com, effectiveness is the “degree to which something is successful in

127
producing a desired result”. What is seemingly different in definition, in essence refers
to the same thing which is the ability to produce the desired results, that it is not just
about the ratio of input to output, but instead relates to the extent to which a measurable
result is obtained (Ciocoiu & Dobrea, 2010). According to dictionaries.com, when
something is deemed effective, it means it has an intended or expected outcome, or
produces a deep, vivid impression. On the contrary, an ineffective programme simply
means that it does not achieve the objectives it is set to fulfill in the first place (Rainer,
2013).
Guidance from existing studies on how ERM effectiveness can be best measured
is almost non-existent. This is because studies on ERM effectiveness in managing risks,
empirical or otherwise, are only a handful. Work by (Collier et al. (2007); Gordon et al.
(2009); Jalal et al. (2011); Laisasikorn and Rompho (2014)) and Paape and Speklé
(2012) are among the very few studies on the effective implementation of an ERM
programme in an organisation. While these studies shed light on what makes an
effective ERM implementation, each deploys its own technique to measure the
effectiveness of ERM processes indicating already the lack of consensus on the
appropriate instruments. See also Appendix C for the list of empirical studies conducted
in regards to ERM effectiveness.
Collier et al. (2007) examine risk management practices at a high level of
aggregation, using broad categories of practices as independent variables, rather than
specific instruments and techniques. The study investigates the effectiveness of risk
management guidance issued for the local authorities in the UK. It uses structure
dimensions of the risk management function, and the risk management processes of risk
identification, risk register, reporting and independent review to measure effectiveness.
Respondents were also asked to map their organisations as fatalists or risk skeptical,
hierarchists, individualists or entrepreneurs or egalitarians or risk aware. The study

128
reveals that the will to implement an effective risk management can be developed if the
concepts were sufficiently embedded in the operational procedures. In this regards,
knowledge management is an important element in managing risks.
Paape and Speklé (2012) narrow the scope of their study by looking at the
relationship between specific risk management design choices and their effect on
perceived risk management effectiveness. They measured ERM effectiveness by merely
asking respondents to score the quality of their risk management on a ten-point scale.
The broadness and openness of such single-item survey captures only respondents’
subjective assessment of the contribution of the risk management system to the
attainment of the organisation’s (implicit or explicit) risk management objectives using
a general statement. In addition, it suffers from the lack of definition of a risk
management system, and the dimensions that should be included in the quality
assessment.
A study by Arnold et al. (2011) subscribes to the participants’ assessment on a
five-rating scale on the effectiveness of their firm’s ERM procedures at a strategic level.
Five statements describing these ERM process was developed for this purpose as
follows: 1. Our organisation performs a thorough enterprise-wide risk assessment at
least once a year; 2. The strength of our internal control system enhances our
organisation’s ability to identify events that may affect the achievement of our
objectives; 3. Our organisation regularly evaluates the effectiveness of internal controls
to mitigate identified risks; 4. Management has effective processes to respond to
identified risks; 5. Our risk management procedures provide the necessary information
top management needs to monitor changes that could impact our organisation’s
wellbeing.
The other study by Jalal et al. (2011) used four out of the eight components of

129
COSO 2004 as the antecedents for a good ERM programme (COSO, 2004). These
components are risk assessment, control, communication and monitoring ignoring the
remaining four components of internal environment, objective setting, event
identification and risk response.
Laisasikorn and Rompho (2014) investigate on the relationship among a
successful ERM system, a performance measurement system and the financial
performance of Thai listed companies. They suggest that the success of an ERM system
can be operationalised based on four components consisting of culture, processes,
structure and infrastructure. Each respondent was asked to rate the overall ERM system
success score based on the a number of statements related to the components of a
successful ERM system using a scale of one to five, where five means the most
successful and one means the least successful.
Out of the studies on ERM effectiveness, Gordon et al. (2009) is the only study
which uses proxies to measure ERM effectiveness. In the study, they came up with what
they termed as ERM Index (ERMI). The index is developed based on ERM’s ability to
achieve its objectives (based on COSO 2004 framework) relative to strategy. The
univariate tests performed to test the mean differences between ERMI for ERM
adopters and non-ERM adopters however show insignificant differences between the
two groups. The authors even admitted that evidence from the uni-variate test suggests
that its ERMI is only a fair and not a perfect, index for measuring the effectiveness of
ERM (Gordon et al., 2009).
The tendency to use non-financial qualitative measures instead of using proxies to
measure effectiveness is also evident in other effectiveness studies. For example, a
company that focuses on product innovation (prospector) may not see consider (short-
term) profits as a good measure of the effectiveness of their strategy as financially-

130
oriented forms do not consider return on investment as a good indicator (Dearden, 1987;
Merchant, 1989). Accordingly, user perception is more common to measure
effectiveness. For example, system users’ satisfaction with the perceived quality of
information outputs provided by the accounting system has been suggested as an
important measure of its effectiveness (Kim, 1989; Seddon & Yip, 1992; Nicolaou,
2000). The above research essentially reflects that effectiveness is not always measured
by financial proxy but by the objectives of the subject/object which effectiveness is
being measured which is not always quantifiable. Additionally, according to Reimann
(1974), in case where appropriate financial indices to quantitatively measure
effectiveness of ERM are hard to obtain or simply non-existent the use of perception by
the top executives to measure effectiveness has been the most common alternatives
(Lawrence & Lorsch, 1969; Reimann, 1974).
The current study, therefore, used the self-assessment method to measure ERM
effectiveness (Bollen, 1998; Jokipii, 2010). Such an approach was supported by
Govindarajan (1988) and Govindarajan and Fisher (1990) who argued that due to the
numerous possible performance dimensions that are critical in measuring the success of
a firm, a subjective approach is the best approach to be taken in measuring
effectiveness.
Essentially, there are two parts to the instruments on ERM effectiveness used in
this study. The first part is the perceived ERM effectiveness based on the ISO 31000 11
principles for an effective ERM. ISO 31000 is deemed to be more applicable on the
basis that it is more up-to-date as well as being more commonly referred to in the
market (Power, 2007) as compared to COSO 2004 framework which is more prevalent
among financial services companies. See Table 4.10.
The second part of the measurement is developed based on the achievement of

131
ERM objectives as set out in the definition. Here, the objectives of implementing ERM
are derived from analysing the various ERM definitions. According to COSO (2004)
framework, the objectives of implementing ERM is twofold, namely “to identify
potential events that may affect the entity, and manage risk to be within its risk appetite,
to provide reasonable assurance regarding the achievement of entity objectives”.
Table 4.10: Instruments Used to Measure ERM Effectiveness Based on ISO 31000
1. Risk management activities in my organisation create and protect organisational value.
2. Risk management in my organisation is part of the management responsibilities and is
embedded in all the organisational processes, including strategic planning as well as
change management activities.
3. Risk management helps decision makers make informed choices, prioritise actions and
distinguish among alternative courses of action.
4. Risk management activities in my organisation consider all kinds of threats and
uncertainties, the nature of those threats and uncertainties, and how they can be
addressed.
5. The risk management programme in my organisation is systematic, structured and
timely.
6. Risk management in my organisation is based on the best available information
including, but not limited to historical data, past experience, inputs from stakeholders
and experts, observations and forecasts.
7. Risk management in my organisation is aligned with the organisation’s external and
internal context and risk profile.
8. The risk management function in my organisation recognises the capabilities,
perceptions and intentions of external and internal people that can facilitate or hinder
achievement of the organisation’s objectives.
9. Risk management activities in my organisation involve stakeholders and decision
makers at all levels of the organisation in a timely manner to ensure that risk
management remains relevant and up-to-date.
10. Risk management in my organisation is dynamic, iterative, and responsive to change.
11. My organisation develops and implements strategies to improve risk management
maturity alongside all other aspects of their organisation.
On the other hand, if one were to look at the definition of ERM based on ISO
31000, one may argue that the objective of risk management activities is to direct and
control an organisation with regard to risks. In other words, an effective ERM
programme will enable an organisation to coordinate and manage the full spectrum of
risks faced and managing the combined impact of those risks to minimise unfavourable
surprises and losses.

132
Ultimately, five sets of objectives were derived from the definitions, which are
then developed into five objective statements as shown on Table 4.11, whereby the
respondents were asked to indicate the effectiveness of ERM in achieving these
objectives.
Table 4.11: Instruments Used to Measure ERM Effectiveness Based on Objectives
The following statements refer to the organisation's ability to achieve the
objectives set for ERM. Please indicate the extent to which the objectives can be
effectively achieved in your organisation.
1. ERM enhances my organisation ability to identify and assess risk events effectively.
2. ERM enhances my organisation ability to manage risks within its risk appetite and risk
tolerance level.
3. ERM enhances my organisation ability regarding the achievement of entity objectives.
4. ERM enhances my organisation ability to minimise unfavourable surprises and
losses.
5. ERM enhances my organisation ability to optimise the potential upside effects from
the opportunities arising from the uncertainties.
For the first part i.e. the ISO 31000 eleven principles of ERM effectiveness, the
respondents were asked to rate on a scale of one to seven (one strongly disagree and
seven strongly disagree). As for the observed effectiveness based on ERM’s ability in
achieving its objectives which is the second part, the respondents were asked to rate on
a scale of one to seven (one being entirely ineffective and seven being entirely
effective).
4.4.4.3 Moderating Variables – Presence of CRO and a Separate ERM Unit
The moderating variables are categorical data whereby respondents were asked if
the organisation appointed a CRO and have a separate ERM unit. These questions are
included in Section 1 of the questionnaire which seeks to get background information of
the respondents.

133
4.4.4.4 Control Variables – Regulatory Environment, Size and ERM
Adoption Status
Three control variables, namely the regulatory environment, size and the ERM
adoption status are controlled in the current study. These variables were controlled to
make the findings more meaningful so that they will not interfere with or upset the
results of the analysis. By controlling these variables, only companies which are listed
on the main board of Malaysia and have implemented ERM will be included in the data
analysis. Table 4.12 shows the operationalisation of the control variables selected and
their source of information.
Table 4.12: Operationalisation of Control Variables
No Variables Acronyms Operationalisation Source of
Information
1 Regulatory
Environment
and Size
LISTED Companies listed on the main board of
Bursa Malaysia
Bursa
Malaysia
2 ERM
Adoption
ERM
Adoption
Content analysis to identify ERM
adopters based on disclosure in annual
reports. Additionally, a question was
included in the online questionnaire to
indicate the number of years ERM has
been adopted in the organisation.
Online Survey
4.5 Qualitative Design
To further supplement the data collected from the online survey, the qualitative
tail of the research is designed to offer further explanation and justification on the non-
association between the aforementioned variables under study. The qualitative research
method used in the current study is predominantly semi-structured interviews, content
analysis of the annual reports and any other form of publicly available documents on the
company website as well those provided by the interviewee, particularly on the risk
management practices.

134
4.5.1 Interview Participants
The interview participants were selected from the survey respondents’ list. The
selection is based on the scores of the variables which requires further in-depth
investigation namely, ERM effectiveness, and strategic role of ERM Champion and
employee involvement. The scores were defined as low and high based on the 33 and 67
percentile - companies which scored below the 33 percentile, will be defined as low and
any scores above the 67 percentile will be considered as high in the variable being
measured.
The high-low scores were then plotted on an x-y axis four dimensions of:
1. High strategic role of ERM Champion / High ERM effectiveness
2. High strategic role of ERM Champion / Low ERM effectiveness
3. Low strategic role of ERM Champion / High ERM effectiveness
4. Low strategic role of ERM Champion / Low ERM effectiveness
Similarly, the matrix to the right displays the employee involvement and ERM
effectiveness ranging in scores from high to low yielding four dimensions of:
1. High employee involvement / High ERM effectiveness
2. High employee involvement / Low ERM effectiveness
3. Low employee involvement / High ERM effectiveness
4. Low employee involvement / Low ERM effectiveness
4.5.2 Interview Guide
An interview protocol was prepared beforehand to ensure that the scope of the
study was covered during the interview session. The protocol serves only as guide and
should not limit “the natural storytelling urge of the interviewee”. Essentially, the actual

135
questions were tailored in accordance with the flow of the actual interview session to
suit the background of the respondents and their role in ERM. On most occasions, there
were additional questions to probe for further clarifications from the interviewees.
There were five sections to the guide. The first section dealt with the background
information of the respondents followed by Section 2 which sought to gain
understanding on the ERM practices within the organisation and ultimately the
respondents perceived effectiveness of ERM in managing risks. Section 3 addressed the
questions on the extent of employee involvement in ERM activities. Section 4 dealt
mainly with the strategic role of ERM Champion. The final section is just a sanity check
on the remaining organisational factors identified for the current study. Please refer to
Appendix E for the complete interview guide.
4.6 Mode of Data Analysis
This section will discuss in detail the process undertaken before analysing the data
collected from both the quantitative and qualitative design.
4.6.1 Data from Quantitative Design
4.6.1.1 Coding and Labelling
The quantitative data to test the hypotheses for the current study was collected
through an online survey campaign. Codes and labels were compiled in a codebook
prepared for ease of reference.

136
4.6.1.2 Preliminary Data Analysis
Surveygizmo, the online application used to host the survey generates a
spreadsheet of all the responses which is used for data analysis. The spreadsheet
eliminated any error which might occur when transferring the data from paper-based
responses, as in the case of a mailed survey approach. Only completed responses were
included in the data analysis.
Additionally, the online survey was developed in such a way that respondents
were required to complete the questions before proceeding to the other parts of the
survey. This control feature further eliminated the risks of missing data in the completed
responses. To understand the profile of the respondents and to determine any anomalies
in the data and/or unusual distribution of data, frequency distribution and descriptive
statistics of the data were performed using SPSS prior to hypotheses testing.
To test for non-response bias, the final samples of respondent are divided into
early and late respondents (Williams & Seaman, 2001) before the independent T-test
were run.
T-test and one-way between-groups analysis (ANOVA) techniques are performed
to assess any statistical significant differences in the means between two or more
populations (Hair, Black, & Anderson, 2010). Specifically, a T-test was conducted to
determine the difference between some of the demographic variables, namely the
presence of CRO and establishment of a separate ERM unit to oversee the ERM
activities within the entities. On the other hand, one-way between-groups analysis
(ANOVA) techniques are performed to assess any statistical significant differences in
the means between two or more populations under the demographic variable, such as
the department of the respondents and organisational strategy.
Common method bias is referred to as the deviation in survey responses because
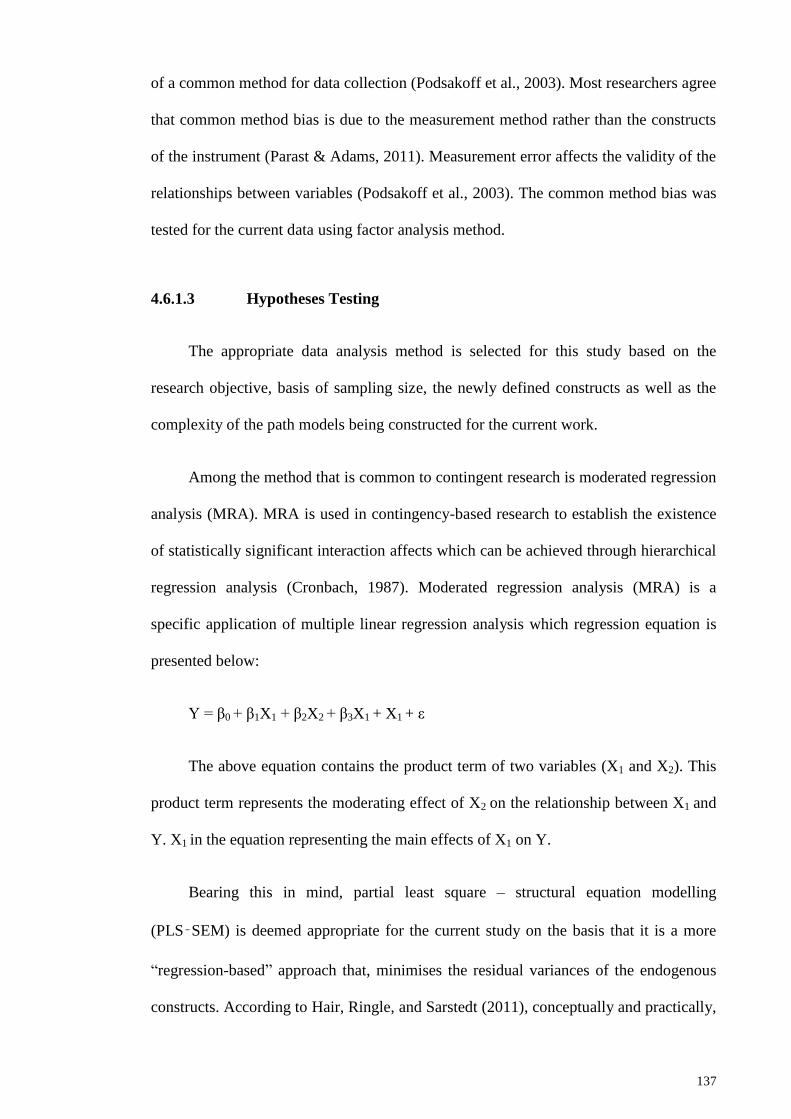
137
of a common method for data collection (Podsakoff et al., 2003). Most researchers agree
that common method bias is due to the measurement method rather than the constructs
of the instrument (Parast & Adams, 2011). Measurement error affects the validity of the
relationships between variables (Podsakoff et al., 2003). The common method bias was
tested for the current data using factor analysis method.
4.6.1.3 Hypotheses Testing
The appropriate data analysis method is selected for this study based on the
research objective, basis of sampling size, the newly defined constructs as well as the
complexity of the path models being constructed for the current work.
Among the method that is common to contingent research is moderated regression
analysis (MRA). MRA is used in contingency-based research to establish the existence
of statistically significant interaction affects which can be achieved through hierarchical
regression analysis (Cronbach, 1987). Moderated regression analysis (MRA) is a
specific application of multiple linear regression analysis which regression equation is
presented below:
Y = β0 + β1X1 + β2X2 + β3X1 + X1 + ε
The above equation contains the product term of two variables (X1 and X2). This
product term represents the moderating effect of X2 on the relationship between X1 and
Y. X1 in the equation representing the main effects of X1 on Y.
Bearing this in mind, partial least square – structural equation modelling
(PLS‑SEM) is deemed appropriate for the current study on the basis that it is a more
“regression-based” approach that, minimises the residual variances of the endogenous
constructs. According to Hair, Ringle, and Sarstedt (2011), conceptually and practically,

138
PLS‑SEM is similar to using multiple regression analysis which in the most common
method to analyses the cause-effect relationship in a contingent-based studies.
Additionally, as opposed to covariance-based structural equation modelling (CB-
SEM), SmartPLS 3.0 is a causal modelling approach aimed at maximising the explained
variance of the dependent latent constructs. On the other hand, CB‑SEM’s objective is
reproducing the theoretical covariance matrix, without focusing on explained variance.
The rule of thumb says that if the research objective is theory testing and confirmation,
then the appropriate method is CB‑SEM. In contrast, if the research objective is
prediction and theory development, then the appropriate method is PLS‑SEM (Hair et
al., 2011) which is the tool used for this research.
4.6.1.4 Partial Least Squares (PLS) Analysis
4.6.1.4.1 Overview of PLS
PLS-SEM is an appropriate tool for the evaluation of data quality on the basis of
measurement model characteristics. The flexibility it offers in regards to its ability to
work efficiently with any sample sizes, less restrictive assumptions on data despite the
increased model complexity are among the rationale behind the choice. PLS-SEM can
address the many shortcomings of CB‑SEM. The constructs’ measurement properties
are also less restrictive with PLS‑SEM. More specifically, PLS-SEM works well even
with constructs with fewer items (e.g., one or two) as compared to those that CB‑SEM
requires (Hair et al., 2011).
The PLS approach is also a useful and flexible tool for statistical model building.
It was chosen for this research due to its flexibility and scope, which facilitates the

139
analysis and investigation of large and complex path models as in this research. Among
the determining factors for the choice of PLS, include theoretical and measurement
conditions, distributional considerations and practical considerations (Falk & Miller,
1992). PLS is an exploratory methodology that relies on data. The PLS approach
matches the researcher’s prediction-oriented objective, does not require normal data
distribution and accommodates small sample sizes (Chin & Newsted, 1999). According
to Chin and Newsted (1999) PLS determinates values for latent variables for predictive
purposes, minimises the variance of all dependent variables and creates latent variable
component scores using the weighted sum of indicators.
Given the current model with a smaller number of sample size of 144 which
emphasises more on the exploration than confirmation, with items of a minimum of
three for some of the constructs, PLS‑SEM appears to be the most appropriate option.
4.6.1.4.2 Evaluation of the Measurement Model
According to Hair, Hult, Ringle, and Sarstedt (2013), there are five steps in
assessing the results of the structural model as depicted in Figure 4.1.
Step 1
Step 2
Step 3
Step 4
Step 5
Assess structural model for collinearity issues
Assess the significance and relevance of the
structural model relationships
Assess the level of R2
Assess the effect size of f2
Assess the predictive relevance Q2
Figure 4.1: Structural Model Assessment Procedure

140
The evaluation of the structural model for hypotheses is performed in PLS based
on the path coefficients (β), t-statistics significant value and the variance explained (R2).
The path coefficients indicate the strength and direction of the relationships among the
latent variables which are explained similarly in Ordinary Least Squares (OLS)
regression. The structural model is evaluated by examining the R2
of the dependent
variables, the path coefficients (β estimates) and its significance value (ρ values).
Coefficient of determination (R2) measures the variation of the dependent variable that
is explained by the predictor variable. R2
can range from 0 to 1 (Hair et al., 2013). The
larger the R2, the greater the explanatory power of independent variables in predicting
the dependent variables.
4.6.2 Data from Qualitative Design
All the interviews were tape-recorded except for four occasions. The recorded
interviews were subsequently transcribed by professional transcribers who signed a non-
disclosure agreement with the researcher to safeguard the confidentiality of the
interview. In total, there were 16 interview participants representing six companies
which were identified based on high-low scores matrix. Of the 16, 15 interviews were
conducted face-to-face while the remaining one was conducted via a telephone
interview. Interview data were analysed manually which involved understanding the
themes of the feedback, observing the body language, frequency analysis, summation
and percentage.
4.7 Summary
This chapter detailed out the research methodology for the study from the data
collection process to the development of research instruments to data cleaning and
screening to the hypothesis testing and fnally to how the data from the interviews was

141
analysed.
This chapter explained the research design and methodology for the systematic
conduct of this study. The study which employs a mixed-method approach of
explanatory design, consists of three distinct steps of content analysis, quantitative and
qualitative tails of the study. A detailed explanation followed as to how each of the
variables was operationalised in accordance to the objectives and scope of the study.
To summarise, the mixed method methodology employed in the current study
consists mainly of online survey campaign which represents the quantitative part of the
study and the semi-structured interviews coupled with content analysis of publicly
available data which formed the qualitative part of the study.
An online survey campaign was launched to collect the quantitative data required
to test the hypotheses. The unit of analysis is organisation which is represented either by
the chief risks officers, chief financial officers or the chief internal auditor. The
measurements used in the current study were mainly adapted from established studies
except for the tone from the top and the effectiveness of ERM in managing risks, which
is derived from ISO 31000 eleven principles for effectiveness and COSO (2004)
framework’s definition of ERM. Data is analysed using SPSS and SmartPLS.
Qualitative data was collected for further understanding, using both semi-
structured interview as well as publicly available. Prior to the interview, content
analysis was performed on the annual report particularly on the Statement of Risk and
Internal Control for better understanding of the ERM practices within the organisation.

142
CHAPTER 5 FINDINGS AND DISCUSSION
5.1 Introduction
This chapter presents an analysis of the data collected from the online survey
campaign and the semi-structured interviews, which represents the quantitative tail and
the qualitative tail, of this explanatory sequential design. The outcome of the
quantitative research design of the current study is discussed in the immediate section of
this chapter (Section 5.2). Section 5.2 is organised as follows. Section 5.2.1 presents the
profile of the respondent followed by the results of non-response bias in Section 5.2.2.
Thereafter, Section 5.2.3 reports the preliminary analysis of the data which includes
data screening and profiling. The demographic profiles of the respondents are tabulated
in this section. Section 5.2.4 discusses the results of t-tests between the two groups of
respondents (a) with and without CRO and (b) with and without a separate ERM unit.
The section also reports the results of the analysis of variances (ANOVA) for the
different departments which the respondents belong to. Section 5.2.5 presents the
assessment on common method bias followed by the systematic evaluation of PLS
measurement model in Section 5.2.6. Section 5.2.7 presents the results of the
hypotheses testing on (a) the direct relationship between the variables, (b) the mediating
effect of tone from the top on the pre-identified relationship as well as (c) the
moderating influence of CRO and ERM Unit on the direct relationship between the
variables.
Based on the results of the survey, qualitative research questions and objectives
were developed in Section 5.3 to further understand the lack of association of some of
the relationships in the variables which is inconsistent with the general expectations
from the literature. Findings from the qualitative tail of the research are discussed in the
subsequent part of this chapter, i.e. Section 5.4. The findings from both tails of the

143
research is triangulated, synthesised and concluded in Section 5.5.
5.2 Results of the Quantitative Tail – Online Survey Campaign
5.2.1 Analysis of Respondents
Data in the current research was collected via an online survey platform called
SurveyGizmo. The campaign was launched by an e-mail invitation to 502 e-mail
addresses of potential respondents which comprised of 78 chief risk officers (CROs),
136 chief internal auditors (CIAs) and 288 chief financial officers (CFOs), representing
330 companies on the main board of Bursa Malaysia. A link to the web-based survey
was included in the e-mail which led the respondents to the questionnaire hosted on
SurveyGizmo. The respondents were required to complete each section before
proceeding to the next, which eliminated the risks of missing data or incomplete
responses.
The survey campaign ran for a period of six weeks in November to December
2014. Every fortnight, an e-mail reminder was sent out to the respondents who have not
completed the questionnaires. In parallel, a follow-up call was also made to increase the
response rate among the respondents.
At the end of the six-week period, a total of 186 respondents, representing 156
companies completed the questionnaires. Of the 186 respondents, 30 of them had
multiple respondents from the same company (ranging from two to three), and the rest
with single informants. Where there were multiple respondents, only one response was
used based on the following rank, CRO over CIA and CFO, and CIA over CFO on the
basis that according to literature, CRO is the main driver for ERM followed by CIA
(Beasley et al., 2005b). Review of literature suggests that the CFO role in ERM is less
apparent unless in the absence of both the CRO and CIA and normally come in the form

144
of support in ERM implementation (Beasley et al., 2005a).
Ultimately, 156 companies participated in the survey yielding a final response rate
of 47%. The analysis of respondents is as shown in Table 5.1 below.
Table 5.1: Response Rate
Survey details Total Percent
(%)
Total number of companies invited in the online survey campaign 330 100
Uncompleted questionnaire for each company 174 53
Completed and final response rate 156 47
5.2.2 Analysis of Response Bias
One of the common issues in a survey-based research is the problem of non-
response bias among the respondents. Non-response bias is an important issue that
needs to be addressed and considered to reduce the likelihood of sampling bias,
systematic error or non-sampling error (Zikmund, 2003).
In order to detect the presence of response bias, an independent sample t-test was
conducted to determine whether the data was subject to non-response bias problems in
the present study. The first and the last 50 responses were selected and dichotomized
into two groups of early and late respondents, respectively.
Table 5.2 presents t-test result of the non-response bias analysis. Based on the
result, all the significant values of the Levene’s test are not significant at p>0.05. This is
also consistent with the results of the t-test for equality of means which indicates that
the one-tailed significance of all the main variables is not significant at p>0.05. Results
show that there is no significant difference between the means, reflecting that there is no
significant difference in the response of the early and late respondents. In other words,
non-response bias does not appear to be significantly and adversely affecting the quality

145
of the current study findings.
Table 5.2: Test of Non-Response Bias
Variables Early response Late response
n = 50 n = 50 t p sig
Mean
Std
Deviation Mean
Std
Deviation
CULTURE 114.88 17.26 115.12 16.35 -0.07 0.94 ns
STRUCTURE 43.36 5.58 43.26 5.88 0.09 0.93 ns
ENT_SYSTEM 54.54 14.97 50.20 16.52 1.38 0.17 ns
TONE_TOP 15.10 3.91 15.46 3.42 -0.49 0.63 ns
STRA_ROLE_ERMC 21.48 4.61 22.60 5.62 -1.09 0.28 ns
INVOLVEMENT 14.74 3.94 15.62 4.11 -1.09 0.28 ns
EFF_ERM 81.74 18.51 81.48 17.80 0.07 0.94 ns
5.2.3 Preliminary Analysis of Data
5.2.3.1 Demographic Profile of Respondents
Table 5.3 presents the profile of the respondents in the current study. The
respondents came from various industries. 35.3% of the respondents are from industrial
products, followed by 17.3% from trade/services and 15.4% from consumer products.
The remaining are from properties (10.3%), constructions (7.7%), finance, plantation
(4.5%), technology (3.8%) and others - mining and REITS (1.4%).
In terms of gender diversity, this group of respondents are dominated by males,
which made up two-thirds of the total. The demographic analysis also indicates that
63.5% of the respondents are above 41 years old - 43.6% of the respondents were
between 41 and 50 years old followed by 18.6% aged between 51 and 60 years old and
1.3% are above 61 years of age. Younger respondents aged between 31 to 40 years old
make up about 28.8% of the total respondents followed by 7.7% who are below 31
years old.
In terms of seniority, 93% of the respondents are at least holding a middle

146
management position. These statistics reflect the seniority and experience of the
respondents which ultimately indicate the credibility and quality of the responses. In
terms of the department of the respondents, finance has the highest number of
representatives followed by internal audit and risks.
Table 5.3: Profile of Respondents (n = 156)
Demographic Profile Categories Frequency Percent
Division Industrial Products 55 35.3
Trade/Services 27 17.3
Consumer Products 24 15.4
Properties 16 10.3
Constructions 12 7.7
Finance 7 4.5
Plantation 7 4.5
Technology 6 3.8
Mining 1 0.7
REITS 1 0.7
Gender Male 103 66.0
Female 53 34.0
Age Below 31 12 7.7
31-40 45 28.8
41-50 68 43.6
51-60 29 18.6
Above 61 2 1.3
Department Finance 56 35.9
Internal Audit 51 32.7
Risks 49 31.4
Level Top Management 72 46.2
Middle Management 73 46.8
Junior Management 10 6.4
Non-management 1 0.6
5.2.3.2 ERM Profile of Respondents
Table 5.4 below reflects the state of the ERM implementation within the
organisations under study. In terms of the ERM profiling of the respondents, 57.7% of
the respondents have a separate ERM unit which is an improvement compared to the

147
survey by Collquit et al. (1999) and Altuntas et al. (2011) where only 29.6% and 47.0%
of companies, respectively have a separate ERM unit. On the other hand, only 42.9% of
the organisation appointed a CRO. This statistics is relatively higher than the 2001
survey by Kleffner et al. (2003) whereby only 13 out of 37 companies (35%) in Canada,
which has adopted ERM, has a dedicated CRO. Similarly, in a study by Altuntas et al.
(2011) only 10 of 95 property-liability insurance companies (10.5%) in Germany has a
dedicated CRO.
The absence of CRO to head the ERM unit may imply the lack of command by
the ERM team in spearheading ERM activities within the organisation. Such a
mismatch between the establishment of a separate ERM unit and the presence of CRO
further raised questions on the operationalisation of the ERM unit as well as the
credibility and experience of the person who heads such unit within the organisation,
and eventually the effectiveness and quality of ERM implementation.
When asked to identify the ERM Champion for their organisation, 30.8% of the
respondents chose chief risk officers or the equivalent head of risks department,
followed by the chief executive officers (24.4%) and thereafter chief financial officers
(18.6%). Only 10.3% of the respondents identified the chief internal auditors as the
ERM Champion while the remaining 25 respondents which made up 16% of the total
specified other functions in their organisation as the ERM Champion. These functions
consist of chief operating officers in eight instances, risk management committee in
three instances and compliance officers in two instances followed by 12 others.

148
Table 5.4: ERM Profile of the Respondents (n=156)
Demographic
Profile Categories Frequency %
ERM Unit Separate ERM Unit 90 57.7
No separate ERM Unit 66 42.3
Presence of
CRO
There is a CRO 67 42.9
There is no CRO 89 57.1
ERM Champion Chief Executive Officer 38 24.4
Chief Risk Officer 48 30.8
Chief Internal Auditor 16 10.3
Chief Financial Officer 29 18.6
Others 25 16.0
Level of ERM
Adoption
No plans to implement ERM. 3 1.9
Considering to implement a complete ERM. 10 6.4
Planning to implement a complete ERM. 15 9.6
In the process of implementing a complete ERM. 46 29.5
ERM is an integral part of the organisation. 82 52.6
Level of ERM
Maturity
Not implementing ERM 12 8.3
In the first year of ERM 12 8.3
In year 2 – 3 of ERM implementation 39 24.4
In year 4 – 5 of ERM implementation 29 18.6
Beyond the fifth year of ERM implementation 64 40.4
Perceived ERM
Effectiveness in
Managing Risks
Low scores ≤ 33.3% (poor) 47 32.6
Medium scores 33.4% - 66.6% (sufficient) 49 34.0
High scores ≥ 66.7% (excellent) 48 33.3
Table 5.4 also show the level of ERM adoption among the respondents. As
tabulated, 52.6% of the respondents report having a fully functional ERM system in
place that ERM is an integral part of the (strategic) planning and control cycle. The
integral part can be defined as complete implementation of ERM and even more can be
embedded in the planning and control process of the entity. Another 29.5% is currently
in the process of implementing such a system followed by 17.9% which do not seem to
have a complete, systematic and proactive approach to risk management.
Of the total respondents, more than half of the respondent organisations (59.0%)
has implemented ERM for more than four years, which again reflects the level of ERM
implementation in this country despite its introduction more than a decade ago.

149
The total scores for the perceived effectiveness of ERM is broken down into three
broader levels of effectiveness based on quartiles of poor (≤ 33.3%), sufficient (33.4% -
66.6%) and excellent (≥66.7%). The descriptive analysis of these scores showed that the
perceived effectiveness of ERM in managing risks is evenly distributed among the three
percentiles.
For the purpose of the current study, only 144 respondents who have implemented
ERM were included in the analysis. The remaining 12 companies which are not
implementing ERM were excluded. The size of 144 exceeded the recommended
minimum 80 (based on dimensions x 10 rule), which is adequate for model testing
(Cohen, 1992). Using the 80% statistical power by Cohen (1992), the data collected is
more than 80% statistical power at 95% with R2
of at least 0.25 of minimum 70 sample
size according to his table.
5.2.3.3 Descriptive Statistics of the Variables
ERM effectiveness is measured based on the 11-principles for an effective ERM
under ISO 31000 as well as the achievement of ERM objectives. All the items are
measured based on the respondents’ agreement to the statements provided.
As indicated in Table 5.5 below, the observed means for ERM effectiveness
(represented by EFF_ERM) which is the dependent variable are well above the
theoretical means. These statistics indicate that the respondents perceive that the ERM
implementation in the organisations they represent is highly effective in managing risks.
The descriptive statistics for the independent variables in the study - culture
(represented by CULTURE), structure (represented by STRUCTURE), enterprise
systems (represented by ENT_SYSTEM), tone from the top (represented by
TONE_TOP), employee involvement (represented by INVOLVEMENT) and the

150
strategic role of ERM Champion (represented by STRA_ROLE_ERMC) - are also
tabulated in Table 5.5.
As indicated in the Table 5.5 below, the observed means for all the independent
variables are above the theoretical mean of 3.50. Among the variables, the mean for
strategic role of ERM Champion of 5.55 is the highest. This is followed by tone from
the top suggesting that the top management (Mean = 5.13) in the respondents’
organisations are highly supportive of ERM initiatives and activities in their
organisations. The level of employee involvement (Mean = 5.10) is also perceived to be
moderately high.
Similarly, it was also noted that the standard deviation for employee involvement,
strategic role of ERM Champion and the tone from the top (in descending order) are
moderately high, signifying that the relatively high variation and widely dispersed data
from the mean value. In other words, the data is showing a big gap of the two extremes
of high and low scores in the variables.
The mean values for culture, is only 4.82 which is only moderate as compared to
the theoretical mean but still higher than structure (Mean = 3.92) and enterprise systems
(Mean = 3.79). The independent variable with the lowest mean is enterprise system at
3.79, indicating the extent of integration in the information technology in the
organisation is perceived to be moderately low.
Additionally, cronbach alpha (α) which is used to measure internal consistency
reliability of the scale for the variables as shown in Table 5.5 is above the threshold
recommended 0.7 (Nunnally, 1978).

151
Table 5.5: Descriptive Statistics of the Variables (n=144)
Mean Med
Std
Dev
Actual Range Theoretical
Range α
Min Max Min Max
EFF_ERM 5.15 5.19 1.15 1.88 7.00 1.00 7.00 0.99
CULTURE 4.82 4.83 0.78 2.88 7.00 1.00 7.00 0.95
STRUCTURE 3.92 3.91 0.49 2.45 5.18 1.00 7.00 0.92
ENT_SYSTEM 3.79 3.89 1.11 1.07 7.00 1.00 7.00 0.94
TONE_TOP 5.13 5.00 1.25 2.00 7.00 1.00 7.00 0.94
STRA_ROLE_ERMC 5.55 5.75 1.32 1.00 7.00 1.00 7.00 0.79
INVOLVEMENT 5.10 5.00 1.34 1.00 7.00 1.00 7.00 0.96
CULTURE = organisational culture, STRUCTURE = organisational structure, ENT_SYSTEM =
enterprise system, TONE_TOP = tone from the top, INVOLVEMENT = employee involvement and
STRA_ROLE_ERMC = strategic role of ERM Champion, EFF_ERM = ERM Effectiveness.
α = Cronbach Alpha, VIF = Variance Inflation Factor
5.2.4 Analysis between Groups (T-test and ANOVA)
5.2.4.1 T-tests
In the current study, T-test was conducted to determine the difference in the
response on all the variables, namely the presence of CRO (companies with and without
CRO) as well as the establishment of a separate ERM unit (companies with a separate
ERM unit and without an ERM unit). The purpose for conducting T-test is to detect any
element of biases between the two groups of respondents. The decision to test for
response bias is driven by the potential differences in ERM activities in the
organisations with a CRO and a separate ERM unit. This is based on the general views
the resources and the expertise offered by the CRO and a dedicated ERM unit can
enhance the effectiveness of ERM in managing risks.
Results of the independent-samples T-test for companies with CRO and without
CRO showed that there is no significance difference in all the variables except for the
tone from the top.

152
The T-test results on Table 5.6 showed a significant difference in the scores for
tone from the top - companies with CRO (Mean = 5.354) and companies without CRO
(Mean = 4.936); t = 1.977, p= 0.050 (two-tailed). This result is not surprising because
the support from the top is only apparent in its own involvement and willingness to
allocate valuable resources to the implementation effort (Holland et al., 1999) which
involves creating the required role to carry out the implementation process (Roberts &
Barrar, 1992). In other words, support from the top varies significantly between the
organisation with CRO and without CRO.
To determine the effect size for this difference, the eta squared, one of the most
common effect size statistics (Pallant, 2007), is calculated using the following formula.
Based on the guidelines by Cohen (2013), the value of eta squared of 0.027 is below the
threshold of 0.06 and therefore is said to have a moderate effect.
Eta squared = t2
t2 + (N1 +
N2 - 2)
t = 1.977
N1 = 66
N2 = 78
= 1.977
2
1.9772 + (66 + 78 - 2)
Eta squared = 0.027 (moderate effect)

153
Table 5.6: T-test Results across Presence of CRO
Mean Standard
deviation
T-test
value
p-
value Sig
Eta squared
(effect size)
CULTURE
CRO (n = 66) 4.920 19.528 1.407 0.161 ns
No CRO (n = 78) 4.738 17.717
STRUCTURE
CRO (n = 66) 3.866 5.210 -1.253 0.212 ns
No CRO (n = 78) 3.970 5.593
ENT_SYSTEM
CRO (n = 66) 3.892 16.475 1.039 0.301 ns
No CRO (n = 78) 3.699 14.735
TONE_TOP 0.03
(moderate effect)
CRO (n = 66) 5.354 4.244 1.977 0.050 s**
No CRO (n = 78) 4.936 3.199
STRA_ROLE_ERMC
CRO (n = 66) 3.702 4.873 0.936 0.351 ns
No CRO (n = 78) 5.659 5.627
INVOLVEMENT
CRO (n = 66) 5.227 4.232 1.017 0.311 ns
No CRO (n = 78) 5.000 3.807
EFF_ERM
CRO (n = 66) 5.274 21.113 1.186 0.237 ns
No CRO (n = 78) 5.046 15.718
CULTURE = organisational culture, STRUCTURE = organisational structure, ENT_SYSTEM =
enterprise systems, TONE_TOP = tone from the top, INVOLVEMENT = employee involvement and
STRA_ROLE_ERMC = strategic role of ERM Champion, EFF_ERM = ERM Effectiveness ** The mean difference is significant at 0.05 level
In regards to the T-test results conducted for respondents with and without a
separate ERM unit - save for structure, tone from the top, strategic role of ERM
Champion and ERM effectiveness, between the respondents with and without a separate
ERM unit, the results of the T-test on Table 5.7 detected potential bias in the scores for
culture, enterprise systems and employee involvement but only moderately.

154
Table 5.7: T-test Results across Separate ERM Unit
Mean Standard
deviation
T-test
value
p-
value
Sig Eta squared
(effect size)
CULTURE
0.03
moderate
effect
Separate ERM Unit (n = 89) 4.930 18.530 2.163 0.032 s**
No ERM Unit (n = 55) 4.645 18.177
STRUCTURE
Separate ERM Unit (n = 89) 3.948 5.216 0.789 0.431 ns
No ERM Unit (n = 55) 3.881 5.786
ENT_SYSTEM
0.05
moderate
effect
Separate ERM Unit (n = 89) 3.984 15.167 2.764 0.006 s**
No ERM Unit (n = 55) 3.469 15.283
TONE_TOP
Separate ERM Unit (n = 89) 5.333 3.699 2.569 0.011 ns
No ERM Unit (n = 55) 4.794 3.629
STRA_ROLE_ERMC
Separate ERM Unit (n = 89) 3.595 5.029 1.113 0.268 ns
No ERM Unit (n = 55) 5.643 5.685
INVOLVEMENT
0.03
moderate
effect
Separate ERM Unit (n = 89) 5.266 3.980 1.864 0.064 s***
No ERM Unit (n = 55) 4.842 3.962
EFF_ERM
Separate ERM Unit (n = 89) 5.302 18.888 2.036 0.044 ns
No ERM Unit (n = 55) 4.905 17.053
CULTURE = organisational culture, STRUCTURE = organisational structure, ENT_SYSTEM =
enterprise systems, TONE_TOP = tone from the top, INVOLVEMENT = employee involvement and
STRA_ROLE_ERMC = strategic role of ERM Champion, EFF_ERM = ERM Effectiveness *** The mean difference is significant at 0.01 level ** The mean difference is significant at 0.05 level
The following paragraphs discuss the rationale behind the bias and how it might
affect the findings. The setting up of a separate ERM unit would certainly facilitate the
creating of risk culture and employee involvement because the unit would have
dedicated resources to create risk awareness and encourage involvement and
engagement from the employees. A separate ERM unit would allow a more structured
flow of information, reporting and monitoring among the various levels of employees in
the entity. Coordination and facilitation of such would further warrant the use of an
integrated system to facilitate the flow of information. Another explanation for such
differences in the T-test results could be the characteristics of the companies with a

155
separate ERM unit. Without doubts, the setting up of a separate ERM unit is not without
costs. Hence it could be assumed that only big companies characterised with high
business complexities can afford to set up a separate ERM unit. Size matters – because
it is only in big companies and/or highly complex businesses that the culture is
dominant and visible, employee involvement is just unavoidable and the use of
integrated systems is more common to facilitate the flow of information across the
organisation. Notwithstanding the above, the magnitude of the differences as shown on
Table 5.7 is only moderate based on Cohen (2013) guideline and therefore not expected
to have significant impact to the findings.
5.2.4.2 ANOVA
The one-way between-groups analysis (ANOVA) technique is also performed to
assess the presence of variances among the main variables for different departments.
The ANOVA results for the main variables by department as shown on Table 5.8
suggest that there are different perceptions on culture, enterprise systems, tone from the
top, employee involvement and ERM effectiveness.
The result is expected due to the different role each department plays in the ERM
implementation and practices within the organisations. Indeed, scholars suggest that the
criteria for effectiveness or any other constructs are based on individuals’ values and
preferences (Jenkins & Ricketts, 1979; Cameron, 1986a). In order to address the bias
from the subjective perception of the individual, it was intended that the current study
consider the perspectives from multiple department (Rainer, 2013) to further enhance
the quality and accuracy of the findings. This will also improve the response rate instead
of otherwise limiting the survey to only the CRO considering that companies do
outsource their risks, internal audit and finance function.

156
Table 5.8: One-way ANOVA Test Results across Department
Mean
F
p
value
Scheffe Test
Department Diff p value Sig.
CULTURE
Risk (n = 49) 121.57 3.84 0.02 Risk -> Internal Audit 8.571 0.077 ns
Internal Audit (n = 46) 113.00 s** Risk -> Finance 9.184* 0.048 s**
Finance (n = 49) 112.39 Internal Audit -> Finance 0.612 0.987 ns
STRUCTURE
Risk (n = 49) 44.06 1.38 0.26
Internal Audit (n = 46) 43.13 ns
Finance (n = 49) 42.24
ENT_SYSTEM
Risk (n = 49) 58.41 4.71 0.01 Risk -> Internal Audit 7.799* 0.047 s**
Internal Audit (n = 46) 50.61 s*** Risk -> Finance 8.510* 0.023 s**
Finance (n = 49) 49.90 Internal Audit -> Finance -7.799 0.047 s**
TONE_TOP
Risk (n = 49) 16.31 3.42 0.04 Risk -> Internal Audit 0.828 0.550 ns
Internal Audit (n = 46) 15.48 s** Risk -> Finance 1.939* 0.036 s**
Finance (n = 49) 14.37 Internal Audit -> Finance -0.828 0.550 ns
STRA_ROLE_ERMC
Risk (n = 49) 23.29 1.64 0.20
Internal Audit (n = 46) 21.76 ns
Finance (n = 49) 21.49
INVOLVEMENT
Risk (n = 49) 16.73 4.98 0.01 Risk -> Internal Audit 2.278* 0.020 s**
Internal Audit (n = 46) 14.46 s*** Risk -> Finance 2.041* 0.038 s**
Finance (n = 49) 14.69 Internal Audit -> Finance -2.278 0.020 s**
EFF_ERM
Risk (n = 49) 87.14 3.26 0.04 Risk -> Internal Audit 4.882 0.425 ns
Internal Audit (n = 46) 82.26 s** Risk -> Finance 9.347* 0.041 s**
Finance (n = 49) 77.80 Internal Audit -> Finance -9.347* 0.041 ns CULTURE = organisational culture, STRUCTURE = organisational structure, ENT_SYSTEM = enterprise system,
TONE_TOP = tone from the top, INVOLVEMENT = employee involvement and STRA_ROLE_ERMC = strategic role
of ERM Champion, EFF_ERM = ERM Effectiveness. *** - The mean difference is significant at the 0.01 level
** - The mean difference is significant at the 0.05 level
5.2.5 Common Method Bias
There are two methods for testing common method bias, namely (1) factor
analysis’s variance ratio and (2) Harmon’s one-factor test (Podsakoff, MacKenzie, Lee,
& Podsakoff, 2003). For the current study, common method variance is tested using
factor analysis variance ratio (Hair et al., 2013) which is determined based on the
following conditions: (a) only one factor exists in the factor analysis result and (b) one
factor will account for the majority of the variance among the variables (Podsakoff et
al., 2003). The factor analysis result shows that ratio of principal factor variance to total

157
variance is 48.61%, which is less than the threshold of 50.0% as shown in Table 5.9. It
can be therefore concluded that common method bias does not exist in this study.
Table 5.9: Common Method Bias
The highest percentage variance
of principle factor (A)
Total percentage
variance (B)
Ratio (R=A/B)
R<50%
Results
37.85% 77.87% 48.61% Accepted
Comp Initial Eigenvalues Extraction Sums of Squared
Loadings
Total % of
Variance
Cumulativ
e %
Total % of
Variance
Cumulativ
e %
1 21.20 37.85 37.85 21.20 37.85 37.85
2 4.54 8.11 45.96 4.54 8.11 45.96
3 3.24 5.79 51.75 3.24 5.79 51.75
4 2.49 4.44 56.19 2.49 4.44 56.19
5 2.16 3.86 60.05 2.16 3.86 60.05
6 1.87 3.33 63.38 1.87 3.33 63.38
7 1.75 3.12 66.50 1.75 3.12 66.50
8 1.39 2.48 68.99 1.39 2.48 68.99
9 1.32 2.36 71.35 1.32 2.36 71.35
10 1.28 2.29 73.64 1.28 2.29 73.64
11 1.23 2.19 75.83 1.23 2.19 75.83
12 1.14 2.04 77.87 1.14 2.04 77.87
13 0.89 1.58 79.45
14 0.84 1.49 80.95
15 0.78 1.39 82.34
16 0.73 1.30 83.63
17 0.70 1.26 84.89
18 0.63 1.13 86.02
19 0.55 0.99 87.01

158
5.2.6 Systematic Evaluation of PLS Measurement Model
Figure 5.1 below shows the model drawn in SmartPLS version 3.2.0. First of all,
we assess the sample size requirements using the 10 time rule and the 80% statistical
power method by (Cohen, 1992). Based on the model in Figure 5.1, the maximum
number of arrows (from exogenous) pointing at a particular latent variable (endogenus)
is 8 and using the 10 times formula, the minimum number of samples required is 80 (8 x
10) samples. On the other hand, according to Cohen’s 80% statistical power table at
95% with R2
of >= 0.25, at least 70 units of samples is required . The sample size used
in the data analysis for the current study is 144 samples which are well above the
minimum threshold based on both rules.
CULTURE = organisational culture, STRUCTURE = organisational structure, ENT_SYSTEM = enterprise system,
TONE_TOP = tone from the top, INVOLVEMENT = employee involvement and STRA_ROLE_ERMC = strategic
role of ERM Champion, EFF_ERM = ERM Effectiveness.
Figure 5.1: PLS Path Model Estimation
Subsequently, a systematic evaluation of the measurement model was carried out.
The evaluation techniques used are the internal consistency (composite reliability),

159
indicator reliability, convergent validity (average variance extracted) and finally
discriminant validity. Reliability is a test of how consistent a measuring instrument
measures whatever concept it is measuring whilst validity is a test of how well an
instrument that is developed measures the particular concept it is intended to measure
(Sekaran & Bougie, 2010).
The first step in evaluating the measurement model is to look at the composite
reliability (CR), for internal consistency. Composite reliability (CR) is a more
appropriate measure for internal consistency or constructs reliability (Werts, Linn, &
Jöreskog, 1974; Henseler, Ringle, & Sinkovics, 2009). According to Hair et al. (2013)
the CR values should be above 0.708 while CR below 0.60 is argued to be lack of
internal consistency reliability. CR values between 0.60 to 0.708 is acceptable for
exploratory research (Hair et al., 2013). This range is consistent with Nunally &
Berstein (1994) who suggest that CR between 0.70 to 0.90 is satisfactory. Based on the
CR shown on Table 5.10, CR for all the latent variables in the model is above the
threshold of 0.70 indicating that all the indicators are measuring the same phenomenon,
indicating satisfactory construct reliability.
The second step is to evaluate the indicator reliability using the outer loading
readings. The rule of thumb states that the higher outer loadings has to be in the same
group of convergent validity and has to be statistically significant i.e above 0.708 (Hair
et al., 2013). Examining the outer loading ensures that the survey items are measuring
the constructs they are designed to measure, thus ensuring that the survey instrument is
reliable. To determine individual item reliabilities, the researcher looked at their
loadings to their respective constructs.
Any items below 0.40 should be eliminated (Hair et al., 2013) while anything
between 0.40 and 0.70 should be considered for removal only when deleting the item

160
improves the composite reliability (CR) or the average variance extracted (AVE).
Table 5.10: Internal Consistency, Composite Reliability (CR)
Composite Reliability (CR)
CULTURE 0.953
STRUCTURE 0.933
ENT_SYSTEM 0.949
TONE_TOP 0.960
STR_ROLE_ERMC 0.862
INVOLVEMENT 0.976
EFF_ERM 0.987 CULTURE = organisational culture, STRUCTURE = organisational structure, ENT_SYSTEM = enterprise system,
TONE_TOP = tone from the top, INVOLVEMENT = employee involvement and STRA_ROLE_ERMC = strategic
role of ERM Champion, EFF_ERM = ERM Effectiveness.
Based on the outer loadings on Table 5.11, all the values of the outer loadings are
above 0.708 except for CUL01, CUL03, CUL05, CUL11, CUL24, STRU_H1,
STRU_H2, STRU_H3, ES_So1, ES_So2 and ES_So3 (ranging between 0.40 and 0.60)
and CUL04, CUL09, CUL12, CUL17, CUL19 and CUL21 (ranging between 0.61 and
0.708). Because none of the indicators is below the threshold of 0.40, we can still keep
the indicators for the time being.
The third step in the evaluation of the measurement model is to evaluate for
convergent validity. Convergent validity is the extent to which the alternative measures
the same constructs. To establish convergent validity, the following were considered:
(1) the outer loadings of the indicators and the (2) average variance extracted (AVE).
The evaluation of the outer loadings is shown on Table 5.11 and explained in the
preceeding paragraphs under the second step to test for indicator reliability (page 159).

161
Table 5.11: Outer Loadings of all Latent Variables
CULT
URE
STRUC
TURE
ENT_S
YSTEM
TONE_
TOP
STR_ROL
E_ERMC
INVOLVE
MENT
EFF_ER
M
CUL01 0.502
CUL02 0.736
CUL03 0.415
CUL04 0.654
CUL05 0.437
CUL06 0.735
CUL07 0.788
CUL08 0.811
CUL09 0.696
CUL10 0.771
CUL11 0.480
CUL12 0.672
CUL13 0.805
CUL14 0.719
CUL15 0.500
CUL16 0.758
CUL17 0.691
CUL18 0.784
CUL19 0.682
CUL20 0.718
CUL21 0.647
CUL22 0.744
CUL23 0.842
CUL24 0.569
STRU_D1 0.749
STRU_D2 0.766
STRU_D3 0.851
STRU_F1 0.783
STRU_F2 0.792
STRU_F3 0.822
STRU_F4 0.833
STRU_F5 0.838
STRU_H1 0.564
STRU_H2 0.593
STRU_H3 0.596
ES_Ad1 0.744
ES_Ad2 0.713
ES_Ad3 0.801 CULTURE = organisational culture, STRUCTURE = organisational structure, ENT_SYSTEM =
enterprise system, TONE_TOP = tone from the top, INVOLVEMENT = employee involvement and
STRA_ROLE_ERMC = strategic role of ERM Champion, EFF_ERM = ERM Effectiveness.

162
Table 5.11: Outer Loadings of all Latent Variables (continued)
CULT
URE
STRUCT
URE
ENT_S
YSTEM
TONE_
TOP
STR_ROLE
_ERMC
INVOLVEM
ENT
EFF_ER
M
ES_Co1 0.868
ES_Co2 0.850
ES_Co3 0.844
ES_Ge1 0.697
ES_Ge2 0.817
ES_In1 0.906
ES_In2 0.886
ES_In3 0.817
ES_So1 0.457
ES_So2 0.517
ES_So3 0.574
Tone1 0.942
Tone2 0.970
Tone3 0.916
ERMC1 0.824
ERMC2 0.774
ERMC3 0.760
ERMC4 0.761
Involve1 0.967
Involve2 0.976
Involve3 0.953
ISOEf01 0.902
ISOEf02 0.886
ISOEf03 0.927
ISOEf04 0.926
ISOEf05 0.895
ISOEf06 0.914
ISOEf07 0.934
ISOEf08 0.926
ISOEf09 0.886
ISOEf10 0.926
ISOEf11 0.904
PerEf1 0.928
PerEf2 0.930
PerEf3 0.937
PerEf4 0.905
PerEf5 0.850 CULTURE = organisational culture, STRUCTURE = organisational structure, ENT_SYSTEM =
enterprise system, TONE_TOP = tone from the top, INVOLVEMENT = employee involvement and
STRA_ROLE_ERMC = strategic role of ERM Champion, EFF_ERM = ERM Effectiveness.

163
The AVE is defined as the grand mean value of the squared loadings and is
equivalent to the communality of a construct. The AVE should be > 0.50 to reflect that,
on average more variance was explained than unexplained in the variables associated
with a given construct (Fornell & Larcker, 1981). On the other hand, AVE < 0.5
indicates than on average, more errors remain in the items than the variance explained
by the construct. As shown on Table 5.12 below, the AVE for all the latent variables ise
> 0.50 except for CULTURE.
Table 5.12: Average Variance Extracted (AVE)
Average Variance Extracted (AVE)
CULTURE 0.468
STRUCTURE 0.564
ENT_SYSTEM 0.580
TONE_TOP 0.889
STR_ROLE_ERMC 0.609
INVOLVEMENT 0.931
EFF_ERM 0.831 CULTURE = organisational culture, STRUCTURE = organisational structure, ENT_SYSTEM =
enterprise system, TONE_TOP = tone from the top, INVOLVEMENT = employee involvement and
STRA_ROLE_ERMC = strategic role of ERM Champion, EFF_ERM = ERM Effectiveness.
To improve the AVE for culture to be above the threshold, the following
indicators for culture which are below 0.60, namely CUL01, CUL03, CUL05, CUL11,
and CUL24 were removed. The remaining indicators which are below 0.708 were
maintained because removing it does not improve the AVE which is already above the
threshold required. The improved CR and AVE for the latent variables after removing
those 5 items are shown on Table 5.13 below. The removal of these items is necessary
to minimise the potential bias in the estimation of the parameters linked to the
constructs (Hulland, 1999) thereby improving AVE for CULTURE.
Additionally, individual item reliability (reflected in the cross loadings), as shown
on Table 5.14, of the new set of measurements after the removal of those items suggests

164
satisfactory item reliability, as all factor loadings are higher than 0.6 implying that more
than 60% of the variance observed variable is shared with the constructs (Chin, 1998).
Table 5.13: Composite Reliability (CR) and Average Variance Extracted (AVE)
Composite Reliability
(CR)
Average Variance Extracted
(AVE)
CULTURE 0.956 0.550
STRUCTURE 0.933 0.564
ENT_SYSTEM 0.949 0.580
TONE_TOP 0.960 0.889
STR_ROLE_ERMC 0.862 0.609
INVOLVEMENT 0.976 0.931
EFF_ERM 0.984 0.849 CULTURE = organisational culture, STRUCTURE = organisational structure, ENT_SYSTEM =
enterprise system, TONE_TOP = tone from the top, INVOLVEMENT = employee involvement and
STRA_ROLE_ERMC = strategic role of ERM Champion, EFF_ERM = ERM Effectiveness.
The fourth step is the test for discriminant validity. Discriminant validity refers to
the extent to which a construct is truly distinct from other constructs by empirical
standards. There are three methods used to assess discriminant validity namely (1) cross
loadings (2) Fornell-Larcker criterion and (3) Heterotrait Monotrait Ratio (HTMT)
(Hair et al., 2013). Table 5.14 shows the cross loadings for all the latent variables in the
measurement model which is greater than all of its loadings on other constructs.

165
Table 5.14: Cross Loadings of all Indicators
CULT
URE
STRU
CTURE
ENT_S
YSTEM
TONE
_TOP
STR_ROL
E_ERMC
INVOLV
EMENT
EFF_E
RM
CUL02 0.709 0.460 0.445 0.362 0.217 0.336 0.424
CUL04 0.655 0.355 0.434 0.348 0.182 0.365 0.423
CUL06 0.744 0.489 0.497 0.486 0.284 0.424 0.497
CUL07 0.780 0.576 0.500 0.290 0.165 0.269 0.425
CUL08 0.805 0.608 0.498 0.288 0.241 0.292 0.418
CUL09 0.686 0.506 0.437 0.248 0.253 0.221 0.306
CUL10 0.800 0.547 0.436 0.353 0.262 0.320 0.459
CUL12 0.663 0.337 0.297 0.112 0.202 0.166 0.213
CUL13 0.815 0.619 0.499 0.376 0.239 0.352 0.480
CUL14 0.731 0.412 0.461 0.375 0.289 0.336 0.410
CUL16 0.764 0.663 0.486 0.413 0.344 0.373 0.505
CUL17 0.698 0.533 0.409 0.359 0.306 0.289 0.443
CUL18 0.785 0.605 0.437 0.428 0.279 0.383 0.448
CUL19 0.679 0.522 0.389 0.405 0.286 0.296 0.417
CUL20 0.736 0.522 0.533 0.479 0.282 0.442 0.509
CUL21 0.657 0.364 0.389 0.259 0.288 0.179 0.343
CUL22 0.765 0.579 0.502 0.468 0.249 0.341 0.543
CUL23 0.843 0.606 0.543 0.456 0.419 0.383 0.488
STRU_D1 0.453 0.749 0.563 0.378 0.293 0.449 0.435
STRU_D2 0.543 0.765 0.577 0.456 0.290 0.473 0.481
STRU_D3 0.624 0.853 0.630 0.539 0.284 0.509 0.590
STRU_F1 0.666 0.783 0.588 0.345 0.180 0.317 0.450
STRU_F2 0.591 0.792 0.487 0.323 0.324 0.356 0.451
STRU_F3 0.654 0.821 0.535 0.351 0.270 0.421 0.443
STRU_F4 0.608 0.832 0.577 0.386 0.192 0.396 0.468
STRU_F5 0.637 0.839 0.619 0.448 0.279 0.473 0.494
STRU_H1 0.233 0.563 0.348 0.270 0.230 0.231 0.246
STRU_H2 0.295 0.593 0.380 0.279 0.235 0.165 0.290
STRU_H3 0.303 0.596 0.340 0.260 0.273 0.218 0.250
ES_Ad1 0.398 0.450 0.743 0.342 0.235 0.419 0.370
ES_Ad2 0.402 0.483 0.712 0.324 0.190 0.390 0.344
ES_Ad3 0.411 0.493 0.800 0.382 0.181 0.449 0.418
ES_Co1 0.529 0.680 0.868 0.469 0.287 0.517 0.544
ES_Co2 0.502 0.616 0.850 0.504 0.279 0.518 0.534
ES_Co3 0.519 0.624 0.844 0.482 0.277 0.488 0.529
CULTURE = organisational culture, STRUCTURE = organisational structure, ENT_SYSTEM =
enterprise system, TONE_TOP = tone from the top, INVOLVEMENT = employee involvement and
STRA_ROLE_ERMC = strategic role of ERM Champion, EFF_ERM = ERM Effectiveness.

166
Table 5.14: Cross Loadings of All Indicators (continued)
CULTU
RE
STRUC
TURE
ENT_S
YSTEM
TONE
_TOP
STR_ROL
E_ERMC
INVOLV
EMENT
EFF_E
RM
ES_Ge1 0.541 0.641 0.699 0.343 0.211 0.441 0.523
ES_Ge2 0.531 0.589 0.821 0.351 0.179 0.377 0.510
ES_In1 0.574 0.637 0.908 0.454 0.232 0.437 0.571
ES_In2 0.587 0.627 0.888 0.463 0.238 0.439 0.532
ES_In3 0.546 0.571 0.818 0.421 0.145 0.368 0.550
ES_So1 0.268 0.191 0.453 0.380 0.129 0.430 0.396
ES_So2 0.312 0.241 0.514 0.422 0.223 0.451 0.436
ES_So3 0.330 0.400 0.571 0.234 0.178 0.273 0.316
Tone1 0.498 0.487 0.525 0.943 0.284 0.672 0.782
Tone2 0.483 0.504 0.529 0.970 0.302 0.729 0.799
Tone3 0.446 0.424 0.448 0.915 0.304 0.639 0.725
ERMC1 0.220 0.215 0.211 0.243 0.822 0.153 0.237
ERMC2 0.310 0.283 0.198 0.247 0.771 0.107 0.281
ERMC3 0.279 0.245 0.274 0.220 0.764 0.252 0.194
ERMC4 0.318 0.320 0.214 0.270 0.763 0.213 0.209
Involve1 0.415 0.443 0.545 0.684 0.179 0.966 0.624
Involve2 0.396 0.475 0.533 0.679 0.188 0.975 0.635
Involve3 0.472 0.544 0.561 0.723 0.271 0.953 0.697
ISOEf01 0.540 0.570 0.562 0.763 0.255 0.624 0.911
ISOEf02 0.532 0.555 0.576 0.747 0.295 0.620 0.895
ISOEf03 0.584 0.566 0.602 0.723 0.276 0.624 0.937
ISOEf04 0.561 0.525 0.588 0.712 0.257 0.611 0.934
ISOEf05 0.491 0.421 0.568 0.755 0.298 0.593 0.910
ISOEf06 0.529 0.529 0.582 0.739 0.285 0.623 0.937
ISOEf07 0.566 0.521 0.581 0.783 0.276 0.645 0.951
ISOEf08 0.537 0.530 0.570 0.772 0.312 0.612 0.939
ISOEf09 0.517 0.521 0.523 0.757 0.303 0.631 0.892
ISOEf10 0.603 0.566 0.630 0.774 0.277 0.644 0.926
ISOEf11 0.574 0.547 0.621 0.743 0.216 0.641 0.902
PerEf1 0.569 0.566 0.585 0.800 0.264 0.704 0.928
PerEf2 0.544 0.537 0.569 0.797 0.290 0.663 0.930
PerEf3 0.570 0.579 0.570 0.773 0.253 0.640 0.937
PerEf4 0.554 0.560 0.578 0.737 0.259 0.641 0.905
PerEf5 0.541 0.509 0.566 0.696 0.235 0.572 0.850 CULTURE = organisational culture, STRUCTURE = organisational structure, ENT_SYSTEM =
enterprise system, TONE_TOP = tone from the top, INVOLVEMENT = employee involvement and
STRA_ROLE_ERMC = strategic role of ERM Champion, EFF_ERM = ERM Effectiveness.

167
The Fornell-Lacker criterion (Fornell & Larcker, 1981) suggests that discriminant
validity can be assessed at the construct level. Table 5.15 tabulated the relevant statistics
using Fornell-Lacker approach. As shown on the table, all diagonal elements exceed the
off-diagonal elements in the corresponding rows and columns, reflecting a sufficient
discriminant validity of constructs under such approach.
Table 5.15: Fornell-Lacker Criterion
CULTU
RE
STRUC
TURE
ENT_SY
STEM
TONE
_TOP
STR_ROL
E_ERMC
INVOLV
EMENT
EFF_ER
M
CULTURE 0.742
STRUCTURE 0.708 0.751
ENT_SYSTEM 0.621 0.700 0.762
TONE_TOP 0.505 0.502 0.532 0.943
STR_ROLE_ERMC 0.362 0.340 0.283 0.314 0.781
INVOLVEMENT 0.445 0.507 0.567 0.722 0.222 0.965
EFF_ERM 0.604 0.590 0.636 0.828 0.299 0.692 0.911
CULTURE = organisational culture, STRUCTURE = organisational structure, ENT_SYSTEM =
enterprise system, TONE_TOP = tone from the top, INVOLVEMENT = employee involvement and
STRA_ROLE_ERMC = strategic role of ERM Champion, EFF_ERM = ERM Effectiveness.
Additionally, the Heterotrait-Monotrait Ratio (HTMT) which is the estimate of
construct correlation on Table 5.16 also shows that all the HTMT is below 0.9 which
means that the variables are moderately correlated based on the threshold suggested by
Hair et al. (2013).
Table 5.16: Heterotrait-Monotrait Ratio (HTMT)
CULT
URE
STRUC
TURE
ENT_SY
STEM
TONE
_TOP
STR_R
OLE_E
RMC
INVOL
VEME
NT
EFF_ER
M
CULTURE
STRUCTURE 0.717
ENT_SYSTEM 0.642 0.725 TONE_TOP 0.516 0.526 0.563
STR_ROLE_ERMC 0.413 0.403 0.334 0.364
INVOLVEMENT 0.450 0.514 0.599 0.758 0.264 EFF_ERM 0.610 0.599 0.654 0.861 0.330 0.708
CULTURE = organisational culture, STRUCTURE = organisational structure, ENT_SYSTEM =
enterprise system, TONE_TOP = tone from the top, INVOLVEMENT = employee involvement and
STRA_ROLE_ERMC = strategic role of ERM Champion, EFF_ERM = ERM Effectiveness.
On the whole, the evaluation of measurement model indicates the reliability and
validity of the constructs to proceed with the evaluation of the structural model. The

168
results for the reflective measurement models are summarised in Table 5.17.
Table 5.17: Result Summary for Reflective Measurement Model
Indicators Loadings
>0.60
Indicator
Reliability
>0.60
Composite
Reliability
>0.708
AVE
>0.50
Discriminant
Analysis
CULTURE CUL02 0.709 0.710 0.956 0.550 Yes
CUL04 0.655 0.653
CUL06 0.744 0.744
CUL07 0.780 0.782
CUL08 0.805 0.807
CUL09 0.686 0.688
CUL10 0.800 0.799
CUL12 0.663 0.662
CUL13 0.815 0.815
CUL14 0.731 0.729
CUL16 0.764 0.765
CUL17 0.698 0.695
CUL18 0.785 0.786
CUL19 0.679 0.680
CUL20 0.736 0.735
CUL21 0.657 0.656
CUL22 0.765 0.765
CUL23 0.843 0.844
STRUCTURE STRU_D1 0.749 0.749 0.933 0.564 Yes
STRU_D2 0.765 0.766
STRU_D3 0.853 0.851
STRU_F1 0.783 0.783
STRU_F2 0.792 0.792
STRU_F3 0.821 0.822
STRU_F4 0.832 0.833
STRU_F5 0.839 0.838
STRU_H1 0.563 0.564
STRU_H2 0.593 0.593
STRU_H3 0.596 0.596

169
Table 5.17: Result Summary for Reflective Measurement Model (continued)
Indicators Loading
s
Indicator
Reliability
Composite
Reliability
AVE Discriminan
t Analysis
ENTERPRISE
SYSTEMS ES_Ad1 0.743 0.744 0.949 0.580 Yes
ES_Ad2 0.712 0.713
ES_Ad3 0.800 0.801
ES_Co1 0.868 0.868
ES_Co2 0.850 0.850
ES_Co3 0.844 0.844
ES_Ge1 0.699 0.697
ES_Ge2 0.821 0.817
ES_In1 0.908 0.906
ES_In2 0.888 0.886
ES_In3 0.818 0.817
ES_So1 0.453 0.457
ES_So2 0.514 0.517
ES_So3 0.571 0.574
TONE FROM
THE TOP Tone1 0.943 0.942 0.960 0.889 Yes
Tone2 0.970 0.970
Tone3 0.915 0.916
STRATEGIC
ROLE OF ERM
CHAMPION
PoERMC1 0.822 0.824 0.862 0.609 Yes
PoERMC2 0.771 0.774
PoERMC3 0.764 0.760
PoERMC4 0.763 0.761
EMPLOYEE
INVOLVEMENT Involve1 0.966 0.967 0.976 0.931 Yes
Involve2 0.975 0.976
Involve3 0.953 0.953
Now that the construct measures have been confirmed as reliable and valid, the
next step is to assess the structural model results. This involves examining the model’s
predictive capabilities and the relationships among constructs. Prior to assessing the
structural model, this model is first examined for collinearity.
The collinearity among indicators was examined using the variance inflation
factor (VIF). Multicollinearity is present when the VIF is above the cut-off point of 10
(O’brien, 2007). As shown on Table 5.18, all the VIF is below 10 indicating that
multicollinearity does not exist among the indicators.

170
Table 5.18: Variance Inflation Factor (VIF) Results
EFF_ERM TONE_TOP
CULTURE 2.276 1.623
ENT_SYSTEM 2.330 1.623
INVOLVEMENT 2.349
STRUCTURE 2.626
STR_ROLE_ERMC 1.198
TONE_TOP 2.364 CULTURE = organisational culture, STRUCTURE = organisational structure, ENT_SYSTEM =
enterprise system, TONE_TOP = tone from the top, INVOLVEMENT = employee involvement
and STR_ROLE_ERMC = strategic role of ERM Champion
5.2.7 Assessing PLS_SEM Results of the Structural Model
According to Chin (1998), R2
value provides the explanatory power of a structural
model, which can be described as substantial, moderate and weak if the values show
0.67, 0.33 and 0.19, respectively. The evaluation of β, the path coefficients and its
significance value are provided in the next section.
The bootstrapping results shown on Figure 5.2 show the significance of the path
coefficients. The results indicate that all paths are statistically significant using a one-
tailed test (T-statistics > 1.645) except for STRUCTUREEFF_ERM,
STR_ROLE_ERMCEFF_ERM and INVOLVEMENTEFF_ERM.

171
CULTURE = organisational culture, STRUCTURE = organisational structure, ENT_SYSTEM =
enterprise system, TONE_TOP = tone from the top, INVOLVEMENT = employee involvement and
STRA_ROLE_ERMC = strategic role of ERM Champion, EFF_ERM = ERM Effectiveness. ***= significant at the 0.01 level
**=significant at the 0.05 level
Figure 5.2: Bootstrapping Results
5.2.7.1 Hypotheses Testing
Eight hypotheses, H1 to H8, are formulated during the initial phase of the study in
order to examine whether there exists positive direct relationship between variables. The
hypotheses are presented again in Table 5.19.

172
Table 5.19: Hypotheses Testing for Direct Relationship Between the Variables
H1: There is a significant positive relationship between organisational culture and
perceived ERM effectiveness in managing risks
H2: There is a significant positive relationship between organisational culture and tone
from the top.
H3: There is a significant positive relationship between organisational mechanistic
structure and perceived ERM effectiveness in managing risks
H4: There is a significant positive relationship between enterprise systems and perceived
ERM effectiveness in managing risks
H5: There is a significant positive relationship between enterprise systems and tone from
the top
H6: There is a significant positive relationship between strong tone from the top and
perceived ERM effectiveness in managing risks
H7: There is a significant positive relationship between the strategic role of ERM
Champion and perceived ERM effectiveness in managing risks
H8: There is a significant positive relationship between employee involvement in risk
management activities and perceived ERM effectiveness in managing risks
Table 5.20: Results of Direct Effects
Direct Effect
Original
Sample
(O)
Sample
Mean
(M)
T Stats P Values
H1 CULTURE->EFF_ERM 0.147 0.144 1.923 0.027 **
H2 CULTURE->TONE FROM THE TOP 0.289 0.301 2.882 0.002 ***
H3 STRUCTURE->EFF_ERM 0.045 0.046 0.575 0.283 ns
H4 ENT_SYSTEM->EFF_ERM 0.148 0.150 2.302 0.011 **
H5 ENT_SYSTEM->TONE FROM THE TOP 0.356 0.352 4.111 0.000 ***
H6 TONE_TOP->EFF_ERM 0.584 0.581 8.426 0.000 ***
H7 STR_ROLE_ERMC->EFF_ERM -0.018 -0.007 0.344 0.366 ns
H8 INVOLVEMENT->EFF_ERM 0.102 0.101 1.471 0.071 ns
CULTURE = organisational culture, STRUCTURE = organisational structure, ENT_SYSTEM =
enterprise system, TONE_TOP = tone from the top, INVOLVEMENT = employee involvement and
STRA_ROLE_ERMC = strategic role of ERM Champion, EFF_ERM = ERM Effectiveness. ***= significant at the 0.01 level **=significant at the 0.05 level
H1: There is a significant positive relationship between organisational culture
and perceived ERM effectiveness in managing risks
H1 states that organisational culture has a positive relationship with perceived
ERM effectiveness in managing risks. As depicted in Table 5.20, it can be seen that this
hypothesis is supported (β = 0.147, p<0.05) which means that the organisational culture
has a significant positive influence on ERM effectiveness in managing risks.

173
Further examination into the components of organisational culture of bureaucratic,
innovative and supportive showed that all the dimensions of culture is significantly and
positively associated with ERM effectiveness as tabulated in Table 5.21. Relatively,
innovative culture (β = 0.386, p<0.00) has the strongest total effect on ERM
effectiveness, followed by supportive culture (β = 0.346, p<0.00) and finally
bureaucratic culture (β = 0.336, p<0.00). The rationale behind the positive effect of all
the three type of culture namely, bureaucratic, innovative and suportive can be due to
the nature of ERM which is an evolving initatives from being a top down initiative in
the beginning to an emergent initiative as it gets mature. The former works well in a
bureaucratic culture as compared to the latter which works well in a supportive
environment.
Table 5.21: Results of the Direct Effect of the Culture Dimensions
Direct Effect Original
Sample (O)
Sample
Mean (M) T Stats
P
Values
CULTURE (Bureaucratic) -> EFF_ERM 0.336 0.334 18.479 0.000***
CULTURE (Innovative) -> EFF_ERM 0.386 0.385 20.791 0.000***
CULTURE (Supportive) -> EFF_ERM 0.346 0.347 23.629 0.000***
***= significant at the 0.01 level
H2: There is a significant positive relationship between organisational
culture and tone from the top
H2 predicts the relationship between organisational culture and tone from the top.
As depicted in Table 5.20, it can be seen that there is a significant direct positive
relationship between these variables (β = 0.289, p<0.01).

174
H3: There is a significant positive relationship between organisational
mechanistic structure and perceived ERM effectiveness in managing risks
In respects to the relationship between organisational mechanistic structure and
perceived ERM effectiveness, the results on Table 5.20, do not show any statistically
significant relationship between the variables (p>0.05). In other words, the results are
not able to support the hypothesised relationship.
H4: There is a significant positive relationship between enterprise
systems and perceived ERM effectiveness in managing risk
H4 predicts a positive association between enterprise systems and perceived ERM
effectiveness in managing risks. Table 5.20 shows that the variables are significantly
correlated with β=0.148, p<0.05.
H5: There is a significant positive relationship between enterprise
systems and tone from the top
H5 further hypothesises the positive association between enterprise systems and
tone from the top. As earlier expected, Table 5.20 shows that the variables are
significantly correlated with β=0.356, p<0.01.
H6: There is a significant positive relationship between strong tone from
the top and perceived ERM effectiveness in managing risks
Table 5.20 shows significant evidence of a highly correlated coefficient for H6.
The hypothesis which predicts that tone from the top has a statistically significant
positive influence on the effectiveness of ERM in managing risks with current data
showing β = 0.584 (p< 0.01).

175
H7: There is a significant positive relationship between the strategic role
of ERM Champion and perceived ERM effectiveness in managing risks
H7 predicts the relationship between strategic role of ERM Champion and the
effectiveness in managing risks. Results on Table 5.20 however, does not support the
hypothesised relationship.
H8: There is a significant positive relationship between employee
involvement in risk management activities and perceived ERM effectiveness in
managing risks
With regard to the positive relationship between employee involvement and ERM
effectiveness in managing risks (H8), the results in Table 5.20 shows the lack of
statistically significant relationship between these variables.
5.2.7.2 The Overall Model
Figure 5.2 (on page 171) shows the path coefficients and the R2 of the dependent
variables. The coefficient determination R2 of 0.759 for perceived ERM effectiveness
indicates that 75.9% of the variances in ERM effectiveness are explained by the
independent variables in the current study. The remainings 24.1% is explained by other
variables which are outside the scope of this study. On the other hand, tone from the top
has the R2 of 0.338 which indicates that culture and enterprise system only explains
33.8% of the variances in tone from the top.
Once the significance of the relationships has been determined, it is equally
important to assess the relevance of the relationships. Path coefficients in the structural
model may be significant, but their sizes maybe so small that they do not warrant
managerial attention. Structural model path coefficients are interpreted relative to one

176
another. If one path coefficient is larger than another, its effect on the endogenous latent
variable is greater. More specifically, the individual path coefficients of the path model
can be interpreted just as the standardised beta coefficients in an OLS regression. These
coefficients represent the estimated change in the endogenous construct for a unit
change in a predictor construct. Table 5.22 shows the at the relative importance of the
exogenous driver constructs in predicting the dependent construct of ERM effectiveness
in managing risks (EFF_ERM) As shown in Table 5.22, tone from the top management
(TONE_TOP = 0.584) has the strongest total effect on ERM effectiveness, followed by
enterprise systems (ENT_SYSTEM = 0.148) and organisational culture (CULTURE =
0.147). In contrast, the effect of employee involvement (INVOLVEMENT = 0.102),
organisational structure (STRUCTURE = 0.045) and strategic role of ERM Champion
(STRA_ROLE_ERMC = -0.018) is only moderately low.
The exogenous construct of enterprise system (ENT_SYSTEM = 0.356) is also
the primary driver (predictor) of tone from the top (TONE_TOP), followed by culture
(CULTURE = 0.289).
Table 5.22: PLS Algorithm Default Report - Path Coefficients
EFF_ERM TONE_TOP
CULTURE 0.147 0.289
ENT_SYSTEM 0.148 0.356
EFF_ERM
INVOLVE 0.102
STRUCTURE 0.045
STR_ROLE_ERMC -0.018
TONE_TOP 0.584 CULTURE = organisational culture, STRUCTURE = organisational structure, ENT_SYSTEM =
enterprise system, TONE_TOP = tone from the top, INVOLVEMENT = employee involvement and
STRA_ROLE_ERMC = strategic role of ERM Champion, EFF_ERM = ERM Effectiveness.

177
5.2.7.3 Test of Mediation
The current conceptual framework also predicts the mediating role of tone from
the top. The hypotheses that examine the mediating role are reflected on Table 5.23.
Similar to testing the direct relationship in the preceding Sections, SmartPLS is used to
examine the mediating effect. Specifically, we looked at the significance analysis of
path coefficient with mediator using the software. Once the mediating influence is
detected, the Variance Accounted For (VAF) is computed to assess the strength of the
mediating influence (Hair et al., 2013).
As shown on Figure 5.2 (on page 171) there is statistically significant positive
direct effect between (i) culture and ERM effectiveness and (ii) enterprise systems and
ERM effectiveness in managing risks.
Table 5.23: Hypothesis for Mediating Relationship Between Variables
H9: Tone from the top mediates the relationship between organisational culture and the
perceived ERM effectiveness in managing risks
H10: Tone from the top mediates the relationship between enterprise systems and the
perceived ERM effectiveness in managing risks
H9: Tone from the top mediates the relationship between organisational
culture and ERM effectiveness in managing risks
H9 suggests that the tone from the top has a mediating influence on the
relationship between culture and ERM effectiveness. Table 5.24 shows that tone from
the top has a significant mediating influence between culture and ERM effectiveness (β
= 0.168, p<0.00). Once the significant relationship is determined, VAF is computed.

178
Table 5.24: Significance Analysis of Path Coefficients with the Mediator
Direct Effect Indirect Effect Total Effect
CULTURE ->
TONE_TOP
TONE_TOP ->
EFF_ERM
CULTURE ->
EFF_ERM
CULTURE ->
EFF_ERM
CULTURE-
>TONE_TOP 0.289 (0.05**) 0.584 (0.00***) 0.168 (0.00***) 0.315 (0.00***)
Table 5.25 shows that 53.5% of the relationship between culture and ERM
effectiveness is explained by the mediator. Because the VAF is greater than 20% but
less than 80%, the mediating influence is said to be partial mediation (Hair et al., 2013).
Table 5.25: Variance Accounted For (VAF)
Direct Indirect Total VAF (Indirect/Total)
CULTURE ->
TONE_TOP -> EFF_ERM 0.147 0.168 0.315 0.535
H10: Tone from the top mediates the relationship between enterprise
systems and perceived ERM effectiveness in managing risks
H10 predicts the mediating role of tone from the top in the relationship between
enterprise systems and ERM effectiveness in managing risks. Table 5.26 shows that
tone from the top indeed has a significant mediating influence on the variables
concerned (r = 0.208, p<0.00) (Hair et al., 2013). Once the significant relationship is
established, the Variance Accounted For (VAF) is computed to assess the strength of
the mediating influence.
Table 5.26 shows that 58.4 % of the relationship between culture and ERM
effectiveness is explained by the mediator. In this case, the mediating influence is said
to be partial mediation because the VAF is greater than 20% but less than 80% - see
Table 5.27 (Hair et al., 2013).

179
Table 5.26: Significance Analysis of Path Coefficients with the Mediator
Direct Effect Indirect Effect Total Effect
ENT_SYSTEM ->
TONE_TOP
TONE_TOP ->
EFF_ERM
ENT_SYSTEM -
> EFF_ERM
ENT_SYSTEM -
> EFF_ERM
ENT_SYSTEM
->TONE_TOP 0.356 (0.00***) 0.584 (0.00***) 0.208 (0.00***) 0.356 (0.00***)
Table 5.27: Variance Accounted For (VAF)
Direct Indirect Total
VAF
(Indirect/Total)
ENT SYSTEM -> TONE_TOP ->
EFF_ERM 0.148 0.208 0.356 0.585
5.2.7.4 Test of Moderation
There are two hypotheses developed to test the moderating role of CRO and the
ERM Unit as presented again on Table 5.28.
Table 5.28: Hypotheses for Moderating Effect
H11: Presence of CRO moderates the relationship between the organisational variables
and perceived ERM effectiveness in managing risks
H12: A separate ERM unit moderates the relationship between the organisational variables
and perceived ERM effectiveness in managing risks
H11: Presence of CRO moderates the relationship between the
organisational variables and ERM effectiveness in managing risks
In recognition of the role played by CRO as one of the strongest indicators for
ERM adoption (Lam, 2000; Kleffner et al., 2003; Aabo et al., 2005; Beasley et al.,
2005a; Mikes, 2008; Wan Daud et al., 2010; Pagach & Warr, 2011; Yazid et al., 2011;
Mikes, 2014), the study hypothesises the moderating influence of CRO in the
relationship between the variables, namely culture, structure, enterprise systems, tone
from the top, strategic role of ERM Champion as well as employee involvement and

180
ERM effectiveness. Based on the results between the groups with and without CRO as
shown on Table 5.29, the moderating influence of CRO is only evidenced in the
relationship between tone from the top and ERM effectiveness.
Table 5.29: PLS-MGA Results for Presence of CRO
p (1) se p(1) p (2) se p(2) |p(1) - p(2)| t Value P Value
CULTURE -> ERM_EFF 0.075 0.128 0.171 0.095 -0.097 0.622 0.535 ns
ENT_SYSTEM -> ERM_EFF 0.185 0.093 0.154 0.089 0.031 0.244 0.808 ns
INVOLVE -> ERM_EFF 0.006 0.111 0.196 0.076 -0.189 1.459 0.147 ns
STRUCTURE -> ERM_EFF -0.021 0.124 0.135 0.089 -0.157 1.054 0.294 ns
STR_ROLE_ERMC -> ERM_EFF 0.055 0.105 -0.033 0.068 0.088 0.729 0.467 ns
TONE_TOP -> ERM_EFF 0.726 0.091 0.405 0.108 0.321 2.233 0.027 **
** p < 0.05, ns = not significant
CULTURE = organisational culture, STRUCTURE = organisational structure, ENT_SYSTEM = enterprise system, TONE_TOP = tone
from the top, INVOLVEMENT = employee involvement and STRA_ROLE_ERMC = strategic role of ERM Champion, EFF_ERM = ERM
Effectiveness
Group 1 :
With CRO
Group 2 :
No CRO
Group 1 vs. Group 2
H12: A separate ERM unit moderates the relationship between the
organisational variables and ERM effectiveness in managing risks
Having a separate ERM unit is also predicted to have a moderating influence on
the relationship between the organisational variables in the study with the effectiveness
of ERM in managing risks. The results shown on Table 5.30 however, do not support
the hypothesis as earlier predicted.
Table 5.30: PLS-MGA Results for Separate ERM Unit
p (1) se p(1) p (2) se p(2) |p(1) - p(2)| t Value P Value
CULTURE -> ERM_EFF 0.043 0.115 0.224 0.094 -0.181 1.107 0.270 ns
ENT_SYSTEM -> ERM_EFF 0.152 0.087 0.167 0.118 -0.015 0.107 0.915 ns
INVOLVE -> ERM_EFF 0.129 0.105 0.076 0.088 0.053 0.353 0.725 ns
STRUCTURE -> ERM_EFF 0.095 0.107 0.034 0.108 0.061 0.384 0.702 ns
STR_ROLE_ERMC -> ERM_EFF -0.012 0.082 -0.012 0.063 0.000 0.000 1.000 ns
TONE_TOP -> ERM_EFF 0.599 0.103 0.552 0.105 0.047 0.303 0.762 ns
** p < 0.05, ns = not significant
CULTURE = organisational culture, STRUCTURE = organisational structure, ENT_SYSTEM = enterprise system, TONE_TOP = tone
from the top, INVOLVEMENT = employee involvement and STRA_ROLE_ERMC = strategic role of ERM Champion, EFF_ERM =
ERM Effectiveness
Group 1 : Group 2 : Group 1 vs. Group 2
Separate ERM Unit No ERM Unit

181
5.2.8 Summary of Results
Table 5.31 tabulates the extent of the total effects of the predictor variables on the
criterion variable. According to the table, the predictor variable which explains most of
the variance in the criterion variable is tone from the top, followed by enterprise
systems and culture. Specifically, this means that managers should spend more effort on
these three main variables if they wish to improve the effectiveness of ERM in
managing risks.
Table 5.31: PLS Algorithm Default Report - Total Effects – Sizes
TONE_TOP EFF_ERM
CULTURE 0.289 0.315
ENT_SYSTEM 0.356 0.356
EFF_ERM 1.000
INVOLVE 0.102
STRUCTURE 0.045
STR_ROLE_ERMC -0.018
TONE_TOP
0.584 CULTURE = organisational culture, STRUCTURE = organisational structure, ENT_SYSTEM =
enterprise system, TONE_TOP = tone from the top, INVOLVEMENT = employee involvement and
STRA_ROLE_ERMC = strategic role of ERM Champion, EFF_ERM = ERM Effectiveness.
The summary of the hypotheses and the results are tabulated in Table 5.32.
Overall, the current study supports the earlier predictions on the influence of tone from
the top, culture and enterprise system on ERM effectiveness in managing risks. There is
also evidence of a partial mediating influence of tone from the top on the relationship
between culture and ERM effectiveness as well as between enterprise systems and ERM
effectiveness.

182
Table 5.32: Summary of Hypotheses Testing and Findings
Hypotheses Findings
H1: There is a significant positive relationship between organisational
culture and perceived ERM effectiveness in managing risks.
Supported
H2: There is a significant positive relationship between organisational
culture and tone from the top.
Supported
H3: There is a significant positive relationship between organisational
mechanistic structure and perceived ERM effectiveness in managing
risks.
Not supported
H4: There is a significant positive relationship between enterprise
systems and perceived ERM effectiveness in managing risks.
Supported
H5: There is a significant positive relationship between enterprise
systems and tone from the top.
Supported
H6: There is a significant positive relationship between strong tone from
the top and perceived ERM effectiveness in managing risks.
Supported
H7: There is a significant positive relationship between the strategic role
of ERM Champion and perceived ERM effectiveness in managing
risks.
Not supported
H8: There is a significant positive relationship between employee
involvement in risk management activities and perceived ERM
effectiveness in managing risks.
Not supported
H9: Tone from the top mediates the relationship between organisational
culture and perceived ERM effectiveness in managing risks.
Supported -
partial mediation
H10: Tone from the top mediates the relationship between enterprise
systems and perceived ERM effectiveness in managing risks.
Supported -
partial mediation
H11: Presence of CRO moderates the relationship between the
organisational variables and perceived ERM effectiveness in
managing risks.
Supported for
tone from the top
H12: A separate ERM unit moderates the relationship between the
organisational variables and perceived ERM effectiveness in
managing risks.
Not supported
The above findings support the general views in the existing literature. For
example, the influence of culture on ERM effectiveness supports the suggestion that
cultural barriers are the most critical challenges in ERM implementation (Muralidhar,
2010; Altuntas et al., 2011) and corroborates with findings from the only study on the
influence of culture on ERM by Kimbrough and Componation (2009).
With regard to enterprise systems, a study on the effectiveness of risk
management guidelines issued for the local authorities in UK reveals that in view of the
large amount of data involved, use of a computer-based system would be ideal

183
(Crawford & Stein, 2004). Levine (2004) asserts that from an implementation
perspective, the information needs of ERM necessitates the availability of IT systems
that provide a true, unified picture of risk across the organisation. The general
expectations of enterprise systems being another critical driver for an effective ERM is
further reinforced by the results of the current study which supports the positive
association between highly integrated systems and the effectiveness of ERM in
managing risks.
However, contrary to our earlier propositions, there is no evidence of a direct link
between mechanistic structure and ERM effectiveness. Neither is there any statistically
significant relationship between the strategic role of ERM Champion and ERM
effectiveness.
The lack of support between the relationship between mechanistic structure and
ERM effectiveness could be due to the hybrid and dynamic nature of the variable itself.
On one hand, we have an organic vs mechanistic structure and on the other, we have
ERM as a top down vs innovative programme. Recent literature suggests that modern
organisations are much more dynamic and adaptive and can take the form of
mechanistic or organic structure depending on the situation (Gibson & Birkinshaw,
2004; Raisch & Birkinshaw, 2008). According to this new school, successful firms are
ambidextrous–aligned and efficient meeting business demands while being receptive
and adaptive to changes in the environment (Duncan, 1976; Gibson & Birkinshaw,
2004). Based on these scholars, to be ambidextrous organisations have to reconcile
internal tensions and conflicting demands in their task environments instead of trading it
off. Additionally, the level and maturity of ERM implementation in the companies
under study varied from being in its first year or in the midst of implementation to more
than 5 years or being embedded in its processes. Therefore it could well be top down
emergent change in the beginning and became an innovation as it matures.

184
The other findings which are somewhat contrary to the theoretical expectations is
the influence of the strategic role of ERM Champion. It contradicts the views that a
strong influence of autonomy associated with risk management function especially in a
time of crisis (Kaplan & Mikes, 2012) is indeed crucial and that the role of ERM
Champion is moving away from a risk controller to a strategic business advisor (Mikes,
2008). The findings are, however, in line with the study conducted on data warehousing
implementation which does not indicate any statistically significant relationship
between the presence of a strong champion and the project's success (Wixom &
Watson, 2001).
Such findings raised an intriguing concern on the status and position of ERM
Champion in the organisational hierarchy particularly in the developing markets. The
insignificant association may suggest one of the following. Firstly, it could be that
unlike the strategic recognition received by its counterparts in developed countries such
as the US, UK and Canada, the role of ERM Champion and/or CRO in this region is
still perceived as risk controllers. Although such a risk controlling role is still positively
related to ERM (Wan Daud et al., 2010), much is needed to be done to transform the
stereotype of risk managers. Without doubts, the change in the role is critical to ERM
effectiveness by virtue of his knowledge on the overall risks faced by the organisation,
making him a valuable asset to the strategic decision makers. Secondly, it could also
indicate the absence of a full-time ERM Champion within the organisation. Based on
the Profile of the Respondents in Table 5.4 (on page 148), 69.2% of the champions are
other than the CROs, implying that they are playing a dual role in the organisation
studied hence suggesting possible lack of priorities placed on ERM initiatives. Such a
dual role played may also have led them to “go native” becoming deal makers rather
than deal questioners (Kaplan & Mikes, 2012). The same could also imply that the
image of the ERM Champions with regard to ERM is overshadowed by their so-called

185
primary role within the organisation as the CEO or the CFO, whichever applicable.
Tests of moderating influence of CRO presence was also performed on the
relationship between all the six predictor variables on ERM effectiveness. The results
showed that CRO presence moderates the relationship between tone from the top and
ERM effectiveness which is consistent with the evidence that CRO presence drives
ERM adoption (Kleffner et al., 2003; Beasley et al., 2005a; Wan Daud et al., 2010;
Pagach & Warr, 2011; Yazid et al., 2011).
A similar test was also performed using a separate ERM unit as the non-
parametric moderating variable. The results showed that establishment of a separate
ERM unit shows no moderating effects at all on the relationship between the variables
in the study and the effectiveness of ERM in managing risks. This could be explained
by the lack of a dedicated role to head the ERM units. As shown in Table 5.4 (on page
148) that while 90 of the respondent companies (or 57.7%) of the companies under
study have a dedicated ERM, only 67 out of 90 (or 74%) have a dedicated CRO. The
lack of CRO to head the ERM unit may imply the lack of command and ultimately
effectiveness of the ERM team to carry out its ERM tasks within the organisation.
The absence of relationship among the few variables warrants a scope in a
qualitative research approach which is presented in the following sections to investigate
the reasons why such a relationship does not exists.
5.3 Research Questions and Objectives for the Qualitative Study
The quantitative findings which showed the lack of associations between the
strategic role of CRO and ERM effectiveness as well as between employee involvement
and ERM effectiveness raised a couple of research questions which can only be best

186
addressed through a qualitative research approach. Additionally, two other questions
were developed to first of all investigate the actual ERM practices within the
organisation and second of all to validate the quantitative findings on the factors which
are associated with the effectiveness of ERM in managing risks.
The research questions for the qualitative studies are appended below. RQ1 and
RQ2 (qualitative) generally seek to understand ERM practices and the factors that can
influence ERM effectiveness. RQ3 and RQ4 (qualitative) were formulated to enhance
the understanding of the findings from the survey. Specifically, these objectives seek to
investigate the rationale behind the lack of significant influence of CRO and employee
involvement on ERM effectiveness from RQ3 of the quantitative study.
RQ1 (qualitative): What are the general ERM practices in Malaysian companies?
RQ2 (qualitative): What are the factors which are positively associated with
perceived ERM effectiveness in managing risks?
RQ3 (qualitative): To what extent does the strategic role of ERM Champion
influence perceived ERM effectiveness in managing risks?
RQ4 (qualitative): To what extent does employee involvement influence perceived
ERM effectiveness in managing risks?
Accordingly, the research objectives for the qualitative study are designed as follows:
RO1 (qualitative): To understand the general ERM practices in Malaysian public
companies.
RO2 (qualitative): To confirm the quantitative findings in regards to the factors
which can influence perceived ERM effectiveness in managing risks.
RO3 (qualitative): To investigate the influence of the strategic role of ERM
Champion on perceived ERM effectiveness in managing risks.
RO4 (qualitative): To investigate the influence of employee involvement on
perceived ERM effectiveness in managing risks.

187
5.4 Results of the Qualitative Study
In general, the results of the questionnaire survey as presented in the previous
Section 5.2 show that there is a positive direct influence between tone from the top,
enterprise systems and organisational culture on the effectiveness of ERM in managing
risks. Additionally, the data found evidence that tone from the top has a partial
mediating effect in the relationship between culture and ERM effectiveness as well
enterprise systems and ERM effectiveness. While our intuition, which is driven by our
knowledge and literature review on the subject, tells us that there is a significant
relationship between mechanistic structure, employee involvement, strategic role of
ERM Champion, the presence of CRO and a separate ERM unit, these hypotheses as it
turned out were not supported by the current research evidence. Specifically, save for
the moderating influence of the presence of CRO, the results of the online survey found
neither a statistically significant direct relationship between the strategic role of ERM
champion and employee involvement and ERM effectiveness nor the moderating
relationship of having a separate ERM unit on the relationship between the variables
under study and ERM effectiveness.
This qualitative tail of the research is therefore designed mainly to offer further
explanation and insights on the non-association between the aforementioned variables
under study. The qualitative research method used in the current study is predominantly
semi-structured interviews, content analysis of the annual reports and any other forms of
publicly-available documents on the company website as well as those provided by the
interviewee, particularly on the risk management practices.

188
5.4.1 Background Information
The interview participants were selected from the survey respondents’ list. The
selection is based on the scores of the main variables identified for further in-depth
investigation, namely ERM effectiveness, and strategic role of ERM Champion and
employee involvement. For companies which scored below the 33 percentile, it will be
defined as low and any scores above the 67 percentile will be considered as high in the
variable being measured.
Based on the scores and the interviewee participants’ agreement to participate in
the interview, six companies were identified for the interview as depicted on the high-
low matrix below. The matrix on the x-axis displays the variable of (i) strategic role of
ERM Champion and (ii) employee involvement and while the matrix on the y-axis
displays ERM effectiveness ranging in scores from high to low.
All the participating companies fulfilled the following criteria:
Participated in the online survey
• Implemented ERM for more than five years
• Has a dedicated head of risks with a team of at least three personnel
Additionally, Mars Berhad was identified as the model for case study for its ERM
best practices based on the stable profitability for the last five years. The approach to
identify a model is deemed necessary to gain an understanding of actual practice of
ERM activities before extending the interviews to other companies. The initial “ice-
breaking’ interview was conducted with the head of risks department of Mars Berhad
and then extended to the other employees who were involved in risk management
activities at Mars Berhad. Once an understanding on ERM practices in Mars Berhad has
been identified, the researcher went on to interview the other employees within the
organisation and thereafter the risk and other officers from other organisations for an in-

189
depth understanding of the influence of employee involvement and strategic role of
ERM Champion as the drivers for ERM effectiveness.
S
trat
egic
Role
of
ER
M
Ch
ampio
n
ERM Effectiveness
Em
plo
yee
In
volv
emen
t
ERM Effectiveness
High
Low
High
Low
High Mars Berhad Venus Berhad
High Mars Berhad Saturn Berhad
Marikh Berhad
Marikh Berhad Venus Berhad
Low Pluto Berhad Saturn Berhad
Low Pluto Berhad
Uranus Berhad
Uranus Berhad
Figure 5.3: High-Low Dimension - Strategic Role of ERM Champion vs ERM
Effectiveness and Employee Involvement vs ERM Effectiveness
5.4.2 Profile of the Interview Participants’ Companies
Table 5.33 provides the profile of the participating companies who participated in
the interview. The table shows that five of the companies are big companies with
employees of more than 10,000, while the other one were smaller firms with employees
of less than 10,000. The profit before tax (PBT) and the net assets of the companies
ranged between RM1.5 million to RM9.1 billion and RM1.9 million to RM46.2 billion,
respectively.

190
Table 5.33: Profile of the Companies Participating in the Interviews
Respondent Company (Type of
Industry)
Type of
Ownership
Number of
employees
PBT
(RM)
Net assets
(RM)
Mr A Mars Berhad
(Industrial Products)
GLC >10,000 553mil 10.5bil Ms B Ms C Mr D Ms E Mr F Ms G Pluto Berhad
(Consumer Products)
MNC >3,000 315mil 2.7bil Ms H
Mr I Saturn Berhad
(Trade/Service)
Newly listed 14,000 1.2bil 10.2bil Mr J Ms K Ms L
Mr M Uranus Berhad
(Consumer Products)
GLC Newly
listed
>19,000 1.5mil 1.9mil
Mr N
Mr O
Venus Berhad
(Consumer Products)
GLC 103,507 3.9bil 40.7bil
Mr P Marikh Berhad
(Financial Services)
GLC 47,000 9.1bil 46.2bil
5.4.3 Profile of the Interview Participants
Semi-structured interviews were performed on a total of 16 participants which
represent six companies. The participants in the interview consist of members of the
board, senior management, managers and executives with varying roles and
responsibilities in relation to ERM.
Each interview session took between 45 minutes to 90 minutes and was conducted
in the interviewees’ office except for two interview participants who requested for the
interview to be conducted outside office for convenience reason. The interview consists
of 14 face-to-face interviews and one telephone interview.
Table 5.34 provides the profile of the interviewees who participated in the
interview which shows a balanced gender composition of eight each for male and
female participants. All the interview participants were highly experienced in their
position with length of service of at least eight years. The interview participant with the

191
longest employment is Mr D and Mr O, the Chairman of the Risk Management
Committee (RMC) of Mars Berhad and Marikh Berhad, respectively who has been in
employment for more than 30 years. Except for one, all the participants held top
management positions. The background of the participants varies, with two from the
board of directors, six from risks, five from audit, two from operations and one from
finance, all of whom are directly involved in the risk management activities in their
organisation in their respective function.
Table 5.34: Profile of the Interview Participants
Name Gender Company Position Department Length of
service
Ms A Female
Mars
Berhad
Senior Manager Risk - ERM champion 25 yrs
Ms B Female Senior Manager Operations 15 yrs
Ms C Female Head of Audit Audit 17 yrs
Mr D Male Chairman of RMC Board >40 yrs
Ms E Female Senior Executive IT 8 yrs
Mr F Male Risk Executive Risk 8 yrs
Ms G Female Pluto
Berhad
Head of Risk Risk – ERM champion 8 yrs
Ms H Female Head of Audit Audit 12 yrs
Mr I Male Saturn
Berhad
Chief Risks Officer Risk – ERM champion 22 yrs
Mr J Male Head of Audit Audit 25 yrs
Ms K Female Head of Finance Finance 22 yrs
Ms L Female Uranus
Berhad
Head of Audit Audit 25 yrs
Mr
M
Male Audit Manager Audit 10 yrs
Mr N Male Venus
Berhad
Chief Risks Officer Risk - ERM champion 27 yrs
Mr O Male Chairman of RMC Board >40 yrs
Mr P Male Marikh
Berhad
Chief Risks Officer Risk – ERM champion 27 yrs

192
5.4.4 Findings from the Qualitative Data
5.4.4.1 ERM Practices and its Perceived Effectiveness Within Organisations
The findings from the interview send a mixed understanding on ERM practices
which is consistent with studies suggesting that ERM is a worldwide concept. It is
always implemented and interpreted in local ways (Mikes, 2009; Arena et al., 2010;
Mikes, 2011; Tekathen & Dechow, 2013). There were a number of similar themes such
as setting up of board risk management committee, appointment if risk coordinator,
regular risk review cycle etc yet each are different in many ways.
Based on the interview, ERM activities in all the six participating organisations is
supported by a dedicated risk management department headed by either a chief risks
officer in three instances or a senior manager in the remaining three cases.
Although the ultimate responsibility for risk management lies with the board of
directors, in all instances, the board delegated the responsibilities to the board
committee established to oversee the effectiveness of risk management in the
organisations. Five out of the six participating organisations established a separate
committee to review the solely the risks management affairs while the remaining one
company set up a committee to review audit and risk managemet affairs jointly.
Generally, the scope of the risk management committee is to formulate the overall risk
management strategy of the company and approve any major risks decision undertaken
by the company. Only major risks or the top few risks will get discussed by this sub-
committee of the board. To further facilitate and enhance the continuous monitoring and
evaluating of the all risks related matters, five of the participating organisations
established a committee at the management executive level. The scope of this
committee is to scrutinise and evaluate all the risks area prior to presenting the major

193
ones to the board risk management committee. This will ensure that all risks area get the
necessary level of attention and to avoid only the major risks getting attention by the
board and the others being overlooked.
When asked to explain ERM practices within the organisations, all of them appear
to have common understanding on the new approach of risk management practices of
looking at risks holistically instead of individually. The main risks management
processes of risk identification, assessment, mitigations, monitoring and communication
are practised in the participant organisations. The interviewees also acknowledged ERM
implementations as a journey over time and not something that can be implemented
overnight. Mars Berhad, for example, took almost eight years to be where it is now and
yet there was still room for improvement. ERM implementation is an evolution over
time - it was only three years ago that Mars Berhad came up with the risk appetite for
the company which maps the probability against the severity of the impact should the
risk event materialise. Thereafter, in 2012, the policy on Project Risk Assessment was
endorsed and communicated in 2012 making it compulsory for risks to be considered in
any projects undertaken by Mars Berhad. In Uranus Berhad, the risk management
committee was only established in 2013 to assist the board in fulfilling its statutory and
fiduciary responsibilities in relation to risk management taking over the responsibilities
from the audit committee.
In most instances, an external consultant is engaged for the first time
implementation. In the case of Mars Berhad, Jardine Lloyd Thompson and for Pluto
Berhad, PricewaterhouseCoopers Malaysia was respectively engaged to assist in the
implementation of ERM. This is rather common owing to the fact that companies may
not have inhouse experts in risk management and therefore are forced to seek expertise
support (Makarova, 2014).

194
All the six companies practice a quarterly sign-off on the risk registers and except
for two which uses an Excel spreadsheet; the remaining participating companies operate
risk management databases in special ERM software to facilitate the update and sign-off
by the relevant personnel.
In terms of the governing framework, all the participants’ companies implemented
ISO 31000 save for two in the financial services industry in which COSO 2004
framework is more prominently applied. Please refer to Appendix F for the main ERM
practices in the participating companies.
When asked about the effectiveness of ERM in managing risks, the common
theme from the interviews is that, even before ERM is being introduced, managing risks
has always been in the company’s veins and subconsciously embedded in the day-to-
day running of the companies. However, as the company grows bigger, needs arise for
the risk activities to be managed consciously and cautiously in a more systematic and
structured manner. Indeed, the Chairman of the Board Risk Management Committee
welcomed this new approach to managing risks because it is the only way to “keep the
company afloat”. As member of the Board which is ultimately responsible for the
management of risks, he gets the comfort of knowing that risks are being managed at a
one-stop centre instead of being fragmented as it used to before.
5.4.4.2 Factors Which Can Influence Perceived ERM Effectiveness
The empirical evidence from the survey showed the presence of positive
relationship between tone from the top, enterprise system and culture and ERM
effectiveness but lack of evidence of employee involvement, ERM champion as well as
mechanistic structure as the drivers for ERM effectiveness.
Similar to the findings of the survey, the interview findings suggests that tone

195
from the top seems to be the theme of the day when it comes to ERM implementation.
The first statement which Ms A gave was that she is lucky because the CEO of Mars
Berhad when she joined the company about eight years ago it was very supportive.
“the MD was saying that in addition to the risk management which he knows
that I’m familiar with; something that he wants me to do is also business
continuity management because he said that as an airport we need to have a
continuity plan. So, I said to him, honestly, I don’t have any experience so, he
said it’s okay, you can appoint a consultant to assist.”.
Both Ms G and Ms H also agreed that in Pluto Berhad, the tone from the top when
it comes to risk matters was quite strong. According to Ms H, the head of internal audit,
the support from the top is evidenced in the establishment of:
“a dedicated Risk Management Committee” in mid-2013 which “shows that,
you know, at the board they think that it deserves time and attention. So, on a
quarterly basis, half a day is being spent by board members to talk about risk.”
The same is also observed in Uranus Berhad with the setting up of its risk
committee, also in 2013. The setting up of risk management committee from among
members of the board further marked an important milestone in getting the management
support.
The other common factors which are identified by the interview participants are
ERM champion, employee involvement and enterprise systems. The participants mostly
gave less merit to mechanistic structure in terms of its role to drive ERM effectiveness.
For example, Mr I, Mr J and Mr P suggest that organisational structure is not as
important as the other variables examined in this study. However, when asked on the
role of ERM Champion and employees, all the interview participants were unanimous
on their importance to warrant an effective ERM in managing risks.

196
The respondents generally agree that the role of ERM champion is key to ERM
effectiveness. Mr D and O who are the Chairman of Risk Management Committee of
Mars Berhad and Venus Berhad, respectively were both agreeable to the critical role
which the ERM champion plays in making sure that the ERM is effective in achieving
its objectives of managing risks.
In regards to employee involvement, Ms A for example, sees her role as the head
of risk management and her team only as the facilitator and coordinator. At the end of
the day, it is the commitment and involvement of the employees from all levels which
determined the effectiveness of ERM in managing risks. She used her company’s
programme called Operational Readiness and Testing (ORAT) which coordinates the
business continuity plans for Mars Berhad. All the tests and trainings are conducted by
the employees with her department only facilitating the process. Ultimately, the input
and action plans documented in ORAT belong to the employees who are responsible to
execute them when the situation arises. This view is echoed by Ms G (Pluto Berhad),
Mr I (Saturn Berhad) and Mr N (Venus Berhad).
On a whole, other than the positive influence of the strategic role of ERM
champion and the extent of employee involvement on ERM effectiveness, the feedback
from the interview participants are consistent with the quantitative findings of
significant relationship between tone from the top, enterprise systems and culture as the
pre-requisites for ERM effectiveness.
Given the above contradiction among literature, findings and the general intuitions
in regards to the influence of the strategic role of ERM champion and the extent of
employee involvement on ERM effectiveness, further probe were carried out to narrow
down the discussions towards these variables which findings are discussed in the
subsequent sections.

197
5.4.4.3 The Strategic Role of ERM Champion and Perceived ERM
Effectiveness
Despite the research propositions, the findings from online survey suggest lack of
associated relationship between the strategic role of ERM Champion and ERM
effectiveness. To further clarify the findings, Section 5 of the interview protocol
consists of questions in relation to the strategic role of the ERM Champion.
The non-risks participants were asked to state whose name comes to mind when
the researcher was asked to name the ERM Champion for their company and all the
nine non-risks interviewees has appropriately identified the CRO or the head of risks as
the ERM Champion. Not all of them agree, though, that the identified Champion carries
the necessary skill sets and the authority required to carry out their Champion role
effectively. The interviewees from two companies questioned somewhat the
effectiveness of the ERM Champion – on the basis that the ERM Champions in the
companies lack the charisma and competencies to be visible in their role and ultimately
to be in command and the driver for ERM change management initiatives. This is,
however, not surprising because in the remaining instances the ERM Champion is
merely the head of risks whose authority is diluted in the reporting structure when the
position has to report to another senior management team. In Mars Berhad for example,
the head of risks is only a senior manager and is reporting to the Senior General
Manager, Planning. Interviews with the other participants from the same company
suggest that despite the lack of recognition, Ms A is certainly a talent to retain. She
appears to be competent and initiated various initiatives to promote risks management
culture among the employees. According to Ms E, Ms A has a major influence on risks
initiatives in Mars Berhad, that she was addressed as “Ms A Risks” among colleagues.
one of the risk coordinators at Mars Berhad. When asked about Ms A’s influence, Ms C,

198
the head of internal audit responded:
“surely there is influence, of course, …that’s why things are happening in terms
of conferences, awards, circulars, e-mails sign-offs etc. I mean, there must have
been some level of influence, if not things (all these events) wouldn’t have
reached here (organised at Mars Berhad).”
This view is however not shared in Uranus Berhad. When interviewed, the audit
counterparts questioned the effectiveness of the Head of Risks and further recommend
for the recruitment of a credible CRO who will be reporting directly to the Chief
Executive Officer of the company. Same as in the case of Saturn Berhad, wherby Ms K
argues that given the specialised nature of the oil and gas industry, it is crucial for the
ERM Champion of the company to possess some technical knowledge in order to be
effective in what he does. In Jupiter, due to the company size, the CRO role is
shouldered by the Chief Financial Officer and managed by a small risk management
team supported the group risk management team.
The interview findings with the participants consisting of champions and non-
champions revealed that champions displayed greater transformational, leadership
behaviour to a significant extent than did non-champions. In addition, they initiated
more influence attempts, and used a greater variety of human relations and
communication skills than that of non-champions (Howell & Higgins, 1990).
Only three out of six companies included the role of ERM Champion in the C-
suite by having a Chief Risks Officer alongside the Chief Executive Officer and the
Chief Financial Officer. In Pluto Berhad, although the ERM Champion is only a
manager, she reports directly to the CEO which reflects somewhat the recognition from
the management team that risks management is under the responsibility of the highest
person. When asked why the position was not a CRO, the response was that it is not

199
necessary because risk management activities in that company are quite stable and
mature, hence no major risk surprises are actually expected. After all, being a
multinational company which processes are monitored and controlled by the Singapore
counterpart, the control and risk culture is already embedded in the mindset of the
employee. This however, may not gel well with the rest of the employees who may
perceive the lack of office position as lack of power and importance as far as risk
management is concern.
The Chairman of the Board Risk Management Committee for Mars Berhad, Mr D,
who is also the member of risks management committee for a couple other listed
companies, Uranus Berhad and Jupiter Berhad, which are also participant organisations
in the study, makes a general comparison of how risks are being managed at each of
these three companies. While the fundamentals of ERM components are almost similar
for all three, he recognised that each has a differing level of maturity and expertise both
in appearance and in fact, in terms of risks management intelligence within the
organisation.
Based on his seatings in various meetings of the three companies coupled with his
formal and informal interactions, Mr D is of the view that the standards of ERM
intelligence at Venus Berhad as impressed by Mr N (the CRO of Venus Berhad), is
much superior compared to the other two companies. When asked why, he explained his
views with the way the comprehensive risks overview he got from the reports of ERM
Champion at Venus Berhad and the professed knowledge he has on facts and figures
when it comes to the risks (at least the top ones) faced by Venus Berhad. One distinct
characteristic of the ERM Champion among the three companies under comparison is
that only the ERM Champion at Venus Berhad holds the position of CRO, which gives
him the benefits of authority and autonomy that comes with the title.

200
Mr O, the Chairman of the Risk Management Committee at Marikh Berhad
expressed a very crucial point whereby he submitted that the effectiveness of CRO
himself is determined by his own credibility and command to drive and champion the
ERM initiatives undertaken by the organisation. Based on the interviews conducted, Mr
O seems to be very pleased and satisfied with the performance of his CRO as compared
to Mr D, the chairman of the Risk Management Committee at Mars Berhad. This is
further reflected in the lack of authority in respect to their ERM champion which is
impressed upon the researcher by the other interview participants.
The above findings from the interview undoubtedly suggests that the strategic role
of champion is only ‘real’ both in fact and in appearance if the position is recognised as
a deserving a C-suite holder or even in its standing and credibility, if the position report
directly to the risk management committee. In other words, the extent of the influence in
the strategic role of the ERM Champion is determined much by the authority and
autonomy of the person who carries the role.
Additionally, the need for a CRO is somehow not seen as important in the
organisations under the qualitative study except for a couple of regulated companies, i.e
financial institutions. Of the six companies which were investigated, it is learnt that only
two have a chief risks officer.
Additionally, while all the participating organisations have a dedicated ERM unit,
the ERM unit is not seen as effective due to the lack or authority of the person who
heads the team. This explains its lack of moderating influence on the relationship
between the factors under study and the perceived effectiveness of ERM in managing
risks.

201
5.4.4.4 Employee Involvement and Perceived ERM Effectiveness
With regard to the employee involvement, all the organisations interviewed
assigned the responsibility to the risk coordinator, who then complied the risks
information from the identification process to coming up with the mitigating action
plans.
Quantitative data of the current study however show that there is no significant
relationship between employee involvement and ERM effectiveness in managing risks,
although based on the content analysis and semi-structured interview findings, all the
participant organisations seem to be delegating down the tasks of identifying, assessing
and ultimately mitigating risks to the risk champion or coordinator appointed at the
divisional or unit level which is consistent with the theory of empowerment in its
delegation sense (Burke, 1986). Practically all the interview participants acknowledged
that the employees closest to the processes or the risks points are the best persons to
carry out risk responsibilities effectively. The head of risks of Mars Berhad insisted that
she and her risk teams is:
“only the facilitator in making sure that risks are being identified, assessed and
monitored regularly and ultimately the mitigation actions being formulated and
put into action when the risks is triggered”.
She contended that:
“in most events of risks materialising, time is critical and it is a matter of
urgency that the appropriate employee reaction has to be impulsive. There
won’t be sufficient time for the risk units to be consulted and hence the need for
employees to get involved and engaged in the risk management activities in the
organisation. This will ensure that the employees know by heart what they are
supposed to do in such loss or even life-threatening situation”..

202
When asked if employee involvement is crucial to an effective ERM, Mr P, the
chief risks officer from Marikh Berhad, one of the major banks in Malaysia, responded
using the analogy of the “three lines of defence” policy practised by the Bank – the first
line of defence being the risk-taking units, the second one, risk-control units followed
by internal audit as the final or third line of defence. The risk-taking units are the line
management who are responsible for the day-to-day management of risks inherent in
their business activities. The risk-control units, which are the second line of defence, are
responsible for setting up risk management frameworks and developing tools and
methodologies for the identification, measurement, monitoring, control and pricing of
risk complemented by internal audit, which provides independent assurance of the
effectiveness of the risk management approach. This is further echoed by Mr J, the head
of audit of Saturn Berhad who explained that in his company:
“the first line of defence is the line management where the operations team right
up to the head of the business units are the first line of defence to deal with the
situations at hand, in this case any risk occurrences or uncertainties faced by
the units. The second line of defence is the health, safety and environment team
and other corporate offices such as human resources, corporate finance and
corporate risks and finally, the third of line of defence is the internal and
external auditors”.
For effective and efficient coordination between the first and second line of
defence, risk coordinators are appointed for each division or business unit. The risk
coordinators are responsible for coordinating all the risk management processes at the
divisional level and ultimately prepare and update the risk registers on a regular basis.
Facilitating the organisation and reporting of the risk registers is the risk department
which sits in the second line of defence. Review by the internal auditor is performed on
a regular basis to provide an independent assurance of the effectiveness of the risk

203
management approach.
While employee involvement is agreed by all the interviewee participants as an
important element for ERM effectiveness, getting Malaysian employees to become
involved has its own sets of challenges, mainly driven by culture. According to Ms A,
unless probed and provoked, input and feedback from Mars Berhad employees is
difficult to come by. Unlike their western counterparts, Malaysians are generally of the
agreeable sort and introvert. Malaysians are also less open compared to the Americans
(Mastor, Jin, & Cooper, 2000). Other barrier to getting employee engagement and
commitment is the support from the superior. In all instances, the risk coordinators
appointed at the business unit or departmental level has his or her main role in the
organisation. In situations when resources are scarce, more often than not, risk
management gets less priority by the middle management whom the risk coordinators
report to.
To lift these barriers and to promote an open culture and to encourage employees’
feedback, companies have developed a few initiatives. In Mars Berhad for example, the
risks department organised events such as an annual risks conference and a risks day.
The conferences and the risks day help to create awareness and to get buy-in from the
heads of division, as well the employees. Among the highlights of the events is the
sharing of best practices by the risk practitioners who are invited to give a talk during
the conference. Such a sharing session is important to relay the importance and
relevance of ERM in today’s corporate world. Additionally, the event is attended by the
board members as well as the senior management team as an emphasis of it being also
in the agenda for the board and the senior management team. Additionally, the efforts
and commitment by the risk coordinator alongside the head of the division is recognised
through the best manager awards and the attractive prizes to the award winners just to
create the reward for those who are actively involved in the ERM process. These

204
initatives however, were not common in the other participating organisations which
explained the lack of positive influence of employee involvement.
High scores of employee involvement is not a guarantee to the effectiveness of
ERM in managing risks. One of the possible reasons could be the complexity of the
business which will be elaborated in the subsequent discussions.
Figure 5.3 (on page 189) shows that both Venus Berhad and Saturn Berhad have a
high employee involvement but somewhat low in ERM effectiveness. On the other hand
Pluto Berhad, which gets low scores on employee involvement, perceived that its ERM
practices are highly effective in managing risks. Upon further investigation, it was
found that both Venus Berhad and Saturn Berhad are a group of diversified units with
profit before tax of RM3.9 billion and RM40.7 billion and net assets of RM1.2 billion
and RM10.2 billion, respectively. According to a statement in its annual reports, Venus
Berhad is a:
“Malaysia-based diversified multinational involved in key growth sectors,
namely, plantation, industrial equipment, motors, property and energy &
utilities with a total workforce of 103,000 employees and presence in 26
countries around the globe.”
Similarly, Saturn Berhad is
“one of the world’s largest integrated oil and gas service and solution providers
with principal business ranging from end-to-end services and solutions to the
upstream petroleum industry covering activities such as engineering,
construction, installation and commissioning of offshore pipelines and
structures, provision of accommodation and support vessels, drilling services,
topside maintenance services, underwater and diving services, geotechnical and
geophysical services and project management through to development and

205
production. It has a total workforce of over 9,000 people coupled with global
presence in over 20 countries including Malaysia, China, Australia, Middle
East, America, Brazil and many more”.
Entities of such diversity and size inevitably is highly complex, hence imposing
further hindrance to putting in place an effective ERM no matter how high is the level
of employee involvement, hence explaining the non-association between employee
involvement and ERM effectiveness in managing risks.
5.5 Summary
This chapter provides discussion for the results from the online survey campaign
and the content analysis of the company annual reports and the semi-structured
interviews. The detailed results of the online questionnaire, which includes the
demographic and the ERM profile of the respondents, the descriptive analyses of the
main variables (both dependent and mediating variables) followed by the descriptive
analyses of the independent variables. Thereafter, the analyses between and among
groups using t-tests and the analysis of variance (ANOVA) are presented and discussed
to determine any significant difference in the selected demographic data which may
have an influence on the variables under study. A few of the analyses show significant
differences, suggesting further examination into the nature of the differences and how it
may affect the findings of the study.
Partial Least Squares (PLS) techniques are used to determine the properties of the
PLS measurement model followed by the hypotheses testing. The test of the mediation
is based on the mediation condition by Hair et al. (2013).
The moderating influence of presence of CRO and the establishment of a separate
ERM unit is tested using PLS by comparing the results of the different sub-groups of

206
data for each moderating variable.
On the whole, consistent with earlier predictions, the results of the current study
found significant direct links between tone from the top, culture and enterprise system
with ERM effectiveness in managing risks. There is also evidence of partial mediating
influence of tone from the top on the relationship between culture and ERM
effectiveness as well as between enterprise systems and ERM effectiveness. However,
contrary to our propositions, there is no evidence of a direct link between mechanistic
structure and ERM effectiveness. Neither is there any statistically significant
relationship between strategic role of ERM Champion and ERM effectiveness, nor
employee involvement and ERM effectiveness.
Additionally, the survey results show that the presence of CRO only has a
moderating influence on the relationship between tone from the top as the driver for
ERM effectiveness. On the other hand, establishment of a separate ERM unit shows no
moderating effects at all on the relationship between the variables in the study and the
effectiveness of ERM in managing risks.
The second part of the chapter provides discussion on the result from the semi-
structured interviews and the content analysis of the publicly available data. The
findings from the interviews and the content analysis generally confirmed the earlier
propositions on the role of culture, structure, enterprise systems, tone from the top,
strategic role of ERM Champion and employee involvement on the criterion variable,
which is ERM effectiveness in managing risks.
Notwithstanding the general understanding, the lack of recognition on the role of
ERM Champion as well as the complexity of the business of the respondents may have
diluted the influence of ERM champion and employee involvement on ERM
effectiveness, hence the non-association findings.

207
CHAPTER 6 DISCUSSION AND CONCLUSIONS
6.1 Introduction
This final chapter comprises six sections. The aim of this chapter is to conclude
this dissertation. After this introduction section, the following Section 6.2 will
summarise both the quantitative and qualitative findings and how these findings address
the objectives of the current research. Thereafter in Section 6.3, research implications
are discussed. The research implications are broken down into two parts: theoretical as
well practical implications. Section 6.4 presents the limitations of the study. Section 6.5
outlines the directions for future research. The conclusion in Section 6.6 is the closure
for the chapter.
As emphasised throughout this dissertation, the investigation on the perceived
effectiveness of ERM in managing risks is lacking, let alone the investigation into the
organisational factors and actors which can influence ERM effectiveness (Soin &
Collier, 2013).
To narrow the gap, this study proposes a comprehensive model to blend both the
organisational factors and actors and examines the relationship between these variables
and the perceived effectiveness of ERM in managing risks.
Using contingency theory as the pillar theory aided by theories of power and
empowerment, the study investigates the direct relationship between the organisational
factors of culture, structure and enterprise systems, and actors of tone from the top, the
strategic role of ERM Champion and employee involvement and perceived ERM
effectiveness. Moreoever, the current study seeks to examine the mediating role of tone
from the top in the relationship between culture and ERM effectiveness and between
enterprise systems and ERM effectiveness. Finally, the model in the study examines the

208
moderating influence of the categorical variables of CRO presence and a separate ERM
unit.
In this Chapter Six, the concluding discussions on the findings are driven by five
objectives for quantitative alongside four objectives for the qualitative part of this
research. The qualitative study is undertaken to enhance the understanding on ERM
practices, in general and to explain the rational behind survey results, in particular.
Specifically, RO3 and RO4 of the qualitative research for this study are designed to
explain the rationale behind the lack of significant influence of the strategic role of
ERM champion and employee involvement on ERM effectiveness.
During the initial stage, the following five research objectives were designed for
the quantitative research of this study.
RO1: To investigate the level of ERM adoption and maturity in Malaysia.
RO2: To evaluate the level of perceived ERM effectiveness in managing risks.
RO3: To investigate whether there is any direct relationship between the organisational
factors, namely culture, structure and enterprise systems and actors namely, tone from
the top, strategic role of ERM Champion and employee involvement and perceived
ERM effectiveness in managing risks.
RO4: To examine whether tone from the top mediates the relationship between culture
and perceived ERM effectiveness and between enterprise systems and perceived ERM
effectiveness in managing risks.
RO5: To examine whether CRO presence and the establishment of a separate ERM unit
moderates the relationship between the organisational factors and actors and the
perceived ERM effectiveness in managing risks.
Subsequently, the following five research objectives were designed for the
qualitative study to find the explanation behind some of the findings from the survey:

209
RO1 (qualitative): To understand the general ERM practices in Malaysian public
companies.
RO2 (qualitative): To confirm the quantitative findings in regards to the factors that can
influence perceived ERM effectiveness in managing risks.
RO3 (qualitative): To investigate the influence of the strategic role of ERM Champion
on perceived ERM effectiveness in managing risks.
RO4 (qualitative): To investigate the influence of employee involvement on perceived
ERM effectiveness in managing risks.
6.2 Discussions of Findings
Data collected from Malaysian public listed companies is used to test the
hypotheses developed for this study. The online survey which ran for a period of six
weeks generated 186 respondents, were later reduced to 144 usable responses after
removing the multiple respondents and companies that had not implemented ERM.
In addition, content analysis in the form of a review of the company’s annual
audited accounts, particularly the Statement of Risk and Internal Control, as well as
semi-structured interview were carried out to gain further insight and in-depth
understanding of the subject, particularly in justifying the unexpected findings from the
survey. A total of six companies participated in the interviews. The selected companies
had a combination of high/low ERM effectiveness and strategic role of ERM champion
as well as high/low ERM effectiveness and extent of employee involvement participated
in the interview. These companies are represented by sixteen individuals consisting of
members of the board, senior management, managers and executives with varying roles
and responsibilities in relation to ERM.

210
6.2.1 Summary of Research Objectives (Quantitative and Qualitative)
The research objectives for both quantitative and qualitative data and the relevant
hypothesis, findings as well as conclusion are summarised on Table 6.1.
Table 6.1: Summary of Research Objectives, Hypotheses and Findings
Research Objectives (Descriptive)
RO1: To investigate the level of ERM adoption and maturity in Malaysia.
Findings Conclusion
Out of the 156 respondents, 82 companies (or
52.6%) submitted that ERM is the integral part of
the organisation, followed by 46 (or 29.5%) which
is in the process of implementing a complete ERM.
25 companies (or 16%) are considering or planning
to implement a complete ERM. Only 3 out of 156
companies do not plan to implement ERM at all.
The level of ERM adoption and maturity
is moderately high. Overall, 73% has
evidence of ERM implementation. More
than half (53%) have adopted a complete
ERM in the workplace.
.
RO2: To evaluate the level of perceived ERM effectiveness in managing risks.
Findings Conclusion
Only 48 companies (or 33.3% of the respondents)
perceived ERM as highly effective in managing
risks followed by 49 others (or 34%) which have
medium scores. The remaining 47 companies (or
32.6%) have low scores in regard to perceived
ERM effectiveness in managing risks.
Based on the findings, majority or 67.3%
of the respondents perceived ERM as
moderately or highly effective in
managing risks.

211
Table 6.1: Summary of Research Objectives, Hypotheses and Findings (continued)
Research Objectives (Quantitative)
RO3: To investigate whether there is any direct relationship between the organisational factors,
namely the organisational culture, structure and enterprise systems and actors namely, tone from
the top, strategic role of ERM Champion and employee involvement and perceived ERM
effectiveness in managing risks.
Hypothesis Findings Conclusion
H1: There is a significant positive relationship
between organisational culture and perceived
ERM effectiveness in managing risks.
H2: There is a significant positive relationship
between organisational culture and tone from
the top.
H3: There is a significant positive relationship
between organisational mechanistic structure
and perceived ERM effectiveness in managing
risks.
H4: There is a significant positive relationship
between enterprise systems and perceived
ERM effectiveness in managing risks.
H5: There is a significant positive relationship
between enterprise systems and tone from the
top.
H6: There is a significant positive relationship
between tone from the top and perceived ERM
effectiveness in managing risks.
H7: There is a significant positive relationship
between the strategic role of ERM Champion
and perceived ERM effectiveness in managing
risks.
H8: There is a significant positive relationship
between employee involvement in risk
management activities and perceived ERM
effectiveness in managing risks.
Supported
Supported
Not
supported
Supported
Supported
Supported
Not
supported
Not
Supported
Empirical evidence indicates
that culture, enterprise systems
and tone from the top has a
significant positive relationship
on ERM perceived effectiveness
in managing risks. However, the
same is not reflected in the
relationship between structure,
strategic role of ERM Champion
and employee involvement and
perceived ERM effectiveness.
In addition, the empirical
evidence confirms the
significant relationship between
culture and tone from the top as
well as between enterprise
systems and tone from the top.

212
Table 6.1: Summary of Research Objectives, Hypotheses and Findings (continued)
Research Objectives (Quantitative)
RO4: To examine whether tone from the top mediates the relationship between culture and
perceived ERM effectiveness and between enterprise systems and perceived ERM effectiveness
in managing risks.
Hypothesis Findings Conclusion
H9: Tone from the top mediates the
relationship between organisational
culture and perceived ERM
effectiveness in managing risks.
H10: Tone from the top mediates the
relationship between enterprise systems
and perceived ERM effectiveness in
managing risks.
Supported -
partial
mediation
Supported -
partial
mediation
Empirical evidence indicates partial
mediating effects of tone from the
top in the relationship (a) between
culture and perceived ERM
effectiveness and (b) between
enterprise systems and perceived
ERM effectiveness.
RO5: To examine whether CRO presence and the establishment of a separate ERM unit
moderates the relationship between the organisational factors and actors and perceived ERM
effectiveness in managing risks.
Hypothesis Findings Conclusion
H11: Presence of CRO moderates the
relationship between the organisational
variables and perceived ERM
effectiveness in managing risks.
H12: A separate ERM unit moderates
the relationship between the
organisational variables and perceived
ERM effectiveness in managing risks.
Supported
for tone from
the top
Not
supported
Empirical evidence indicates that
presence of CRO moderates only the
relationship between tone from the
top and perceived effectiveness in
managing risks.

213
Table 6.1: Summary of Research Objectives, Hypotheses and Findings (continued)
Research Objectives (Qualitative)
Research Objectives Conclusion
RO1 (qualitative): To understand
the general ERM practices in
Malaysian public companies
There were a number of similar themes such as setting
up of a board risk management committee, appointment
of risk coordinator, regular risk review cycle, etc. yet
each are different in many ways.
RO2 (qualitative): To confirm the
quantitative findings in regards to
the factors which can influence
perceived ERM effectiveness in
managing risks.
Except for structure, generally, interview participants
concurred on the model proposing the positive
relationship between the organisational factors (which
consists of culture and enterprise systems) and the
perceived ERM effectiveness as well as the relationship
between the internal human agencies (which consists of
tone from the top, strategic role of ERM Champion and
employee involvement) and the perceived ERM
effectiveness.
RO3 (qualitative): To investigate
the influence of the strategic role
of ERM Champion on perceived
ERM effectiveness in managing
risks.
Out of the six participating companies, only three has its
ERM Champion as part of the senior management team.
There were also questions raised on the skill sets and the
authority of the champion.Bear in mind, Not many
companies has CRO (only 43% has a CRO) and only
31% of them is regarded as the ERM champion. It could
be that the role is not considered crucial within the
organisation (see Table 5.4)..
The lack of the association between the strategic role of
the champion and ERM effectiveness can be explained
by the lack of power from the lack of title and lack of
skills which is explained by the theory of power. They
are not part of the management team. They have limited
access to the management team.
RO4 (qualitative): To investigate
the influence of employee
involvement on perceived ERM
effectiveness in managing risks.
Our interview findings suggests two rationale behind the
non-association.
First, business complexity hinders the positive impact
from employee involvement.
Second, The scope and the motivations behind the risk
coordinators varies from coordinating for the sake of
compliance to one who is so committed and dedicated.
The nature of ERM which is very formalised and
procedural limits one’s ability to get more involved. The
lack of motivations on the part of the risk coordinators
and ultimately the employees can be due to the failure of
empowering in its enabling sense (from lack of
awareness and from poor lack of authority). As a results,
employees are demotivated to accomplish task
objectives (Ogboro&Obeng, 2000) which is key to ERM
effectiveness.

214
Accordingly, the following Figure 6.1 presents the research model for this
research. The first eight hypotheses tested the direct relationship between the variables.
Hypotheses 9 and 10 tested the mediating role of tone from the top in the model.
Finally, hypotheses 11 and 12 examined the moderating role of CRO and a separate
ERM unit.
Figure 6.1: The Research Model of the Study
6.2.2 Research Objectives (Quantitative and Qualitative) Revisited
The current section reports the quantitative findings in relation to the research
objectives. Where applicable, the findings from qualitative study are also discussed to
enhance the understanding on ERM practices, in general and to explain the rational
behind survey results, in particular.
For the purpose of this research, quantitative data consists of data from (i) content
analysis of keyword search and (ii) 144 online survey respondents. Qualitative methods
consist of (i) content analysis in the form of a review of the company’s annual audited

215
accounts, particularly the Statement of Risk and Internal Control, as well as (ii) semi-
structured interview. These qualitative methods were carried out to gain further insight
of the subject, particularly in justifying the unexpected findings that are contrary to the
general expectation and with the literature.
6.2.2.1 Research Objective 1
RO1: To investigate the level of ERM adoption and maturity in Malaysia.
In terms of the level of ERM adoption, more than half of the respondents (52%)
indicated that ERM is an integral part of the (strategic) planning and control cycle,
implying a complete implementation of ERM which is embedded in the planning and
control process of the entity. In comparison, a similar survey conducted in Malaysia in
2008 on 89 companies and in 2009 on 817 organisations headquartered in the
Netherlands indicate that 42% (Wan Daud et al., 2010; Wan Daud, 2011) and 11%
(Paape & Speklé, 2012) respectively, of the respondents has reached such a level of
ERM adoption as compared to 53% in the current study – see Table 6.2. Additionally,
there were only 2% in the current study that have no plans to implement ERM as
compared to 14% and 3% in the Netherland study and 2008 Malaysian study,
respectively.
Comparison between the level of adoption between the current findings and the
earlier study conducted in 2008 show a fairly reasonable increase with 82 companies,
stating that ERM is an integral part of the organisation in 2014 as compared to 37 in
2008. Despite the difference in the sampling size and method, one is not doing unjustice
to construe that there is till much to be done to encourage ERM practices in this part of
the world.

216
Table 6.2: Comparative Analysis on the Level of ERM Adoption
Years of Survey/ 2008 1 2009
2 2014
3
Categories Frequency % Frequency % Frequency %
No plans to implement ERM. 3 4 114 14 3 2
Considering to implement a complete
ERM.
12 14 318 39 10 6
Planning to implement a complete ERM. 4 5 192 24 15 10
In the process of implementing a complete
ERM.
33 36 102 12 46 29
ERM is an integral part of the organisation. 37 42 91 11 82 53
Total 89 100 817 100 156 100
1 - Mail survey among Malaysian public listed companies (Wan Daud et al., 2010; Wan Daud, 2011) 2 - Mail survey among companies headquartered in Netherlands (Paape & Speckle, 2012)
3 - Online survey among Malaysian public listed companies with evidence of ERM adoption in the annual report (this
survey)
In terms of ERM maturity, more than half of the 156 respondent organisations
(59.0%) have implemented ERM for more than four years. This high level of adoption
reflects the high level of ERM implementation among Malaysian PLCs despite its
introduction merely a decade ago. Down in the list are another 24.4% and 8.3% which
have implemented ERM for more than three years but less than four years and more
than two years but less than three years, respectively – See Table 5.4 on page 148. The
remaining 8.3% of the companies stated that they are not implementing ERM.
The level of ERM adoption is driven by a number of factors. The main factor is
costs. Prior to enjoying the benefits, there is a costs or ‘investment’ (Makarova, 2014)
attached in the implementation of ERM which poses obstacles to smaller companies in
implementing ERM. In many initial roll-out instances, external consultants were
engaged to support the ERM set-up processes (Makarova, 2014) due to lack of internal
know-how in risk management. The consultation fee is far from negligible because of
the specialised nature of the field and the need to fit into the unique characteristics of
the company. Additionally, once implemented, the need for regular update entails for
dedicated risk officers to be hired and preferably a separate ERM unit to be set up. This
places further load on the operating expenses, not to mention the small and limited risks

217
talents which pose challenges in hiring the right risks team. As it stands, ERM is
considered by many as the additional back-room effort whose benefits are neither
tangible nor quantifiable.
The other important factor to improve the adoption rate is regulations (solvency
and corporate governance). Study suggests that without strong enforcement by the
regulators, companies might not have ERM or at least not implemented in such a speedy
manner (Acharyya & Johnson, 2006). This is further supported by the current findings
that companies in the finance industry, which is known for its stringent regulations,
recorded the highest number of ERM adopters of 68% of the total industry followed by
the companies in the industrial products industry. This high adoption rate in the finance
industry is consistent with the common view that the finance industry, given its tight
regulatory environment and a relatively more stable ERM practice compared to other
industries (Liebenberg & Hoyt, 2003; Beasley et al., 2005a; Pagach & Warr, 2007; Wan
Daud, 2011; Wan Daud et al., 2011). On the same basis, the lack of ERM guidance and
regulations could well explain the reason for the remaining companies which has yet to
implement ERM. Unlike in developed countries where ERM is more mature based on
the development and evolution of the standards and frameworks governing ERM, local
guidances for ERM is still lacking. Bursa Malaysia’s move to introduce risk
management in its 2013 guideline is already a huge step despite taking too long to react.
Needless to say, despite ‘borrowing’ parts of ERM 2004 framework in its blueprint, the
Bursa Malaysia guideline is not too open to encourage companies to implement ERM
specifically rather refer to risk management in its broader perspective.

218
6.2.2.2 Research Objective 2
RO2: To Evaluate the Level of Perceived ERM Effectiveness in Managing Risks.
The total scores for the perceived effectiveness of ERM are also analysed by
identifying the scores for low-, medium- and high-perceived effectiveness based on
three broad levels of effectiveness namely poor (≤ 33.3), sufficient (33.4 - 66.6) and
excellent (≥66.7). The descriptive analysis of these scores on Table 5.4 (on page 148)
showed that 34.0% of the respondents perceived its ERM effectiveness in managing
risks as sufficient followed by 33.3% who believe that the level ERM effectiveness in
their organisations is excellent. According to the COSO (2004) framework, an excellent
ERM addresses the upside opportunity associated with any events and mitigates the
downside of the negative outcomes which comes with it. The remaining 32.6%
considered that ERM in the workplace is poor in terms of its ability to manage risks
faced by the organisation.
6.2.2.3 Research Objective 3
RO3: To investigate whether there is any direct relationship between the
organisational factors namely the organisational culture, structure and enterprise
systems and actors namely, tone from the top, strategic role of ERM Champion
and employee involvement and perceived ERM effectiveness in managing risks.
Eight hypotheses were tested under RO1, namely H1, H2, H3, H4, H5, H6, H7
and H8. H1, H3 and H4 propose a positive relationship between the organisational
factors consisting of culture, structure and enteprise syatems and perceived ERM
effectiveness. On the other hand, H6, H7 and H8 predict a positive influence of the
organisational actors namely tone from the top, strategic role of ERM Champion and

219
employee involvement on perceived ERM effectiveness in managing risks. H2 and H5
hypothesise the association between culture and tone form the top and between
enterprise systems and tone from the top, respectively.
Based on the empirical results, the main contingent variable for predicting
perceived ERM effectiveness is tone from the top, which explained 58.4% of the
variances in the dependent variable, followed by enterprise systems and organisational
culture, with each contributing 14.8% and 14.7%.
While the above findings are consistent with the generally accepted views, the
empirical evidence did not indicate any significant relationship between the remainder
of the contingent factors in the research model and perceived effectiveness. These
variables are organisational structure, strategic role of ERM Champion and employee
involvement.
Specifically, H1 predicts a positive relationship between organisational culture
and perceived ERM effectiveness in managing risks. Consistent with the findings from
the only study which investigates the influence of culture on ERM implementation by
Kimbrough and Componation (2009), the current study found empirical support for the
hypothesis (β = 0.147, p<0.05). The findings support the general notions that cultural
barriers are the most critical challenges in ERM implementation (Muralidhar, 2010;
Altuntas et al., 2011).
H2 proposes that culture has a positive influence on the tone from the top.
Empirical evidence in this study showed a significant positive relationship between
culture and tone from the top (β = 0.289, p<0.01). These findings provide support for
existing literature regarding the role of culture to motivate desire in employees (in this
case, to motivate support from the top) to eventually embrace and become engaged in
the changes (A. Hartmann, 2006). This is also consistent with the general understanding

220
on the role of organisational culture in defining the values and shaping the behaviour of
the members of the organisation (Cooke & Lafferty, 1989; Cameron & Quinn, 1999)
including the top management team.
In H3, a positive relationship between mechanistic structure and perceived ERM
effectiveness is proposed. Despite the study by Arnold et al. (2011), which found a
strong link between the effectiveness of ERM processes and organisational structure,
namely its strategic flexibility which implied organisational reactiveness to new
regulatory mandates, the empirical evidence in the current study suggested otherwise.
The possible explanation behind such contradiction is threefold. First of all,
contingency theory suggests that the design of the organisational structure is contingent
upon the demands of the external environment namely market, technology etc
(Lawrence & Lorsch, 1969). Additionally the extent of influence of these demands is
found to be greater in high-performing as compared to low-performing firms (Reimann,
1974). Greater independence and freedom which is akin to organic organisation seem to
be the themes enjoyed by high-performing firms which has higher likelihood to
implement ERM (Gordon et al., 2009; Pagach & Warr, 2010; Gates et al., 2012; Lin et
al., 2012; Nickmanesh et al., 2013). On the other hand, our hypothesis predicts a
positive association between mechanistic organisations and the integrated measures to
managing risks (C. L. Lee & Yang, 2011). Such a paradoxical combination between the
likelihood of high-performing firms to implement ERM and between mechanistic
organisations and ERM may be the possible reasons for the lack of association.
Secondly, recent literature suggests that modern orgnisations are much more
dynamic and adaptive – they can take the form of mechanistic or organistic structure
depending on the situation. According to this new school of thought, successful firms
are ambidextrous, aligned and efficient, meeting business demands while being

221
receptive and adaptive to changes in the environment (Duncan, 1976; Gibson &
Birkinshaw, 2004). Based on these scholars, to be ambidextrous, organisations have to
reconcile the internal tensions and conflicting demands in their task environments
instead of trading it off in the earlier studies. Duncan (1976) put forward an idea of
dual-structure for businesses to fit into the dynamic business environments, whereby
implementation of administrative innovations such as activity-based-costing works well
in mechanistic organisations, while technical innovations work well in organistic
organisation (Gosselin, 1997). Drawing from these findings from Gosselin (1997) and
the dual-structure view by Duncan (1976), inferences are made that in the beginning
stage of ERM implementation, being akin to administrative innovation, the organisation
will takes the form of mechanistic structure. As ERM implementation in the
organisation eventually matures, the set-up will adapt to the organic-type structure to
facilitate the innovative ideas from the team. Based on these premises, the differing
state of ERM maturity of the respondents and hence the type of structure which can
influence ERM effectiveness, could possibly be the justifications for the non-association
between organisational structure and perceived ERM effectiveness as suggested by the
current empirical evidence.
Thirdly, the insignificant relationship could also be due to the lack of clear
distinction as to whether ERM is a top-down vs an emergent programme. The level and
maturity of ERM implementation in the companies under study varied from being in its
first year or in the midst of implementation, to greater than five years or being
embedded in its processes. Therefore, it could well be top down emergent change in the
beginning and became an innovation as it matures.
H4 hypothesises that enterprise systems and perceived effectiveness of ERM in
managing risk are positively related. The general expectation of enterprise systems
being a critical driver for an effective ERM is substantiated by the results of the current

222
study. The positive association is evidenced between a highly integrated system and the
perceived effectiveness of ERM in managing risks (β = 0.148, p<0.01). The current
finding is consistent with the study on the effectiveness of risk management guideline
issued for the local authorities in the UK. The UK study reveals that due to the large
amount of data involved, use of a computer-based system would be ideal (Crawford &
Stein, 2004). Similarly, Levine (2004) asserts that from an implementation perspective,
the information needs of ERM necessitate the availability of IT systems that provide a
true, unified picture of risk across the organisation.
H5 proposes a positive relationship between enterprise systems and tone from the
top. Analysis of data conducted from the online survey supports the hypothesis (β =
0.356, p<0.01). The results indicate that an integrated systems supports flow of
information, in particular in respect of the relevant initiative, to the management team
and will in turn kindle the support towards that particular initiative. This information
can be with regard to the progress or success of the initiative or any other information
that may trigger supports towards such an initiative.
Positive influence of tone from the top on perceived ERM effectiveness in
managing risks is predicted in H6. The results from the current quantitative analysis (β
= 0.584, p<0.01) are consistent with the findings of Kaplan and Mikes (2012) and Lam
(2000). Such findings suggest that the project team should get support and buy-in from
the management prior to ERM implementation. Top management that sets the right tone
with regard to ERM will ensure the effectiveness of ERM in managing risks.
In H7, the positive association between the strategic role of ERM Champion and
perceived ERM effectiveness is proposed. The findings from the current study are
somewhat contrary to the views that strong influence of autonomy associated with risk
management function especially in time of crisis (Kaplan & Mikes, 2012) is indeed

223
crucial and that the role of ERM Champion is moving away from a risk controller to a
strategic business advisor (Mikes, 2008). The findings are also inconsistent with that of
Wan Daud et al. (2010) who found a positive relationship between quality of CRO and
level of ERM adoption.
Such findings raised an intriguing concern on the status and position of ERM
Champion in the organisational hierarchy, particularly in developing markets. The
insignificant association may suggest one of the following. Firstly, it could be that
unlike the strategic recognition received by its counterparts in developed countries such
as the US, UK and Canada, the role of ERM Champion and/or CRO in this region is
still perceived as a risk controller and not as a strategic business partner. Secondly, it
could also indicate the absence of a full-time ERM Champion within the organisation.
Based on the descriptive statistics in Table 5.4 (on page 148) that 69.2% of the
champions are other than the CROs, implying that they are playing a dual role in the
organisation hence suggesting possible lack of priorities placed on ERM initiatives.
Such a dual role played may also have led them to “go native”, becoming deal makers
rather than deal questioners (Kaplan & Mikes, 2012). The same could also imply that
the image of the ERM Champions with regard to ERM is overshadowed by their so-
called primary role within the organisation as the CEO or the CFO.
To further understand such non-association, in-depth semi-structured interviews
were conducted with the aim of investigating the influence of the strategic role of
ERM champion on perceived ERM effectiveness in managing risks - RO3
(qualitative). The interview findings of sixteen interview participants from six
organisations indicate that, where the CRO is tasked to be the ERM Champion, often he
or she is not part of the management team. Although the function reports directly to the
audit committee or the head of governance, their responsibility is confined to risk-
related matters. In these instances, their personnel grade is not senior enough to give

224
them the authority they require to carry out their function more effectively. Not only
that, the limited access to the management team deprive them of the strategic decisions
and directions of the company which then restricts their ability to advise the
management team accordingly in the risks that may exist in the strategic ventures of the
company. Moreover, the quality and competency of the ERM champion is also being
questioned as they do not possess the calibre and the required skills and expertise in
regards to ERM. Not to mention the limited exposure as perceived by the interviewees
especially from abroad. Out of the six ERM Champions interviewed, only two have an
international stint in their credentials.
The above observational findings signify the absence of a high-level structural
position (French et al., 1959) and the restricted access to high-level information
(Bacharach & Lawler, 1980) – both of which indicate lack of principal sources of
power. According to Conger and Kanungo (1988), theory of power suggests that
organisational actors who lack power are less likely to generate the desired outcomes as
the impact of their efforts is being thwarted by those with more power. This could well
be the reasons why there is no significant evidence to support the association between
the strategic role of ERM Champion and the effectiveness of ERM in managing risks.
Another objective of collecting qualitative data in this study is to understand the
rationale behind the lack of relationship between employee involvement and perceived
ERM effectiveness as hypothesised in H8. Specifically, RO4 (qualitative) is aimed to
investigate the influence of employee involvement on perceived ERM effectiveness
in managing risks - RO4 (qualitative). Here, the interview findings suggest that the
general practice of the respondent organisations is to appoint a risk coordinator, the
scope and the motivations behind the risk coordinators varies from coordinating for the
sake of compliance to one who is so committed and dedicated towards implementing
ERM. The lack of motivation on the part of the risk coordinators and ultimately the

225
employees can be due to the failure of empowering in its enabling sense. Employee
participation is suggested to be one of the strategies in the empowerment process
(Conger & Kanungo, 1988) to motivate employees to generate the desire to accomplish
task objectives. However, if such strategy, which is in this case employee involvement
in ERM activities, fails to generate that persisting behaviour to attain the objectives of
managing risks, it could well be at the expense of ERM effectiveness.
Another possible explanation is the complexity of the business which poses
challenges to implement an effective ERM. To support this, the interview findings from
two participating organisations, each with a contrasting combinations of high employee
involvement but somewhat low in ERM effectiveness (Venus Berhad) and the other
with low employee involvement but high ERM effectiveness (Pluto Berhad) were
compared. Our investigations revealed that the diversified, highly complex and large
size of Venus Berhad in itself was a challenge to putting in place an effective ERM no
matter how high was the level of employee involvement. On the other hand, Pluto
Berhad with a matured and stable market demonstrated a highly effective ERM despite
the low employee involvement.
6.2.2.4 Research Objective 4
RO4: To examine whether tone from the top mediates the relationship between
culture and perceived ERM effectiveness and between enterprise systems and the
perceived ERM effectiveness in managing risks.
Findings from the current study show significant direct relationship between the
organisational culture and the perceived effectiveness of ERM (H1) and between
enterprise systems and perceived ERM effectiveness (H4). For RO4, two hypotheses
predicting the mediating role of tone from the top on the proven direct association are

226
tested. Accordingly, H9 hypothesises the mediating role of tone from the top in the
relationship between culture and perceived ERM effectiveness. H10, examines the
mediating role of tone from the top in the relationship between enterprise systems and
the perceived effectiveness of ERM in managing risks.
Attempts were made by Huigang et al. (2007) to explain how top management
mediates the impact of external institutional pressures on the degree of usage of
enterprise resource planning (ERP) systems. The study highlights the important role of
top management in mediating the effect of institutional pressures on IT assimilation.
According to the study, tone or support from the top can be in the form of its own
involvement or in the form of allocating the organisational resources. L. Barton (2001)
suggests that the top management need to identify, anticipate and eventually manage the
crisis, risks or uncertainties – even to prepare formal standing procedures as a guideline
to the rest of the organisation. Support from the management is attested from the
allocation of resources on the recruitment of a dedicated role and unit to drive ERM,
training and education as well as the facilitation of a conducive environment (Lucas,
1981) for ERM to be effective.
Specifically, the current study proposed that support from the top will facilitate
the establishment of the right culture. This in turn generates the right element and
degree of bureaucratic, innovative and supportive measures towards the successful and
effective ERM in managing risks. Similarly, support from the top is anticipated to be
reflected in the enterprise systems implementation which ultimately generates a
favourable effect on ERM effectiveness.
Results of the tests conducted on H9 indeed show that tone from the top has a
significant mediating influence between culture and ERM effectiveness (β = 0.168,
p<0.00) with 53.5% of the relationship between culture and ERM effectiveness being

227
explained by the mediator. Such size of strength in the mediating influence is said to be
partial mediation (Hair et al., 2013).
H10 predicts the mediating role of tone from the top in the relationship between
enterprise systems and ERM effectiveness in managing risks. The empirical findings
confirmed that tone from the top indeed has a significant mediating influence on the
variables concerned (r = 0.208, p<0.00) (Hair et al., 2013) with 58.5% strength as
measured by the Variance Accounted For (VAF). In this case, the mediating influence is
said to be partial. Partial mediation implies that there is not only a significant
relationship between the mediator and the dependent variable, but also some direct
relationship between the independent and dependent variable.
6.2.2.5 Research Objective 5
RO5: To examine whether CRO presence and a separate ERM unit moderates the
relationship between the organisational factors and actors and the perceived ERM
effectiveness in managing risks.
RO5 attempts to investigate the moderating role of CRO presence (H11) and a
separate ERM unit (H12) in the relationship between the variables.
While previous studies indicate that the presence of CRO and the establishment of
a separate ERM unit is positively associated with the level of ERM adoption,
researchers have yet to investigate the moderating effect of the two variables on the
relationship between the factors and perceived ERM effectiveness in managing risks.
Based on the full SmartPLS analysis, it is evident that the relationship between
tone from the top and ERM effectiveness is higher for companies with CRO (H11). This
is consistent with the implied understanding that the appointment of a CRO is one of the

228
strongest indicators of ERM employment in the organisation (Kleffner et al., 2003;
Beasley et al., 2005a; Wan Daud et al., 2010; Pagach & Warr, 2011; Yazid et al., 2011).
This is further reinforced by Kaplan and Mikes (2012) who suggested that for risk
management practices to be effective, a separate function, in this case, CRO, to handle
strategic and external risks management is necessary. The presence of a quality CRO
(Wan Daud et al., 2010) as well as a separate and dedicated ERM unit undoubtedly
facilitate to a great extent the ERM implementation and ultimately its effectiveness in
the workplace as the CRO and his or her team seek for support from among the
management and employees, to develop the ERM guidelines and processes as well as
coordinate the activities resulting therefrom. Simply put, having such a sponsor will
eventually moderate positively the relationship between the predictors and ERM
effectiveness.
However, unlike the presence of a CRO, the moderating influence of a separate
ERM unit is not evidenced in the current empirical analysis. Such lacking in the
moderating influence reflects the lack of association between a separate ERM unit on
perceived ERM effectiveness in managing risks. This missing link somewhat
contradicts Lam (2009) who argues that greater impartiality of the risk management
function is a factor for an effective ERM implementation. The rationale behind such
lack of moderating influence is twofold. First, there were already successful instances
especially in smaller organisations whereby ERM is driven by other key executives in
the organisation, more commonly by the chief executive officer (CEO), the internal
auditor (de Zwaan et al., 2011) or the chief financial officer (CFO) (Bloxham & Borge,
2006) and without a separate ERM unit. These executives undoubtedly possess the right
skills and competency to perform the role of ERM champion in a smaller set-up in
which business uncertainties and complexities are not as varied and as huge as their
bigger counterparts. Second, the lack of expertise and skills in the ERM unit in itself

229
can lead to the failure of the ERM unit to be effective in their role in driving ERM
implementation in the workplace as suggested by another Malaysian study done
recently (Yusuwan et al., 2008).
The lack of a strong moderating influence of the CRO presence and a separate
ERM unit not necessarily imply the trivial impact of both. The insights however, offer
good news to smaller companies, which may not have the resources and allocation to
hire a dedicated person and unit or due to the less complex nature of the business. To
smaller entities, it means they can still implement an effective ERM despite not having
a CRO or a separate ERM unit.
6.2.2.6 Research Objectives 1 & 2 (Qualitative)
The following Section 6.2.2.6 and Section 6.2.2.7 address the two other objectives
for the qualitative study.
RO1 (Qualitative) : To understand the general ERM practices in Malaysian public
listed companies.
During the interview, participants were also asked to describe the ERM practices
within the organisation they represented. To understand the processes better, the
researchers also performed a content analysis of the participants’ annual reports,
particularly the statement of risks and internal controls and verifed the facts with the
participants during the interview. The data collected from both approaches were then
compiled and summarised. Based on the data collected, it can be generally concluded
that while there are many common themes for ERM practices among the companies,
there are also pertinent differences subject to the specifics and the contexts of the
organisation within which it operates – see also Appendix F.

230
6.2.2.7 Research Objective 2 (Qualitative)
RO2 (Qualitative): To confirm the quantitative findings with regard to the factors
that can influence the perceived ERM effectiveness in managing risks.
All the interview participants agreed on the need for organisations to implement
ERM in order to manage risks more effectively as compared to the traditional approach.
Except for structure, generally, they concurred on the model proposing the positive
relationship between the organisational factors (which consists of culture and enterprise
systems) and the perceived ERM effectiveness as well as the relationship between the
internal human agencies (which consists of tone from the top, strategic role of ERM
Champion and employee involvement) and the perceived ERM effectiveness.
On the whole, the interview participants were generally in agreement with the
strong influence of tone from the top, culture and enterprise systems on the ERM
effectiveness in managing risks; they were equally intrigued by the findings that the
other variables, namely the strategic role of ERM Champion, employee involvement,
CRO presence and the establishment of a separate ERM unit do not have a significant
association in the relationships.
6.3 Implications of Study
6.3.1 Knowledge Implications
Like any other, the main implication of this study is the addition to the body of
knowledge. Investigation into ERM effectiveness research based on our analysis has
been scant. In addition, none of the existing ERM effectiveness studies actually
examined the influence of both the organisational factors and actors on ERM
effectiveness. Largely, the technical aspects of ERM adoption and implementation
dominate the current state of knowledge in ERM. To recap, the more common research

231
themes are namely the financial characteristics of firms which adopted ERM (e.g.
Pagach & Warr, 2011; Lin et al., 2012), the determinants for adoption (e.g. Beasley et
al., 2005a; Paape & Speklé, 2012), the ERM impact on firm’s value and performance
(e.g. Gordon et al., 2009; Gates et al., 2012) and the support of senior management such
as the Chief Risk Officer (CRO) (e.g. Beasley et al., 2007; Mikes, 2008), Board of
Directors (BOD) (e.g. Wan Daud et al., 2011; Yazid et al., 2011) and internal audit (e.g.
I. Fraser & Henry, 2007; de Zwaan et al., 2011) and the implementation of ERM in
organisation (e.g. Arena et al., 2010; Tekathen & Dechow, 2013). Without belittling the
contribution of these studies, which offer important insights into the factors and extent
of ERM adoption and its value proposition, they do not necessarily imply that ERM is
effective in managing risks. Neither have they investigated the factors that drive ERM
effectiveness in managing risks.
The second implication is in the application of multiple theories in its attempts to
develop a comprehensive model that investigates both the organisational and human
settings to provide explanations with regard to the effectiveness of ERM in managing
risks. Such a blend of the two themes is also the highlight of this study because to the
best of the researchers’ knowledge, none of the literature thus far has this area covered
and investigated. In light of the dual nature of the variables namely the elements of the
organisational settings as well as the organisational actors, this study is premised upon
contingency theory, together with the theories of power and empowerment. In other
words, the current study submits that the effectiveness of ERM in managing risks is
contingent upon the presence of the contingent factors comprising both the
organisational settings and the power and empowerment of the organisational actors.
The fundamentals of contingency theory suggest that the choice of an appropriate
(or fit) and effective systems is contingent upon the circumstances surrounding a
specific organisation (Otley, 1999) and using the same logic, the effectiveness of ERM

232
akin to any managament system will also depend on the context of the organisation in
which it operates. The theory is further reinforced by the COSO (2004) framework
which suggests that two organisations should not have similar ERM specifics and may
vary in accordance with the organisational contexts.
Additionally, theories of power and empowerment are also deployed in this study
to explain the conduct and influence of the organisational actors namely top
management, ERM champion as well as employees in regards to ERM effectiveness.
Theory of power in the current study suggests that the absence of high-level structural
position (French et al., 1959) and the restricted access to high level information
(Bacharach & Lawler, 1980) may lead to lack of power on the part of the ERM
champion and hence explain the generating of desired and undesired outcomes (of ERM
effectiveness and ineffectiveness). This is consistent with findings that the impact of
their efforts of those with less power can easily be thwarted by those with more power
(Conger & Kanungo, 1988). Similarly, the lack of empowerment in its enabling sense
explains the lack of motivation among the employees to generate the desire to
accomplish task objectives (McClelland, 1975; Yukl, 1989; Ugboro & Obeng, 2000) of
producing an effective ERM in managing risks.
The third implication is reflected in the multiple method approach. As discussed
in the preceeding chapter, prior studies in ERM are predominanatly quantitative in
nature. To refresh, based on our analysis of 62 empirical studies published between
2003 and 2014, the majority or 74% of ERM empirical studies are quantitative using
survey (34%), secondary data (39%) and experiment (1%). The remaining are made up
of qualitative (16%) and mixed methods (10%). Qualitative studies in the analysis
consist of case studies (13%) and interviews (3%) – see Figure 2.4 (page 48).
The current study, however, employs a multiple method approach in different

233
phases of the study to identify the ERM adopters and to collect data that is distinct from
other ERM studies. Specifically, this study employs a three-step approach of content
analysis followed by an online survey questionnaire and finally the case study approach.
To the best of the researcher’s knowledge, this is the first research on ERM
effectiveness that uses such a multiple approach.
The few ERM studies which actually looked at ERM effectiveness deploy their
own set of instruments to measure ERM effectiveness which applicability is limited to a
certain extent (see Appendix C). None used ISO 31000 as the guiding framework to
operationalise ERM effectiveness. The instruments used in the current study seek to
address some if not all of the limitations imposed by each of the intruments used in
existing ERM studies. Additionally, the ISO 31000 11 principles for ERM effectiveness
are used to operationalise ERM effectiveness.
Furthermore, in terms of data analysis approach, thus far, none of the ERM
research has used the Partial Least Square (PLS) regression technique. Bearing this in
mind, PLS‑SEM is deemed appropriate for the current study on the basis that it is a
“regression-based” approach that minimises the residual variances of the endogenous
constructs. According to Hair et al. (2011), conceptually and practically, PLS‑SEM is
similar to using multiple regression analysis which is the most common method to
analyse the cause-effect relationship in a contingent-based studies.
As opposed to covariance-based SEM (CB-SEM), SmartPLS 3.0 is a causal
modelling approach aimed at maximising the explained variance of the dependent latent
constructs. CB‑SEM’s objective is to reproduce the theoretical covariance matrix,
without focusing on explained variance. The rule of thumb says that if the research
objective is theory testing and confirmation, then the appropriate method is CB‑SEM.
In contrast, if the research objective is prediction and theory development, then the

234
appropriate method is PLS‑SEM (Hair et al., 2011) and hence justifies the choice of
using SmartPLS as the tool to analyse data in this study.
6.3.2 Practical and Policy Implications
Given the benefits of ERM, the findings of this study are set to offer insights into
what makes a conducive environment towards an effective and successful ERM in
managing risks. In the Malaysian perspective, the current study seeks to shed some light
onto the level of ERM adoption among Malaysian companies as disclosed in the
financial statement. The empirical evidence is also hoped to change the motivation for
ERM implementation from compliance or a “tick-in-a-box’ exercise to a business sense
exercise. Other organisations can learn and hopefully emulate the experiences of
companies that have successfully implemented enterprise risk management in the
workplace.
The findings from this study on the significant influence of the top management
on culture and ERM effectiveness alongside report that lack of management support
topped the list of the challenges in ERM implementation in Malaysia (Yusuwan et al.,
2008) tell us that management support should be gained if they want to implement
ERM. The critical role of top management in shaping the organisational culture which
in turn define the employees’ attitude towards ERM implementation as proven in this
study makes it a good case for top management to take a more proactive role in ERM
implementation. Concerted efforts by senior management team to instil the required risk
culture and risk mindset among the employees can certainly orchestrate a more
appropriate setting for ERM to be effective. From the macro perspective, the findings of
this study serve to motivate businesses to implement ERM to manage risks and
uncertainties effectively. By having an effective ERM, eventually business losses are

235
minimised and failures prevented. In the long run, the economy will prosper and the
standard of living will improve.
From the regulatory standpoints, the statistics on the level of ERM adoption and
maturity should trigger the relevant authorities and agencies to come up with a quick
win as well as long-term resolution to further improve the adoption rate. The impact of
the Bursa Malaysia 2013 Guideline on adoption rate is evidenced in the increase of
ERM disclosure as compared to before the Guideline is in place (Togok, Isa, &
Zainuddin, 2016). This is consistent with prior studies which suggest that without strong
enforcement by regulators, companies might not have implemented ERM or at least, not
in such a speedy manner (Acharyya & Johnson, 2006). The regulatory influence is
further reflected in the practice of the finance industry which is known for its stringent
regulations, tight regulatory environment and a relatively more stable ERM practice as
compared to other industries (Liebenberg & Hoyt, 2003; Beasley et al., 2005a; Pagach
& Warr, 2007; Wan Daud, 2011; Wan Daud et al., 2011).
The current findings could provide the foundation for an ERM framework
applicable to this part of the world i.e the Asean Economic Community (AEC). The
relevant authorities from the member countries in collaboration with the local risk
professional association should review the existing ERM frameworks such as COSO
(2004) framework and ISO 31000 for its applicability and if necessary localise it to
meet the AEC needs (Mikes, 2009; Arena et al., 2010; Mikes, 2011; Tekathen &
Dechow, 2013). By doing so, companies, especially smaller ones who cannot afford
dedicated risk personnel will be more guided in the details of ERM implementation.
The findings on the variables which have the most influence should offer further
bases for the formulation of policies and initiatives to encourage effective ERM
implementation. An ERM awareness drive targeting specifically the top management

236
can be launched by the relevant agencies to create awareness and ultimately get their
buy-in to set the right tone in regards to ERM.
6.4 Limitations of Study
Survey data for this research are obtained from multiple sources, namely the
groups of chief risk officers, chief internal auditors and chief financial officers, which
may have different views of the level of ERM effectiveness in their organisations.
While it is intended to have a multiple perspective to minimise the impact of such bias
the small data size could aggravate the influence on the variances especially in a
developing country such as Malaysia, where ERM is considered as a fairly new concept
and where compliance attitude is not as high as in the developed markets.
Another limitation is found in the varying level of ERM implementation. The
level of ERM implementation of the 144 respondents used to test the hypotheses ranged
from less that one year to over five years of implementation. This gives rise to diverse
evaluation in terms of the effectiveness of ERM in managing risks. Understandably,
organisations which are more matured in ERM may perceive its ERM to be highly
effective as compared to those who are new to ERM. One of the ways to address this
issue would be to get the feedback from the perspective of one group of respondents
only, for example, the chief risks officers, chief internal auditor or the chief financial
officer, provided that, of course, the population is big enough for data analysis.
The current study is also limited in terms of time setting. Firstly, the study
measured all research variables at a single point in time, which limits the analysis on a
cause-effect relationship (Douglas, 1976). Secondly, the use of summated responses to
questionnaire items that appear on the same instrument can never be free completely
from any form of bias, in particular in the form of (i) common method bias (ii) non-

237
response bias, and many more.
Though care was taken to pre-test the questionnaire and validate these data
extensively through psychometric analyses, which has not indicated any violations of
scale reliability and validity, the inherent limitation of the survey method can never be
completely ignored. For example, like any survey instruments, the choice of
measurement is critical to ensure that the correct data is collected. An inappropriate
conceptualisation of the variables particularly structure, strategic role of ERM champion
and employee involvement may have led to inaccurate findings to a certain extent. This
is also acknowledged as a limitation on this study.
6.5 Suggestions for Future Research
Following the compelling evidence provided in the current study that top
management support promotes an effective ERM, it would be useful to investigate the
antecedents which can motivate top management support. The main findings of the
current study clearly indicate that a better understanding of the factors that influence top
management support is urgently needed. Specifically, further investigation into the
theories of power and empowerment is believed to offer huge insight in the
identification of the factors that are likely to influence the top manager’s support, ERM
champion and employees towards an ERM implementation.
Furthermore, the research model developed for the current study, particularly the
concept of perceived ERM effectiveness in managing risks and its fit with contingent
variables, offer empirically observable indicators that could be examined in a pre and
post-implementation context. Specifically, additional insights into these indicators may
be gained by longitudinal studies based on the research model. The study described in
this dissertation was cross-sectional and examined the level of ERM adoption as well as

238
the other variables in the framework at a given point in time. A longitudinal study based
on the proposed research model may help explain how the variables changes pre and
post-ERM implementation.
Additionally, future research could explore other instruments to measure the
variables. For example, future studies on culture could consider using other instruments
to measure the variable. Other than Wallach (1983), three more recent approaches to
operationalise culture: (a) Organizational Culture Profile (O'Reilly et al., 1991) (b)
Organizational Culture Inventory (Cooke & Lafferty, 1989) and (c) Competing Values
Framework (Quinn & Spreitzer, 1991; Cameron & Quinn, 1999). The use of observable
indicators vis-a-vis the self-assessment method may also reduce the subjective element
in the assessment of effectiveness. This set of indices can consist of indicators such as
company failures, C-suite rotation, early board member departures as well as bad news
announcements.
6.6 Conclusions
The current study offers insight into the level of ERM adoption in Malaysia and
the perceived ERM effectiveness in managing risks among the companies that adopt
ERM. The conceptual framework is developed for the current study that seeks to
investigate the organisational factors that can influence ERM effectiveness in managing
risks. In this study, the interaction between the organisational settings and the internal
human elements were investigated. The mediating influence of the tone from the top
and the moderating influence of CRO presence and a separate ERM unit were also
examined.
The findings of the survey illustrates the top-down nature of ERM and how well it
trickles down the organisational hierarchy given the right settings consisting of risk-

239
minded culture and good enterprise system. . From a broader perspective, putting ERM
in place only sets the beginning of the journey. This research demonstrates how
optimising the benefits of ERM require an appropriate setting of risk culture and
systems to nurture its processes to success. More importantly, this settings is not given
but deliberately and carefully seeded and sowed in the organisation. Shifting the
orientation of the risks culture and mindsets is strategic and transformational and takes
years of efforts in engaging the organisation across functions and from top to bottom.
This study has contributed useful results for both professionals and researchers in
the area of ERM. ERM experts and policymakers will find the level of ERM adoption
and the perceived level of ERM effectiveness in managing risks useful in various
respects. Policy makers can further improve the level of adoption by regulating the
conduct of ERM and by incentivising the adopters and penalising the non-adopters.
Experts may find the need to review the principles for ERM effectiveness in managing
risks. Additionally, senior management can benefit from the study knowing that their
support is positively associated with the perceived ERM effectiveness in managing
risks.
The empirical evidence from the quantitative analysis shows that tone from the
top is the main driver for ERM effectiveness in managing risks, followed by enterprise
systems and organisational culture. While literature shows that the quality of the CRO is
the driver for ERM adoption, the strategic role of ERM champion as evidenced in this
study is not necessarily the driver for ERM effectiveness in managing risks. Similarly,
the findings show lack of association between employee involvement and ERM
effectiveness. Further examination using a qualitative approach suggests that each
organisational case is unique and has other factors which influence the results greatly.

240
REFERENCES
Aabo, T., Fraser, J., & Simkins, B. J. (2005). The rise and evolution of the chief risk
officer: enterprise risk management at Hydro One. Journal of Applied Corporate
Finance, 17(3), 5-5.
Aaron, A. (2001). Traditional, interpretive, and reception based content analyses:
improving the ability of content analysis to address issues of pragmatic and
theoretical concern. Social Indicators Research, 54(2), 139-172.
Acharyya, M., & Johnson, J. (2006). Investigating the development of enterprise risk
management in the insurance industry: an empirical study of four major European
insurers. The Geneva Papers on Risk and Insurance, Special Issue July, 55-80.
Aebi, V., Sabato, G., & Schmid, M. (2012). Risk management, corporate governance,
and bank performance in the financial crisis. Journal of Banking & Finance, 36(12),
3213-3226.
Aiello, J. R., & Kolb, K. J. (1995). Electronic performance monitoring and social
context: impact on productivity and stress. Journal of Applied Psychology, 80(3),
339.
Alder, G. S. (2001). Employee reactions to electronic performance monitoring: A
consequence of organisational culture. The Journal of High Technology Management
Research, 12(2), 323-342.
Altuntas, M., Berry-stölzle, T. R., & Hoyt, R. E. (2011). Implementation of enterprise
risk management : evidence from the German property-liability insurance industry.
Geneva Papers on Risk & Insurance, 36(3), 414-439.
Ambrose, M. L., & Alder, G. S. (2000). Designing, implementing, and utilizing
computerised performance monitoring: Enhancing organizational justice. Research in
personnel and human resources management, 18, 187-220.
Anthony, R. N. (1965). Planning and Control Systems: A Framework for Analysis.
Boston MA: Harvard University Press.
Aranya, N. (1990). Budget instrumentality, participation and organizational
effectiveness. Journal of Management Accounting Research, 2, 67.
Arena, M., Arnaboldi, M., & Azzone, G. (2010). The organizational dynamics of
enterprise risk management. Accounting, Organisations and Society, 35(7), 659-675.

241
Arena, M., Arnaboldi, M., & Azzone, G. (2011). Is enterprise risk management real ?
Journal of Risk Research, 14(7), 779-797.
Arena, M., & Azzone, G. (2009). Identifying organisational drivers of internal audit
effectiveness. International Journal of Auditing, 13(1), 43-60.
Arnold, V., Benford, T., Canada, J., Kuhn Jr., J. R., & Sutton, S. G. (2007). The
unintended consequences of Sarbanes-Oxley on technology innovation and supply
chain integration. Journal of Emerging Technologies in Accounting, 4(1), 103-121.
Arnold, V., Benford, T., Canada, J., & Sutton, S. G. (2011). The role of strategic
enterprise risk management and organisational flexibility in easing new regulatory
compliance. International Journal of Accounting Information Systems, 12(3), 171-
188.
Arnold, V., Hampton, C., & Sutton, S. G. (2012). Enterprise risk management as a
strategic governance mechanism in B2B-enabled transnational supply chains.
Journal of Information Systems, 26(1), 51-76.
AS/NZS 4360. (1995). AS/NZS 4360 Risk Management Standard,. Retrieved
http://infostore.saiglobal.com/store/details.aspx?ProductID=381545b (accessed on
May 4, 2015)
Babbie, E. (2015). The practice of social research (12 ed.). Wadsworth: Cengage
Learning.
Bacharach, S. B., & Lawler, E. J. (1980). Power and politics in organizations: Jossey-
Bass San Francisco.
Banham, R. (1999). Kit and Caboodle: Understanding the skepticism about enterprise
risk management. CFO Magazine, 63.
Banham, R. (2004). Enterprising views of risk management. Journal Of Accountancy,
197(6), 65-71.
Barlow, D. (1993). The evolution of risk management. Risk Management, 40, 38-38.
Barney, J. B. (1986). Organisational culture: can it be a source of sustained competitive
advantage? Academy of Management Review, 11(3), 656-665.
Baron, R. M., & Kenny, D. A. (1986). The moderator-mediator variable distinction in

242
social psychological research: conceptual, strategic, and statistical considerations.
Journal of Personality and Social Psychology, 51(6), 1173-1182.
Barton, L. (2001). Crisis in organizations II. Cincinnati. OH: South-Western College
Publishing.
Barton, T. L., Shenkir, W. G., & Walker, P. L. (2002). Making enterprise risk
management pay off: How leading companies implement risk management. Upper
Saddle River: Financial Times / Prentice Hall PTR.
Baruch, Y., & Holtom, B. C. (2008). Survey response rate levels and trends in
organisational research. Human Relations, 61(8), 1139-1160.
Baxter, R., Bedard, J. C., Hoitash, R., & Yezegel, A. (2013). Enterprise risk
management program quality: determinants, value relevance, and the financial crisis.
Contemporary Accounting Research, 30(4), 1264-1295.
Beasley, M. S., Branson, B. C., & Hancock, B. V. (2008). Rising expectations. Journal
of Accountancy, 205(4), 44-46,48,50-51,10.
Beasley, M. S., Branson, B. C., & Hancock, B. V. (2009). ERM: opportunities for
improvement. Journal of Accountancy, 208(3), 28-32,12.
Beasley, M. S., Chen, A., Nunez, K., & Wright, L. (2006). Working hand in hand:
balanced scorecards and enterprise risk management. Strategic Finance, 87(9), 49-
55.
Beasley, M. S., Clune, R., & Hermanson, D. R. (2005a). Enterprise risk management:
An empirical analysis of factors associated with the extent of implementation.
Journal of Accounting and Public Policy, 24(6), 521-531.
Beasley, M. S., Clune, R., & Hermanson, D. R. (2005b). ERM: a status report. The
Internal Auditor, 62(1), 67-72.
Beasley, M. S., Pagach, D. P., & Warr, R. S. (2007). Information conveyed in hiring
announcements of senior executives overseeing enterprise-wide risk management
processes. SSRN Working Papers.
Beck, U. (1992). Risk society: towards a new modernity (Vol. 17). London: Sage
Bennis, W. G., & Nanus, B. (2004). Leaders. New York: Harper Business Essentials.

243
Best, P., Rikhardsson, P., & Toleman, M. (2009). Continuous fraud detection in
enterprise systems through audit trail analysis. Journal of Digital Forensics, Security
and Law, 4(1), 39-60.
Bhimani, A. (2009). Risk management, corporate governance and management
accounting: Emerging interdependencies. Management Accounting Research, 20(1),
2-5.
Bingi, P., Sharma, M. K., & Godla, J. K. (1999). Critical issues affecting an ERP
implementation. IS Management, 16(3), 7-14.
Birnberg, J. G. (2011). A proposed framework for behavioural accounting research.
Behavioural Research in Accounting, 23(1), 1-43.
Bloxham, E., & Borge, D. (2006). Risk management and the CFO : A risk or an
opportunity? Corporate Finance Review, 10(5), 21-26.
Bollen, K. A. (1998). Structural equation models. New York: John Wiley & Sons Ltd.
Boyle, J. F., & Boyle, D. M. (2013). The role of internal audit in enterprise risk
management. Internal Auditing, 28(4), 3-10.
Bromiley, P., McShane, M. K., Nair, A., & Rustambekov, E. (2015). Enterprise risk
management: review, critique, and research directions. Long Range Planning, 48(4),
265-276.
Brownell, P., & McInnes, M. (1986). Budgetary participation, motivation, and
managerial performance. Accounting Review, 61(4), 587.
Buchanan, L. (2004). Breakthrough ideas for 2004. Harvard Business Review, 2, 13-16.
Burke, W. (1986). Leadership as empowering others. In S. Srivastra (Ed.) (Ed.),
Executive power (pp. 51-77). San Francisco: Jossey-Bass
Illinois at Urbana-Champaign's Academy for Entrepreneurial Leadership Historical
Research Reference in Entrepreneurship.
Bursa Malaysia. (2013). Statement on risk management & internal control (guidelines
for directors of listed issuers). Kuala Lumpur.

244
Cameron, K. S. (1986a). Effectiveness as paradox: Consensus and conflict in
conceptions of organisational effectiveness. Management Science, 32(5), 539-553.
Cameron, K. S. (1986b). A study of organisational effectiveness and its predictors.
Management Science, 32(1), 87-112.
Cameron, K. S., & Quinn, R. E. (1999). Diagnosing and changing organisational
culture: Based on the competing values framework. Reading MA: Addison-Wesley
Publishing
Carmeli, A., & Tishler, A. (2004). Resources, capabilities, and the performance of
industrial firms: A multivariate analysis. Managerial and decision economics,
25(6‐7), 299-315.
Caruana, A., Morris, M. H., & Vella, A. J. (1998). The effect of centralization and
formalization on entrepreneurship in export firms. Journal of small business
management, 36(1), 16.
Casualty Actuary Society. (2003). Overview of enterprise risk management. retrieved
from http://www.casact.org/area/erm/overview.pdf (accessed on August 19, 2014)
Chambers, A. (1992). Effective Internal Audits: How to plan and implement. Boston,
MA: Pitman.
Chatterjee, D., Grewal, R., & Sambamurthy, V. (2002). Shaping up for e-commerce:
institutional enablers of the organisational assimilation of web technologies. MIS
Quarterly, 65-89.
Chen, S., Pan, F., & Wang, Y. (Cartographer). (2008). Participation in transfer pricing:
the role of affective and cognitive mechanisms. Retrieved from
http://ssrn.com/abstract=1216222 (accessed on Feb 2, 2014)
Chenhall, R. H. (2003). Management control systems design within its organisational
context: findings from contingency-based research and directions for the future.
Accounting, Organisations and Society, 28(2), 127-168.
Chenhall, R. H., & Morris, D. (1986). The impact of structure, environment, and
interdependence on the perceived usefulness of management accounting systems.
Accounting Review, 61(1), 16-35.

245
Chia, Y. M. (1995). Decentralization, management accounting system (MAS)
information characteristics and their interaction effects on managerial performance: a
Singapore study. Journal of Business Finance & Accounting, 22(6), 811-830.
Child, J. (1972). Organisational structure, environment and performance : the role of
strategic choice. Sociology, 6(1), 1-22.
Chin, W. W. (1998). The partial least squares approach to structural equation modeling.
Modern Methods for Business Research, 295(2), 295-336.
Chin, W. W., & Newsted, P. R. (1999). Structural equation modeling analysis with
small samples using partial least squares. In R. H. (Ed.) (Ed.), Statistical Strategies
for Small Sample Research (pp. 307-341). Thousand Oaks, CA: Sage Publications
Ciocoiu, C. N., & Dobrea, R. C. (2010). The role of standardization in improving the
effectiveness of integrated risk management. In G. Nota (Ed.), Advances in Risk
Management (pp. 1-18). doi: ISBN: 978-953-307-138-1, InTech, Available from:
http://www.intechopen.com/books/advances-in-risk-management/the-role-of-
standardization-in-improving-the-effectiveness-of-integrated-risk-management
(accessed on June 16, 2014)
Claessens, S., Djankov, S., & Lang, L. (1998). East Asian corporates: growth, financing
and risks over the last decade: World Bank Policy Research Working Paper No.
2017.
Cohen, J. (1992). A power primer. Psychological bulletin, 112(1), 155.
Cohen, J. (2013). Statistical power analysis for the behavioural sciences (Rev. ed.).
New York: Academic press.
Collier, P. M., Berry, A. J., & Burke, G. T. (2007). Risk and management accounting:
Best practice guidelines for enterprise-wide internal control procedures. Oxford:
CIMA Publishing/Elsevier.
Collquit, L. L., Hoyt, R. E., & Lee, R. B. (1999). Integrated risk management and the
role of risk manager. Risk Management and Insurance Review, 2, 43-61.
Conger, J. A., & Kanungo, R. N. (1988). The empowerment process: Integrating theory
and practice. Academy of Management Review, 13(3), 471-482.

246
Connair, S. (2013). Enterprise risk management: From silos to strategic objectives.
Armed Forces Comptroller, 58(1), 24-26.
Cooke, R. A., & Lafferty, J. C. (1989). Organizational cultural inventory (OCI).
Plymouth, MI: Human Synergistics.
Cooke, R. A., & Rousseau, D. M. (1988). Behavioural norms and expectations a
quantitative approach to the assessment of organisational culture. Group &
Organisation Studies (1986-1998), 13(3), 245.
Cornwell, T. (2001). Risk management comes into sharper focus after Sept 11 disaster.
National Mortgage News, 26(7), 16.
COSO. (2004). Enterprise risk management-integrated framework.
http://www.coso.org/documents/COSO_ERM_ExecutiveSummary.pdf (accessed on
Dec 18, 2013)
Crawford, M., & Stein, W. (2004). Risk management in UK local authorities: The
effectiveness of current guidance and practice. The International Journal of Public
Sector Management, 17(6/7), 498-512.
Creswell, J. W., & Plano Clark, V. L. (2007). Designing and conducting mixed methods
research. CA: Sage. Thousand Oaks, CA: Sage.
Cronbach, L. J. (1987). Statistical tests for moderator variables: Flaws in analyses
recently proposed. Psychological Bulletin, 102(3), 414-417.
Curkovic, S., Scannell, T., Wagner, B., & Vitek, M. (2013). Supply chain risk
management within the context of COSO’s enterprise risk management framework.
Journal of Business Administration Research, 2(1).
D’Arcy, S. P., & Brogan, J. C. (2001). Enterprise risk management. Journal of Risk
Management of Korea, 12(1), 207-228.
Dahl, R. A. (1957). The concept of power. Behavioral Science, 2(3), 201-215.
Damanpour, F. (1991). Organisational innovation: A meta-analysis of effects of
determinants and moderators. Academy of Management Journal, 34(3), 555-590.
Davenport, T. H. (1998). Putting the enterprise into the enterprise system. Harvard

247
Business Review, 76(4).
Davenport, T. H. (2000). Mission critical: Realizing the promise of enterprise systems.
Boston: Harvard Business Press.
de Zwaan, L., Stewart, J., & Subramaniam, N. (2011). Internal audit involvement in
enterprise risk management. Managerial Auditing Journal, 26(7), 586-604.
Dearden, J. (1987). Measuring profit center managers. Harvard Business Review, 65(5),
84-88.
DeLoach, J. W., & Andersen, A. (2000). Enterprise-wide risk management: strategies
for linking risk and opportunity. Financial Times Prentice Hall.
Delobbe, N., Haccoun, R. R., & Vandenberghe, C. (2002). Measuring core dimensions
of organisational culture: A review of research and development of a new instrument.
Unpublished manuscript, Universite catholique de Louvain, Belgium.
Denison, D. R. (1990). Corporate culture and organizational effectiveness. New York:
John Wiley & Sons.
Denison, D. R., & Mishra, A. K. (1995). Toward a theory of organisational culture and
effectiveness. Organisation Science, 6(2), 204-223.
Deragon, J. (2000). Old knowledge with a new name. E.Risk.com. Retrieved from
http://riskmania.com/pdsdata/Old%20Knowledge%20With%20a%20New%20Name-
erisk.pdf (accessed on August 19, 2014)
Desender, K. A. (2011). On the Determinants of Enterprise Risk Management
Implementation. Rochester. http://ssrn.com/abstract=1025982 (accessed on Nov 26,
2013)
DeTienne, K. B., & Abbott, N. (1993). Developing an employee-centered electronic
monitoring-system. Journal of Systems Management, 44(8), 12-15.
Dickinson, G. (2001). Enterprise risk management: Its origins and conceptual
foundation. Geneva Papers on Risk & Insurance, 26(3), 360-366.
Douglas, J. D. (1976). Investigative social research: Individual and team field research.

248
Thousand Oaks: Sage Beverly Hills.
Drazin, R., & Van de Ven, A. H. (1985). Alternative forms of fit in contingency theory.
Administrative Science Quarterly, 514-539.
Dreyer, S., & Ingram, D. (2008). Standard & Poor’s to apply enterprise risk analysis to
corporate ratings http://www.nyu.edu/intercep/ERM%20for%20Non-
Financial%20Companies%205.7.08.pdf (accessed on May 7, 2014)
Drori, G. S. (2006). Governed by governance: The new prism of organisational change
Globalisation and Organisation: World Society and Organisational Change, GS
Drori, JW Meyer, and H. Hwang, Editors (pp. 91-118)
Duncan, R. B. (1976). The ambidextrous organisation: Designing dual structures for
innovation. The Management of Organisation, 1, 167-188.
Enz, C. A. (1988). The role of value congruity in intraorganizational power.
Administrative Science Quarterly, 284-304.
Ernst & Young. (2011). The evolving IT risk landscape : The why and how of IT risk
management today. Paper presented at the Insight on IT risks business briefing.
Ernst & Young. (2013). Managing IT risk in a fast-changing environment, EMEIA FSO
IT risk management survey: Ernst & Young.
Ernst & Young, & Institute of Internal Auditors of Malaysia. (2011). 2011 Survey on
risk management practices in Malaysia. Kuala Lumpur.
Ernst and Young. (2008). The future of risk management and internal control. New
York: EYGM Limited.
Fahy, M., & Lynch, R. (1999). Enterprise resource planning (ERP) systems and
strategic management accounting. Paper presented at the European Accounting
Association EAA Conference, Bordeaux, France.
Falk, R. F., & Miller, N. B. (1992). A primer for soft modeling. Akron, OH, US:
University of Akron Press.

249
Fisher, J. (1998). Contingency Theory, Management Control Systems and Firm
Outcomes: Past Results and Future Directions. Behavioural Research in Accounting,
10, 47-64.
Fornell, C., & Larcker, D. F. (1981). Evaluating structural equation models with
unobservable variables and measurement error. Journal of Marketing Research, 39-
50.
Fraser, I., & Henry, W. (2007). Embedding risk management: structures and
approaches. Managerial Auditing Journal, 22(4), 392-409.
Fraser, J., Schoening-Thiessen, K., & Simkins, B. J. (2008). Who reads what most
often? A survey of enterprise risk management literature read by risk executives.
Journal of Applied Finance, 18(1), 73-91.
French, J. R., Raven, B., & Cartwright, D. (1959). The bases of social power. Classics
of Organization Theory, 311-320.
Frigo, M. L., & Anderson, R. J. (2014). Risk management framework: Adapt, don't
adopt. Strategic Finance, 96(1), 49-53.
Fry, L. W., & Slocum, J. W. (1984). Technology, structure, and workgroup
effectiveness: A test of a contingency model. Academy of Management Journal,
27(2), 221-246.
Gates, S., Nicolas, J.-L., & Walker, P. L. (2012). Enterprise risk management: a process
for enhanced management and improved performance. Management Accounting
Quarterly, 13(3), 28-38.
Gerdin, J., & Greve, J. (2004). Forms of contingency fit in management accounting
research—a critical review. Accounting, Organisations and Society, 29(3–4), 303-
326.
Gerdin, J., & Greve, J. (2008). The appropriateness of statistical methods for testing
contingency hypotheses in management accounting research. Accounting,
Organisations and Society, 33(7–8), 995-1009.
Ghazali, Z., & Abdul Manab, N. (2013). Enterprise risk management and value
creation: initial findings amongst non-financial public listed companies in Malaysian
Bourse. Asian Economic and Financial Review, 3(7), 913.
Gibson, C. B., & Birkinshaw, J. (2004). The antecedents, consequences, and mediating

250
role of organisational ambidexterity. Academy of Management Journal, 47(2), 209-
226.
Gordon, L. A., Leob, M. P., & Tseng, C.-Y. (2009). Enterprise risk management and
firm performance: A contingency perspective. Journal of Accounting and Public
Policy, 28(4), 301-327.
Gordon, L. A., & Narayanan, V. K. (1984). Management accounting systems, perceived
environmental uncertainty and organisation structure: An empirical investigation.
Accounting, Organisations and Society, 9(1), 33-47.
Gosselin, M. (1997). The effect of strategy and organisational structure on the adoption
and implementation activity-based costing. Accounting, Organisations and Society,
22(2), 105-122.
Gouldner, A. W. (1954). Patterns of industrial bureaucracy. New York: Free Press
Patterns of industrial bureaucracy.
Govindarajan, V. (1988). A contingency approach to strategy implementation at the
business-unit level: integrating administrative mechanisms with strategy. Academy of
Management Journal, 31(4), 828-853.
Govindarajan, V., & Fisher, J. (1990). Strategy, control systems, and resource sharing:
Effects on business-unit performance. Academy of Management Journal, 33(2), 259-
285.
Gramling, A. A., & Myers, P. M. (2006). Internal auditing's role in ERM. The Internal
Auditor, 63(2), 52-56,58.
Granlund, M., & Malmi, T. (2000). The liberations and limitations of ERP-systems for
management accounting. Paper presented at the 23th EAA Conference.
Greene, J. C. (2007). Mixed methods in social inquiry. San Francisco: Jossey-Bass.
Gupta, A. (2000). Enterprise resource planning: the emerging organisational value
systems. Industrial Management & Data Systems, 100(3), 114-118.
Hage, J. (1980). Theories of organisations: Form, process, and transformation. New
York: John Wiley & Sons.

251
Hage, J., & Aiken, M. (1969). Routine technology, social structure, and organisation
goals. Administrative Science Quarterly, 366-376.
Hair, J. F., Black, W. C., & Anderson, R. E. (2010). Multivariate data analysis: A
global perspective (Seventh Edition ed). New Jersey: Pearson Prentice Hall.
Hair, J. F., Hult, G. T. M., Ringle, C., & Sarstedt, M. (2013). A primer on partial least
squares structural equation modeling (PLS-SEM). Thousand Oaks: Sage
Publications.
Hair, J. F., Ringle, C., & Sarstedt, M. (2011). PLS-SEM: Indeed a silver bullet. Journal
of Marketing Theory and Practice, 19(2), 139-151.
Hambrick, D. C., & Lei, D. (1985). Toward an empirical prioritization of contingency
variables for business strategy. Academy of Management Journal, 28(4), 763.
Harrington, S., & Niehaus, G. (2003). United Grain Growers: Enterprise risk
management and weather risk. Risk Management and Insurance Review, 6(2), 193-
217.
Harrington, S., Niehaus, G., & Risko, K. J. (2002). Enterprise risk management: the
case of united grain growers. Journal of Applied Corporate Finance, 14(4), 71-81.
Hartmann, A. (2006). The context of innovation management in construction firms.
Construction Management and Economics, 24(6), 567-578.
Hartmann, F. G. H., & Moers, F. (1999). Testing contingency hypotheses in budgetary
research: An evaluation of the use of moderated regression analysis. Accounting,
Organisations and Society, 24(4), 291-315.
Heng, Y. S., Jifeng, Y., & Jared, L. (2011). Enterprise risk management in financial
crisis. IUP Journal of Risk & Insurance, 8(3), 7-21.
Henseler, J., Ringle, C. M., & Sinkovics, R. R. (2009). The use of partial least squares
path modeling in international marketing. Advances in International Marketing
(AIM), 20, 277-320.
Hickson, D. J., Hinings, C. R., Lee, C. A., Schneck, R. E., & Pennings, J. M. (1971). A
strategic contingencies' theory of intraorganizational power. Administrative Science
Quarterly, 216-229.

252
Hinings, C. R., Hickson, D. J., Pennings, J. M., & Schneck, R. E. (1974). Structural
conditions of intraorganizational power. Administrative Science Quarterly, 22-44.
Hodgkinson, R. (2001). Enterprise-wide risk management In Hunt, B. (ed.) Risk
Management Guide 2001: London: White Page.
Hofer, C. W. (1975). Toward a contingency theory of business strategy. Academy of
Management Journal, 18(4), 784.
Hofstede, G. (1980). Culture’s consequences. Beverly Hills: Ca: Sage.
Hofstede, G. (2001). The game of budget control (Vol. 6): Psychology Press.
Holland, C. P., Light, B., & Gibson, N. (1999). A critical success factors model for
enterprise resource planning implementation. Paper presented at the Proceedings of
the 7th European Conference on Information Systems.
Holsapple, C. W., & Sena, M. P. (1999). Enterprise systems for organisational decision
support: A research agenda. Paper presented at the Proceedings of AMCIS.
Holsapple, C. W., & Sena, M. P. (2003). The decision-support characteristics of ERP
systems. International Journal of Human-Computer Interaction, 16(1), 101-123.
Holton, G. A. (1996). Closed form value at risk. Contingency Analysis. retrieved from
http://www.contingencyanalysis.com/frame/framevar.htm on June 21, 2015.
Hopper, T., & Powell, A. (1985). Making sense of research into the organisational and
social aspects of management accounting: A review of its underlying assumptions.
Journal of management Studies, 22(5), 429-465.
Hopwood, A. G. (1972). An empirical study of the role of accounting data in
performance evaluation. Journal of accounting research, 156-182.
Howell, J. M., & Higgins, C. A. (1990). Champions of technological innovation.
Administrative science quarterly, 317-341.
Hoyt, R. E., & Liebenberg, A. P. (2011). The value of enterprise risk management.

253
Journal of Risk and Insurance, 78(4), 795-822.
Hu, Q., Dinev, T., Hart, P., & Cooke, D. (2012). Managing Employee Compliance with
Information Security Policies: The Critical Role of Top Management and
Organizational Culture. Decision Sciences, 43(4), 615.
Huber, C., & Scheytt, T. (2013). The dispositif of risk management: reconstructing risk
management after the financial crisis. Management Accounting Research, 24(2), 88.
Huigang, L., Saraf, N., Qing, H., & Yajiong, X. (2007). Assimilation of enterprise
systems: the effect of institutional pressures and the mediating role of top
management. MIS Quarterly, 31(1), 59-87.
Hulland, J. (1999). Use of partial least squares (PLS) in strategic management research:
A review of four recent studies. Strategic Management Journal, 20(2), 195-204.
Ibarra, H., & Andrews, S. B. (1993). Power, social influence, and sense making: Effects
of network centrality and proximity on employee perceptions. Administrative Science
Quarterly, 38(2), 277-303.
IMA – Institute of Management Accountants. (2006). Enterprise risk management:
Frameworks, elements, and integration, statements on management accounting.
Ismail, R., & Rahman, R. A. (2011). Institutional investors and board of directors'
monitoring role on risk management disclosure level in Malaysia. IUP Journal of
Corporate Governance, 10(2), 37-61.
ISO 31000:2010. (2010). Risk Management – Principles and guidelines. Geneva:
International Standards Organisations.
http://www.iso.org/iso/home/standards/iso31000.htm (accessed on August 19, 2014)
Ittner, C. D., & Larcker, D. F. (2001). Assessing empirical research in managerial
accounting: a value-based management perspective. Journal of Accounting and
Economics, 32(1), 349-410.
Jabbour, M. (2011). The impact of enterprise risk management on capital allocation in
insurance companies. http://ssrn.com/abstract=1910283 (accessed on Nov 11, 2013)
Jalal, A., AlBayati, F. S., & AlBuainain, N. R. (2011). Evaluating enterprise risk
management (ERM): Bahrain financial sectors as a case study. International
Business Research, 4(3), 83-92.

254
Jansen, J. J., Van Den Bosch, F. A., & Volberda, H. W. (2006). Exploratory innovation,
exploitative innovation, and performance: Effects of organizational antecedents and
environmental moderators. Management Science, 52(11), 1661-1674.
Jarvenpaa, S. L., & Ives, B. (1991). Executive involvement and participation in the
management of information technology. MIS Quarterly, 205-227.
Jenkins, A. M., & Ricketts, J. A. (1979). Development of an instrument to measure user
information satisfaction with management information systems. Unpublished
working paper, Indiana University, Bloomington.
Jensen, M. C., & Meckling, W. H. (1976). Theory of the firm: Managerial behaviour,
agency costs and ownership structure. Journal of Financial Economics, 3:4, 305-360.
Jermias, J., & Gani, L. (2004). Integrating business strategy, organisational
configurations and management accounting systems with business unit effectiveness:
a fitness landscape approach. Management Accounting Research, 15(2), 179-200.
Jie, L. (2012). The enterprise risk management and the risk oriented internal audit.
iBusiness, 4(3), 287-292. doi:10.4236/ib.2012.43036 (accessed on Nov 21, 2013)
Jin, F. E. (2001). Poor risk management causes ailing firms' downfall. Business Times
(Malaysia). https://www.highbeam.com/doc/1P1-44962006.html (accessed on March
3, 2015)
Jokipii, A. (2010). Determinants and consequences of internal control in firms: a
contingency theory based analysis. Journal of Management & Governance, 14(2),
115-144.
Jung, T., Scott, T., Davies, H. T., Bower, P., Whalley, D., McNally, R., & Mannion, R.
(2009). Instruments for exploring organisational culture: A review of the literature.
Public Administration Review, 69(6), 1087-1096.
Kanhai, C., Ganesh, L., & Muhwandavaka, R. (2014). An investigation of the extent of
adoption of enterprise risk management (ERM) by banks in Zimbabwe. International
Journal of Business & Commerce, 3(7).
Kanter, R. M. (1989). Power failure in management circuits. Harvard Business, 65-75.
Kanungo, S., Sadavarti, S., & Srinivas, Y. (2001). Relating IT strategy and
organisational culture: an empirical study of public sector units in India. The Journal
of Strategic Information Systems, 10(1), 29-57.

255
Kaplan, R. S., & Mikes, A. (2012). Managing risks: A new framework. Harvard
Business Review, 90(6), 48-60.
Kasim, M. A. (2011). Enterprise risk management (ERM) in Malaysian high
performance GLCs: A study of the status of implementation, the role of internal audit
and the impact on organisational performance. (PhD), Universiti Teknologi Mara.
Kasim, M. A., Abdul Aziz, A., & Kasim, I. (2011). Enterprise risk management (ERM)
in Malaysia. USA: LAP Lamber Academic Publishing GmBH & Co. KG.
Kenis, I. (1979). Effects of budgetary goal characteristics on managerial attitudes and
performance. Accounting Review, 54(4), 707.
Khazanchi, D., & Sutton, S. G. (2001). Assurance services for business-to-business
electronic commerce: a framework and implications. Journal of the Association for
Information Systems, 1(1), 11.
Kim, K. K. (1989). User satisfaction: A synthesis of three different perspectives.
Journal of Information Systems, 4(1), 1-12.
Kimbrough, R. L., & Componation, P. J. (2009). The relationship between
organisational culture and enterprise risk management. Engineering Management
Journal, 21(2), 18-26.
Kleffner, A. E., Lee, R. B., & McGannon, B. (2003). The effect of corporate
governance of the use of enterprise risk management: Evidence from Canada. Risk
Management and Insurance Review, 6(1), 53-73.
Knight, K. W. (2010). AS/NZS ISO 31000:2009 - The new standard for managing risk.
Keeping Good Companies, 62(2), 68-69.
Koberg, C. S., & Chusmir, L. H. (1987). Organisational culture relationships with
creativity and other job-related variables. Journal of Business Research, 15(5), 397-
409.
Kotter, J. P. (1995). Leading change: why transformation efforts fail. Harvard Business
Review, March-April, 50-67.
Lai, F. W. (2014). Enterprise risk management and its value creation transmission
mechanism. Recent Advances in Environmental Sciences and Financial
Development, 46.

256
Laisasikorn, K., & Rompho, N. (2014). A study of the relationship between a successful
enterprise risk management system, a performance measurement system and the
financial performance of Thai listed companies. Journal of Applied Business and
Economics, 16(2), 81.
Lajili, K., & Zéghal, D. (2005). A content analysis of risk management disclosures in
Canadian annual reports. Canadian Journal of Administrative Sciences, 22(2), 125-
142.
Lam, J. (2000). Enterprise-wide risk management and the role of the chief risk officer.
white paper, ERisk. com, March, 25.
Lam, J. (2003). Ten predictions for risk management. RMA Journal, 85(8), 84-87.
Lam, J. (2009). Key requirements for enterprise-wide risk management: Lessons
learned from the global financial crisis. The RMA Journal, 91(8), 22-26,11.
Langfield-Smith, K. (1997). Management control systems and strategy: A critical
review. Accounting, Organisations and Society, 22, 207-232.
Latour, B. (1987). Science in action. Cambridge: Harvard University Press.
Lawrence, P. R., & Lorsch, J. W. (1969). Organisation and environment: Managing
differentiation and integration (Vol. III). Homewood: Richard D. Irwin.
Lecy, J. D., Schmitz, H. P., & Swedlund, H. (2012). Non-governmental and not-for-
profit organisational effectiveness: A modern synthesis. Voluntas, 23(2), 434-457.
Lee, C. L., & Yang, H. J. (2011). Organisation structure, competition and performance
measurement systems and their joint effects on performance. Management
Accounting Research, 22(2), 84-104.
Lee, S. K. J., & Yu, K. (2004). Corporate culture and organisational performance.
Journal of Managerial Psychology, 19(4), 340-359.
Leonard-Barton, D., & Deschamps, I. (1988). Managerial influence in the
implementation of new technology. Management Science, 34(10), 1252-1265.
Levine, R. (2004). Risk management systems: understanding the need. Risk
Management, 32(2).

257
Lewis, M. (2008). Introduction. In M. Lewis (Ed.), Panic! The Story of Modern
Financial Insanity (pp. 3-13). London: Penguin
Li, Q., Wu, Y., Ojiako, U., Marshall, A., & Chipulu, M. (2014). Enterprise risk
management and firm value within China’s insurance industry. Acta Commercii
14(1), 10 pages. doi: doi:10.4102/ac.v14i1.198 (accessed on March 1, 2014)
Liebenberg, A. P., & Hoyt, R. E. (2003). The determinants of enterprise risk
management: evidence from the appointment of chief risk officers. Risk Management
& Insurance Review, 6(1), 37-52.
Lin, Y., Wen, M.-M., & Yu, J. (2012). Enterprise risk management: Strategic
antecedents, risk integration, and performance. North American Actuarial Journal,
16(1), 1-28.
Lok, P., & Crawford, J. (2004). The effect of organisational culture and leadership style
on job satisfaction and organisational commitment: A cross-national comparison.
Journal of Management Development, 23(4), 321-338.
Loonam, J., & McDonagh, J. (2005). Exploring top management support for the
introduction of enterprise information systems: a literature review. Irish Journal of
Management, 26(1), 163.
Lucas, D. (1981). Implementation: The key to successful information systems. New
York: Mc-Graw Hill.
Mahoney, M. L. (2011). An examination of the determinants of top management
support of information technology projects. (PhD PhD.), Stevens Institute of
Technology, Ann Arbor. Retrieved from
http://search.proquest.com/docview/881293382?accountid=28930 (accessed on May
28, 2015)
Makarova, V. A. (2014). The effectiveness of risk management implementation in
Russian companies. World Applied Sciences Journal, 31(5), 833-839.
Markus, M. L. (1983). Power, politics, and MIS implementation. Communications of
the ACM, 26(6), 430-444.
Markus, M. L., & Tanis, C. (2000). The enterprise systems experience–from adoption to
success. Framing the domains of IT research: Glimpsing the future through the past,
173, 207-173.

258
Martin, J. (1992). Cultures in organisations: Three perspectives. New York: Oxford
University Press.
Mastor, K. A., Jin, P., & Cooper, M. (2000). Malay culture and personality a big five
perspective. American Behavioural Scientist, 44(1), 95-111.
McClelland, D. C. (1975). Power: The inner experience. Oxford: Irvington Power.
McKenney, J. L., & McFarlan, F. W. (1982). The information archipelago-maps and
bridges. Harvard Business Review, 60(5), 109-119.
McShane, M. K., Nair, A., & Rustambekov, E. (2011). Does enterprise risk
management increase firm value? Journal of Accounting, Auditing & Finance, 26(4),
641-658.
Merchant, K. A. (1989). Rewarding results: Motivating profit center managers. Boston:
Harvard Business School Press.
Merchant, K. A., & Simons, R. (1986). Research and control in complex organizations:
an overview: Division of Research, Graduate School of Business Administration,
Harvard University.
Meulbroek, L. (2002). Integrated risk management for the firm: A senior manager's
guide. http://ssrn.com/abstract=301331 (accessed on April 16, 2014)
Mia, L. (1988). Managerial attitude, motivation and the effectiveness of budget
participation. Accounting, Organisations and Society, 13(5), 465-475.
Miccolis, J. A. (2000). Enterprise risk management in the financial services industry:
Still a long way to go. http://www.irmi.com/expert/articles/2000/miccolis08.aspx
(accessed on August 19, 2014)
Miccolis, J. A., Kevin Hively, & Merkley, B. W. (2001). Enterprise risk management:
Trends and emerging practices. Altamonte Springs: The Institute of Internal
Auditors Research Foundation.
Mikes, A. (2008). Chief risk officers at crunch time: Compliance champions or business
partners? Journal of Risk Management in Financial Institutions, 2(1), 7-25.

259
Mikes, A. (2009). Risk management and calculative cultures. Management Accounting
Research, 20(1), 18.
Mikes, A. (2011). From counting risk to making risk count: Boundary-work in risk
management. Accounting, Organisations and Society, 36(4-5), 226.
Mikes, A. (2014). The triumph of the humble chief risk officer. Harvard Business
School, Boston, MA.
Milani, K. (1975). The relationship of participation in budget-setting to industrial
supervisor performance and attitudes - A field study. The Accounting Review, 50(2),
274.
Miller, K. D. (1992). A framework for integrated risk management in international
business. Journal of International Business Studies, 311-331.
Miller, K. D., & Waller, H. G. (2003). Scenarios, real options and integrated risk
management. Long Range Planning, 36(1), 93-107.
Millo, Y., & MacKenzie, D. (2009). The usefulness of inaccurate models: towards an
understanding of the emergence of financial risk management. Accounting,
Organisations and Society, 34(5), 638-653.
Mottershead, N., & Godfrey, A. (2001). From theory to practice: Evolving Your
organisation's risk management In Hunt, B. (ed.) Risk Management Guide 2001. .
London: White Page.
Muralidhar, K. (2010). Enterprise risk management in the Middle East oil industry.
International Journal of Energy Sector Management, 4(1), 59-86.
Musig, P., & Kunsrison, R. (2012). The effect of continuous enterprise risk management
improvement on internal audit work success of the institute of higher education.
Journal of the Academy of Business & Economics, 12(5).
Mwangi, M. L. (2014). The relationship between risk management and financial
performance of the top 100 small and medium enterprises in Kenya. (Master of
Science), University of Nairobi.
Nah, F. F.-H., Lau, J. L.-S., & Kuang, J. (2001). Critical factors for successful
implementation of enterprise systems. Business process management journal, 7(3),
285-296.

260
Nahm, A. Y., Vonderembse, M. A., & Koufteros, X. A. (2003). The impact of
organisational structure on time-based manufacturing and plant performance. Journal
of Operations Management, 21(3), 281-306.
Nickmanesh, S., Zohoori, M., Musram, H. A. M., & Akbari, A. (2013). Enterprise risk
management and performance in Malaysia. Interdisciplinary Journal of
Contemporary Research In Business, 5(1), 670-707.
Nicolaou, A. I. (2000). A contingency model of perceived effectiveness in accounting
information systems: Organisational coordination and control effects. International
Journal of Accounting Information Systems, 1(2), 91-105.
Nielsen, K., & Randall, R. (2012). The importance of employee participation and
perceptions of changes in procedures in a teamworking intervention. Work & Stress,
26(2), 91-111.
Nocco, B. W., & Stulz, R. M. (2006). Enterprise risk management: Theory and practice.
Journal of Applied Corporate Finance, 18(4), 8-20.
Nunnally, J. (1978). Psychometric methods. New York: McGraw-Hill.
Nyagah, B. K. (2014). The effect of enterprise risk management on financial
performance of pension fund management firms in Kenya. University of Nairobi.
O'Leary, D. E. (2000). Enterprise resource planning systems: systems, life cycle,
electronic commerce and risk. Cambridge: Cambridge University Press.
O'Mahony, A., & Doran, J. (2008). The changing role of management accountants;
evidence from the implementation of ERP systems in large organisations.
International Journal of Business and Management, 3(8), 109-115.
O'Reilly, C. A., III, Chatman, J., & Caldwell, D. F. (1991). People and organisational
culture: A profile comparison approach to assessing person-organisation fit. Academy
of Management Journal, 34(3), 487.
O’brien, R. M. (2007). A caution regarding rules of thumb for variance inflation factors.
Quality & Quantity, 41(5), 673-690.
Obalola, M. A., Akpan, T. I., & Olufemi, A. A. (2014). The relationship between
enterprise risk management (ERM) and organisational performance: Evidence from
Nigerian insurance industry. Research Journal of Finance and Accounting, 5(14),
152-160.

261
Oh, L. B., & Teo, H. H. (2009). An empirical study of IT-enabled enterprise risk
management and organisational resilience. CONF-IRM 2009 Proceedings, Paper 9.
http://aisel.aisnet.org/confirm2009/19 (accessed on Sept 13, 2014)
Otley, D. (1978). Budget use and managerial performance. Journal of Accounting
Research, 16(1), 122-149.
Otley, D. (1980). The contingency theory of management accounting: achievement and
prognosis. Accounting, Organisations and Society, 5, 413–428.
Otley, D. (1985). Developments in management accounting research. Management
Accounting, 67(3), 37-42.
Otley, D. (1999). Performance management: a framework for management control
systems research. Management Accounting Research, 10(4), 363-382.
Ottensmeyer, E. J., & Heroux, M. A. (1991). Ethics, public policy, and managing
advanced technologies: The case of electronic surveillance. Journal of Business
Ethics, 10(7), 519-526.
Paape, L., & Speklé, R. F. (2012). The adoption and design of enterprise risk
management practices : An empirical study. European Accounting Review, 21(3),
533-564.
Pagach, D., & Warr, R. (2007). An empirical investigation of the characteristics of firms
adopting enterprise risk management. North Carolina State University working
paper. http://ssrn.com/abstract=1010200 (accessed on Nov 16, 2013)
Pagach, D., & Warr, R. (2010). The effects of enterprise risk management on firm
performance. Rochester. Retrieved from http://ssrn.com/abstract=1155218 (accessed
on Nov 21, 2013)
Pagach, D., & Warr, R. (2011). The characteristics of firms that hire chief risk officers.
Journal of Risk and Insurance, 78(1), 185-211.
Pallant, J. (2007). SPSS survival manual: A step-by-step guide to data analysis using
SPSS version 15. Nova Iorque: McGraw Hill.
Pfeffer, J. (1982). Organizations and organization theory. Massachusetts: Pitman
Podsakoff, P. M., MacKenzie, S. B., Lee, J.-Y., & Podsakoff, N. P. (2003). Common

262
method biases in behavioural research: a critical review of the literature and
recommended remedies. Journal of Applied Psychology, 88(5), 879.
Pollara, J. B. (2008). FGRC: Seize the opportunity. Strategic Finance (May), 58-59.
Poston, R., & Grabski, S. (2000). The impact of enterprise resource planning systems
on firm performance. Paper presented at the Proceedings of the twenty first
international conference on Information systems.
Power, M. (2004). The risk management of everything. The Journal of Risk Finance,
5(3), 58-65.
Power, M. (2007). Organized uncertainty: Designing a world of risk management.
Oxford: Oxford University Press.
Power, M. (2009). The risk management of nothing. Accounting, Organisations and
Society, 34, 849-855.
Probst, T. M. (2005). Countering the negative effects of job insecurity through
participative decision making: lessons from the demand-control model. Journal of
Occupational Health Psychology, 10(4), 320.
Protiviti Inc. (2006). Guide to enterprise risk management: Frequently asked questions:
Protiviti Inc.
Provan, K. G. (1980). Recognising, measuring, and interpreting the potential/enacted
power distinction in organisational research. The Academy of Management Review,
5(4), 549-559.
Pugh, D. S., Hickson, D. J., Hinings, C. R., & Turner, C. (1968). Dimensions of
organisation structure. Administrative Science Quarterly, 13(1), 65-105.
Purdy, G. (2010). ISO 31000: 2009—setting a new standard for risk management. Risk
analysis, 30(6), 881-886.
Quinn, R. E., & Spreitzer, G. M. (1991). The psychometrics of the competing values
culture instrument and an analysis of the impact of organisational culture on quality
of life: Emerald.

263
Quon, T. K., Zeghal, D., & Maingot, M. (2012). Enterprise risk management and firm
performance. Procedia - Social and Behavioural Sciences, 62(0), 263-267.
Rainer, L. (2013). Insights into the effectiveness of internal audit: A multi-method and
multi-perspective study. (PhD), Université Catholique De Louvain. Retrieved from
http://hdl.handle.net/2078.1/124464 (accessed on Feb 15, 2014)
Raisch, S., & Birkinshaw, J. (2008). Organisational ambidexterity: Antecedents,
outcomes and moderators. Journal of Management, 34(3), 375-409.
Randall, R., Nielsen, K., & Tvedt, S. D. (2009). The development of five scales to
measure employees' appraisals of organisational-level stress management
interventions. Work & Stress, 23(1), 1-23.
Rapert, M. I., & Wren, B. M. (1998). Reconsidering organizational structure: a dual
perspective of frameworks and processes. Journal of Managerial Issues, X(3), 287-
302.
Rasid, S. Z. A., Isa, C. R., & Ismail, W. K. W. (2014). Management accounting
systems, enterprise risk management and organisational performance in financial
institutions. Asian Review of Accounting, 22(2), 128 - 144.
Reimann, B. C. (1974). Dimensions of structure in effective organisations: some
empirical evidence. Academy of Management Journal, 17(4), 693-708.
RIMS. (2011). FAQ on SRM and ERM. Why strategic management? retrieved from
http://www.rims.org/resources/ERM/Documents/ (accessed on April 20, 2014)
Robert, K. S., & Anette, M. (2012). Smart companies match their approach to the nature
of the threats they face. Harvard Business Review, June.
Roberts, H. J., & Barrar, P. R. N. (1992). MRPII implementation: key factors for
success. Computer Integrated Manufacturing Systems, 5(1), 31-38.
Rogers, E. M. (2010). Diffusion of innovations (4th ed.). New York: The Free Press.
Rom, A., & Rohde, C. (2006). Enterprise resource planning systems, strategic enterprise
management systems and management accounting: A Danish study. Journal of
Enterprise Information Management, 19(1/2), 50-66.
Rosskam, E. (2009). Using participatory action research methodology to improve
worker health Unhealthy Work: Causes, Consequences, and Cures (pp. 211-228).

264
Amityville, NY: Baywood
Scapens, R. W., & Jazayeri, M. (2003). ERP systems and management accounting
change: opportunities or impacts? A research note. European Accounting Review,
12(1), 201-233.
Schanfield, A. (2009). More to risk management than COSO ERM (Vol. 208, pp. 14-
15): American Institute of Ceritified Public Accountants.
Schein, E. H. (1983). The role of the founder in creating organisational culture.
Organisational dynamics, 12(1), 13-28.
Schein, E. H. (1984). Coming to a new awareness of organisational culture. Sloan
Management Review, 25(2), 3-16.
Schein, E. H. (1985). Organisational culture and leadership: A dynamic view. San
Francisco: Jossey Bass.
Schmit, J. T., & Roth, K. (1990). Cost effectiveness of risk management practices. The
Journal of Risk and Insurance, 57(3), 455-470.
Schneider, B., Brief, A. P., & Guzzo, R. A. (1996). Creating a climate and culture for
sustainable organisational change. Organisational Dynamics, 24(4), 7-19.
Schneier, R., & Miccolis, J. (1998). Enterprise risk management. Strategy &
Leadership, 26(2), 10-16.
Schoonhoven, C. B. (1981). Problems with contingency theory: testing assumptions
hidden within the language of contingency" theory". Administrative science
quarterly, 349-377.
Schwartz, H., & Davis, S. M. (1981). Matching corporate culture and business strategy.
Organisational dynamics, 10(1), 30-48.
Seddon, P., & Yip, S.-K. (1992). An empirical evaluation of user information
satisfaction (UIS) measures for use with general ledger accounting software. Journal
of Information Systems, 6(1), 75-92.
Sekaran, U., & Bougie, R. (2010). Research methods for business: a skill building
approach. UK: Wiley.

265
Sharma, R., & Yetton, P. (2003). The contingent effects of management support and
task interdependence on successful information systems implementation. MIS
Quarterly, 27(4), 533-556.
Smith, C. G., & Tannenbaum, A. S. (1963). Organizational control structure: A
comparative analysis. Human Relations, 16(4), 299-316.
Sobel, P. J., & Reding, K. F. (2004). Aligning corporate governance with enterprise risk
management. Management Accounting Quarterly, 5(2), 29.
Soin, K., & Collier, P. (2013). Risk and risk management in management accounting
and control. Management Accounting Research, 24(2), 82-87.
Soltanizadeh, S., Rasid, S. Z. A., Golshan, N., Quoquab, F., & Basiruddin, R. (2014).
Enterprise Risk Management Practices among Malaysian Firms. Procedia - Social
and Behavioral Sciences, 164, 332-337.
Sorkin, A. R. (2010). Too big to fail: The inside story of how Wall Street and
Washington fought to save the financial system and themselves. New York: Penguin.
Souder, W. E., Sherman, J. D., & Davies-Cooper, R. (1998). Environmental uncertainty,
organisational integration, and new product development effectiveness: A test of
contingency theory. Journal of Product Innovation Management, 15(6), 520-533.
Spathis, C. (2006). Enterprise systems implementation and accounting benefits. Journal
of Enterprise Information Management, 19(1/2), 67-82.
Spreitzer, G. M., De Janasz, S. C., & Quinn, R. E. (1999). Empowered to lead: The role
of psychological empowerment in leadership. Journal of Organizational Behavior,
20(4), 511-526.
Spreitzer, G. M., Kizilos, M. A., & Nason, S. W. (1997). A dimensional analysis of the
relationship between psychological empowerment and effectiveness satisfaction, and
strain. Journal of Management, 23(5), 679-704.
Standards Developments. (2010). Professional Safety, 55(8), 43-45.
Stanton, P., & Stanton, J. (2002). Corporate annual reports: research perspectives used.
Accounting, Auditing & Accountability Journal 15(4), 478-500.
Stedry, A. C., & Kay, E. (1966). The effects of goal difficulty on performance: A field

266
experiment. Behavioural Science, 11(6), 459-470.
Steinheider, B., Bayerl, P., & Wuestewald, T. (2006). The effects of participative
management on employee commitment, productivity, and community satisfaction in a
police agency. Paper presented at the Paper presented at the annual meeting of the
International Communication Association, Dresden International Congress Centre,
Dresden, Germany.
Stulz, R. M. (1996). Rethinking risk management. Journal of Applied Corporate
Finance, 9(3), 8-24.
Stulz, R. M. (2003). The revolution in corporate finance (4th ed ed.): Blackwell
Publishing.
Sutton, S. G. (2006). Extended-enterprise systems' impact on enterprise risk
management. Journal of Enterprise Information Management, 19(1/2), 97-114.
Tahir, I. M., & Razali, A. R. (2011). The relationship between enterprise risk
management (ERM) and firm value: evidence from Malaysian public listed
companies. International Journal of Economics and Management Sciences, 1(2), 32-
41.
Tannenbaum, A. S. (1962). Control in organizations: Individual adjustment and
organizational performance. Administrative Science Quarterly, 236-257.
Tekathen, M., & Dechow, N. (2013). Enterprise risk management and continuous re-
alignment in the pursuit of accountability: A German case. Management Accounting
Research, 24(2), 100-121.
Thiessen, K., Hoyt, R. E., & Merkley, B. M. (2001). A Composite Sketch of a Chief Risk
Officer, Toronto, September.
Thompson, J. D. (1967). Organisations in action: Social science bases of administration.
Thong, J. Y. L., Yap, C.-S., & Raman, K. S. (1996). Top management support, external
expertise and information systems implementation in small businesses. Information
Systems Research, 7(2), 248-267. doi: 10.2307/23010862
Tiller, M. G. (1983). The dissonance model of participative budgeting: an empirical
exploration. Journal of Accounting Research, 581-595.

267
Tillinghast-Towers Perrin. (2001). Creating value through enterprise risk management -
A practical approach for the Insurance Industry. retrieved from
http://www.towersperrin.com/tp/getwebcachedoc?webc=till/usa/2001/200106/20020
51306.pdf (accessed on August 19, 2014)
Togok, S. H., Isa, C. R., & Zainuddin, S. (2016). Enterprise risk management adoption
in Malaysia: A disclosure approach. Asian Journal of Business and Accounting, 9(1),
83.
Tosi, H. L., & Carroll, S. J. (1976). Management: Contingencies, structure, and
process: St. Clair Press Chicago.
Treasury Board. (2001). Integrated risk management framework. Treasury Board,
Canadian Government, Ottawa.
Ugboro, I. O., & Obeng, K. (2000). Top management leadership, employee
empowerment, job satisfaction, and customer satisfaction in TQM organizations: an
empirical study. Journal of Quality Management, 5(2), 247-272.
Verbrugge, J., Smith, C., Niehaus, G., Briscoe, C., Coleman, W., Lawder, K., . . . Chew,
D. (2003). University of Georgia roundtable on enterprise-wide risk management.
Journal of Applied Corporate Finance, 15(4), 8-26.
Vroom, V. H. (1959). Some personality determinants of the effects of participation. The
Journal of Abnormal and Social Psychology, 59(3), 322.
Walker, G. B. (2007). Public participation as participatory communication in
environmental policy decision-making: From concepts to structured conversations.
Environmental Communication, 1(1), 99-110.
Walker, P. L., Shenkir, W. G., & Barton, T. L. (2003). ERM in practice. The Internal
Auditor, 60(4), 51-55.
Wallach, E. J. (1983). Individuals and organisations: The cultural match. Training &
Development Journal, 37(2), 28.
Wan Daud, W. N. (2011). The role of the quality internal audit support in enterprise risk
management (ERM) practices: evidence from Malaysia. International Journal of
Business and Social Science, 2(5), 189-197.
Wan Daud, W. N., Haron, H., & Ibrahim, D. N. (2011). The role of quality board of
directors in enterprise risk management (ERM) practices: evidence from binary

268
logistic regression. International Journal of Business and Management, 6(12), 205-
211.
Wan Daud, W. N., Yazid, A. S., & Hussin, H. M. R. (2010). The effect of chief risk
officer (CRO) on enterprise risk management (ERM) practices: evidence from
Malaysia. The International Business & Economics Research Journal, 9(11), 55-64.
Waterhouse, J. H., & Tiessen, P. (1978). A contingency framework for management
accounting systems research. Accounting, Organisations and Society, 3, 65-76.
Waweru, N., & Kisaka, E. (2013). The effect of enterprise risk management
implementation on the value of companies Listed on the Nairobi Stock Exchange.
Journal of Applied Finance and Banking, 3(3), 81-105.
Weber, M. (1947). The theory of social and economic organisation. London: Oxford
University Press.
Werts, C. E., Linn, R. L., & Jöreskog, K. G. (1974). Intraclass reliability estimates:
Testing structural assumptions. Educational and Psychological measurement, 34(1),
25-33.
Wilkins, A. L., & Ouchi, W. G. (1983). Efficient cultures: Exploring the relationship
between culture and organisational performance. Administrative Science Quarterly,
28(3), 468-481.
Wixom, B. H., & Watson, H. J. (2001). An empirical investigation of the factors
affecting data warehousing success. MIS Quarterly, 25(1), 17-41.
Woon, L. F., Azizan, N. A., & Samad, M. F. A. (2011). A strategic framework for value
enhancing enterprise risk management. Journal of Global Business & Economics,
2(1), 23-47.
Woosang, H., & Hokey, M. (2013). Assessing the impact of ERP on supplier
performance. Industrial Management and Data Systems, 113(7), 1025-1047.
Xin, L. (2011). A holistic perspective of enterprise risk management. (PhD PhD),
Washington State University, Ann Arbor. Retrieved from
http://search.proquest.com/docview/924154960?accountid=28930 (accessed on Nov
16, 2013)
Yazid, A. S., Hussin, M. R., & Wan Daud, W. N. (2011). An examination of enterprise

269
risk management (ERM) practices among the government-linked companies (GLCs)
in Malaysia. International Business Research, 4(4), 94-103.
Yazid, A. S., Razali, A. R., & Hussin, M. R. (2012). Determinants of enterprise risk
management (ERM): a proposed framework for Malaysian public listed companies.
International Business Research, 5(1), 80-86.
Yetton, P., Sharma, & Southon, G. (1999). Successful IS innovation: the contingent
contributions of innovation characteristics and implementation process. Journal of
Information Technology, 14(1), 53-68.
Yilmaz, C., & Ergun, E. (2008). Organisational culture and firm effectiveness: An
examination of relative effects of culture traits and the balanced culture hypothesis in
an emerging economy. Journal of World Business, 43(3), 290-306.
Yukl, G. A. (1989). Leadership in organizations: Pearson Education India.
Yusuwan, N. M., Adnan, H., Omar, A. F., & Kamaruzaman, J. (2008). Clients'
perspectives of risk management practice in Malaysian construction industry. J. Pol.
& L., 1, 121.
Zehra, H. T., & Bukhari, I. (2015). Relationship between organizational culture and in-
role job performance among private sector bank employees. Pakistan Business
Review, 17(3), 541-561.
Zheng, W., Yang, B., & McLean, G. N. (2010). Linking organisational culture,
structure, strategy, and organisational effectiveness: Mediating role of knowledge
management. Journal of Business Research, 63(7), 763-771.

270
LIST OF PUBLICATIONS AND CONFERENCES WHERE PAPERS
ARE PRESENTED
Publications
1. Operationalising enterprise risk management (ERM) effectiveness. Journal of
Accounting Perspectives, Vol. 7, December 2014, pages 28-48 (Non-ISI/Non-
SCOPUS Cited Publication).
2. Enterprise risk management adoption in Malaysia: A disclosure approach. Asian
Journal of Business and Accounting, Vol 9(1), June 28, 2016, pages 83-104.
(Non-ISI/SCOPUS Cited Publication).
Conferences where Papers from this Thesis were presented
1. Review of Enterprise Risk Management (ERM) Literature. Paper presented at the
International Conference on Technology and Business Management, March 2014.
2. Operationalising Enterprise Risk Management (ERM) Effectiveness. Paper
presented at the 16th Malaysian Finance Association Conference, Kuala Lumpur,
June 2014.
3. Behavioural Factors Influencing the Perceived Effectiveness of Enterprise Risk
Management (ERM) in Managing Risks. Paper presented at the Asian Academic
Accounting Association 16th Annual Conference, Bandung. November 2015.

271

272

273

274

275

Appendix A
276
dsadsadsadsdsa Step 3 – Qualitative approach of collecting
data using semi-structured interview and
content analysis
Step 2 – Quantitative approach of collecting
data using online
Download annual
reports of 820 PLCs
from company’s
website
Develop programme to
search keywords from
annual reports
Deemed as Adopted
ERM
List of e-mail add of
respondents
Key
words
found?
Develop Research
Instruments
Pretesting for content,
and face validity tests
Develop online survey
Pilot testing
Online Survey Launch
Call the adopters for e-
mail address of the
CRO, CFO and CIA
Data Analysis using
PLS Survey
Results
Step 1 – Sample Definition using content analysis of
annual reports
Pre-Survey Interview Identify scope for
Qualitative part of
the Data Collection
Send interview
recording for
transcription
Conduct interview
Identify potential
company(ies) and
officers as potential
interviewee
Analyze interview
data using Nvivo
Discussion of
Findings
Pretested by 1 audit consultant, 5 academics, 2 professionals
Past Complete
27
6

Appendix B
277
List of Empirical Studies Published in Journals Conducted on ERM from 2003 to 2014 (N=62)
No Title Authors
Research
Method
Main Research Theme (sub
theme) Country
1 The characteristics of firms that hire chief risk officers Pagach and Warr (2010) Secondary data Financial characteristics of ERM
adopters US
2 Enterprise risk management : strategic antecedents, risk integration, and
performance Lin, Wen and Yu (2012) Secondary data
Financial characteristics of ERM
adopters US
3 The determinants of enterprise risk management : evidence from the
appointment of chief risk officers
Liebenberg and Hoyt
(2003) Secondary data
Financial characteristics of ERM
adopters US
4 The effect of corporate governance on the use of enterprise risk management
: evidence from Canada
Kleffner, Lee and
McGannon (2003)
Mixed method -
survey ->
interview
Financial characteristics of ERM
adopters Canada
5 Determinants of enterprise risk management (ERM): A proposed framework
for Malaysian public listed companies
Yazid, Razali and Hussin
(2012) Survey Determinants for ERM adoption Malaysia
6 ERM: opportunities for improvement Beasley, Branson and
Hancock (2008) Survey Determinants for ERM adoption US
7 Enterprise risk management: An empirical analysis of factors associated with
the extent of implementation
Beasley, Clune, and
Hermanson (2005a) Survey Determinants for ERM adoption US
8 The adoption and design of enterprise risk management practices: an
empirical study Paape and Speklé (2012) Survey
Determinants for ERM adoption and
relationship between risk
management design choices and
ERM effectiveness
Netherland
9 The effect of enterprise risk management implementation on the value of
companies listed on the Nairobi Stock Exchange
Waweru and Kisaka
(2013) Secondary data ERM Impact on firm's value Kenya
10 Enterprise risk management and value creation: initial findings amongst non-
financial publiclisted companies in Malaysian bourse
Ghazali and Abdul
Manab (2013) Secondary data ERM Impact on firm's value Malaysia
27
7

Appendix B
278
List of Empirical Studies Published in Journals Conducted on ERM from 2003 to 2014 (N=62) (continued)
No Title Authors Research Method
Main Research Theme (sub
theme) Country
11 The relationship between enterprise risk management (ERM) and firm value:
evidence from Malaysian public listed companies. Tahir and Razali (2011) Secondary data ERM Impact on firm's value Malaysia
12 Does enterprise risk management increase firm value Mc Shane, Nair and
Rustambekov (2011) Secondary data ERM Impact on firm's value US
13 The value of enterprise risk management Hoyt and Liebenberg
(2011) Secondary data ERM Impact on firm's value US
14 Enterprise risk management and firm performance in Malaysia Nickmanesh, Zohoori,
Musram and Akbari (2013) Secondary data
ERM Impact on firm's
performance Malaysia
15 Enterprise risk management : A process of enhanced management and
improved performance
Gates, Nicolas and Walker
(2012) Survey
ERM Impact on firm's
performance US
16 Enterprise risk management and firm performance : a contingency perspective Gordon, Martin and Chih-
Yang (2009) Secondary data
ERM Impact on firm's
performance (ERM
effectiveness)
US
17 Management accounting systems, enterprise risk management and
organizational performance in financial institutions
Rasid, Isa and Ismail
(2014) Secondary data
ERM Impact on firm's
performance Malaysia
18 The relationship between enterprise risk management (ERM) and
organizational performance : evidence from Nigerian insurance industry
Obalola, Akpan and
Olufemi (2014) Secondary data
ERM Impact on firm's
performance Nigeria
19 Enterprise risk Management program quality : determinants, value relevance,
and the financial crisis
Baxter, Bedard, Hoitash
and Yezegel (2013) Secondary data
ERM Impact on firm's
performance during crisis US Banks
20 The value of investing in enterprise risk management Grace, Leverty, Phillips
and Shimpi (2014)
Survey and
secondary data
ERM Impact on firm's
performance during crisis US
27
8

Appendix B
279
List of Empirical Studies Published in Journals Conducted on ERM from 2003 to 2014 (N=62) (continued)
No Title Authors Research Method
Main Research Theme (sub
theme) Country
21
A study of the relationship between a successful enterprise risk management
system, a performance measurement system and the financial performance of
Thai listed companies
Laisasikorn and Rompho
(2014)
Survey and
secondary data
Impact of a successful (effective)
ERM and Performance
measurement system on firm's
performance
Thailand
22 Enterprise risk management as a strategic governance mechanism in B2B-
Enabled transnational supply chains
Arnold, Hampton and
Sutton (2012) Survey
ERM Impact on Supply Chain
Relationship
North
America
23 Enterprise-wide risk management and organizational fit : a comparative
study
Arnaboldi and Lapsley
(2014) Case study ERM impact on budgeting UK
24 Integrated risk management and product innovation in China : the
moderating role of board of directors Wu and Wu (2013) Survey
ERM impact on product
innovation (moderating role of
board of directors)
China
25 The rise and evolution of the chief risk officer : enterprise risk management
at Hydro One
Aabo, Fraser and Simkins
(2005) Case study
Role of CRO in ERM
implementation Canada
26 The effect of chief risk officer (CRO) on enterprise risk management (ERM)
practices : evidence from Malaysia
Wan Daud, Yazid and
Hussin (2010) Survey
Role of CRO in ERM
implementation Malaysia
27 Risk management at crunch time: are chief risk officers compliance
champions or business partners? Mikes (2008)
Mixed method -
survey -> interview
Role of CRO in ERM
implementation UK Banks
28 Information conveyed in hiring announcements of senior executives
overseeing enterprise-wide risk management processes
Beasley, Pagach and Warr
(2007) Secondary data
Role of CRO in ERM
implementation US
29 Governance and shareholder response to chief risk officer appointments Gupta, Prakashand Rangan
(2012) Secondary data
Role of CRO in ERM
implementation US
30 Integrated risk management and the role of risk manager Collquit, Hoyt and Lee
(1999) Survey
Role of CRO in ERM
implementation US
27
9

Appendix B
280
List of Empirical Studies Published in Journals Conducted on ERM from 2003 to 2014 (N=62) (continued)
No Title Authors Research Method
Main Research Theme (sub
theme) Country
31 Internal audit involvement in enterprise risk management de Zwaan, Stewart and
Subramaniam (2011)
Experimental
design
Role of internal audit on
ERM implementation Australia
32 The enterprise risk management and the risk oriented internal audit Liu (2012) Mixed method -
interview -> survey
Role of internal audit on
ERM implementation and its
application on ERM
effectiveness
China
33 The enterprise risk management and the risk oriented internal audit (ERM)
practices : evidence from Malaysia Wan Daud (2011) Survey
Role of internal audit on
ERM implementation Malaysia
34 The effect of continous enterprise risk management improvement on internal
audit work success of the institute of higher education
Musig and Kunsrison
(2012). Survey
Role of internal audit on
ERM implementation Thailand
35 Embedding risk management : structures and approaches Fraser and Henry (2007) Interview Role of internal audit on
ERM implementation UK
36 ERM: a status report Beasley, Clune and
Hermanson (2005) Survey
Role of internal audit on
ERM implementation US
37 The role of quality board of directors in erm practices: evidence from binary
logistic regression
Wan Daud, Haron and
Ibrahim (2011) Survey Role of BOD on ERM Malaysia
38 An examination of enterprise risk management (ERM) practices among the
government-linked companies (GLCs) in Malaysia
Yazid, Hussin and Wan
Daud (2011) Survey
Role of CRO and BOD on
ERM implementation Malaysia
39 Evaluating enterprise risk management (ERM) ; Bahrain financial sectors as
a case study
Jalal, Albayati and
Albuainain (2011) Survey
ERM practices within
organisation (ERM
effectiveness)
Bahrain
40 Enterprise risk management (ERM) practices of private higher education
institutions in Botswana : a critical analysis Rudhumbu (2014) Survey
ERM practices within
organisation Botswana
28
0

Appendix B
281
List of Empirical Studies Published in Journals Conducted on ERM from 2003 to 2014 (N=62) (continued)
No Title Authors Research Method
Main Research Theme (sub
theme) Country
41 Current practices of enterprise risk management in Dubai Rao and Marie (2007) Survey ERM practices within
organisation Dubai
42 Enterprise risk management and continuous re-alignment in the pursuit of
accountability: a German case
Tekathen and Dechow
(2013) Case study
ERM practices within
organisation Germany
43 Implementation of enterprise risk management: evidence from the German
property-liability insurance industry
Altuntas,Berry-stölzle and
Hoyt (2011) Survey
ERM practices within
organisation Germany
44 Enterprise risk management in the Middle East Oil industry : an empirical
investigation across GCC countries Muralidhar (2010) Case study
ERM practices within
organisation
Gulf
Cooperation
Council
45 Is enterprise risk management real? Arena, Arnaboldi and
Azzone (2011) Case study
ERM practices within
organisation Italy
46 The organizational dynamics of enterprise risk management Arena, Arnaboldi and
Azzone (2010) Case study
ERM practices within
organisation Italy
47 Risk and management accounting: best practice guidelines for enterprise-wide
internal control procedures
Collier, Berry and Burke
(2007)
Mixed method - case
study -> survey
ERM practices within
organisation (ERM
effectiveness)
UK
48 United Grain Growers: enterprise risk Management and weather risk Harrington and Niehaus
(2003) Case study
ERM practices within
organisation US
49 Enterprise risk management strategies for state departments of transportation Hallowell, Molenaar and
Fortunato (2012) Mix method
ERM practices within public
entities US
50 An exploratory study of enterprise risk management pillars of ERM Lundqvist (2014) Survey ERM practices and the
framework used. Sweden
51 Investigating enterprise risk management maturity in construction firms Zhao, Hwang and Low
(2014)
Mix method - survey
-> case study
ERM maturity and ERM
Practices within organisation Singapore
28
1

Appendix B
282
List of Empirical Studies Published in Journals Conducted on ERM from 2003 to 2014 (N=62) (continued)
No Title Authors Research Method Main Research Theme (sub theme) Country
52 Developing fuzzy enterprise risk management maturity model for
construction firms
Zhao, Hwang and Low
(2013) Survey
ERM maturity and ERM Practices
within organisation Singapore
53 Enterprise risk management: insights from a textile-apparel supply chain Moon, Mo and Chan
(2014) Interview
ERM maturity and ERM Practices
within organisation Hongkong
54 The role of enterprise risk management and organisational strategic
flexibility in easing new regulatory compliance
Arnold, Benford, Canada,
Sutton (2011) Survey
Effectiveness of ERM Programme -
in reaction to new regulatory
mandates.
US
55 The effectiveness of risk management implementation in Russian
companies Makarova (2014) Survey
ERM practices within organisation
and the effective risks assessments Russia
56 The relationship between corporate strategy and enterprise risk
management: evidencefrom Canada
Ben-Amar, Boujenoui,
Zeghal (2014) Secondary data
Relationship between strategy and
risk management approach Canada
57 Enterprise risk management in financial crisis Heng Yik, Jifeng and
Jared (2011) Secondary data
Current Issues in ERM - financial
crisis US
58 Integration of carbon risks and opportunities in enterprise risk management
systems: evidence from Australian firms
Subramaniam, Wahyuni,
Cooper, Leung, Wines
(2014)
Survey Risks and opportunities of ERM
approach carbon pricing mechanism Australia
59 Who reads what most often ? A survey of ERM literature read by risk
managers
Fraser, Schoening-
Thiessen and Simkins
(2008)
Survey Literature on ERM Canada
60 Supply chain risk management within the context of COSO’s enterprise
risk management framework
Curkovic, Scannell,
Wagner, and Vitek (2013) Survey ERM based on COSO 8 components
North
America
61 An investigation of the extent of adoption of enterprise risk management
(ERM) by banks in Zimbabwe
Kanhai, Ganesh, &
Muhwandavaka (2014)
Survey and secondary
data Level of ERM adoption Zimbabwe
62 Risk management and calculative cultures Mikes (2009) Case study Value-based ERM approach UK Banks
28
2

Appendix C
283
Summary of ERM Effectiveness Studies
No Title Authors Research Objectives (in regards to
effectiveness)
Operationalisation Findings
1 Risk and management
accounting: best practice
guidelines for enterprise-wide
internal control
Data collection method:
Questionnaire followed by
interviews
Collier, Berry and
Burke (2007)
To investigate the effectiveness of
risk management guidance issued
for the local authorities in UK
Uses dimensions of structure of
the risk management function,
and the risk management
processes of risk identification,
risk register, reporting and
independent review to measure
effectiveness
The study reveals that the will to
implement an effective risk management
can be developed if the concepts are
sufficiently embedded in the operational
procedures, implying that knowledge
management is an important element in
managing risks..
2 Enterprise risk management
and firm performance: a
contingency perspective.
Data collection method:
Questionnaire
Gordon, Martin
and Chih-Yang
(2009)
To investigate whether the
relationship between ERM and
firm performance is contingent
upon the proper match between
ERM and five key contingency
variables (environmental
uncertainty, industry competition,
firm size, firm complexity, and
board of directors’ monitoring
and firm performance).
Develops a set of ERM index
(ERMI) to measure ERM
effectiveness based on ERM’s
ability to achieve its objectives
(based on COSO 2004) relative to
strategy.
The findings confirm that the ERM-firm
performance relation is indeed contingent
on the proper match between ERM and the
five variables. The findings also suggest
that its ERM Index (ERMI) is only fair
and not a perfect measure of ERM
effectiveness.
3 Evaluating enterprise risk
management (ERM): Bahrain
financial sectors as a case
study
Data collection method:
Questionnaire
Jalal, Albayati
and Albuainain
(2011)
To investigate the relationship
between eight components of
COSO 2004 ERM and ERM
effectiveness.
Uses only four out of the eight
components of COSO 2004 (risk
assessment, communication,
monitoring and control) as the
antecedents for a good ERM
programme (COSO, 2004).
Findings show lack of association between
risk assessment & ERM, communication
& ERM, monitoring & ERM, but there is a
relationship between control & ERM.
4 The effectiveness of risk
management implementation
in Russian companies
Data collection method:
Questionnaire
Makarova (2014) To determine the most effective
ERM programme for Russian
companies.
Information not available. Information not available.
28
3

Appendix C
284
Summary of ERM Effectiveness Studies (continued)
No Title Authors Research Objectives (in regards
to effectiveness) Operationalisation Findings
5
The role of enterprise risk
management and
organisational strategic in
easing new regulatory
compliance
Data collection method:
Questionnaire
Arnold,
Benford,
Canada and
Sutton
(2011)
To investigate the relationship
between an organisations’ pre-
regulatory effectiveness of
enterprise risk management
(ERM) processes and their
reactiveness to new regulatory
mandates.
Uses a five-rating scale on
the effectiveness of ERM
procedures at a strategic
level. Five statements
describing ERM process
were developed for this
purpose.
Findings indicate presence of direct
relationship between ERM effectiveness on
the strength of the control environment and
the indirect relationship between ERM
effectiveness on control environment via
compatibility and strategic flexibility as the
mediator. Findings also support the
propositions that organisations with
effective ERM processes and flexible
organisational structures react quickly to
change in the regulatory landscape.
6
The adoption and design of
enterprise risk management
practices: an empirical study
Data collection method:
Questionnaire
Paape and
Speklé
(2012)
To investigate the relationship
between specific risk
management design choices and
their effect on perceived risk
management effectiveness
Uses a single item
statement on quality of risk
management whereby
respondents are asked to
rate on a ten-point scale.
Findings show no evidence that application
of the COSO framework improves risk
management effectiveness. In addition, the
study finds that perceived risk management
effectiveness is associated with the
frequency of risk assessment and reporting,
and with the use of quantitative risk
assessment techniques.
7
A study of the relationship
between a successful
enterprise risk management
system, a performance
measurement system and the
financial performance of
Thai listed companies
Data collection method:
Questionnaire and secondary
data
Laisasikorn
and Rompho
(2014)
To investigate how the
relationship between and
effective ERM system (ERMS)
and a performance measurement
system (PMS) with the financial
performance.
Uses four components
consisting of culture,
processes, structure and
infrastructure (based on
COSO 2004). Each
respondent was asked to
rate the statements related
to the components using a
scale of 1–5.
The findings suggest that both systems are
sources for companies’ competitive
advantage and sustainable growth.
However, the results of the study also
indicate that success of the ERMS and PMS
have a weak positive correlation with the
financial performance of an organisation.
28
4

Appendix D
285
Faculty of Business and Accountancy
Universiti Malaya
Lembah Pantai 50603 Kuala Lumpur
Date
Dear Sir/Madam,
EFFECTIVENESS OF ENTERPRISE RISK MANAGEMENT (ERM) IN MANAGING
RISKS
This survey is part of the thesis for the PhD programme undertaken at the Faculty of Business
and Accountancy, University of Malaya. The study is designed to further expand the body of
knowledge regarding the factors influencing the effectiveness of ERM in managing risks. The information you provide will help us to better understand the relationship between the
organisational factors and ERM effectiveness in managing risks. There are a total of 19 main
questions in the questionnaire which are broken down into the following six sections:
Section 1 : BACKGROUND INFORMATION
Section 2 : ERM CHAMPION IN YOUR ORGANISATION
Section 3 : CULTURE, STRUCTURE AND ENTERPRISE SYSTEM TECHNOLOGY OF
YOUR ORGANISATION
Section 4 : EMPLOYEE INVOLVEMENT AND TONE FROM THE TOP
Section 5 : ERM IMPLEMENTATION IN YOUR ORGANISATION
Section 6 : PERCEIVED ERM EFFECTIVENESS IN MANAGING RISKS IN YOUR
ORGANISATION
To maximise the usefulness of your response, we wish to ask you to please answer all questions
in the questionnaire and answer them as frankly and as honestly as possible. It should take
approximately 30 uninterrupted minutes to complete the questionnaire.
The information you provide will be kept strictly confidential and used solely for the
purpose of the current thesis. Only those who are directly involved in the thesis
preparation will have access to the data collected.
We wish to thank you in advance for your kind understanding and support. In the meantime,
please do not hesitate to contact the corresponding researcher, Ms Salinah at +6013-325 6166 if
you have any questions regarding the survey.
Yours sincerely.
Salinah Hj Togok
Assoc Prof Dr Ruhana Che Isa
Dr Suria Zainuddin
Department Of Accounting
Faculty Of Business And Accountancy
University Of Malaya
Kuala Lumpur

Appendix D
286
SECTION 1: BACKGROUND INFORMATION
Please choose only ONE answer by indicating (√) in the relevant box provided.
1. Gender Male Female
2. Age 30 and below 51 - 60
31 – 40 Above 60
41 - 50
3. Please state your current position and your job title:
Top Management Job title: __________________________
Middle Management Job title: __________________________
Junior Management Job title: __________________________
Non-management Job title: __________________________
4. Length of service (in number of years)
In employment years
In current position years
5. Industry (predefined)
Manufacturing Technology
Industrial Product Property
Consumer Product Plantation
Trade and Services Construction
Others. Please specify __________
6. Type of Organisation
Public Listed Company (PLC)
Government-Linked Companies (GLCs)
Multinational Companies (MNCs)
Others. Please specify _______________
7. Does your organisation has a separate ERM unit?
Yes No
8. Does your organisation has a dedicated Chief Risk Officer?
Yes No

Appendix D
287
SECTION 2: ENTERPRISE RISK MANAGEMENT (ERM) CHAMPION IN YOUR
ORGANISATION
The following question identifies the ERM Champion in your organisation. Please choose only
ONE of the roles below to be identified as ERM Champion based on the following primary
responsibilities in relation ERM activities.
9. A Risk Champion is primarily responsible for the following tasks in relation to the
implementation and coordination of ERM programme.
Establishing effective risk management programme for the organisation.
Reporting the relevant risk information up, down and across the organisation.
Monitoring all the risk management activities within the organisation
Please choose one of the following role in your organisation who has the responsibility for all or
most of the above tasks.
F. Chief Executive Officer
G. Chief Risk Officer
H. Chief Internal Auditor
I. Chief Financial Officer
J. Others. Please specify ___________________
10. The following statements refers to the power of the ERM Champion whom you have
identified from Question 10 above. Please indicate your agreement to each of the following
statement by circling ONE of the number/rating below regarding the power of ERM
Champion in your organisation.
Strongly Strongly
Disagree Agree
1. The ERM Champion is a member of the
Management team. 1 2 3 4 5 6 7
2. The ERM Champion reports directly to the CEO or
the Board of Directors or the Audit and Risk
Committee.
1 2 3 4 5 6 7
3. The ERM Champion is involved in the setting up of
new ventures or new projects. 1 2 3 4 5 6 7
4. The ERM Champion participates in board-level
strategic decision making (i.e. M&A, portfolio
rebalancing, etc.).
1 2 3 4 5 6 7

Appendix D
288
SECTION 3: CULTURE, STRUCTURE AND ENTERPRISE SYSTEM TECHNOLOGY
OF YOUR ORGANISATION
Please choose only ONE answer by circling the relevant number/rating.
11. Please indicate how each of the following statement describes your organisational culture.
Least
describe Best
describe
1. Risk taking 1 2 3 4 5 6 7
2. Collaborating 1 2 3 4 5 6 7
3. Hierarchical 1 2 3 4 5 6 7
4. Procedural 1 2 3 4 5 6 7
5. Relationship Oriented 1 2 3 4 5 6 7
6. Results oriented 1 2 3 4 5 6 7
7. Creative 1 2 3 4 5 6 7
8. Encouraging 1 2 3 4 5 6 7
9. Sociable 1 2 3 4 5 6 7
10. Structured 1 2 3 4 5 6 7
11. Pressurised 1 2 3 4 5 6 7
12. Ordered 1 2 3 4 5 6 7
13. Stimulating 1 2 3 4 5 6 7
14. Regulated 1 2 3 4 5 6 7
15. Personal Freedom 1 2 3 4 5 6 7
16. Equitable 1 2 3 4 5 6 7
17. Safe 1 2 3 4 5 6 7
18. Challenging 1 2 3 4 5 6 7
19. Enterprising 1 2 3 4 5 6 7
20. Established, Solid 1 2 3 4 5 6 7
21. Cautious 1 2 3 4 5 6 7
22. Trusting 1 2 3 4 5 6 7
23. Driving 1 2 3 4 5 6 7
24. Power-oriented 1 2 3 4 5 6 7

Appendix D
289
12. Please indicate your agreement to each of the following statement about your organisation
structure.
Nature of formalisation
Strongly
Disagree
Strongly
Agree
1. My organisation establishes rules and procedures to
show how employees can make suggestions for changes 1 2 3 4 5 6 7
2. My organisation establishes rules and procedures to
reflect the experience learned from the past. 1 2 3 4 5 6 7
3. My organisation establishes rules and procedures to
guide employees to implement improvement at work. 1 2 3 4 5 6 7
4. My organisation establishes rules and procedures to
encourage employees to be creative in dealing with
problems at work.
1 2 3 4 5 6 7
5. The employees in my organisation can share opinions
with their superior and get involved in making decisions. 1 2 3 4 5 6 7
Hierarchy
Strongly
Disagree
Strongly
Agree
1. There are only a few layers in my organisational
hierarchy. 1 2 3 4 5 6 7
2. My organisation is a lean organisation. 1 2 3 4 5 6 7
3. My organisation has only few management layers
between staff at the basic level and CEO. 1 2 3 4 5 6 7
Decentralisation
Strongly
Disagree
Strongly
Agree
1. The employees in my organisation have the authority to
correct problems when they occur. 1 2 3 4 5 6 7
2. The employees in my organisation are empowered and
have control over their job. 1 2 3 4 5 6 7
3. My superiors are supportive of the decisions made by
their team. 1 2 3 4 5 6 7

Appendix D
290
13. Please indicate your agreement to each of the following statement about your organisation
enterprise systems technology.
General
Strongly
Disagree
Strongly
Agree
1. All kinds of business information flow
electronically across the organisation. 1 2 3 4 5 6 7
2. The systems for financial and accounting
information, human resource information, supply
chain information, where applicable, is fully
integrated.
1 2 3 4 5 6 7
Integration
Strongly
Disagree
Strongly
Agree
1. We seamlessly integrate all business modules in the
enterprise system technology. 1 2 3 4 5 6 7
2. We seamlessly integrate all internal business
transactions in the enterprise system technology. 1 2 3 4 5 6 7
3. We seamlessly integrate the enterprise system
technology with customer and supplier system,
using communication protocols and standards.
1 2 3 4 5 6 7
Configuration
Strongly
Disagree
Strongly
Agree
1. The enterprise system technology in my
organisation meets all my organisational needs. 1 2 3 4 5 6 7
2. The enterprise system technology in my
organisation accommodates the relevant changes
required.
1 2 3 4 5 6 7
3. The enterprise system technology in my
organisation supports the business processes and
practices of my organisation (data fit).
1 2 3 4 5 6 7
Adaptation
Strongly
Disagree
Strongly
Agree
1. We can easily alter the enterprise system technology
data items, to fit into changing organisational
needs.
1 2 3 4 5 6 7
2. We can easily alter the enterprise system technology
input/output screens, to fit into changing
organisational needs.
1 2 3 4 5 6 7
3. We can easily alter the enterprise system technology
reports, to fit into changing organisational needs. 1 2 3 4 5 6 7
Software for ERM
Strongly
Disagree
Strongly
Agree
1. My organisation implements risk management
software to capture all risk information which
includes the risk events, response and status of each
response.
1 2 3 4 5 6 7
2. The risk management software used in my
organisation is accessible to all the applicable risk
owners, line management and the dedicated risk
team.
1 2 3 4 5 6 7
3. The risk management software used in my
organisation is integrated with all the other
operating systems in the organisation.
1 2 3 4 5 6 7

Appendix D
291
SECTION 4: EMPLOYEE INVOLVEMENT and TONE FROM THE TOP
Please choose only ONE answer by circling the relevant number/rating.
14. Please indicate your agreement to each of the following statement regarding the extent of
employee involvement in ERM activities in your organisation.
Strongly Strongly
Disagree Agree
1. Employees are involved in identifying the key risk
area. 1 2 3 4 5 6 7
2. Employees are involved in defining the risk
mitigating initiatives. 1 2 3 4 5 6 7
3. Management put in great efforts to involve
employees in ERM processes/activities. 1 2 3 4 5 6 7
15. Please indicate your agreement to each of the following statement regarding the extent of
tone from the top in regards to ERM activities in your organisation.
Strongly Strongly
Disagree Agree
1. The internal environment in my organisation
provides an appropriate foundation for ERM. 1 2 3 4 5 6 7
2. The ‘tone from the top’ sends an appropriate level
of emphasis on the importance of ERM in my
organisation.
1 2 3 4 5 6 7
3. Board of directors or committee of the board in my
organisation is actively involved in the risk
management activities.
1 2 3 4 5 6 7

Appendix D
292
SECTION 5: ERM IMPLEMENTATION IN YOUR ORGANISATION
Please choose only ONE answer by indicating (√) in the relevant box provided
16. Please choose the statement which BEST described the level of ERM implementation in
your organisation.
A. We identify, assess, and control strategic, financial, operational, and compliance
risks; ERM is an integral part of the (strategic) planning & control cycle.
B. We identify, assess, and control strategic, financial, operational, and compliance
risks; we are in the process of implementing a complete ERM.
C. We identify, assess and control risk in specific area; we are planning to implement
a complete ERM.
D. We actively control risk in specific areas (e.g. health & safety, financial risk); we
are considering to implement a complete ERM.
E. Risk management is mainly incident-driven; no plans exist to implement ERM.
17. Please indicate the number of years ERM has been implemented in your organisation.
A. In the first year of ERM
B. In the year 2 – 3 of ERM implementation
C. In the year 4 – 5 of ERM implementation
D. Beyond the fifth year of ERM implementation
E. Not implementing ERM

Appendix D
293
SECTION 6: ERM PERCEIVED EFFECTIVENESS IN MANAGING RISKS
Please choose only ONE answer by circling the relevant number/rating.
18. The following statements refer to the 11 principles of an effective risk management
according to ISO 31000: 2009. Please indicate your agreement to each of the following
statement in respect to the ERM practices in your organisation.
Strongly Strongly
Disagree Agree
1. Risk management activities in my organisation
create and protect organisational value. 1 2 3 4 5 6 7
2. Risk management in my organisation is part of the
management responsibilities and are embedded
in all the organisational processes, including
strategic planning as well as change management
activities.
1 2 3 4 5 6 7
3. Risk management helps decision makers make
informed choices, prioritise actions and
distinguish among alternative courses of action.
1 2 3 4 5 6 7
4. Risk management activities in my organisation
considers all kinds of threats and uncertainties,
the nature of those threats and uncertainties, and
how they can be addressed.
1 2 3 4 5 6 7
5. Risk management programme in my organisation is
systematic, structured and timely. 1 2 3 4 5 6 7
6. Risk management in my organisation is based on
the best available information including but not
limited to historical data, past experience, inputs
from stakeholders and experts, observations and
forecasts.
1 2 3 4 5 6 7
7. Risk management in my organisation is aligned
with the organisation’s external and internal
context and risk profile.
1 2 3 4 5 6 7
8. Risk management function in my organisation
recognises the capabilities, perceptions and
intentions of external and internal people that can
facilitate or hinder achievement of the
organisation’s objectives.
1 2 3 4 5 6 7
9. Risk management activities in my organisation
involve stakeholders and decision makers at all
levels of the organisation in a timely manner to
ensure that risk management remains relevant and
up-to-date.
1 2 3 4 5 6 7
10. Risk management in my organisation is dynamic,
iterative, and responsive to change. 1 2 3 4 5 6 7
11. My organisation develops and implements
strategies to improve risk management maturity
alongside all other aspects of their organisation.
1 2 3 4 5 6 7

Appendix D
294
19. The following statements refer to the organisation ability to achieve the objectives set
for ERM. Please indicate the extent to which the objectives can be effectively achieved in your
organisation.
Entirely Entirely
Ineffective Effective
1 ERM enhances my organisation ability to identify
and assess risk events effectively. 1 2 3 4 5 6 7
2. ERM enhances my organisation ability to
manage risks within its risk appetite and risk
tolerance level.
1 2 3 4 5 6 7
3. ERM enhances my organisation ability regarding
the achievement of entity objectives. 1 2 3 4 5 6 7
4. ERM enhances my organisation ability to
minimise unfavourable suprises and losses. 1 2 3 4 5 6 7
5. ERM enhances my organisation ability to
optimise the potential upside effects from the
opportunities arising from the uncertainties.
1 2 3 4 5 6 7

Appendix E
295
Study on the Factors Influencing Perceived Effectiveness of ERM Implementation in
Managing Risks (hereafter referred to as the Current Study)
Introduction script at the beginning of the interview session
This Interview forms part of the Case Study. The objective of this interview is to gain insight
into ERM practices within Organisations, in particular its effectiveness in managing risks and
the organisational factors that can influence its effectiveness. The conduct of this interview is
purely for academic purposes. We are not engaged by your management team or any parties to
audit the processes in your organisation or to evaluate your performance.
Your management team is, however, aware of the research that we are currently conducting
and written approval has been obtained to conduct this interview with you. There are no right
or wrong in the answers to the questions although it may be worth highlighting that the ERM
practices in your organisation are among the best in the country. Therefore we would
appreciate it if you could be as truthful and frank as possible in giving your feedback or
expressing your views.
Please be assured that your identity will not be disclosed in any form of publication or report
which maybe produced upon completion of the case study. Any form of input gathered from this
interview will be used only for academic purposes and specific to the preparation of the current
study.
This questionnaire consists of 5 sections of open-ended questions as follows:
Section 1 – Background information
Section 2 – ERM practices within organisations and its effectiveness in managing risks
Section 3 – Employee involvement in ERM activities
Section 4 – Strategic Role of ERM Champion
Section 5– Organisational Setting

Appendix E
296
SECTION 1 – BACKGROUND INFORMATION
In this section we would like to know your background and the background of the organisation
which you are representing.
Please tell me about yourself.
1. Name of the Interviewee:
2. Department:
3. Position:
4. How long have you been in the position:
SECTION 2 – ERM PRACTICES WITHIN ORGANISATIONS AND ITS
EFFECTIVENESS IN MANAGING RISKS
In this section, we would like to know the ERM practices, in particular its effectiveness in
managing risks.
1. Please describe what is your role in ERM in your organisation?
2. Can you describe the Risk Management practices in your organisation?
3. Tell me about about ERM approach of managing risks?
4. In what way does ERM affect your work?
5. In what way does ERM affect the ability of the company in managing risks?
6. To what extent do you think ERM is effective in managing risks?
SECTION 3 – EMPLOYEE INVOLVEMENT IN ERM ACTIVITIES
In this Section we would like to understand the nature and extent of employee involvement in
ERM activities.
1. Describe your role in ERM activities in your company? Please describe the extent of
your involvement. (for example as risk owner, as coordinator, if in risk dept., as an
enforcer, if in audit dept. etc.)
2. How do you support ERM in your company? Please describe the extent of your support.
3. How do you describe employee involvement in ERM activities in your company?
4. How often do you get involved in ERM activities? Daily, weekly, monthly, annually, or
regularly.
5. Tell me how does the management encourage employees to participate in the ERM
activities. (Does the management make it compulsory? Does management impose some
form of penalty if employees do not participate?)
6. In your opinion, to what extent does employee involvement or involvement affect the
effectiveness of ERM in managing risks?
SECTION 4 – STRATEGIC ROLE OF ERM CHAMPION
In this Section we would like to understand the nature of ERM Champion at MAB.
1. If you were asked to name the ERM Champion for MAB, whose name comes into your
mind? Please explain why. To whom does the ERM Champion report to in the
organisation: to the management team / Board Risk Management Committee?
2. How do you describe his or her seniority/authorities in this company?
3. How do you describe his influence or autonomy concerning the future direction of the
company?
4. Is risk topic a compulsory item in the checklist when assessing the feasibility of any
projects (for example merger, acquisition, new development projects) to be undertaken
by the company?

Appendix E
297
SECTION 5 – ORGANISATIONAL SETTINGS
In this Section we would like to understand the organisational settings of this company.
1. How do you describe the organisational culture in the company in regards to risk
management? (Pointers: Is it team work or individual culture, risk taker or risk averse
culture? Is risk embedded in the culture?)
2. How do you describe the enterprise system in MAB from the operation point of view
and from ERM point of view?
3. How do you describe the tone from the top when it comes to ERM initiatives?
(Pointers: Does ERM gets top priority by the top management? Does management team
drive ERM?)
4. What are the initiatives done by the top management of this company to embed the risk
awareness culture among employees?
Script to conclude the interview session
Thank you very much for your feedback.

Appendix F
298
Summary of ERM Practices
Company Mars Berhad Pluto Berhad Saturn Berhad Uranus Berhad Venus Berhad Marikh Berhad
Industry Industrial Products Consumer Products Trade/Service Consumer Products Consumer Products Financial Services
Interview
Participants
Mr A - Head of Risk Ms G - Head of Risk Mr I - CRO Ms L - Head of
Audit
Mr M - Audit
Manager
Mr N - CRO Mr P – CRO
Ms B – Risk Coordinator Ms H - Head of Audit Mr J - Head of Audit
Ms K - Head of
Finance
Mr O - Chairman of
Risk Management
Ms C - Head of Audit
Mr D - Chairman of Risk
Management Committee
Ms E - Risk Coordinator
Mr F - Risk Executive
Presence of
CRO x x √ x √ √
Separate ERM
Unit √ √ √ √ √ √
Board Risk
Management
Committee
Board Risk Management
Committee
Risk Management
Committee (July 2013)
Audit and Risk
Management
Committee
Board Governance
& Risk
Management
Committee
Risk Management
Committee
Risk Management
Committee,
Credit Review
Committee
29
8

Appendix F
299
Summary of ERM Practices (continued)
Company Mars Berhad Pluto Berhad Saturn Berhad Uranus Berhad Venus Berhad Marikh Berhad
Corporate Risk
Management
Committee at
Management
Executive
Level
Corporate Risk
Management Committee
(2013)
Management Risk
Committee
no information Risk Management
Committee
(dissolved early
2014)
no information Group Asset & Liability
Committee, Group
Executive Risk Committee,
Group Management Credit
Committee, Group
Operational Risk
Management Committee
Engaged
consultant to
implement
√ √ x √ no info no info
Appointment
of risk
coordinators
√ √ √ √ √ √
Number of
times the risk
register is
being signed
off
Quarterly Quarterly Quarterly Quarterly Quarterly Quarterly
Use of ERM
Software √ √ x √ x √
ERM
Framework ISO 31000 ISO 31000
ISO 31000 and
COSO 2004
framework,
where
applicable
ISO 31000 ISO 31000 COSO 2004 Framework
29
9


