Embed Size (px)
Citation preview

i
Optimization of Processing Parameters for Camel Milk
Cheese Production
By
Zahida Qadeer
94-ag-1578
M.Sc. (Hons.) Food Technology (UAF)
A dissertation partial submitted to fulfill the degree requirements for
Doctor of Philosophy
In
Food Technology
National Institute of Food Science & Technology
Faculty of Food, Nutrition and Home Sciences
University of Agriculture,
Faisalabad
Pakistan
2017

ii
DEDICATED
TO
Holy Prophet
(PBUH)

iii
ACKNOWLEDGMENTS
All admirations and appreciations are for Allah Almighty, the most graceful and Merciful
and base of all wisdom and knowledge, who sacred me with thoughts, good health, talented
instructors, serving friends and chance to gather this study. I also offer my humble obligations to
Holy Prophet Hazrat Muhammad (Peace be Upon Him), whose ethical and spiritual guidness
clarifyed my mind and prospered my heart and thoughts towards attaining high morals of life.
I am thankful to my supervisor Prof. Dr. Nuzhat Huma, NIFSAT, University of
Agriculture, Faisalabad for her guidness in execution, planning and intellectual ideas that
enhanced the performance of scientific research work.
I am grateful to my supervisory committee members, Dr. Aysha Sameen (NIFSAT) and
Prof. Dr. Tahira Iqbal, Department of Biochemistry, University of Agriculture Faisalabad for
their kind help, guidance, proper support and devotions to achieve my target.
I pay my gratefulness to Dr. Saima Rafiq, Mr. Mian Shamas Murtaza, Mrs. Naila Siraj
and Mr. Muhammad Umair Sattar Ph.D. scholars of the Institute for their help in my dissertation
completion. My gratified to all Ph.D. fellows in boosting my courage during the course of study.
I feel it incomplete if I do not extend my fervent thanks and heartiest compliments to my
mother, mother in law, father in law, brothers, sister and my kids for remembering me in their
prayers and whose act always enforced me to update my knowledge. Particularly want to thank
to my husband (Late) for his cooperation and accountability during my work.
(Zahida Qadeer)

iv

v

vi

vii
Table of Contents ACKNOWLEDGMENTS............................................................................................................................. iii
ABSTRACT ............................................................................................................................................. xiv
CHAPTER 1 .............................................................................................................................................. 1
INTRODUCTION 1
CHAPTER 2 .............................................................................................................................................. 5
REVIEW OF LITERATURE 5
2.1 Camels in Pakistan 5
2.2 Composition of camel milk 7
2.2.1 Protein 7
a. Casein 7
b. Whey proteins 9
2.2.2 Fats 10
2.2.3 Lactose 11
2.2.4 Mineral matter 11
2.2.5 Vitamins 12
2.2.6 Other minor constituents of camel milk 12
2.3 Nutritional and functional properties of camel milk 13
2.4 Camel milk transformation 15
2.5 Factors affecting the camel milk cheese preparation 16
2.5.1 Standardization 16
2.5.2 Pasteurization 17
2.5.3 Pre-acidification 19
2.5.4 Effect of calcium chloride 21
2.5.5 Starter cultures 24
2.5.6 Coagulation 26
2.5.7 Action of rennet 27
2.5.8 Cooking/Scalding 29
2.5.9 Whey drainage and cheese yield 30
2.6 Changes occurring during cheese storage 32

viii
2.6.1 Proteolysis 32
2.6.2 Textural changes 33
2.7 Heat stability of defensive proteins 34
CHAPTER 3 ............................................................................................................................................ 36
MATERIALS AND METHODS 36
3.1 Procurement of raw material / chemicals 36
3.2 Physico-chemical analysis of milk 36
3.2.1 pH 36
3.2.2 Acidity percentage 36
3.2.3 Protein content 37
3.2.4 Fat content 37
3.2.5 Solid-not-fat content 37
3.2.6 Total solids 38
3.2.7 Moisture content 38
3.3 Research plan 38
3.4 Physico-chemical analysis of camel milk cheese (CMC) 41
3.4.1 pH 41
3.4.2 Acidity percentage 41
3.4.3 Moisture content 41
3.4.4 Fat content 41
3.4.5 Protein content 42
3.4.6 Cheese yield 42
3.5. Texture 42
3.6 Assessment of camel milk cheese proteolysis 43
3.6.1 Urea-PAGE 43
3.6.2 RP-HPLC 43
3.7 Sensory evaluation of camel milk cheese 44
3.8 Statistical analysis 44
CHAPTER 4 ............................................................................................................................................ 47
RESULTS AND DISCUSSION 47
4.1 Chemical analysis of camel and buffalo milk 47
4.2 Optimization of processing conditions for camel milk cheese production (Study 1) 48

ix
4.2.1 Effect of parameters on camel milk cheese coagulation time 49
4.2.2 Effect of parameters on camel milk cheese yield 52
4.2.3 Effect of parameters on camel milk cheese texture 54
4.2.4 Discussion of parameters on camel milk cheese 54
4.3 Effect of parameters for composition of camel milk cheese 59
4.3.1 Effect of parameters on acidity of camel milk cheese 61
4.3.2 Effect of parameters on moisture contents of camel milk cheese 61
4.3.3 Effect of parameters on fat contents of camel milk cheese 63
4.3.4 Effect of parameters on protein contents of camel milk cheese 63
4.3.5 Discussion of parameters on chemical properties of camel milk cheese 66
4.4 Compositional analysis of camel milk cheese (Study 11) 69
4.4.1 Moisture contents of camel milk cheese 70
4.4.2 pH value of camel milk cheese 72
4.4.3 Acidity of camel milk cheese 74
4.4.4 Protein contents of camel milk cheese 76
4.4.5 Fat contents of camel milk cheese 79
4.5 Sensory evaluation of camel milk cheese 81
4.6 Assessment of Camel milk cheese proteolysis 87
4.6.1 Electrophoresis (Urea-PAGE) 87
4.6.2 RP-HPLC 88
CHAPTER 5 ...................................................................................................................................... 101
SUMMARY Error! Bookmark not defined.
RECOMMENDATION/FUTURE ASPECTS 103
LITTERATURE CITED ............................................................................................................................. 104
Appendix-1 ................................................................................................. Error! Bookmark not defined.
Appendix -11 .............................................................................................. Error! Bookmark not defined.

x
LIST OF TABLES
Table No. Title Page No.
Table 2.1 Camel breeds of Pakistan 6
Table 2.2 Provincial distribution of camel breeds in Pakistan 7
Table 2.3 Casein fractions of cow, buffalo and camel milk 8
Table 3.1 Treatment plan for camel milk cheese production 40
Table 4.1 Chemical analysis of camel and buffalo milk (%) 47
Table 4.2 Mean squares for coagulation time, yield and texture for camel
milk cheese
49
Table 4.3 Mean squares for effect of processing parameters on composition
of camel milk cheese
57
Table 4.4 Analysis of variance for moisture content of camel milk cheese 70
Table 4.5 Effect of buffalo milk, starter cultures and storage period on the
moisture content (%) of camel milk cheese
70
Table 4.6 Analysis of variance for pH of camel milk cheese
72
Table 4.7 Effect of buffalo milk, starter cultures and storage period on the
pH of camel milk cheese
72
Table 4.8 Analysis of variance for acidity of camel milk cheese
74
Table 4.9 Effect of buffalo milk, starter cultures and storage period on the
acidity of camel milk cheese
74
Table 4.10 Analysis of variance for protein of camel milk 77
Table 4.11 Effect of buffalo milk, starter cultures and storage period on the
protein content (%) of camel milk cheese
77
Table 4.12 Analysis of variance for Fat content of camel milk cheese 80
Table 4.13 Effect of buffalo milk, starter cultures and storage period on the fat
content (%) of camel milk cheese
80
Table 4.14 Mean squares for texture, flavor, taste, color and overall
acceptability of camel milk cheese
84
Table 4.15 Effect of camel, buffalo milk and starter culture on texture of
camel milk cheese during storage
84

xi
Table 4.16 Effect of camel, buffalo milk and starter culture on flavour of
camel milk cheese during storage
85
Table 4.17 Effect of camel, buffalo milk and starter culture on taste of camel
milk cheese during storage
85
Table 4.18 Effect of camel, buffalo milk and starter culture on color of camel
milk cheese during storage
86
Table 4.19 Effect of camel, buffalo milk and starter culture on overall
acceptabilty of camel milk cheese during storage
86
Table 4.20a Mean square of proteolysis for culture, buffalo milk and storage
period on α-casein of camel milk cheese (ppm)
92
Table 4.20b Mean square of proteolysis for culture, buffalo milk and storage
period on β-casein of camel milk cheese (ppm)
92
Table 4.20c Mean square of proteolysis for culture, buffalo milk and storage
period on -casein of camel milk cheese (ppm)
92

xii
FIGURES LIST
Figure Number Title Page
Number
Figure 3.1 Flow diagram for camel milk cheese making process 39
Figure 3.2 Extraction of water-soluble fraction/extract 45
Figure 4.1 Effect of two-two processing parameters on coagulation time 50
Figure 4.2 Effect of two-two processing parameters on yield % 52
Figurer 4.3 Effect of two-two processing parameters on texture (N) 54
Figure 4.4 Effect of two-two processing parameters on acidity value 59
Figure 4.5 Effect of two-two processing parameters on moisture content 61
Figure 4.6 Effect of two-two processing parameters on fat content 63
Figure 4.7 Effect of two-two processing parameters on protein content 64
Figure 4.8a Electrophoretogram of camel milk cheeses at day one 88
Figure 4.8b Electrophoretogram of camel milk cheeses after 30 days 88
Figure 4.8c Electrophoretogram of camel milk cheeses after 60 days 89
Figure 4.9 Casein standard for camel milk 93
Figure 4.10a Effect of culture, buffalo milk and storage period on α-casein
proteolysis of camel milk cheese
93
Figure 4.10b Effect of culture, buffalo milk and storage period on β-casein
proteolysis of camel milk cheese
94
Figure 4.10c Effect of culture, buffalo milk and storage period on -casein
proteolysis of camel milk cheese
94
Figure 4.11a Peptide production in CM during proteolysis after 15 days 97
Figure 4.11b Peptide production in CM during proteolysis after 60 days 97
Figure 4.11c Peptide production in CBM during proteolysis after 15 days 98
Figure 4.11d Peptide production in CBM during proteolysis after 60 days 98
Figure 4.11e Peptide production in CT during proteolysis after 15 days 99
Figure 4.11f Peptide production in CT during proteolysis after 60 days 99

xiii
Figure 4.11g Peptide production in CBT during proteolysis after 15 days 100
Figure 4.11h Peptide production in CBT during proteolysis after 60 days 100
LIST OF APPENDIX
Appendix No. Title Page No.
Appendix I Sensory evaluation performa of camel milk cheese 130
Appendix II Preparation of Urea-Page solutions 131

xiv
ABSTRACT
Pakistan share is one million heads of the world’s 20 million camel population. Although camel
is not considered the major milk source in Pakistan, it has been utilized to support the growing
demand of milk products and fresh milk. Camel cheese is gaining popularity due to their
nutritional and therapeutic potential, hence to manufacture camel milk cheese (CMC) is not an
easy task. The main problems faced by researchers and processors for camel milk cheese
production is the longer coagulation time and low yield of cheese. The hypothesis of this study
was there is a potential to increase the yield and reduce the coagulation time camel milk, and
consequently the quality of cheese, by optimizing the processing conditions. To select the
optimum processing conditions, preliminary trials were conducted using pasteurization
temperatures (60, 65, 70°C), pH (5.3, 5.5, 5.7), CaCl2 (0.04, 0.06, 0.08%) and buffalo milk (0,
10, 20%) using yield and coagulation time as criterion for the evaluation of the process’s sucess.
The whole research work was divided in two studies. In study-I, eighty one combinations of
these selected processing parameters were used for cheese production at laboratory scale, and
evaluation was done for the yield, coagulation time, texture, acidity, fat, protein and moisture
contents. It was concluded from this study that coagulation time can be reduced to 50 min and
yield increased to 20% when the milk is pasteurized at 65°C, pH is reduced to 5.5 and CaCl2 is
added at 0.06% before the coagulation of milk. The fat, moisture, proteins and texture were
16%, 65%, 17%, and 6 N respectively. Quality attributes were improved with the increase of
buffalo milk addition, but the addition of only 10% was chosen to facilitate the coagulation
process. Study-II was performed to assess the influence of starter culture for the CMC quality
attributes. Four cheese samples designated as camel (milk) cheese by using mesophilic cultures
(CM), camel (milk) cheese with thermophilic cultures (CT), camel + buffalo milk (10%) cheese
with mesophilic cultures (CBM) and camel milk + buffalo milk (10%) with thermophilic cultures
were prepared and stored at 4°C for 60 days, evaluated for physico-chemical, sensory and
proteolytic aspects. The results showed significant (p<0.01) influences for cheese samples and
storage days on the pH, acidity, moisture, protein and fat contents. The interactive effect of these
variables was insignificant (p>0.05) except the (p<0.05) pH. Results showed that highest
moisture content (70.19%) was in CM treatment whereas the lowest was found in CBT treatment
(55.19%). Lower acidity value was observed in CM (0.63%) and CBM (0.66%) compared to CT
(0.78%) and CBT (0.83%), however the more protein (21.04, 21.57%) and fat (17.65, 17.70%)
was retained in the CBM and CBT, respectively during storage. All the quality parameters
decreased significantly during storage except of acidity. Results of sensory analyses showed a
significant (p<0.01) impact of processing conditions on all sensory attributes. CBT treatment
was the preferred cheese by the panelist followed by CBM and CT. All CMC samples were
acceptable for sensory attributes up to 30 days of storage. In a proteolytic study (Urea-PAGE and
RP-HPLC) of the samples, it was noted that level of intact caseins (s, and k-caseins) were
decreased with the increase of storage time, addition of buffalo milk and thermophilic cultures. A
higher extent of proteolysis was observed in CBT followed by CBM, CT and CM. From both
studies, it is concluded that 65°C/30 min temperature of pasteurization, pH 5.5, CaCl2 0.06%,
addition of buffalo milk (10%) with thermophilic starter cultures (L. bulgaricus and Strep.
Thermophillus) produced CMC with good characteristics.
1
CHAPTER 1
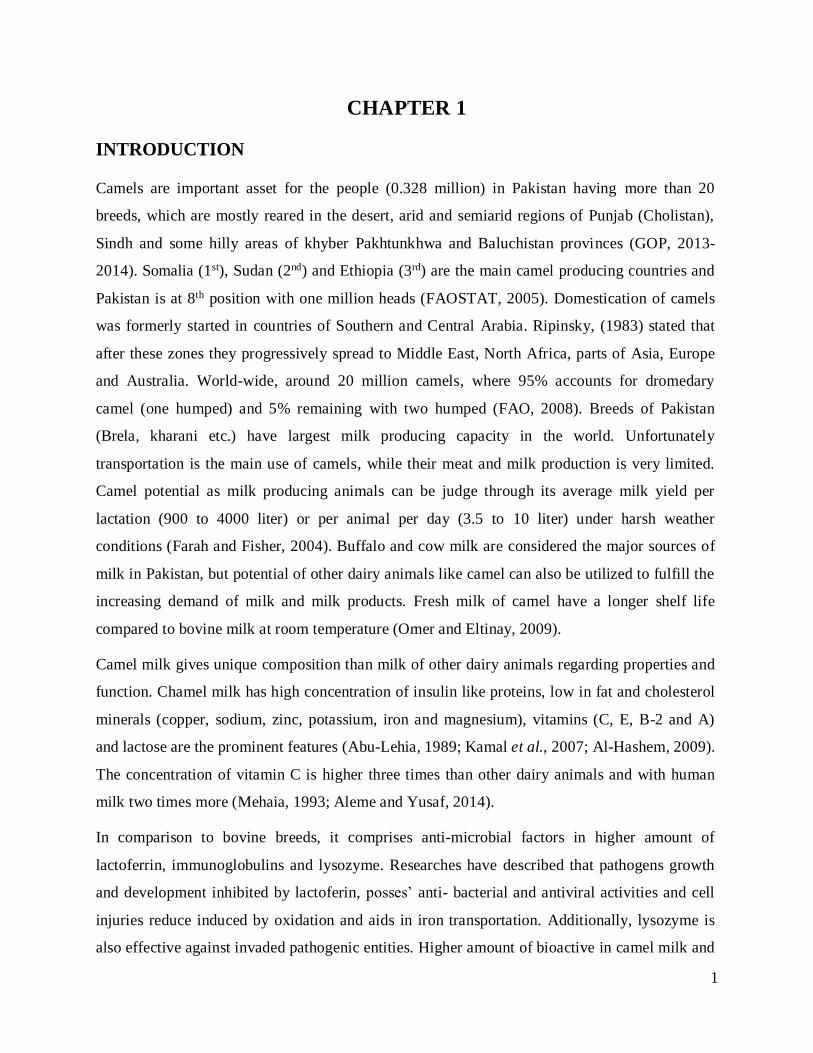
INTRODUCTION
Camels are important asset for the people (0.328 million) in Pakistan having more than 20
breeds, which are mostly reared in the desert, arid and semiarid regions of Punjab (Cholistan),
Sindh and some hilly areas of khyber Pakhtunkhwa and Baluchistan provinces (GOP, 2013-
2014). Somalia (1st), Sudan (2nd) and Ethiopia (3rd) are the main camel producing countries and
Pakistan is at 8th position with one million heads (FAOSTAT, 2005). Domestication of camels
was formerly started in countries of Southern and Central Arabia. Ripinsky, (1983) stated that
after these zones they progressively spread to Middle East, North Africa, parts of Asia, Europe
and Australia. World-wide, around 20 million camels, where 95% accounts for dromedary
camel (one humped) and 5% remaining with two humped (FAO, 2008). Breeds of Pakistan
(Brela, kharani etc.) have largest milk producing capacity in the world. Unfortunately
transportation is the main use of camels, while their meat and milk production is very limited.
Camel potential as milk producing animals can be judge through its average milk yield per
lactation (900 to 4000 liter) or per animal per day (3.5 to 10 liter) under harsh weather
conditions (Farah and Fisher, 2004). Buffalo and cow milk are considered the major sources of
milk in Pakistan, but potential of other dairy animals like camel can also be utilized to fulfill the
increasing demand of milk and milk products. Fresh milk of camel have a longer shelf life
compared to bovine milk at room temperature (Omer and Eltinay, 2009).
Camel milk gives unique composition than milk of other dairy animals regarding properties and
function. Chamel milk has high concentration of insulin like proteins, low in fat and cholesterol
minerals (copper, sodium, zinc, potassium, iron and magnesium), vitamins (C, E, B-2 and A)
and lactose are the prominent features (Abu-Lehia, 1989; Kamal et al., 2007; Al-Hashem, 2009).
The concentration of vitamin C is higher three times than other dairy animals and with human
milk two times more (Mehaia, 1993; Aleme and Yusaf, 2014).
In comparison to bovine breeds, it comprises anti-microbial factors in higher amount of
lactoferrin, immunoglobulins and lysozyme. Researches have described that pathogens growth
and development inhibited by lactoferin, posses’ anti- bacterial and antiviral activities and cell
injuries reduce induced by oxidation and aids in iron transportation. Additionally, lysozyme is
also effective against invaded pathogenic entities. Higher amount of bioactive in camel milk and

2
protective proteins improves the defensive response system which uncounter many infections
and stimulate the defense body systems (Abdel-Salam, 1996).
The casein micelles of camel milk have average diameter (260-300 nm), twice than cow milk
(130 nm) (Farah et al., 2004). Similarity of camel milk to human milk is owing to higher
concentration of β-casein and absence of β-lactoglobulin, which is the main serum protein
present in the milk of other ruminants, leading to a better digestibility. Low concentration of κ-
and α-casein is another camel milk dominating feature than bovine milk. Some recognized camel
milk proteins which have been in camel milk are serum albumin, peptidoglycan recognition
protein and α-lactalbumin (El-Agarny et al., 1992; Kappeler et al., 2004; Sharma et al., 2012).
Vitamins in camel milk act as antioxidants and are helpful in controlling tissue damages (Al-
Humaid et al., 2010). Persons can consume camel milk, having weak immunity and deficiency of
lactase deprived of any allergic signs (Kappeler et al., 2004). In brief, camel milk is invented to
bounce a high therapeutic value. The camel milk medicinal value has been exploited for curing a
number of diseases since ancient times (El-Agamy et al., 1998). Diseases like jaundice, dropsy,
asthma, tuberculosis and leishmaniasis have been treated affectedly in Kenya, Sudan, Russia and
India by fresh as well as fermented camel milk (Abdelgadir et al., 1998).
Medicinal value milk of camel suggested as having properties like anti-hypertensive activity,
anti-carcinogenic properties as well as effective against diabetes and liver disease. Moreover,
camel milk is also used for autistic and bovine milk allergic children (El-Fakharany et al., 2017).
Successfully camel milk is being utilized by the ill (elderly and infants) supportive for bone
development beacause of having different mineral contents (Mahdieh et al., 2016). There is a
belief amongst Sinai Peninsula, that any intestinal disorder can be cured by camel milk
consumption (El-Agamy et al., 2009; Beg et al., 1986; Fitzgerald et al., 2004; Agrawal et al.,
2007).
Camel milk has been suggested for consumption by the immature children being affected by
biliary atresia and inadequate breathing as it may be useful in supporting fully development of
liver and lungs (Ramet, 2001). Gastrointestinal digestive system chronic and acute ailments can
be treated with the usage of Shubat (camel milk fermented product) is also reported by
Shehadeh, (2016). Studies observed that one of the camel milk protein, which resembled to
blood insulin, do not coagulate in acidic conditions of stomach (Wangoh, 1993). This coagulum
inability formation allows to pass quickly the camel milk through the stomach in combination

3
with a perticular insulin, similar to protein and for intestinal intake availability (Beg et al.,
1986).
Fermented products and fresh camel milk are being widely utilized for remedial ingredient
against diarrhea, stomach ulcers and constipation to improve hepatic problems (Shori, 2015).
Treatment of spleen inflammation chronic hepatitis with camel milk is also reported (El-
Fakharany et al., 2012). Similar observations have been recorded in the earlier with the
improved functionality of liver with the drinking camel milk (El-Said, 2010). Freshly prepared
or preserved Shubat’s antiviral effect was also noticed in Kazakhstan related with the sialic
conjugates existence, yeasts and bacterial metabolites. The lactic acid bacteria are also
supportive for counter to pathogenic microorganisms such as Bacillus, Escherichia,
Staphylococcus and Salmonella (Farah, 1996).
Camel milk has being used successively in the traditional medicine of African nations for the
inflammation and wounds cure (Yagil, 1987). Raw milk is also used in the therapy of diarrhea,
mainly of newborn children and of peptic ulcers (Lozovich, 1995; Farah, 1996). In Russia, India
and Kazakhstan for the patients admitted in hospitals with diseases, such as T.B and diabetes are
being recommended one liter of camel milk per day as a treatment. Insulin like protein in camel
milk was recognized in 1986 (Farah, 1996). Human investigations of diabeties (type I) discribed
that half liter of camel milk daily intake, decreases average 30 percent the artificial insulin dose
by providing 52 units of insulin. Several other studies have been revealed the camel milk anti-
diabetic properties (Fitzgerald et al., 2004).
Camel milk is mainly used to nourish their Youngs and rest is taken by holder freshly or little bit
fermented or sold to consumers in big cities by mixing with buffalo milk. The popularity of pure
camel milk is very low among people due to its high acidic and salty taste. Considering the
medicinal benefits of camel milk, its acceptability can be enhanced by transforming it into
various other dairy products (Sawaya et al., 1984).
With the passage of time, the popularity of camel milk is increasing in the world. The products
like camel's milk, camel milk yoghurt, khoa (conc. milk), soft cheese, ghee (butter oil) and
butter are available in different areas like Dhanaan-Ethiopia (Eyassu, 2007), gariss in Sudan
(Warda et al.,2008 ) Kenya’s suusac (Tezira et al., 2005). There is view amongst some Asians
that ghee (melted butter) and butter cannot be manufacture by camel milk because of fat

4
globules smallar size, however few researchers efficiently established the techniques to
manufacture butter and ghee. Utmost camel milk dairy products manufactured are dahi
(yoghurt) in North Eastern Baluchistan community, Lassi (sour milk) and kurth (cheese)
(Knoess et al., 1986).
In some dry area of Pakistan where annual rain fall is very low, camel can serve as a source of
good quality milk provider as compared to other livestock animal under such harsh conditions.
Due to lack of cold chain, camel milk has no access to market. The camel milk can be conserved
in the form of cheese in these areas to sell in urban markets.
To make cheese from camel milk is not an easy task in comparasion of bovine milk due to its
lower total solids levels, unique composition of casein with lower amount of kappa casein (Farah
and Atkins, 1992). The main problems faced by the processers are the longer coagulation time,
poor texture and low cheese yield. The rennet type and concentration, pasteurization
temperature, CaCl2 concentration and selection of the starter culture have strong impact on the
cheese production and quality attributes (Farah and Atkins, 1992; Al haj and Al-Kanhal, 2010).
Inspite of such complications, attemps have been conducted to prepare camel milk cheese at
experimental scale in Saudi Arabia, semi commercial manufacturing in Mauritania and Tunisia
(Ramet, 2001). United Arab Emirate has taken lead in the commercial production of camel milk
cheese with good market response. Unfortunately in Pakistan, inspite of 8th largest camel
producer in the world, no such type of effort has been reported.
Considering the importance of camel milk and problems related with the camel milk cheese
production, an effort was carried out to produce the cheese with high yield, lower coagulation
time with more firm texture. The major objective of the study were
Optimize different processing parameters (pasteurization temperature, pH, CaCl2
and addition of buffalo) on camel milk cheese production.
To determine the impact of optimized processing conditions on different aspect of
camel milk cheese quality
Assess the effect of thermophilic and mesophilic (starter) cultures on camel milk
cheese quality.

5
CHAPTER 2
REVIEW OF LITERATURE
Cheese can be prepared from buffalo, cow, goat and sheep as well as camel milk to add varieties in
cheese family. It has been described that mostly fresh camel milk is used for consumption.
However, some traditional products are being produced include fermented milk, soft white
cheese, yoghurt, ice cream and butter from camel milk. A thin, fragile, soft textured yoghurt and
cheese have also produce from milk of camel (Al haj and Al Kanhal, 2010). Cheese has diversity
in flavor and texture throughout the world. Roughly, less than half of milk production being
consumed for cheese business to preserve most valueable milk constituents like casein, calcium, fat and
phosphorus (Adda et al., 1982; Fox et al., 2000). Review of literature regarding the camel milk
and its transformation into cheese is described under following headings to support the current
study;
2.1. Camels in Pakistan
2.2. Composition of camel milk
2.3. Nutritional and functional properties of camel milk
2.4. Camel milk transformation
2.5. Factors affecting the camel milk cheese preparation
2.6. Changes occurring during cheese storage
2.1 Camels in Pakistan
Camels are the most adepted and main animal specie that can stay alive and remain productive in
hot, harsh and deserted environmental conditions. Camels in Pakistan, are mainly reared by
migratory tribes in subsistence system of production except for some producers of fertilied lands
and a minor sum are utilized for transport (Abbas and Tilley, 1990; Schwartz, 1992; Afzal and
Naqvi, 2003).
Mainly camels are reared for meat, milk, hair, hide and wool production, coupled with sport
(racing, dancing) and as riding animal for the individuals residing in the wide-ranging deserts.
Leather products like ropes and cloths are made by their hides (Snow et al., 1992; Kohler-
Rollefson, 1992). Names and characters of some Pakistani camel breeds are described in Table
2.1 while province wise distribution of camels is given in Table 2.2.

6
Table 2.1 Camel Breeds in Pakistan
Breeds of
Camel
Usage
Type
Major Areas Weight of
Adults
Maturity
Age
(year)
Milking
Yield
(lit/lact)
Length
per
Lactation
(days ) M ale Female
Lassi Baggage and Riding Adjoining areas of Lasbella district
in Sindh and Balochistan
57 551 3.8 1306 301
Makrani Transportation and
Baggage
& milk
Makran, Kharan, Lasbella,
Thalwan, Karachi and Dadu
660 671 3.9 1929 519
Pishin Baggage Surroundings of Pishin and Quetta 716 701 4.2 1721 354
Rodbari
Water lifting and
Transportation
from underground
Gwadar, Pasni, Turbat, Daska,
Kappar, Punjgur and Khuzdar
721 706 3.1 1694 467
Khader Transportation Range lands of D.G. Khan 686 671 3.7 1657 451
Maya Riding Hilly areas North Western NWFP,
Waziristan
731 721 3.1 1519 481
Morecha Riding, loading and
Milk
Bahawalpur, Rahimyar Khan,
Bahawalnagar and adjoining areas.
656 636 3.8 4178 478
Kharai Loading, Riding and
Milking
Thatta, Mirpur Sakro, Sujawal,
Karachi and Badin 621 601 3.6 1834 321
Sourced from (Isani and Baloch, 2000)

7
Table 2.2 Provincial distribution of camel breeds in Pakistan
Province % age Breeds
Balochistan 41.2% (7 breeds)
Punjab 21.6% (5 breeds)
Sindh 30.2% (4 breeds)
KPK 6.9% (4 breeds)
(Isani and Baloch, 2000)
The lactation period of she camel is 12 months, if not conceived in second year still produce
milk. Lactating camel’s milking can be performed three times a day, producing approximately
six liters of milk per day in dry season and more in the raining season. This milk is sold in minor
volumes or circulated as a gift to neighbours. Considering potential of camel than cows reared
under the same dry weather and feed situations, it is appeared higher (Faye, 2005). The camel
milk physico-chemical properties changes with the fodder type and intake of water (Khodaie,
2002). Farah (1996) reported that variations in season bring changes in camel milk production
most of the milk is produced in showery wet season.
2.2 Composition of camel milk
2.2.1 Protein
The protein contents of camel milk ranges from 2.14 to 4.80 %. Variation in protein contents is
due to the difference in breeds (Mehaia et al., 1995). The concentration of protein is low in
summer (August, 2.5%) and higher in winter (3%) (Konuspayeva et al., 2009; Haddadin et al.,
2008). Proteins of milk are catagorized in the main two groups, casein and whey proteins.
a. Casein
Casein is the major part of camel milk protein and containg (Dromedary) 1.63 to 2.76 % casein
protein which is the 52-87 % of total proteins of milk (Khaskheli et al., 2005). The higher
concentration of β-casein (-CN) with low concentration of α-casein (-CN, -CN) and κ-casein
8
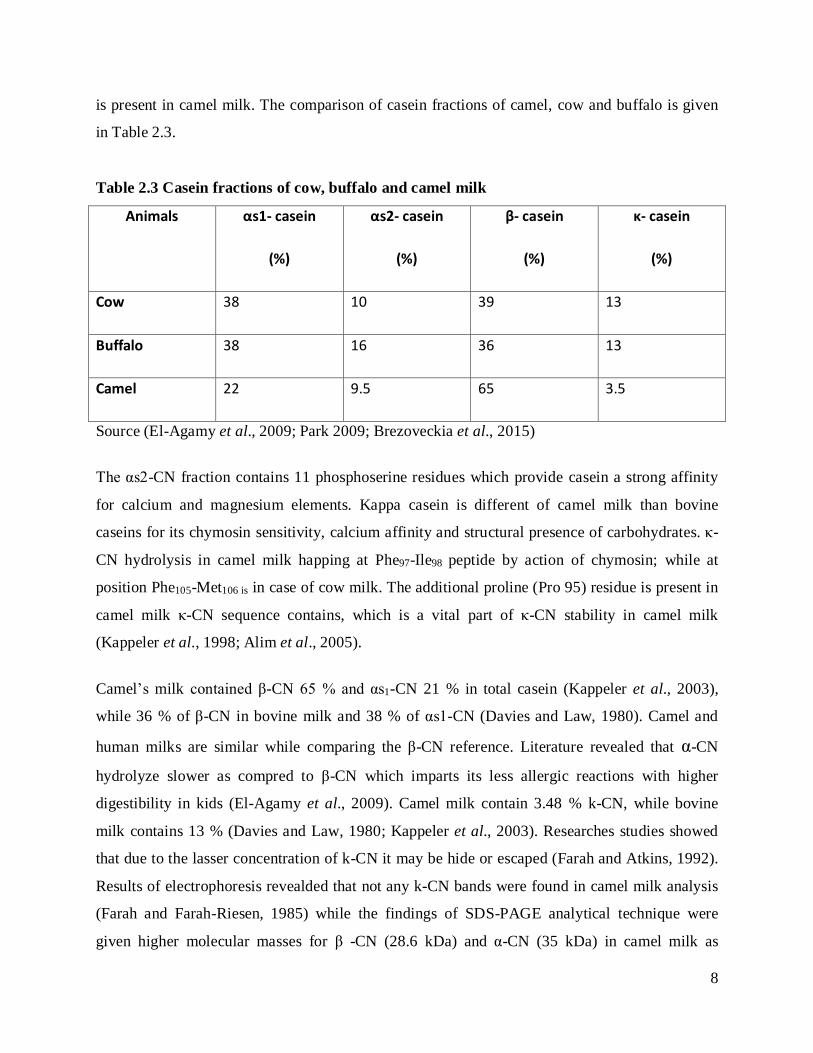
is present in camel milk. The comparison of casein fractions of camel, cow and buffalo is given
in Table 2.3.
Table 2.3 Casein fractions of cow, buffalo and camel milk
Animals αs1- casein
(%)
αs2- casein
(%)
β- casein
(%)
κ- casein
(%)
Cow 38 10 39 13
Buffalo 38 16 36 13
Camel 22 9.5 65 3.5
Source (El-Agamy et al., 2009; Park 2009; Brezoveckia et al., 2015)
The αs2-CN fraction contains 11 phosphoserine residues which provide casein a strong affinity
for calcium and magnesium elements. Kappa casein is different of camel milk than bovine
caseins for its chymosin sensitivity, calcium affinity and structural presence of carbohydrates. κ-
CN hydrolysis in camel milk happing at Phe97-Ile98 peptide by action of chymosin; while at
position Phe105-Met106 is in case of cow milk. The additional proline (Pro 95) residue is present in
camel milk κ-CN sequence contains, which is a vital part of κ-CN stability in camel milk
(Kappeler et al., 1998; Alim et al., 2005).
Camel’s milk contained β-CN 65 % and αs1-CN 21 % in total casein (Kappeler et al., 2003),
while 36 % of β-CN in bovine milk and 38 % of αs1-CN (Davies and Law, 1980). Camel and
human milks are similar while comparing the β-CN reference. Literature revealed that α-CN
hydrolyze slower as compred to β-CN which imparts its less allergic reactions with higher
digestibility in kids (El-Agamy et al., 2009). Camel milk contain 3.48 % k-CN, while bovine
milk contains 13 % (Davies and Law, 1980; Kappeler et al., 2003). Researches studies showed
that due to the lasser concentration of k-CN it may be hide or escaped (Farah and Atkins, 1992).
Results of electrophoresis revealded that not any k-CN bands were found in camel milk analysis
(Farah and Farah-Riesen, 1985) while the findings of SDS-PAGE analytical technique were
given higher molecular masses for β -CN (28.6 kDa) and α-CN (35 kDa) in camel milk as

9
compare to bovine milk (24 kDa and 22-25 kDa respectively) as reported by Eigel et al. (1984);
Farah (1996); Mohamed (1990).
Kappeler et al., (1998) determined the sequence of amino acids in camel milk caseins. The
amino acid number in 4 caseins were found as αs2-CN 178, αs1-CN 207, β-CN 217 and k-CN
162. The findings discribed that sequence of camel milk casein is similar to bovine milk with
very minor variations. More differences were noticed in the arrangement of αs1-CN’s primary
structure, while secondary structure of camel milk resemblance with bovine casein. Regarding
the amino acids, cystine and glycine were present in less quantity in Dromedary camel milk
casein as compare to bovine milk (Farah and Ruegg, 1989).
Hinz et al. (2012) performed Urea-PAGE and Two-dimensional gel electrophoretogram analysis
and found 5 variant κ-CN isoforms in milk of camel in comparison with bovine, caprine and
ovine milk κ-CN and also observed the slowest migration of camel milk β- and αs1-CN than
other milk samples. According to them the net-negative charge on the proteins was the main
reason behind this. The similar findings were noted by El-Zubeir and Jabreel, (2008); Saliha et
al. (2013) during milk of Dromendary analysis using anion exchange chromatography.
Omer et al. (2016) performed analysis of proteins of camel milk on capillary electrophoresis and
found that highest concentration of β-CN (12.78 ± 0.92 mg mL−1), then α-CN
(2.90 ± 0.28 mg mL−1) although single small share (1.68 ± 0.02 mg mL−1) of κ-CN represented
in casein. The findings were also confirmed by SDS-PAGE.
b. Whey proteins
Milky white colored whey is separated from camel milk in cheese making after coagulation
while greenish whey is produced after coagulation from bovine milk (El-Zubeir and Jabreel,
2008; Saliha et al., 2013). Enlightened camel milk whey behavior may be due to the scattering of
light from boosted level of tiny fat globules and caseins particles (Mohamed and Larsson-
Raznikiewicz, 1990). Dromendary camel milk whey proteins constitute 20 to 25% of total
protein which gives it the following leading protein fraction after casein protein. Whey protein of
camel milk was in the range of 0.64 to 0.81% (Khaskheli et al., 2005; El-Zubeir and Jabreel,
2008). Buffalo milk whey protein is somehow altered from whey proteins of milk of camel, as
the -lactoglobulin (β-lg) doesn’t present in camel milk, that make its similarity with the milk of
10
human (El-Agamy et al., 2009). Due to the trace fractions or absence of β-lg and -lactalbumin
(α-lb) of total whey protein comprises the major camel milk whey protein. While 25% is -lb
and 50% of β-lg made the total and main bovine milk whey protein (Laleye et al., 2008;
Kappeler et al., 2003).
Peptidoglycan recognition protein, serum albumin, lactoferrin, immunoglobulins are the some
other components present in camel milk whey protein (Merin et al., 2001; Kappeler et al., 2004).
Lactoferrin iron retention by diverse sources of milk happens at low pH (<3.1-4.2), while it is
discovered that camel milk lactoferrin iron drops as of its N-lobe at 3-4 pH andas of its C-lobe at
pH 6-7 (Kappeler et al., 2003; Khan et al., 2001).
Enzymatic hydrolysis and antioxidant potential of α-lb in camel milk has been studied by Salami
et al. (2009). They revealed that compared to bovine milk α-lb, camel milk revealed the higher
digestibility with both trypsin and chymotrypsin enzyme, but sensitivity was alike of both
proteins towards pepsin. Camel α-lb shows high antioxidant activity than bovine α-lb, containing
more antioxidant amino acids residues coupled with the conformational variations in these two
proteins.
2.2.2 Fats
Fat level of milk of camel widely varies from 1.3 to 6.5% with average 3.5 ±1.0%. During a
study it was noted that contents of fat drastically lowed or decreased from 4.0 to 1.2% in the
camels dehydrated milk in hot season (Haddadin et al., 2008; Konuspayeva et al., 2009). A
practical relationship is present among protein and fat contents in the milk of camel (Haddadin et
al., 2008).
Milk fat of camels have a low carotene amount and less concentration of fatty acids of shorter
chain than bovine milk (Yagil ,1982; Stahl et al., 2006) however high in polyunsaturated fatty
acids, with a higher ratio of omega 3 and omega 6 in comparison to the milk of cow (Yagil
,1982). In contrast to theses the higher amount of fatty acids with long chain observed in milk of
camel than milk of bovine fat. Similary, percentage (43 %) of fatty acids with unsaturation
particularly found higher percentage of essential fatty acids in milk of camel (Sawaya et al.,
1984; Abu-Lehia, 1989; Haddadin et al., 2008) although unsaturated fatty acids highest amount
was found in milk of human. Already it is discovered, the saturated fatty acids quantity in milk

11
fat of camels was 68.1% that are lesser as compared to milk of bovine (69.9%) saturated fatty
acids (Konuspayeva et al., 2009).
Fat cholesterol contents of milk of camels (35.1 mg 100 g-1) were reported as larger in amount
(26.13 mg 100 g-1) than fats of bovine milk (Konuspayeva et al., 2009; Gorban and Izzeldin,
1999). Similarly found that fats of camel milk have higher melting and solidifing temperature
(41.8 ± 0.8°C and 31.6 ±1.9°C correspondingly) in comparison to milk fats of bovin (31.9
±2.1°C and 23.1 ±1.7°C correspondingly). The importance of milk fats of camel is that the
presence of low quantity of fatty acids with short chain (C4-C12) and a higher long chain
quantity with fatty acids number (C14-C22) than milk fats of bovine (Rüegg and Farah, 1991;
Haddadin et al., 2008). The production of butter from cream of camel milk required a high
temperature for churning (20ᵒC - 26°C) than milk of bovine butter manufacturing temperature
(9°C-13°C) (Ramet,2001). Traditional methods are facing some difficulties in extracting camel
milk fat during churning of cultured milk probably due to the bounding of fat globules with
proteins of milk in camel (Rüegg and Farah, 1991; Khan and Appanna, 1967).
2.2.3 Lactose
Milk lactose contents of camel ranged between 2.39 to 5.79 % (Rüegg and Farah, 1991;
Konuspayeva et al., 2009). The type of vegetation in deserty regions may be the considerable
feature for broad disparity in milk lactose contents. Generally halophilic plants like Acacia,
artiplex and salosa alike to eat by camels to accomplish their biological salts requirement. Thus
milk of camels is frequently described as sweet, saltish or even unpleasant. Researchers studied
that lactose contents are least varied by lactation time and under hydrated or dehydrated
conditions of animal. However, varietal difference in breeds can cause slight variation in lactose
contents (Yagil and Etzion, 1980; Elamin and Wilcox, 1992; Al haj and Al Kanhal, 2010).
2.2.4 Mineral matter
The amount of minerals present in milk is included in the ash contents which varies 0.59 to
0.89% in milk of dromedary camels (Al haj and Al Kanhal, 2010; Konuspayeva et al., 2009).
Variations in breed, feeding, water intake and analytical procedures are responsible for the
variation in the ash contents (Mehaia et al., 1995; Haddadin et al., 2008). The average amounts
for potassium, calcium, sodium, magnesium, zinc, iron and manganese were 156, 114, 59, 10.5,

12
0.53, 0.29 and 0.05 (mg./100 g) respectively in the milk of dromedary camels (Sawaya et al.,
1984; Miller, 1996; Raziq, et al., 2011; Sanayeia et al., 2015).
The taken feed by camels like artiplx and acacia, normally have higher salts quantities, regarding
this milk of camels is made-up to have the good chloride contents (Raziq, et al., 2011; Khaskheli
et al., 2005). The depletion in some milk constituents with elevated level of chloride in obtained
milk from thirsty camels could be another reason of its saltish taste. Mineral (potassium, sodium,
copper, manganese and iron) contents in milk of camels have been described to be domenatly in
high amounts as comparison of milk of bovine (Sanayeia et al., 2015). This is well known about
the iron is involved in different biological processes, like transportation of oxygen with the
synthesis and storage of deoxyribonucleic acid.
2.2.5 Vitamins
Rich amount of vitamin C, pantothenic acid, folic acid, niacin (B3) and cobalamin (B12) is
present in camel milk, while vitamin A and riboflavin (B2) is lower than bovine milk. White
color of milk of camel is well illuminated with the carotene lower levels. However thiamin (B1),
pyridoxine (B6) and vitamin E are comparable with bovine milk (Sanayeia et al., 2015; Stahl et
al., 2006; Haddadin et al., 2008). More (3-5 times) vitamin C was discovered in camel milk as
compare to bovine milk. Therefore, fruits and vegetables are hard to access in desert areas, milk
of camels can be utilized effectivly as a vitamin C substitute. The average vitamin C amount is
34.16 mg. L-1 present in camel milk. USDA (2009) recommended that 250 mL of milk
dromedary camel sustain an ordinary person by giving 15.6% of B12, 10.5% of vitamin C,
8.25% of B2, 5.25% of vitamin A, pyridoxine and B1 of the RDI than 250 mL bovine milk gives
an average of 43.5% B12, 3.5% vitamin C, 36% B2, 9% vitamin A, 11.5% B6, and B1 of the
RDI.
2.2.6 Other minor constituents of camel milk
Camel milk contains immunoglobulins (Igs) including unique subclass of IgG2 and IgG3 that are
special to camels, resembles with human Igs in structure but shorter in size. Being small in size,
they can penetrate more easily into tissues and organs to fight infection and help in repair, where
even human antibodies cannot (Ramet, 2001). Mullaicharam (2014) reported that camel VHH
(camelid heavy-chain antibody) areas are well-matched to enzyme inhibition than antibody

13
fragments of humans hence more effective against viral enzymatic neutralization due to its
smaller size. Concentration of Ig-G in camel milk is higher (1.59 mg / mL) in comparison with
buffalo, cow, goat, human milk, sheep, and (0.63, 0.67, 0.70, 0.86 and 0.55 mg. /mL
correspondingly). Concentration of Ig varies in milk with species, animal health status and stage
of lactation (Ramet, 2001; El-Agamy and Nawar, 2000).
Comparative research carried out to find the lactoferrin (LF) amounts in buffalo, camel, cow,
donkey, sheep, mare, goat and human milk by El-Agamy and Nawar (2000). Investigation
revealed that significantly various amounts of LF was observed. The LF contents in human milk
were reported was higher (1.8 mg. /mL), while the lowest level was observed in donkey milk
(0.08 mg. /mL). However LF contents of camel milk (0.23 mg. /mL) stood considerably higher
than goat, sheep, buffalo and cow milk. Second day after parturition higher contents of LF (5.2
mg. /mL) were noted in colostrum milk of camels in comparison to bovine colostrum. However
at 30th day of parturition, the drop in LF content in camel milk was observed while this value was
higher than bovine milk (El-Agamy et al., 1996; Abd El-Gawad et al., 1996). El-Agamy and
Nawar (2000) and Kappeler et al. (1998) reported that ended period of lactation camel milk have
0.22 mg. mL-1 LF contents.
El-Agamy and Nawar (2000) examined the lysozyme in milk of camel and notices the bovine
and camel milk lysozymes antigenically did not resemble, although having comparable
structures. The lysozyme concentration extensively differs depending on species ranging from 78
mg. /100 mL in mare milk and 14 μg. /100 mL in buffalo milk. While camel milk contains
higher amount (231 and 501 μg. /100 mL) of lysozyme than (14 and 38 μg. / 100 mL) in buffalo
(Korhonen, 1977). Observed differences in the amounts could be owing the difference in period
of lactation (El-Agamy et al., 1996; Duhaiman, 1988; El-Agamy et al., 1998).
Lactoperoxidase (LPO) present in camel milk is a monomeric protein, which shows its similarity
(79.2%) to human eosinophil peroxidase and (79.3%) human myeloperoxidase (Kappeler, 1998).
LPO of bovine were having high molecular weights (88 kDa) than camel milk (78.1 kDa)
(Ramet, 2001;Yoshida and Ye, 1991).
2.3 Nutritional and functional properties of camel milk

14
Nutritionally, 1 cup of camel milk (245 mL) can provide 157-159 Kcal energy and 2,000 to
2,200 Kcal can be fulfilled with 3- 4 L of milk. Similarly, 2 L of camel milk can meet the daily
protein needs of a person and about 1L of camel milk can easily accomplish the daily
requirements calcium or phosphorus (800 mg). Vitamin C requirement of a person (61 mg./ day)
can be fulfill by 1.5 L milk of camel. Similary with the essential amino acids requirements
(Podrabsky, 1992).
Camel milk’s medicinal properties propose due to having proteins with protective action, play a
part for improving mechanism of defensive immune system. The milk of camel showed
inhibitory effects toward both Salmonella Typhimurium, Escherichia coli (gram negative) and
Listeria monocytogenes, Staphylococcus aureus (gram positive) due to its high concentrations of
antimicrobial compounds such as Igs, LF, and lysozyme (Benkerroum et al., 2004; Podrabsky,
1992).
Milk of camel amusingly contains insulin like protein or insulin, not damaged though passing the
stomach. Studies shows that rats fed on camel milk for thirty day can significantly reduce the
blood glucose level, urea, uric acid, creatinine, lipid profile and alkaline phosphetases (ALP).
Experiment showed that daily intake of camel milk can reduce about 30-40% daily insulin
requirements in more than 90% patients. Milk of camel could be utilized as an insulin cure in
controlling diabetes and affective against type I diabetes in using milk in raw form (Agarwal et
al., 2005; Agrawal et al., 2011; Mullaicharam, 2014: Arab et al., 2015).
Milk of camel can be attributed effective against food allergies owing to lack the allergens which
are much active in the milk of cows. Also lacking in β-lg, while more β-CN is present.
Additional existence of Igs that resembled milk of camel to milk of mother, that is lessens in
reactions of allergies in kids along with builds up their coming reaction to the foods (Merin et
al., 2001; Beg et al., 1986; Shabo et al., 2005).
It was found in a research work that camel milk ceases tumor cell lines HepG2 and MCF7 and
activates apoptotic pathways through intrinsic and extrinsic proliferation (El-Fakharany et al.,
2012). Camel casein and LF were reported to induce apoptosis and reduce the viability of tumor
cell lines (Korashy et al., 2012; Kontou et al., 2011; El Miniawy et al., 2014). Camel milk is
capable of anti-oxidative and anti-inflammatory activity checked by using apoptotic marker
against inflammatory bowel diseases (IBD), proved efficient with nominal side effects. Milk of

15
camel has been investigated act like a curative agent against hepatic injury and colon injury with
boosting the antioxidant protection (Arab et al., 2015; El-Farharany et al., 2008).
2.4 Camel milk transformation
The milk of camel has never been estimated for its value or appreciated accurately as it deserve.
Camel milk has been consumed raw or as a naturally fermented product. It has been reported by
households that milk of camel can be reserved as safe for drinking till one weak at abmiant
temperature (Ramat, 2001; Suliman and El Zubeir, 2014). Its shelf life is far lengthier than the
raw milk cow i.e 24-48 hours. Transforming raw milk of camel into products like pasteurized
and fermented milk will consequently be of pronounced value addition for holders at smaller
scale to market their products of milk (Rehmat, 2001). Mauritania and Saudi-Arabia are now
industrially pasteurized the raw milk of camel. Problem rose with heating of camel milk readily
flocculate even at low temperature. Many socio-economic and ecological issues contributed
pasteurization a difficult task of camel milk in desert areas (Bruntse, 2002; Abeiderrahmane and
Reed, 1993).
Moreover, fermented milk products of camel have an extensive shelf life as compred to raw fresh
milk (El Zubeir and Marowa, 2009; Rehmat, 2001; Suliman and El Zubeir, 2014). Some
fermented traditional milk products of camel, consumed through out the world like Shubat in
Kazakhstan (Thapa, 2000), Lehban in Syria and Egypt (Wernery, 2003), Kefir in Caucasian,
Suusac in Kenya (Tezira et al., 2005), Dhanaan in Ethiopia (Eyassu, 2007), Gariss is common in
Sudan, Tarag, and Unda in Mongolia (Yagil, 1982), Susa in North-Eastern Africa prepared by
incubation of milk in smoked sanitized wooden buckets. Most of these fermented camel’s milk
products are produced to utilize the surplus amount of milk (Dirar, 1993; Bruntse, 2002).
The appearance of fermented camel milk is fragile with soft coagulation. Investigations
revealeded in Kenya and noted that the "Susa" quality may be upgraded by utilization of spacific
(mesophillic) starter cultures instead of natural fermentating bacteria. The new product favored
by Somalians than old-style product (Farah, 1996; Attia et al., 2001). The method of traditional
fermented camel milk products are manufactured from boiled milk for bacterial descruction,
afterwards cool down at room temperature and small quantity of previously fermented milk was
added as a starter, mixed well and kept overnight at ambient temperature. After 10 to 12 hours

16
curd is formed with sour taste and typical flavor of fermented milk (Ramat, 2001; Bruntse, 2002;
Suliman and El Zubeir, 2014; Al haj and Al Kanhal, 2010).
2.5 Factors affecting the camel milk cheese preparation
Camel milk cheese is not easy to make in the normal circumstances than milk of other ruminants.
The main difficulties encountered in processing of cheese from camel milk are the weak curd
and low yield. The cheese yield potential depends on the concentration of components in milk
which varies with species, breed, stage of lactation, age, seasonal changes in climate, type of
feed, health conditions, especially mastitis, and milking procedures. Among the milk
components the percentage of casein to fat are major determinants of cheese yield. To overcome
these problems efforts have been made by changing the processing parameters (Al haj and Al
Kanhal, 2010). Factors and processing conditions which affect the yield of cheese quality are
being discussed below;
2.5.1 Standardization
Protein and fats are the main components of milk that effect the quality and yield of cheese.
Although protein contents of milk is little bit more stable than fat contents hence these
variations are minimized to some extent in bulked milk from numerous cultivates. The
preparation of cheese varieties are lessened further by milk fat and protein content
standardization.
To get consistency in composition standardization of milk may done on the bases of whole
protein or casein - fat ratio (C/F) to meet the standard for a particular cheese (Guinee et al.,
2007; Farkye, 2004). For the milk standardization C\F ratio, the incorporation of powderd skim
milk, milk protein concentrate, consolidated skim milk or caseinate or fat or cream removal are
generally adopted. In stead of these cream addition improves contents of fat in cheese milk.
Suggested ratios 0.92 C/F for the production of cheese by Farkye, (2004) may gives good
results.
Other than protein and fat, milk calcium also play significant role in cheese making. The
reduction in calcium content in low fat cheese resulted by milk pre-acidification effect on the
chewiness and whiteness. These quality attributes are also inclined by interactions of protein-

17
protein. The bounding (colloidal, ionic) nature of the calcium in cheese is also significant in
comparision with whole content of calcium. The casein bonding (micellar calcium and micellar
calcium phosphate) has an impact on the cottage cheese water-soluble and insoluble calcium
equilibrium which persist naturally (Metzger et al., 2000).
A massive convergent is reported in the water level, total solids, ash, fat, protein, and minerals
such as Ca, Na, Zn and K. (Alwan and Zwaik, 2014). It is documented that the concentration of
fat in milk of camel is comparable to cow’s milk, varying between 3.2 and 3.8 %. However,
about half amount of fat is vanished with whey in the cheese making procedure from camel milk.
The loose casein network matrix of camel milk allow fat globule to pass through the curd,
leading to lower cheese yield and quality (Farah, 1996). It is reported by Yagil and Etzion,
(1980) that in drought conditions, the contents of fat in milk of camel decreased from 4.4 to
1.2%.
Regarding these facts, the total solids and fat contents are maintained to ensure acceptable taste
and textural properties of cheese. A number of methods have been used for this purpose like
increasing casein concentration, evaporation of milk, ultra-filtration, adding milk powder and
addition of fresh milk of other animals. Mixing camel milk with buffalo milk increased the soft
cheese yield, total solids, fat, ash, protein contents and recovery of milk constitutes. Blendind
milk of camel with milk of buffalo also enhanced the microbiol quality with organoleptic
properties of resulting cheese. These improvement are directly associated with the level of
mixing of buffalo milk (Ramet, 2001; Inayat. et al., 2003; Shahein et al., 2014; Brezovecki et al.,
2015). The cheese composition from camel milk may have to fulfill the existing regulations by
controlling fat content of the camel milk before coagulation. The further draining and ripening of
the curd can be adjusted by controlling the dry matter content (Ramet, 1987; Mehaia, 2006).
2.5.2 Pasteurization
Milk microbiology in cheese manufacturing is an important matter that affects the finally
produce product that can be controlled by pasteurization. Jonson and Law (1999) stated that
pasteurized milk is preferred in comparison to raw milk for cheese making. Mostly to kill all
pathogenic and a portion of nonpathogenic organisms before further processing into cheese
pasteurization is preferred. For cheese making pasteurization of milk is possible reduce
microbial contents, assuring high surprising yield coupled with higher temperature aging and

18
quality (Salwa and Galal, 2002). Plate heat exchanger pasteurization with normal time
temperature relations of 72o C for 15 seconds in holding tubes is standard practice to eradicate
pathogens (Remat, 2001; Maubois, 2002).
In another study Farah et al. (2004) stated that camel milk losses its ability to coagulate at
pasteurization above 65°C. Ramet (2001) explained that milk thermalize at 62°C/01min or
pasteurize at 72°C/01 min is being considered of superior quality regarding microbial
stabilization. The findings show that clotting and draining ability of milk was gradually reduced
when high conditions of heat treatment were adopted. A progressive increase in the time
temperature resulted in the development of the coagulum due to heat denaturation, improves
water binding capacity of the whey proteins and subsequently moister, crumbly and brittle curd
formed with more losses of dry matter in the whey. So regarding this fact it is required to control
the camel milk heat treatment to retain the total solids content in the cheese. It was concluded
that for soft or fresh camel milk cheese, low pasteurization temperature (72 - 76°C for 15 - 30s)
should be applied, while thermalizing temperature (62°C for 01 - 02 min) can be applied for semi
hard and hard type cheese.
In many areas of world, the unpasteurized milk utilization is still in practice for cheese
production. However cheese processing from unpasteurized milk having high bacterial count
of non-starter than to pasteurized milk processed for cheese with superior in functionality but
body and texture are similar (Farkye, 2004).
Various authors reported that the camel milk heat stability is different from cow’s milk owing to
the deficiency or absence of κ-CN and β-lg (proteins) in milk of camel which could be a reason
of its reduced high temperatures stability while these proteins have a vital role in the heat
stability of bovine milk while in contrast the whey protein (α-lb) of camel milk showed higher
heat stability as compred to the milk of cow (Farah, 1996; Ramet, 2001).
Results of Al Haj et al. (2011) related that low stability with heat of camel milk protein with k -
CN and calcium content. Furthermore, camel milk belongs to type A milk and has 2 stage protein
coagulation. Results of study exhibited that the camel milk could be converted from type A to
type B and eliminate its minimum heat stability by adding k -CN or EDTA. Results also revealed
that increase in pH is beneficial for camel milk heat stability; however, very small change in pH
could result in large effect on protein heat stability. Camel milk can be sterilized if the pH
increased or certain additives such as phosphate are added. Cheese rheological properties from

19
high temperature heated milk to can be enhanced by 0.001% calcium chloride addition
(Farah, 1996; Gosh and Sing, 1990).
Although camel casein is accessible to chymosin but limited availability of k-casein milk of
camel could be a possible explanation of poor stability with heat. Tayefi-Nasrabadi et al., (2011)
also described the low stability with heat of Lactoperoxidase present in camel milk as compared
to milk of bovine. Generally it is recommended that pasteurization treatment of camel milk prior
to processing into cheese improve the hygiene and gives better results.
Soluble calcium and phosphate, as well as the colloidal calcium phosphate (CCP) levels plus the
nature of their binding to casein might affect the heat stability. Among the other influencing
factors of milk heat stability which unknown in camel milk are the forces which contribute to the
integrity of casein micelles such as hydrophilic bonding, electrostatic interaction and disulphide
bonding (Farah, 1996).
Al-Saleh (1996) studied the heat coagulation time and whey proteins heat denaturation of milk
cow and camel and heated at 63, 80 and 120°C for 30 min for nitrogen determination and
concluded that lower non-casein nitrogen was found in milk of camel than milk of cow after
heating up to 90°C but found more heat stable whey proteins in the milk of camel than milk of
cow.
Heat treatment adversely effect on camel milk by lowering casein contents and dry matter than
bovine milk. Cheese making capability of camel milk is further reduces in the hot season with
shortage of food and water. For better results such milk should not be heated to avoid further
reduction of its cheese making capability. Considering economical and hygiene risks, poor
quality milk should be rejected in comparison with higher total solids and casein content for
processing, which would affect the yield, taste, texture and quality of the final product (Ramat,
2001).
2.5.3 Pre-acidification
Acid production is the compulsory operation in the manufacturing of most of the cheese kinds.
Suitable dose and acidification time is the vital phase in the production of cheese with high-
quality. Controlled acidification inhibit the spoilage and pathogenic organisms growth, disturbe
the coagulantion activity during processing, aging then dissolved calcium phosphate colloides,
ultimately influence the texture of cheese, stimulates syneresis which later determine cheese

20
structure. The extent of activation of enzyme, eventually affects the quality and flavor cheese
(Fox et al., 2000; McSweeney, 2007).
Use of lactic acid or citric acid or GDL (glucono-6- lactone) (direct acidification) may also be
used as another method for organic acidification. Biological acid production is much complex in
application than direct acid production. Consequently consistent and quick processing time,
enhanced moisture retaining, specific pH control, variability and reduces culture overhead. The
starter bacteria play very important role in cheese ripening, in addition to acidification. Acid
production with chemical agents is used in cheese variety in which texture is more significant
than flavor (Fox et al., 2000; McSweeney, 2007).
Cheese manufactured with culture addition had lower melt ability than manufactured with direct
acid production. Very soft pizza cheeses were manufactured with acid production at pH 5.6 in
milk due to the acid production in milk changes the cheese inorganic matter (Shakeel-ur-
Rehman, 2004) and effects in fractional CCP loss from micellular casein into the serum of milk
and is then drained with whey. Meltability improves by calcium loss from cheese, increased
proteolysis because of inproved retention of coagulant (Farkye and Fox, 1990; Lucey and Fox,
1993). At pH 6.0, the gel strength increases at maximum and lowering pH decreases the gel
strength and affect meltability (Jen and Ashworth, 1970).
The optimal activity of milk clotting enzymes (acid proteases) is near to 5.5 pH. Previous
findings showed that pH of raw milk of camel varies from 6.55 to 6.85, depending on
environmental factors. This pH value is not mostly beneficial for good clotting. It is thus
recommended to acidify the camel milk slightly before the enzyme addition for cheese making.
Decreasing milk pH from 6.66 to 6.40 decreases 28 % clotting time and further 70% reduces by
the addition of rennet (Farah, 1993; Ramet, 2001).
Farah et al. (2004) concluded that camel milk coagulate at pH near 5.5 while fresh milk have pH
between 6.6-6.8 so it is better to lower the initial pH for good curd formation. Many studies
reported that reduction in the pH (5.6) with temperature up to 42°C reduces the coagulation time
of camel milk (Farah, 1993; Mehaia et al., 1995; Siboukeur et al., 2005). Reduction in the pH
might be the resulted in development of the process of neutralization in charge and secondary
phase structural changes happining in coagulation while aggregation rate of the micelles

21
improves with the increase in temperature and hydrophobic interactions formed gel network
(Farah, 1993; Siboukeur et al., 2005).
Cheddar cheese texture, composition and microstructure has been studied by changing the milk
pH at rennet addition time. Cheddar cheeses were prepared by pre-acidification to 6.7, 6.5, 6.3
and 6.1 pH. The dense protein network was observed in gel renneted at 6.1pH by utilization of
cryo-scanning electron and confocal laser scanning microscopy techniques. Further compact
texture was noted after heating with low porosity, making coarse and uneven structure than other
treatments reduces fat losses during whey drainage after cooking.
Cheese (Chaddar) prepared on pH 6.1 with milk rennet enzyme, have harder the texture than
cheese prepared with milk rennet enzyme on pH 6.5 or 6.7. Higher yield (11–13%) was obtained
in cheese rennet enzyme on pH 6.1 or 6.3 than pH 6.7 renneted cheeses. These findings indicated
the renneting milk pH can be utilized to amplified yield and texture alteration in cheese
(Cheddar) (Ong et al., 2012).
Bai and Zhao, (2015) finding showed that the milk of camel have strong buffering capability as
milk of bovine. They conducted the experiment at pH 4.4 and 4.9 by using two buffering peaks.
Same pH did not gave the same buffering index of camel milk having original pH 6.6 - 2.1 and
again titrated from pH 2.1 - 6.6 while one buffering peak was observed at pH 7.1 when the camel
milk was alkalized from original 6.6 to 11.0 pH. The findings of this study described that
acidification buffering properties of camel milk was variant as copmapred to base during 2nd
titration.
2.5.4 Effect of calcium chloride
Mehaia (1993), and Zubeir and Jabreel (2008) elaborated that the calcium chloride (CaCl2)
addition prior to addition of rennet improve the renneting properties with reducing clotting time
which also enhancing the yield of camel milk cheese. Because camel milk has a unique salt
balance, the calcium addition in means of mono phosphate or calcium chloride resulted in the
reduction of clotting time and improved the curd strength. Compared with cow's milk, 15 to 20%
higher concentration of CaCl2 is effective in camel milk. Concerning the technology perspective
of cheese manufacturing, limited addition of CaCl2 is recommended to avoid development of
soapy and bitter flavor in cheese however higher amounts reduce the 20 to 25% clotting times
(Ramet, 2001; Farah and Bachmann, 1987).

22
The CaCl2 is commonly used to improve coagulum development with the increase in yield of
cheese while high calcium concentrations resulted in the adverse effects. Crucial influence of
calcium has noted on coagulation. Calcium elevation improves the resulted coagulum with a
higher hydrolysis quantity of κ-CN (Mcsweeney, 2007). Though addition of extra higher
calcium (> 0.12m) doses ultimately reduces the proportion of rennet and firmness in gelling of
milk, so binding of calcium may obstruct with gel improvement or κ-CN ability to disolve (Van
Hooydonk et al., 1986).
Ramet (1987) investigated that calcium influence on the clotting time of milk of camel as
compared with milk of cow. They reported that four times rennet had to be added to improve
coagulation in milk of camel as speedily as milk of cow. Use of calcium up to 1.5 mM can
progressively reduce the clotting time, after which no further reduction of clotting time was
observed however cow milk responded well to calcium than camel milk. The authors
recommended that the quantity of calcium salt added be restricted to 1-2 mM (15 g/100 L). The
recommended salt quantity, lessen the coagulation time of camel milk with acceptable cheese
taste. Pre-acidification at pH 5.9 with organic acid (citric acid) caused 40% calcium reduction
with functional properties improvement. Additionally enhances baking and cooking properties,
coupled with good quality of Mozzarella cheese (Metzger et al., 2001).
Addition of CaCl2, 30 min before the addition of clotting enzyme after milk thermization or
pasteurizing and cooling is recommended, otherwise would be influential on coagulation
(Mohamed and Larsson-Raznikiewicz. 1990). Pre-acidification of milk before Cheddar cheese
production promotes the calcium solubilization that effects the protein interactions in cheese.
The low levels of acidulant injection decrease the interactions between proteins in comparison to
higher doses of acid addition which promote interactions of protein- protein because the caseins
are near to their point of isoelectric. Therefore on low pH than 5.0, the caseins acid precipitation
is dominated over on the opposite influence resulted the better calcium solubility and decreases
the calcium content of cheese and improve the protein to protein interactions (Pastorino et al.,
2003).
In a study, Mozzarella cheese was prepared with different pH and calcium concentration coupled
with starter fermenting culture in (control, CL) cheese, direct acidification (DA1 cheese) by
lactic acid and glucono-δ- lactone (GDL) + lactic acid (DA2 and DA3 cheeses) in combination.
Findings of this research proves the important role of pH to influence cheese composition (pH,
23
moisture level and calcium content) and water holding capacity of matrix of para-casein,
viscoelasticity heat-induced changes and properties of the cheese produced after heating. Cheese
(DA1) with higher pH (5.8) with lower level of calcium (22 mg. g-1 protein), having lower total
protein levels, and high moisture retention with higher initial flowability values, 1st day
stretching in comparison with control which achieved after 15 days. However increasing cheese
pH at same amounts of calcium (30 mg. g-1 protein) significantly reduces the flowability and
stretchability at 1 day (Guinee et al., 2002). Later on a investigation conducted by Ong et al.
(2015) also reported that addition of calcium chloride and pH at whey drainage has an impact on
cheese preparation. They investigated the microstructure of cheddar cheese with the help of
scanning electron microscopy and check the impact of CaCl2 (100 or 300 mg / kg) with pH 6.3
and 6.1. The thicker network of protein with minor gel holes was found made by higher amount
of CaCl2 than the lower or without CaCl2 addition. CaCl2 addition also lowers the fat losses in
the whey. The cheese texture was harder with a lowering drainage pH and moisture content and
concluded that the lowering the drainage pH combined with addition of calcium can be exploited
to increase the protein network formation in cheese making with better fat retention.
Another similar research was conducted by Soodam et al. (2015). They study the biochemical
and microstructural changes during cheese aging were using textural and chemical analyses
joined with electron microscopy with added calcium chloride or altered drainage pH. Cheese
porosity and ripening time increased with the vertices amount of protein declined in the images
of microscope; indicate cheese protein solubilisation manufactured without adding calcium at a
pH 6.0 at time of draining. However, these changes became insignificant with the increase of
added CaCl2. The findings showed that addition of CaCl2 can be utilized at a low pH of draining
for improvement of making procedure with no adverse effects on the mature cheese quality.
Salt content influences cheese composition practicality either directly or indirectly on different
stages. Elevated salt concentration causes more hardness and diminishes cohesiveness
(Cervantes et al., 1983). High level of salt in cheese may adversely affect caseins solubilization,
making the protein lattice more hydrated and to swelled (Kindstedt, 1995). Cervantes et al.,
(1983) and Paulson et al. (1998) noted that micro and ultra-structure of cheese can be improved
by salting while with no added salt cheese had large protein aggregates in the protein matrix.
Moreover, a more uniform structure with hydrated proteins, translucent in appearance with
improved meltability was found in salted cheese.
24
Calcium exists in milk as free ionic calcium or calcium caseinate or in calcium phosphate form
as micro granules or an ionic cluster. Distribution of calcium phosphate was throughout the milk
matrix of casein and considerd to interrelate with residues of casein phospho-serine and turn as
agent for cross linking in the micelle of milk casein moreover verified the structure of sub
micelle. As a result of this function the cross linking, caseinate, calcium and colloidal calcium
phosphate can take part in the structural characteristics of cheese casein matrix (Holt, 1992).
Calcium contents noticeably impact on the time required for functional attribute of the
commercial cheese like flowability and stretchability. Thus, shelf life of cheese can also be
affected by alteration in calcium concentration (Guinee et al., 2002).
The calcium effect at early stages of making cheese parameters and composition has been
usually investigated by calcium chloride addtion in the milk for the cheese manufacturing
(Lawrence et al., 1987). But, variation in the content of calcium is dependent upon curd pH in
the cheese making. The total calcium amount in cheese has been revealed to effect texture of
cheese (Lucey and Fox, 1993; Yun et al., 1995) and can be diversity controlled by processing
parameters such as pre-acidification, pH of whey drainage, time of cooking and temperature,
and final chilling temperature (Keller et al., 1974; Satia and Raadsveld, 1969).
Increasing the Mozzarella calcium level (27 to 29.5 mg/g) protein, by increasing whey drainage
pH from 6.3 to 6.46 bring a moisture reduction (45.9 to 46.3 % wt/wt) yet effect the pH of
drainage or flowability or free oil level through period of storage (Yun et al., 1995). Addition of
salt to milk or framework of casein forcing the separation of phosphate and calcium from
micelles of casein resulted in increased caseins calcium salvation or hydration or the amount of
protein - calcium in cheese could be effect the surface of cheese (Creamer, 1976; Gaucheron et
al., 1997).
2.5.5 Starter cultures
Manufacturing of cheese, the different particular strains of (LAB) lactic acid bacteria are
incorporated with milk for renneting. Main purpose of starter cultures is to yield lactic acid along
with flavoring compounds particularly acetic acid, acetaldehyde and diacetyle. Acid production
promotes the rennet activity, helps in removal of curd whey and prevents the undesirable
bacterial growth.

25
Milk is a rich resource for bacterial growth under suitable conditions. The bacteria produce lactic
acid as a byproduct using milk sugar (lactose) as an energy source. Lactic acid bacteria, having
genera leuconostoc, enterococcus, lactococcus, lactobacillus and streptococcus are called as
starter (Feeny et al., 2002). These cultures are utilized in the manufacturing of diversified milk
products, which are good for human health (Guinee et al., 2000).
Abdl Rahman and El-Zubair, (2013) revealed that camel milk fermentation by mixed cultures of
yogurt influence the some attributes however Lactococcus lactis was not liked by the panelists.
The watery and fragile consistency of all fermented camel milk products with poor structure
(poor scores) was prominent feature. The mixed cultures show more development, acidicity and
proteolytic activity than single (starter) culture in camel fermented milk. To facilitate the
coagulation of camel milk by the addition of LAB, rennet with lowering the pH, improved curd
strength. Practically firmer camel milk coagulation did not produced with the addition of single
yoghurt culture or any other LAB (Al haj and Al Kanhal, 2010).
The traditional products contain Lactobacilli lactic, Streptococcus thermophilus and lactose
fermenting yeast. Mesophilic cultures imparting unpleasant mouth feel while thermophilic
yogurt cultures worked well with camel milk (Ramet, 2001). A study conducted by Rajiv et al.
(2002) compared Streptococcus thermophilus, Lactobacillus helveticus with conventional
delburkii ssp. Lactobacillus bulgaricus as starter culture and found better practical properties of
previous cultures then conventional. El-Agamy et al. (1992) reported that growth rate of cultures
used for cow milk fermentation was slowed in milk of camel could be due to natural
antimicrobial activity of camel milk. Bayoumi, (1990) relate the property of milk of camel with
presence of higher contents of non-protein nitrogen.
Hayaloglu et al. (2013) conducted a study on goat milk cheeses by using two different breeds
and three (starter) cultures (without culture, mesophilic and thermophilic culture). The results
indicated that breeds effect on yield and chemical composition while starter culture impact on
soluble nitrogen fractions and pH values in cheese. In ripening of mesophilic starter’s cheese, the
αs-CN degraded sharply increased after 8 weeks. However more RP-HPLC peptide profiles
changes during ripening were observed in the cheeses made by mesophilic starter cultures; while,
minor effect on peptide profile has noted by breed.
Pappa et al. (2006) investigated the impact of proteolysis on culture with milk type. They
manufacture Teleme cheese from caprine, bovine, and ovine milk with mesophilic (Lactococcus

26
lactis, Lactococcus lactis, Cremoris) thermophilic (Streptococcus thermophiles, Lactobacillus
delbrueckii,) and combined cultures mesophilic - thermophilic (1:1) and check the cheese
proteolysis with 6 months storage. They observed different rate of proteolysis with similar
profiles of proteolysis in all samples with thermophilic starter cultures than mesophilic cultures.
Regarding highest proteolysis (measured on the basis of nitrogenous fractions) was noticed in
sheep’s milk and lowest in cow milk. While the results of electrophoresis and RP-HPLC
estimated highest in cow milk and lowest in goat milk cheeses. The data revealed that cheeses
could be more clustered by milk type or culture than the ripening stage.
Turkish white-brined cheese was manufactured by Hayaloglu et al. (2005) using Lactococcus
strains and ripened for 90 days. Result shows that the starter cultures considerably affect on
cheeses biochemical, chemical, physical and sensory properties as compare to control. Starter
bacteria did not affected the pH, chemical composition, and sensory properties of cheeses
however urea-PAGE (pH 4.6-insoluble fractions) and soluble nitrogen fractions levels were
observed different at various stages of ripening. The considerable degradation of αs1-CN and β-
CN of cheeses was noted in the pH 4.6-insoluble fractions during Urea-PAGE study. The starter
culture significantly influenced the phosphotungstic acid-soluble nitrogen 5% levels, insoluble
fractions of the pH 4.6-soluble fraction, 12% trichloroacetic acid-soluble nitrogen, the peptide R-
HPLC profiles and total free fatty acids of the cheeses. As ripening proceeded the levels of
peptides increased in the cheeses. Results of chromatographic and electrophoretic were clearly
different in terms of their peptide profiles of cheeses which can be categorized on bases stage of
ripening and type of starter.
Silva and Malcata, (2005) manufactured cheese using sterilized ovine milk, by the addition of
clotting agent in the form of crude liquid extracts of cardosin or Cynara cardunculus ‘A’ and
compared with commercial starter culture. To study the effect of the coagulant type used during
proteolysis (24 hrs) was estimated by separation of peptides (water soluble) extracts by R-HPLC
then by partial sequencing. According to their findings that the initial stages of ripening did not
significantly affected by starter culture.
2.5.6 Coagulation
The necessary distinguishing step in manufacturing of maximum varieties of cheese due to
casein coagulation of milk for gel formation that helps in fat retention. Coagulation may be

27
attained with proteolysis by rennet, addition of acidulant to attain 4.6 pH and 5.2 pH coupled
with heating (Fox and McSweeney, 2004). Two distinct stages involves in rennet
coagulation, proteolysis stage in which the destabilization of casein micelle by κ-CN
hydrolysis and formation of para-κ-CN micelles. The secondary phase is the calcium
mediated stage which involves in limited aggregation of para casein micelles. The temperature
above than 20oC is required with some other conditions for the secondary stage. Cleavage of the
peptide bond primarily produced with the hydrolysis of κ-CN and this hydrolysis is sensitive to
acid proteinases hydrolysis. This cleavage produces a para-κ-CN and GMP (glyco-macro
peptide) or CMP (casein macro peptide) (Fox et al., 2000; Remat, 2001; Fox and McSweeney,
2004; Skeie, 2007).
Hydrolysis of more than 86% of whole κ-CN, reduces the micelle stability to a level of colloid,
stay in connection and ultimatly form a 3D network stated as coagulum or jell. Consequently to
hydrolysis, casein micelles zeta potential reduced from 11/21 - 5/7 mV (Fox and McSweeney,
2004) and proteins sensitive to calcium as α-s1 and α-s2 placed to the inner of structure of
micelle are opened (Fox et al., 2000).
Reasons that affect the coagulation of rennet include cold storage of milk, pasteurization
temperature, cooling, protein, fat content, renneting temperature, homogenization, rennet, pH,
and Ca concentrations (Lucey et al., 2003).
As compared to bovine milk, longer rennet coagulation time was observed in camel milk by
Farah and Bachmann (1987). Farah and Rüegg (1989) and Eksterend et al. (1980) related this
longer coagulation time with larger number of bulky casein micelles which has reduces level of
k-CN. Later on same type of results were also revealded by Shuiep et al. (2013).
2.5.7 Action of rennet
The camel milk coagulum obtained by bovine rennet enzyme gives fragile, firm and rough
texture (Farah and Bachmann, 1987; Farah and Rüegg, 1989). Increased rennet concentration (up
to 70 times) was observed to speed up coagulation in camel milk (Larsson-Raznikiewicz and
Mohamed, 1986; Ramet, 2001; Siboukeur et al., 2005). Presence of specific protease inhibitors
or a particular structure of casein micelle might be raising the rennet concentration to coagulate
camel milk (Ramet, 2001). The composition of the casein micelles is another factor which might
the reason of the reduction in coagulation in the milk of camel by enzymatic action. In addition,

28
the k-CN which has a major role in clotting of milk by enzyme showed than milk of cow variable
electro-potential (Bai and Zhao, 2015).
As a substitute of bovine rennet, camel gastric enzyme extracts gives better coagulation in camel
milk. This might be credited by pepsin content in the rennet which are present in a higher amount
that reduces the coagulation time (Wangoh et al., 1993; Siboukeur et al., 2005). FAO developed
and approved a camifloc to solve camel milk coagulation problem, contains vegetable rennet and
calcium phosphate (Zubeir and Jabreel, 2008).
Activity of chymosin of camel is different from bovine chymosin investigated by Børsting et al.
(2014). Camel chymosin showed lower activity for the cleavage of Phe-Phe bond then bovine
chymosin. Camel chymosin retention is less dependent on pH then bovine. The pH 6.5- 6 had
higher retention while at pH 6 the retention of both is same. Soltani et al. (2016) observed less
proteolytic action of camel chymosin in Iranian White cheese which might be due to the low
breakdown of proteins. They concluded that increasing the rennet concentration in the cheese
preparation increases the proteolysis.
Bansal et al. (2009) prepared Cheddar cheese using calf and camel chymosin. They found
insignificant variation in the pH and composition among the cheeses manufactured with calf or
camel coagulant while lower primary proteolysis level was observed in camel chymosin made
cheeses than calf chymosin made cheeses, which was reflected through quantitative variation
among cheese peptide profiles. However, apart from isoleucine, histidine and lysine, the similar
levels of amino acids. The current study suggested that camel chymosin also suitable for
Cheddar cheese making with low proteolysis and less sulphur intensity and showed broth flavors
and less bitter taste while the cheese made by using calf chymosin were more cohesive and
adhesive.
Another aspect about camel milk was reported by Bansal et al. (2009), that milk of camel k-CN
has a varient position for chymosin hydrolysis as milk k-CN of bovine. Bovine chymosin
hydrolyzes the k-CN of bovine milk at 105Phe-106Met bond, while camel milk k-CN hydrolysis
site is Phe97-Ile98. Moreover, an extra proline residue (Pro95) in k-CN sequence of camel milk
was reported which plays a vital function to strengthen the k-CN sequence of camel milk
compared to k-CN sequence of bovine milk. They also reported that coagulation of camel milk
was less with bovine rennet as compared to camel rennet.

29
Børsting et al., (2014) concluded that quantity of coagulant retained in the curd influences the
casein breakdown and indirectly affect the cheese texture and flavor. Findings of other researcher
showed that ultrafiltration of milk for cheese making is also responsible to retained all the
coagulant in the curd (Broome and Limsowtin, 1998; Karami et al., 2009) which might improve
the enzyme’s proteolytic activity and proteolysis in ripening. The higher protein content in
cheese as compare to fat or moisture improves the firmness and visco-elastic structure (Børsting
et al., 2014). Shimaa et al. (2016) made yoghurt from pure milk of camel and blended milk of
camel and sheep. They noted the higher content of lactic acid in mixture yoghurts as compare to
pure camel milk yoghurts. Camel milk exhibited the longer coagulation time compared with
sheep milk.
2.5.8 Cooking/Scalding
The variations in manufacturing parameters of cheese can effect the composition, ripening and
sensory evaluations. Storage time and temperature can also alter the Soft cheese
functionality. Cheese vat cooking temperature influences the cheese moisture retention.
Variation in the content of moisture have important impact on texture and sensory properties.
Hence, the cooking temperature variation during cheese making (Kindsted et al., 1993). It
was suggested by Khan et al. (2004) that after curd formation from camel milk, the coagulum
should be cut and drained off the whey. Scalding should be done gradually by raising the
temperature up to 38°C within 30 minutes.
Curds made (Mozzarella-type) with milks of buffalo and cow at three gelating temperatures (29,
35 and 38°C) and three cut times (45, 60, 75 and 90 min) indicated that moisture contents and
yield of curd was reduced at rising the temperature of gelation and more losses of fat in whey. In
cow’s milk more pronounced effect of higher gelation temperature was noted (39°C) as
compared to buffalo milk while the both samples showed more fat losses and low yield.
However least protein and fat lost in whey was observed on 34°C temperature of gelating in cow
as well as buffalo milk. The higher curd yield was obtained in buffalo milk than cow milk that
can be resulted in variation of total solids, protein and fat contents. The gelation temperature has
a well-built connection with curd moisture and loss tangent. More over two milk types showed
different extent of αs-1 and β-CN fractions. Similarly the total protein, casein%, fat and casein
bound-calcium was found lower in cow’s milk than buffalo milk (Hussain et al., 2012).

30
2.5.9 Whey drainage and cheese yield
The drainage is the removal of whey from curd with certain pH. Most of the verities of cheese,
whey is drained at 6.20 pH. The high drainage pH that is 6.39, which may reduced the retention
of chymosin, proteolysis extent of storage (Thunell et al., 1979) and the inefficency of residual
rennet in cooking and curd plasticing structure. pH linked expansion fall in the ratio of protein-
lactate and curd buffering capability failure because of the soluble calcium elimination,
phosphate and lactic acid (Lawrence et al., 1987).
Investigation of Holmes et al. (1977) revealed that pH was reliant the appropriat chymosin
between curd and whey. Mostly at draining point coagulant is gone in the whey while the
quantity and extent of curd residual rennet depends on pH. The low curd pH at time of whey
removal, higher curd rennet is retained and further level of chymosin hydrolyzes of α-s1-CN is
reported. In case of microbial retention of rennet among whey and curd is pH independent. The
gradation of α-CN hydrolysis in the (Cheddar) cheese was independent on milk pH (Banks,
2004).
The buffering capacity of the cheese is different for different sources affected by the mineral
substance of the cheese. Lower curds pH have an affinity to be fragile (Cheshire) cheese and
high pH curds have more versatile trend (Colby cheddar). The Gouda and Cheddar with higher
calcium and pH has a 15 nm in breadth globular structure. In disparity with aggregation of
protein in cheese (lower pH and calcium) are smal and not well arranged. Mozzarella cheese
aggregates (intermediate pH) are in-between those in Cheshire and Gouda cheese. Soft, delicate
texture of Mozzarella cheese while have a crumbly and fractured texture of Cheshire cheese.
Differences are partially due to variation in the inorganic mineral amount, different rates of acid
production and pH.
In Mozzarella cheese production combination of curd particles are not occurs till pH attained
round about 5.9, curd particles recombination then increases at extreme with pH 5.2.
Cheddaring procedure includes the growth of a compact curd structure (fibrous) with
cohesivness and stretchability however the structure depent on pH and effect of the
recombination of calcium losses from network of protein and probably other pH-dependent
changes in the Para-casein physicochemical properties (Fox, 1990). The progressive
dissociation of the sub micelles occurs at pH 4.5 into smaller aggregates of casein (Roefs et al.,

31
1985). The coagulant inactivation at low pH, eventually influences the unmelted cheese texture
and shredding properties. As low pH of curd, calcium is transferred from the curd into the whey
which enhances the cheeses moisture content and produces softer texture (Yun et al., 1995).
In camel milk cheese making, draining of whey is a critical step to determine coagulum
brittleness and elasticity. More care required to apply physical treatment at the earlier stages of
draining, to avoid disintegration and damage of the curd. A well prepared coagulum is needed at
cutting and moulding stages which can minimize the curd losses in whey. The size of cubes
during cutting preferably low as compared to milk curd of cow. Longer time required for the
drainage of whey resulted in the significant increase of total solids in the final curd by the
cohesion improvement of the casein metric. The fresh camel milk curd should drained in muslin
cloths or bags due to the high moisture (65%) and fragility while direct filling into cheese
moulds resulted into the more losses. After 2-3 hours partially moulded curd drained to avoid
these losses. Muslin cloth ensures more curd retention. These modifications are more economical
when milk with quantity of total solids has to be processed in the hot season. Another problem is
faced during draining off camel milk whey, because big volume of curd sticks to the muslin
cloth. To avoid this, turning of curd must be carried out after 15 to 30 minutes in the beginning
then time should be increased to 30 to 60 minutes. An additional cloth may also used during
draining for better yield (Ramet, 2001).
White colored whey drained from camel curd with 6.9 to 7.0% total solids content and 1.2 to
1.3% fats was reported (Mehaia, 1993). The 70 and 90% is the total amount of whey produced
during draining varies with the type of cheese (Ramet, 2001). Compared with bovine milk, faster
whey drainage and salt absorption is observed in camel milk cheese. Prolong drainage can result
in dry and hard texture camel cheese that might be because of high moisture retention and low
water binding ability of the camel milk casein. The resulted texture of cheese becomes hard with
salty taste because of the low contents of fat (more fat losses in the whey), weaker casein water
binding ability and larger micelles (Ramet, 2001).
Cheese yield depends largely on milk origin, season, cheese type and retention of solids in milk
and cheese. During hot season, recovery of solids (31.7%) is lower in semi hard cheese.
Pasteurization, modified clotting enzyme addition, addition of calcium salt and mixing of other
types of milk in soft cheese increases the recovery of solid from 38.0 to 42.0% depending on
season. The recovery of solids is high in fresh cheese, because the whey solids are also held

32
strongly in the curd. The moisture content in the cheese determined the cheese weight that (6.7 to
10.7 kg /100 L of milk) dependent upon the quality of the raw milk while up to 26.0% yield can
be recovered with high quality milk in terms of total solid contents (Ramet, 2001).
2.6 Changes occurring during cheese storage
2.6.1 Proteolysis
Cheese ripening involves lactose metabolism, protein breakdown and fat hydrolysis which are
the complex and active biochemical process which contribute to cheese flavor and texture
development. The proteolysis degree can be determined evaluated by gel electrophoresis and
HPLC while amount of total nitrogen fractions and free amino acids (Olerte et al., 2000;
Delgado et al., 2011). The techniques like individual amino acid profiles or peptide casein
electrophoresis gives a precise proteolysis assessment (Bontinis et al., 2012). Analysis by only
by Kjeldahl is hard to conclude the degree due to the proteolysis complexity. Salt-in-moisture,
pH, temperature, ripening time, starter, secondary starter and non-starter micro flora,
environmental micro flora, milk enzymes and rennet influenced the cheese proteolysis (
McSweeney and Sousa, 2000; Hayaloglu et al., 2005).
In proteolysis starter cultures play an important role owing to proteinase or peptidase system that
hydrolyzes casein into small amino acids and peptides. Starter cultures effects have been widely
investigated by different researchers on cheeses (Pappa and Anifantakis, 2001; Michel and
Martly, 2001; Hayaloglu et al., 2005). However camel milk cheese ripening data is very limited,
due to less scientific research has been carried on camel milk cheese. Particular starter cultures
with more advantages to improve the fermented products quality are more desirable to promote
the product characteristics. Chaves-López et al. (2014) studied differences in proteolysis by
various cultures and reported that growth of LAB is promoted when used with yeasts due to
several growth promoter compounds produced by yeast for bacteria, like amino acids, vitamins
and growth factors by synergistic effects and resulted peptides were higher in cheese.
Sheehan et al. (2007) analyzed the thermophilic cultured cheeses proteolysis, through Urea-
PAGE and determined that αs1-casein hydrolysis in the ripening related to cooking temperature.
Higher cooking temperature reduces or slows down αs1-casein to αs1-CN (f24–199) hydrolysis
or degradation. Børsting et al. (2015) has found the lower activity of proteolysis of camel

33
cheese chymosin. The ability of LAB to hydrolyse intact αS1-CN was not noted but the resulted
product found the amino acids were in double amount.
Pappa et al. (2006) determined the TN and soluble N in cheeses manufactured using the
thermophilic and the mesophilic cultures. They revealed that the thermophilic culture has most
proteolytic activity with highest ratio of WSN/TN in mature cheeses. They also noted the highest
production of peptides in thermophilic and lowest in the mesophilic cultures cheeses with highest
hydrolysis of αS1-CN respectively in the cow’s or sheep’s milk cheeses. They also found the
difference in WSN and urea-PAGE in cheeses made with the mesophilic and thermophilic
cultures, regardless of the milk type. They found overall higher proteolytic activity of
Streptococcs thermophilus than that of Lactobacillus lactis due to the additional peptidases and
have higher expression levels of their peptidases. In addition Streptococcus thermophilus
possesses two additional peptidases. Other reason might be the diversity of the proteolytic
enzymatic system present in the starters which are supported by hereditary investigations. They
found a novel type of proteinase in the thermophilic lactobacilli.
Hayaloglu et al. (2005) examined the urea-PAGE and reverse phase-HPLC peptide profiles of
the camel milk cheeses and noted the minor variation in the samples at early ripening and
changed with the time (until 15 d). Kappeler et al. (1998) examined camel milk acid precipitated
casein by RP-HPLC and found estimated peak integration composition as αs1-casein 220, αs2-
casein 95, β-casein 650, ƙ-casein 35 (g/ kg total casein). Alim et al. (2005) also analyzed the
camel milk samples on SDS-PAGE and identifying the αs1-CN, αs2-CN and β-CN fractions only.
HPLC showed three main peaks after analysis of precipitated casein. Molecular masses were
exploited by electro spray ionization-mass spectrometry as 24,760, 22,060 and 24,970 Da,
corresponding to αs1-casein, αs2-casein, β-casein and no ƙ-casein in the sample. More over two
milk types showed different extent of αs-1 and β-CN fractions (Hussain et al., 2012).
2.6.2 Textural changes
In Feta type cheese made with buffalo milk, regardless of culture levels, the hardness decreased
during ripening. However, 1% culture level was found with maximum and 2% culture level was
found with the minimum hardness in cheese. As the concentration of culture increases the
cohesiveness, chewiness and springiness of cheeses decreased during 2 months ripening period,

34
while moisture, fat, protein, salt and yield was increased with the increment of starter culture
(Kumar et al., 2014).
Experimental observations indicated that texture and taste quality development in milk of camel
cheese resembles to the milk of cow cheese but chalky and crumbly textured cheese. This type of
texture might be the result of less capability of casein to bind water and low fat contents in
cheese. Greasy mouth feel has been reported during cheese consumption. This type of defect is
related to the camel milk fatty acid composition and melting point of the fat which interact with
the mouth temperature. During ripening of camel milk cheese faster and deeper water
evaporation from the curd is noted as compared to bovine milk cheeses that form a hard texture
with crusty surface and required controlled relative humidity during ripening. This problem is
also associated to the casein and fat composition of camel milk (Mehaia, 1993; Ramet, 2001).
Generally taste of camel milk cheese dependent upon ripening time and type of cheese. Neutral
taste was observed in fresh, young soft cheese and semi hard cheese while slight to moderate
bitterness has been reported in cheese during the early ripening period. The defect could be
originated by high levels of calcium or bitter peptides accumulation produced by milk clotting
enzymes proteolytic activity, resulting lower pH and particular forage species (Ramet, 2001).
2.7 Heat stability of defensive proteins
Camel milk is less heat stable as compared to milk of bovine. Heat induced coagulation time
(HCT) for milk of cow at 130°C is about 45 min. at pH 6.8, while milk of camel coagulates in 2
to 3 minutes at this temperature and pH. The chilling point of milk of camel was create to be (-
0.57 to - 0.61°C) lesser than the freezing point of cow milk (-0.52°C to -0.57°C). Camel milk
contains elevated salt to lactose concentration than cow milk that may contribute to poor stability
of proteins. The other reasons could be the vitamin C level which is high in milk of camel
(Wangoh, 1997; Farah and Atkins, 1992).
A research work was conducted by El-Agamy and Nawar, (2000) to check the impact of heat
treatment on defensive proteins such as lysozyme, immunoglobulins (IgG) and lactoferrin. The
work of skimmed milk sample of cow, buffalo and camel was exposed to treatment of heat at 60,
70, 80 and 100°C for 30 min. The investigation showed that milk (from all sources) heating at
65°C / 30 min decreased the activity of immunoglobulin however; no significant effect was

35
noted on lactoferrins and lysozymes. The entire action of immunoglobulin was vanished in milk
of buffalo and cow at 75°C for half an hour compared to 70% reduction of milk immunoglobulin
activity of camel. Entire lactoferrins action were disappeared at 80°C /30 min in the used milk
types. Though the loss in activity of lysozyme was 81.7 for buffalo at this temperature, 74 for
milk of cow and 56 % for milk of camel. Their effect is suggested that milk of camel defensive
proteins are much stable with heat as compared to milk proteins of bofine.
Felfoula at el. (2015) conducted a study on laboratory scale to check the impact of different heat
treatments on cow and camel whey. Dry deposit weights were determined on stainless plates and
studied by (DSC) differential scanning calorimetry and SDS-PAGE. The noted findings had
confirmed both whey of cow and camel at 61°C heating the does not produce light fouling on
plates, but heavy deposition on plate of stainless steel was noted above 70°C. The
electrophoresis patterns indicated the disappearance of camel serum albumin’s (CSA) at 90°C in
whey while α-la level reduces with time temperature and time. Thermograms of DSC showed
that 73.8°C was the denaturation temperature for rennet whey of camel, 61.5°C for acid whey of
camel, 71°C for rennet whey of cow and 63.9°C for cow acid whey with respect to pH (6.5 and
4.4 for rennet and acid whey of camel). They observed that impact of pH on the heating attiutute
of proteins in whey, the major protein is α-la in whey of camel with free thiol deficiency and
resulting in unfolding by heat at a low heating temperature as compared to β-lg at high acidity.
However stability of α-la which pH dependent is comparatively persistent with pH range of 5.2–
8.0, while reduces upon acid production (Ruegg et al., 1977). Hendrix et al. (2000) have shown
that the heat-induced denatured and the unfolded are not clear at higher pH values than 5
however near neutraled pH values, denaturation occurs by heat at higher temperature and
produced a completely opened polypeptide.

36
CHAPTER 3
MATERIALS AND METHODS
The investigation was performed in the Laboratory and Processing Hall of dairy section at
NIFSAT, Faculty of Food, Nutrition and Home Sciences, University of Agriculture, Faisalabad,
Pakistan. Target of current investigation was to optimize, processing conditions (pH,
temperature, CaCl2, buffalo milk blend, starter cultures) for camel milk cheese production,
increase the yield and reduce the coagulation time.
3.1 Procurement of raw material / chemicals
For the manufacture of cheese, fresh milk of camel was collected from a local (Brela) producer
near Faisalabad, Pakistan and milk of buffalo was collected by the Agriculture University dairy
farm, Faisalabad. Thermophilic (Lactobacillus thermophilus and Lactobaccilus bulgaricus) and
mesophilic (Lactococcus lactis and Lactococcus cremoris) starter cultures were obtained from
Sacco Clerici and camel rennet was procured from Chr. Hansen Denmark Ltd. The chemicals of
Sigma-Aldrich (St. Louis, MO, USA) and Fisher scientific (CHEMTREC®, USA) were used in
the study.
3.2 Physico-chemical analysis of milk
The milk used for cheese production was first analyzed for pH, acidity, protein, fat, solid-not-fat
(SNF), total solids and moisture contents to check its quality for cheese making.
3.2.1 pH
Milk pH of camel samples were directly noted with the pH digital electronic meter (Hanna, HI-
99161) after calibration with buffer solution of pH 4 and 7.
3.2.2 Acidity percentage
Milk acidity of camels samples were astimated with AOAC, (2012), method No. 947.05 by
titrating milk 10 mL sample with 0.1 N NaOH yet light pink appearance as end point which
persist for few min. The acidity (%) on the basis of lactic acid was calculated with given
formula;

37
Acidity % = Used volume of NaOH used × 0.009× 100
Volume of milk
3.2.3 Protein content
The milk protein content of camel samples were determined with method (991.20) of AOAC
(2012) based on Kjeldahl’s, Kjeltec System (D-40599, made up by German, Behr Labor Technik
GmbH). For digestion, milk samples of 10 mL were taken in a (digestion) tube, using (two)
digestion tablets (containing 5 g K2SO4 and 0.005 g selenium) and 20 mL N-free H2SO4 were
added to it. In blank tube, digestion tablet and acid was added without sample. All the tubes were
transferred to digestion block and heated first at 230°C to control foaming then at 430°C.
Continued digestion until the digest became clear. The digestion tube was attached to the
distillation unit and distillation was conducted in the presence of 40% NaOH and distillate was
put (collected) in flask of conical shap having solution of boric acid (4%). In the last, contents in
conical flask were titrated against 0.1 N solution of N-free H2SO4 and volume used was noticed
when the pink color appeared. The nitrogen was calculated by the formula;
Nitrogen (%) = Volume (sample-blank) H2SO4× 0.0014× 100
Weight of sample
Protein (%) = N (%) × 6.38
3.2.4 Fat content
To determine the fat contentsin milk samples of camel method of Marshall, (1993) used by
appling Gerber technique. The milk sample (10.94 mL) was taken into a butyrometer containing
10 mL H2SO4. The amyl alcohol was also added slowly on top of milk along the wall of the
butyrometer for better fat separation. The butyrometer was closed with the rubber cork and
contents were mixed. Butyrometers were kept in water bath at 66°C for 10 min until complete
digestion. Afterwards, Gerber machine (Funke Gerber Supervision-N Germany) was used for
centrifug butyrometers at 1100 rpm (5 min) and then allowed to stand in hot water (water bath)
at 65°C for 5 minutes before carrying out direct reading of the fat content from the neck of e
butyrometer.
3.2.5 Solid-not-fat content

38
Solid not fat (SNF) contents were estimated by method using Lactometer described by David
(1976). The Lactometer reading (LR) was noted from the meter and SNF were calculated as
follows.
% SNF = 0.25 × LR + 0.22 × Fat% + 0.72 (for camel milk)
3.2.6 Total solids
Total solids (TS) were estimated with the AOAC 925.23 (2012) method. The weighed quantity
of samples were put in crucible and put in hot air oven for drying (105 ± 3°C). The weight of the
dried sample was noted and used to calculate the total solids as follows.
Total solids (%) = Weight of dried sample (g) × 100
Weight of sample
3.2.7 Moisture content
Contants of moisture of samples of milk were calculated after subtraction of the weight of the
dried sample from the wet sample following the equation given below
Moisture (%) = Wt of wet sample – Wt of dried sample × 100
Wt of sample
3.3 Research plan
To optimize the processing conditions for manufacturing cheese from camel milk, the effects of
various factors like, pasteurization temperature, pH, CaCl2 and mixing of buffalo milk and
influence of starter cultures was studied. In the present research work, camel rennet (0.01%) was
used for cheese making. The current effort was conceded in two studies. Before conduction of
these studies temperature (60, 65 and 70°C), pH (5.3, 5.5 and 5.7 pH), CaCl2 (0.04, 0.06 and
0.08%) and buffalo milk (0, 10 and 20%) amalgamation were finalized through various
preliminary trials based on the yield and coagulation time.
a) Study I
In this study, 81 combinations of selected processing conditions (Table 3.1) were used for the
manufacturing of camel milk cheese at laboratory scale and evaluate their quality parameters
(coagulation time, yield, texture, moisture, acidity, protein and fat contents). From this study the
best combination was selected for the study II.

39
b) Study II
In Study-II, the optimized processing variables from Study-1 were used for the production of
camel milk cheese using thermophilic and mesophilic starter cultures with and without addition
of buffalo milk into camel for the production of cheese. These cheese samples were designated
as milk of camel cheese + mesophilic cultures (CM), milk of camel cheese with thermophilic
cultures (CT), camel + buffalo milk (10%) cheese with mesophilic cultures (CBM) and camel
milk + buffalo milk (10%) with thermophilic cultures (CBT). The cheese samples were prepared
following the manufacturing process as given in Figure 3.1 (Hailu et al., 2014). Cheese samples
were vacuum packed and stored at 6 ± 2°C for 60 days.
Figure 3.1 Flow chart of camel milk cheese making
Milk pasteurization at 65°C ;30 min
Cooling to 31°C and 37°C
Pre-acidification with 10% citric acid
at 5.8
Addition of CaCl2 ; 0.06%
Addition of thermophilic and
mesophilic culture
Incubation at 31 and 37°C for 40
min
Rennet addition 1%
Coagulation ; 2 hrs Cutting
Scalding at 37°C and 42°C ; 40 min
Whey drainage
Packaging and storage

40
Table 3.1 Treatment plan for camel milk cheese production for 5.3 pH
CMC: camel milk cheese
Camel
Milk
Cheese pH
Temp ᵒC CaCl2 % Buffalo milk %
CMC-1 5.3
60 0.04 0
CMC-2 5.3
60 0.04 10
CMC-3 5.3
60 0.04 20
CMC-4 5.3 60 0.06 0
CMC -5 5.3 60 0.06 10
CMC -6 5.3
60 0.06 20
CMC -7 5.3
60 0.08 0
CMC -8 5.3
60 0.08 10
CMC-9 5.3
60 0.08 20
CMC-10 5.3
65 0.04 0
CMC-11 5.3
65 0.04 10
CMC-12 5.3
65 0.04 20
CMC-13 5.3
65 0.06 0
CMC-14 5.3
65 0.06 10
CMC-15 5.3
65 0.06 20
CMC-16 5.3
65 0.08 0
CMC-17 5.3
65 0.08 10
CMC-18 5.3
65 0.08 20
CMC-19 5.3
70 0.04 0
CMC-20 5.3
70 0.04 10
CMC-21 5.3
70 0.04 20
CMC-22 5.3
70 0.06 0
CMC-23 5.3
70 0.06 10
CMC-24 5.3
70 0.06 20
CMC-25 5.3
70 0.08 0
CMC-26 5.3
70 0.08 10
CMC-27 5.3
70 0.08 20

41
3.4 Physico-chemical analysis of camel milk cheese (CMC)
3.4.1 pH
By blending 20 g of choped sample of camel cheeses were prepared in a slurry form with 12 mL
distilled water and then used to measure the pH of cheese at 25°C with a pH meter (Hanna, HI-
99161) fresh pH 4.0 and 7.0 standard buffers were used for caliberation by following Ong et al.
(2007).
3.4.2 Acidity percentage
Percent acidity in camel samples of cheese was determined with titrating method (920.124) of
AOAC, (2012). Finally choped sample of cheese (1 g) were blended by mixing 10 mL hot water,
filtered after stronge shaking. Remaing liquid (filtrate) then titrated againt NaOH (0.1N) with
indicator (phenolphthalein).
Acidity % of lactic acid = Volume of NaOH × 0.009 × 100
Volume of milk
3.4.3 Moisture content
Contents of moisture in milk of camel cheese samples were evaluated using hot air oven for
drying samples at 104 ± 4°C uptill persistent wt of samples was obtained by using AOAC,
(2012) Method (926.08). A small quantity of sand was filled in the drying crucible for protection
to avoid losse of samples at the bottom. Then, the crucibles were applied high temperature
(104°C for 1h) in oven. Desiccators was used to cool the samples after removal from the oven.
The drying crucible was weighed as w1. After that, ~ 3-4 g of chopped cheese samples were
weighed and denoted as w2 and carefully mixed sand and samples with glass rod and put back in
oven at 104°C for 5 h. Again cool in the desiccator when given time was completed in the oven
and recorded the weight as w3 and calculated the moisture by using following equation;
Moisture (%) = [(w2 - w3) ÷ (w2 – w1)] × 100
3.4.4 Fat content
Content of fat in cheese samples were estimated by Marshall (1993) method using centrifugation
by Gerber machine. The grated sample (3 g) was first enfolded in cellophane grease proof paper
and then put slowly into cheese (butyrometer, 3 g) containing sulphuric acid (10 mL) and

42
distilled water (3 mL). Distilled water (5 mL) at 60°C was added along the wall of butyrometer
above the sample. Finally, amyl alcohol (1 mL) was incorporated in tube. Vigorous shaking was
applied on butyrometer to completely dissolve the cheese sespentions and later kept it hot water
bath (85°C for 10 minutes) until complete digestion. Afterwards, butyrometer was stopped up
and centrifuged at 1300 rpm for 5 min, then allowed to stand in a hot water at 65°C for 10
minutes before carrying out direct reading of fat content.
3.4.5 Protein content
Kjeldahl method for contents of protein or nitrogen was estimated by using kjeltec system (D-
40599, Behr Labor Technik, Düsseldorf, Germany) as given in IDF (2006). The grated cheese
sample (1 g) was dissolved (digested) in digestion flask (Kjeldhal) with 25 mL conc. N-free
H2SO4 with 2 tablets (digestion) till vibrant clear solution was achieved. The sulfuric acid used to
trapped ammonium, was getting free with the addition of sodium hydroxide (40%) in the
distillation process and boric acid solution was used for collection and hydrochloric acid (0.1 N)
titration done to estimate the nitrogen amount.. Nitrogen was calculated by the following
formula.
Nitrogen (%) = Volume (sample-blank) HCl × 0.0014 × 100
Weight of sample
Protein % = N % × 6.38
3.4.6 Cheese yield
Cheese yield was calculated after drainage following the equation as given below
Yield (%) = Cheese weight (kg) × 100
Mi lk wt (k g)
3.5. Texture
Cheese cubes were cut of cheese samples from all treatment at given (7 days) interim and
packed (stored) in plastic (sealed) bags at 8°C for one day. Then cylindrical shape cheese
samples were pressed under texture profile analyzer at the rate of 20 mm/minutes at ambient
temperature by using the stable micro system with double compression. The cheese

43
extetensible ring shaped probe was used. The results were measured as the applied force (N)
by using compression on sample of cheese (Guinee et a l . , 2000).
3.6 Assessment of camel milk cheese proteolysis
The degree of proteolysis in the camel milk cheeses was evaluated by Urea- PAGE and HPLC
analyses.
3.6.1 Urea-PAGE
The cheese sample was mixed with water as given in Figure 3.2, following the procedure of
Kuchroo and Fox (1982) to obtain water-soluble and insoluble extracts. Briefly, the finally
grounded cheese samples were homogenized by twice the volume of (distilled) water with
homogenizer (VELP® Scientifica N˙R171362 OV5) for 1 min at 1000 rpm. Then, with 1N HCl
slurry pH was accustomed at 4.6 at ambient temperature. After half an hour, readjusted the pH
was to 4.6 and placed in hot water (bath) for 1 h at 40°C. The slurry was centrifuged at 4000 ×g
and 4°C (AG 22331 Hamburg, Germany) for half an hour. Then filterd the soluble fraction
placed with in the upper fat layer and precipitate of casein, freeze-dried using lyophilizer
(CHRIST®, ALPHA 1-4 LD plus, Germany) and stored at -20°C for RP-HPLC and urea-PAGE
studies. Similarly the insoluble fractions were also lyophilized at -40°C for urea-PAGE. The 1
mL sample buffer was used to dissolved freeze dried samples (10 mg) and at 55°C for 10 minuts
incubated. Using micropipette 8 µL of standard and 10 µL of samples were loaded in the gel.
Before the use (Electrophoresis Mini Protean, Biorad) electrophoresis unit was immediately
assembled. The samples were allowed to pass with 112 volts through the gel (stacking) and then
224 V for separating gel. Gels were removed afterward the indicated time, and stained and de-
stained by respective solutions (Sheehan et al., 2004). Solutions preparation for urea- PAGE is
given in Appendix II.
3.6.2 RP-HPLC
Proteolysis in freeze dried soluble and insoluble fraction (4.6 pH) of camel milk cheese was
astimated (Verdini et al., 2004). Camel casein standard (freeze dried) was solubilized (0.5, 1.0
and 1.5%) in the same solvents as for the cheese sample. Approximately 10 mg powder for each
sample of soluble and insoluble fraction was dissolved in 0.5 mL urea solution (48 g Urea, 2 g

44
Tris, 1.3 g Sodium citrate and 300 µl mercaptoethanol /100 mL) and 2.0 mL TFA/Water solution
(Christensen et al., 1989). The sample solutions mixed and filter through 0.45 µm filter (Fisher
Scientific, Ireland) and injected (20 µL) into Phenomenex Jupiter (250 mm × 4.6 mm × 5μm,
300 Å sized pores Phenomenex, Co, Torrance, CA, USA) C18 and C4 column with UV detector
(SPD-10AV, Perkin Elmer, USA) into the HPLC system (Perkin Elmer, USA), using pump (LC-
10AT, Perkin Elmer, USA) at 25°C temperature for chromatographic separations.
For the fractionation of proteins, 10 mg soluble as well as insoluble samples in pH 4.6 were
mixed with 1.0 mL (1000 micro litter) of deionized water and 20 µl of this was injected in the
HPLC and concentration of protein fraction was caltulaetd in ppm. Detection was carried out at
214 nm (soluble and insoluble). With solvent A gradient elution was used as 0.1% trifluoroacetic
acid (TFA, sequencing grade, Sigma-Aldrich Laborchemikalien GmbH, Seelze, Germany) in
HPLC-grade water (deionized) and 0.1% TFA in acetonitrile as solvent B. Initially sample (with
100% solvent A for five minutes) were eluted, later with a 0% to 50% solvent gradient B for 55
minutes, 50% solvent B maintained for six minutes, following a 50% to 60% solvent B linear
gradient for four minutes, lastly three minutes with 60% solvent B. Total time was 73 min with
1.0 mL min-1flow rate.
3.7 Sensory evaluation of camel milk cheese
The cheese of camel milk was assessed for varient sensory parameters (Color, texture, flavor,
taste and overall acceptability) by the method of Clark et al., (2009). The camel cheese
samples were assessed (sensory parameters) at 7 days interim during aging by a trained
assessor’s panel. Voluntary panelists were selected utilizing a (9-point) hedonic scale (7 =
like extremely, 6 = like moderately, 5 = like slightly 4 = neither like nor dislike, 3 = dislike
slightly, 2 = dislike moderately and 1 = dislike extremely). All cheese treatments were
labeled properly. Panal of 20-30 teacher and students were duputed with in the age group 22-
50 years after the training of one hour session for cheese avaluation.
3.8 Statistical analysis
Analyses were performed in triplicate to determine the impact of investigated parameters (pH,
pasteurization temperature, CaCl2 and buffalo milk blend) on yield, coagulation time, texture and
ripening time. The resultant data was analyzed statistically by ANOVA using Minitab statistical

45
package and was used for multiple comparisons (α = 0.05) between means. Response surface
method was used for analysis between mean values. The findingws were expressed as mean
values ± standard error (SE).

46
Figure 3.2 Extraction of water-soluble fraction/extract
R-P-HPLC
Grated cheese +
distilled water
Homogenization
Drop pH of cheese
slurry (1M HCL; PH
4.6)
Heating in water
bath (40ᵒC, 1h)
Centrifugation
(4000 g, 4ᵒC, 30 min)
Precipitation
Supernatant
Fat layer
Filtration
Whatman No.41
Water soluble
fraction
Freeze Drying
Freeze drying
Urea-
PAGE

47
CHAPTER 4
RESULT AND DISCUSSION
In the present investigation the impact of pasteurization temperature, pH, CaCl2 and addition of
buffalo milk on the yield, coagulation time, texture and chemical composition of camel milk
cheese was studied. The influence of cultures was also investigated after optimization of
processing conditions on the same parameters given above and on the proteolysis. The findings
of all the essesed constraints are debated below the given headings.
4.1 Chemical analysis of camel and buffalo milk
The analyses of results regarding of raw camel and buffalo milk is presented in Table 4.1,
which showed that fresh camel milk has average pH 6.61 (ranged 6.59 to 6.65). The acidity
(titrateable) of milk of camel measured (lactic acid) varied from 0.13-0.16% (average 0.17 ±
0.01) lactic acid, Wangoh (1997) findings are supported the current findings.
The content of fat in milk of camel was 3.3 ± 0.02%. Studies showed that fat level in milk
of camel varies from 1.2 to 6.4%. Several factors are responsible for this variation; such as
hot seasons can reduce 4.2 to 1.2% fat content in the milk of camels in dehydration (Wangoh,
(1997; Konuspayeva et al., 2009).
The milk of camel showed the 3.01±0.15 of protein content which is within to the values
reported by Elamin and Wilcox, (1992) who estimated that milk protein contents of camels
varies from 2.22 - 4.89%. Genotypes of animal and change in season can resulted in variation
of protein content, that is found low in summer (2.48%) and high in winter (2.9%) (Remat,
2001; Al haj and Al Kanhal, 2010).
The ash content value of milk of camel presented in Table 4.1 was 0.70±0.01% which
generally described the total amount of mineral contents. Haddadin et al. (2008)
revealdedthat milk of Dromedary camel’s ash content ranged betwwen 0.60 and 0.90%,
which is dependent on fodder, water intake, breeds and analytical techniques. The total solid
contents of camel milk were 11.8 ± 0.6 %, which depends on protein, fat, mineral and lactose
(content) in milk of camel.

48
The composition of camel milk (Table 4.1) can vary due to several factors such as species,
breed of animals, feeding behavior and seasonal variations as well as the water intake of
animal (Remat, 2001; Al haj and Al Kanhal, 2010).
Raw fresh milk of buffalo utilized for current study, also estimated for various constraints such
as acidity, pH, ash, total solids and fat as discribed in Table (4.1). The pH values and acidity %
in milk of buffalo were 6.69 and 0.15% while Ahmad, (2010) noted these values as 6.81 and
0.162% respectively. Acidity and pH is the major contributor in the final quality of cheese. The
fat (6.9%) and protein (4.5%) contents of raw milk analysis are in agreement with the results
(7.1% and 4.4%) of Ahmad et al. (2008). Ash content of buffalo milk was 0.78% that is compare
able with the findings of (0.9%) Han et al. (2012). The 17.88% total solids contents close to the
findings of Han et al. (2012), which was 17.7%. These differences may be found due to the
variation in lactation period, climatic conditions and animal feed.
Table 4.1: Chemical analysis of camel and buffalo milk (%)
Species pH Acidity Protein Fat
Total
solids Ash
Camel 6.61±0.04 0.17±0.01 3.01±0.15 3.3±0.02 11.8±0.61 0.7±0.01
Buffalo 6.69±0.04 0.15±0.01 4.5±0.92 6.9±1.40 17.88±0.35 0.78±0.16
Values are given as mean±SD
4.2 Optimization of processing conditions for camel milk cheese production
Study 1
In the manufacturing of camel milk cheese pH of milk, temperature of pasteurization, CaCl2
concentration and addition of buffalo milk greatly affect the coagulation time, texture,
composition and yield in milk of camel cheese. The Table 4.2 showed significant (p<0.01)
analysis of variance in variables pH (P), temperature (T), CaCl2 (C) and buffalo milk blend (B)
on coagulation time, texture and yield of camel milk cheese. All the interaction of processing
parameters (Table 4.2) showed the significant (p<0.01) effect on coagulation time except C x B,
which behaved (p<0.05) non-significant. Cheese texture of camel milk influenced significantly

49
(p<0.01) by the interaction between P . C, P . B, P .T, C . T, P. C. T, P. C . B . T while C . B, B .
T, P . C . B, P . B . T, C . B . T showed the non-significant (p<0.05) behavior towards the texture
of cheese. The interactive effect of P . C, C . T, P . C . T, P . C. B . T interactions were high
(p<0.01) significant for yield. Yield was also (p<0.05) significant influence by interaction of P x
T, C x B x T. while other interactions showed non- significant (p>0.05) impact on camel milk
cheese.
Statistical analysis clearify the variables like pH, CaCl2, Temperature and buffalo milk blend are
the main parameters which affect the coagulation time, texture and yield individually as well as
in combination however some interactive effects with each other was manifested the negligible
affectation on the cheese coagulation time texture and yield.
4.2.1 Effect of parameters on camel milk cheese coagulation time
The influence of interactions between two-two variables for coagulation time is graphically
illustrated in Figure 4.1 a - f. It is evident from Figure 4.1 (a) the pH and CaCl2 response on
coagulation time was similar at 0.04% and 0.08% CaCl2 concentration, while at 0.06% CaCl2
concentration, coagulation time was lowest for pH 5.5, followed by pH 5.3 and 5.7 respectively.
The similar trend was observed regarding the interaction of pH with blend (Figure 4.1 b).
Coagulation time was reduced by increasing the buffalo milk concentration, at each value of pH
(5.3, 5.5, and 5.7); however minimum coagulation time was observed with pH 5.5. The
interaction of temperature with pH, CaCl2 and blend (Figure 4.1c, e, f) elucidated the lowest
coagulation time at 60 and 65ᵒC temperatures. A sudden increase in coagulation time was notice
at 70°C at all pH levels, CaCl2 concentrations, temperatures and buffalo milk blends. There was
non-significant interaction of C x B for coagulation time (Figures 4.1 d).

50
Table 4.2 Mean squares for coagulation time(min), yield (%) and texture (N) for camel
milk cheese
Source of variation Coagulation time Yield Texture
pH (P)
310.4** 1848.38** 5.21**
CaCl2 (C)
232.6**
164.01** 1.90**
Blend (B)
285.3** 106.55** 0.92**
Temp (T)
71079.8**
227.87** 16.33**
P x C
65.7**
20.81** 0.06**
P x B 19.1** 0.91NS 0.03**
P x T 140.6** 2.13* 0.06**
C x B 1.8NS 1.37NS 0.006NS
C x T 43.3** 10.16** 0.08**
B x T 6.8** 1.22NS 0.06NS
P x C x B 7.3** 1.18NS 0.008NS
P x C x T 51.3** 5.89** 0.05**
P x B x T 3.9** 0.74NS 0.06NS
C x B x T 6.3** 1.50* 0.06NS
P x C x B x T 9.5** 2.34** 0.06**
** = High-ly significant (P<0.01), * = Significant (P<0.05); NS = non-significant (P>0.05)

51
Figure 4.1 Effect of two-two parameters on coagulation time
a b c
d e
f

52
Graphical presentation clerify that as the percentage of buffalo milk addition increased in the
cheese production; there was a reduction in the coagulation time. The pH 5.5 was proved the
more appropriate regarding the reduction in coagulation time. The impact of CaCl2, blend, pH at
60 and 65°C temperature was almost similar, however relatively lower coagulation time was
observed at 0.08% CaCl2.
4.2.2 Effect of parameters on camel milk cheese yield
Recovered amount of cheese yield is the obtained final wt from 100 kg of cheese milk that is a
vital criteria regarding the profitability of cheese industry. Higher solids percentage in milk,
better the outcome of cheese attained and ultimately more economic turn over. Interaction
influence between two variables for yield is depicted graphically in Figure 4.2 a-f. The
interaction of pH (5.3, 5.5 and 5.7) with different concentrations of CaCl2 (0.04, 0.06 and 0.08%)
present in Figure 4.3a that indicate the very low of yield at pH 5.3. The cheese yield was high at
pH 5.5 with three concentrations of CaCl2 hence maximum was noted at 0.08% CaCl2. While the
yield of cheese affected non-significantly by the interaction of pH and blending of buffalo milk
(Figure 4.2 b). The concentration of buffalo milk increased, yield was increased at each value of
pH. Interaction of temperature regarding pH and CaCl2 showed the significant effect on yield
(Figure 4.2 c and e) while non-significant with blend (Figure 4.2 f). The interaction of blend with
CaCl2 present in Figure 4.2 (d) also showed the increase in yield with the addition of buffalo
milk relatively high at 0.08% CaCl2. It is also depicted a lower yield that was recorded at 70°C
while relatively higher yield was recorded at 65°C.
The cumulative effects of all parameters for yield illustrated that pH 5.3 had least effect
regarding the yield as compared to pH 5.5 and 5.7 in all interactions of CaCl2, temperature and
buffalo milk blend. The highest yield was recorded at 65ᵒC temperature, 0.08% CaCl2 and pH
5.5. Regarding the addition of buffalo milk it was noted in all the graphs that with the increase in
concentration of buffalo milk the increase in yield was also observed.

53
Figure 4.2 Effect of two-two parameters on yield (%)
a b
a
c
a
d
a
e
a
f
a
54
4.2.3 Effect of parameters on camel milk cheese texture
Texture of cheese is elementary attributes like appearance met the demands of consumers in
cheese consumption. Moreover, it’s a renowned cheese characteristic which influence preference
or acceptability of products (Hicsasmaz et al., 2000). The graphical manipulation of interaction
between two-two variables for texture is provided in Figure 4.3 from a to f. The interactive effect
of pH and CaCl2 (Figure 4.3 a) presented that rise in the percentage of CaCl2 improves the texture
at all three pH (5.3, 5.5, 5.7) levels however more firm texture was observed at 5.5 pH and
0.08% CaCl2. Same trend was noted in the interaction of pH with blend (Figure 4.3 b). The
firmness of texture was elevated as the concentration of the buffalo milk increased hence highest
firmness was obtained at 20% blend and 5.5pH. The interaction of temperature with pH and
CaCl2 depicted (Figure 4.5 c and e respectively) the firmer texture was obtained with increasing
the temperature from 60 to 65°C regardless of pH and CaCl2 concentration. The other
interactions (C .B, B . T, P . C . B, P . B . T and C . B . T) were non-significant for texture (Figure
4.3 d, f).
The collective effect of all parameters for texture described that high pasteurization temperature
(70°C ) is not in favor of firm texture for camel milk cheese while high concentration of CaCl2
and buffalo milk improve the texture at pH 5.5.
4.2.4 Discussion of parameters on camel milk cheese
Milk of camel reveals a 2-3 times lengthier coagulation time with rennet (RCT) and low cheese
yield with firm texture compared with bovine milk. The results revealed that high pasteurization
temperature adversely prolong the camel milk RCT, and resulted in reduced yield with firm
texture. These findings are in line with previous researchers (Farah and Ruegg, 1989; Farah and
Atkins, 1992; Al-Saleh, 1996; O’Connel and Fox, 2000; Omer and Eltinay, 2009; Al haj and Al
Kanhal, 2010) who relate low heat stability of camel milk with more larger micelles quantity
(200-500 nm) as compared to cow’s milk (220-300 nm).

55
Figure 4.3 Effect of two-two parameters on texture (N)
a
a
b
a
c
d
a
e
a
f
a

56
The size and number of micelles in camel milk can theoretically explain the heat poor stability of
milk of camel in the current research, whereas, large numbers of casein micelles in cow milk are
reported to coagulate rapidly, while small numbers of micelles increase in size with heating.
Further causes might be the minor size of the fat globules in camel (2.31 µm), higher number
(200-500 nm) of micelles (bigger) in milk of camel (O’Connell and Fox, 2000). These
parameters are affected undesirably by milk treated at heat on temperatures above 71°C because
of the denatured β-lg and α-la with ƙ-CN interactions (O’Connell and Fox, 2003). Heat induces
changes in milk casein proceeded towards coagulation when subjected to high heat treatment.
Some interactions also occur between β-lg and casein upon heating which affects the heat
stability. Researcher prove that ƙ-CN and β-lg plays a vital part in the bovine milk stability and
deficiency or absence of such two compounds in milk of camel could be a cause of high
temperature low stability. Relationship of temperature with pH with regarding to surface charge
is another important factor which discussed by investigators (Farah and Ruegg.1989; Farah and
Atkins.1992; Al-Saleh.1996).
It is clear from the present findings that reduction in RCT, high yield and firm texture was
achieved at pH 5.5. This aspect was also studied by Kherouatou et al. (2003) and Attia et al.
(2000). They related this aspect the milk of dromedary camel micelle which seem like to
preserve its veracity up to pH 5.5, lower that they undergo through biochemical and structural
modifications which results in the loose microstructure, micelle hydration and viscosity seeming.
The transition pH may be with in pH 5.0 coagulum and micelle structure. Similar observation
about came milk was also noted by Farah and Atkins (1992).The findings of Najera et al. (2003)
also noted that 5.0 was the optimum pH for the enzymatic hydrolysis phase which affect the
coagulation time. Camel milk is known for its stronger buffering capacity compared to bovine
milk, therefore, buffering capacity of milk may influence many of its physico-chemical
properties (Dian and Bai, 2014).
Weak and fragile curd with low yield is an additional feature in camel milk cheese production
which is probable be because of the lower coagulum content of total solids, particularly casein
low contents (Ramet, 2001; El-Zubeir and Jabreel, 2008). The rate of rennet coagulation as well
as yield and texture are also affected by concentration of calcium and pH. In present work the
least RCT, high yield and firmer texture was observed at 0.08% CaCl2 with addition of 20%
buffalo milk to the camel milk. These results are related with the work of Soodam et al. (2015)

57
and Ong et al. (2015). The authors used the CaCl2 and pH parameters to lower the RCT in
cheddar cheese manufacturing from cow’s milk. The results of current work was also in
conformity by the findings of Daviau et al. (2000) and Castillo et al. (2000), they evaluate the
pH relationship with temperature of coagulation for (gel) firmness rate in the clotting in milk of
goat.
The results of Daviau et al. (2000) are similar to the present study, they concluded that gel
firmness affected by Ca strength which strongly influenced by pH. Na’jera et al. (2003)
concluded that high temperature (45°C) produced fast rate of firmness in gel than lower
temperature (29°C) regardless of pH, though effect of CaCl2 correlated with pH. Moreover their
multi - factorial study indicated that time of coagulation was utmost impacted with pH and
CaCl2, while curd firmness was influenced by temperature.
CaCl2 is generally add up in milk to increase formation of coagulum with improve yield of
cheese while more concentration of calcium cholorid can give opposing impacts. The results
concluded by Jovanović et al. (2002) are in line with the observations of current work that
showed relationship of pH and ionic strength have strong effect on coagulation time and firmness
in the cheese production. Results of Ong et al. (2015) also favors the current study findings
which concluded that cheese coagulation and texture was improved with the CaCl2 addition in
amalgamation at pH a low drainage. Findings of Farah and Bachmann (1987) and Ramet (2001)
support the present work. They recommended the use of 15 to 20% higher concentration of
CaCl2 in camel milk as required in bovine milk which reduces 20 to 25% clotting time.
The effects of buffalo milk incorporation that has high solid content were noted. Amalgamation
reduced RCT, increase yield with the improvement in the texture which was depicted in the
present findings. The increase in the %age of buffalo milk reduces the coagulation time improves
the yield with harder texture. Findings of current work is line by the result of Ramet, (2001);
Eyassu et al. (2007); El Zubeir et al. (2008) and Shahein et al. (2014). They noted the reduction
of RCT in milk of camel with mixing the milk of other species that could increase total soluble
solid contents of milk. Ammar et al. (1999) also found the higher yield of manufactured Labneh
by milk of buffalo as compared to milk of cow or even combined which increases by salt
addition. El-Gawad and Ahmed (2011) have related the yield of cheese with fat and casein
components of milk or moisture, protein and fat % in cheese.

58
Table 4.3 Mean squares for effect of processing parameters on composition of camel milk cheese
Source of variation Acidity Moisture Fat Protein
pH (P)
CaCl2 (C)
Blend (B)
Temp (T)
P x C
P x B
P x T
C x B
C x T
B x T
P x C x B
P x C x T
P x B x T
C x B x T
P x C x B x T
0.15**
0.0003**
0.00003NS
0.00016*
0.0002**
0.00007NS
0.00007NS
0.00017**
0.00003NS
0.00020**
0.00005NS
0.00015**
0.00025**
0.00005NS
0.00013**
42.54**
127.41**
86.94**
302.68**
17.01**
1.39NS
7.80**
1.13NS
8.09**
2.40**
0.90NS
12.31**
1.55*
1.16NS
1.003NS
8.57**
18.48**
14.72**
13.16**
5.45**
0.26NS
2.59**
0.36NS
3.25**
0.17NS
0.89*
4.72**
1.27**
0.42NS
0.52NS
39.32**
10.07**
23.90**
31.93**
15.92**
2.12**
0.51NS
1.33**
2.58**
0.13NS
1.09**
0.96*
0.74NS
0.77*
0.53NS
** = Highly significant (P<0.01) , NS = Non-significant (P>0.05) , * = Significant (P<0.05)

59
Abdou et al. (2002); Abd El-Rafee and Abd El-Gawad (2002); Hussain et al. (2012) described
that an rise in yield is because of higher amount of soluble total solids present in milk of buffalo
because total protein, casein, fat, lactose and solids-not-fat are high in milk of buffalo as
compared to milk of cow and the rheological properties of curd are improved as the total solids
in the milk are increased.
Firmness of curd, syneresis and coagulation are influenced by the parameters like as the quantity
of k-casein, pH, mineral and temperature contents (Nejera et al., 2003; Abdou et al. 2002;
Bornaz et al., 2009). Hashim et al. (2009) findings showed that CaCl2 addition improves the
firmness and gelation of the yogurt and cheese made from camel milk.
4.3 Effect of processing parameters on the composition of camel milk cheese
Cheeses are appreciated for their long life, flavor and high content of protein, fat and mineral
contents (calcium and phosphorus) (Fox et al., 2000). Cheeses have longer shelf life than milk,
although it depends on the cheese type and moisture contents and cheeses hardness.
The mean squares for composition of camel milk cheese are presented in the Table 4.3. The data
showed factors like pH, temperature and CaCl2 have (p<0.01) significant impact upon the
acidity, protein, fat, moisture, and ash contents in cheese. Addition of buffalo milk had
significant affect on moisture, fat and protein but non-significantly affect acidity. The
interactions between P x C and P x C x T significantly affect the all parameters of composition.
Interaction of P x B and C x B x T significantly while P x B x T insignificantly affect the protein
content. P x T significantly affect moisture and fat contents, C x B significantly affect acidity and
protein contents. C x T significantly affect moisture, fat and protein contents. The interactive
effect of B x T and P x C x B showed significant impact on fat and protein contents while P x C x
B x T have only significant effect on acidity. Statistical analysis clearify that the variables pH,
CaCl2, Temperature and buffalo milk blend are the key parameters that can impact individually
or in combination on the properties (chemical) in milk of camel cheese.

60
Figure 4.4 Effect of two-two parameters on acidity %

61
4.3.1 Effect of processing parameters on the acidity of camel milk cheese
Acidity is used to evaluate the quality of cheese which has a main impact on taste of the cheese.
The graphical manipulation of interaction between two-two variables for acidity is described in
Figure 4.4 a-f. The interactive effect of pH with CaCl2 (Figure 4.4 a) reflected that pH have main
effect on acidity and 0.04% CaCl2 decreasing acidity than others CaCl2 (0.06, 0.08%) but this
response was more dominant in 5.3 pH than 5.5 and pH 5.7. However in case of CaCl2 and
buffalo milk blend interaction, lower acidity was attained with 0% buffalo milk and 0.04% CaCl2
(Figure 4.7 d). While concerning the interaction of temperature and blend (Figure 4.4 f) a little
change was observed at 65°C producing higher acidity at 20% buffalo milk as compared to pure
camel milk. The other interactions were non-significant for acidity (Figure 4.4 b, c, e).
The collective effect of all processing parameters on the acidity for camel milk cheese are
showed the major difference is due to the pH of cheese, while the contribution of CaCl2,
temperature and blend is low for acidity. This difference is due to the change in pH but not the
interaction.
4.3.2 Effect of processing parameters on the moisture contents of camel milk
cheese
Moisture is a vital component for cheese classification. The shelf life will be short with high
moisture while flow ability and melting property of cheeses are also improved with moisture
content. The graphical interaction of two-two variables for moisture is provided in Figure 4.5 a-f.
The interactive effect of pH with CaCl2 (Figure 4.5 a) reflects the highest and lowest moisture
contents were attained by the cheese having pH 5.7 at different CaCl2 contents. The highest
moisture was at the addition of 0.04% CaCl2 concentration while lowest with 0.08% CaCl2. In the
other cheeses having pH 5.3 and 5.5; the lowest moisture contents were obtained at higher
concentration of CaCl2. It is also observed that moisture contents were high for the cheese having
pH 5.3 except at 0.04% CaCl2 concentration. The same trend was noted in interactions of
temperature with pH, temperature and CaCl2 and temperature and buffalo blend (Figure 4.5 c, e,
f). The highest moisture contents were attained at 70°C and lowest at 65°C at the 3 levels of pH
(5.3, 5.5 and 5.7). The cheese containing 0.08% concentration of CaCl2 showed lowest moisture
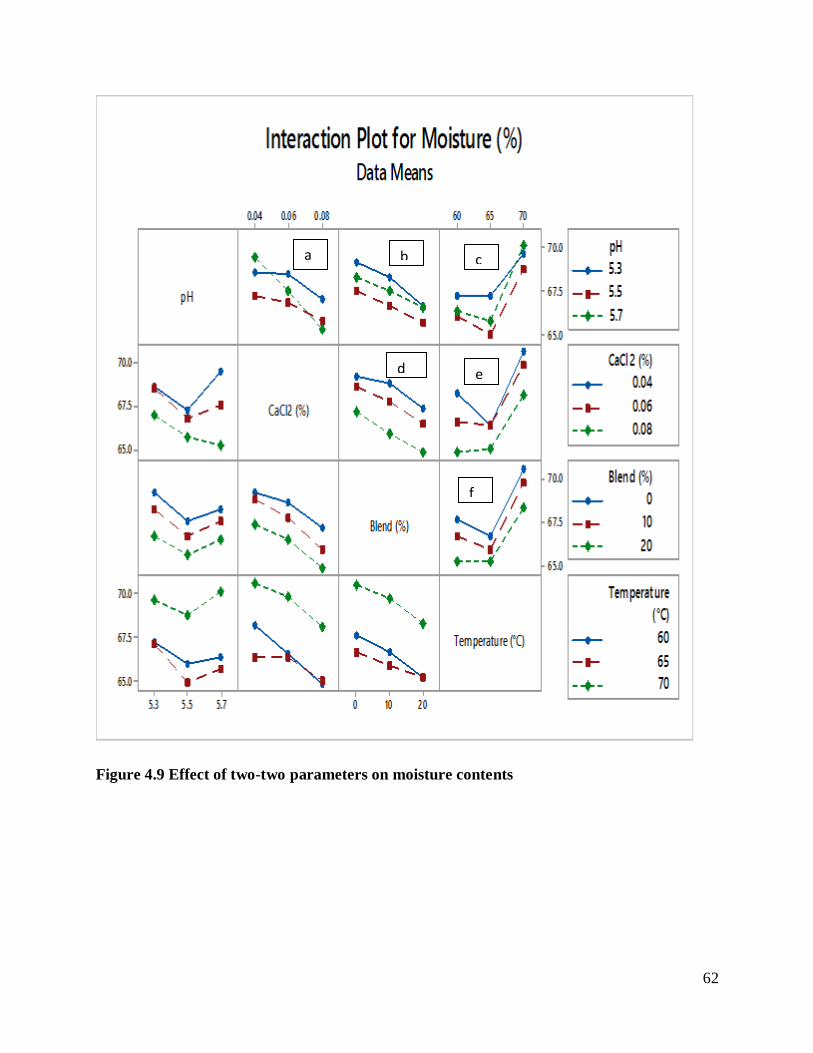
62
Figure 4.9 Effect of two-two parameters on moisture contents
a
a
b
a
c
a
d
a
e
a
f
a

63
at 65ᵒC and 20% buffalo milk blend processed at 65°C produced the cheese with lower moisture
contents. The other interactions were non-significant for moisture (Figure 4.5 b, d). The
combined effect of all parameters for moisture clearly discribed that higher moisture contents
can be attained if cheese is processed at higher temperature (70°C), without the addition of
buffalo milk and 0.04% CaCl2 while lower moisture attained in camel milk cheese with the
incorporation of 65°C, 0.08% CaCl2 concentration and 20% buffalo milk addition and 5.5pH.
4.3.3 Effect of processing parameters on the fat contents of camel milk cheese
In cheese, milk fat globules are dispersed in the form of spherical droplets covered by casein
network (Mahaia. 1995; El-Zeini, 2006). Fat % in cheese plays an important role in melting and
stretching properties (McSweeney, 2007).
The graphical interpretation of interactive effect of two-two variables on fat contents of cheese is
indicated in Figure 4.6 a-f. The combine effect of pH with CaCl2 (Figure 4.6 a) depicted that at
0.06% CaCl2 concentration the highest fat contents were again retained for the cheese having 5.5
pH. Lowest fat contents were estimated at 0.04% CaCl2 for 5.7 and pH 5.3. The interaction of pH
and CaCl2 with temperature (4.6 c, e) showed that at highest temperature (70°C) poor fat
retention was noticed at all pH (5.3, 5.5, 5.7) and CaCl2 (0.06, 0.08%) however for 0.06%
concentration CaCl2 and 65°C temperature the desirable results were obtained regarding fat
retention in camel milk cheese. Interactions other than those mentioned were insignificant
regarding the fat contents of cheese (Figure 4.6 b, d).
The cumulative effect on fat contents of all parameters are expressed that camel milk cheese if
heat processed at 65°C temperature containing 0.06% concentration of CaCl2 and pH 5.5 will
produce a cheese with higher fat contents.
4.3.4 Effect of processing parameters on the protein contents of camel milk
cheese
Protein contents and chemical and biological changes in manufacturing and cheese aging define
the acceptance with final quality of cheese. Protein also contributes in melting and stretching
attributes of cheese verities (Guinee et al., 2007).

64
Figure 4.6 Effect of two-two parameters on fat contents
a
a
a
b
a
c
d
a
e
a
f
a

65
Figure 4.13 Effect of two-two parameters on protein contents
a
a
b c
a
d
a
e
a
f
a

66
The interactive effect of two-two variables for protein contents is provided in graphical
representation in Figure 4.7 a-f. The merging effect of pH and CaCl2 (Figure 4.7 a) on the protein
contents of cheese depicted the higher protein values in cheese, which produced at 0.06% CaCl2
and pH 5.5 while cheese with pH 5.7 and 5.3 showed lower protein levels at 3 concentration of
CaCl2 (0.06, 0.04, 0.08%). The interaction of pH and buffalo milk blend (Figure 4.7 b) showed
the increasing trend in the protein contents with the addition of buffalo milk at 3 pH but more
prominent increase was noted with 5.5 pH. The analogous trend was noted in the interactive
effect of CaCl2 and buffalo milk blend (Figure 4.7 d) with the temperature, that shows increasing
the quantity of buffalo milk in camel milk improves the protein contents however 0.06% CaCl2
showed highest response. The integrative effect of CaCl2 and temperature (Figure 4.7 e) showed
the more retention of protein contents at 65°C than at 60°C and 70°C at 3 levels of CaCl2 (0.06,
0.04, 0.08%). The other interactions were non-significant for protein contents of camel milk
cheese (Figure 4.7 c, f).
The collective effect of cheese of all variables on protein contents is apparent from the graphs
that optimistic effect of 65°C, 5.5pH and 0.06% CaCl2 showed the highest level of protein
contents in cheese. It is also determined that milk of buffalo addition to milk of camel increases
the protein level in CMC.
4.3.5 Discussion of processing parameters on the chemical properties of camel
milk cheese
The composition optimization for the production of CMC is elaborated as: acidity is foremost
affected by pH, a modest affects is produced by temperature and CaCl2 concentration while at
low pH with high CaCl2 conc. and more added buffalo milk decreases the moisture contents
however high temp (70°C) produces more moist cheese than 65°C. The higher fat and protein
contents are recovered at 65°C temperature, 0.06% CaCl2 at 5.5pH with increase in buffalo milk
blend.
According to Remat, (2001) clotting and draining ability of camel milk was gradually reduced at
higher heat treatment conditions with less firmer, moist and brittle texture of cheese. This
clotting ability is the function of chemical reaction between k-CN and b-lg and total solid
contents which further slowdown the enzymatic action, while k-CN, b-lg and total solid contents

67
are low or absent in camel milk, so considering all these factors the low heat treatment (72 to
76°C for 15 to 30 seconds) for cheese production is preferred. The similar observations about
compositional effect on cheese problems are also given by Kappeler et al. (2003); Ereifej et al.
(2011); Elahj, (2015); Yadav et al. (2015). Their findings are in line with the observations of
present work.
The findings of El-Batawy et al. (2004) and El-Sisey, (2002) are line up with the observation of
the current study when preparing the cheeses with the addition of salt resulted in more moisture
(%), acidity and yield (%) than other treatments in fresh cheese. The findings of Ammar et al.
(1999) are also in agreement with the observations of present study; they made Labneh from
buffalo milk and noted higher yield than cow milk or mixed milk and they also concluded that
increasing the dose of added salt in Labneh’s milk raised the total solid content as well as yield
of the product. However the findings of Marwa et al. (2013) are partially similar with the present
observations while manufacturing Labneh with camel milk and found that heat treatment
improved which further.
The current results showed lower tends in pH to attain a higher levels of moisture. This finding is
constant with previously published findings of Yazici and Akbulut, (2007) and Ong et al. (2015).
They studied the effect of CaCl2 addition with low drainage pH and found high fat and protein
retention in cheese at low pH and CaCl2 addition which also produced cheese with low moisture
contents. They also concluded that significantly harder textural of the cheeses was attained with
a low draining pH. Bornaz et al. (2009) and Glantz et al. (2010) related the impact of CaCl2 in
cheese manufacturing with the size of micelle in milk. The amount of calcium phosphate in the
micelles are inversally related to the size of micells and smaller size was reported to improve the
gel formation. Camel milk have larger micelle size as compared to bovine milk (Farah, 1996;
Remat, 2001; Al haj and Al Kanhal, 2010), CaCl2 is effectively participate in camel milk cheese
production (Mehaia, 1993: El-Zubair and Jabreel, 2008). Aggregation of casein is also assed by
the casein charge and camel milk have more negative charge/ buffering capacity than bovine
milk, this can be manipulated by acidification or lowering pH (charge neutralization process) of
the camel milk (Farah and Bachman, 1987; Nejera et al., 2003; Siboukeur et al., 2005; Bai and
Zhao, 2015).

68
These results are also supported the current work. Simultaneously the observations of Mehaia,
(2006) and Yonas et al. (2014) on camel milk cheese production with higher protein, ash
contents and yield with the addition of CaCl2 and camel chymosin rennet strongly favored the
outcomes of present work. Konuspayeva et al. (2014) were also found faster camel milk
coagulation at lower pH however they did not found any clotting time variation and firmness of
curd with the adding of calcium. Different response of camel at low pH than bovine milk might
be due to the different protein fractions in both milks (Attia et al., 2000) and effect of pH on
flocculation on the milk of camel was noted profound and seeming when difference in pH of
fresh milk was more than rennet pH of milk in cheese making and owing to low ƙ - CN contents
rapid drop in pH was more helpful in camel milk clotting (Ramet, 2001) while Guinee et al.
(2007) noted inverse relationship in moisture contents of cheese and level of CaCl2 in directly
acidified Mozzarella cheese as the Ca level decreased the higher moisture was attained in the
cheese, contributing to a more hydration of casein.
The results of Upreti and Metzger (2006) also favor the current work. They reported that the fat
content of fat and protein of cheddar cheeses were considerably influenced by a variant calcium
concentration might be resulted with the variation of moisture contents. While the results of
Santos et al. (2013) are partially agree with the current findings. They does not observed
variation in protein and fat retention in cheddar cheese processed at pH 6.6 and pH 5.8 with the
150 and 300 ppm addition of CaCl2 or without this. Pastorino et al. (2003) correlated the increase
in protein contents due to the contraction of protein aggregates below pH 5.5, which result in
harder texture.
The results revealed the (P<0.01) important effect of pasteurization temperature at chemical
composition of CMC (Table 4.4). The 65°C found the most effective temperature while, further
increase in temperature gives unfavorable results so camel milk is unstable at high temperature.
This might be because β-lactoglobulin lack and ƙ-casein lower % in camel milk. These proteins
form a complex in cow and buffalo’s milk in cheese making (have vital impact on heat
coagulation) then stabilize whey proteins at high temperature (Fox and Hearn, 1978; Farah and
Atkins.1991; Farah, 1993; Al-Saleh, 1996). However El-Zubeir and Marowa, (2009) reported
that pasteurization improves the shelf life quality of the fermented milk products of camel
(Garris) with a minor protein variation with ash and total solid substances of pasteurized milk to
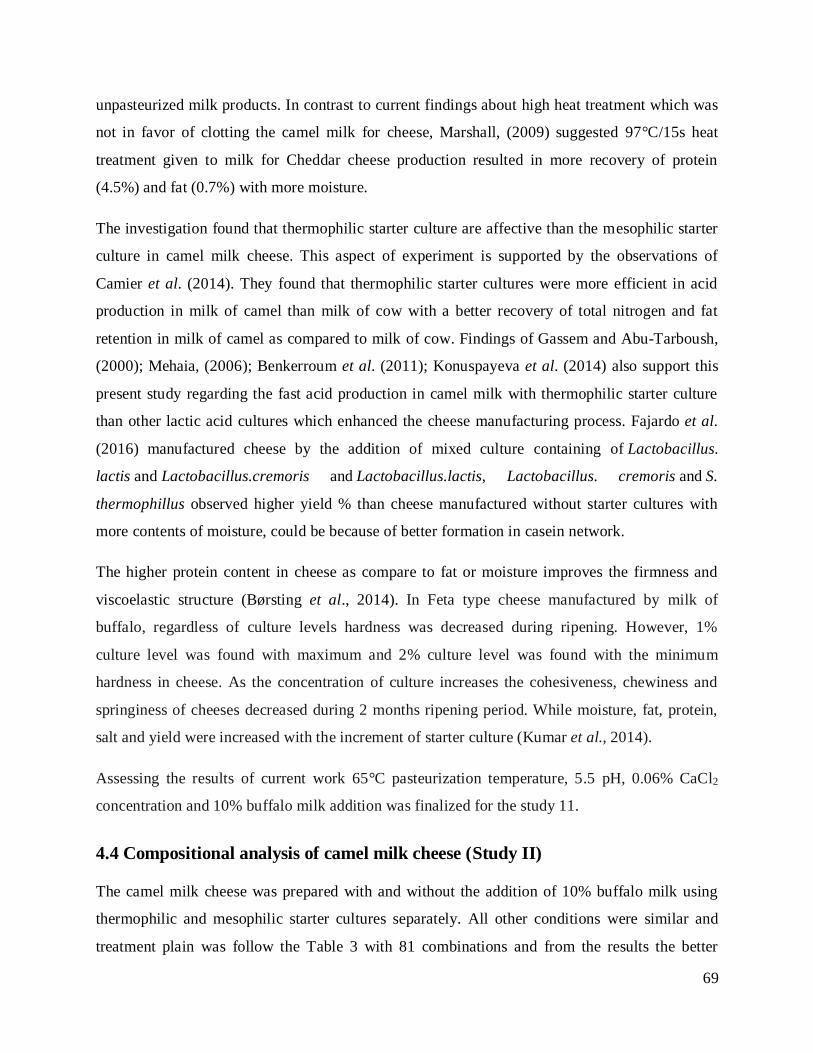
69
unpasteurized milk products. In contrast to current findings about high heat treatment which was
not in favor of clotting the camel milk for cheese, Marshall, (2009) suggested 97°C/15s heat
treatment given to milk for Cheddar cheese production resulted in more recovery of protein
(4.5%) and fat (0.7%) with more moisture.
The investigation found that thermophilic starter culture are affective than the mesophilic starter
culture in camel milk cheese. This aspect of experiment is supported by the observations of
Camier et al. (2014). They found that thermophilic starter cultures were more efficient in acid
production in milk of camel than milk of cow with a better recovery of total nitrogen and fat
retention in milk of camel as compared to milk of cow. Findings of Gassem and Abu-Tarboush,
(2000); Mehaia, (2006); Benkerroum et al. (2011); Konuspayeva et al. (2014) also support this
present study regarding the fast acid production in camel milk with thermophilic starter culture
than other lactic acid cultures which enhanced the cheese manufacturing process. Fajardo et al.
(2016) manufactured cheese by the addition of mixed culture containing of Lactobacillus.
lactis and Lactobacillus.cremoris and Lactobacillus.lactis, Lactobacillus. cremoris and S.
thermophillus observed higher yield % than cheese manufactured without starter cultures with
more contents of moisture, could be because of better formation in casein network.
The higher protein content in cheese as compare to fat or moisture improves the firmness and
viscoelastic structure (Børsting et al., 2014). In Feta type cheese manufactured by milk of
buffalo, regardless of culture levels hardness was decreased during ripening. However, 1%
culture level was found with maximum and 2% culture level was found with the minimum
hardness in cheese. As the concentration of culture increases the cohesiveness, chewiness and
springiness of cheeses decreased during 2 months ripening period. While moisture, fat, protein,
salt and yield were increased with the increment of starter culture (Kumar et al., 2014).
Assessing the results of current work 65°C pasteurization temperature, 5.5 pH, 0.06% CaCl2
concentration and 10% buffalo milk addition was finalized for the study 11.
4.4 Compositional analysis of camel milk cheese (Study II)
The camel milk cheese was prepared with and without the addition of 10% buffalo milk using
thermophilic and mesophilic starter cultures separately. All other conditions were similar and
treatment plain was follow the Table 3 with 81 combinations and from the results the better

70
combinations were selected for the study II. These cheese samples were subjected to chemical
analyses after 15 days intervals during storage of 60 days and the results obtained are presented
and discussed in the following sections.
4.4.1 Moisture contents of camel milk cheese
Chief factor which effect the characters of cheese is moisture which also impact on a plasticizer
in the matrix of protein and makes, more prone to break and less elastic upon compression. The
moisture content determination is vital in quality valuations to follow the specifications. The
moisture content difference can also impact the texture and cheese shelf‐life (Fox et al., 2000;
Lee et al., 2006).
Mean sum of squares of moisture of variable camel milk cheese are presented in Table 4.4. The
difference in cultures, addition of buffalo milk and ripening days has significant (P<0.01) effect
on moisture content of camel milk cheese. Relationship in variables showed the non‐significant
behavior on the content of moisture of cheese of camel milk.
The findings of contents of moisture of camel milk cheese are presented in Table 4.5. The values
of moisture contents shows that the cheese prepared from camel milk using mesophilic starter
culture (CM) and from mixture of camel and buffalo milk using mesophilic culture (CBM)
contained the highest moisture contents (69.37 and 67.59% respectively). The cheese prepared
from blending of camel and buffalo milk with thermophilic starter culture (CBT) indicates the
lowest moisture (55.97%). Moreover it is clear by findings, moisture contents of all type of
cheeses decreased progressively during storage. The decrease in moisture contents of CM, CT,
CBM and CBT was 1.57% (70.19 – 68.62%), 1.29% (57.07 – 55.78%), 1.56% (68.16 – 66.60%)
and 1.51% (56.66- 55.15%) respectively.
The moisture contents of fresh camel milk cheese reported by Mehaia (2006) varied within
61.96% to 64.15% which is in accordance with current investigation while Khan et al. (2004)
reported the 58.84% moisture contents however; Shahein et al. (2014) reported lower (54.67%)
values for moisture contents of camel and cow milk mixed cheese than the present findings. The
decreasing trend of contents of moisture of cheese in the storage time is sustained by the studies
of Buriti et al. (2005) and Pappa et al. (2007). They reported that moisture contents decrease in
early twenty days which could be because of increase in casein hydration or synersis

71
Table: 4.4 Analysis of variance for moisture contents in camel milk cheese
Variation Source Degree of
Freedom Sum of Squares Means Squares F-Value
Days 4 16.18 4.04 57.36**
Cheese samples 3 1893.78 631.26 8950.68**
Days x cheese
samples
12 0.55 0.04 0.65NS
Error 40 2.82 0.07
Total 59 1913.34
** = Significant at P≤0.01 NS = Insignificant
Table: 4 .5 Effect of buffalo milk, starter cultures and storage period on the moisture
content (%) of camel milk cheese
Days
Cheese
samples
0
15
30
45
60
Overall
Means
CM 70.19 ±0.15 a
69.95±0.12a 69.07 ±0.15 a 68.98 ±0.16 a 68.62±0.36 a 69.37 ±0.17 A
CBM 68.16 ±0.11 b
67.93 ±0.04 b 67.15 ±0.04 b 67.04 ±0.04 b 66.60±0.08 b 67.39±0.12 B
CT 57.07 ±0.07 c
56.92 ±0.04 c 56.58 ±0.13 c 56.30±0.08 c 55.78±0.34 c 56.53 ±0.09 C
CBT 56.66 ±0.05 d
56.38 ±0.04 c 56.14 ±0.10 c 55.54 ±0.22 d 55.15±0.15c 55.97 ±0.22 D
Similar letter in a column are non-significant (P>0.05) statistically.
CM : Camel milk + mesophilic culture
CBM : Camel + Buffalo milk + mesophilic culture
CT : Camel milk + thermophilic culture
CBT : Camel + Buffalo milk + thermophilic culture

72
while Papetti and Carelli, (2013) related this decreasing trend with the biochemical hydrolysis of
fat and protein. Change in free water into the chemically bound water could be the reason of
moisture contents reduction (Fox et al., 2000). The observed variation in moisture contents is
due to the milk source agreed with the findings of Sameen et al. (2010). The low contents of
casein fraction are the foremost important factor affecting curd firmness and moisture retention
(Lawrence et al., 1987: Ramet, 2001). This could be the reason of high moisture contents of
camel milk cheese as compared to blend milk cheese.
Siddig et al. (2016) revealded that effective starter cultures were resulted in the change of
moisture contents of camel mixed cow milk cheese (68.42% to 60.49%) while Kameni et al.
(2006) and Pappa et al., (2007) founded the higher moisture/DM content in the cow cheeses
prepared from thermophilic culture as compared to mesophilic culture. Fajardo et al. (2016)
reported the non -significant difference in the cheese moisture contents with different starter
cultures. Ahmed and Kanwal, (2004) reported that some species of lactobacillus and
streptococcus grew better in camel cheese than others. The sited difference might be co- related
with difference in rate of acidicidy of cultures in the camel milk which impacted the moisture
content of cheese (Dave et al., 2003).
4.4.2 pH value of camel milk cheese
Among the numerous aspects of cheese processing and ripening, pH plays a vital role in
determination of characteristics of cheese (McSweeney et al., 2007).
The results of statistical analysis of cheese samples of milk of camel are presented in Table 4.6,
apparent by the data the starter cultures, addition the milk of buffalo and storage period affected
(significantly P<0.01) the pH of all cheeses. The correlation in the different parameters also
revealded a significant (P<0.05) impact on the cheese pH.
The regarding pH values of mean of cheese of camel milk is elucidated in Table 4.7. The values
of the pH showed that cheese prepared from the camel and buffalo milk blended with
thermophilc starter culture (CBT) showed the lowest pH value (4.74) followed by camel milk
cheese with thermophilic culture (CT 4.83). The pH of camel milk cheese, camel and buffalo
milk blend cheese with mesophilic (CM and CBM) was 4.97 and 4.93 respectively. The
difference between values was insignificant. It is apparent from the results that pH of all type of

73
Table: 4.6 Analysis of variance for pH of camel milk cheese
Source of
Variation
Degree of
Freedom Sum of Squares Means Squares F-Value
Days 4 0.92 0.23 60.82**
Cheese samples 3 0.45 0.15 39.98**
Days x cheese
samples
12 0.10 0.008 2.23*
Error 40 0.15 0.004
Total 59 1.63
** = Significant at P≤0.01 NS = Insignificant
Table: 4.7 Effect of buffalo milk, starter cultures and storage period on the pH of camel
milk cheese
Days
Cheese samples
0
15
30
45
60
Overall
Means
CM 5.13±0.03 a 5.11±0.07a 4.96±0.06a 4.85±0.03a 4.78±0.05a 4.97±0.03 A
CBM 5.27 ±0.03b 5.15±0.07a 4.87±0.0b 4.81±0.03a 4.70±0.05b 4.92±0.04 A
CT 5.00±0.06c 4.89±0.02b 4.83±0.03b 4.76±0.02b 4.69±0.03b 4.83±0.06 B
CBT 4.86±0.03d 4.79±0.01b 4.73±0.01c 4.70±0.01c 4.64±0.04c 4.74±0.03 C
Similar letter in a column are insignificant (P>0.05) statistically.
CM : Camel milk + mesophilic culture
CBM : Camel + Buffalo milk + mesophilic culture
CT : Camel milk + thermophilic culture
CBT : Camel + Buffalo milk + thermophilic culture

74
cheese decreased progressively during storage. The decrease in pH of CM (5.13-4.78), CT (5.00-
4.69), CBM (5.27-4.70) and CBT (4.86-4.64) was observed as 0.35, 0.31, 0.57 and 0.22% during
storage of 60 days. Decrease in pH during storage can be associated with the rise in lactic acid
because of the lactic acid bacteria utilizatied lactose. Hydrolysis of protein into amino acids and
fats into fatty acids could also be the cause of decrease in pH of cheese (Cogan et al., 2000).
The results illustrated that pH level of cheese was also significantly (P<0.01) affected by the
starter cultures because the cheese manufactured from camel milk and camel with buffalo milk
using thermophilic starter culture had higher pH than the cheese manufactured with mesophilic
culture. Inayat et al. (2003) and Hailu et al. (2014) revealded a comparasion pH (5.23) value in
camel cheeses. Similar kind of difference in pH (4.90 to 4.78) noted by Marwa et al. (2013)
while working on Labneh preparation from camel milk using thermophilic culture. This might be
due to the higher biochemical activity thermophilc starter cultures as compared to mesophilic
cultures used in the cheese production. Basic function of starters is to utilize the lactose and
convert it into acid in the cheese milk (Vernam and Sutherland, 1994; Farkye, 2004).
Increase in acid production with thermophilic culture was also noted by Michel and Martley
(2001). Similarly Mehaia (1993) and Gassem and Abu-Taboush (2000) founded the more lactic
acid production by thermophilic / yoghurt starter culture in camel milk cheese. The lower rate of
pH reduction proves better for camel milk coagulation (Farah and Bachamann, 1987; Khan et al.,
2004). The findings of various researchers (Gassem and Abu-Tarboush, 2000; Carrasco et al.,
2005; Siboukeur et al., 2005; Mehaia, 2006; Benkerroum et al., 2011; Konuspayeva et al., 2014)
support the results of current work regarding the acid production in milk of camel. This might be
related with higher buffering capacity of milk of camel to bovine milk (Camier et al., 2014: Bai
and Zhao, 2015).
4.4.3 Acidity of camel milk cheese
The lactic acid production with additional acids by fermentation of lactose is common in all type
of cheese during storage and ripening. The increase in acidity reduces the spoilage organisms,
influences the coagulant/enzymes activity in processing and aging, colloidal calcium phosphate
solubilisation, promote synersis, ultimately affect the texture, flavor and quality of cheese
(McSweeney, 2007).

75
Table: 4.8 Analysis of variance for acidity of camel milk cheese
Source of
Variation
Degree of
Freedom Sum of Squares Means Squares F-Value
Days 4 0.60 0.15 29.34**
Cheese samples 3 0.16 0.05 10.48**
Days x cheese
samples
12 0.01 0.002 0.31NS
Error 40 0.20 0.005
Total 59 0.99
** = Significant at P≤0.01 NS = Insignificant
Table: 4.9 Effect of buffalo milk, starter cultures and storage period on the acidity (%) of
camel milk cheese
Days
Cheese
samples
0
15
30
45
60
Overall
Means
CM 0.63±0.04a 0.72±0.04a 0.80±0.01a 0.89±0.04a 0.92±0.03a 0.80 ±0.02 A
CBM 0.66±0.06a 0.73±0.07b 0.76±0.07a 0.88±0.04a 0.97±0.05a 0.90±0.03
A
CT 0.78±0.04b 0.85±0.04c 0.98±0.04b 1.01±0.04b 1.11±0.01b 0.95 ±0.03
B
CBT 0.83±0.02c 0.89±0.02c 0.99±0.04b 1.11±0.02c 1.16±0.01b 1.0 ±0.02B
Similar letter in a column are insignificant (P>0.05) statistically.
CM : Camel milk + mesophilic culture
CBM : Camel + Buffalo milk + mesophilic culture
CT : Camel milk + thermophilic culture
CBT : Camel + Buffalo milk + thermophilic culture

76
The results regarding the analysis of variance for acidity of camel milk cheese discussed in Table
4.8. It is apparent from the data starter culture, addition of buffalo milk and storage period
significantly (P<0.01) affect the acidity% of different cheeses. The interaction among these
variables showed insignificant effect.
The mean storage values of and samples of cheese difference of acidity mentioned in the Table
4.9 depicted that cheese prepared from mesophilic starter culture with camel milk (CM) and
camel with buffalo milk blend (CBM) contained lower acidity (0.80% and 0.90% respectively)
than the acidity level of thermophilic culture in camel milk (CT) and camel milk buffalo blend
cheese (CBT) with thermophilic culture (0.95% and 1.0% respectively). An insignificance
difference was noticed between the cheeses containing the thermophilic starter, similar was the
case of cheeses contains mesophilic cultures. It is obvious from the results that increased acidity
% was observed in all type of cheese during storage. The total increase in acidity % noted was
0.29, 0.33, 0.31 and 0.33 in CM, CT, CBM and CBT respectively. The Vernam and Sutherland
(1994) reported that the acidity ranges between 0.9 to 1.0% which supports the present findings.
Marwa et al. (2013) also observed the compare able range of acidity in camel milk cheese (0.82-
1.02%).
Inayat et al. (2003) and Fajardo et al. (2016) observed the relatively higher acidity values in
cheese with starter culture (Thermophilic) as compared to controlled (without culture). Farah and
Bachamann (1987), Sert et al. (2007) reported the significant difference in the acidity with the
use of different starter cultures. Increased acid production by thermophilic culture in camel milk
cheese is also reported by Mehaia, (1993), Gassem and Abu-Taboush, (2000) and Michel and
Martley, (2001).
Chaves et al. (1999) observed the significant acidity rise in the storage of cheese (Mozzarella)
which can support, current study as a function of ripening period. Alike same acidity rise in
cheese was revealded by Hailu et al. (2014) while using thermophilic culture. The production of
lactate in the ripening could be an important precursor for microbial metabolism or oxidation
(Ong et al., 2007) which leads to acidity variation in the further ripening period of cheese.
4.4.4 Protein contents of camel milk cheese
The casein content has significant effects on the biochemical changes during cheese making and
ripening which ultimately influence final quality of cheese (Guniee et al., 2007).

77
The results regarding the protein content of camel milk cheese are apparent in Table 4.10. The
analysis showed that effect of storage period and difference in cheese samples have (P<0.01)
significant effect on protein of camel milk cheeses. While their interaction depicted insignificant
effect. The protein contents of cheese mentioned in Table 4.11. It is apparent that the protein
contents of cheese containing the buffalo milk (CBM and CBT) retained more protein (20.54%
and 20.81% respectively) as compared to cheese containing camel milk (CM, 18.94% and CT,
18.99%). The culture effect showed insignificant impact. The protein contents decreased 21.04-
20.16% in CBM, 19.51- 18.51% in CM, 19.65-18.37% in CT and 21.57-20.17% in CBT during
storage of 60 days. Inayat et al. (2003) reported the 19.64% protein contents in soft unripened
camel milk cheese which is comparable with the current work. The variation in protein content
among different cheese samples prepared from buffalo and camel blended milk and pure camel
could be due to the presence of high content of protein/CN in the milk of buffalo than milk of
camel (Table 4.1). Many researchers also found that high protein content in milk will produce
cheeses of high content of protein. (Fox and McSweeney, 2004; Ahmad et al., 2008; Sameen et
al., 2010).
The higher acidity and lower pH in camel cheese blended with buffalo milk might be another
reason for more retention of protein. The finding of Khan et al. (2004): Pappa and Satirakoglou,
(2008); Kumar, (2014) and Shahein et al. (2014) related the current work. They found the
increased protein cheese amount with thermophilic starter culture than starter culture of
mesophilic type. Although the impact of culture is insignificant in findings of current study
however the overall decrease in protein is noted more in the cheese samples with thermophilic
cultures (1.4 - 1.26%) as compared to the cheese made with mesophilic culture (0.88 - 1%).
Decreased amount of protein during storage indicate the hydrolysis of protein which remained
portion of compound of soluble nitrogenous, diffused in the phase (serum) during storage
(Michaeldous et al., 2005).

78
Table: 4.10 Analysis of variance for protein of camel milk cheese
Source of
Variation
Degree of
Freedom Sum of Squares Means Squares F-Value
Days 4 9.92 2.48 22.22**
Cheese samples 3 44.46 14.82 132.75**
Days x cheese
samples
12 0.34 0.02 0.25NS
Error 40 4.46 0.11
Total 59 59.20
** = Significant at P≤0.01 NS = Insignificant
Table: 4.11 Effect of buffalo milk, starter cultures and storage period on the protein
content (%) of camel milk cheese
Days
Treatments
0
15
30
45
60
Overall
Mean
CM 19.51±0.09b 19.19±0.15b 18.91±0.08b 18.61±0.22b 18.51±0.15b 18.94±0.04
B
CBM 21.04±0.10a 20.76±0.14a 20.46±0.08a 20.24±0.14a 20.16±0.07a 20.54 ±0.03A
CT 19.65±0.13b 19.14±0.15b 18.89±0.06b 18.56±0.17b 18.39±0.23b 18.99±0.11
B
CBT 21.57±0.12a 21.15±0.10a 20.77±0.07a 20.37±0.10a 20.17±0.20a 20.81
±0.02 A
Similar letter in a column are insignificant (P>0.05) statistically.
CM : Camel milk + mesophilic culture
CBM : Camel + Buffalo milk + mesophilic culture
CT : Camel milk + thermophilic culture
CBT : Camel + Buffalo milk + thermophilic culture

79
4.4.5 Fat contents of camel milk cheese
The fat contributes to cheese texture, taste and appearance by interstitial spaces filling in the
mineral structural and protein network and influence the ultimate cheese quality (Fox and
McSweeney, 2004; Kucukoner and Haque, 2006). Additionally fat contents of milk affect the
processing and cheese functional properties.
The results regarding the analysis of variance for content of fat cheese of camel milk elucidated
in Table 4.12. The results indicate the significant (P≤0.01) effect of cheese samples (starter
culture × buffalo milk blend) and storage period on the fat contents of camel milk cheese while
their interactive is insignificant (P>0.05) impact. The mean fat content values (Table 4.13) of
explain that cheese manufactured from camel milk using mesophilic and thermophilic cultures
(CM, CT) retain low fat contents (15.76 and 15.73%) then cheese prepared from blend of camel
and buffalo milk using mesophilic and thermophilic starter cultures (CBM 17.31%, CBT 17.34%
). Results reveled that fat contents of all type of cheese decreased progressively during storage.
The decrease in fat contents (Table 4.13) of CBM, CM, CBT and CT was 17.65-16.94%, 16.08-
15.31%, 17.70-16.95% and 16.04-15.29% respectively.
The results of the current work were in similarity with the results of Shahein et al. (2014),
revealded that content of fat in soft camel milk cheese and blended camel milk cheese were
16.10% and 22.30% respectively. The difference in fat contents of camel milk cheese were
affected with the addition of buffalo milk which might be effective with the high fat contents in
milk of buffalo (Table 4.1) than milk of camel (Sameen et al., 2010; Imtiaz et al., 2012; Shahein
et al., 2014). Size of fat globules in milk of camel is smaller as compared to buffalo fat, hence
loss of fat in the whey could be another reason of low fat contents in camel milk cheese
(Brezovecki et al., 2015). The findings of Ramet (2001) relate this with the reduced fat contents
in the camel milk cheese, and might be the weak binding capacity of camel milk curd resulted in
high whey fat losses which ultimately affect sensory characters and yield.
Decrease in fat contents during storage (0.71 – 0.77%) could be due to the lipolysis by the starter
cultures. Lipolysis can be caused by various milk and microbial enzymes (Ramat, 2001). Lipase
hydrolyses the carboxylic ester bond in fat, release free fatty acids (FFA) and glycerol
(Ravishankar, 2016). Short chain FFAs C4 and C6 are mainly produced during this process.
These short chain fatty acids can be catalyzed by microbial enzymes resulting in the formation of
flavouring compounds (McSweeny and Sousa, 2000; McSweeny, 2007; Fox et al., 2004)

80
Table: 4.12 Analysis of variance for fat of camel milk cheese
Source of
Variation
Degree of
Freedom Sum of Squares Means Squares F-Value
Days 4 4.16 1.04 63.50**
Cheese samples 3 37.44 12.48 760.51**
Days x cheese
samples
12 0.04 0.004 0.22NS
Error 40 0.65 0.01
Total 59 42.31
** = Significant at P≤0.01 NS = Insignificant
Table: 4.13 Effect of buffalo milk, starter cultures and storage period on the fat content
(%) of camel milk cheese
Days
Cheese
sample
0
15
30
45
60
Overall
Means
CM 16.08±0.04b 15.95±0.06b 15.83±0.03b 15.63±0.05b 15.31±0.09b 15.76 ±0.05
B
CBM 17.65±0.03a 17.50±0.03a 17.32±0.10a 17.15±0.10a 16.94±0.09a 17.31 ±0.06
A
CT 16.04±0.07b 15.95±0.07b 15.80±0.07b 15.57±0.11b 15.29±0.14b 15.73±0.04
B
CBT 17.70±0.02a 17.55±0.06a 17.31±0.06b 17.18±0.09a 16.95±0.05a 17.34±0.05
A
Similar letter in a column are insignificant (P>0.05) statistically.
CM : Camel milk + mesophilic culture
CBM : Camel + Buffalo milk + mesophilic culture
CT : Camel milk + thermophilic culture
CBT : Camel + Buffalo milk + thermophilic culture

81
4.5 Sensory evaluation of camel milk cheese
Sensory evaluation is an important part of cheese quality used to judge the preference of
consumers through several sensory attributed of cheese like appearance, flavour, color, taste and
texture. There are significant variations in sensory profile of cheese due to their diversity in
composition, extent of proteolysis and texture (Jerónimo and Malcata, 2013). In present
investigation 9-point hedonic scale was used for the estimation of each sensory attribute.
The statistical analyses of the data regarding the effect of cheese samples (treatments) and
storage period on the sensory characteristics (texture, flavour, taste, colour and overall
acceptability) is being illustrated in Table 4.14. The highly (significant) storage period effect,
treatment and their corelation (p<0.01) on all the sensory traits.
The scores for sensory attributes obtained by the different treatments from day 1 to 60 are
presented in Tables 4.15-4.19. The data for texture (Table 4.15) showed that cheese prepared
from blend of camel and buffalo milk scored higher with thermophilic culture for texture as
compared to pure camel milk. However, a highest value was found for CBT (9.00) and lowest
for CM (7.70). A decreasing trend in texture scores was noticed in all the cheese samples during
storage.
The scores for flavor evaluation of all camel milk cheese are presented in the Figure 4.16. There
was significant difference in all the cheese samples (CM, CT, CBM and CBT). The cheese
prepared samples by the blend of camel and milk of buffalo, containing thermophilic starter
cultures gained the higher scores (7.69) than the cheese samples prepared only from buffalo milk
and mesophillic starter cultures (4.99). All the cheeses attained higher score for flavor up to 30 th
days of storage and then a decrease was noted with the proceeding of storage. According to
scores assigned to cheese samples, CBT cheese was more preferred followed by the CBM and
CT cheese samples.
Contradictory to the other sensory traits, the taste scores (Table 4.4) allotted to all types of
cheese improves with storage up to the 45th day of storage; afterword a decline was clearly
visible till the end of storage. Like other sensory parameter, the scores of taste assigned to CBT
were highest following by the CBM, CT and CM, however at the end of storage CT and CM
became equivalent to each other regarding the taste scores.

82
The results for color of camel milk cheese are depicted in the Table 4.18. The graphical
presentation showed that camel and buffalo milk blend cheese using thermophilic culture (CBT)
got the maximum score (8.77) for color as compared to the other cheeses samples. Pure camel
milk cheese samples were not attractive by the panalists as compred to blended one. However
with the storage period color likeness for all cheese was reduced. The reduction in scores up to
45 days was at slower rate but after that a prominent decrease was noticed. Overall acceptability
of the sensory characteristics (texture, flavor, taste, color) as mentioned in Figure 4.19,
exposed that storage period has negative impact on all the sensory characteristics after 30
days of storage which means that camel milk cheese samples can be acceptable for 30 days. In
comparison among the cheese samples, CBT remained at the top followed by CBM till 30
storage days.
Chemical composition of the milk for cheese (especially calcium and protein content) and
manufacturing process influenced the texture of cheese (McSweeney, 2007; Pappa et al., 2007).
Kindstedt, (1995) observed the decreasing trend in texture of Mozzarella cheese which the
supported the findings of the present studies. Khan et al. (2004) mentioned the texture of the
milk of camel cheese prepared with using starters (yoghurt culture) was more preferred as
compared to the cheese prepared by direct acidification. However, all cheeses were accepted by
the panellists.
The finding of El Zubeir and Jabreel (2008) and Mehaia (1993) were in line with the results of
current study, who reported the excellent overall acceptability of camel milk cheese while some
evaluators noticed a harsh flavor in camel cheeses. Improvement in flavor and taste during
storage are the result of processes of metabolizum bring change for the texture and flavor
changes in cheese (McSweeney, 2007). The enzymes from microbial and remaining rennet
continue to breakdown of fat and protein (McSweeney, 2007; Smit et al., 2005), more flavoring
compounds are produced in cheeses, which result in the improvement of sensory characters up to
certain period of time. Prolong storage of soft cheese can be responsible for some kind
deteriorations in cheese. Kosikowski (1997) relate the improvement in sensory attributes with the
development of lactic acid that regulate the development of unwanted organisms. The flavor
improvement coulde be because of the initial present natural flora in milk of buffalo that take
part in flavor improvement. However the findings of Ramet (2001) related the sensory characters
of camel milk cheese with the reduced fat contents in the camel milk. Less short chain fatty acids

83
percentage in milk of camel than milk of bovine might be another reason that can affect the
sensory attributes of camel milk cheese (Stahl et al., 2006).
Fajardo et al. (2016) found, cheese manufactured by starter cultures has better sensory scores in
general acceptability compared to control. They also conclude that type of starter culture seems
to enhance the aroma, cheese texture and flavor. Shahein et al. (2014) findings are in line results
with present study regarding the improvement in the sensory characters of camel milk cheese
blended with buffalo milk and improved with the storage time up to certain level. Sulieman et al.
(2016) also concluded that cheese sensory quality improved by blending by milk of camel with
milk of cow and starter culture influence on flavor, texture and appearance as compared to direct
acidified cheeses. Mehaia, (1993); Gassem and Abu- Tarboush, (2000); also found the flavor
improved in milk of camel cheese by the use of yoghurt starters. Yoghurt starters are the
thermophilic culture as utilized in the present investigation. Rahman et al. (2009) reported the
significantly higher sensory score of milk of camel by yogurt (L. bulgaricus and St.
thermophilus, 1:1) culture fermented as compared to L. bulgaricus, St. thermophilus and L.
acidophilus and Lactococcus lactis when used singly.
Similar finding was obtained by Kamini et al. (2006); Rahman et al. (2009) while making camel
milk cheese and found that thermophilic starter cultures were more preferred than mesophillic
starter culture and both cultures were also different in their lipolytic activity. The cheese color
reflected by the animal diet and milk type such as buffalo, camel, cow and goat and season.

84
Table 4.14 Mean squares for texture, flavor, taste, color and overall acceptability of camel
milk cheese
Source of
Variation
Degree
of
Freedom
Texture Flavor Taste Color Overall
acceptability
Days 4 2.86** 3.23** 12.87** 15.07** 12.93**
Cheese
samples
3 21.45** 11.13** 8.39** 3.08** 10.63**
Days x
cheese
samples
12 0.13** 0.07** 0.15** 0.66** 0.41*
Error 40 0.02 0.02 0.02 0.02 0.18
Total 59
* = Significant (P≤ 0.05)** = Highly Significant (P≤0.01) NS = Insignificant
Table 4.15 Effect of camel, buffalo milk and starter culture on texture of camel milk cheese
during storage
Treatments Day-1 Day-2 Day-3 Day-4 Day-5
CM 7.70
±0.06b
7.54
±0.04b
7.02
±0.07bc
6.70
±0.09c
6.40
±0.02c
CT 8.27
±0.09b
8.07
±0.08b
7.59
±0.06bc
7.06
±0.03c
6.52
±0.07c
CBM 8.90
±0.06a
8.65
±0.15ab
8.18
±0.15b
7.91
±0.15b
7.60
±0.06c
CBT 9.00
±0.08a
8.97
±0.05a
8.65
±0.12a
8.39
±0.10ab
7.69
±0.07b
Similar letter in a column are statistically non-significant (P>0.05).

85
Table 4.16 Effect of camel, buffalo milk and starter culture on flavour of camel milk cheese
during storage
Treatments Day-1 Day-2 Day-3 Day-4 Day-5
CT 4.69
±0.02i
4.70
±0.13gjo
4.53
±0.10hi
4.19
±0.15i
4.07
±0.03i
CM 5.34
±0.06fgh
5.14
±0.06efg
4.82
±0.12e
4.30
±0.04fgh
4.17
±0.18i
CBM 6.80
±0.01e
5.58
±0.04cd
5.24
±0.08c
5.19
±0.06de
5.29
±0.07fgh
CBT 7.69
±0.02bc
7.07
±0.03ab
6.30
±0.03a
6.11
±0.04bc
5.70
±0.13ef
Similar letter in a column are statistically non-significant (P>0.05).
Table 4.17 Effect of camel, buffalo milk and starter culture on taste of camel milk cheese
during storage
Treatments Day-1 Day-2 Day-3 Day-4 Day-5
CT 5.29
±0.03jk
5.53
±0.08hi
6.14
±0.10fg
4.45
±0.10k
3.95
±0.04l
CM 6.37
±0.03ef
7.00
±0.06cd
6.89
±0.06cd
5.27
±0.07ij
4.31
±0.09kl
CBM 6.61
±0.14de
7.22
±0.06bc
7.23
±0.05bc
5.78
±0.11gh
5.03
±0.07j
CBT 7.51
±0.08ab
7.74
±0.13a
7.82
±0.12a
5.86
±0.07gh
5.23
±0.06ij
Mean sharing similar letter in a column are statistically non-significant (P>0.05).
CT = Camel milk + mesophilic culture
CM = Camel milk + thermophilic culture
CBM = Camel + buffalo milk + mesophilic culture
CBT = Camel + Buffalo milk + thermophilic culture
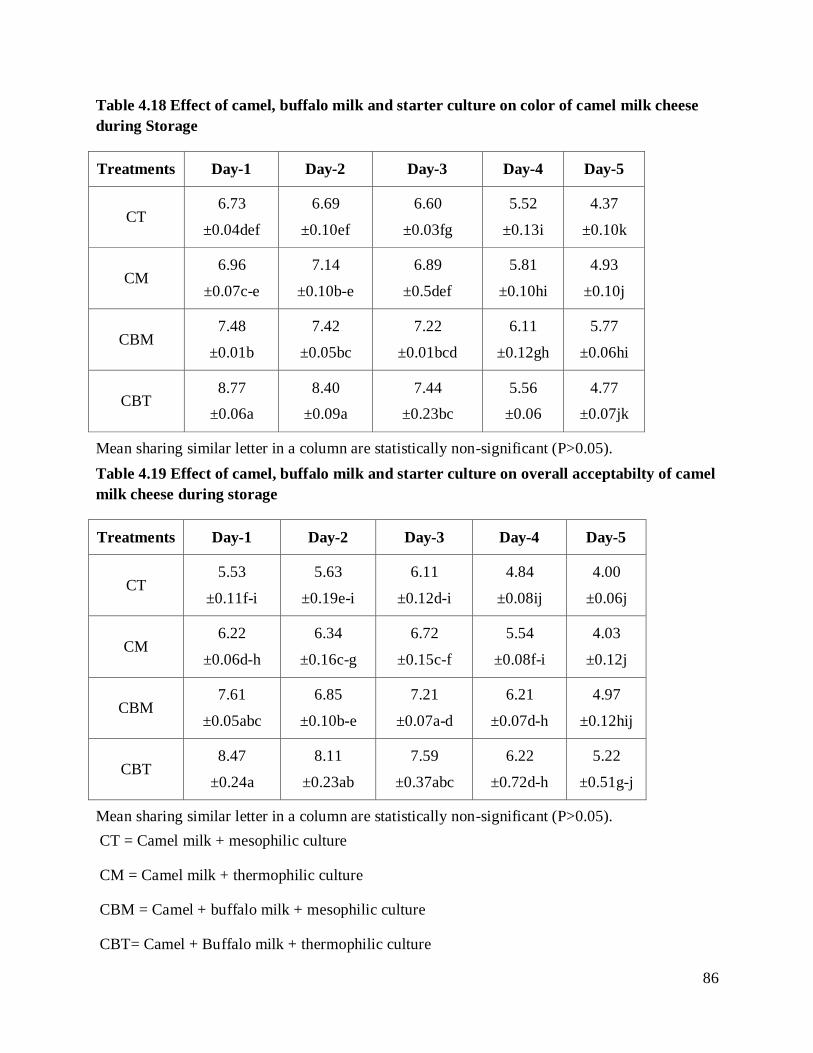
86
Table 4.18 Effect of camel, buffalo milk and starter culture on color of camel milk cheese
during Storage
Treatments Day-1 Day-2 Day-3 Day-4 Day-5
CT 6.73
±0.04def
6.69
±0.10ef
6.60
±0.03fg
5.52
±0.13i
4.37
±0.10k
CM 6.96
±0.07c-e
7.14
±0.10b-e
6.89
±0.5def
5.81
±0.10hi
4.93
±0.10j
CBM 7.48
±0.01b
7.42
±0.05bc
7.22
±0.01bcd
6.11
±0.12gh
5.77
±0.06hi
CBT 8.77
±0.06a
8.40
±0.09a
7.44
±0.23bc
5.56
±0.06
4.77
±0.07jk
Mean sharing similar letter in a column are statistically non-significant (P>0.05).
Table 4.19 Effect of camel, buffalo milk and starter culture on overall acceptabilty of camel
milk cheese during storage
Treatments Day-1 Day-2 Day-3 Day-4 Day-5
CT 5.53
±0.11f-i
5.63
±0.19e-i
6.11
±0.12d-i
4.84
±0.08ij
4.00
±0.06j
CM 6.22
±0.06d-h
6.34
±0.16c-g
6.72
±0.15c-f
5.54
±0.08f-i
4.03
±0.12j
CBM 7.61
±0.05abc
6.85
±0.10b-e
7.21
±0.07a-d
6.21
±0.07d-h
4.97
±0.12hij
CBT 8.47
±0.24a
8.11
±0.23ab
7.59
±0.37abc
6.22
±0.72d-h
5.22
±0.51g-j
Mean sharing similar letter in a column are statistically non-significant (P>0.05).
CT = Camel milk + mesophilic culture
CM = Camel milk + thermophilic culture
CBM = Camel + buffalo milk + mesophilic culture
CBT= Camel + Buffalo milk + thermophilic culture

87
4.6 Assessment of camel milk cheese proteolysis during storage
Proteolysis is the complex biochemical changes occurred in cheese in the manufacturing and
storage through with activities of proteinases and peptidases which could be from starter and non
starter lactic acid bacteria (NSLAB) which may native and derived.
Proteolysis takes place at three stages 1; in raw milk before cheese making, 2; during coagulation
of milk by the rennet, and 3; during ripening. Leucocytes proteinases are lew active as compared
microbial proteinase. Milk native proteinase (Plasmin), the can also do β-casein hydrolysis
significantly. Rennet is chief agent to control the breaking of κ-casein, at pond of peptide
between phenylalanine and methionine (105-106) during coagulation process (Fox, 1989). The
proteolysis is further divided into primary and secondary proteolysis during ripening. The
proteins (caseins) are hydrolysed into amino acids in primary proteolysis, which later on
catabolise into various flavoring compounds during secondary proteolysis (McSweeney, 2007).
The extent of proteolysis can be quantified through several techniques. It is also indicate the
protein matrix integrity. The present investigation it is being quantified through Urea-PAGE and
HPLC, which are presented and discussed in the following sections.
4.6.1 Urea-PAGE
The results with reference to the Urea–PAGE of cheese in the form of chromatograms are being
presented in Figures 4.8a-c. Two bands of protein, β-casein and αs1-casein are clearly visible
from the Figure 4.8a in all samples of cheese at day one of storage. However, the width of bands
is little bit high in milk of camel cheese containing buffalo milk (CBM and CBT). Casein
fractions are being labeled according to bovine milk sodium caseinate which was used as
standard. Electrophoretogram mainly showed the difference in casein fractions (αs1- and β-
casein) of different cheeses samples.
In Figure 4.8b after 30 days of storage, the four bands were visible in all the cheese samples,
which showed that part of the αs1- and β-casein has been hydrolyzed into other unknown
fractions. The intensity of the bands referred to αs1- and β-casein shown in Figure 4.8a has been
reduced in Figure 4.8b after 30 days of storage. The density of band could not be measured due
to unavailability of the equipment. This is the only visual observation. The protein fraction band
below the αs1-casein was broader (Figure 4.8b) that could be the fraction of αS1-casein (f24–
199) as reported by McSweeney et al, (1993) and Fox and McSweeney (2000).

88
After 60 days storage or ripening at 4°C (Figure 4.8c), the extent of proteolysis was visible in the
increase in number of bands and decrease in the density of the αs1- and β-casein. The results of
Urea-PAGE are supported by the results of HPLC, which also show the reduction in the
percentage of casein intacted and increase in water soluble fractions in cheese. The concentration
of different fractions was not estimated in the Urea-PAGE, because the main intension was to
check the proteolysis not the nature of fractions. It is also noticed from the results that the bands
of BCM and CBT are lighter than the CM and CT after 60 days which could be the indicator
more proteolysis in buffalo milk containing cheese.
4.6.2 RP-HPLC
Aging is a natural process, in which broken down of caseins by proteolysis into their hydrolytic
products. The αs-1, αs-2 and β-casein hydrolysis in milk of camel cheeses, is an important event
of casein degradation by residual coagulant. The quantity of breakdown of casein in milk of
camel cheese by thermophilic and mesophilic culture and storage time is monitored in the result.
The defatted cheese samples were divided into two portions; water soluble and insoluble. Water
insoluble fraction was used to study the proteolysis in terms of no of peptide compounds formed
during storage, while insoluble fraction indicated the amount of intact caseins or the hydrolysis
of casein in camel milk cheeses. Casein of camel was utilized as standard in camel milk cheeses
to assess the degree of hydrolysis (Figure 4.9). The peaks designated form s-CN, -CN and k-
CN appeared after 48, 47, 54 and 21min retention times.
Insoluble fraction of cheese at pH 4.6
In camel milk cheeses three peaks of αs-1, k- CN and β-CN were recognized by relating their
time retention by casein standard of camel milk (Figure 4.9). The effect of storage days, buffalo
milk and starter cultures on the s-CN, β-CN and -CN are exposed in the Figures 4.10a-c and
their statistical evaluation is given in Table 4.20. The results regarding the -CN (Table 4.20a)
indicates the significant reduction during storage. There is insignificant difference between CM
and CBM with reference to the culture at day 1, 30 and 60, while the CBT and CT at 60th day
only. The statistical analysis of -CN also indicate the consistent reduction in the intact casein
till the end of storage. It is apparent from the results that the CBT contained the lowest value of
-CN at the day one, which indicate higher rate of proteolysis

89
Figure 4.8 a. Electrophotograph of camel milk cheese at day one
Figure 4.8 b. Electrophotograph of camel milk cheese after 30 days
S = Casein standard C1= Camel milk + mesophilic culture
C2 = Camel milk + mesophilic culture C3= Camel+ buffalo milk + thermophilic culture
C4 = Camel + buffalo milk + thermophilic culture

90
Figure 4.8 c. Electrophotograph of camel milk cheese after 60 days
S = Casein standard C1= Camel milk + mesophilic culture
C2 = Camel milk + mesophilic culture C3= Camel+ buffalo milk + thermophilic culture
C4 = Camel + buffalo milk + thermophilic culture

91
during the cheese making as well. The starter cultures also showed significant impact on this
casein. Regarding the result of k-casein, the change was noticed upto the 30 days of ripening,
afterword an insignificant reduction was noticed.
The graphical presentation of the -CN also indicate the graduation degradation of this casein,
but the lowest amount or intact casein was in CT and CBT, which indicate the higher rate of
proteolysis. Similarly the graphical presentation of -CN indicate the higher casein in CBM
followed by the CM, CT and CBT. The higher value in cheese containing buffalo milk would be
because of high content of casein in that milk. Lower values of proteolysis extent of intact casein
indicate. The Figure 4.10c showed the strength of k-CN in the cheese. The CBM contains the
higher amount, followed by CM, CT and CBT.
Soluble fraction of cheese at pH 4.6
Chromatographs regarding the peptides present in soluble fraction are illustrated in Figures 4.11
a-h. The total numbers of peptides and increase or decrease in the area of some prominent
peptides are considered as an indicator of the extent of proteolysis in each cheese sample. The
graphs presented were taken from 15th and 60th day of storage.
The proteolytic pattern presented in Figure 4.11a and b (CM 15, CM 60) indicated the 96 and
110 total number of peptides peaks in the soluble fraction of cheese samples. The most
prominent peaks appear at the 21, 22, 43, 44 and 55 retention time, which could be degradation
products of k, and -caseins. The number of peaks in cheese samples CT, CBM and CBT at
15th day were 103, 84 and 97 while at 60th day were 77, 93 and 97 respectively. The number of
prominent (having relatively larger areas) peaks were 8, 21, 26 respectively in these samples,
which shows the higher extent of proteolysis in cheese contain buffalo milk (Figure 4.11 c - h).
The peak, which appeared at 55 min retention time, was common in all soluble extracts that
could be originated from -CN. The no of peaks and area of peaks which appeared between 40 to
50 min retention time was higher in cheese containing buffalo milk. Similarly, the no of larger
peaks was higher (34) in cheese containing thermophilic starter cultures than containing the
mesophilic starter cultures (28).

92
Table 4.20a. Mean square effect of culture, buffalo milk and storage period on α-casein on
camel milk cheese (ppm)
Day1 Day30 Day60
CM 2103.00±75.00Abc
2005.00±55.00ABc
1905..00±45.00Bb
CT 1849.66±55.07Aa
1673.00±60.00Ba
1515.00±45.00 Ca
CBM 2204±70.00Ac
2025.66±52.51Bc
1835.00±63.02 Cb
CBT 2053.00±60.00Ab
1806.33±70.05Bb
1528.00±70.00 Ca
Mean sharing similar letter in a column are statistically insignificant (P>0.05)
Table 4.20b. Mean square effect of culture, buffalo milk and storage period on β-casein on
camel milk cheese (ppm)
Day1 Day30 Day60
CM 20113.50±200.00Ab
19216.00±300.00Bc
18343.00±300.00Ca
CT 19869.00±300.00Ab
18112.00±300.00Bb
16612.00±300.00Cb
CBM 22354.00±450.92Ac
21788.50±350.00ABd
21088.00±400.00Bc
CBT 16349.00±339.01Aa
15113.00±400.00Ba
14365.00±250.00Cd
Mean sharing similar letter in a column are statistically insignificant (P>0.05)
Table 4.20c. Mean square effect of culture, buffalo milk and storage period on -casein on
camel milk cheese (ppm)
Day1 Day30 Day60
CM 299.00±12.72Aa
232.00±45.25 Aba
172.50±23.33 Ba
CT 288.50±14.84Aa
172.00±11.31 Ba
192.00±9.89 Ba
CBM 468.00±15.55Ab
411.50±16.26Bb
358.50±19.09 Bb
CBT 318.00±16.97Aa
223.50±10.60 Ba
164.00±26.87 Ba
Mean sharing similar letter in a column are statistically insignificant (P>0.05)

93
Figure 4.9 Casein standerd for camel milk cheese
Figure 4.10a Effect of culture, buffalo milk and storage period on proteolysis of α-casein in
camel milk cheese.

94
Figure 4.10b Effect of culture, buffalo milk and storage period on proteolysis of β-casein in
camel milk cheese.
Figure 4.10c Effect of culture, buffalo milk and storage period on proteolysis of ƙ-casein in
camel milk cheese.

95
Discussion of proteolysis
Very little work has been conducted regarding the ripening in camel milk cheese; hence the
results of present investigation are supported by the cheese manufactured from camel and other
milk sources. The αs1-casein (f 24-199) production showed the activity of indigenous milk
proteases Cathepsin D and remidial chymosin, has chymosin similarity (Hurley et al., 2000;
Gagnaire et al., 2001). Mayer et al. (1996) reported that primary degradation product of αs1-I
casein, remains to rise at the last of storage and is ultimately yield hydrolyzed different peptides
as in the Figure 4.11c after 60 days of storage.
Higher degradation in buffalo milk and thermophilic containing cheese could be the higher
protein content and proteolytic activity of thermophilic starter cultures. Fenelon and Guinee
(2000) supported the present study through their findings that degradation of both αs1- and β-
casein gradually in ripening and breakdown rate of latter have lower rate than former. Few
researchers observed the significant increase in γ-caseins during storage up to 60 days;
afterwards no change was noticed but the degradation of β-casein did not stop (Ceruti et al.
2012). Previous studies have also revealed the high β-casein to γ–caseins and αs1-casein to αs1-
casein (f 24-199) degradation (McSweeney and Sousa, 2000; Sheehan et al., 2004; Costabel et
al., 2007).
The plasmin and alkaline milk proteinase, that have higher β-casein specificity, is reflected to be
contributing of major enzyme into the β-casein in cheese degradation (Grufferty and Fox, 1988)
Plasmin not inactivated by the time/temperature conditions and is heat stable (Dulley, 1972)
utilized by for cheese pasteurization milk. Hydrolyzes of β-casein at Lys107-Glu108, Lys105-
His106 and Lys28-Lys29 producing γ2, γ1 and γ3 caseins Plasmin preferably and proteoses and
peptones (Dulley, 1972; Chaves et al., 1999; Lane and Fox 1999; McSweeney and Sousa, 2000;
Seisa et al., 2004). Since the true fraction composition depends on genetic variants of β–casein of
γ-casein, happing in the cheese making milk (Eigel et al., 1984). It has been revealded by Abu
Tarboush (1994) that proteolytic activities of yoghurt starters (thermophilic) was high in milk of
camel than in milk of cow. His finding also supported the study because more proteolytic activity
was noticed in cheese containing thermophilic starter cultures. It is also reported that proteolytic
activity of Lactobacillus strains is higher than Lactococcus strains (Sasaki et al., 1995).
Similarly, Eigel et al. (1984) stated that the more proteolytic activity have in Lactobacilli even
than other, while the mixture of both showed higher activity than when used separately.

96
Rahman et al., 2009 estimated the proteolytic activities of L. bulgaricus, L. acidophilus, St.
thermophiles, L. lactis, and mixed cultures of St. thermophiles and L. bulgaricus (1:1) during
fermentation in milk of camel as Free Amino Group (FAG). They observe the 157.31, 193.14,
147.37, 174.9 and 199.98 FAG amount respectively. The result showed the higher proteolytic
activity of Lactobacillus than the Lactococcus lactis. The results of HPLC and Urea-PAGE are
supported by the work of above mentioned researchers, but in present research work, the
proteolysis was higher in buffalo milk containing cheese.
The highest level of proteolysis was noticed during manufacturing of Teleme cheeses using
thermophilic starter culture irrespective of the source of milk (Pappa et al., 2006). They
associated this proteolysis with the earlier lysis of thermophilic bacteria and release of
intracellular enzymes into the cheese. The higher proteolytic activity of lactobacilli could be due
to the production of peptidases (Khalid and Marth, 1990; Sasaki et al., 1995). Two peptidases
oligopeptidase and amino peptidase PepS are produced by St. thermophilus which could be
responsible for the proteolysis (Oumer et al., 2001). It was concluded in another study that
thermophilic show considerably higher amino peptidase activity than mesophilic culture (Garde
et al., 2003).
It is concluded from the present investigation that, the proteolysis extent was higher is higher in
prepared cheese using thermophilic cultures than mesophilic cultures. The cheese containing mix
milk (camel 90% + buffalo 10%) has more attraction for the proteolytic activities than camel
alone. Rafiq et al. (2016) reported that buffalo milk Cheddar cheese showed more proteolysis
than cow milk Cheddar cheese.

97
Figure 4.11a Peptide production in CM during
proteolysis after 15 days
Figure 4.11b Peptide production in CM during
proteolysis after 60 days

98
Figure 4.11d Peptide production in CBM during
proteolysis after 60 days
s
Figure 4.11c Peptide production in CBM during
proteolysis after 15 days

99
Figure 4.11e Peptide production in CT during
proteolysis after 15 days
Figure 4.11f Peptide production in CT during
proteolysis after 60 days

100
Figure 4.11h Peptide production in CBT during
proteolysis after 60 days
Figure 4.11g Peptide production in CBT during
proteolysis after 15 days
101
CHAPTER 5
SUMMARY
Pakistan is the 8th country in camel milk production with one million heads of camel. Camels are
mainly reared for ploughing, transportation and meat purposes; hence least importance is given
as a dairy animal. Their potential of milk production can be exploited to fulfill the increasing
demand of milk and milk products. Camel milk having a higher amount of factors containing
anti-microbial (lactoferrin, immunoglobulins and lysozyme), bioactive proteins and peptides that
comprise therapeutic potential. Production of cheese by milk of camel is very hard than other
milking animal’s milk. The main problems which are faced by the researcher are linked with low
yield and higher time of milk coagulation. This work was done to investigate the individual,
combine impacts of parameters variables to increase the cheese yield and reduce the coagulation
time. The impact of processing variables was also evaluated on various quality attributes of
camel milk cheese.
Before the conduction of research, preliminary trails were conducted separately for each
condition to select the processing parameters. From these trials, four processing parameters like
pasteurization temperatures (60, 65, 70°C for 30 min), pH (5.3, 5.5, 5.7), CaCl2 (0.04, 0.06,
0.08%) and addition of buffalo milk (0, 10, 30%) were selected based on the yield and
coagulation time. The whole research work was divided in two studies. In Study-I, eighty-one
types of camel milk cheeses were prepared and compared for yield, coagulation time and
composition. From this part of study, it was concluded that camel milk pasteurized at 65°C,
having pH 5.5 and CaCl2 0.06% before the cheese making showed the higher yield, fat, protein
contents and frim texture as compared the other combinations of processing parameters.
In Study-II, the above mentioned optimized processing parameters were used for the production
of camel milk cheese using thermophilic cultures (CT), camel milk cheese with mesophilic
cultures (CM), camel + buffalo milk (10%) cheese using mesophilic cultures (CBM) and camel
milk + buffalo milk (10%) cheese with thermophilic cultures (CBT). All these cheese were kept
for 2 months at 8°C and analyzed for physico-chemical parameters, sensory attributes and
proteolysis aspects. The evaluation of statistic of the showed data the (p<0.01) significant
influence by starter cultures, buffalo milk addition and storage period on the composition of
102
cheese, while their interaction showed the significant (p<0.05) influence only on pH. All the
quality parameters deteriorated significantly during storage except acidity.
Regarding the sensory evaluation, it was noticed the all the sensory attributes were (p<0.01)
significantly effected by the addition of buffalo milk and type of culture. The CBT was more
preferred by the panelist followed by CBM, CT and CM for all sensory attributes. The camel
milk cheese samples were acceptable for sensory attributes up to 30 days of storage.
During proteolysis study it was noted that intact caseins (S, and k-caseins) in camel milk
cheeses decreased with the increase of storage time. The higher extent of proteolysis was
observed in CBT followed by CBM, CT and CM. It was noted that addition of buffalo milk and
thermophilic starter cultures increased the proteolysis in camel milk cheese. It was concluded
from the study that 65°C/30min temperature of pasteurization, pH 5.5, CaCl2 0.06%, addition of
buffalo milk (10%) with thermophilic starter cultures (L. bulgaricus and Strep. Thermophillus)
produced the cheese which was more acceptable regarding the chemical and sensory quality of
cheese.
103
RECOMMENDATION/FUTURE ASPECTS
Shorter coagulation time and higher cheese yield from camel milk can be obtained by
optimizing the processing conditions like pasteurization 65°C/ 30min, pre-acidification
at pH 5.5 with the adding 0.06% CaCl2 and 10% buffalo milk.
The camel milk cheese prepared with the optimized conditions also had good
composition and sensorial acceptability
Thermophilic starter cultures were better than mesophilic cultures with the blending of
buffalo milk regarding texture, composition and sensory attributes.
Camel milk cheese can be acceptable up to 30 days when packed and stored at
refrigeration temperature.
Camel milk cheese can be a good choice for those who dislike the camel milk due to
its salty taste.
Future work should be conducted on purification and identification of protein and
peptides with the specific physiological effects on human health.
104
LITTERATURE CITED
Abbas, B. and P. Tilley. 1990. Pastoral management for protecting ecological balance in Halaib
District, Red Sea Province, Sudan. Nomadic Peoples. 29: 77-86.
Abbas, K.A. 2003. Studies on Mozzarella cheese. M.Sc. Thesis. Fac. of Agri, Fayoum, Cairo
Uni., Egypt.
Abd El-Gawad, I. A., E. M. El-Sayed, M. B. Mahfouz and A. M. Abd El-Salam. 1996. Changes
of lactoferrin concentration in colostrum and milk from different species. Egypt. J. Dairy
Sci. 24: 297-308.
Abd El-Rafee S. and M. A.M. Abd El-Gawad. 2002. Effect of milk types on the properties of
Provolone cheese. Egypt. J. Dairy Sci. 30: 243-252.
Abdelgadir, W. S., T. K. Ahmed and H. A. Dirar. 1998. The traditional milk product of the
Sudan. Int. J. Food Microbiol. 44: 1-13.
Abdel-Salam, A. M. 1996. Studies on lactoferrin of clostrum and milk from different species of
animals. M.Sc. Thesis in Dairy Science, Faculty of agriculture, Cario University.
Abdl Rhaman Derar A.W.M. and I. E.M. El Zubeir. 2013. Evaluation of microbiogical quality of
white soft cheese manufactured from camel and sheep milk. Annals. Food Sci. Tech.
14(2): 304-311.
Abdou S.M., M.E. Shenana, S.G. Osmana and A.M. Sadek. 2002. Production of Halloumi
cheese from different types of milk. Egypt. J. Dairy Sci. 30: 231-242.
Abu-Lehia, I. H. 1989. Physical and chemical characteristics of camel milk fat and its fractions.
Food Chem. 34: 261-271.
Abu-Tarboush, H. M. 1994. Growth behavior of Lactobacillus acidophilus and biochemical
characteristics and acceptability of acidophilus milk made from camel milk.
Milchwissenschaft. 49: 379-382.
Adda, J., J.C. Gripon and L. Vassal. 1982. The chemistry of flavor and texture generation in
cheese. Food Chem. 9:115-129.
Afzal, M. and A.N. Naqvi. 2003. Livestock Resources of Pakistan: Present Status and Future
Trends. Quarterly Science Vision .9: 1-2 (Jul - Dec, 2003) and 3-4 (Jan - Jun, 2004).

105
Agrawal, R. 2005. Probiotics: An emerging food supplement with health benefits. Food
Biotechnology 19: 227-246.
Agrawal, R. P., S. Budania, P. Sharma, R. Gupta and D. K. Kochar. 2007. Zero prevalence of
diabetes in camel milk consuming Raica community of northwest Rajasthan, India. Dia.
Res. Clin. Prac. 76: 290-296.
Agrawal, R., S. Jain, S. Shah, A. Chopra and V. Agrawal. 2011. Effect of camel milk on
glycemic control and insulin requirement in patients with type 1diabetes: 2- years
randomized controlled trial. Euro J Clinical Nutr. 65:1048–1052.
Ahmad, S. 2010. Understanding of the molecular changes in casein micelles of buffalo milk as a
function of physico-chemical conditions: a comparison with cow milk. PhD Thesis,
Agrocampus Ouest-INRA, France.
Ahmed, S.I., F. Gaucher, E. Rousseau, Beaucher, J.F. Grongnet and F. Gaucheron. 2008. Effects
of acidification on physico‐chemical characteristics of buffalo milk: A comparison with
cow’s milk. Food Chem. 106:11‐17.
Ahmed, T. and R. Kanwal. 2004. Biochemical characteristics of lactic acid producing bacteria
and preparation of camel milk cheese by using starter culture. Pak. Vet. J. 24(2):87- 91
Al haj, O.A. and H.A. Al Kanhal. 2010. Compositional, technological and nutritional aspects of
dromedary camel milk - A Review. Int. Dairy J. 20(12): 811-821.
Al haj O. A., A. A. M. Metwalli and E. A. Ismail. 2011. Heat stability of camel milk proteins
after sterilization process. J. Camel Practice and Res. 18 (2): 277-282
Aleme, A. and M. Yusuf. 2014. Traditional consumption, Therapeutic value and its derived dairy
products of dromedary camel (Camelus Dromedaries) milk in Somali regional state and
Eastern Ethiopia; A Review. J. Bio. Agri. and Healthcare. 4 (25):140-144.
Al-Hashem, F. 2009. Camel milk protects against aluminium chloride-induced toxicity in the
liver and kidney of white albino rats. Am. J. Biochem. Biotechnol. 5: 98-108.
Al-Humaid, A. I., H. M. Mousa, R. A. El-Mergawi and A. M. Abdel-salam. 2010. Chemical
composition and antioxidant activity of dates and dates-camel-milk mixtures as a
protective meal against lipid peroxidation activity in rats. J. Food Tech. 5: 22-30.
106
Alim, N., F. Fondrini, I. Bonizzi, M. Feligini and G. Enne.2005. Characterization of Casein
Fractions from Algerian Dromedary (Camelus dromedarius) Milk. Pak. J. Nutr. 4 (2):
112-116.
Al-Saleh, A.A. 1996. Heat coagulation of camel milk. J. King Saud Univ. 8(1): 107-116.
Alwan O. A. and H. B. Zwaik. 2014. Milk Composition of Libyan Maghrebi Camels (Camels
Dromedaries) Reared Under Farm and Desert Conditions. International Conference on
Chemical, Environment and Biological Sciences (CEBS-2014). Sept. 17-18, Kuala
Lumpur (Malaysia).
Amany, S. M., M. A. Mohamed and A. M. Abdel-Salam. 2005. Anti-schistosomal activity of
colostral and mature camel milk on Schistosoma mansoni infected mice. Asia Pac. J.
Clin.Nutr. 14 (4): 432-438.
Ammar T.M.A., A.A. El-Shazly, M.M. Nasr and I.M.I. Omar. 1999. Comparative study on
recombined Labneh, with buffalo and cow milk Laneh. I. Effect of level on consumer
acceptability. Egypt. J. Dairy Sci. 27: 127-139.
Anonymous. 2013-14. Pakistan Economic Survey. Ministry of Finance, Government of Pakistan,
Islamabad, Pakistan.
AOAC. 2012. Association of Official Analytical Chemists. Official methods of analysis. 17th
edition published by AOAC. Po box 540. Benjamin Franklin station, Washington, DC.
USA.
Arab, H. H., S. A. Salama, H. A.Omar, E.-S. A. Arafa, and I. A. Maghrabi. 2015. Diosmin
Protects against Ethanol-Induced Gastric Injury in Rats: Novel Anti-Ulcer
Actions. PLOSONE, 10(3): 0122417.
Attia H., N. Kherouatou, M. Nasri and T. Khorchani. 2000. Characterization of the dromedary
milk casein micelle and study of its changes during acidification. Lait. 80: 503-515.
Attia, H., N. Kherouatou and A. Dhouib. 2001. Dromedary milk lactic acid fermentation:
microbiological and rheological characteristics. J. Indus. Microbio. and Biotech.. 26: 263–
270.
Bai, Y.H., and D.B. Zhao. 2015. The acid base buffering properties of Alxa Bactrian camel milk.
Small Rum. Res. 123(2): 287-292.

107
Banks, J. M. 2004. The technology of low fat cheese manufacturing. Int. J. Dairy Tech. Chem.
113: 424-434.
Bansal, N., M.A. Drake, P. Piraino, M.L. Broe, M. Harboe, P.F. Fox and P.L.H. 2009.
McSweeney. Suitability of recombinant camel (Camelus dromedarius) chymosin as a
coagulant for Cheddar cheese. Int. Dairy J. 19: 510–517.
Bayoumi, S. 1990. Studies on composition and rennet coagulation of camel milk. Kieler
milchwirtschaftliche Forschungsberichte. 42: 3-8.
Beg, O. U., H. Von Bahr-Lindstrom, Z. H. Zaidi and H. Jornvall. 1986. A camel milk whey
protein rich in half-cystine: Primary structure, assessment of variations, internal repeat
patterns, and relationships with neurophysin and other active polypeptides. Eur. J.
Biochem. 159: 195-201.
Benkerroum, N., M. Dehhaoui, A. El Fayq and R. Tlaiha. 2011. The effect of concentration of
chymosin on the yield and sensory properties of camel cheese and on its microbiological
quality. Int. J. Dairy Tech. 64(2):232-239.
Benkerroum, N., M. Mekkaoui, N. Bennani, and H. Kamal. 2004. Antimicrobial activity of
camel’s milk against pathogenic strains of Escherichia coli and Listeria monocytogenes.
Int. J. Dairy Tech. 57:39–43.
Berquist, W. E. 1995. Biofeedback therapy for anorectal disorders in children. Semin. Pediatr.
Surg. 4(1): 48-53.
Bontinis, Th. G., H. Mallatou, E.C. Pappa, Th. Massouras and E. Alichanidis. 2012. Study of
proteolysis, lipolysis and volatile profile of a traditional Greek goat cheese (Xinotyri)
during ripening. Small Rumin. Res. 105:193-201.
Bornaz, S., A. Sahli, A. Attalah and H.Attia. 2009. Physicochemical characterization of
renneting properties of camel’s milk: comparison with goat’s, ewe’s and cow’s milks. Int.
J. Dairy Tech. 26(4): 505-513.
Børsting, M. W., M. K. Stallknecht, F. K. Vogensen and Y. Ardö. 2015. Influence of proteolytic
Lactococcus lactis subsp. cremoris on ripening of reduced-fat Cheddar cheese made with
camel chymosin. Int. Dairy J. 41: 38-45.
Børsting, M.W., K.B. Qvist and Y. Ardö. 2014. Influence of pH on retention of camel chymosin
in curd. Int. Dairy J. 38: 133-135.
108
Brezovecki, A., M. Čagalj, Z. F. Dermit, N. Mikulec, D. B. Ljoljić and N. Antunac. 2015.
Camel milk. Mljekarstvo 65 (2): 81-90.
Broome, M.C., and G.K.Y Limsowtin. 1998. Milk coagulants. Aus. J. Dairy Tech. 53: 188-190.
Bruntse, A. 2002. Camel milk products.Proceedings of the 8th Kenya camel Forum. pp: 52-
53.camel (Camelus dromedaries) milk. Int. Dairy J. 28 (2): 88-93.
Buriti, F.C.A., J.S. DaRocha and S.M.I. Saad. 2005. Incorporation of Lactobacillus acidophilus
in Minas fresh cheese and its implication for textural and sensorial properties during
storage. Int. Dairy J.15: 1279 -1288.
Camier, B., E. Beaucher, F. Gaucheron, G. Konuspayeva and B. Faye. 2014. Manufacture and
characterization of white cheese from camel milk: Mineralisation and buffering capacity-
A comparason with cow milk. 2nd International symposium on Mineral and Dairy
products, New Zealand, 26-27 February. 2014.
Carrasco, M.S., E.H. Scarinci and A.C. Simonetta. 2005. Associative growth of lactic acid
bacteria for cheese starter: Acidifying and proteolytic activities and redox potential
development. J. Food Agri. Environ. 3(2): 116-119.
Castillo, M., F. A. Payne, C. L. Hicks and M. B. Lo´pez. 2000. Predicting cutting and clotting
time of coagulating goat’s milk using diffuse reflectance: effect of pH temperature and
enzyme concentration. Int. Dairy J. 10: 551-562.
Ceruti, R.J., E.Z. Susana, A.S. Guillermo. 2012. The influence of elevated initial ripening
temperature on the proteolysis in Reggianito cheese. Food Res. Int. 48: 34-40.
Cervantes, M.A., D.B. Lund, and N.F. Olson. 1983. Effects of salt concentration and freezing on
Mozzarella cheese. J. Dairy Sci. 66:204-213.
Chaves, W., H. Viotto and C.R.F. Grosso. 1999. Proteolysis and functional properties of
mozzarella cheese as affected by refrigerated storage. J. Food Sci. 64(2):202‐205.
Chaves-López, C., A. Serio, A. Paparella, M. Martuscelli, A. Corsetti, R. Tofalo and G. Suzzi.
2014. Impact of microbial cultures on proteolysis and release of bioactive peptides in
fermented milk .Food Microbiol. 42: 117-121.

109
Christensen, P. B., L. P. Nielsen, N. P. Revsbech and J. Sorensen. 1989. Microzonation of
denitrification activity in stream sediments as studied by combined oxygen and nitrous
oxide microsensor. Appl. Environ. Microbial. 55: 1234-l241.
Clark, S., M. Costello, M.A. Drake and F. Bodyfelt. 2009. The Sensory Evaluation of Dairy
Products. NY, USA. pp. 167-192.
Coagan, T.M., P.L.H. McSweeney and T.P. Guinee (edi.). 2000. 6 th Cheese Symposium.
Teagasc, Dublin, Ireland.
Costabel, L., M.S. Pauletti and E. Hynes. 2007. Proteolysis in Mozzarella cheeses snufactured by
different industrial processes. J. Dairy Sci. 90: 2103‐2112.
Creamer, L.K. 1976. Casein proteolysis in Mozzarella type cheese. N.Z. J. Dairy Sci.
Technol.11:130-138.
Dave, I.R., P. Sharma and K. Muthukumarappan. 2003. Effect of starter culture and
coagulating enzymes on viscoelastic behavior and melt of Mozzarella cheese. J. Food
Sci. 68:1404‐1410.
Daviau C., M. H. Famelart, A. Pierre, H. Goude´dranche and J. L. Maubois. 2000. Rennet
coagulation of skim milk and curd drainage: effect of pH, casein concentration, ionic
strength and heat treatment. Lait, 80: 397–415.
David, P. 1976. The chemical analysis of foods. 7th edn. Churchill Livingston; London, UK
Davies, D. T. and A. J. R. Law. 1980. Content and composition of protein in creamy milk in
South-West Scotland. J. Dairy Res. 47: 83-90.
De Sukumar. 1997. Outline of dairy technology. Oxford University Press.Mumbai. 12: 8-14.
Delgado, F.J., J.Gonzalez-Crespo, R.Cava and R.Ramirez. 2011. Proteolysis, texture and colour
of a raw goat milk cheese throughout the maturation. Eur. Food Res. Tech. 233:483- 488.
Dervisoglu, M. and O. Aydemir. 2007. Physicochemical and microbiological characteristics of
Kulek cheese made from raw and heat-treated milk. World J. Microbio. and Biotech.
23 (4): 451–460.
Dirar, H. A. 1993. Gariss. Dairy Products. The indigenous fermented foods of the Sudan and
Nutrition. pp. 552.

110
Duhaiman, A. S. 1988. Purification of camel milk lysozyme and its lytic effect on Escherichia
coli and Micrococcus lysodeikticus. Comp. Biochem. Physiol. 91: 793-796.
Dulley, J.R. 1972. Bovine milk protease. J. Dairy Res. 40:1‐9.
Eigel, W.N., J.E. Butler, C.A. Emstrom, H.M. Farrel, V.R. Harwalkar, R. Jenness and R.
Whitney. 1984. Nomenclature of proteins of cow’s milk: 5 th ed. J. Dairy Sci.
67:1599‐1631
Eksterend, B., M. Larsson, and C. Perlmann, 1980. Casein micelle size and composition
related to the enzymatic coagulation process. Biochimica et Biophysica Acta, 660: 361-
366.
El Dairouty, R.K., A. M. El Sayed, M. M. El‐Senaity, N. F. Tawfek and O. M. Sharaf 1990.
Chemical and microbiological changes in Roquefort style cheese during ripening.
Ecology Food Nutri. 24: 89–96.
El Miniawy, H. M.F., K. A. Ahmed, M. A. Tony, S.A. Mansour, M. M. S. Khattab.2014.Camel
milk inhibits murine hepatic carcinogenesis, initiated by diethylnitrosamine and promoted
by phenobarbitone. Int. J. Vet. Sci. Medic. 2(2): 136–141
El-Agamy, E. I. and M. Nawar. 2000. Nutritive and immunological values of camel milk: A
comparative study with milk of other species. In: Proc. 2nd International Camelid
Conference: Agroecons. Camelid Farm, Almaty, Kazakhstan.8-12 Sept.
El-Agamy, E. I., M. Nawar, S. M. Shamsia, S. Awad and G. F. W. Haenlein. 2009. Are camel
milk proteins convenient to the nutrition of cow milk allergic children? Small Rum. Res.
82: 1-6.
El-Agamy, E. I., R. Ruppanner, A. Ismail, C. P. Champagne and R. Assaf. 1996. Purification and
characterization of lactoferrin, lactoperoxidase, lysozyme and immunoglobulins from
camel’s milk. Int. Dairy J. 6: 129-145.
El-Agamy, E. I., R. Ruppanner, A. Ismail, C. P. Champagne and R. Assaf. 1992. Antibacterial
and antiviral activity of camel milk protective proteins. J. Dairy Res. 59: 169-175.
El-Agamy, E. I., Z. I. Abou-Shloue and Y. I. Abdel-Kader. 1997. A comparative study of milk
proteins from different species. II. Electrophoretic patterns, molecular characterization,

111
amino acid composition and immunological relationships. Third 100 Alexandria
conference on Food Science and Technology, Alexandria, Egypt.
El-Agamy, E. I., Z. I. Abou-Shloue and Y.I Abdel-Kader. 1998. Antimicrobial factors and
nutritive value of human milk and other species. Mansoura University. J. Agri. Sci. 23(1):
245-254.
Elahj A. M. 2015. Camel’s Milk Protein Fractionation by SDS-Polyacrylamide Gel
Electrophoresis. I. J. Agro Vet. Medical Sci. 9 (2): 41-45.
Elamin, F. M. and C. J. Wilcox. 1992. Milk composition of Majaheim camels. J. Dairy Sci. 75:
3155-3157.
El-Batawy, M.A., E.A. Galal, M.A. Morsy and K.A.A. Abbas. 2004. Utilization of ultrafiltration
technique in making Mozzarella cheese from different kinds of milk. Egypt. J. Dairy Sci.
32: 303-314.
El-Fakharany E. M. ,N.A.El-Baky, M. H. Linjawi, A. A. Aljaddawi,T. H. Saleem, A. Y. Nassar,
A. Osman,and E. M. Redwan. 2017. Influence of camel milk on the hepatitis C virus
burden of infected patients. Exp Ther Med. 13(4): 1313–1320.
El-Fakharany, E. M., N. Abedelbaky, B. M. Haroun, L. Sanchez, N. A. Redwan and E. M.
Redwan. 2012. Anti-infectivity of camel polyclonal antibodies against hepatitis C virus in
Huh 7.5 hepatoma. Virol. J. 16(9): 201-211.
El-Fakharany, E., A. Tabll, A. El-Wahab, B. Haroun and E. Redwan. 2008. Potential activity of
camel milk-amylase and lactoferrin against hepatitis C virus infectivity in HepG2 and
lymphocytes. Hepat. Mon. 8(2):101-9.
El-Gawad, M. A.M. and N. S. Ahmed. 2011. Cheese yield as affected by some parameters.
Review. Acta Sci. Pol. Tech. Aliment. 10(2): 131-153.
El-Said, E. E., G. R. El-Sayed and E. Tantawy. 2010. Effect of camel milk on oxidative stresses
in experimentally induced diabetic Rabbits. Vet. Res. Forum 1(1): 30-40.
El-Sissi N.G. 2002. Production of an improved Nasr cheese by using blue cheese slurry. Egypt.
J. Dairy Sci. 30: 101-112.

112
El-Zeini, H.M. 2006. Microstructure, rheological and geometrical properties of fat globules of
milk from different animal species. Pol. J. Food Nutr. Sci. 15(56): 147-154.
El-Zubeir, I. E. M. and I. I. Marowa. 2009. Effect of pasteurization of milk on the keeping
quality of fermented camel milk (Gariss) in Sudan. Livestock Research for Rural
Development 21 (2) 2009 and Poster presentation at the International Conference on
Traditional Dairy Food, Karnal, India, November 2007.
El-Zubeir, I. E. M. and M. S. O. Jabreel. 2008. Fresh cheese from camel milk coagulated with
Camifloc. Int. J. Dairy Tech. 61: 90-95.
Ereifej K. I., M. H. Alu’datt, H. A. AlKhalidy, I. Alli and T. Rababah. 2011. Comparison and
characterization of fat and protein composition for camel milk from eight Jordanian
locations. Food Chem. 127: 282–289.
Eyassu S. 2007. Handling, preservation and utilization of camel milk in Jigjiga and Shinile
Zones of Somali Regional State. 19 (4). Livestock Research for Rural Development.
Available at http://www.lrrd.org/lrrd19/6/seif19086.htm
Fajardo J G. S., T. I. P. de la Ossa and E. J. Hernández. 2016. Effect of pasteurization and starter
cultures on physicochemical and microbiological properties of costeño cheese. Rev. Fac.
Nac. Agron. 69(2): 8007-8014.
FAO, 2008. Animal Health Yearbook. Food and Agriculture Organization. Rome. Italy.
FAOSTAT. 2005. http://faostat.fao.org/faostat/collections?subset=agriculture. Date of access: 9
March, 2014.
Farah, Z. 1996. Camel milk properties and products. Swiss Centre for Developments
Cooperation in Technology and Management. St. Gallen, Switzerland: SKAT
Farah, Z. and A. Fischer. 2004. The camel (C. dromedarius) as a meat and milk animal:
handbook and product development. Vdf. Hochschulverlag. www.camelgate.com.
Farah, Z. and D. Atkins. 1992. Heat coagulation of camel milk. J. Dairy Res. 59: 229-231.
Farah, Z. and M. Farah-Riesen. 1985. Separation and characterization of major components of
camel milk casein. Milchwissenschaft. 40: 669-671.

113
Farah, Z. and M. W. Riiegg. 1989. The size distribution of casein micelles in camel milk. Food
microstructure. 8: 211-216.
Farah, Z. and M.R. Bachmann. 1987. Rennet coagulation properties of camel milk.
Milchwissenschaft. 42(11): 689-692.
Farkye, N.Y. 2004. Cheese Technology. Int. J. Dairy Tech. 57(2‐3):91‐98.
Farkye, N.Y. and P.F. Fox. 1990. Observations on plasmin activity in cheese. J. Dairy Res. 57:
413-418.
Faye, B. 2005. Productivity potential of camels. In: Faye, B., Esenov, P. (Eds.), Proc. of. Inter.
Workshop, Desertification Combat and Food Safety: the Added Value of Camel
Producers, Vol. 362 NATO Sciences Series, Life and Behavioural Sciences, Ashkabad,
Turkme´ nistan, April 19–22, 2004. IOS Press Publ., Amsterdam, The Netherlands, pp.
127–134.
Feeny, E.P., T.P. Guinee and P.F Fox. 2002. Effect of pH and calcium concentration on
proteolysis in mozzarella cheese. J. Dairy Sci. 85:1646-1654.
Felfoula, I., C.Lopezb, F.Gaucheron, H. Attiaa and M.A. Ayadia. 2015. A laboratory
investigation of cow and camel whey proteins deposition under different heat treatments.
Food and bio products proces. 96: 256-263.
Fenelon, M.A. and T.P. Guinee. 2000. Primary proteolysis and textural changes during ripening
in Cheddar cheese manufactured to different fat contents. Int. Dairy J. 10: 151-158.
Fife, R.L., D.J. McMahon and C.J. Oberg. 1996. Functionality of low fat mozzarella cheese. J.
Dairy Sci. 79:1903-1910.
Fitzgerald, R.J., B.A. Murray and D.J. Walsh. 2004. Hypotensive peptides from milk proteins. J.
Nutri. 134: 980-988.
Fox, P. F. 1989. Proteolysis during cheese manufacture and ripening. J. Dairy Sci. 72: 1379-
1400.
Fox, P.F. and C.M. Hearn. 1978. Heat stability of milk: influence of K-casein hydrolysis. J.
Dairy Res.45:173.

114
Fox, P.F. and P.L.H. McSweeney. 2004. Cheese: An overview. Cheese chemistry, physics and
microbiology. General Aspects. 1:1226-3652.
Fox, P.F., T.P. Guinee, T.M. Cogan and P.L.H. McSweeney. 2000. Fundamentals of Cheese
Science. Aspen Publishers, Gaithersburg, Maryland, USA. pp: 587.
Gagnaarie, V., D. Molle, M. Herrouuin and J. Leonil. 2001. Peptides identification during
Emmental cheese ripening: origion and proteolytic systems involved. J. Agric. Food
Chem. 49: 4402‐ 4413.
Gassem, M.A. and H.M. Abu-Tarboush. 2000. Lactic acid production by Lactobacillus
delbrueckii ssp. Bulgaricus in camel’s and cow’s whey. Milchwissenschaft. 55: 374-378.
Glantz, M., T.G. Devold, G.E. Vegarud , H. L. Månsson , H. Stålhammar and M. Paulsson. 2010.
Importance of casein micelle size and milk composition for milk gelation. J. Dairy Sci.
93(4):1444-1451.
Gorban, A. M. S. and O. M. Izzeldin. 1999. Study on cholesteryl ester fatty acids in camel and
cow milk lipids. Int. J. Food Sci. and Tech.34:229-234.
Gosh, B.C. and S. Singh. 1990. Effect of different fat levels on the production of mozzarella
cheese by starter culture technique. Int. J. Dairy Sci. 42: 132‐136.
Grufferty, M.B. and P.F. Fox. 1988. Milk alkaline proteinase. J. Dairy Res. 55: 609-630.
Guinee, T.P., E.O. Mulholland, J. Kelly and D. J. O'Callaghan. 2007. Effect of protein‐to‐fat
ratio of milk on the composition, manufacturing efficiency and yield of cheddar cheese. J.
Dairy Sci. 90:110-123.
Guinee, T.P., M.A. Auty, C. Mullins, M.O. Corcoran and E.O. MulHolland. 2000. Preliminary
observation on effects of fat content and degree of fat emulsification on the structure~
functional relationship of Cheddar type cheese. J. Texture Stud. 31:645-663.
Haddadin, M. S. Y., S. I. Gammoh and R. K. Robinson. 2008. Seasonal variations in the
chemical composition of camel milk in Jordan. J. Dairy Res. 75: 8-12.
Hailu, Y., E., Seifu and Z. Yilma. 2014. Physicochemical properties and consumer acceptability
of soft unripened cheese made from camel milk using crude extract of ginger (Zingiber
officinale) as coagulant. African J. Sci. 8(2): 87-91.
115
Han, X., F.L. Lee, L. Zhang and M.R. Guo. 2012. Chemical composition of water buffalo milk
and its low-fat symbiotic yogurt development. Functional Food in Health and Disease.
2:86-106.
Hashim, I.B., A.H. Khalil, and H. Habib. 2009. Quality and acceptability of a set yoghurt made
from camel milk. J. Dairy Sci. 92(3): 857-862.
Hayaloglu A.A., M. Guven, P. F. Fox and P. L. H. McSweeney. 2005. Influence of Starters on
Chemical, Biochemical, and Sensory Changes in Turkish White-Brined Cheese during
Ripening. J. Dairy Sci. 88:3460-3474.
Hayaloglu, A.A., C. Tolu and K. Yasar. 2013. Influence of goat breeds and starter culture
systems on gross composition and proteolysis in Gokceada goat cheese during ripening.
Small Rumi. Res. 113: 231- 238.
Hendrix, T., Y.V. Griko and P. Privalov, 2000. A calorimetric study of the influence of calcium
on the stability of bovine α-lactalbumin. Biophys. Chem. 84: 27-34.
Hicsasmaz, Z., L. Shippelt and S.S.H. Rizvi. 2000. Evaluation of mozzarella cheese
stretchability by the ring-and-ball method. J. Dairy Sci. 87:1993-1998.
Hinz, K., P.M.O’Connor, T. Huppertz, R. P. Ross and A. L. Kelly. 2012. Comparison of the
principal proteins in bovine, caprine, buffalo, equine and camel milk. J. Dairy Res. 79:
185-191.
Holmes, D, G., J. W. Duersch and C. A. Ernstrom. 1977. Distribution of milk clotting enzymes
between curd and whey and their survival during Cheddar cheese making. J. Dairy Sci.
60: 862–869.
Holt, H. 1992. Dairy products judging. Pub. 731. Agriculture External Services. Institute of
Agriculture, University of Tennesse, Knoxuille, USA.
Hurely, M.J., L.B. Laesen, A.L. Kelly and P.L.H. Mcsaweeney. 2000. Cathapsin D activity in
Quarg. Int. Dairy J. 10: 453‐458.
Hussain I., J. Yan, A.S. Grandison, and A.E. Bell. 2012. Effects of gelation temperature on
mozzarella-type curd made from buffalo and cows’ milk: 2. Curd yield, overall quality
and casein fractions. Food chem. 135(3): 1404-1410.

116
IDFA. 2006. Determination of the nitrogen content and calculation of crude protein. Int. Dairy
Fedration, Brussels, Belgium.
Inayat, S., M. A. Arain, M. Khaskheli and A. H. Malik. 2003. Study of the Effect of Processing
on the Chemical Quality of Soft Unripened Cheese Made from Camel Milk. Pak. J. Nutri.
2 (2): 102-105.
Isani, G. B. and M. N. Baloch. 2000. Camel breeds of Pakistan. The Camel Applied Research
and Development Network. CARDN- Pakistan/ ACSAD/P93/200: Pp.150.
ISO 1992. Sensory analysis: Vocabulary (ISO 5492), Geneva, Switzerland.
Jen, J. and Ashworth. 1970. Factors Influencing the Curd tension of rennet coagulated milk, salt
balance. J. Dairy Sci. 53:1201.
Jovanović, S., O. Maćej and J. D. Djurdjević. 2002. The influence of various factors on milk
clotting time. J. Agri. Sci. 47(1):57-73.
Kamal, A. M., O. A. Salama and K. M. El-saied. 2007. Changes in amino acid profile of camel
milk protein during the early lactation. Int. J. Dairy. Hepatol. 32: 39-47.
Kameni, A., J. Mbanya and S. Mendi. 2006. Effects of starter cultures and heat treatments of
milk on Bafut cheese; a local cheese from the High Lands of Cameroon. Livestock
Research for Rural Development. Vol. 18, Article # 47. Retrieved December 6, 2016.
http://www.lrrd.org/lrrd18/4/kame18047.htm.
Kappeler, S. R., C. Heuberger, Z. Farah and Z. Puhan. 2004. Expression of the peptidoglycan
recognition protein, PGRP, in the lactating mammary gland. J. Dairy Sci. 87: 2660-2668.
Kappeler, S., Z. Farah and Z. Puhan. 1998. Sequence analysis of Camelus dromedarius milk
caseins. J. Dairy Res. 65: 209-222.
Kappeler, S., Z. Farah and Z. Puhan. 2003. 5'-Flanking regions of camel milk genes are highly
similar to homologue regions of other species and can be divided into two distinct
groups. J. Dairy Sci. 86: 498-508.
Karami, M., M. R. Ehsani, E. M. Mousavi, K.Rezaei, and M. Safari. 2009. Microstructural
changes in fat during the ripening of Iranian ultrafiltered Feta cheese. J. Dairy Sci.
91(11): 4147-4154.

117
Keller, B., N.F. Olson, and T. Richardson. 1974. Mineral retention and rheological properties of
mozzarella cheese made by direct acidification. J. Dairy Sci. 57(2): 174-180.
Khalid, N.M. and E.H. Marth. 1990. Proteolytic activity by strains of Lactobacillus plantarum
and Lactobacillus casei. J. Dairy Sci. 73: 3068-3076.
Khan, H., I. H. Athar and M. Aslam. 2004. Evaluation of Cheese Prepared by Processing Camel
Milk. Pak. J. Zool. 36(4): 323-326.
Khan, J. A., P. Kumar, M. Paramasivam, R. S. Yadav, M. S. Sahani and S. Sharma. 2001. Camel
lactoferrin; a transferrincum; lactoferrin: crystal structure of camel apolactoferrin at 2.6 Å
resolution and structural basis of its dual role. J. Mol. Biol. 309: 751-761.
Khan, M. K. U., and Appanna, T. C. 1967. Carotene and vitamin A in camel milk. Indian J.
Nutri. Dietetics. 4:17.
Khaskheli, M., M. A. Arain, S. Chaudhry, A. H. Soomro and T. A. Qureshi. 2005. Physico-
chemical quality of camel milk. J. Agri. Soci. Sci. 2: 164-166.
Kherouatou, N., M. Nasri and H. Attia. 2003. A Study of the Dromedary Milk Casein Micelle
and its Changes during Acidification. Braz. J. Food Tech. 6(2): 237-244.
Khodaie, S. A. 2002. Camel production system and the socio-economics of camel herders in the
Islamic Republic of Iran.The Camel Applied Research and Development Network.
Kindstedt, P.S .1995. Factors affecting the functional characteristics of unmelted and melted
Mozzarella cheese. In Chemistry of Structure‐Function Relationships in Cheese. pp:
27‐41. Mali E L and Tunick M H, edi. New Yorki Plenum Press.
Kirk, R. S. and R. Sawyer 1991. Pearson’s compositon and analysis of food. 9th Edition.
Knoess, K. H., A. J. Makhudum, M. Rafiq and M. Hafeez. 1986. Milk production potential of the
dromedary, with special reference to the province of the Punjab, Pakistan. World Anim.
Rev. FAO, Rome. 57: 11-21.
Kohler-Rollefson, I. 1992. The Raika dromedary breeders of Rajasthan: A pastoral system in
crisis. Nomadic Peoples. 30: 74-83.
Kontou, N., T. Psaltopoulou, D. Panagiotakos, M. A. Dimopoulos and A. Linos. 2011. The
mediterranean diet in cancer prevention: a review. J. Medi. Food. 14: 1065-1078.

118
Konuspayeva, G., B. Camier, F. Gaucheron and B. Faye. 2014. Regular article. Some parameters
to process camel milk into cheese. Emir. J. Food Agri. 26 (4): 354-358.
Konuspayeva, G., B. Faye and G. Loiseau. 2009. The composition of camel milk: a meta-
analysis of the literature data. J. Food Compos. Anal. 22: 95-101.
Korashy, H.M., Z.H. Maayah, A.R. Abd-Allah, A.O. El-Kadi and A. A. Alhaider. 2011.
Camel milk triggers apoptotic signaling pathways in human hepatoma HepG2 and breast
cancer MCF7 cell lines through transcriptional mechanism. J. Biomed Biotechnol. 133
(1):184-190.
Korhonen, H. 1977. Antimicrobial factors in bovine colostrum. J. Sci. Agri. Soci. Finland. 49:
434-447.
Kosikowski, F.V. and V.V. Mistry. 1997. Cheese and fermented milk foods. Vol. II, Procedures
and Analysis. 3rd edi. Great Falls, VA: Kosikowski FV. LLC.
Kowalchyk, A. W. and Olson, N. F. 1977. Effects of pH and temperature on the
secondary phase of milk clotting by rennet. J. Dairy Sci. 60:1256-1259.
Kuchroo, C.N. and P.F. Fox. 1982. Soluble nitrogen in Cheddar cheese: Comparison of
extraction procedures. Milchwiss. 37: 331-335.
Kucukoner, E. and Z. U. Haque. 2006. Physicochemical properties of low‐fat and full‐fat
Cheddar cheeses. Int. J. Dairy Tech. 59(3):166‐170.
Kumar, S., S. K. Kanawjia and S. Khatkar. 2014. Effect of rate of addition of starter culture on
textural characteristics of buffalo milk Feta type cheese during ripening. J. Food Sci
.Technol. 51(4):800-804.
Laleye, L. C., B. Jobe and A. A. H. Wasesa. 2008. Comparative study on heat stability and
functionality of camel and bovine whey proteins. J. Dairy Sci. 91: 4527-4534.
Lane, C.N. and P.F. Fox. 1996. Contribution of starter and adjunct lactobacilli to proteolysis
in Cheddar cheese during ripening. Int. Dairy J., 6(7):715‐728.
Lawrence, R.C., L.K. Creamer and J. Gilles. 1987. Texture development during cheese ripening.
J. Dairy Sci. 70:1748‐1760.
Lozovich, S. 1995. Medical uses of whole and fermented mare milk in Russia. Cultured Dairy
Products J. 30: 18-21.

119
Lucey, J.A. and P.F. Fox. 1993. Importance of calcium and phosphate in cheese manufacture: A
review. J. Dairy Sci. 76:1714-1724.
Lucey, J.A., M.E. Johnson and D.S. Horne. 2003. Invited review: Perspectives on the basis of the
rheology and texture properties of cheese. J. Dairy Sci. 86:2725‐2743.
Mahdieh M., M. Mollehishad, Z. Piravivanak and Z. Pouretedal. 2016. Evaluation of mineral
content and heavy metals of dromedary camel milk in Iran. Food Sci. Technol
(Campinas). 36 (4): 717-723.
Mallatou, H., E. Pappa and V.A. Boumba. 2004. Proteolysis in Teleme cheese made from ewes,
goats or a mixture of ewes’ and goats’ milk. Int. Dairy J. 14: 977-987.
Marshall, R.J. 2009. Increasing cheese yields by high heat treatment of milk. J. Dairy Res. 53(2):
313–322.
Marshall, R.T. 1993. Standard Methods for the examination of dairy products. 16th ed. American
Public Health Association, Washington, DC.
Marwa M. D., Samah M. S. and K.A. Soryal. 2013. Compositional, Rheological and
Organoleptic Qualities of Camel Milk Labneh as Affected by Some Milk Heat
Treatments. W. J. Dairy and Food Sci. 8 (2): 118-130.
Maubois, J. L. 2002. Membrane microfiltration: A tool for a new approach in dairy technology.
Aust. J. Dairy Tech. 57:92‐99.
Mayer, H.K. 1996. Electrophoretic ripening index for the evaluation of proteolysis and the
deduction of the age of Permesan cheese. Zeitchrift fur Lebensmittel- Untersuchng und-
Forschung. 202: 465-470.
McGregor, J.U. and C.H. White. 1990. Effect of enzyme treatment and ultra filtration on the
quality of low fat Cheddar cheese. J. Dairy Sci. 73: 571‐578.
McSweeney, P. L. H. and M. J. Sousa. 2000. Biochemical pathways for the production of flavor
compounds in cheeses during ripening: A review. Lait. 80:293-324.
McSweeney, P.L.H. 2007. Cheese problems solved. Woodhead Publishing Limited, Cambridge,
England. p.18.

120
McSweeney, P.L.H., N.F. Olson, P.F. Fox, A. Healy and P. Hojrup. 1993. Proteolytic specificity
of chymosin on bovine αs1‐casein. J. Dairy Res. 60: 401-412.
Mehaia, M. A. 2006. Manufacture of fresh soft white cheese (Domiati-Type) from camel’s milk
using ultrafiltration process. J. Food Tech. 4(3): 206-212.
Mehaia, M. A., M. A. Hablas, K. M. Abdel-Rahman and S. A. El-Mougy. 1995. Milk
composition of Majaheim, Wadah and Hamra camels in Saudi Arabia. Food Chem. 52:
115-122.
Mehaia, M.A. 1993. Fresh soft white cheese (Domiati-type) from camel milk: composition, yield
and sensory evaluation. J. Dairy Sci. 76: 2845-2855.
Merin, U., S. Bernstein, A. Bloch-Damti, R. Yagil, C. van Creveld and P. Lindner. 2001. A
comparative study of milk serum proteins in camel (Camelus dromedarius) and bovine
colostrums. Livest. Prod. Sci. 67: 297-301.
Metzger, L. E., D. M. Barbano, M. A. Rudan, and P. S. Kindstedt. 2000. Effect of milk
preacidification on low fat Mozzarella cheese. I. Composition and yield. J. Dairy Sci.
83:648–658.
Michaelidous, A., C. Biliaderis and G. Zerfiridis. 2005. Low fat white brined cheese made from
bovine and two commercial fat mimetics: Chemical, physical and sensory attributes. Int.
Dairy J. 12(6): 525- 540.
Michel, V. and F.G. Martley. 2001. Streptococcus thermophilus in Cheddar cheese – production
and fate of galactose. J. Dairy Res. 68: 317-325.
Miller, D. D. 1996. Minerals. In O.R. Fennema (Ed.), Food chemistry (3rd edi.). New York,
USA: Marcel Dekker Inc.
Mohamed, M. A. and M. Larsson-Raznikiewicz.1990. Hard cheese from camel milk.
Milchwissenschaft. 45: 716-718.
Mullaicharam, A. R. 2014. A review on medicinal properties of Camel milk. World J. Pharm Sci.
2(3): 237-242.

121
Najera, A.I., M. de Renobales and L. J. R. Barron. 2003. Effects of pH, temperature, CaCl2 and
enzyme concentrations on the rennet-clotting properties of milk: a multifactorial study.
Food Chem. 80:345-352.
O’Connell, J. E. and P. F. Fox. 2003. Heat-induced coagulation of milk. In Advanced Dairy
Chemistry, Vol. 1: Proteins. Fox, P.F., McSweeney, P.L.H. (edi). New York: Kluwer
Academic Publishers. 879-945.
O'Connell, J.E. and Fox, P.F. 2000. The two-stage coagulation of milk proteins in the minimum
of the heat coagulation time-pH profile of milk: effect of casein micelle size. J Dairy
Sci. 83(3):378-86.
Olerte, C., S. Sanz, E. Gonzalez-Fandoz and P. Torre. 2000. The effect of commercial starter
culture addition on the ripening of an artisanal goat’s cheese (Cameros cheese). J. Appl.
Microbiol. 88: 421-429.
Omar A., N. Harbourne and M. J. Oruna- Concha. 2016. Quantification of major camel milk
proteins by capillary electrophoresis. Int. Dairy J. 58: 31-35.
Omer, R. H. and A. H. Eltinay. 2009. Changes in chemical composition of camel’s raw milk
during storage. Pak. J. Nutr. 8: 607-610.
Ong L., K. Soodam, S.E. Kentish, I.B. Powell and S.L. Gras. 2015. The addition of calcium
chloride in combination with a lower draining pH to change the microstructure and
improve fat retention in Cheddar cheese. Int. Dairy J. 46:53-62.
Ong, L., A. Henriksson, and N.P. Shah. 2007. Chemical analysis and sensory evaluation of
cheddar cheese produced with Lactobacillus acidophilus, Lactobacillus casei,
Lactobacillus paracasei or bifidobacterium sp. Int. Dairy J. 17(8): 67-78.
Ong, L., R.R. Dagastine, S.E. Kentish and S.L. Gras. 2012. The effect of pH at renneting on
the microstructure, composition and texture of Cheddar cheese. Food Res. Int. 48: 119-
130.
Oumer, A., P. Gaya , E. Fernandez-Garcia and R. Marica. 2001. Proteolysis and formation of
volatile compounds in cheese manufactured with a bacteriocin-producing adjunct culture.
J. Dairy Res. 68 (1):117-129.
122
Papetti P. and A. Carelli. 2013. Composition and sensory analysis for quality evaluation of a
typical Italian cheese: influence of ripening period. Czech J. Food Sci. 31: 438- 444.
Pappa E. C., I. G. Kandarakis and H. Mallatou. 2007. Effect of different types of milks and
cultures on the rheological characteristics of Teleme cheese. J. Food Eng. 79:143-149.
Pappa, E. C. and E.M. Anifantakis. 2001. Effect of concentrated starter cultures on the
proteolysis and organoleptic characteristics of Feta cheese. Milchwissenschaft. 56: 325-
329.
Pappa, E. C., I.G. Kandarakis, G. K. Zerfiridis, E. M. Anifantakis and K. Sotirakoglou. 2006.
Influence of starter cultures on the proteolysis of Teleme cheese made from different
types of milk. Le Lait. 86 (4): 273-290.
Park, Y.W. 2009. Bioactive Components in Milk and Dairy Products. Chapter 6. John Wiley and
Sons Publishers.
Pastorino, A.J., C.L. Hansen and D.J. McMahon. 2003. Effect of pH on the chemical
composition and structure function relationships of cheddar cheese. J. Dairy Sci. 86 (9):
2751-2760.
Paulson, B.M., D.J. McMahon and C.J. Oberg. 1998. Influence of sodium chloride on
appearance, functionality and protein arrangements in nonfat Mozzarella cheese. J. Dairy
Sci. 81: 2053-2064.
Phelan, J. A., J. Guiney and P.F. Fox. 1973. Proteolysis of β-casein in Cheddar cheese. J.
Dairy Res. 41: 105-112.
Podrabsky, M. 1992. Nutrition in aging. In: Food, Nutrition and Diet Therapy (Mahan, L.
Kathleen, Arlin and T. Marian (Eds.). Philadelphia, Williams Basic. Saunders Co. pp:
249.
Rafiq, S., N. Huma, I. Pasha and M. Shahid. 2016. Compositional Profiling and Proteolytic
Activities in Cow and Buffalo Milk Cheddar Cheese. Pak. J. Zool. 48(4): 1141-1146.
Rahman I. E. A., H. A. Dirar and M. A. Osman. 2009. Microbiological and biochemical changes
and sensory evaluation of camel milk fermented by selected bacterial starter cultures.
Afri. J. Food Sci. 3(12): 398-405.

123
Rajagopal, S.N. and W.E. Sandine. 1990. Associative growth and proteolysis of Streptococcus
thermophilus and Lactobacillus bulgaricus in skim milk. J. Dairy Sci. 73:894-899.
Rajiv, I. D., P. Sharma and D.J. McMahon. 2003. Melt and rheological properties of Mozzarella
cheese as affected by starter culture and coagulating enzymes. Lait. 83: 61–77.
Ramet, J P. 2001. The Technology of Making Cheese from Camel Milk (Camelus
dromedary). Animal Production and Health Paper. No. 113, FAO, Rome,
Italy.
Ramet, J. P. 1987. Use of bovine calf rennet to coagulate raw camel milk.World Ani. Review.
61: 11-16.
Ramet, J. P. 1991. Processing camel milk into cheese.Revue Mondiale de Zootechnique. 61: 21-
28.
Raziq, A., K. de Verdier, M. Younas, S. Khan, A. Iqbal and M. S. Khan. 2011. Milk composition
in the Kohi camel of mountainous Balochistan, Pakistan. Journal of Camelid Science 4:
49-62.
Rehman-Ur-Shakeel, D. Waldron, P. F. Fox. 2004. Effect of modifying lactose concentration in
cheese curd on proteolysis and in quality of Cheddar cheese. Int. Dairy J. 14:591-597.
Ripinsky, M. 1983. Camel ancestry and domestication in Egypt and the Sahara. Archaeology,
May-June: 21-27.
Ruegg, M., U. Morr and B. Blanc.1977.A calorimetric study of the thermal denaturation of whey
proteins in simulated milk ultrafiltrate. J. Dairy Res. 44: 509-520.
Rüegg, M.W. and Z. Farah. 1991. Melting curves of camel milk fat. Milchwissenschaft,
46: 361-362.
Ryan, Y. Ma., C, D. M. Barbano, D. M. Galton, M. A. Rudan, and K. J. Boor. 2000. Effects of
Somatic Cell Count on Quality and Shelf-Life of Pasteurized Fluid Milk. J. Dairy Sci.
83:264-274.
Salami, M., R. Yousefi, M. R. Ehsani, S. H. Razavi, J. M. Chobert and T. Haertle. 2009.
Enzymatic digestion and antioxidant activity of the native and molten globule states of
camel α-lactalbumin: possible significance for use in infant formula. Int. Dairy J. 19:
518-523.

124
Saliha, S. A. Z., A. Dalila, S. Chahra, B.H. Saliha and M. Abderrahmane. 2013. Separation and
characterization of major milk proteins from Algerian Dromedary (Camelus
dromedarius). Emir. J. Food Agric. 25 (4): 283-290.
Salwa, A.A. and E.A. Galal. 2002. Effect of milk pre-treatment on the keeping quality of
Domiati cheese. Pak. J. Nutri. 3:132-136.
Sameen, A., F. M. Anjum, N. Huma and H. Nawaz. 2010. Chemical composition and sensory
evaluation of Mozzarella cheese: influenced by milk source, fat level, starter culture and
ripening period. Pak. J. Agri. Sci. 47(1): 26-31.
Sanayeia, S., M. Jahadib, M. Fazelb and M. Janigorban. 2015. Physico-Chemical Characteristics
of Raw Milk of One-Humped Camel from Khur and Biabanak in Isfahan Province of
Iran. J. Food Biosci. Tech. 5(2): 67-72.
Santos, B.N.C., C.C.C V. Silva, J.R. Domingues, M.A.S. Cortez, D.D.G.C. Freitas, C.C.J.
Chiappini and K.G.L. Araújo. 2013. Effect of calcium addition and pH on yield and
texture of Minas cured cheese Arq. Bras. Med. Vet. Zootec. 65(2): 601-609.
Sasaki M., B. W. Basman, P. S. T. Tan. 1995. Comparison of proteolytic activities in various
lactobacilli. J. Dairy Res. 62:601-610.
Satia, H.S. and C.W. Raadsveld. 1969. The quality of Gouda cheese, made from milk enriched
with calcium and phosphate. Nelh. Milk Dairy J. 23:276.
Sawaya, W. N., J. K. Khalil, A. Al-Shalhat and H. Al-Mohammad. 1984. Chemical composition
and nutritional quality of camel milk. J. Food Sci. 49: 744-747.
Schwartz, H. J. 1992. Productive performance and productivity of dromedaries (Camelus
dromedarius). Anim. Res. Develop. 35: 86-98.
Seisa, D., G. Osthoff, C. Hugo, A. Hugo, C. Bothma, J. Van der Merwe. 2004. The effect of
lowdose gamma irradiation and temperature on the microbiological and chemical changes
during ripening of Cheddar cheese. J. Radiation Phys. Chem. 69: 419‐431.
Sert, D., A. Ayar and N. Akin. 2007. The Effects of Starter Culture on Chemical Composition,
Microbiological and Sensory Characteristics of Turkish Kasar Cheese during Ripening.
Int. J. Food Safety. 9: 7-13.

125
Shabo, Y., R. Barzel, M. Margoulis and R. Yagil. 2005. Camel milk for food allergies in
children. Immunol. Allergies. 7: 796-798.
Shahein, M.R., A.M. Hassanein and A.F. Zayan. 2014. Evaluation of soft cheese manufactured from
camel and buffalo milk. World J. Dairy and Food Sci. 9(2): 213-219.
Sharma, P., D. Dube, M. Sinha, S. Dey, P. Kaur, S. Sharma and T. P. Singh. 2012. Structural
basis of heparin binding to camel peptidoglycan recognition protein-S. Int. J. Biochem.
Mol. Biol. 3(1):86-94.
Sheehan, J. J. and T.P. Guinee. 2004. Effect of pH and calcium level on the biochemical, textural
and functional properties of reduced‐fat Mozzarella cheese. Int. Dairy J. 14:161-172.
Sheehan, J. J., J. C. Oliveira, A. L. Kelly and P. L.H. Mc Sweeney. 2007. Effect of cook
temperature on primary proteolysis and predicted residual chymosin activity of a semi-
hard cheese manufactured using thermophilic cultures. Int. Dairy J. 17: 826-834.
Sheehan, J.J., K. O’Sullivanb and T.P. Guinee. 2004. Effect of coagulant type and storage
temperature on the functionality of reduced‐fat Mozzarella cheese. Lait 84: 551-566.
Shehadeh K. 2016. Importance of camel milk for human health. A review article. Emirates J.
Food Agri. 28(3): 158-163.
Shimaa. A., I., Ibtisam E. and M. El Zubeir. 2016. Processing, composition and sensory
characteristic of yoghurt made from camel milk and camel- sheep milk mixtures. Small
Rumi. Res.136: 109-112.
Shuiep, E. S., I. J. Giambra, I. E. M.El Zubeir and G.Erhardt. 2013. Biochemical and molecular
characterization of polymorphisms of as1-casein in Sudanese camel (Camelus
dromedarius) milk. Inter. Dairy J. 28: 88-93.
Siboukeur, O., A. Mati, and B. Hessas. 2005. Improving the coagulability of camel’s
milk’s by using gastric enzyme coagulation extracts (Camelus dromedarius). Cahiers
Agricultures, 14: 473-478.
Siddig, S. M., A. M. E. Sulieman, Z. A. Salih and A. A. Abdelmuhsin. 2016. Quality
characteristics of White Cheese (Jibna-beida) produced using camel milk and mixture of
camel milk and cow milk. I. J. Food Sci. and Nutri. Engin. 6(3): 49-54.

126
Silva S. V. and F. X. Malcata. 2005. Partial identification of water-soluble peptides released at
early stages of proteolysis in sterilized ovine cheese-like systems: influence of type of
coagulant and starter. J. Dairy Sci. 88:1947-1954.
Singh, H. and P.F. Fox. 1985. Heat stability of milk: pH-dependent dissociation of micellar K-
casein on heating milk at ultra- high temperature. J. Dairy Res.52: 529.
Singh, T.K., M.A. Drake and K.R. Cadwallader. 2003. Flavor of Cheddar cheese: A chemical
and sensory perspective. Comp. Rev. Food Sci. Food Safety. 2:139-162.
Skeie, S. 2007. Characteristics in milk influencing the cheese yield and cheese quality. J. Ani.
Feed Sci. Suppl. 16:132-142.
Smith, J. W. L., T. P. Charlock, R. Kahn, J. V. Martins, L. A. Remer, P. V. Hobbs, J.
Redemann and C. K. Rutledge. 2005. EOS Terra Aerosol and Radiative Flux Validation:
An Overview of the Chesapeake Lighthouse and Aircraft Measurements for Satellites
(CLAMS) Experiment. J. Atmospheric Sci. 62: 903-911.
Soltani, M., O.S. Boran and A.A. Hayaloglu. 2016. Effect of various blends of camel
chymosin and microbial rennet (Rhizomucor miehei) on microstructure and rheological
properties of Iranian UF White cheese. LWT-Food Sci. and Tech.
Soodam K., L. Ong, I. B. Powell, S. E. Kentish and S. L. Gras. 2015. Effect of calcium chloride
addition and draining pH on the microstructure and texture of full fat Cheddar cheese
during ripening. Food Chem. 181:111-118.
Stahl, T., H. P. Sallmann, R. Duehlmeier and U. Wernery. 2006. Selected vitamins and fatty acid
patterns in dromedary milk and colostrums. J. Camel Prac. Res. 13: 53-57.
Steel, R. G. D., J. H. Torrie and D. Dickey. 1997. Principles and procedures of statistics: a
biometrical approach, 3rd ed. McGraw Hill Book Co., Inc., New York.
Stepaniak, L. 2004. Dairy enzymology. Int. J. Dairy Technol. 57: 153-171.
Sulieman A. M. E., S. M. Siddig and Z. A. Salih. 2016. Microbiological Characteristics and
Sensory Evaluation of White Cheese Produced by Using Camel Milk and Mixture of
Camel and Cow Milk. J. Microbiology Res. 6(1): 8-13.

127
Suliman, E. S. K. and I. E. M. El Zubeir. 2014. A Survey of the Processing and Chemical
Composition of Gariss Produced by Nomadic Camel Women Herders in AlGaderif State,
Sudan. Jordan J. Biol. Sci. 7(2): 95-100.
Tayefi-Nasrabadi, H., M. A. Hoseinpour-fayzi and M. Mohasseli. 2011. Effect of heat treatment
on lactoperoxidase activity in camel milk: A comparison with bovine lactoperoxidase.
Small Rumi. Res. 99(2-3):187-190.
Tezira, A.L., S.K. Mbugua and J. Wangoh. 2005. Enumeration and identification of microflora in
suusac, a Kenyan traditional fermented camel milk product. LWT. 38(2): 125-130.
Thapa, T. B. 2000. Small scale milk processing technologies: other milk products. An Electronic
Conference, Food and Agriculture Organization of the United Nations.
Upreti, P. and L.E. Metzger. 2006. Influence of Calcium and Phosphorus, Lactose, and Salt -to-
Moisture Ratio on Cheddar Cheese Quality: Manufacture and Composition. J. Dairy Sci.
89: 420-428.
USDA. 2009. United States Department of Agriculture, National Agricultural library dietary
reference intakes. Elements.Retrieved from.http://www.nal.usda.gov/.
Verdini, R.A., S.E. Zorrilla and A.C. Rubiolo. 2004. Characterisation of soft cheese proteolysis
by RP-HPLC analysis of its nitrogenous fractions. Effect of ripening time and sampling
zone. Int. Dairy J. 14: 445–454.
Vermelho, A.B., V. Cardoso, R.P. Nascimento, A.S. Pinheiro and I.A. Rodrigues. 2016.
Application of enzyme in food industry by Ravishankar Rai V. chap in Advances in Food
Biotechnology. Jonh Weley & Sons Ltd. UK. Pp - 117.
Vernam, A. H. and J. P. Sutherland. 1994. “Milk Products-1”, Chapman and Hall, New York.
Walsh, C.D., T.P. Guniee, D. Harington, R. Mehra, J. Murphy and R.J. Fitzgerald. 1998. Cheese
making: Compositional and functional characteristics of low‐moisture part skim
mozzarella cheese from bovine milks containing K‐casein AA, AB, BB genetic variants.
J. Dairy Res. 65:307‐315.
Walstra, P., J.T.M. Wouters and T.J. Geurts. 2006. Dairy Science and Technology. 2nd ed. Taylor
and Francis Group, Boca Raton, London.
Wangoh, J. 1993. What steps towards camel milk technology? Int. J. Animal Sci. 8: 9-11.

128
Wangoh, J. 1997. Chemical and Technological Properties of Camel (Camelus dromedarius)
Milk. Diss. ETH Nr. 12295, Swiss Federal Institute of Technology, Zurich, Switzerland.
Warda, A., D.S. Nielsen, S. Hamad, and M. Jakobsen. 2008. A traditional Sudanese fermented
camel's milk product, Gariss, as a habitat of Streptococcus infantarius subsp. Infantarius.
Int. J. Food Microbiol. 127(3):215-219.
Web, B.H., A.H. Johnson and J.A. Alford. 1974. Fundamental of dairy chemistry.2nd ed. CBS,
Pub. New Dehli.
Wernery, U. 2003.Novel observations on camel milk. IN: Camel Health In Relation to Camel
Milk. Proceeding of the 9th Kenya Camel Forum.
Wszolek, M., A.Y. Tamime, D.D. Muir and M.N.I. Barclay. 2001. Properties of kefir made in
Scotland and Poland using bovine, caprine and ovine milk with different starter cultures.
J. Food sci. and Tech. 34: 251-261.
Yadav A. K., R. Kumar, L. Priyadarshini and J. Singh. 2015. Composition and medicinal
properties of camel milk: A Review. Asian J. Dairy and Food Res. 34(2): 83-91.
Yagil, R. 1982. Camels and camel milk Production and Health. FAO Animal Paper. Rome.
Yagil, R. 1987. Camel milk. A Review. Farms Animals. 2(2): 81-99.
Yagil, R. and Z. Etzion. 1980. Effect of drought condition on the quality of camel milk. J. Dairy
Res. 47: 159-166.
Yateem, A., M. T. Balba, T. Al-Surrayai, B. Al-Mutairi and R. Al-Daher. 2008. Isolation of
lactic acid bacteria with probiotic potential from camel milk. Int. J. Dairy Sci. 3: 194-199.
Yazici, F. and C. Akbulut. 2007. Impact of whey pH at drainage on the physicochemical, sensory
and functional properties of mozzarella cheese made from buffalo milk. J. Agri. and Food
Chem.55: 9993-10000.
Yonas H., E., Seifu and Z. Yilma. 2014. Physicochemical properties and consumer
acceptability of soft unripened cheese made from camel milk using crude extract of
ginger (Zingiber officinale) as coagulant. African J Sci. 8(2): 87-91.

129
Yoshida, S. and X. Ye. 1991. Isolation of lactoperoxidase and lactoferrin from bovine milk
rennet whey and acid whey by sulphopropyl cation exchange chromatography. Neth.
Milk Dairy J.45: 273-280.
Yun, J.J., D.M. Barbano, P.S. Kindstedt and K.L. Larose. 1995. Mozzarella cheese: Impact of
whey pH at draining on chemical composition, proteolysis, and functional properties. J.
Dairy Sci. 78:1-7.
Zisu, B. and N.P. Shah. 2006. Textural and functional changes in low fat mozzarella cheese in
relation to proteolysis and microstructure as influenced by the use of fat replacer, pr-
acidification and ESP starter. Int. Dairy J. 15:957-972.