Embed Size (px)
Citation preview

Final Report
OPERATING COSTS OF TRUCKING
AND SURFACE INTERMODAL
TRANSPORTATION IN CANADA
Submitted By:
By Ray Barton Associates Ltd. In association with
Logistics Solution Builders Inc. and
The Research and Traffic Group
March 31, 2008

Operating Costs of Trucking and Surface Intermodal Transportation in Canada
2
TABLE OF CONTENTS
TABLE OF CONTENTS .................................................................................................. 2 List of Exhibits ................................................................................................................. 3 1.0 Introduction ............................................................................................................... 4 2.0 Truck Costing ............................................................................................................ 5
2.1 Methodology ......................................................................................................... 5 2.2 Cost Components Summarized ........................................................................... 17 2.3 Overview of Findings and Trends ........................................................................ 30 2.4 Comments about Reliability of the Unit Costing Method ...................................... 31
3.0 Effects of Fleet size ................................................................................................. 36 4.0 Private vs. For-hire fleets ......................................................................................... 38 5.0 Owner-Operator Cost Survey .................................................................................. 40 6.0 Rail .......................................................................................................................... 43
6.1 Rail Rates ............................................................................................................ 43 6.2 Rail–Truck comparisons ...................................................................................... 46
7.0 Marine Movements .................................................................................................. 49
7.1 Halifax-Boston ..................................................................................................... 49 7.2 Montreal-St John’s ............................................................................................... 50 7.3 Sept-Iles – Trois Rivières ..................................................................................... 51 7.4 West Coast Movements ....................................................................................... 51 7.5 Cross Lake Ferry Operation Oswego-Toronto ..................................................... 51
APPENDIX A SUMMARY OF BASE CASE TRUCK COST ANALYSIS RESULTS ............................. 52 APPENDIX B RATES FOR HAULING CONTAINER CHASSIS SPECIFIED CORRIDORS................. 67 APPENDIX C SUMMARY OF OWNER OPERATOR ANALYSIS RESULTS ....................................... 70 APPENDIX D COSTING ANALYSIS OF OSWEGO-TORONTO FERRY OPERATION ....................... 77

Operating Costs of Trucking and Surface Intermodal Transportation in Canada
3
List of Exhibits Exhibit 2.1: Equipment Configurations for Case Studies ...................................... 6
Exhibit 2.2: Main Population Centres Assumed For Each Region ...................... 17
Exhibit 2.3: Representative Driver Wages .......................................................... 19
Exhibit 2.4: Fuel Costs ........................................................................................ 21
Exhibit 2.5 Purchase Cost of Power Units .......................................................... 24
Exhibit 2.6 Purchase Costs for Trailer Units ....................................................... 25
Exhibit 2.7: Licencing Fees and Weights ............................................................ 27
Exhibit 2.8: Unit Tractor-trailer Cost Comparisons Over Time ............................ 30
Exhibit 5.1: Owner-operator Costs ...................................................................... 40
Exhibit 5.2: Comparison of Owner-operator and Fleet Vehicle Costs ................. 42
Exhibit 6.1: Intermodal Rates for Selected Corridors CN Rail ............................. 44
Exhibit 6.2: Intermodal Rates for Selected Corridors CP Rail ............................. 45
Exhibit 6.3: Comparison of Truck Costs and CN Rail Rates Selected Corridors . 46
Exhibit 6.4: Comparison of Truck Costs and CP Rail Rates Selected Corridors . 47
Exhibit 7.1 Comparison of Marine Rates and Truck Costs Halifax-Boston ......... 49
Exhibit 7.2: Comparison of Marine Rate and Truck Costs Montreal –St Johns. . 50
Operating Costs of Trucking and Surface Intermodal Transportation in Canada
4
OPERATING COSTS OF TRUCKING AND SURFACE INTERMODAL TRANSPORTATION IN CANADA
1.0 Introduction
Since 1972, Transport Canada has sponsored research and publication of “Operating Costs of Trucks in Canada”, a report series that was expanded in 1986 to include comparison of direct trucking to rail intermodal transportation. The most recent edition of this study was prepared for Transport Canada by Logistics Solution Builders Inc. in 2005. For the 2007 edition of this project, the title is changed to “Operating Costs of Trucking and Surface Intermodal Transportation in Canada” and the scope of investigations has been enlarged. Objectives for this project are as follows: Provide estimates for year 2007 Operating Costs of Trucks and Intermodal
Transportation Services in Canada. Reflect differences in the truck operating cost structure associated with a
sample of provincial and territorial regions in Canada. Reflect the comparative truck operating cost structure for International (US
Based) operations. Depict differences, if any, from base case trucking service options
including use of owner operators, variations with fleet size, and private trucking costs compared to for-hire trucking costs.
Provide comparative intermodal transportation service costs for:
o Specified rail intermodal services and direct trucking costs o Specified short sea shipping services and direct trucking costs

Operating Costs of Trucking and Surface Intermodal Transportation in Canada
5
2.0 Truck Costing
2.1 Methodology
The approach used for this update of trucking costs is the same methodology used since 1972, and widely accepted by the trucking industry and private fleets for evaluating operating costs to provide trucking services to users. Documentation of this approach has been widely described in prior editions of Operating Costs of Trucks in Canada. Furthermore, this method has been presented to open industry seminars, called the “Know Your Truck Costs” series, sponsored by the Canadian Industrial Transportation League (now CITA), the Propane Gas Association of Canada, the Alberta Motor Transport Association and the British Columbia Trucking Association. In this context, the method has been widely exposed to industry and generally accepted in these forums. We follow essentially an activity based approach that itemizes each case study's distance travelled, operating speeds, fuel consumption rates, and all additional work hours not driving (i.e. waiting time, loading / unloading time) where drivers and equipment are "on duty". The foregoing activity measurements result in specified costs for over the road operation of trucks. Vehicle related costs include driver costs, fuel costs, repairs, tires, equipment ownership and licensing. The latter two costs are proportional to the number of vehicles needed to haul a given volume of freight, within a given timeframe. In addition to the direct hauling activity related costs, provision is made for assignable indirect costs for the fleet business. These include over-all administrative activity (management and supervision, billing and accounting, information technology, sales and marketing, and provision of business premises for operating the fleets), interest costs for moneys invested in equipment and for working capital of the business, insurance costs and an operator profit margin. Whether the trucking operation is for-hire, or part of a private fleet, providing an operator profit margin in the assessment of over-all operating cost (or user cost) covers the costs associated with the fleet business owner earning a "return on investment". -- either an operating margin to cover return for investment in a for-hire fleet, or for "opportunity cost" when a firm invests monies in a private fleet operation. In 1972, industry profit margins of for-hire trucking were generally significantly higher than is common today -- hence earlier Operating Costs of Trucks in Canada editions set operator profit at 10% of revenues. Currently, operator margins tend to be lower, perhaps averaging from 2.5 to 5% of revenues for industry leading fleet operations. Exceptional trucking operators can still earn margins around 10% -- for example these are comparable to

Operating Costs of Trucking and Surface Intermodal Transportation in Canada
6
margins reported by express transportation companies operating a premium service (e.g. trucking division of UPS, according to Transport Topics’ Top 100 for 2004, for example). As compared to the earlier studies, the current study compares three margin levels: 10%, 5% and 2.5% operator profit margin -- enabling the user to tailor the costs to their understanding of the particular trucking market being benchmarked. To enumerate all of the foregoing cost components, an Excel based costing spreadsheet is used to calculate annual component costs for a single vehicle -- operated as part of a fleet operation -- for each of the following vehicle configurations shown in Exhibit 2.1. Costs are enumerated as total and component costs of the vehicle for a year, costs per hour, and costs per kilometre.
Exhibit 2.1: Equipment Configurations for Case Studies
Five Axle Semi Trailer (Van)
Operating Costs of Trucking and Surface Intermodal Transportation in Canada
7
Exhibit 2.1: Equipment Configurations for Case Studies
Five Axle Semi Trailer (Flat deck or Lowboy)
Five Axle Semi Trailer (Liquid Tank)

Operating Costs of Trucking and Surface Intermodal Transportation in Canada
8
Exhibit 2.1: Equipment Configurations for Case Studies
Five Axle Container Chassis
Six Axle Tridem Semi Trailer (Van)
Six Axle Tridem Semi Trailer (Flat Deck)
Operating Costs of Trucking and Surface Intermodal Transportation in Canada
9
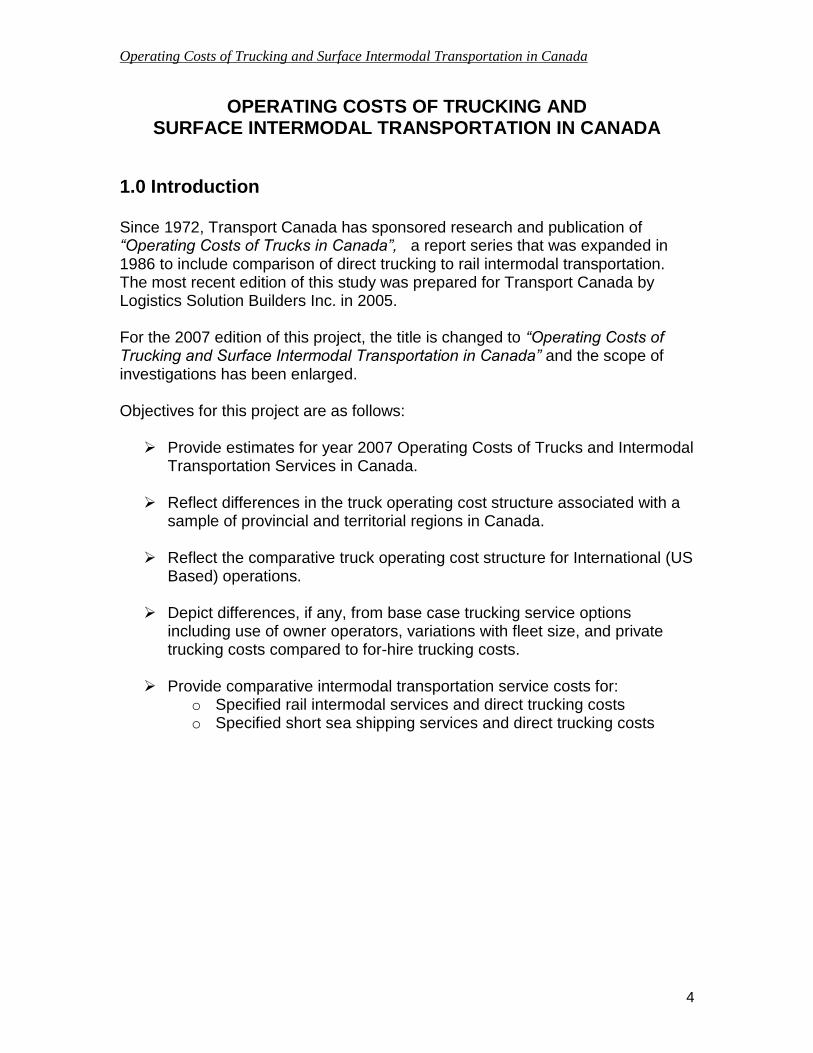
Exhibit 2.1: Equipment Configurations for Case Studies
Six Axle Tridem Tank Trailer
Eight Axle Super B-Train (Flat Deck)
Eight Axle Super B-Train (Liquid Tank)

Operating Costs of Trucking and Surface Intermodal Transportation in Canada
10
Exhibit 2.1: Equipment Configurations for Case Studies
Two Axle Straight Truck (Van)
The calculation is a replica of the methodology commonly used by fleet operators to determine costs, hence rates to quote customers for undertaking specific trucking activity. The project consultants have employed this methodology and used it to develop custom applications to consult within the for-hire trucking industry, and with operators of private trucking fleets, to undertake feasibility studies, quote new business, and benchmark cost efficiency of fleet operations. Input Unit Costs To implement this methodology a database of factor costs for wages, fuel, tires, repairs, equipment purchase and other cost inputs is maintained and updated from one report edition to the next. This database has never made use of statistical sampling techniques, because of sampling limitations, but rather is more of an "expert system" designed to capture and reflect a smaller sampling of data sources, updated and applied to the database from prior report editions. Because of the number of case study / regional configurations considered, sample sizes are small and care must be taken when "parsing" the over-all truck costs down into specific unit cost components. (see later discussion, section 2.3) For updating the database to 2007 from values used in the prior 2005 Operating Cost of Trucks in Canada study, five basic sources of information were consulted: 1) Truck Fleet Supplier Quotations (Equipment, tires, fuel). 2) Fleet Operator Expert Consultation in all Regions. A telephone survey

Operating Costs of Trucking and Surface Intermodal Transportation in Canada
11
attempted to contact and seek co-operation from between 150 and 200 trucking companies located from various directories, trucking associations and websites. Of these firms, partial cost data -- primarily related to driver wage levels but also including all cost components, if the carrier was willing to discuss these – was secured from 49 trucking businesses. When one considers that this data is spread across 10 provinces and 2 territories, one can see that -- on average --the sampling is only 4 or 5 firms per region. (see prior discussion of sampling size).
3) Literature Review on the Subject of Driver Costs (rates of pay, working
conditions, benefits, bonuses, etc.) including web references and employment advertisements.
4) Regulatory Publications (vehicular size and weight restrictions, license
fees, fuel taxation, sales taxes, etc.) -- primarily the JJ Keller Truck Licence and Tax Manual (Canada Regulations) and the JJ Keller Trucking Permit Guide (U Trip Ends to Corridors) and review of published literature and Internet sources such as Statistics Canada, US Department of Energy, Natural Resources Canada, Bank of Canada and other data sources.
For trucks domiciled in US Regions, on the selected international corridors, unit costs for inputs were obtained in US currency. These were then converted to equivalent Canadian currency costs using the average 2007 exchange rate of 1$ US = 1.074781 $ CDN (Source: Bank of Canada). For operations on international Canada - US corridors, most costs were based on the assumed home country of domicile for the trucker, except that fuel costs were based on US cost levels (reflecting ability to purchase fuel in US, taxed at US rates, for both truckers regardless of domicile). Vehicle Configurations and Equipment Life Cycle For the vehicle configurations illustrated in Exhibit 2.1, vehicle specifications can vary considerably for even a single equipment type. Such variations can reflect in significantly different costs for vehicle purchase, vehicle repairs and fuel consumption. These significant variations are present, when considering the trucking industry as a whole. Specific fleet operators will be using their own chosen specifications, engine sizes and other equipment selection preferences. The "mix" of vehicles on the road will reflect all of these differences, together with a mix of vehicle ages -- since not all vehicles are brand new. In order to better standardize Operating Costs of Trucks in Canada, some general vehicle specifications have been developed -- and these are reviewed

Operating Costs of Trucking and Surface Intermodal Transportation in Canada
12
every time that the study is updated -- by asking equipment suppliers and fleet owners whether the assumed basic specifications remain "representative" of what the majority of the industry is operating.1 The specifications that were used to guide our current discussion with equipment suppliers were as follows. Power Unit Configurations For the regional case studies, cabs were assumed to be NOT sleeper equipped (for purposes of estimating tare weight and purchase costs). For the longer distance corridor cases consideration was given to additional costs (and weight) to add to the basic power unit specifications to reflect a sleeper equipped power unit.
TRACTOR FOR A FIVE AXLE SEMI CONFIGURATION: Conventional configuration, Caterpillar C-13 Series Engine, 380 HP, 13 Speed Transmission, 40,000 lbs rear end, air ride suspension, 11R24.5 tires, 209” wheel base, 12,000 lbs front axle, GVW approximately 80,000 lbs, Canada 87,100 lbs. Tractor Tare Weight: 7620 kg
TRACTOR FOR A SIX AXLE SEMI CONFIGURATION: Conventional configuration, Detroit Series 60 Engine, 430 HP, 18 Speed Transmission, 46,000 lbs rear axle, air ride suspension, 12,000 lbs front axle, 195” to 210” wheel base, 11R24.5 tires, 4.56 gear ratio, GVW approx 100,000 lbs. Tractor Tare Weight: 7938 kg
TRACTOR FOR AN EIGHT AXLE SUPER B TRAIN CONFIGURATION: Conventional configuration, Caterpillar C-15 Series Engine, 475 HP, 18 speed transmission, 46,000 lbs rear axle, air ride suspension, 12,000 lbs front axle, 209” wheel base, 11R24.5 tires, 4.56 gear ratio, GVW approx. 140,000 lbs. Tractor Tare Weight: 7938 kg
TWO AXLE STRAIGHT TRUCK (VAN) SPECIFICATION: 2 Axle Diesel Powered Straight Truck Cab and Chassis, 24 Foot Insulated Van Box. No Reefer, Rear Doors, GVW approx. 14,600 kg, Automatic transmission.
1 While new EPA regulatory requirements were introduced in the 2007 model engines, it is too
early to determine the effects these changes have had on fuel economy and vehicle operating costs, although early industry literature suggests these changes have been minimal (Truck news, October 2007 Volume 27, Issue 10). While the technology added to the tractor to meet the regulations weights several hundred pounds, there was little change reported by fleets in the overall tare weight of their tractors.

Operating Costs of Trucking and Surface Intermodal Transportation in Canada
13
Trailers for Five Axle, Six Axle and Eight Axle Super-B Operations
FIVE AXLE SEMI VAN CONFIGURATION (TANDEM SEMI TRAILER): Interior post insulated van, 1 1/8” - 1 ½” insulation, double doors at rear with 5 hinges per door, anti - rack door locks, vents front and back, air ride suspension, steel disk wheels, hardwood floors, undercoated, rear gear black finish, aluminium panels, prefinished white, 2 rows of cargo E-track. Trailer Tare Weight: 6,418 kg
FIVE AXLE SEMI FLAT DECK CONFIGURATION (TANDEM SEMI TRAILER): Outside rail construction with stake pockets and rub rail, load winches at 3’-0” centres, air suspension, steel disc wheels, hardwood floor, 1 colour epoxy finish. Trailer Tare Weight: 5,897 kg
FIVE AXLE BULK LIQUID TANKER CONFIGURATION (TANDEM SEMI TRAILER): (TC307) 27,275 litres, type 316L Stainless Steel 2 B finish, bright annealed jacketing, 5” insulation compressed to 4”, dimple style hot wall, 20” manway, fort vale super vent, 1” pressurization package, 2 x 20’ - 0” S.S. hose trays, spring suspension, steel disk wheels, 1 colour epoxy finish, walkaround spill dam, curbside ladders, stainless steel fenders, aluminium catwalk, single compartment. Trailer Tare Weight: 5,942 kg
FIVE AXLE CONTAINER CHASSIS CONFIGURATION (TANDEM SEMI TRAILER): 40' - 45' Steel Extendable Gooseneck Container Chassis. Overall width 96 inches, main frame width 40 inches, Maximum rear height 48 inches, Twist lock and slide pins meet ISO specifications, Frame design and steel to ASTM A572 Grade 50 Specification, ICC Bumper, AAR approved landing gear of 50,000 lb lift capacity and 140,000 lb static capacity. Trailer Tare Weight: 6800 lbs
SIX AXLE TRIAXLE VAN CONFIGURATION (TRIDEM SEMI TRAILER): Interior post insulated van, 1 1/8” - 1 ½” insulation, double doors at rear with 5 hinges per door, anti-rack door locks, vents front and back, air suspension, steel disk wheels, hardwood floors, undercoated, rear gear black finish, aluminium panels prefinished white, 2 rows cargo E-track. Trailer Tare Weight: 8006 kg
SIX AXLE TRIAXLE FLAT DECK CONFIGURATION (TRIDEM SEMI TRAILER): Outside rail construction with stake pockets and rub rail, load winches at 3’ 0” centres, air suspension, steel disk wheels, hardwood floor, 1 colour epoxy finish. Trailer Tare Weight: 6804 kg
SIX AXLE TRIAXLE TANK TRAILER CONFIGURATION (TRIDEM SEMI TRAILER): (TC407) 36,367 litres, type 316L Stainless Steel 2 B finish, bright annealed jacketing, 5” insulation compressed to 4”, dimple style hot wall, 20” manway, fort vale super vent, 1” pressurization package, 2 x 20’ -

Operating Costs of Trucking and Surface Intermodal Transportation in Canada
14
0” S.S. hose trays, spring suspension, steel disk wheels, 1 colour epoxy finish, walkaround spill dam, curbside ladders, stainless steel fenders, aluminium catwalk, single compartment. Trailer Tare Weight: 7,200 KG
EIGHT AXLE SUPER B FLAT DECK CONFIGURATION (TRIDEM LEAD TRAILER, TANDEM PUP TRAILER): Outside rail construction with stake pockets and rub rail, load winches at 3’ 0” centres, air suspension, steel disc wheels, hardwood floor, 1 colour epoxy finish. Trailer Tare Weight: 8845 kg
EIGHT AXLE SUPER B LIQUID TANK CONFIGURATION (TRIDEM LEAD TRAILER, TANDEM PUP TRAILER): (TC 306) Aluminium petroleum RTAC B-train, 4 compartment, double bulkheads, 20” fill covers, 4” air internal valves, 4” openable bottomload adapters, 63,500 litre capacity, four 20’-0” hose trays, prepared for vapour recovery, optic overfill sensors, 36”x30”x28” fitting box (aluminium). Trailer Tare Weight: 10659 kg.
Vehicle Life Cycle for This Analysis Whether a fleet operator buys a new or used vehicle, and how long it is retained, is a business decision reflecting the owner's business strategy and the trucking market segment served. For example, an agricultural producer often purchases older used equipment and retains it for many years -- reflecting low average annual mileage characteristics of this hauling, the fact that hauling is very "local" to the home base, etc. For most for-hire line haul trucking operations, the "standard" life cycle management strategy is as follows: For median utilization of 100,000 miles per year (160,000 km), operators will purchase new power units and retain them in line haul trucking service for 5 years. After 500,000 to 750,000 miles, (or 800,000 to 1.2 million km) the power unit will either be sold, or "retired" for use as an urban pick up and delivery unit, or a yard tractor. Under the same utilization scenario, trailers will be purchased new and operated for an average of 8 years. Medium Sized Fleet Assumption The presented case studies give annual costs to operate a single vehicle; however the costs were developed assuming the vehicle is part of a medium sized trucking fleet. For this reason, indirect costs for administration, interest,

Operating Costs of Trucking and Surface Intermodal Transportation in Canada
15
insurance and operator margin have been allocated to the single vehicle based on normal percentages for these cost components within trucking businesses in Canada and the US. Effects of fleet size on unit costs will be discussed further in Section 3. “Terminalling” Productivity Assumptions For developing truck operating costs as impacted by terminalling (load-unload) productivity, truck equipment ownership costs during wait time are excluded from analysis for the reason that the basic equipment utilization criteria, namely total kilometres travelled annually, implicitly already accounts for these costs. In other words, it is less feasible for an operator to realize a high number of kilometres annually as the proportion of equipment time spent loading and unloading increases. Terminal productivity does directly influence driver wages and burden costs because whether the drivers are physically involved in commodity handling, they must be paid the representative hourly rate during the time involved for waiting to be loaded or unloaded. For this study, terminal handling performance is based on the following parameters:
Dry Freight in Combination Units: One origin-destination per trip is assumed, which reduces the time required to handle one payload. Realistically, the rate of loading-unloading varies with consignment type; however observation indicates that 4,500 kg per man-hour is representative of dry freight loading/unloading performance. Assuming an adequate availability of manpower, a handling time criteria of three hours for 27,270 kg has been applied to all applicable cases. That is, the driver will be on the job, but not driving, three hours for a 27,270 kg dry freight payload.
Bulk Commodities: A study of various bulk operations indicates that the following load/unload rates reflect a good average for bulk commodities: 40,900 kg in 1 hour and 15 minutes; 22,700 kg in 45 minutes; 9,100 kg in 15 minutes.
Dry Freight in Van Straight Trucks The time spent loading and unloading freight was assumed to be 1 person hour per 1600 kg of consignment.
The above mentioned handling performances are used in the analysis to estimate the total time necessary during the operations to handle the commodities. During this time the driver is paid on an hourly rate basis. The same handling performances have been applied throughout with exception of the
Operating Costs of Trucking and Surface Intermodal Transportation in Canada
16
container chassis hauling evaluations where a time of 0.75 hours per trip was applied in total for all loading and unloading activity. We are also assuming that the only handling cost to the truck operator is the wages and burden paid to the driver on duty during loading and unloading. The handling facilities and manpower are considered not to be under the trucker's management, or if so, that the costs for this operation are recovered against a “handling charge” and not included in the trucking cost. Truck Operations Productivity and Cost Factors
Intra Regional Base Case Trip Distances: The combination units are assigned a round trip distance of 320 kilometres since they are assumed to be involved in predominantly "terminal-to-terminal" highway service. Urban two axle units are assigned a trip distance of 100 kms. These common trip distances tend to reflect average common operational factors within the industry -- recognizing there are shorter and longer distance market segments, for specific operations.
City Pair Corridor Studies: Costs are developed for one way travel based on practical route distances taken from PC*Miler. Numbers of one-way trips annually, which reflect in annual distances travelled by units, reflect 3,000 working hours per unit divided by time required for a single one-way trip.
These corridor operations are applied to the line haul combination units and not to straight truck applications. Annual Operating Distance Annual operating distance is a convenient efficiency index that reflects factors such as seasonality, hauling distance, traffic congestion, or urban / inter-urban operation. This factor is also readily monitored and understood by fleet operators. For this study, three annual utilization scenarios were undertaken -- designed to reflect Low, Median, and High annual utilization. For line haul combination trucks, the scenarios reflect:
Low Annual Utilization (80,000 km per year, or 50,000 miles per year)
Median Annual Utilization (160,000 km per year, 100,000 miles per year)
High Annual Utilization (240,000 km per year, or 150,000 miles per year)
For the city pair corridors, annual mileage reflected a median utilization based on 3000 worked hours per year, applied to the trip distance.
In the case of the urban two axle trucks, the utilization levels were 40,000 km; 80,000 km and 120,000 km annually for Low, Median and High cases.
Operating Costs of Trucking and Surface Intermodal Transportation in Canada
17
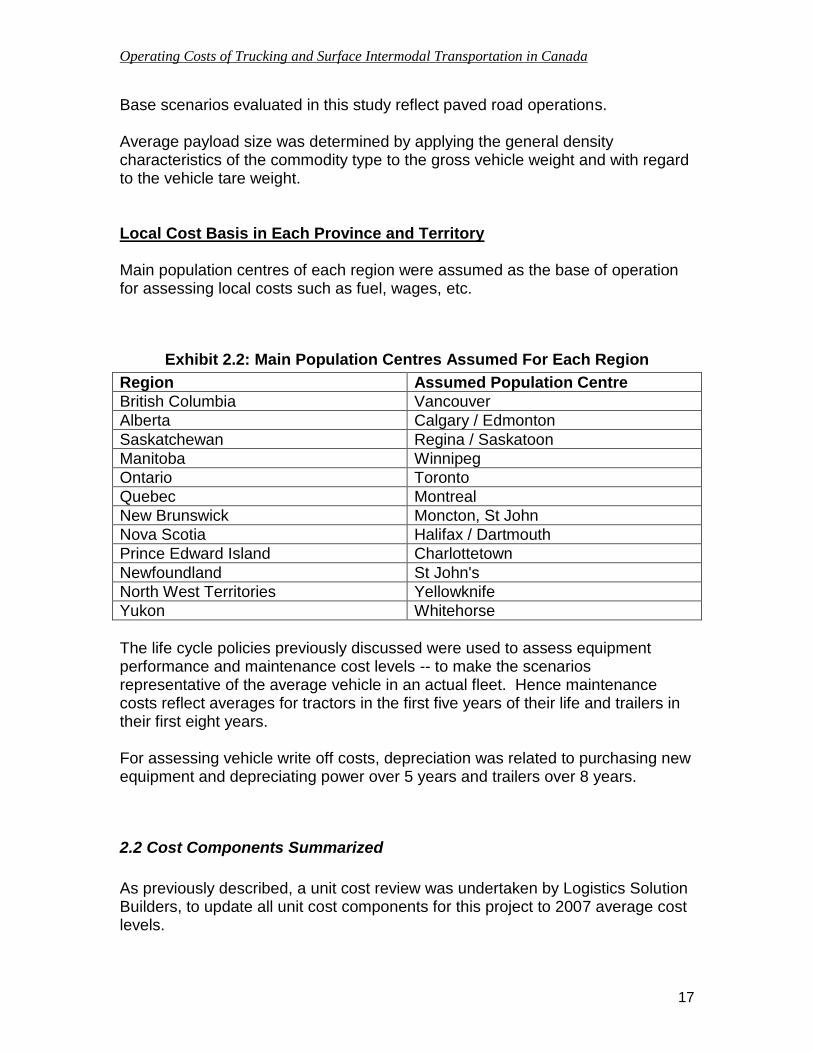
Base scenarios evaluated in this study reflect paved road operations. Average payload size was determined by applying the general density characteristics of the commodity type to the gross vehicle weight and with regard to the vehicle tare weight. Local Cost Basis in Each Province and Territory Main population centres of each region were assumed as the base of operation for assessing local costs such as fuel, wages, etc.
Exhibit 2.2: Main Population Centres Assumed For Each Region
Region Assumed Population Centre
British Columbia Vancouver
Alberta Calgary / Edmonton
Saskatchewan Regina / Saskatoon
Manitoba Winnipeg
Ontario Toronto
Quebec Montreal
New Brunswick Moncton, St John
Nova Scotia Halifax / Dartmouth
Prince Edward Island Charlottetown
Newfoundland St John's
North West Territories Yellowknife
Yukon Whitehorse
The life cycle policies previously discussed were used to assess equipment performance and maintenance cost levels -- to make the scenarios representative of the average vehicle in an actual fleet. Hence maintenance costs reflect averages for tractors in the first five years of their life and trailers in their first eight years. For assessing vehicle write off costs, depreciation was related to purchasing new equipment and depreciating power over 5 years and trailers over 8 years.
2.2 Cost Components Summarized
As previously described, a unit cost review was undertaken by Logistics Solution Builders, to update all unit cost components for this project to 2007 average cost levels.

Operating Costs of Trucking and Surface Intermodal Transportation in Canada
18
As noted previously, this update of Operating Costs of Trucks in Canada is built partially upon the regularity of updates -- hence the study was commenced using the data base of unit cost information compiled over the years, in previous studies, as a starting point of inquiry. This permitted us to seek information concerning absolute levels of cost, but also to understand changes over the past two years -- down to the regional and specific equipment configuration level of inquiry. Data sources consulted for these efforts included review of published literature and web based information concerning the trucking industry, contact with trucking associations, information shared with us from almost fifty for-hire trucking businesses and contact with trailer manufacturers and dealers, power unit suppliers, tire suppliers and a major oil company's national fleet sales department. Driver Costs Samples of 2007 hourly and distance base wage rates for drivers in regions were obtained from:
Discussions with fleet operators in all the regions.
Reference to available collective bargaining results published in internet references and trade publications.
Review of corporate web-sites, many of which publish driver compensation information.
Review of newspaper classified advertisements and web-based driver recruitment sites for carriers and driver pools.
Review of transportation and other wage statistics from Statistics Canada, the US Department of Labor, Published Teamsters Wage Rates, and US County and State Wage Survey Statistics.
Considering these sources, and in light of the driver wage database from the prior study, Logistics Solution Builders developed our best estimate for average driver wages applicable for the hauling cases in our study.

Operating Costs of Trucking and Surface Intermodal Transportation in Canada
19
The 2007 base wage unit costs were as follows:
Exhibit 2.3: Representative Driver Wages
REPRESENTATIVE DRIVER WAGES ACROSS CANADA (mid 2007)
BULK COMMODITY GENERAL COMMODITY
5-Axle 5-Axle 6-Axle 6-Axle 7/8-Axle 7/8-Axle 5-Axle 5-Axle 6-Axle 6-Axle 7/8-Axle 7/8-Axle
Vehicles Vehicles Vehicles Vehicles Vehicles Vehicles Vehicles Vehicles Vehicles Vehicles Vehicles Vehicles
per hr per km per hr per km per hr per km per hr per km per hr per km per hr per km
$ cents $ cents $ cents $ cents $ cents $ cents
British Columbia $21.50 28.58 $23.50 28.89 $25.00 29.21 $22.00 28.58 $24.00 28.89 $25.50 29.21
Alberta $19.50 27.50 $21.50 28.35 $23.50 30.06 $20.00 27.50 $22.00 28.35 $24.00 30.06
Saskatchewan $19.00 25.48 $20.50 26.10 $22.00 27.34 $19.50 25.48 $21.00 26.10 $22.50 27.34
Manitoba $18.50 25.17 $20.00 25.79 $21.50 26.72 $19.00 25.17 $20.50 25.79 $22.00 26.72
Ontario $19.50 26.10 $22.00 26.72 $24.00 27.34 $20.00 26.10 $22.50 26.72 $24.50 27.34
Quebec $18.50 24.86 $20.00 25.48 $21.50 26.41 $19.00 24.86 $20.50 25.48 $22.00 26.41
New Brunswick $15.25 21.13 $15.50 22.06 $16.25 23.92 $15.75 21.13 $16.25 22.06 $17.25 23.92
Nova Scotia $15.25 21.13 $15.50 22.06 $16.25 23.92 $15.75 21.13 $16.25 22.06 $17.25 23.92
P.E.I. $14.75 20.51 $15.00 21.59 $15.75 23.61 $15.25 20.51 $15.50 21.59 $16.50 23.61
Newfoundland $16.00 22.06 $16.50 22.68 $16.75 24.23 $16.00 22.06 $16.50 22.68 $16.75 24.23
Yukon $22.00 29.21 $23.00 30.14 $25.50 31.07 $22.50 29.83 $23.75 30.60 $26.25 31.69
N.W.T. $20.00 27.50 $22.00 28.35 $24.00 30.06 $20.50 27.50 $22.50 28.35 $24.50 30.06
U.S. DRIVER WAGES FOR FIVE-AXLE SEMI CONFIGURATION (mid 2007) in Canadian $/hr and
cents/km
BULK COMMODITY GENERAL COMMODITY
5-Axle 5-Axle 5-Axle 5-Axle
Vehicles Vehicles Vehicles Vehicles
per hr per km per hr per km
$ cents $ cents
U.S. North East (NY,NJ, Mass) $21.76 28.38 $23.38 30.05
U.S. Great Lakes (Ill,Mich) $21.76 28.38 $23.38 30.05
U.S. Midwest (Nebr,Kans,Okl) $20.21 27.38 $21.93 29.39
U.S. South (Ark, Alab, Geo) $19.08 26.88 $21.07 28.38
U.S. West. (Wash, Oreg, Calif) $20.21 28.38 $21.93 30.05
1.07478127 2007 U.S. to Can $ Exchange Rate
Costs for Driving Activity Driving costs are influenced by distance, hours and tonnage associated with a haul. Larger highway vehicles are costed on the basis of calculating driver wages on either a per-kilometre rate, or an hourly rate -- whichever is highest. This is standard procedure and results in most cases in line-haul pavement kilometres being rated on a distance basis and urban and gravel kilometres paid on an hourly basis, due to slower vehicle speed. Urban straight truck operations are costed on an hourly pay basis.

Operating Costs of Trucking and Surface Intermodal Transportation in Canada
20
Costs for Loading and Unloading Time Cost for driver time resulting from loading and unloading of payloads is included using the appropriate hourly rate. Wage Burden Costs In addition to paying base hourly and mileage wages for driving and loading / unloading work performed, a wage burden percentage is applied to cover costs associated with non worked paid time (e.g. Vacation and Statutory Holidays), driver benefits such as pensions, medical premiums, etc. that are provided by the employer. Burden percents used have been developed from analysis and consultation with fleet operators. Fuel Costs Fuel costs are a result of the influence of distance travelled, vehicle fuel consumption, and of course fuel prices. To support Operating Costs of Trucks in Canada, Logistics Solution Builders maintains a database of realistic fuel consumption rates for each case study hauling scenario. These are based on, and updated with, consultation of fleet operators, discussions with distributors of power units to the industry and review of published literature on fleet energy management benchmarks and targets. In relation to pricing, we reviewed average annual 2007 fleet discounted fuel pricing in the most heavily populated areas of each region. Costs included provincial and state tax as well as Canadian excise tax on fuels. Price levels used in our study are on shown by Exhibit 2.4.

Operating Costs of Trucking and Surface Intermodal Transportation in Canada
21
Exhibit 2.4: Fuel Costs
ESTIMATED TRUCKER FUEL COSTS BY PROVINCE (avg 2007)
Diesel
Est. Purchase Tank Wagon Provincial Fuel Tax Federal Fuel Tax
cents/litre cents/litre cents/litre cents/litre
(with fuel taxes) (without fuel taxes)
British Columbia 94. 9 71. 9 15. 0 4
Alberta 86. 3 73. 3 9. 0 4
Saskatchewan 89. 5 70. 5 15. 0 4
Manitoba 85. 6 70. 1 11. 5 4
Ontario 84. 1 65. 8 14. 3 4
Quebec 86. 1 65. 9 16. 2 4
New Brunswick 86. 0 65. 1 16. 9 4
Nova Scotia 88. 7 69. 3 15. 4 4
P.E.I. 89. 0 64. 7 20. 3 4
Newfoundland 91. 6 71. 1 16. 5 4
Yukon 97. 6 86. 4 7. 2 4
N.W.T. 106. 5 93. 4 9. 1 4
U.S. Cost Information based on U.S. DEPT OF ENERGY REPORTS
Diesel Purchase Equivalent
$ CDN/ U.S. GALLON CDN cents/litre
U.S. NorthEast (basis NY) 3.101 81.9
U.S. Great Lakes (Michigan) 3.085 81.5
U.S. Midwest (Nebraska) 3.085 81.5
U.S. Southern (Texas) 3.042 80.4
U.S. Western (Calif,Colo) 3.278 86.6 Note US costs have been expressed in equivalent Canadian dollars based on the average exchange rate, previously discussed.
Operating Costs of Trucking and Surface Intermodal Transportation in Canada
22
Repair Costs Repair costs used in our study represent expected costs of parts, lubricants, oil, and labour associated with the maintenance and repair of the particular equipment type. Our database on repair costs was updated in consultation with equipment dealerships, fleet managers, and reference to US Bureau of Commerce and Statistics Canada Industrial Price Indices. We have assumed that repairs were undertaken under efficient shop management and that a prudent preventive maintenance system was employed that was compatible with equipment manufacturer recommended service intervals, warranties and other best practices. Cleaning Costs The cost of cleaning tractors, flatdeck trailers and van freight trailers has minimal effect on total operating costs. Annual costs of cleaning bulk tanks vary with the type of commodity carried and the quantity of different bulk commodities transported during the year. An average of tank trailer cleaning costs was developed from discussions with various bulk tank truck carriers as well as a review of prices charged at commercial tank cleaning facilities. Transport Costs The transport cost category is a miscellaneous category to reflect all those factors that may be attributed to extra equipment that are not normally viewed as part of a vehicle's standard configuration. This may represent special pumps, hoses, safety equipment, dunnage, small tools, chains, tarping, heaters* or refrigeration* equipment. These costs will vary with area of operation and also with the specific type of product hauled. *Note: Starred items are not included for this analysis, but such items would normally be included in the category “transport costs”, when evaluating these specialized trucking applications. Tire Costs Tire unit costs in our database were updated by Logistics Solution Builders through consultation with suppliers of tires, our knowledge base from prior related fleet studies, and reference to industrial price indices published by

Operating Costs of Trucking and Surface Intermodal Transportation in Canada
23
Statistics Canada and the US Bureau of Commerce. Actual in-service costs for trucking tires are a reflection of the following factors:
Number of tires for the particular vehicle and cost of new tires purchased in each region.
Life of a tire in each service application, considering road surface conditions.
Cost of retreading, when retreading is desirable, and life of a retread tire for each region.
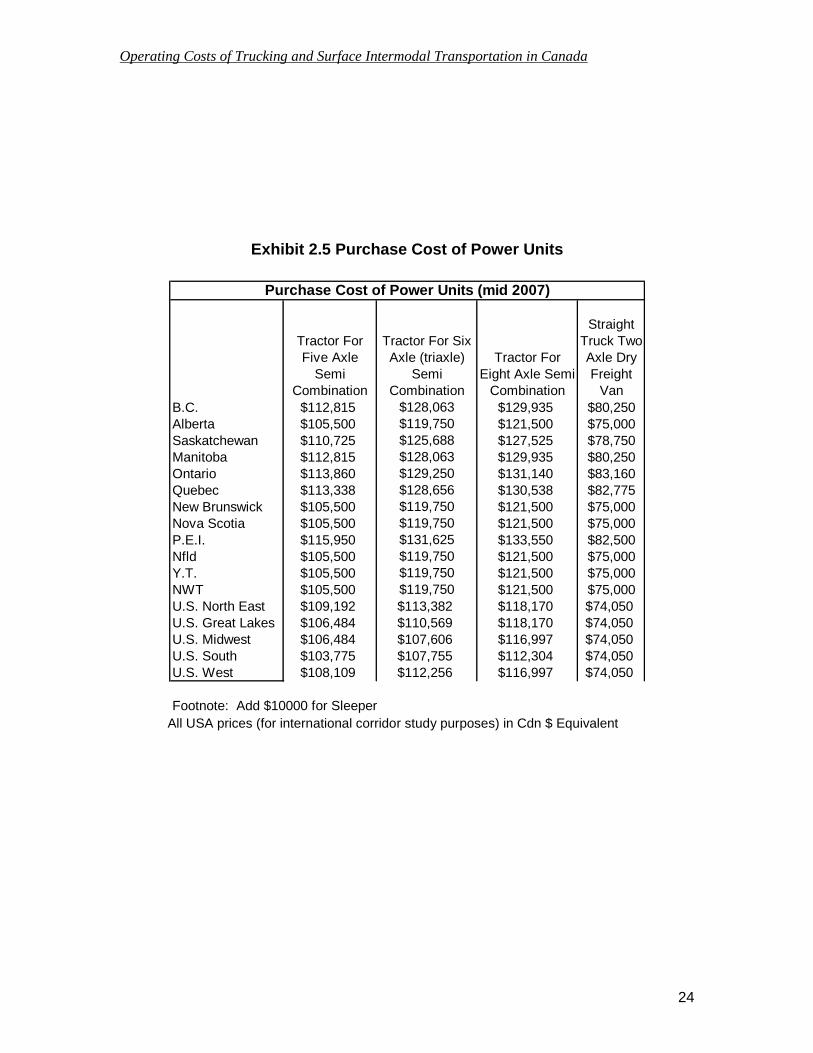
Depreciation Costs "Normal" depreciation is used based on the 2007 equipment purchase cost obtained from dealer quotations. That is, one percent a month for trailers over a trailer life of eight years and 79.2 percent for tractors over a tractor life of five years. This assumption relates equipment write-off to current replacement cost rather than an arbitrary "book value" determination. Equipment values used for this study, inclusive of applicable provincial and state sales taxes, are tabulated below. Although this is not a detailed procurement study on the supply of highway tractors to the industry, when compared to similar cost estimates used in the prior 2005 study, it would appear that the shift in Canadian currency versus U.S. currency has moderated equipment purchase costs somewhat for truck operators.
Operating Costs of Trucking and Surface Intermodal Transportation in Canada
24
Exhibit 2.5 Purchase Cost of Power Units
Purchase Cost of Power Units (mid 2007)
Tractor For
Five Axle
Semi
Combination
Tractor For Six
Axle (triaxle)
Semi
Combination
Tractor For
Eight Axle Semi
Combination
Straight
Truck Two
Axle Dry
Freight
Van
B.C. $112,815 $128,063 $129,935 $80,250
Alberta $105,500 $119,750 $121,500 $75,000
Saskatchewan $110,725 $125,688 $127,525 $78,750
Manitoba $112,815 $128,063 $129,935 $80,250
Ontario $113,860 $129,250 $131,140 $83,160
Quebec $113,338 $128,656 $130,538 $82,775
New Brunswick $105,500 $119,750 $121,500 $75,000
Nova Scotia $105,500 $119,750 $121,500 $75,000
P.E.I. $115,950 $131,625 $133,550 $82,500
Nfld $105,500 $119,750 $121,500 $75,000
Y.T. $105,500 $119,750 $121,500 $75,000
NWT $105,500 $119,750 $121,500 $75,000
U.S. North East $109,192 $113,382 $118,170 $74,050
U.S. Great Lakes $106,484 $110,569 $118,170 $74,050
U.S. Midwest $106,484 $107,606 $116,997 $74,050
U.S. South $103,775 $107,755 $112,304 $74,050
U.S. West $108,109 $112,256 $116,997 $74,050
Footnote: Add $10000 for Sleeper All USA prices (for international corridor study purposes) in Cdn $ Equivalent

Operating Costs of Trucking and Surface Intermodal Transportation in Canada
25
Exhibit 2.6 Purchase Costs for Trailer Units
Purchase Costs For Trailers (mid 2007)
Trailer For
Five Axle
Combination
Semi Van
Trailer For
Five Axle
Combination
Flat Deck
Trailer For
Five Axle
Combination
Bulk Liquid
Tanker
Trailer For
Five Axle
Combination
Container
Chassis
Trailer
Trailer For
Six Axle
Combination
Triaxle Van
B.C. $27,820 $26,750 $70,620 $24,075 $34,240
Alberta $26,000 $25,000 $66,000 $22,500 $32,000
Saskatchewan $27,300 $26,250 $69,300 $23,625 $33,600
Manitoba $27,820 $26,750 $70,620 $24,075 $34,240
Ontario $28,080 $27,000 $71,280 $24,300 $34,560
Quebec $27,950 $26,875 $70,950 $24,188 $34,400
New Brunswick $26,000 $25,000 $66,000 $22,500 $32,000
Nova Scotia $26,000 $25,000 $66,000 $22,500 $32,000
P.E.I. $28,600 $27,500 $72,600 $24,750 $35,200
Nfld $26,000 $25,000 $66,000 $22,500 $32,000
Y.T. $26,000 $25,000 $66,000 $22,500 $32,000
NWT $26,000 $25,000 $66,000 $22,500 $32,000
U.S. North East $27,000 $26,000 $70,000 $22,000 $31,000
U.S. Great Lakes $27,000 $26,000 $70,000 $22,000 $31,000
U.S. Midwest $27,000 $26,000 $70,000 $22,000 $31,000
U.S. South $27,000 $26,000 $70,000 $22,000 $31,000
U.S. West $27,000 $26,000 $70,000 $22,000 $31,000
Trailer For
Six Axle
Combination
Triaxle Flat
Deck
Trailer For
Six Axle
Combination
Bulk Liquid
Tanker
Trailer For
Eight Axle B
Train Flat
Deck
Trailer For
Eight Axle B
Train Bulk
Liquid
Tanker
B.C. $31,000 $90,000 $43,000 $169,000
Alberta $29,000 $84,000 $40,000 $158,000
Saskatchewan $30,000 $88,000 $42,000 $166,000
Manitoba $31,000 $90,000 $43,000 $169,000
Ontario $31,000 $91,000 $43,000 $170,000
Quebec $31,000 $90,000 $43,000 $170,000
New Brunswick $29,000 $84,000 $40,000 $158,000
Nova Scotia $29,000 $84,000 $40,000 $158,000
P.E.I. $32,000 $92,000 $44,000 $174,000
Nfld $29,000 $84,000 $40,000 $158,000
Y.T. $29,000 $84,000 $40,000 $158,000
NWT $29,000 $84,000 $40,000 $158,000
U.S. North East $28,000 $82,000 $38,000 $165,000
U.S. Great Lakes $28,000 $82,000 $38,000 $165,000
U.S. Midwest $28,000 $82,000 $38,000 $165,000
U.S. South $28,000 $82,000 $38,000 $165,000
U.S. West $28,000 $82,000 $38,000 $165,000 GST has been excluded since fleet operators will claim offsetting GST credits.

Operating Costs of Trucking and Surface Intermodal Transportation in Canada
26
License Costs Canadian license costs reflect the provincial or territorial charges for licensing the vehicle configurations studied as found in the Truck License & Tax Manual: A Guide to Canadian Regulations, 2007 edition published by J.J. Keller and Associates2. US license costs for our international corridors are based on registration of a Five Axle Tractor Semitrailer Combination to the accepted interstate highway standard of 80,000 lbs (36,364 kg) gross vehicle weight. The registration costs are based on selected state jurisdictions, within each region, and applicable charges were secured from the Trucking Permit Guide, 2007 edition published by J.J. Keller and Associates. It includes highway use tax and state taxes. Two axle straight trucks were assumed licensed at 14,600 kg in all jurisdictions.
2 Note that provincial insurance programs, where provided do not include insurance costs as part
of vehicle registrations fees for trucks as they sometimes do for autos

Operating Costs of Trucking and Surface Intermodal Transportation in Canada
27
Resulting annual license costs for our Canadian case studies were as follows:
Exhibit 2.7: Licencing Fees and Weights
VEHICLE LICENSING FEES AND WEIGHTS (2007)
($) Annual ($) Annual
GVW/GCW No. of Fee for Fee for
(kgs) Axles Power Unit Trailer
British Columbia 39,500 5 2229 30
46,500 6 2799 30
63,500 8 3905 60
14,600 2 607
Alberta 39,500 5 1809 20
46,500 6 2377 20
62,500 8 3314 40
14,600 2 463
Saskatchewan 39,500 5 2378 32
46,500 6 2495 32
62,500 8 4041 64
14,600 2 656
Manitoba 39,500 5 2236 $10 / 5 yrs
46,500 6 2780 $10 / 5 yrs
62,500 8 4048 $20 / 5 yrs
14,600 2 501
Ontario 45,000 5 1869 $35 / Life
54,000 6 2280 $35 / Life
63,500 8 2722 $70 / Life
14,600 2 549
Quebec 45,500 5 2162 42
55,500 6 2961 42
59,000 8 2961 84
14,600 2 696
New Brunswick 41,500 5 2141 16
49,500 6 2534 16
62,500 8 3129 32
14,600 2 757
Nova Scotia 40,500 5 2238 35
53,000 6 2675 35
58,500 8 3194 70
14,600 2 819
P.E.I. 40,600 5 1558 $65 / 5 yrs
49,700 6 1884 $65 / 5 yrs
62,500 8 2655 $130 / 5 yrs
14,600 2 564
Newfoundland 40,500 5 1898 25
49,500 6 2325 25
62,500 8 2940 50
14,600 2 692
Yukon Territory 43,800 5 1128 $1 / month
53,300 6 1428 $1 / month
63,500 8 1728 $2 / month
14,600 2 240
N.W.T. 39,500 5 1135 20
46,500 6 1338 20
63,500 8 1831 40
14,600 2 410

Operating Costs of Trucking and Surface Intermodal Transportation in Canada
28
Indirect Costs: Administration, Interest, and Insurance Administration and interest on working capital costs have been applied to the hauling cases based on average industry levels for fleets and taking account of normal interest charges applicable to trucking businesses in Canada and the US during 2007. The applicable percentage amounted to 12.5% of revenue for Canadian trucking businesses and 13% of revenue for US based trucking businesses. The Canada / US interest rate difference reflects information gained from the Bank of Canada Internet site concerning Chartered Bank Prime Interest Rates and US Prime Rates Charged by Banks during 2007 -- with borrowing rates adjusted to reflect expected credit treatment of reasonably creditworthy trucking enterprises having clean financial performance abstracts. Interest costs for financing equipment purchase reflects an assumed borrowing cost of 7% in Canada (9.25% in the US), loan payback period equivalent to equipment life, and an assumed 75% of equipment purchase costs financed (25% down payment required). Insurance rates, as a percent of revenue, reflect recent risk and claims performance of the trucking industry, historically a value between 3% and 3.5% of revenue. Operator Profit Margin Early editions of Operating Costs of Trucks in Canada provided for operator profit margin at the (then normal) level of 10 percent of revenue. Since Canadian trucking industry entry deregulation in the 1980's, profit levels have eroded and it is very common for well managed trucking enterprises to earn margins between 2.5% and 5% of business revenue. Specialized fleets can still earn higher levels of margin (for example time sensitive express operations such as the land based trucking divisions of international courier / freight forwarding businesses, but these are arguably not strictly trucking "pure plays", and their financial returns are certainly exceptional). To aid in applying the case studies investigated to specific business circumstances, Operating Costs of Trucks in Canada now calculates over-all trucking costs using three alternative levels of margin: 10%, 5% and 2.5% of revenue.
Operating Costs of Trucking and Surface Intermodal Transportation in Canada
29
For readers who are uncertain of which margin to assume for a specific hauling situation, a median approach is recommended -- basing evaluations using the 5% margin cases provided. For each of the three alternate levels of profitability, the expected internal rate of return on investment that the trucking fleet generates is computed, as follows. Internal Rate of Return on Investment Calculation The calculation used to estimate this internal rate of return is to evaluate the equivalent interest earned from a cash flow series as follows: Beginning of time period: A negative cash flow equal to monies spent for equipment purchase Each time period (year): A positive cash flow equal to margin earned plus depreciation and interest on equipment purchase
End of time period: A positive cash flow equal to monies realized as salvage on equipment disposal.
The resulting calculation is a computation of the “cash flows” (since depreciation accrual is a “non cash item” in any given year) associated with the investment and is independent of borrowed money -- hence representing a measure of the “internal rate of return” for investing money in the trucking asset. A reader might be tempted to look at the calculated “rates of return” in this report and feel that these rates are quite high. It must be remembered, however, that the “rate of return” that is appropriate for an investment of capital also reflects the “risk factor” in owning the asset. Trucking has been historically viewed as a higher risk investment than owning shares in enterprises such as “utilities” or “bonds” -- reflecting what is usually a very competitive market situation in the trucking industry. As a result, the rates of return displayed by the model are generally appropriate for investment in trucking as viewed by the financial community. It is also appropriate to consider the specialization or competitive factors that apply to given trucking markets (availability of capital). Many non specialized sectors (e.g. Flatdeck hauling, Agricultural trucking) may provide a lower rate of return on investment than more specialized trucking equipment due to the low degree of specialization of the investment in trailer equipment and competitive factors associated with having many suppliers of these services. On the other hand, very specialized trucking services that involve expensive (single purpose) equipment (e.g. A trailer for compressed gases such as anhydrous ammonia or

Operating Costs of Trucking and Surface Intermodal Transportation in Canada
30
N.G.L.’s) may dictate a higher rate of return to attract capital investment in the enterprise.
2.3 Overview of Findings and Trends
Prior editions of Operating Costs of Trucks in Canada have portrayed historical cost trend data across the sum of all vehicle configurations and regions investigated. The case studies chosen by the client for the 2007 report are significantly different from prior reports which necessitated a re-creation / significant changes to the Excel spreadsheets with the result that previously programmed trending / graphing evaluations are no longer supported due to:
changed equipment configurations being investigated
elimination of the US regional analyses
replacement of the generic international corridors with specific "city pairs" At the suggestion of the client, unit cost results from prior studies for some sample vehicle configurations were "cut and paste" into a new spreadsheet, with this year's results, to enable some trend comparisons of unit trucking costs to be developed and displayed. Exhibit 2.8 illustrates these trends for 7 tractor-trailer configurations where such unit cost comparisons are possible.
Exhibit 2.8: Unit Tractor-trailer Cost Comparisons Over Time
Average Unit Costs (Median Utilization, 5% Profit) By Year
130
180
230
1999 2001 2003 2005 2007
Year
Ce
nts
/KM
5 Axle Semi Unit (Van) 5 Axle Semi Unit (Flat Deck) 5 Axle Bulk Liquid Tanker
6 Axle (Triaxle) Semi Unit (Van) 6 Axle (Triaxle) Semi Unit (Flat Deck) 8 Axle Super B Train Unit (Flat Deck)
8 Axle Super B Bulk Liquid Tanker
Operating Costs of Trucking and Surface Intermodal Transportation in Canada
31
When examining these cost trends since the last edition of Operating Costs of Trucks in Canada, across the seven vehicle configurations, the 2005 through 2007 increase in unit trucking costs in Canada appears to be an increase of 7.6% over the two years, or approximately 3.7% compounded annually. This rate is significantly higher than the two year increase in Canada's consumer price index, which rose a total of 4.2% over the same two years (or equivalent to 2.1% compounded). The reason for unit trucking costs increasing significantly faster than inflation in the general economy is no doubt related to escalation in fuel prices in this timeframe as well as apparent upward adjustments to driver wages (especially in the resource sectors / western Canada) in response to the generally recognized shortage of drivers. Appendix A provides a summary of base case analysis results while Appendix B provides truck haul container chassis costs for specified domestic and international corridors. Detailed case study costing component results are submitted separately to the client in an Excel file.
2.4 Comments about Reliability of the Unit Costing Method
As noted previously, Operating Costs of Trucks in Canada is not a "statistical survey", but rather the application of an activity based unit cost model using information from expert opinion developed as an ongoing "database" supplemented by consultations with industry, suppliers to the industry, etc. The motor carrier sector is a very diverse segment of the economy. This is one of the factors that has historically impeded the development of statistical models and is especially one that impedes the use of "statistical averages" for accurately estimating trucking costs in specific situations. From the Central Limit Theorem, where σ (sigma) represents the statistical variance, in situations where the variance (σ) is quite large, a precise estimation of the mean value for an underlying process requires very large statistical sampling to be undertaken. In the face of these difficulties and with the relatively small published statistical sampling of Canada's motor carrier industries, the cost modelling approach used in the Operating Costs of Trucks in Canada methodology -- is essentially that of applying an "expert system" for estimating total vehicle costs per kilometre. Accurate Determination of Truck Costs: Rate Making In considering the question of "accuracy" of our estimates, we look to the most precise determination of fleet costs -- that which is undertaken by firms when they are setting prices to bid for their services -- the rate making process.

Operating Costs of Trucking and Surface Intermodal Transportation in Canada
32
As stated previously, the methodology laid out for this project is an enumerative process that relates costs to unit component costs (e.g. wage rates per hour, fuel prices per litre, repair costs per vehicle km operated, etc.) The unit costs, estimated separately, are then "summed up" to derive a total cost which can be expressed as a vehicle operating cost per kilometre…for a specific situation. If we were a trucking company using a model similar to the one developed for this project to forecast the operating costs for a particular haul that we were bidding on -- we would require the accuracy of our cost forecast to be very precise. Given the low profit margins of the industry, and the competitiveness of the bidding process, one would expect that our over-all cost estimate -- for some new business -- will need to be accurate ± less than one percent. If we significantly over estimate the costs, our price will be too high and the business will be awarded to another bidder. If we under estimate the costs, the business will be awarded to us -- but will likely be unprofitable for us. In this type of application of our methodology, of course, our firm would have the luxury of exact knowledge (a 100% sample, statistically) of our immediate prior unit cost structure. We would know current and immediate future wage levels of our drivers; we would have an exact recent fuel cost structure, etc. We would also have an exact specification for the haul in question -- providing such information as trip distance, trip cycle time, specific road speeds, etc. At the same time, our firm would generally need to be "in synch" with the best practices of the industry as a whole -- otherwise our cost components might all be "too high", and we would not be awarded business -- using our cost estimates. This being said, we know from experience that different truck operators pay different amounts for fuel. Different truck operators have different wage structures. Different truck operators have different purchase arrangements with different suppliers. Some of the foregoing factors favour larger fleets, who perhaps command larger discounts from suppliers with whom they book larger amounts of business. Other cost factors (such as wages paid to drivers, or administrative costs) can be lower for smaller businesses. For these components, the variability (σ) is very large (commonly, variations can be found that are ± 10 or 20 percent, when looking at the individual components). The evidence that both types of trucking business tend to have a similar "bottom line cost structure" is provided by the marketplace. Frequently, larger firms as well as a large number of smaller fleet businesses are found coexisting within the

Operating Costs of Trucking and Surface Intermodal Transportation in Canada
33
same marketplace. That is to say, on similar routes, hauling similar products, etc. -- we find both large and small fleet operators. Less Accurate Estimating of Truck Costs: Benchmarking Moving one step away from the more exacting needs associated with "rate making", very often firms need to benchmark their practices against one another -- or against what would be considered "best practices" for the sector as a whole. For this type of determination, over-all costs can be estimated within somewhat greater tolerances, perhaps ± 5 percent. These kinds of cost determination can be useful for assessing questions such as:
Should our company operate (or cease to operate) a private fleet?
What transportation rates are we likely to be able to negotiate, if our company put this hauling out for bid?
What would be the trucking costs to use for assessing investment grade feasibility of a new project (that trucking companies may be inclined not to waste much time at bidding -- since the hauling is only a hypothetical piece of business)?
For these types of exercises, the principal of Logistics Solution Builders Inc. has applied the methodology used in this present study, for over twenty years. Essentially, the model and the data sources used and described for each of the cost components, is the same quality of information that we have provided with this model. The process provided is not a statistically based model, but it is an "expert system" that uses reasonable average information -- determined from discussions with industry experts, consultation with suppliers to the industry, etc. These information are maintained in an ongoing live database of information that is augmented periodically with new experience -- from actual hauling applications, as they are evaluated and information gathered. As noted elsewhere in the report, we consulted specific industry operators and suppliers, to update our prior 2005 database for that edition of the Operating Costs of Trucks in Canada report, a document that has been widely circulated -- used, and scrutinized by industry, for many years. Over-all, and this is not a statistically tested value, such as a mathematically derived "confidence interval", but reflects in the author's experience with actual hauling applications, the benchmarking estimates developed from the system and provided in this report should easily answer the need for the client to estimate total trucking costs on a cents per kilometre basis, for each of the vehicle populations in the sample, to within

Operating Costs of Trucking and Surface Intermodal Transportation in Canada
34
± 5 per cent.
The above figure, which is the author's conservative opinion of the reliability of the estimates developed using this methodology, means that if our model estimates unit costs of $1.66 per kilometre for a specific configuration of vehicle….that it is safe to expect that unit operating costs over-all are likely to be between ± 5 % of this value, or between ± 8 cents per kilometre. Drilling Down to Individual Cost Components Operating Costs of Trucks In Canada is a model built for the purpose of answering the need to estimate vehicle costs per kilometre, over-all, for various types of vehicles operated in Canada and on selected origin-destination city corridors (including some international corridors). It is not represented as a tool for doing detailed unit cost component analysis. The component sub estimates (such as driver costs, or fuel costs, for example) are interesting and useful by-products, of the over-all methodology…but should probably be treated with an understanding that they may have a wider tolerance for variation within them, than are the estimates derived using the over-all model. As already described in context of "firm size", the author's experience is that some unit costs tend to be lower for smaller firms (such as wages, and very simplified administrative structures) … but these are often offset due to scale economies in purchasing fuels, tires, consumables and equipment by the larger firms. As a result of these types of factor -- when one disaggregates to a specific cost component, larger variations between companies occur than when looking at over-all costs totalled. Because of the types of variations noted, and known by the author to be present within the trucking industry, specific unit cost components derived from an expert opinion sampling, versus an over-all industry survey, are likely to be accurate only ± 15 to 20 per cent -- if compared to a specific hauling application. These are the calibre of information used within our model's look-ups, because the over-all sampling size is necessarily small -- when consulting such experts. This is to say, for example, that if our model data "look up" quotes a unit maintenance cost of 27.8 cents per kilometre for tires and repairs, that a specific operator of similarly configured equipment may easily have a unit cost structure, for that same grouped component, that is ± 6 cents per kilometre in comparison to the lookup value noted. Again, some of the component variation may be accounted for by different purchasing and life cycle strategies. In the author's fleet consulting and costing
Operating Costs of Trucking and Surface Intermodal Transportation in Canada
35
experience, we have encountered situations where operator A purchases a "sturdier" component or vehicle and may have a lower maintenance cost than operator B, but this is traded off with a higher capital cost. Also, some significant differences in maintenance costs are known to occur between fleet operators based on the driver skills, and management thereof -- that can vary between fleets. Of course, when we are considering the use of the model to estimate the average maintenance costs across the entire trucking industry that uses those types of vehicles -- one would expect, from the central limit theorem of statistics -- that the mean average maintenance cost should lie within a closer tolerance than the 6 cent value reported above. Essentially we are saying that if 2σ (the 95 percent confidence limit on the maintenance costs for an individual firm) is roughly 6 cents per kilometre, then our "expert estimate" for the mean value of the industry as a whole, will be much closer -- perhaps ±2 cents per km, if we are only estimating the average value for the over all industry. (Though no one has measured this hypothetical average value -- or we would have gladly used this for our "look up" table). Because no one has specifically done surveys for each of the cost items in question, predicting the accuracy of each cost item in our model, as an estimate of the mean value, cannot be stated mathematically using an exact statistical confidence interval. Estimated Error: Concluding Remarks This being said, even if wider variations are present within individual model cost sub-components, the over-all purpose for which this model is intended, understanding the costs for motor carriage using various configurations of vehicle in Canada's regions, and on specific corridors, should be well served using the model results presented herein. For benchmarking purposes, that no doubt do not require accuracy any higher than ±5 percent over all, our approach has been mapped back to industry numbers with excellent results.
Operating Costs of Trucking and Surface Intermodal Transportation in Canada
36
3.0 Effects of Fleet size
The unit cost sampling in the study for Operating Costs of Trucks in Canada does not permit easy determination of how fleet size impacts operating costs. Generally, the trucking firms being interviewed, and even the suppliers, are hesitant to discuss practices that have commercial importance to them -- especially when realizing that the information will be published in government study that is freely distributed. Beyond this commercial reluctance, there is the question of "respondent burden" in that we are -- for example -- now asking a supplier to disclose not only their "average discounted price", but also how the discount may vary with firm size, hence requiring them to search and disclose more information -- provided without charge to the consultant -- in response to our information requests. In the consultant’s experience, however, where large and small fleets have been reviewed, it is very common to have both types of firm working in the same hauling marketplace for the same transportation rate(s). How is this possible? Cost Advantages for Larger Firms Very large fleets (with say 500 + vehicles) tend to enjoy the advantages that come with high volume purchases of vehicles and all consumables such as fuels, tires, spare parts, etc. In comparing the unit costs for such firms, where the author has been able to see what unit prices are paid, it is common to see cost savings in the order of 10%, when compared to the unit cost levels used in this report. The owner operator cost survey results, when unit costs for tractor operation only (excluding all administration, profit and driver costs) are compared to our fleet cost estimates, bears this out with the Opcosts model showing cost savings for fleets compared to owner operators when only looking at these line items. (see Section 5) Cost Advantages for Smaller Firms Smaller family firms (with less than 5 or 10 vehicles) tend to enjoy cost advantages that stem from paying lower wages and benefits (often 10 to 15%
Operating Costs of Trucking and Surface Intermodal Transportation in Canada
37
lower than the wage levels used in this report) than larger firms3 that attract union interest (even if the larger firms are not unionized, they will pay higher wages in order to stay "not unionized"). Note again that our owner operator survey reported lower driver wage costs than company trucks (again see Section 5). Smaller firms will tend to spend up to 30% less for "administration" -- largely because the span of control is smaller -- the owner / principal can more readily manage and control the business by "daily walking around", and "visiting with all staff including the drivers", etc. For larger businesses, auditing and financial control packages are required as well as sophisticated communications systems and networks to co-ordinate the work of geographically dispersed branch operations. Generally, the relative advantages for each firm size tend to cancel each other out, in our experience. The author was formerly the manager of a consulting business unit owned by a large fleet business -- giving a unique opportunity to view actual financial information of that business, on a confidential basis. At the same time, the consulting practice was often involved with smaller trucking businesses, and owner operators -- sometimes with unit cost information collected under subpoena, if the firm was involved in litigation (e.g. a loss of income determination for the business). This unique access to actual information for both size of firm reinforces the opinion expressed above.
3 Canada’s Driving Force published by the Canadian Trucking Human Resources Council shows
larger firms are more likely to pay fringe benefits such as insurance policies, paid time for training, medical/dental and pension plan contributions.

Operating Costs of Trucking and Surface Intermodal Transportation in Canada
38
4.0 Private vs. for-hire fleets
The trucking industry consists of two main sectors: the for-hire sector which has historically been defined as consisting of those companies that haul freight owned by others, for compensation, and the private sector consisting of those companies who primarily haul their own freight, but may, from time to time, haul other people’s goods for compensation. In dollar terms, the two sectors are nearly the same size. However, there are some major differences in their make-up as well as some interesting similarities. Private trucking is dominated by a large number of small fleets operating in and around urban areas, where it holds an 85% market share. The majority of fleets operating in this area consist of 1 or 2 vehicles and are typically straight trucks. As haul distance increases, this market share drops. Its market share is about 50% at trip distances of 200 km; decreasing to 10% at distances of 2000 km and greater. Truck size increases as trip distances increase to take advantage of the economics of the larger vehicles over these haul distances4. Companies transport their own products for a number of reasons. Some companies move products such as industrial gases that require specialized handling techniques that the company wishes to keep tight control over for safety and liability reasons. Other companies wish to maintain control over the fleets to ensure vehicles are available when as required. With deregulation, the differences between private and for-hire trucking have become less defined over the past several years. For example, private fleets can haul products for compensation allowing them to find backhaul where they previously did not have any. Private fleets are now more likely to contract out some specific freight movements where the for-hire sector can do the movement more efficiently due to better load balancing opportunities (personal communication with the Private Motor Truck Council of Canada). Many private fleets have to continually prove they are cost-competitive with for-hire trucking. For example, the annual Private Motor Truck Council of Canada top issues survey indicates this to be a rapidly increasing top issue with private fleets. The three cost main cost variables that could result in a cost differential between private and for-hire fleets are vehicle utilization (annual kilometres driven), driver wages and fuel. Each of these was examined as follows. Information available from the NRCan 2000 Fuel Economy Benchmarking Survey indicates that the utilization of both private and for-hire fleets varies considerably depending upon the application. However, similar vehicles operated in similar circumstances have similar fuel consumption rates.
4 Profile of Private Trucking. Private Motor Truck Council of Canada. January 1998.

Operating Costs of Trucking and Surface Intermodal Transportation in Canada
39
One example noted was fuel haulers who tend to use their vehicles with two shifts a day, sometimes seven days a week resulting in annual utilization rates around 250,000 km whether private or for-hire. Single driver intercity van fleet utilization rates typically vary between 95,000 and 180,000 km whether private or for-hire. Vehicles used for single shift weekday delivery locally or regionally typically have a utilization rate in the range of 40,000 to 80,000 km a year whether private or for-hire. These data indicate there are not any systematic differences in utilization rates between private and for-hire fleets. Rather, differences are application specific. Confidential data available to the consultants also indicates that wage rates paid are similar for both sectors for similar operations, although there is a widely held perception that private fleets pay higher wage rates. Similarly, these confidential data indicated fuel consumption rates are similar. Overall, it is the consultant’s assessment that there are not any systematic differences in costs between private and for-hire fleets when operating under the same conditions.
Operating Costs of Trucking and Surface Intermodal Transportation in Canada
40
5.0 Owner-Operator Cost Survey
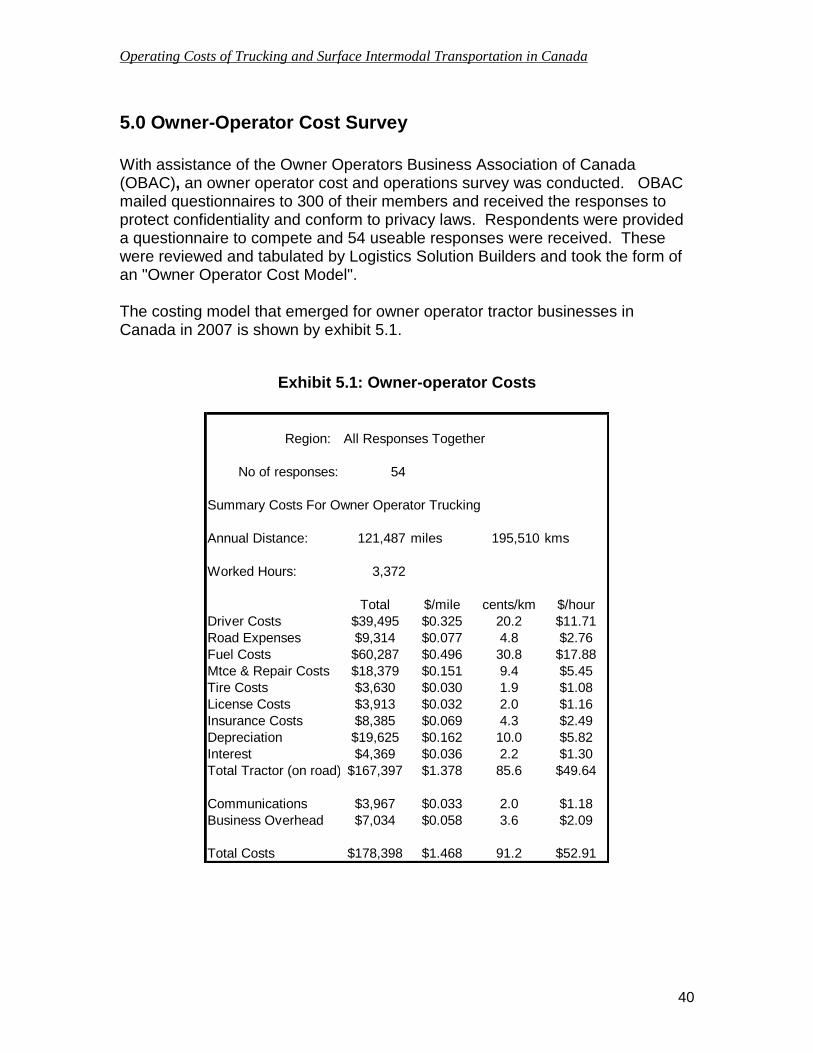
With assistance of the Owner Operators Business Association of Canada (OBAC), an owner operator cost and operations survey was conducted. OBAC mailed questionnaires to 300 of their members and received the responses to protect confidentiality and conform to privacy laws. Respondents were provided a questionnaire to compete and 54 useable responses were received. These were reviewed and tabulated by Logistics Solution Builders and took the form of an "Owner Operator Cost Model". The costing model that emerged for owner operator tractor businesses in Canada in 2007 is shown by exhibit 5.1.
Exhibit 5.1: Owner-operator Costs
Region: All Responses Together
No of responses: 54
Summary Costs For Owner Operator Trucking
Annual Distance: 121,487 miles 195,510 kms
Worked Hours: 3,372
Total $/mile cents/km $/hour
Driver Costs $39,495 $0.325 20.2 $11.71
Road Expenses $9,314 $0.077 4.8 $2.76
Fuel Costs $60,287 $0.496 30.8 $17.88
Mtce & Repair Costs $18,379 $0.151 9.4 $5.45
Tire Costs $3,630 $0.030 1.9 $1.08
License Costs $3,913 $0.032 2.0 $1.16
Insurance Costs $8,385 $0.069 4.3 $2.49
Depreciation $19,625 $0.162 10.0 $5.82
Interest $4,369 $0.036 2.2 $1.30
Total Tractor (on road) $167,397 $1.378 85.6 $49.64
Communications $3,967 $0.033 2.0 $1.18
Business Overhead $7,034 $0.058 3.6 $2.09
Total Costs $178,398 $1.468 91.2 $52.91

Operating Costs of Trucking and Surface Intermodal Transportation in Canada
41
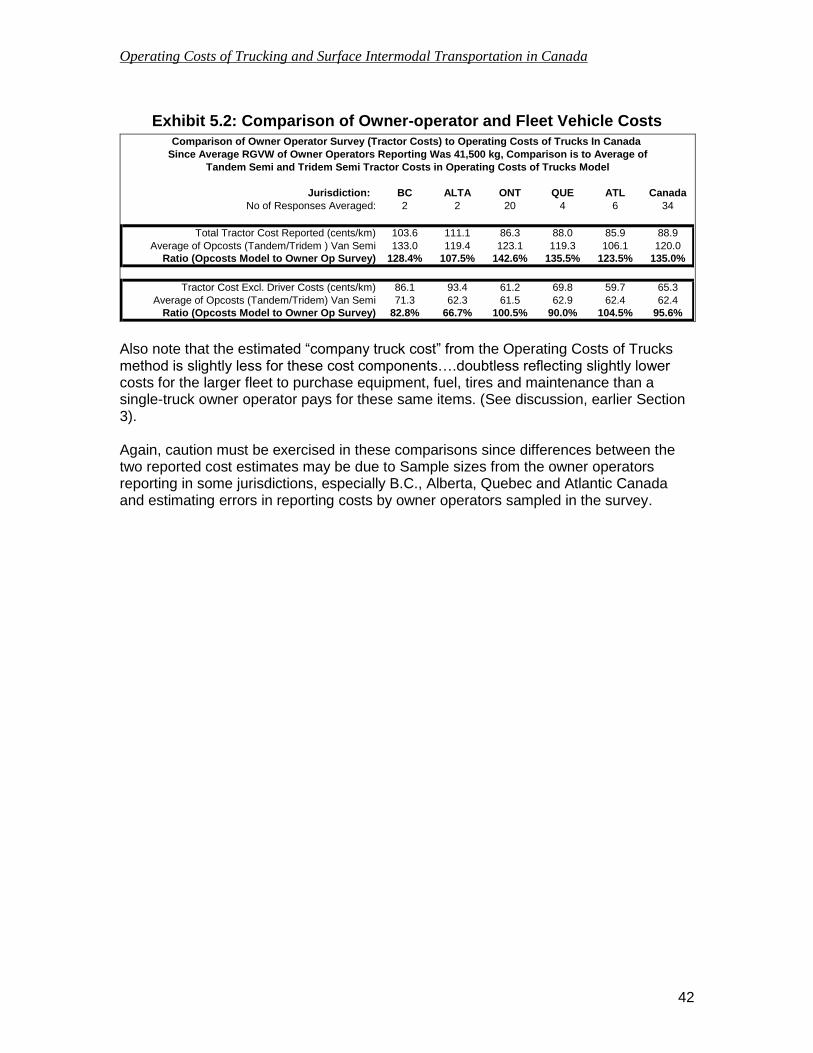
In one of the survey questions, operators were asked to estimate the percentage of miles operated in each provincial jurisdiction or the USA and this question was used by the consultant to develop some "regional cost estimates" based on owner operators that reported a significant proportion of their mileage operated within any specific jurisdiction. For provinces of Saskatchewan, Manitoba, individual Atlantic Canada provinces as well as the Yukon, Northwest Territories and Nunavut, operated mileage reported was insignificant. Alberta and British Columbia each had 2 operators with significant mileage, with most of the surveyed firms reporting mileage in Ontario, Quebec and the U.S.A. Detailed summaries of these unit cost evaluations are provided in Appendix C. An interesting situation does emerge when we compare owner operator reported costs from our survey to the modelled costs for tractor operation (including no administrative costs) in our Operating Costs of Trucks in Canada model. Exhibit 5.2 shows two comparisons:
The first comparison emerges based on what was reported for tractor costs in the owner operator survey when "wages" and "road costs" (both components of driver costs) are included and compared to "total tractor costs" from the Operating Costs of Trucks in Canada. Generally, the "tractor costs" estimated using our model come out significantly higher than reported in the owner operator survey. This is explainable when we note that driver costs reported in the owner operator survey tended to only be 17 to 27 cents per kilometre.
The second comparison emerges when we "back out" what was reported for driver costs in the owner operator survey and the driver component from "Operating Costs of Trucks in Canada". In this instance, there is better agreement between the two estimates of tractor operating cost (a 2.9 cent per kilometre difference between 62.4 and 65.3 cents per km) for a lower cost of 4.6% for fleet operators.
Operating Costs of Trucking and Surface Intermodal Transportation in Canada
42
Exhibit 5.2: Comparison of Owner-operator and Fleet Vehicle Costs
Comparison of Owner Operator Survey (Tractor Costs) to Operating Costs of Trucks In Canada
Since Average RGVW of Owner Operators Reporting Was 41,500 kg, Comparison is to Average of
Tandem Semi and Tridem Semi Tractor Costs in Operating Costs of Trucks Model
Jurisdiction: BC ALTA ONT QUE ATL Canada
No of Responses Averaged: 2 2 20 4 6 34
Total Tractor Cost Reported (cents/km) 103.6 111.1 86.3 88.0 85.9 88.9
Average of Opcosts (Tandem/Tridem ) Van Semi 133.0 119.4 123.1 119.3 106.1 120.0
Ratio (Opcosts Model to Owner Op Survey) 128.4% 107.5% 142.6% 135.5% 123.5% 135.0%
Tractor Cost Excl. Driver Costs (cents/km) 86.1 93.4 61.2 69.8 59.7 65.3
Average of Opcosts (Tandem/Tridem) Van Semi 71.3 62.3 61.5 62.9 62.4 62.4
Ratio (Opcosts Model to Owner Op Survey) 82.8% 66.7% 100.5% 90.0% 104.5% 95.6% Also note that the estimated “company truck cost” from the Operating Costs of Trucks method is slightly less for these cost components….doubtless reflecting slightly lower costs for the larger fleet to purchase equipment, fuel, tires and maintenance than a single-truck owner operator pays for these same items. (See discussion, earlier Section 3). Again, caution must be exercised in these comparisons since differences between the two reported cost estimates may be due to Sample sizes from the owner operators reporting in some jurisdictions, especially B.C., Alberta, Quebec and Atlantic Canada and estimating errors in reporting costs by owner operators sampled in the survey.

Operating Costs of Trucking and Surface Intermodal Transportation in Canada
43
6.0 Rail
6.1 Rail Rates
CN and CP were approached for rate quotes and provided the rates set out below for the routes they operate. All of the rates provided were for ramp-to-ramp service (loading onto a rail car, rail line haul and unloading from a rail car). In addition, both carriers publish terminal charges for a range of services such as storage beyond the normal free time allowed, and electrical hook-ups for containers with cooling or heating units which may apply depending upon the circumstances relating to the movement or non-movement of containers. It should be noted that CP no longer offers conventional trailer-on-flatcar service but does handle trailers on its Expressway service between Montreal and Toronto. As expected, we were advised that confidential rates are somewhat lower than the non-confidential rates but the railways did not provide any indication of how much lower. With intermodal generally considered to be a high-volume but low mark-up activity, it is possible that the reductions contained in confidential contracts are smaller than for some carload products but other (potentially mutually beneficial) arrangements may be included in the total confidential pricing package. For example, the need to return empty marine containers to a port can be alleviated if a domestic cargo can be obtained in the return direction. To accomplish this, the railway needs the concurrence of the owning steamship line and compliance with CBSA rules. There is also a benefit for the steamship line since the container would be returned by the railway without charge to the steamship line. Such a movement benefits both the railway and the steamship company. Any reductions in confidential rates are probably predicated either on competition from another railway, another gateway, or by the level of truck competition faced in the particular corridor. Short haul movements such as Montreal-Toronto would of necessity be truck competitive while rail would have a price advantage for longer hauls. If just-in-time service is a factor the advantage would swing back towards truck even if the cost of using truck is higher than for rail. Exhibits 6.1 and 6.2 show the rates obtained from each railway for the routes noted.

Operating Costs of Trucking and Surface Intermodal Transportation in Canada
44
Exhibit 6.1: Intermodal Rates for Selected Corridors CN Rail
CANADIAN NATIONAL INTERMODAL (FAK) RATES (RAMP TO RAMP SERVICE ONLY)
MARKET FROM TO OPEN
TARIFF PLAN EQUIP. 48’- 53'
Dist. (mi.) $Exch.
DOMESTIC CALGARY VANCOUVER 7290 25 CNRU $1,185 995 CAD
DOMESTIC MONCTON MONTREAL 7290 25 CNRU 557 655 CAD
DOMESTIC MONTREAL MONCTON 7290 25 CNRU 985 655 CAD
DOMESTIC MONTREAL TORONTO 7290 25 CNRU 583 340 CAD
DOMESTIC TORONTO WINNIPEG 7290 25 CNRU 1,814 1,240 CAD
DOMESTIC VANCOUVER TORONTO 7290 25 CNRU 2,310 2,767 CAD
MARKET FROM TO TARIFF PLAN EQUIP. 48' –
53' Dist. (mi.) $Exch.
TRANSBORDER TORONTO CHICAGO 8383 25 CNRU $451 513 USD
TRANSBORDER TORONTO DETROIT 8383 25 CNRU 599 245 USD
TRANSBORDER TORONTO MEMPHIS 8383 25 CNRU 875 990 USD
MARKET FROM TO TARIFF PLAN EQUIP. 20' 40' Dist. (mi.) $Exch.
OSM CALGARY VANCOUVER 7589 85 IMPEX 764 $871 990 CAD
OSM HALIFAX CHICAGO 7589 85 IMPEX 908 1,009 1,672 USD
OSM HALIFAX TORONTO 7589 85 IMPEX 971 1,100 1,186 CAD
OSM MONTREAL TORONTO 7589 85 IMPEX 626 717 350 CAD
OSM VANCOUVER TORONTO 7589 85 IMPEX 1,932 2,169 2,767 CAD
Notes on CN Tables
FAK indicates Freight All Kinds - general freight not commodity specific OSM indicates overseas markets – the import or export of goods. All movements in steamship company
owned ISO containers (20 foot or 40 foot).
All domestic and transborder rates for movement in railway owned containers.
Terminal service charge included in OSM traffic rates where applicable. CN rates are exclusive of fuel surcharge in Tariff 7401. Surcharge rate of 15.30% in December 2007 and
17.37% in January 2008 applied in $1 increments.. Rates include lifting (to and from chassis) at origin and destination terminals. Lifting, movement for
storage and storage at terminals may be subject to additional charges depending on circumstances and agreement with shipper.
Rates quoted above are for the movement of loaded containers and may vary by direction. Rates do not include pick up and delivery (dray or highway service) Distances are approximate.

Operating Costs of Trucking and Surface Intermodal Transportation in Canada
45
Exhibit 6.2: Intermodal Rates for Selected Corridors CP Rail
CANADIAN PACIFIC INTERMODAL (FAK) RATES
(RAMP TO RAMP SERVICE ONLY)
MARKET FROM TO OPEN
TARIFF Dist. (mi.) EQUIPMENT 53' $Exch.
DOMESTIC CALGARY VANCOUVER 629 CP $1,023 CAD
DOMESTIC MONTREAL TORONTO 345 Shipper/trucker 380 CAD
DOMESTIC TORONTO WINNIPEG 1,211 CP
1,719 CAD
DOMESTIC VANCOUVER TORONTO 2,534 CP
2,211 CAD
MARKET FROM TO TARIFF Dist. (mi.) EQUIPMENT 53' $Exch.
TRANSBORDER TORONTO CHICAGO 530 EMP5 $433 USD
MARKET FROM TO TARIFF Dist. (mi.) EQUIPMENT 20' 40' $Exch.
OSM CALGARY VANCOUVER CPRS 7589 648 IMPEX $645 $716 CAD
OSM MONTREAL TORONTO CPRS 7589 355 IMPEX 544 705 CAD
OSM VANCOUVER TORONTO CPRS 7589 2,554 IMPEX 1842 2,110 CAD
Notes on CP Tables
FAK indicates Freight All Kinds - general freight not commodity specific CP informed us that it does not provide intermodal service between Toronto and Detroit. OSM indicates overseas markets the import or export of goods in third-party owned ocean containers (20 foot or 40
foot).
OSM rates are exclusive of a terminal service charge at the inland point.
Rates quoted above are for the movement of loaded containers and may vary by direction. All domestic rates were quoted in railway owned containers. CP quoted transborder rates in EPM equipment for
which there is a daily charge of about $17 (presumably $US) not included in the rates. CP’s Montreal – Toronto domestic rates are for CP Expressway trailer service hauling customer supplied trailers
and are NOT published. CP rates quoted above are exclusive of fuel surcharge which CP quoted at 27.2% in December 2007 (Tariff CPRS
9000). The January fuel surcharge is 30.8%. Rates include lifting (to and from chassis) at origin and destination terminals. Lifting, movement for storage and
storage at terminals may be subject to additional charges depending on circumstances and agreement with shipper. Rates do not include pick up and delivery (dray or highway service). Distances are approximate.
5 EMP refers to “Equipment Management Program”, a program for the interline movement of
containers specifically allocated to the program. Participating railways include the Norfolk Southern, Union Pacific, Kansas City Southern and Canadian Pacific. There is a daily customer charge of about US$17 for the use of an EMP container.
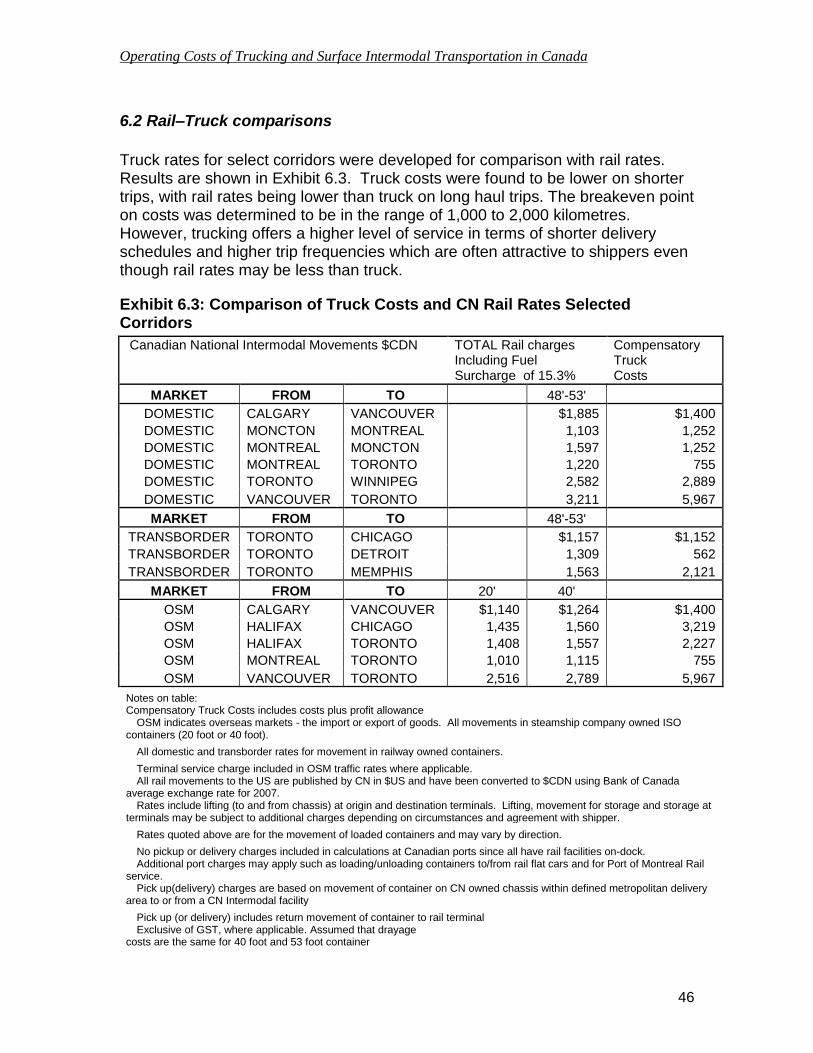
Operating Costs of Trucking and Surface Intermodal Transportation in Canada
46
6.2 Rail–Truck comparisons
Truck rates for select corridors were developed for comparison with rail rates. Results are shown in Exhibit 6.3. Truck costs were found to be lower on shorter trips, with rail rates being lower than truck on long haul trips. The breakeven point on costs was determined to be in the range of 1,000 to 2,000 kilometres. However, trucking offers a higher level of service in terms of shorter delivery schedules and higher trip frequencies which are often attractive to shippers even though rail rates may be less than truck.
Exhibit 6.3: Comparison of Truck Costs and CN Rail Rates Selected Corridors
Canadian National Intermodal Movements $CDN
TOTAL Rail charges Including Fuel Surcharge of 15.3%
Compensatory Truck Costs
MARKET FROM TO 48'-53'
DOMESTIC CALGARY VANCOUVER $1,885 $1,400
DOMESTIC MONCTON MONTREAL 1,103 1,252
DOMESTIC MONTREAL MONCTON 1,597 1,252
DOMESTIC MONTREAL TORONTO 1,220 755
DOMESTIC TORONTO WINNIPEG 2,582 2,889
DOMESTIC VANCOUVER TORONTO 3,211 5,967
MARKET FROM TO 48'-53'
TRANSBORDER TORONTO CHICAGO $1,157 $1,152
TRANSBORDER TORONTO DETROIT 1,309 562
TRANSBORDER TORONTO MEMPHIS 1,563 2,121
MARKET FROM TO 20' 40'
OSM CALGARY VANCOUVER $1,140 $1,264 $1,400
OSM HALIFAX CHICAGO 1,435 1,560 3,219
OSM HALIFAX TORONTO 1,408 1,557 2,227
OSM MONTREAL TORONTO 1,010 1,115 755
OSM VANCOUVER TORONTO 2,516 2,789 5,967
Notes on table: Compensatory Truck Costs includes costs plus profit allowance
OSM indicates overseas markets - the import or export of goods. All movements in steamship company owned ISO containers (20 foot or 40 foot).
All domestic and transborder rates for movement in railway owned containers.
Terminal service charge included in OSM traffic rates where applicable. All rail movements to the US are published by CN in $US and have been converted to $CDN using Bank of Canada
average exchange rate for 2007. Rates include lifting (to and from chassis) at origin and destination terminals. Lifting, movement for storage and storage at
terminals may be subject to additional charges depending on circumstances and agreement with shipper.
Rates quoted above are for the movement of loaded containers and may vary by direction.
No pickup or delivery charges included in calculations at Canadian ports since all have rail facilities on-dock. Additional port charges may apply such as loading/unloading containers to/from rail flat cars and for Port of Montreal Rail
service. Pick up(delivery) charges are based on movement of container on CN owned chassis within defined metropolitan delivery
area to or from a CN Intermodal facility
Pick up (or delivery) includes return movement of container to rail terminal Exclusive of GST, where applicable. Assumed that drayage
costs are the same for 40 foot and 53 foot container
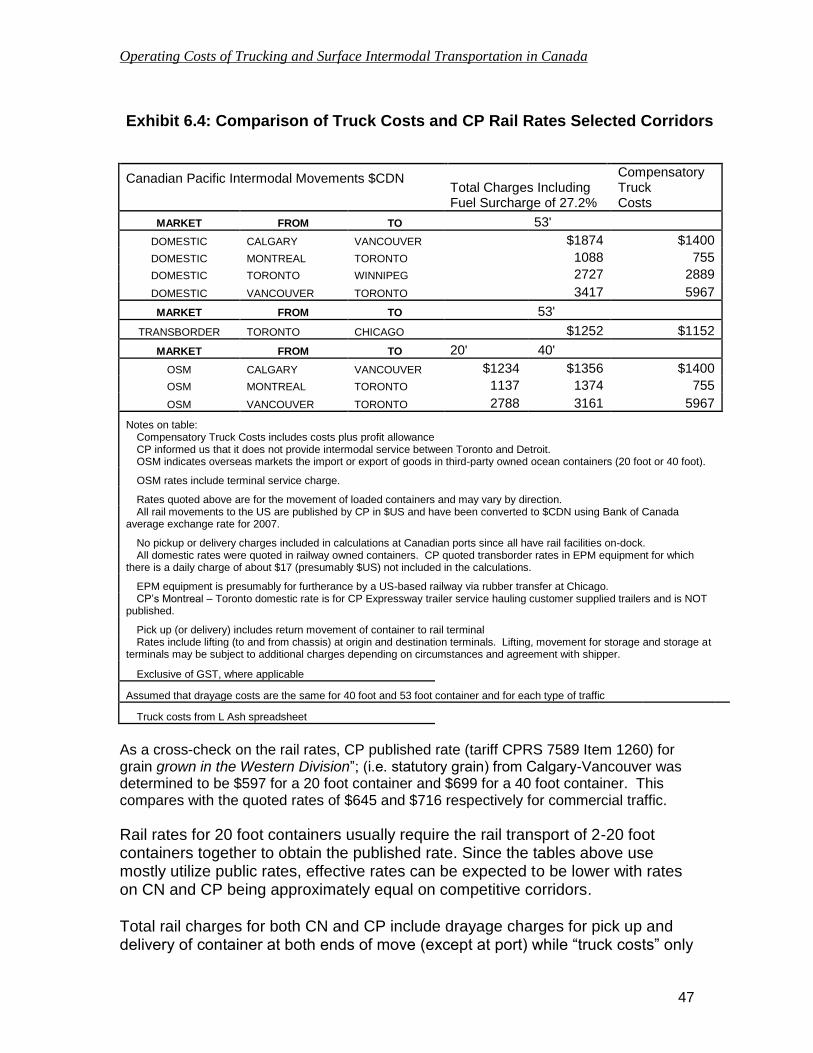
Operating Costs of Trucking and Surface Intermodal Transportation in Canada
47
Exhibit 6.4: Comparison of Truck Costs and CP Rail Rates Selected Corridors
Canadian Pacific Intermodal Movements $CDN
Total Charges Including Fuel Surcharge of 27.2%
Compensatory Truck Costs
MARKET FROM TO 53'
DOMESTIC CALGARY VANCOUVER $1874 $1400
DOMESTIC MONTREAL TORONTO 1088 755
DOMESTIC TORONTO WINNIPEG 2727 2889
DOMESTIC VANCOUVER TORONTO 3417 5967
MARKET FROM TO 53'
TRANSBORDER TORONTO CHICAGO $1252 $1152
MARKET FROM TO 20' 40'
OSM CALGARY VANCOUVER $1234 $1356 $1400
OSM MONTREAL TORONTO 1137 1374 755
OSM VANCOUVER TORONTO 2788 3161 5967
Notes on table: Compensatory Truck Costs includes costs plus profit allowance CP informed us that it does not provide intermodal service between Toronto and Detroit. OSM indicates overseas markets the import or export of goods in third-party owned ocean containers (20 foot or 40 foot).
OSM rates include terminal service charge.
Rates quoted above are for the movement of loaded containers and may vary by direction. All rail movements to the US are published by CP in $US and have been converted to $CDN using Bank of Canada
average exchange rate for 2007.
No pickup or delivery charges included in calculations at Canadian ports since all have rail facilities on-dock. All domestic rates were quoted in railway owned containers. CP quoted transborder rates in EPM equipment for which
there is a daily charge of about $17 (presumably $US) not included in the calculations.
EPM equipment is presumably for furtherance by a US-based railway via rubber transfer at Chicago. CP’s Montreal – Toronto domestic rate is for CP Expressway trailer service hauling customer supplied trailers and is NOT
published.
Pick up (or delivery) includes return movement of container to rail terminal Rates include lifting (to and from chassis) at origin and destination terminals. Lifting, movement for storage and storage at
terminals may be subject to additional charges depending on circumstances and agreement with shipper.
Exclusive of GST, where applicable
Assumed that drayage costs are the same for 40 foot and 53 foot container and for each type of traffic
Truck costs from L Ash spreadsheet
As a cross-check on the rail rates, CP published rate (tariff CPRS 7589 Item 1260) for grain grown in the Western Division”; (i.e. statutory grain) from Calgary-Vancouver was determined to be $597 for a 20 foot container and $699 for a 40 foot container. This compares with the quoted rates of $645 and $716 respectively for commercial traffic.
Rail rates for 20 foot containers usually require the rail transport of 2-20 foot containers together to obtain the published rate. Since the tables above use mostly utilize public rates, effective rates can be expected to be lower with rates on CN and CP being approximately equal on competitive corridors. Total rail charges for both CN and CP include drayage charges for pick up and delivery of container at both ends of move (except at port) while “truck costs” only

Operating Costs of Trucking and Surface Intermodal Transportation in Canada
48
include either pick up or delivery at each end. Drayage charges utilized in the rail analysis are based on published rates in CN tariff.

Operating Costs of Trucking and Surface Intermodal Transportation in Canada
49
7.0 Marine Movements
Marine intermodal movements on both the east and west coasts were examined and rates obtained where possible. As no intermodal movement exists for the Great Lakes we estimated the potential ferry charges based on avoidable over-the-road costs.
7.1 Halifax-Boston
A bi-weekly Halifax-Boston feeder service using containership Simone J commenced on July 2, 2007 but the service was terminated early in 2008. The service was set up to transport overseas marine containers between the Ports of Halifax and Boston. While the service was operating, we were told that the port-to-port rate on an all-in basis (including stevedoring) was $750US for a 40 foot container and $700US for a 20 foot container. We were also told that it was unlikely that a fuel surcharge was applied to the rates. While the service was not predicated on the transport of domestic North American traffic, it could have been used for such if demand arose.6 Accordingly, we have prepared the following comparison assuming the transport of goods from within the City of Halifax to within the City of Boston. Further, we have assumed local delivery charges of $200 at each end in the respective national currency which is in line with published railway pick-up and delivery charges. US dollars have been converted to Canadian dollars at the Bank of Canada’s 2007 average exchange rate.
Exhibit 7.1 Comparison of Marine Rates and Truck Costs Halifax-Boston
Marine Truck
40 ft 20ft
Halifax Pickup $200 $200
Marine Rate $806 $752
Boston Delivery $215 $215
Total $1,221 $1,167 $1,420
The comparisons above do not include any additional port related charges that may apply. They also use marine containers for the marine leg but highway transport would probably be in a 53 foot dry van. While the comparisons appear to be favourable to marine, it should be noted that most movements from Nova Scotia to Massachusetts are probably originated elsewhere than Halifax and destined for other than Boston. If the origin and destination are shifted outside
6 The handling of 53 foot domestic containers on a cellular liner might have proven to be a
challenge.

Operating Costs of Trucking and Surface Intermodal Transportation in Canada
50
the metro areas (e.g. originating at one of the three Michelin plants at Bridgewater, Waterville and Pictou County), the cost comparison would probably shift to favour truck transport. There is also the jit factor that is prevalent in the shipment of manufactured and processed goods that favours truck.
7.2 Montreal-St John’s
The Oceanex fleet of vessels can handle both containers stacked and ro-ro trailers (loaded with containers). We were quoted a rate of CDN$3,500 port to port all-in including loading and unloading for a 40 foot or 53 foot container. The rate was said to be based on truck competition – avoidable over-the-road costs. No mention was made of a fuel surcharge. The return rate from St John’s appears to be lower – Oceanex quoted a return rate plus fuel surcharge of approximately CDN $2,100 for on-dock St John’s to door in Montreal. Ferry charges North Sydney to Port aux Basques are currently:
$CDN205.50 for a vehicle over 30ft to 40 ft
$CDN270.50 for a vehicle over 40 ft to 50ft
$CDN325.00 for a vehicle over 50 ft to 60 ft
$CDN385.25 for a vehicle over 60 ft to 70 ft The ferry movement could involve the marine transport of a container on a trailer (drop trailer operation for which an additional $CDN 99.25 jockey charge applies) or a tractor trailer combination (for which the tractor driver would be charged $CDN78.50 for the crossing). For the purpose of this analysis a highway move using a 53 foot dry van with cab has been assumed with a total vehicle length of 60-70 feet. The marine move from Montreal to St John’s via Oceanex has been assumed to be a drop trailer 53 foot dry van with local drayage provided in the rate to St John’s. Accordingly, the direct truck cost would be $3,379 for the highway service plus ferry charges of $463 for a total of $3,842. We were told that regular dry van service makes considerable use of the marine option with refrigerated goods moving predominantly over-the-road.
Exhibit 7.2: Comparison of Marine Rate and Truck Costs Montreal –St Johns.
Marine Truck
Compensatory truck costs $3,379
Marine Atlantic Charges $464
Total $3,500 $3,843

Operating Costs of Trucking and Surface Intermodal Transportation in Canada
51
7.3 Sept-Iles – Trois Rivières
While there are some bulk movements along the St Lawrence River, there are not any marine containerized movements for which comparable trucking costs could be developed.
7.4 West Coast Movements
While marine interests indicated there has been interest in developing West Coast short-sea container movements competitive with rail or truck, to date none have been developed.
7.5 Cross Lake Ferry Operation Oswego-Toronto
While there have been proposals for a cross lake service one does not currently exist.
However, estimated potential ferry charges based on avoidable over-the-road costs7
were calculated. Details are provided in Appendix D. We note that this analysis is provided only as an example as actual charges could vary considerable because of prevailing market conditions.
7 Compensatory rates plus allowance for typical industry profit margin

Operating Costs of Trucking and Surface Intermodal Transportation in Canada
52
APPENDIX A
SUMMARY OF BASE CASE TRUCK COST ANALYSIS RESULTS
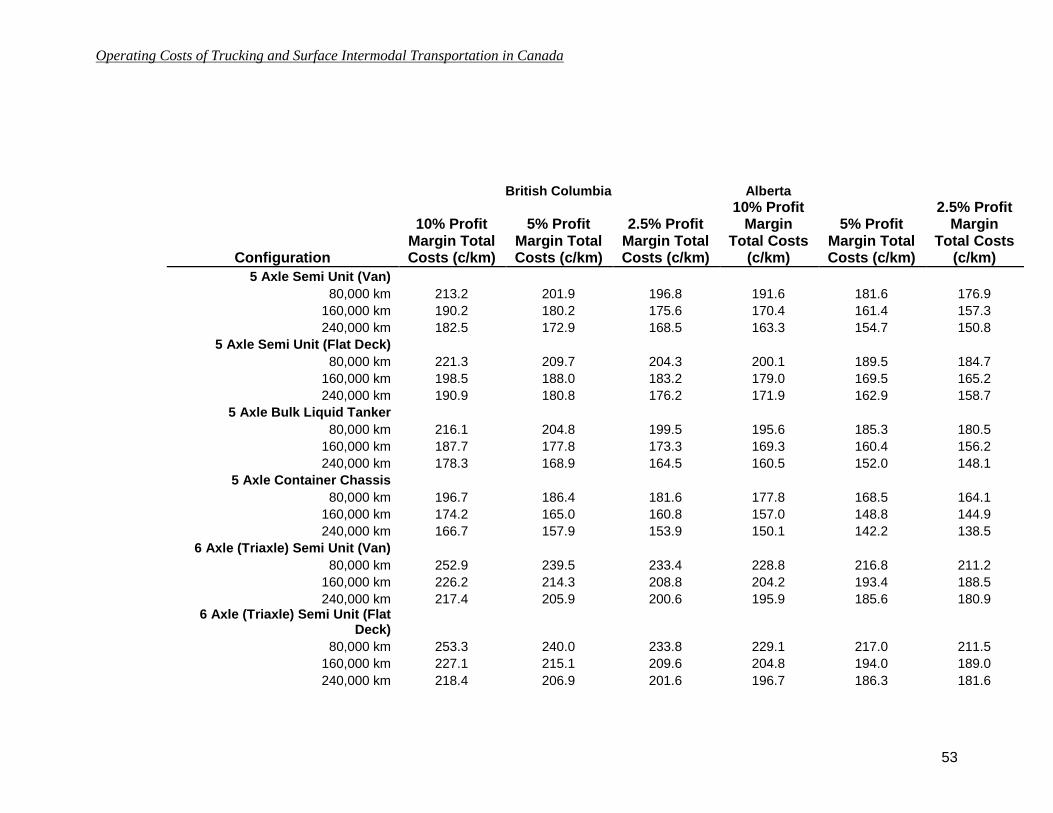
Operating Costs of Trucking and Surface Intermodal Transportation in Canada
53
British Columbia Alberta
Configuration
10% Profit Margin Total Costs (c/km)
5% Profit Margin Total Costs (c/km)
2.5% Profit Margin Total Costs (c/km)
10% Profit Margin
Total Costs (c/km)
5% Profit Margin Total Costs (c/km)
2.5% Profit Margin
Total Costs (c/km)
5 Axle Semi Unit (Van)
80,000 km 213.2 201.9 196.8 191.6 181.6 176.9
160,000 km 190.2 180.2 175.6 170.4 161.4 157.3
240,000 km 182.5 172.9 168.5 163.3 154.7 150.8
5 Axle Semi Unit (Flat Deck)
80,000 km 221.3 209.7 204.3 200.1 189.5 184.7
160,000 km 198.5 188.0 183.2 179.0 169.5 165.2
240,000 km 190.9 180.8 176.2 171.9 162.9 158.7
5 Axle Bulk Liquid Tanker
80,000 km 216.1 204.8 199.5 195.6 185.3 180.5
160,000 km 187.7 177.8 173.3 169.3 160.4 156.2
240,000 km 178.3 168.9 164.5 160.5 152.0 148.1
5 Axle Container Chassis
80,000 km 196.7 186.4 181.6 177.8 168.5 164.1
160,000 km 174.2 165.0 160.8 157.0 148.8 144.9
240,000 km 166.7 157.9 153.9 150.1 142.2 138.5
6 Axle (Triaxle) Semi Unit (Van)
80,000 km 252.9 239.5 233.4 228.8 216.8 211.2
160,000 km 226.2 214.3 208.8 204.2 193.4 188.5
240,000 km 217.4 205.9 200.6 195.9 185.6 180.9
6 Axle (Triaxle) Semi Unit (Flat
Deck)
80,000 km 253.3 240.0 233.8 229.1 217.0 211.5
160,000 km 227.1 215.1 209.6 204.8 194.0 189.0
240,000 km 218.4 206.9 201.6 196.7 186.3 181.6

Operating Costs of Trucking and Surface Intermodal Transportation in Canada
54
6 Axle Bulk Liquid Tanker
80,000 km 240.9 228.2 222.4 218.2 206.7 201.4
160,000 km 207.1 196.2 191.2 186.9 177.0 172.5
240,000 km 195.9 185.6 180.8 176.4 167.1 162.9
8 Axle Super B Train Unit (Flat
Deck)
80,000 km 294.8 279.3 272.1 270.0 255.8 249.2
160,000 km 265.8 251.8 245.4 243.2 230.4 224.5
240,000 km 256.2 242.7 236.5 234.3 221.9 216.2
8 Axle Super B Bulk Liquid
Tanker
80,000 km 284.5 269.6 262.6 260.2 246.5 240.2
160,000 km 239.5 226.9 221.1 218.4 206.9 201.6
240,000 km 224.5 212.7 207.3 204.5 193.7 188.8

Operating Costs of Trucking and Surface Intermodal Transportation in Canada
55
Saskatchewan Manitoba
Configuration
10% Profit Margin Total Costs (c/km)
5% Profit Margin Total Costs (c/km)
2.5% Profit Margin Total Costs (c/km)
10% Profit Margin
Total Costs (c/km)
5% Profit Margin Total Costs (c/km)
2.5% Profit Margin
Total Costs (c/km)
5 Axle Semi Unit (Van)
80,000 km 189.7 179.7 175.1 186.2 176.4 171.9
160,000 km 167.0 158.2 154.1 163.3 154.7 150.7
240,000 km 159.4 151.0 147.1 155.6 147.4 143.7
5 Axle Semi Unit (Flat Deck)
80,000 km 193.9 183.7 179.0 193.1 182.9 178.2
160,000 km 171.4 162.4 158.2 170.2 161.3 157.1
240,000 km 163.9 155.2 151.2 162.6 154.1 150.1
5 Axle Bulk Liquid Tanker
80,000 km 190.2 180.2 175.6 189.8 179.8 175.2
160,000 km 162.2 153.7 149.7 161.4 152.9 149.0
240,000 km 152.9 144.8 141.1 151.9 143.9 140.2
5 Axle Container Chassis
80,000 km 172.9 163.8 159.6 171.9 162.9 158.7
160,000 km 150.7 142.7 139.1 149.5 141.6 138.0
240,000 km 143.2 135.7 132.2 142.0 134.5 131.1
6 Axle (Triaxle) Semi Unit (Van)
80,000 km 220.9 209.2 203.9 220.5 208.9 203.6
160,000 km 194.9 184.7 179.9 193.9 183.7 179.0
240,000 km 186.3 176.5 172.0 185.1 175.3 170.8
6 Axle (Triaxle) Semi Unit (Flat
Deck)
80,000 km 220.8 209.2 203.8 220.5 208.9 203.5
160,000 km 195.3 185.0 180.3 194.3 184.1 179.3
240,000 km 186.8 177.0 172.4 185.6 175.8 171.3

Operating Costs of Trucking and Surface Intermodal Transportation in Canada
56
6 Axle Bulk Liquid Tanker
80,000 km 212.2 201.1 195.9 212.2 201.1 195.9
160,000 km 179.3 169.9 165.5 178.5 169.1 164.8
240,000 km 168.4 159.5 155.4 167.3 158.5 154.4
8 Axle Super B Train Unit (Flat
Deck)
80,000 km 257.9 244.4 238.1 256.7 243.2 236.9
160,000 km 229.3 217.3 211.7 227.6 215.7 210.1
240,000 km 219.8 208.2 202.9 218.0 206.5 201.2
8 Axle Super B Bulk Liquid
Tanker
80,000 km 253.5 240.1 234.0 252.8 239.4 233.3
160,000 km 209.1 198.1 193.0 207.7 196.7 191.7
240,000 km 194.3 184.1 179.4 192.6 182.5 177.8
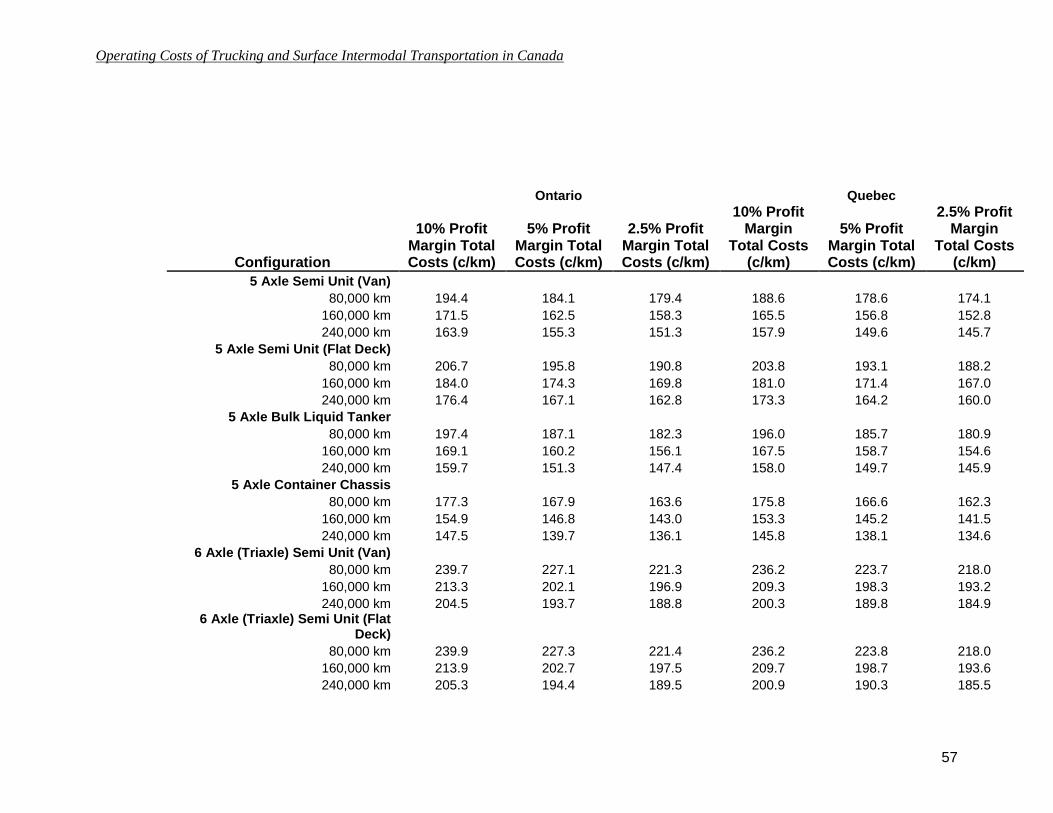
Operating Costs of Trucking and Surface Intermodal Transportation in Canada
57
Ontario Quebec
Configuration
10% Profit Margin Total Costs (c/km)
5% Profit Margin Total Costs (c/km)
2.5% Profit Margin Total Costs (c/km)
10% Profit Margin
Total Costs (c/km)
5% Profit Margin Total Costs (c/km)
2.5% Profit Margin
Total Costs (c/km)
5 Axle Semi Unit (Van)
80,000 km 194.4 184.1 179.4 188.6 178.6 174.1
160,000 km 171.5 162.5 158.3 165.5 156.8 152.8
240,000 km 163.9 155.3 151.3 157.9 149.6 145.7
5 Axle Semi Unit (Flat Deck)
80,000 km 206.7 195.8 190.8 203.8 193.1 188.2
160,000 km 184.0 174.3 169.8 181.0 171.4 167.0
240,000 km 176.4 167.1 162.8 173.3 164.2 160.0
5 Axle Bulk Liquid Tanker
80,000 km 197.4 187.1 182.3 196.0 185.7 180.9
160,000 km 169.1 160.2 156.1 167.5 158.7 154.6
240,000 km 159.7 151.3 147.4 158.0 149.7 145.9
5 Axle Container Chassis
80,000 km 177.3 167.9 163.6 175.8 166.6 162.3
160,000 km 154.9 146.8 143.0 153.3 145.2 141.5
240,000 km 147.5 139.7 136.1 145.8 138.1 134.6
6 Axle (Triaxle) Semi Unit (Van)
80,000 km 239.7 227.1 221.3 236.2 223.7 218.0
160,000 km 213.3 202.1 196.9 209.3 198.3 193.2
240,000 km 204.5 193.7 188.8 200.3 189.8 184.9
6 Axle (Triaxle) Semi Unit (Flat
Deck)
80,000 km 239.9 227.3 221.4 236.2 223.8 218.0
160,000 km 213.9 202.7 197.5 209.7 198.7 193.6
240,000 km 205.3 194.4 189.5 200.9 190.3 185.5

Operating Costs of Trucking and Surface Intermodal Transportation in Canada
58
6 Axle Bulk Liquid Tanker
80,000 km 221.1 209.4 204.1 220.1 208.6 203.2
160,000 km 187.5 177.6 173.1 186.1 176.3 171.8
240,000 km 176.3 167.0 162.7 174.8 165.6 161.3
8 Axle Super B Train Unit (Flat
Deck)
80,000 km 268.8 254.6 248.1 255.1 241.6 235.4
160,000 km 240.6 227.9 222.1 226.8 214.8 209.3
240,000 km 231.2 219.0 213.4 217.3 205.9 200.6
8 Axle Super B Bulk Liquid
Tanker
80,000 km 259.1 245.4 239.1 255.2 241.8 235.6
160,000 km 214.7 203.4 198.2 210.8 199.7 194.6
240,000 km 199.9 189.4 184.5 196.0 185.7 180.9

Operating Costs of Trucking and Surface Intermodal Transportation in Canada
59
New Brunswick Nova Scotia
Configuration
10% Profit Margin Total Costs (c/km)
5% Profit Margin Total Costs (c/km)
2.5% Profit Margin Total Costs (c/km)
10% Profit Margin
Total Costs (c/km)
5% Profit Margin Total Costs (c/km)
2.5% Profit Margin
Total Costs (c/km)
5 Axle Semi Unit (Van)
80,000 km 174.2 165.0 160.8 175.0 165.8 161.5
160,000 km 152.7 144.6 140.9 153.4 145.3 141.6
240,000 km 145.5 137.8 134.3 146.2 138.5 135.0
5 Axle Semi Unit (Flat Deck)
80,000 km 180.5 171.0 166.7 181.4 171.8 167.4
160,000 km 159.2 150.8 146.9 159.9 151.5 147.6
240,000 km 152.0 144.0 140.3 152.7 144.7 141.0
5 Axle Bulk Liquid Tanker
80,000 km 179.6 170.1 165.7 181.1 171.5 167.1
160,000 km 153.0 144.9 141.2 154.4 146.3 142.5
240,000 km 144.1 136.5 133.0 145.5 137.8 134.3
5 Axle Container Chassis
80,000 km 161.8 153.3 149.3 163.6 155.0 151.0
160,000 km 140.7 133.3 129.9 142.4 134.9 131.4
240,000 km 133.7 126.7 123.4 135.3 128.2 124.9
6 Axle (Triaxle) Semi Unit (Van)
80,000 km 206.2 195.4 190.4 207.8 196.9 191.8
160,000 km 181.4 171.9 167.5 182.9 173.3 168.8
240,000 km 173.2 164.0 159.8 174.6 165.4 161.1
6 Axle (Triaxle) Semi Unit (Flat
Deck)
80,000 km 206.0 195.2 190.1 207.6 196.7 191.6
160,000 km 181.6 172.0 167.6 183.0 173.4 168.9
240,000 km 173.4 164.3 160.1 174.8 165.6 161.4

Operating Costs of Trucking and Surface Intermodal Transportation in Canada
60
6 Axle Bulk Liquid Tanker
80,000 km 201.2 190.6 185.7 203.2 192.5 187.6
160,000 km 169.7 160.8 156.7 171.6 162.6 158.4
240,000 km 159.2 150.9 147.0 161.0 152.6 148.7
8 Axle Super B Train Unit (Flat
Deck)
80,000 km 234.2 221.9 216.2 232.5 220.3 214.6
160,000 km 207.6 196.6 191.6 205.8 195.0 190.0
240,000 km 198.7 188.2 183.4 196.9 186.5 181.8
8 Axle Super B Bulk Liquid
Tanker
80,000 km 238.7 226.2 220.4 240.0 227.4 221.5
160,000 km 197.1 186.7 181.9 198.3 187.9 183.0
240,000 km 183.2 173.6 169.1 184.4 174.7 170.2

Operating Costs of Trucking and Surface Intermodal Transportation in Canada
61
PEI Newfoundland
Configuration
10% Profit Margin Total Costs (c/km)
5% Profit Margin Total Costs (c/km)
2.5% Profit Margin Total Costs (c/km)
10% Profit Margin
Total Costs (c/km)
5% Profit Margin Total Costs (c/km)
2.5% Profit Margin
Total Costs (c/km)
5 Axle Semi Unit (Van)
80,000 km 176.6 167.3 163.0 186.2 176.4 171.8
160,000 km 153.6 145.5 141.8 164.8 156.2 152.2
240,000 km 146.0 138.3 134.7 157.7 149.4 145.6
5 Axle Semi Unit (Flat Deck)
80,000 km 182.6 173.0 168.6 190.3 180.3 175.7
160,000 km 159.8 151.4 147.5 169.1 160.2 156.1
240,000 km 152.2 144.2 140.5 162.1 153.5 149.6
5 Axle Bulk Liquid Tanker
80,000 km 183.9 174.2 169.8 190.7 180.7 176.0
160,000 km 155.4 147.2 143.4 164.3 155.7 151.7
240,000 km 145.8 138.2 134.6 155.5 147.3 143.5
5 Axle Container Chassis
80,000 km 165.2 156.5 152.5 172.6 163.6 159.4
160,000 km 142.8 135.2 131.8 151.8 143.8 140.1
240,000 km 135.3 128.1 124.9 144.8 137.2 133.7
6 Axle (Triaxle) Semi Unit (Van)
80,000 km 209.8 198.7 193.6 218.5 207.0 201.7
160,000 km 183.3 173.6 169.2 193.9 183.7 178.9
240,000 km 174.4 165.2 161.0 185.6 175.9 171.4
6 Axle (Triaxle) Semi Unit (Flat
Deck)
80,000 km 209.3 198.3 193.2 218.2 206.7 201.4
160,000 km 183.2 173.6 169.1 193.9 183.7 179.0
240,000 km 174.5 165.3 161.1 185.8 176.1 171.5

Operating Costs of Trucking and Surface Intermodal Transportation in Canada
62
6 Axle Bulk Liquid Tanker
80,000 km 207.2 196.2 191.2 214.1 202.8 197.6
160,000 km 173.3 164.2 160.0 182.8 173.2 168.7
240,000 km 162.0 153.5 149.6 172.4 163.3 159.1
8 Axle Super B Train Unit (Flat
Deck)
80,000 km 238.1 225.6 219.8 246.1 233.2 227.2
160,000 km 209.5 198.5 193.4 219.7 208.1 202.8
240,000 km 200.0 189.5 184.6 210.8 199.7 194.6
8 Axle Super B Bulk Liquid
Tanker
80,000 km 247.4 234.4 228.3 253.4 240.1 233.9
160,000 km 202.3 191.6 186.7 211.9 200.8 195.6
240,000 km 187.3 177.4 172.9 198.1 187.7 182.9

Operating Costs of Trucking and Surface Intermodal Transportation in Canada
63
Yukon Northwest Territories
Configuration
10% Profit Margin Total Costs (c/km)
5% Profit Margin Total Costs (c/km)
2.5% Profit Margin Total Costs (c/km)
10% Profit Margin
Total Costs (c/km)
5% Profit Margin Total Costs (c/km)
2.5% Profit Margin
Total Costs (c/km)
5 Axle Semi Unit (Van)
80,000 km 217.7 206.2 200.9 210.0 199.0 193.9
160,000 km 197.0 186.7 181.9 189.4 179.4 174.8
240,000 km 190.2 180.1 175.5 182.5 172.9 168.4
5 Axle Semi Unit (Flat Deck)
80,000 km 225.6 213.8 208.3 215.3 204.0 198.7
160,000 km 205.1 194.3 189.3 194.8 184.5 179.8
240,000 km 198.3 187.8 183.0 187.9 178.0 173.5
5 Axle Bulk Liquid Tanker
80,000 km 215.3 204.0 198.8 211.1 200.0 194.8
160,000 km 189.6 179.6 175.0 185.3 175.6 171.0
240,000 km 181.0 171.5 167.1 176.7 167.4 163.1
5 Axle Container Chassis
80,000 km 194.6 184.4 179.6 192.7 182.5 177.8
160,000 km 174.4 165.2 161.0 172.4 163.4 159.2
240,000 km 167.7 158.8 154.8 165.7 157.0 153.0
6 Axle (Triaxle) Semi Unit (Van)
80,000 km 258.5 244.9 238.6 245.4 232.5 226.5
160,000 km 234.6 222.3 216.6 221.6 209.9 204.5
240,000 km 226.7 214.7 209.2 213.6 202.4 197.2
6 Axle (Triaxle) Semi Unit (Flat
Deck)
80,000 km 259.2 245.6 239.3 246.1 233.2 227.2
160,000 km 235.7 223.3 217.6 222.7 211.0 205.5
240,000 km 227.9 215.9 210.4 214.9 203.6 198.3

Operating Costs of Trucking and Surface Intermodal Transportation in Canada
64
6 Axle Bulk Liquid Tanker
80,000 km 241.4 228.7 222.8 236.0 223.6 217.9
160,000 km 210.9 199.8 194.7 205.5 194.7 189.7
240,000 km 200.7 190.1 185.3 195.4 185.1 180.4
8 Axle Super B Train Unit (Flat
Deck)
80,000 km 293.0 277.6 270.4 288.6 273.4 266.4
160,000 km 267.5 253.5 247.0 263.1 249.2 242.8
240,000 km 259.1 245.4 239.1 254.6 241.2 235.0
8 Axle Super B Bulk Liquid
Tanker
80,000 km 278.6 264.0 257.2 277.3 262.7 256.0
160,000 km 238.2 225.6 219.9 236.7 224.3 218.5
240,000 km 224.7 212.9 207.4 223.2 211.5 206.0
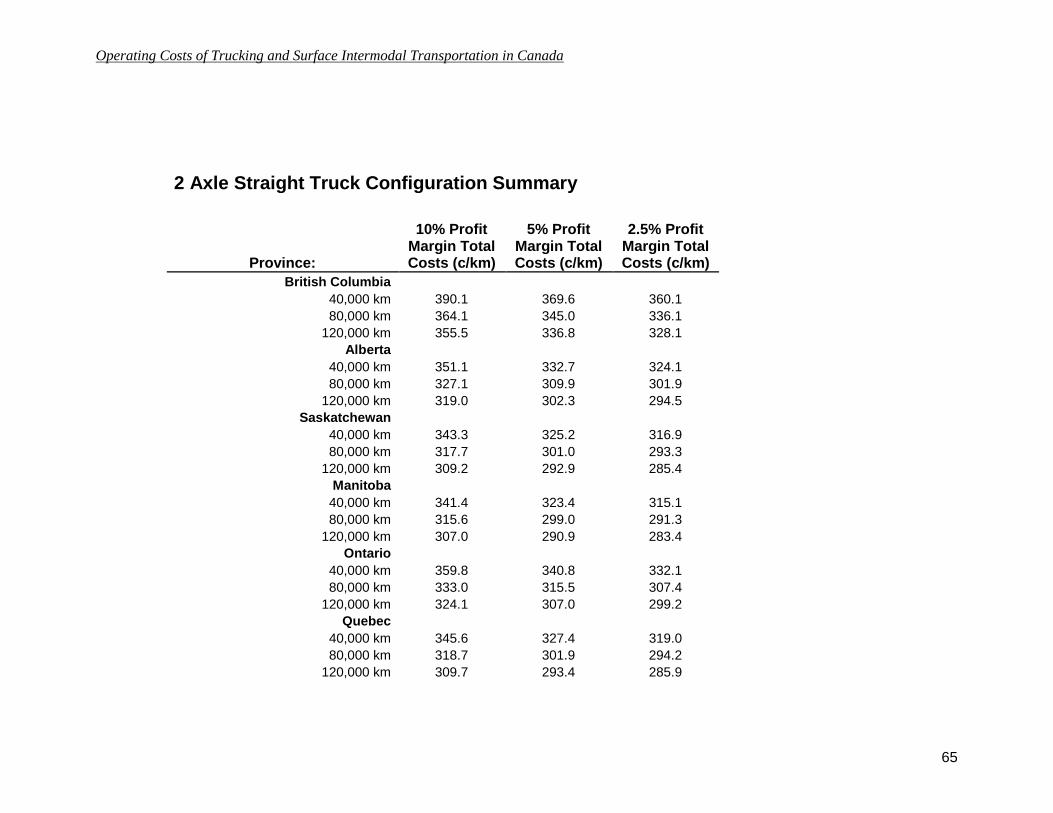
Operating Costs of Trucking and Surface Intermodal Transportation in Canada
65
2 Axle Straight Truck Configuration Summary
Province:
10% Profit Margin Total Costs (c/km)
5% Profit Margin Total Costs (c/km)
2.5% Profit Margin Total Costs (c/km)
British Columbia
40,000 km 390.1 369.6 360.1
80,000 km 364.1 345.0 336.1
120,000 km 355.5 336.8 328.1
Alberta
40,000 km 351.1 332.7 324.1
80,000 km 327.1 309.9 301.9
120,000 km 319.0 302.3 294.5
Saskatchewan
40,000 km 343.3 325.2 316.9
80,000 km 317.7 301.0 293.3
120,000 km 309.2 292.9 285.4
Manitoba
40,000 km 341.4 323.4 315.1
80,000 km 315.6 299.0 291.3
120,000 km 307.0 290.9 283.4
Ontario
40,000 km 359.8 340.8 332.1
80,000 km 333.0 315.5 307.4
120,000 km 324.1 307.0 299.2
Quebec
40,000 km 345.6 327.4 319.0
80,000 km 318.7 301.9 294.2
120,000 km 309.7 293.4 285.9

Operating Costs of Trucking and Surface Intermodal Transportation in Canada
66
New Brunswick
40,000 km 293.8 278.4 271.2
80,000 km 269.3 255.1 248.6
120,000 km 261.1 247.3 241.0
Nova Scotia
40,000 km 295.2 279.7 272.5
80,000 km 270.5 256.3 249.7
120,000 km 262.3 248.5 242.1
P.E.I.
40,000 km 293.3 277.9 270.8
80,000 km 266.8 252.7 246.2
120,000 km 257.9 244.3 238.1
Newfoundland
40,000 km 301.6 285.8 278.4
80,000 km 277.2 262.6 255.9
120,000 km 269.0 254.9 248.3
Yukon
40,000 km 387.0 366.7 357.3
80,000 km 363.3 344.2 335.4
120,000 km 355.4 336.7 328.1
N.W.T.
40,000 km 370.7 351.2 342.2
80,000 km 346.7 328.5 320.0
120,000 km 338.7 320.9 312.6
Operating Costs of Trucking and Surface Intermodal Transportation in Canada
67
APPENDIX B
RATES FOR HAULING CONTAINER CHASSIS ON
SPECIFIED CORRIDORS (ONE-WAY)

Operating Costs of Trucking and Surface Intermodal Transportation in Canada
68
$ $
Canadian Corridors Analysis -- PC*Miler Distances and Running Times Cost Per Truck
Delivery
Distance
(MI) Distance
(KM) Transit (Hr) Km Cost Per Trip
1 St John's, NL Toronto, ON 1914.7 3081.3 68.0 131.9 $4,064
2 Halifax, NS Moncton, NB 162.6 261.6 5.1 136.5 $357
3 Halifax, NS Toronto, ON 1111.6 1788.9 34.2 124.5 $2,227
4 Moncton, NB Montreal, QC 617.3 993.4 23.2 126.0 $1,252
5 Quebec, QC Baie Comeau QC 255.9 411.8 7.2 142.2 $586
6 Montreal, QC Quebec, QC 156.7 252.1 5.0 148.3 $374
7 Val D'Or Toronto, ON 455.9 733.7 11.6 137.3 $1,007
8 Toronto, ON Montreal, QC 337.6 543.3 9.0 139.0 $755
9 Toronto, ON Winnipeg, MB 1379.8 2220.5 56.2 130.1 $2,889
10 Sault Ste Marie Toronto, ON 423.5 681.5 10.9 139.7 $952
11 Winnipeg, MB Calgary, AB 826.1 1329.4 27.9 133.1 $1,769
12 Saskatoon Calgary, AB 386.0 621.2 10.1 135.5 $842
13 Calgary, AB Vancouver, BC 604.4 972.7 22.9 143.9 $1,400
14 Calgary, AB Edmonton, AB 188.7 303.7 5.7 149.1 $453
15 Edmonton, AB Yellowknife, NT 929.5 1495.8 30.2 142.7 $2,135
16 Vancouver, BC Toronto, ON 2716.5 4371.7 101.9 136.5 $5,967
17 Whitehorse, YT Vancouver, BC 1584.3 2549.6 52.7 152.3 $3,883

Operating Costs of Trucking and Surface Intermodal Transportation in Canada
69
International Corridors Analysis -- PC*Miler Distances and Running Times Cost Per Truck
Delivery
Distance
(MI) Distance
(KM) Transit (Hr) Km Cost Per Trip
1 Montreal, QC New York, NY 374.5 602.7 10.8 139.1 $838
2 Toronto, ON Chicago, IL 514.0 827.2 21.9 139.3 $1,152
3 Cambridge, ON Detroit, MI 182.3 293.3 6.6 151.4 $444
4 Toronto, ON Dayton, OH 439.8 707.8 12.3 140.5 $994
5 Kingston, ON Detroit, MI 389.6 627.0 11.2 142.0 $890
6 Winnipeg, MB Kansas City, MO 814.9 1311.4 28.6 130.8 $1,715
7 Calgary, AB Phoenix, AZ 1541.9 2481.4 52.8 138.4 $3,434
8 Vancouver, BC Los Angeles, CA 1280.7 2061.0 47.0 142.9 $2,945
Cost Per Truck
Delivery
Additional Corridors For Rail and Marine Comparisons of Chassis Movements Km Cost Per Trip
1 Sept Iles Trois Rivières 476.5 766.8 13.1 139.3 $1,068
2 Halifax Chicago 1,616.2 2600.9 62.4 123.8 $3,219
3 Montreal St John's 1,579.5 2541.9 61.6 132.9 $3,379
4 Halifax Boston 701.7 1129.2 26.1 125.7 $1,420
5 Toronto Memphis 969.4 1560.1 32.0 136.0 $2,121
6 Toronto Detroit 236.9 381.3 7.8 147.4 $562

Operating Costs of Trucking and Surface Intermodal Transportation in Canada
70
APPENDIX C
SUMMARY OF OWNER OPERATOR ANALYSIS RESULTS
BY REGION

Operating Costs of Trucking and Surface Intermodal Transportation in Canada
71
Region: British Columbia
No of responses: 2
Summary Costs For Owner Operator Trucking
Annual Distance: 116,910 miles 188,142 kms
Worked Hours: 2,554
Total $/mile cents/km $/hour
Driver Costs $30,000 $0.257 15.9 $11.75
Road Expenses $3,100 $0.027 1.6 $1.21
Fuel Costs $79,626 $0.681 42.3 $31.18
Mtce & Repair Costs $35,068 $0.300 18.6 $13.73
Tire Costs $4,746 $0.041 2.5 $1.86
License Costs $500 $0.004 0.3 $0.20
Insurance Costs $14,077 $0.120 7.5 $5.51
Depreciation $25,843 $0.221 13.7 $10.12
Interest $1,922 $0.016 1.0 $0.75
Total Tractor (on road) $194,881 $1.667 103.6 $76.30
Communications $2,763 $0.024 1.5 $1.08
Business Overhead $2,000 $0.017 1.1 $0.78
Total Costs $199,644 $1.708 106.1 $78.17
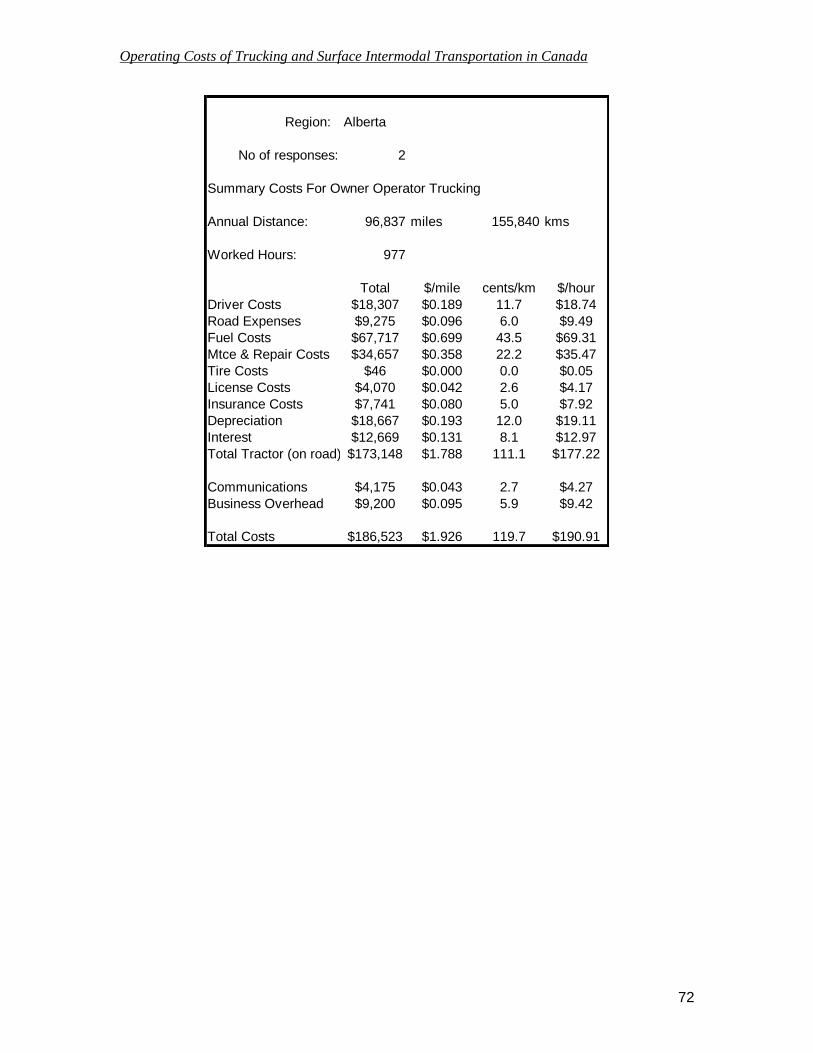
Operating Costs of Trucking and Surface Intermodal Transportation in Canada
72
Region: Alberta
No of responses: 2
Summary Costs For Owner Operator Trucking
Annual Distance: 96,837 miles 155,840 kms
Worked Hours: 977
Total $/mile cents/km $/hour
Driver Costs $18,307 $0.189 11.7 $18.74
Road Expenses $9,275 $0.096 6.0 $9.49
Fuel Costs $67,717 $0.699 43.5 $69.31
Mtce & Repair Costs $34,657 $0.358 22.2 $35.47
Tire Costs $46 $0.000 0.0 $0.05
License Costs $4,070 $0.042 2.6 $4.17
Insurance Costs $7,741 $0.080 5.0 $7.92
Depreciation $18,667 $0.193 12.0 $19.11
Interest $12,669 $0.131 8.1 $12.97
Total Tractor (on road) $173,148 $1.788 111.1 $177.22
Communications $4,175 $0.043 2.7 $4.27
Business Overhead $9,200 $0.095 5.9 $9.42
Total Costs $186,523 $1.926 119.7 $190.91
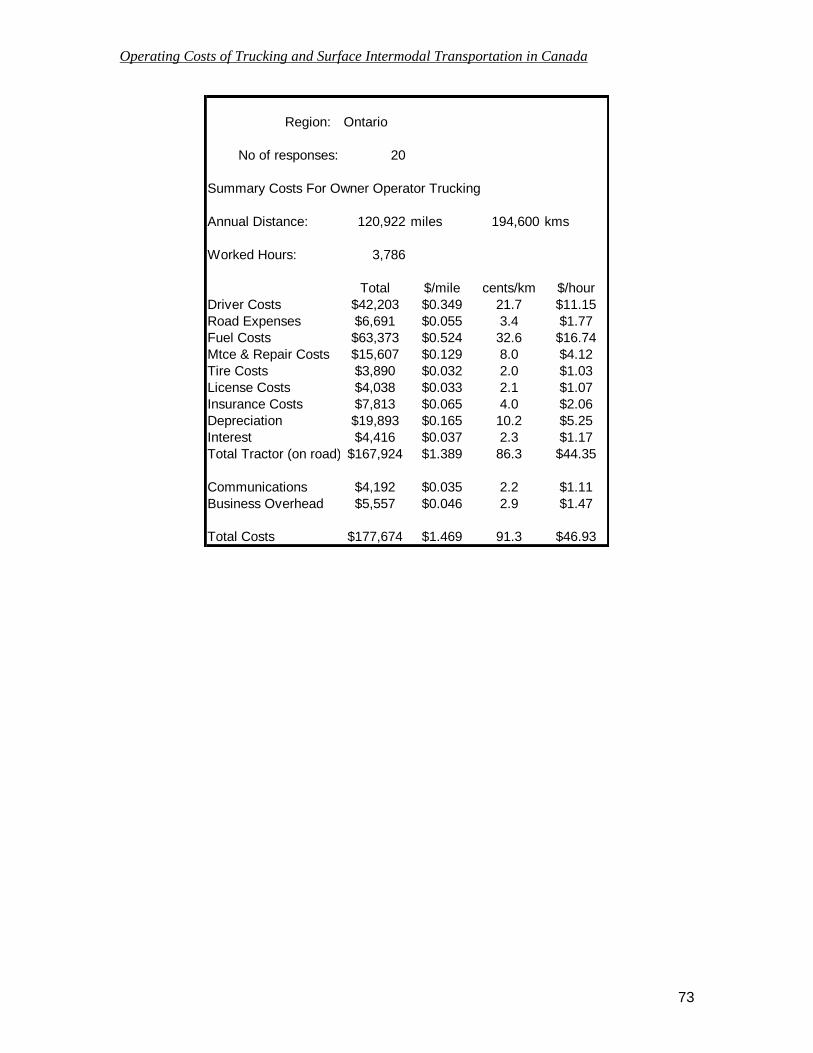
Operating Costs of Trucking and Surface Intermodal Transportation in Canada
73
Region: Ontario
No of responses: 20
Summary Costs For Owner Operator Trucking
Annual Distance: 120,922 miles 194,600 kms
Worked Hours: 3,786
Total $/mile cents/km $/hour
Driver Costs $42,203 $0.349 21.7 $11.15
Road Expenses $6,691 $0.055 3.4 $1.77
Fuel Costs $63,373 $0.524 32.6 $16.74
Mtce & Repair Costs $15,607 $0.129 8.0 $4.12
Tire Costs $3,890 $0.032 2.0 $1.03
License Costs $4,038 $0.033 2.1 $1.07
Insurance Costs $7,813 $0.065 4.0 $2.06
Depreciation $19,893 $0.165 10.2 $5.25
Interest $4,416 $0.037 2.3 $1.17
Total Tractor (on road) $167,924 $1.389 86.3 $44.35
Communications $4,192 $0.035 2.2 $1.11
Business Overhead $5,557 $0.046 2.9 $1.47
Total Costs $177,674 $1.469 91.3 $46.93
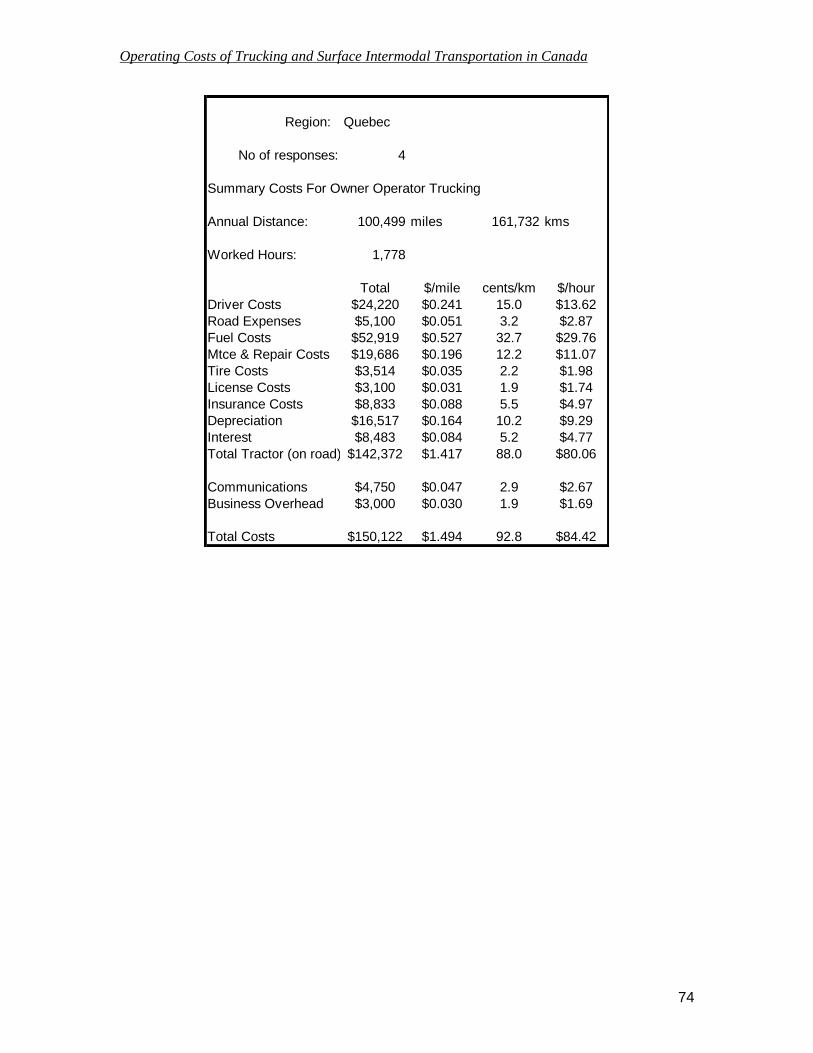
Operating Costs of Trucking and Surface Intermodal Transportation in Canada
74
Region: Quebec
No of responses: 4
Summary Costs For Owner Operator Trucking
Annual Distance: 100,499 miles 161,732 kms
Worked Hours: 1,778
Total $/mile cents/km $/hour
Driver Costs $24,220 $0.241 15.0 $13.62
Road Expenses $5,100 $0.051 3.2 $2.87
Fuel Costs $52,919 $0.527 32.7 $29.76
Mtce & Repair Costs $19,686 $0.196 12.2 $11.07
Tire Costs $3,514 $0.035 2.2 $1.98
License Costs $3,100 $0.031 1.9 $1.74
Insurance Costs $8,833 $0.088 5.5 $4.97
Depreciation $16,517 $0.164 10.2 $9.29
Interest $8,483 $0.084 5.2 $4.77
Total Tractor (on road) $142,372 $1.417 88.0 $80.06
Communications $4,750 $0.047 2.9 $2.67
Business Overhead $3,000 $0.030 1.9 $1.69
Total Costs $150,122 $1.494 92.8 $84.42
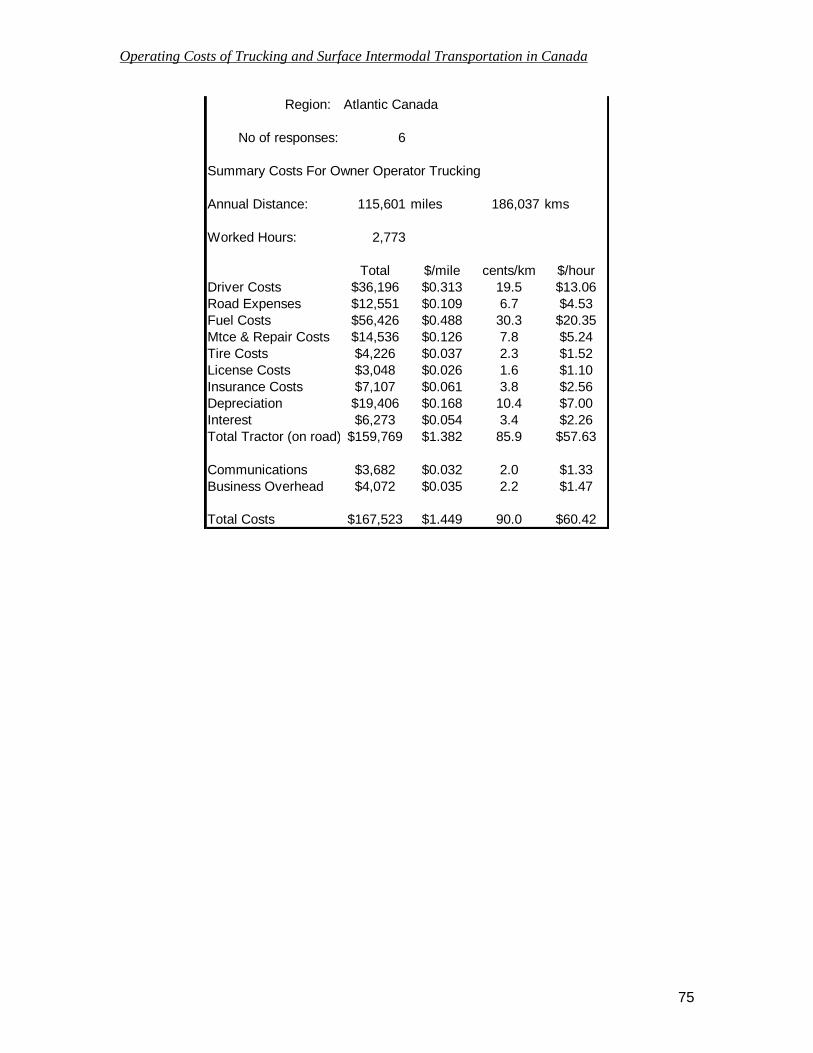
Operating Costs of Trucking and Surface Intermodal Transportation in Canada
75
Region: Atlantic Canada
No of responses: 6
Summary Costs For Owner Operator Trucking
Annual Distance: 115,601 miles 186,037 kms
Worked Hours: 2,773
Total $/mile cents/km $/hour
Driver Costs $36,196 $0.313 19.5 $13.06
Road Expenses $12,551 $0.109 6.7 $4.53
Fuel Costs $56,426 $0.488 30.3 $20.35
Mtce & Repair Costs $14,536 $0.126 7.8 $5.24
Tire Costs $4,226 $0.037 2.3 $1.52
License Costs $3,048 $0.026 1.6 $1.10
Insurance Costs $7,107 $0.061 3.8 $2.56
Depreciation $19,406 $0.168 10.4 $7.00
Interest $6,273 $0.054 3.4 $2.26
Total Tractor (on road) $159,769 $1.382 85.9 $57.63
Communications $3,682 $0.032 2.0 $1.33
Business Overhead $4,072 $0.035 2.2 $1.47
Total Costs $167,523 $1.449 90.0 $60.42

Operating Costs of Trucking and Surface Intermodal Transportation in Canada
76
Region: > 30% MILEAGE in USA
No of responses: 31
Summary Costs For Owner Operator Trucking
Annual Distance: 123,554 miles 198,835 kms
Worked Hours: 3,159
Total $/mile cents/km $/hour
Driver Costs $43,131 $0.349 21.7 $13.65
Road Expenses $11,031 $0.089 5.5 $3.49
Fuel Costs $56,867 $0.460 28.6 $18.00
Mtce & Repair Costs $17,740 $0.144 8.9 $5.62
Tire Costs $3,541 $0.029 1.8 $1.12
License Costs $4,259 $0.034 2.1 $1.35
Insurance Costs $8,589 $0.070 4.3 $2.72
Depreciation $19,398 $0.157 9.8 $6.14
Interest $2,832 $0.023 1.4 $0.90
Total Tractor (on road) $167,388 $1.355 84.2 $52.99
Communications $4,195 $0.034 2.1 $1.33
Business Overhead $8,269 $0.067 4.2 $2.62
Total Costs $179,853 $1.456 90.5 $56.93

Operating Costs of Trucking and Surface Intermodal Transportation in Canada
77
APPENDIX D
COSTING ANALYSIS OF CROSS LAKE FERRY OPERATION
OSWEGO-TORONTO
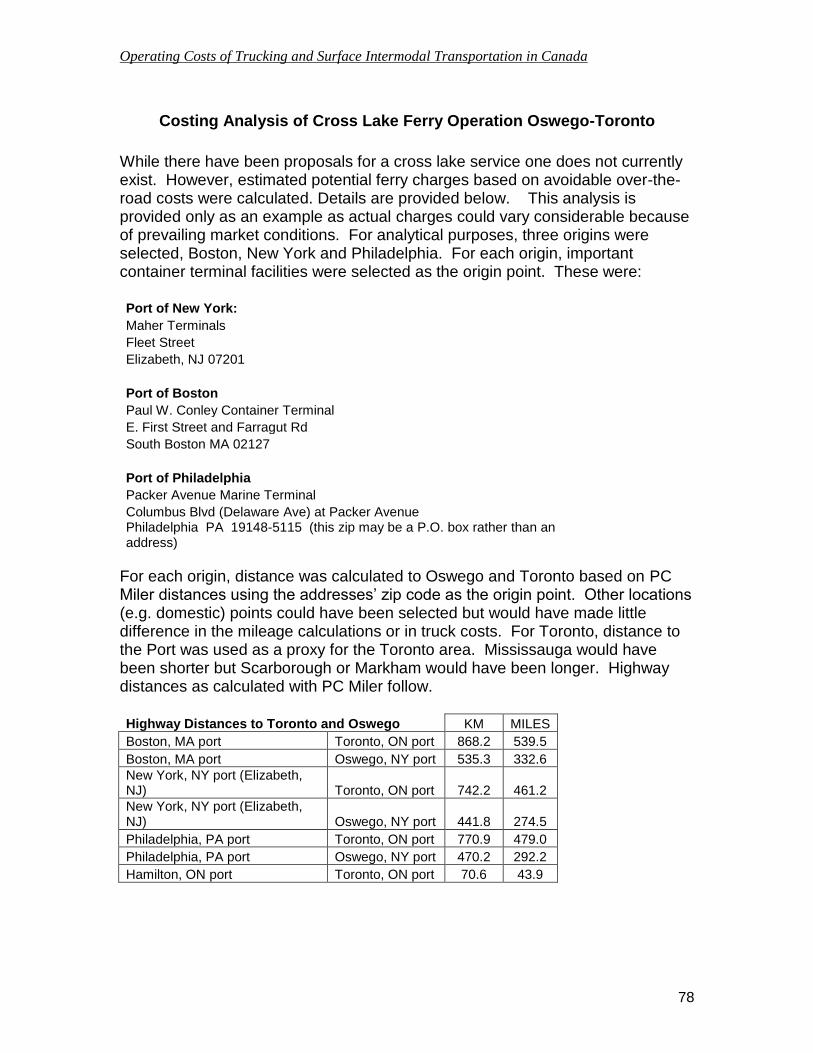
Operating Costs of Trucking and Surface Intermodal Transportation in Canada
78
Costing Analysis of Cross Lake Ferry Operation Oswego-Toronto
While there have been proposals for a cross lake service one does not currently exist. However, estimated potential ferry charges based on avoidable over-the-road costs were calculated. Details are provided below. This analysis is provided only as an example as actual charges could vary considerable because of prevailing market conditions. For analytical purposes, three origins were selected, Boston, New York and Philadelphia. For each origin, important container terminal facilities were selected as the origin point. These were: Port of New York:
Maher Terminals
Fleet Street
Elizabeth, NJ 07201
Port of Boston
Paul W. Conley Container Terminal
E. First Street and Farragut Rd
South Boston MA 02127
Port of Philadelphia
Packer Avenue Marine Terminal
Columbus Blvd (Delaware Ave) at Packer Avenue Philadelphia PA 19148-5115 (this zip may be a P.O. box rather than an address)
For each origin, distance was calculated to Oswego and Toronto based on PC Miler distances using the addresses’ zip code as the origin point. Other locations (e.g. domestic) points could have been selected but would have made little difference in the mileage calculations or in truck costs. For Toronto, distance to the Port was used as a proxy for the Toronto area. Mississauga would have been shorter but Scarborough or Markham would have been longer. Highway distances as calculated with PC Miler follow. Highway Distances to Toronto and Oswego KM MILES
Boston, MA port Toronto, ON port 868.2 539.5
Boston, MA port Oswego, NY port 535.3 332.6
New York, NY port (Elizabeth, NJ) Toronto, ON port 742.2 461.2
New York, NY port (Elizabeth, NJ) Oswego, NY port 441.8 274.5
Philadelphia, PA port Toronto, ON port 770.9 479.0
Philadelphia, PA port Oswego, NY port 470.2 292.2
Hamilton, ON port Toronto, ON port 70.6 43.9

Operating Costs of Trucking and Surface Intermodal Transportation in Canada
79
Marine distance from Oswego to Hamilton was assumed to be 216 km and cross lake transit time at 12 hours.8 The service would be drop trailer with two ferries each operating one round trip per day. Notwithstanding, the foregoing, the true measure of what would be available for a ferry service depends upon the level of competition that truck operators could provide. Accordingly, the truck costing model was used to develop over-the-road truck costs including a margin for profit. The following tables provide the comparison of what would presumably be available for a ferry service when the trucking costs from New York, Boston, and Philadelphia respectively direct to Toronto or via Oswego and Hamilton are compared.
Movement Cost
Direct trucking from New York to Toronto $1,026
Trucking Cost for road portion of same movement using potential Oswego-Hamilton ferry service:
New York – Oswego Hamilton-Toronto Total cost
$658 $135 $793
Cost difference available for ferry service ($1,026 -$793)
$233
Movement Cost
Direct trucking from Boston to Toronto $1,193
Trucking Cost for road portion of same movement using potential Oswego-Hamilton ferry service:
Boston – Oswego Hamilton-Toronto Total cost
$788 $135 $923
Cost difference available for ferry service ($1,193 -$923)
$270
8 Marine Transportation in Ontario, A study for the Marine Transportation Forum and the Ontario
Ministry of Transportation, The Mariport Group, December 2006, p 13.

Operating Costs of Trucking and Surface Intermodal Transportation in Canada
80
Movement Cost
Direct trucking from Philadelphia to Toronto $1,064
Trucking Cost for road portion of same movement using potential Oswego-Hamilton ferry service:
Philadelphia – Oswego Hamilton-Toronto Total cost
$698 $135 $833
Cost difference available for ferry service ($1,064 -$833)
$231
With a drop trailer service, considerable space would be required at each end to marshal and store the trailers and there would be a cost for this. Also, ferry loading/unloading would be time consuming. West Coast barge jockeying charges, for example, are in the order of $30 per trailer at each end of the barge movement and Marine Atlantic charges are considerably higher ($99.25). If costs comparable to those at the West Coast were to be assumed this would remove about $60 from the share available for the actual cross-lake operation. In addition, a cross-lake service would add in the order of 14 hours to an average transit time. A split movement would have some natural advantages and some potential disadvantages. Advantages:
Because drivers would only operate within their home country, border certification would not be needed.
Potential for reduced costs where daily round trips are possible.
Fewer trucks on the road between the border and Hamilton.
Disadvantages
There could be additional CBSA charges at Hamilton if the Windsor ferry model is followed.
Container transit time would be greatly increased if the ferry option is used.
If any problems occurred with the ferry operation,9 transit time could be greatly increased – essentially one day longer.
There would be cost associated if tractors have an extended wait for the ferry or for having to hold trailers waiting for pick-up.
9 For example, breakdown or weather problems.