Embed Size (px)
Citation preview
Aircraft Operating Costs 4-1
4. AIRCRAFT OPERATING COSTS
4.1 INTRODUCTION
This section provides estimates of variable and fixed aircraft operating costs. Aircraft variable operating costs are important factors in the evaluation of FAA investment and regulatory programs that concern the time spent in air transportation. The variable operating costs of aircraft affect aircraft operators directly and users of air service indirectly in the form of higher or lower fares or taxes. Fixed aircraft costs may also be important in evaluating the effects of FAA investment and regulatory programs that affect fleet size, cause aircraft to be more productive, or cause aircraft to be out of service for extended periods of time.
To put airline costs in perspective, this section first shows the relationship of
aircraft operating costs to total airline operating costs and then presents another disaggregation of total airline costs. After this, aircraft operating costs are presented in more detail. Costs in this section are shown for air carrier, general aviation and military equipment types. Data are presented for aircraft categories identical to those in Section 3 above.
Cost data are defined for air carrier and general aviation aircraft as variable or fixed.
Variable costs change in proportion to aircraft usage, and include fuel and oil, maintenance and crew costs.1 Fixed costs show little or no change in proportion to changes in activity. For example, in the short-term, a change in activity may not affect an operator’s decision about a specific aircraft or fleet of aircraft. In the longer-term, the operator could change its fleet and ownership costs.
There are two estimates of fixed costs provided. The first is fixed accounting charges
including depreciation, insurance, and rental charges reported by carriers in Form 41, or which have been estimated for GA aircraft. The second is provided for commercial aircraft only. If an FAA initiative improves system efficiency, an operator may be able to provide the same service with fewer aircraft; alternatively, an FAA initiative may cause aircraft to be out of service or to be removed from the fleet entirely. In either case, an estimate of the benefit or cost to the carrier of an FAA initiative would include the carrier’s opportunity costs—the value of the aircraft in its next best use. One immediate alternative use of an aircraft might be to lease it out to another operator. Since there is a well-defined market for operating (short-term) leases for most aircraft types, one can use the average monthly lease rate as a good proxy for the benefit or cost over a defined period of time.
4.1.1. Average versus Incremental Cost
By necessity, the operating cost data presented in this chapter represent average costs. Cost categories such as ownership costs are reported separately so they can be included or excluded in a specific analysis. However, economists typically look at the concept of incremental costs (i.e., the changes in costs from small changes in levels of activity). Incremental costs may
1 Some analysts assume that crew costs are fixed in the short run; this is especially the case for entities that operate one or a small number of aircraft.

Aircraft Operating Costs 4-2
differ from the average costs used in this chapter, but the data from Form 41 and other sources using average costs are well-accepted industry standards. Analysts are cautioned, however, that average costs may not always be the most appropriate measure.
4.1.2. Change in Industry Structure and Implications for Airline Operating Cost Trends
The U.S. airline industry has undergone considerable restructuring since the previous Economic Values report was published in 2007. The recession of 2007-2009 resulted in substantially reduced demand for air travel, while the price of jet fuel simultaneously increased to near-record levels. U.S. airlines sustained billions of dollars in losses, resulting in bankruptcies, consolidation and widespread changes in operating practices.
U.S. airlines reduced capacity, retired fuel-inefficient aircraft types and have maintained
a sharp focus on profitability. A small number of major carriers now provide the majority of airline service in the country, although a number of ultra-low-cost carriers have developed that focus on point to point service with fares and costs substantially less than the major carriers. Because the Form 41 data represent aggregations across the industry, reported costs may not accurately depict actual costs for individual carriers.
4.1.3. Direct and Indirect Costs
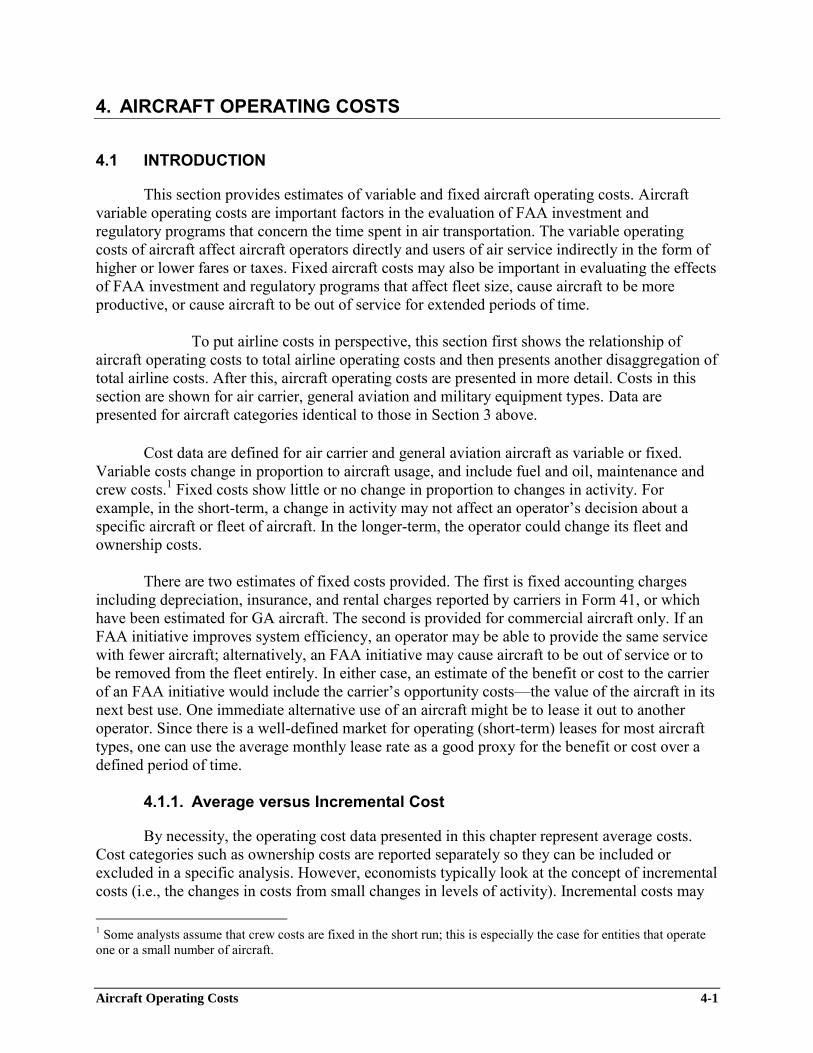
Table 4-1 shows direct and indirect operating expenses for Group III air carriers.2 As can be seen, direct costs are about 52 percent of total costs for major passenger air carriers and about 43 percent of total costs for all-cargo air carriers. The direct costs will be examined in more detail later in this chapter. However, this table provides a perspective on overall carrier costs and the relative magnitudes of each category of costs. Industry costs for carriers filing Schedule P-7 of Form 41 totaled $145.3 billion for passenger air carriers and $32.9 billion for all-cargo air carriers in 2013. Overall, the average total operating cost per block hour for passenger air carriers was $9,099 and the average cost for all-cargo air carriers was $25,820 in 2013.
2 Group III air carriers are those with annual revenues of more than $1 billion; direct and indirect costs are categories used on Schedule P.7 of Form 41.
Aircraft Operating Costs 4-3
Table 4-1: 2013 Group III Part 121 Air Carrier Costs – Direct and Indirect Costs
Cost Group
Cost Type
Passenger All-Cargo
Cost (millions)
Share of
Cost
Cost per
Block Hour
Cost (millions)
Share of
Cost
Cost per
Block Hour
Direct Aircraft Operating Expense $75,227.5 52% $4,709 $14,203.6 43% $11,138
Subtotal Direct Expenses $75,227.5 52% $4,709 $14,203.6 43% $11,138
Indirect
Advertising and Promotion Expenses $1,218.0 1% $76 $118.9 0% $93
Aircraft Servicing Expenses $7,575.3 5% $474 $1,224.1 4% $960
Amortization (non-flight equipment) $604.8 0% $38 $1.6 0% $1
Depreciation Expense - Maintenance Equipment $68.8 0% $4 $129.2 0% $101
General and Administrative Expense $9,133.0 6% $572 $2,842.3 9% $2,229
Maintenance and Depreciation (ground equipment)
$1,763.6 1% $110 $506.8 2% $397
Passenger Service Expenses $9,843.8 7% $616 $38.0 0% $30
Reservations and Sales Expenses $6,652.1 5% $416 $275.3 1% $216
Traffic Servicing Expenses $12,311.6 8% $771 $2,952.9 9% $2,315
Subtotal Service, Sales, and General Operating Expenses
$49,171.0 34% $3,078 $8,089.1 25% $6,343
Transport Related Expenses $20,963.5 14% $1,312 $10,634.9 32% $8,339
Subtotal Indirect Expenses $70,134.6 48% $4,390 $18,724.0 57% $14,682
Total Operating Expenses $145,362.1 100% $9,099 $32,927.6 100% $25,820
Source: 2013 Form 41, Schedules P-7 and T-100
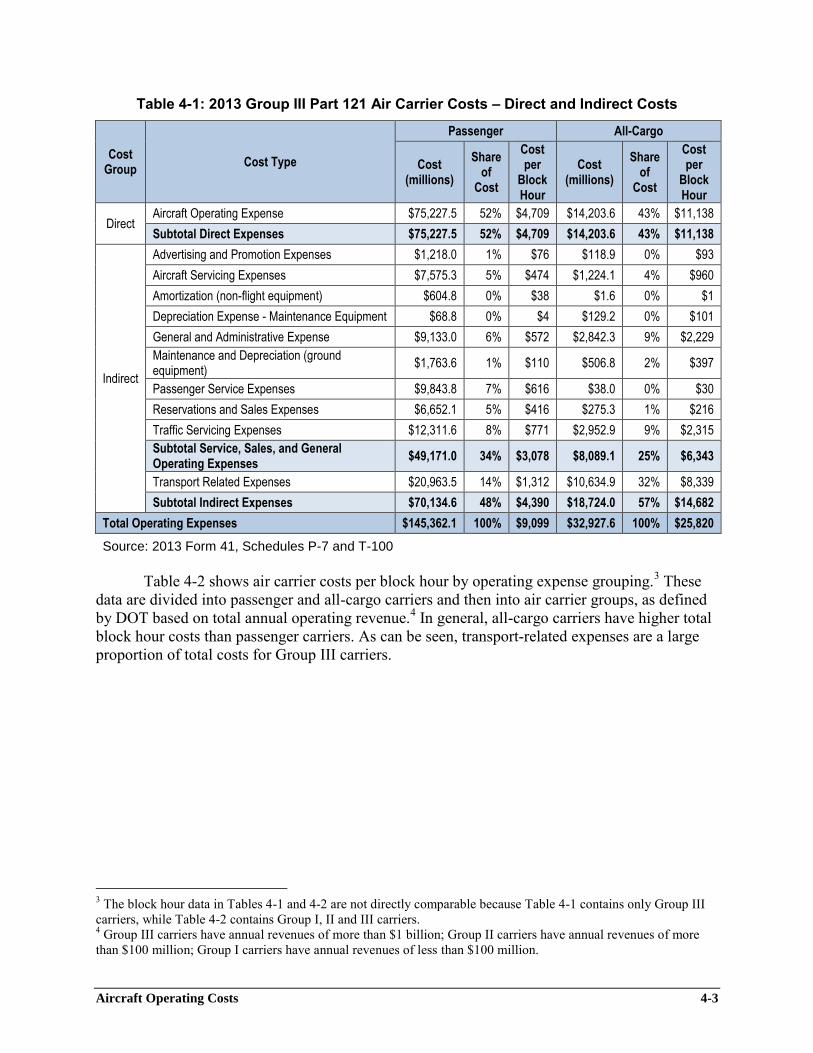
Table 4-2 shows air carrier costs per block hour by operating expense grouping.3 These
data are divided into passenger and all-cargo carriers and then into air carrier groups, as defined by DOT based on total annual operating revenue.4 In general, all-cargo carriers have higher total block hour costs than passenger carriers. As can be seen, transport-related expenses are a large proportion of total costs for Group III carriers.
3 The block hour data in Tables 4-1 and 4-2 are not directly comparable because Table 4-1 contains only Group III carriers, while Table 4-2 contains Group I, II and III carriers. 4 Group III carriers have annual revenues of more than $1 billion; Group II carriers have annual revenues of more than $100 million; Group I carriers have annual revenues of less than $100 million.
Aircraft Operating Costs 4-4
Table 4-2: 2013 Part 121 Air Carrier Operating and Other Expenses per Block Hour by Expense Category and Carrier Group
Expense Category Passenger All-Cargo Total
Carriers Group III
Group II
Group I
Group III
Group II
Group I
Aircraft and Traffic Handling Personnel
$341 $46 $260 $893 $114 $343 $337
Flight Personnel $779 $278 $591 $1,278 $644 $751 $746
General Management Personnel
$33 $25 $236 $254 $193 $348 $48
Maintenance Labor $163 $80 $312 $581 $303 $558 $182
Other Personnel $286 $37 $178 $615 $249 $286 $275
Total Salaries $1,603 $466 $1,577 $3,621 $1,503 $2,285 $1,588 Total Fringe Benefits $687 $208 $577 $1,323 $682 $607 $667
Total Salaries and Benefits $2,290 $674 $2,154 $4,944 $2,186 $2,891 $2,255 Amortization $63 $8 $0 $1 $19 $309 $52
Depreciation $328 $148 $292 $1,335 $269 $452 $369
Landing Fees $162 $68 $203 $338 $289 $98 $162
Materials $2,968 $533 $1,196 $6,266 $5,066 $3,118 $2,887
Other $175 $149 $413 $1,607 $601 $664 $268
Rentals $510 $281 $739 $1,018 $4,119 $971 $545
Services $1,308 $379 $1,473 $1,972 $1,862 $1,926 $1,239
Transport Related Expenses $1,313 $2 $8 $8,339 $2,217 $381 $1,599
Total Operating Expenses $9,116 $2,240 $6,478 $25,820 $16,628 $10,810 $9,377 Total Other Expenses (Income) $369 $30 ($317) $370 $255 $67 $324
Total Expenses $9,485 $2,270 $6,161 $26,190 $16,883 $10,877 $9,700
Source: 2013 Form 41, Schedules P-6, P-5.1 and T-100
4.2 CARRIER AIRCRAFT OPERATING COST DATA
Cost data for air carriers were derived from Bureau of Transportation Statistics (BTS) Form 41 data. The air carrier sub-groupings are based on the reporting requirements of 14 CFR Part 241, which prescribe reporting requirements for large certificated air carriers.5 In some years, there could be additional air carrier groups for Part 135 carriers that are required to report financial and traffic data per 14 CFR Part 241. However, in 2013, no Part 135 carriers were required to report.6
5 Large certificated air carriers hold Certificates of Public Convenience and Necessity issued by the U.S. Department of Transportation authorizing the performance of air transportation with annual operating revenues of $20 million or more. 6 One carrier that filed Schedule P-5.1 holds joint Part 121 and Part 135 operating authority.
Aircraft Operating Costs 4-5
Air carriers with total annual operating revenues of $100 million or more report aircraft operating costs on Schedule P-5.2 and air carriers with total annual operating revenue of less than $100 million report aircraft operating costs on Schedule P-5.1. The air carrier aircraft operating cost data are presented in four groups:
Part 121 air carrier operations of passenger aircraft
Air carriers filing Schedule P-5.27 Air carriers filing Schedule P-5.18
Part 121 air carrier operations of all-cargo aircraft Air carriers filing Schedule P-5.2 Air carriers filing Schedule P-5.1
For air carriers filing Schedule P-5.2, variable costs are categorized as fuel and oil,
maintenance, and crew. Fixed costs are categorized as depreciation, rentals, insurance, and other. Most of the cost categories are comprised of multiple items from Form 41 Schedule P-5.2. The composition of the cost categories is shown in Table 4-3.
7 Carrier groups II and III; large certificated air carriers with total annual operating revenues of $100 million or more. 8 Carrier Group I: Total annual operating revenues of less than $100 million.

Aircraft Operating Costs 4-6
Table 4-3: Air Carriers Filing Schedule P-5.2 Aircraft Operating Cost Categories
Variable Costs Fixed Costs
Economic Values Cost
Category Form 41, Schedule P-5.2 Cost Item
Economic Values Cost
Category
Form 41, Schedule P-5.2 Cost Item
Fuel and Oil
Aircraft Fuel
Depreciation
Depreciation - Airframes
Aircraft Oil Depreciation - Aircraft Engines
Taxes-Other than Payroll1 Depreciation - Aircraft Parts
Maintenance
Labor - Airframes Depreciation - Aircraft Engine Parts
Labor - Aircraft Engines Depreciation - Other Flight Equipment
Airfram Repairs - Outside
Rentals
Aircraft Interchange Charges
Aircraft Engine Repairs - Outside Rentals
Aircraft Interchange Charges Amortization Expense - Capital Leases - Flight Equip. Maintenance Materials - Airframes
Maintenance Materials - Aircraft Engines
Insurance Insurance Purchased
Other
Injuries, Loss and Damage2
Airworthiness Allowance Provision - Airframes
Other Expenses
Other Supplies
Airframe Overhauls Deferred (credit) Professional and Technical Fees and Expenses Airworthiness Allowance Provision -
Aircraft Engines
Aircraft Engine Overhauls Deferred (credit)
Applied Maintenance Burden-Flight Equipment
Net Obsolescence & Deterioration - Expendable Parts
Crew
Pilots and Copilots Salaries
Other Flight Personnel
Trainees and Instructors
Personnel Expenses
Employee Benefits and Pensions
Taxes - Payroll 1 Non-refundable fuel taxes 2 Excess of losses over insurance recoveries
Air carriers filing Schedule P-5.1 are not required to report aircraft operating costs in as
much detail as air carriers filing Schedule P-5.2. Variable costs are categorized as fuel and oil, maintenance, and crew. The only fixed cost category is depreciation, which includes rentals. The other category includes all other costs associated with flying operations and may contain both variable and fixed costs. Table 4-4 shows the relationship of Schedule P-5.1 cost items to the cost categories used in this report.

Aircraft Operating Costs 4-7
Table 4-4: Air Carriers Filing Schedule P-5.1 Aircraft Operating Cost Categories
Variable Costs Fixed Costs
Other Costs
Economic Values Cost
Category
Form 41, Schedule P-5.1 Cost
Item
Economic Values Cost
Category
Form 41, Schedule P-5.1 Cost
Item
Economic Values Cost
Category
Form 41, Schedule P-5.1 Cost
Item
Fuel and Oil Aircraft Fuel and Oil
Depreciation
Depreciation and Rental - Flight Equipment
Other
Flying Operations - Other
Maintenance Maintenance - Flight Equipment
Crew Pilots and Copilot
Table 4-5 shows aggregate average aircraft operating cost per block hour and activity
data for air carriers filing Schedules P-5.2 and P-5.1 in 2013. Carriers that filed Schedule P-5.1 represented a very small proportion of the air carrier industry.

Aircraft Operating Costs 4-8
Table 4-5: 2013 Summary Air Carrier Average Aircraft Operating Costs and Block Hours
Aircraft Category
Carriers Filing Schedule P-5.2 Carriers Filing Schedule P-5.1 Total Carriers
Col. 1 Average Variable Costs
per Block Hour
Col. 2 Average
Total Costs
per Block Hour
Col. 3
Total Block Hours
Col. 4 Average Variable Costs
per Block Hour
Col. 5 Average
Total Costs
per Block Hour
Col. 6
Total Block Hours
Col. 7 Average Variable Costs
per Block Hour
Col. 8 Average
Total Costs
per Block Hour
Col. 9
Total Block Hours
Wide-body more than 300 seats $13,500 $14,592 191,834 NR NR NR $13,500 $14,592 191,834
Wide-body 300 seats and below $8,236 $9,103 2,006,089 NR NR NR $8,236 $9,103 2,006,089
Four-engine wide-body $10,567 $13,912 235,903 $31,626 $34,896 1,439 $10,694 $14,039 237,342
Three-engine wide-body $12,502 $15,013 365,601 NR NR NR $12,502 $15,013 365,601
Two-engine wide-body $8,557 $10,430 534,015 $2,452 $3,623 9,579 $8,450 $10,310 543,594
Narrow-body more than 160 seats $5,014 $5,641 2,392,889 NR NR NR $5,014 $5,641 2,392,889
Narrow-body 160 seats and below $3,834 $4,392 8,975,434 $5,215 $6,241 28,872 $3,839 $4,398 9,004,306
RJ more than 60 seats $1,080 $1,424 2,156,423 NR NR NR $1,080 $1,424 2,156,423
RJ 60 seats and below $994 $1,241 2,598,953 NR NR NR $994 $1,241 2,598,953
Turboprop more than 60 seats $1,165 $1,612 218,193 $2,758 $3,396 4,379 $1,196 $1,647 222,572
Turboprop 20 - 60 seats $818 $1,200 112,295 $1,387 $2,574 9,976 $864 $1,312 122,271
Turboprop under 20 seats (Part 25) NR NR NR NR NR NR NR NR NR
Turboprop under 20 seats (Part 23) $293 $1,020 95,571 $653 $1,069 1,093 $297 $1,021 96,664
Piston engine (Part 25) NR NR NR $4,009 $4,214 4,568 $4,009 $4,214 4,568
Piston engine (Part 23) $0 $2,887 56,945 NR NR NR $0 $2,887 56,945
Total $4,134 $4,783 19,940,145 $4,416 $5,443 59,906 $4,135 $4,785 20,000,051
Source: 2013 Form 41, Schedules P-5.1, P-5.2 and T-100 NR = None Reported Col 1: Average variable cost (weighted by block hours) for passenger and all-cargo carriers filing Schedule P-5.2 Col 2: Average total cost (weighted by block hours) for passenger and all-cargo carriers filing Schedule P-5.2 Col 3: Total block hours from Schedule T-100 for passenger and all-cargo carriers filing Schedule P-5.2 Col 4: Average variable cost (weighted by block hours) for passenger and all-cargo carriers filing Schedule P-5.1 Col 5: Average total cost (weighted by block hours) for passenger and all-cargo carriers filing Schedule P-5.1 Col 6: Total block hours from Schedule T-100 for passenger and all-cargo carriers filing Schedule P-5.1 Col 7: Average variable cost (weighted by block hours) for passenger and all-cargo carriers filing Schedules P-5.1 and P-5.2 Col 8: Average total cost (weighted by block hours) for passenger and all-cargo carriers filing Schedules P-5.1 and P-5.2 Col 9: Total block hours from Schedule T-100 for passenger and all-cargo carriers filing Schedules P-5.1 and P-5.2
Block hours are the common industry measure for presenting operating cost data and are
used in this report. Tables are also provided on the APO website for costs broken down by airborne hours. Analysts using the data need to identify the appropriate value, block or airborne hours. (Section 6 discusses cost by phase of flight, which divides elapsed block times into component flight segments.) Variable costs include all aircraft operating cost elements, except rentals, depreciation and insurance. This provides an industry-wide perspective for passenger and all-cargo operators combined.

Aircraft Operating Costs 4-9
4.2.1. Part 121 Passenger and All-Cargo Air Carriers Filing Schedule P-5.2 Cost per Block Hour
Table 4-6 summarizes variable and fixed costs per block hour for Part 121 passenger air carriers that filed Schedule P-5.2. Total operating costs averaged $4,289 per block hour while variable costs averaged $3,764 per block hour. Variable costs accounted for an average of 88 percent of total costs. Narrow-body aircraft with 160 seats and accounted for nearly one-half of activity, measured in block hours.
Table 4-6: 2013 Part 121 Passenger Air Carriers Filing Schedule P-5.2 Operating and
Fixed Costs per Block Hour
Aircraft Category
Cost per Block Hour Col. 11
Block Hours
Col. 1 Fuel
and Oil
Col. 2
Maintenance
Col. 3
Crew
Col. 4 Total
Variable
Col. 5
Depreciation
Col. 6
Rentals
Col. 7
Insurance
Col. 8
Other
Col. 9 Total Fixed
Col. 10
Total
Wide-body more than 300 seats $10,275 $1,687 $1,538 $13,500 $761 $318 $9 $5 $1,093 $14,592 191,834
Wide-body 300 seats and below $5,719 $1,343 $1,174 $8,236 $522 $328 $10 $6 $867 $9,103 2,006,089
Narrow-body more than 160 seats $3,102 $964 $777 $4,843 $352 $199 $6 $1 $558 $5,400 2,260,009
Narrow-body 160 seats and below $2,394 $715 $724 $3,833 $221 $325 $9 $3 $558 $4,390 8,959,309
RJ more than 60 seats $287 $444 $349 $1,080 $144 $188 $6 $5 $344 $1,424 2,156,423
RJ 60 seats and below $145 $468 $379 $993 $59 $179 $6 $3 $248 $1,240 2,596,269
Turboprop more than 60 seats NR $654 $323 $1,020 $264 $155 $3 $2 $423 $1,443 210,338
Turboprop 20-60 seats $310 $250 $258 $818 $265 $107 $0 $9 $382 $1,200 112,295
Turboprop under 20 seats (Part 23) $1,050 $175 $850 $2,075 $0 $479 $241 $167 $888 $2,962 4,605
All Aircraft $2,322 $754 $688 $3,764 $244 $270 $8 $4 $526 $4,289 18,497,171
Source: 2013 Form 41 Schedule P-5.2 financial data and Schedule T-100 traffic data NR: Reported data not reliable Col 1: Fuel and Oil Costs (see Table 4-3) divided by total block hours Col 2: Maintenance Costs (see Table 4-3) divided by total block hours Col 3: Crew Costs (see Table 4-3) divided by total block hours Col 4: Columns 1 + 2 + 3 Col 5: Depreciation Costs (see Table 4-3) divided by total block hours Col 6: Rental Costs (see Table 4-3) divided by total block hours Col 7: Insurance Costs (see Table 4-3) divided by total block hours Col 8: Other Costs (see Table 4-3) divided by total block hours Col 9: Columns 5 + 6 + 7 + 8 Col 10: Columns 4 + 9 Col 11: Total block hours reported on Schedule T-100
Table 4-7 reports operating cost data for Part 121 all-cargo air carriers filing Schedule P-
5.2. Total operating costs averaged $11,104 per block hour while variable costs averaged $8,889 per block hour. Variable costs accounted for an average of 80 percent of total costs. Wide-body aircraft accounted for nearly 80 percent of activity, measured in block hours.

Aircraft Operating Costs 4-10
Table 4-7: 2013 Part 121 All-Cargo Air Carriers Filing Schedule P-5.2 Operating and Fixed Costs per Block Hour
Aircraft Category
Cost per Block Hour Col. 11
Block Hours
Col. 1 Fuel
and Oil
Col. 2
Maintenance
Col. 3
Crew
Col. 4 Total
Variable
Col. 5
Depreciation
Col. 6
Rentals
Col. 7
Insurance
Col. 8
Other
Col. 9 Total Fixed
Col. 10
Total
Wide-body more than 300 seats $7,228 $1,670 $1,669 $10,567 $610 $2,667 $38 $30 $3,345 $13,912 235,903
Wide-body 300 seats and below $6,875 $3,378 $2,250 $12,502 $1,545 $624 $41 $300 $2,511 $15,013 365,601
Narrow-body more than 160 seats $4,597 $1,937 $2,023 $8,557 $909 $754 $47 $162 $1,872 $10,430 534,015
Narrow-body 160 seats and below $3,182 $2,829 $1,928 $7,939 $1,424 $207 $52 $113 $1,795 $9,734 132,880
RJ more than 60 seats $3,010 $1,060 $602 $4,672 $143 $96 $70 $399 $709 $5,380 16,125
RJ 60 seats and below $882 $620 $386 $1,888 $331 $0 $157 $10 $498 $2,387 2,684
Turboprop more than 60 seats $1,546 $1,507 $2,007 $5,060 $897 $0 $192 $1 $1,090 $6,150 7,855
Turboprop 20-60 seats NR $12 $190 $203 $45 $675 $0 $0 $720 $922 90,966
Turboprop under 20 seats (Part 23) NR NR NR NR $332 $2,483 $72 $0 $2,887 $2,887 56,945
All Aircraft $4,961 $2,128 $1,799 $8,889 $982 $1,034 $44 $156 $2,215 $11,104 1,442,974
Source: 2013 Form 41 Schedule P-5.2 financial data and Schedule T-100 traffic data NR: Reported data not reliable Col 1: Fuel and Oil Costs (see Table 4-3) divided by total block hours Col 2: Maintenance Costs (see Table 4-3) divided by total block hours Col 3: Crew Costs (see Table 4-3) divided by total block hours Col 4: Columns 1 + 2 + 3 Col 5: Depreciation Costs (see Table 4-3) divided by total block hours Col 6: Rental Costs (see Table 4-3) divided by total block hours Col 7: Insurance Costs (see Table 4-3) divided by total block hours Col 8: Other Costs (see Table 4-3) divided by total block hours Col 9: Columns 5 + 6 + 7 + 8 Col 10: Columns 4 + 9 Col 11: Total block hours reported on Schedule T-100
4.2.2. Part 121 Passenger and All-Cargo Air Carriers Filing Schedule P-5.1
Cost Per Block Hour
Table 4-8 presents operating cost per block hour data for Part 121 passenger air carriers filing Schedule P-5.1. These carriers report in a different format than the carriers that file Schedule P-5.2. The composition of the “other” category is unknown, so it cannot be classified as either variable or fixed costs. The average total cost per block hour was $3,111, while the variable cost per block hour was $2,525.
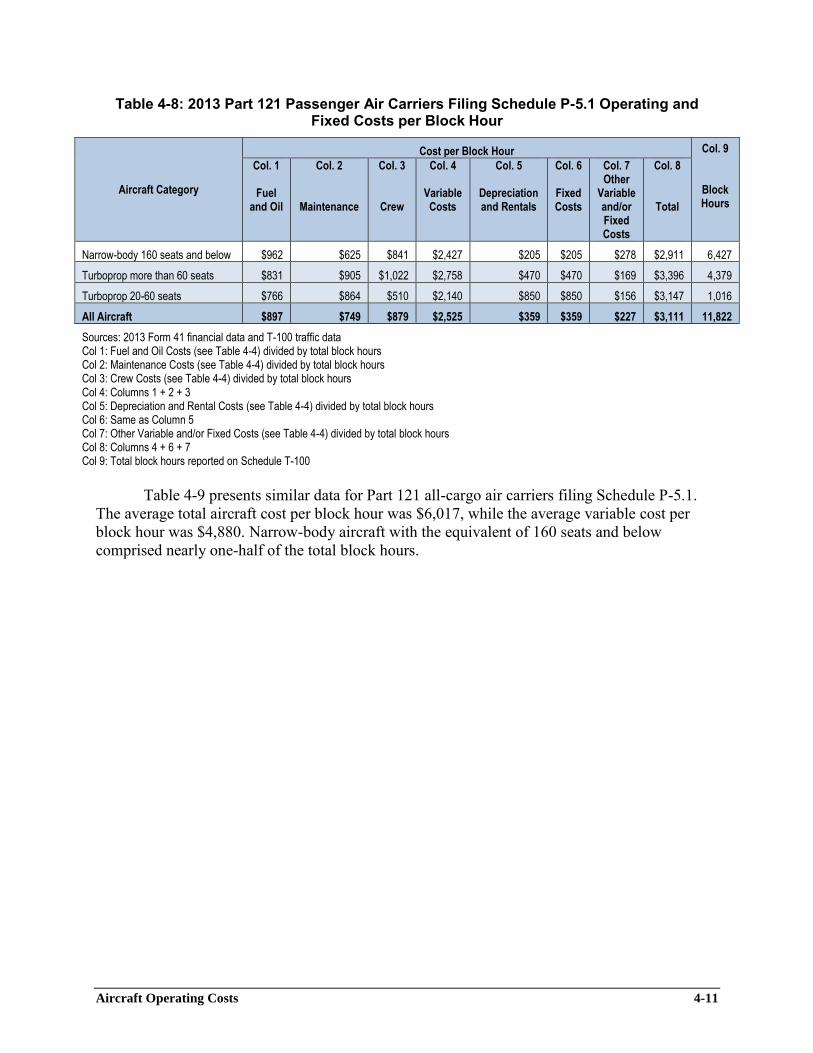
Aircraft Operating Costs 4-11
Table 4-8: 2013 Part 121 Passenger Air Carriers Filing Schedule P-5.1 Operating and Fixed Costs per Block Hour
Aircraft Category
Cost per Block Hour Col. 9
Block Hours
Col. 1
Fuel and Oil
Col. 2
Maintenance
Col. 3
Crew
Col. 4
Variable Costs
Col. 5
Depreciation and Rentals
Col. 6
Fixed Costs
Col. 7 Other
Variable and/or Fixed Costs
Col. 8
Total
Narrow-body 160 seats and below $962 $625 $841 $2,427 $205 $205 $278 $2,911 6,427
Turboprop more than 60 seats $831 $905 $1,022 $2,758 $470 $470 $169 $3,396 4,379
Turboprop 20-60 seats $766 $864 $510 $2,140 $850 $850 $156 $3,147 1,016
All Aircraft $897 $749 $879 $2,525 $359 $359 $227 $3,111 11,822
Sources: 2013 Form 41 financial data and T-100 traffic data Col 1: Fuel and Oil Costs (see Table 4-4) divided by total block hours Col 2: Maintenance Costs (see Table 4-4) divided by total block hours Col 3: Crew Costs (see Table 4-4) divided by total block hours Col 4: Columns 1 + 2 + 3 Col 5: Depreciation and Rental Costs (see Table 4-4) divided by total block hours Col 6: Same as Column 5 Col 7: Other Variable and/or Fixed Costs (see Table 4-4) divided by total block hours Col 8: Columns 4 + 6 + 7 Col 9: Total block hours reported on Schedule T-100
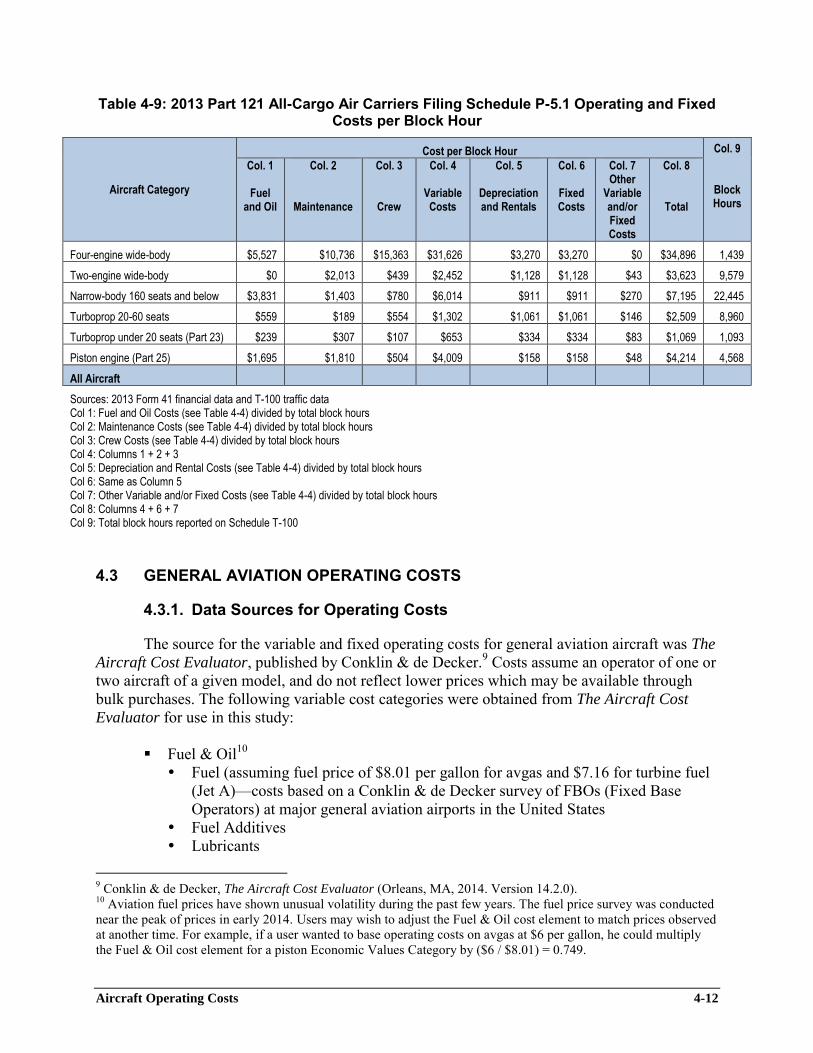
Table 4-9 presents similar data for Part 121 all-cargo air carriers filing Schedule P-5.1.
The average total aircraft cost per block hour was $6,017, while the average variable cost per block hour was $4,880. Narrow-body aircraft with the equivalent of 160 seats and below comprised nearly one-half of the total block hours.
Aircraft Operating Costs 4-12
Table 4-9: 2013 Part 121 All-Cargo Air Carriers Filing Schedule P-5.1 Operating and Fixed Costs per Block Hour
Aircraft Category
Cost per Block Hour Col. 9
Block Hours
Col. 1
Fuel and Oil
Col. 2
Maintenance
Col. 3
Crew
Col. 4
Variable Costs
Col. 5
Depreciation and Rentals
Col. 6
Fixed Costs
Col. 7 Other
Variable and/or Fixed Costs
Col. 8
Total
Four-engine wide-body $5,527 $10,736 $15,363 $31,626 $3,270 $3,270 $0 $34,896 1,439
Two-engine wide-body $0 $2,013 $439 $2,452 $1,128 $1,128 $43 $3,623 9,579
Narrow-body 160 seats and below $3,831 $1,403 $780 $6,014 $911 $911 $270 $7,195 22,445
Turboprop 20-60 seats $559 $189 $554 $1,302 $1,061 $1,061 $146 $2,509 8,960
Turboprop under 20 seats (Part 23) $239 $307 $107 $653 $334 $334 $83 $1,069 1,093
Piston engine (Part 25) $1,695 $1,810 $504 $4,009 $158 $158 $48 $4,214 4,568
All Aircraft
Sources: 2013 Form 41 financial data and T-100 traffic data Col 1: Fuel and Oil Costs (see Table 4-4) divided by total block hours Col 2: Maintenance Costs (see Table 4-4) divided by total block hours Col 3: Crew Costs (see Table 4-4) divided by total block hours Col 4: Columns 1 + 2 + 3 Col 5: Depreciation and Rental Costs (see Table 4-4) divided by total block hours Col 6: Same as Column 5 Col 7: Other Variable and/or Fixed Costs (see Table 4-4) divided by total block hours Col 8: Columns 4 + 6 + 7 Col 9: Total block hours reported on Schedule T-100
4.3 GENERAL AVIATION OPERATING COSTS
4.3.1. Data Sources for Operating Costs
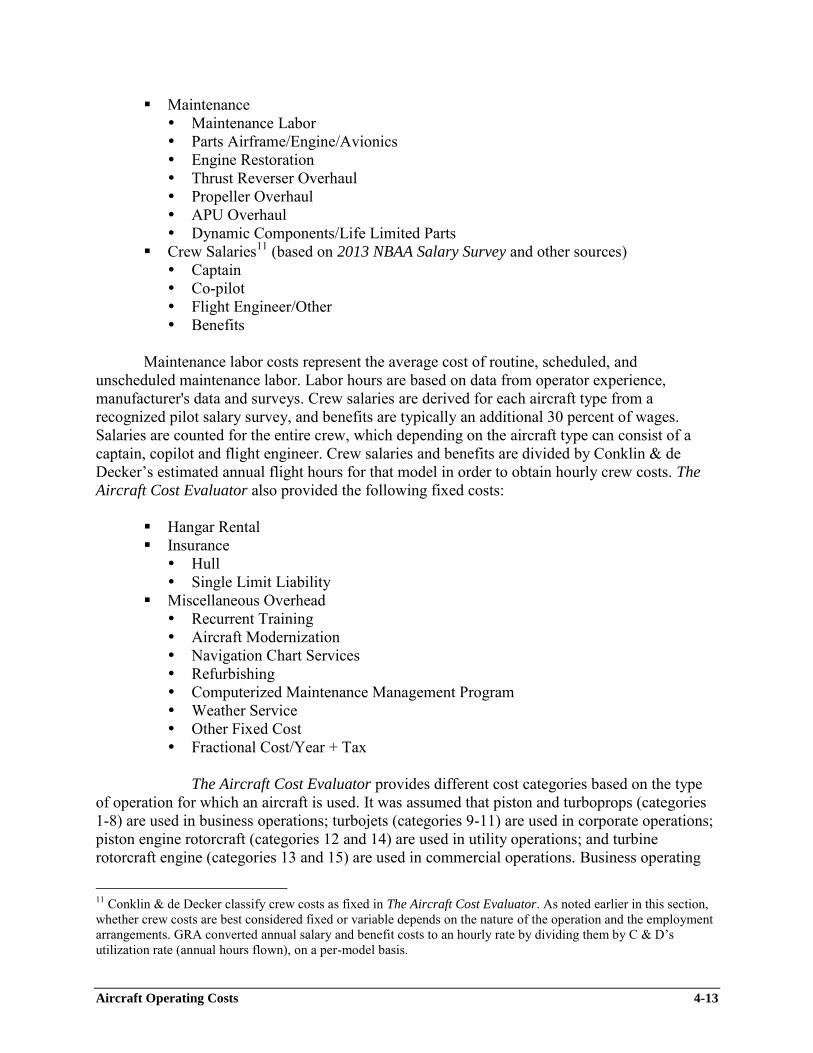
The source for the variable and fixed operating costs for general aviation aircraft was The
Aircraft Cost Evaluator, published by Conklin & de Decker.9 Costs assume an operator of one or two aircraft of a given model, and do not reflect lower prices which may be available through bulk purchases. The following variable cost categories were obtained from The Aircraft Cost
Evaluator for use in this study: Fuel & Oil10
Fuel (assuming fuel price of $8.01 per gallon for avgas and $7.16 for turbine fuel (Jet A)—costs based on a Conklin & de Decker survey of FBOs (Fixed Base Operators) at major general aviation airports in the United States
Fuel Additives Lubricants
9 Conklin & de Decker, The Aircraft Cost Evaluator (Orleans, MA, 2014. Version 14.2.0). 10 Aviation fuel prices have shown unusual volatility during the past few years. The fuel price survey was conducted near the peak of prices in early 2014. Users may wish to adjust the Fuel & Oil cost element to match prices observed at another time. For example, if a user wanted to base operating costs on avgas at $6 per gallon, he could multiply the Fuel & Oil cost element for a piston Economic Values Category by ($6 / $8.01) = 0.749.
Aircraft Operating Costs 4-13
Maintenance Maintenance Labor Parts Airframe/Engine/Avionics Engine Restoration Thrust Reverser Overhaul Propeller Overhaul APU Overhaul Dynamic Components/Life Limited Parts
Crew Salaries11 (based on 2013 NBAA Salary Survey and other sources) Captain Co-pilot Flight Engineer/Other Benefits
Maintenance labor costs represent the average cost of routine, scheduled, and
unscheduled maintenance labor. Labor hours are based on data from operator experience, manufacturer's data and surveys. Crew salaries are derived for each aircraft type from a recognized pilot salary survey, and benefits are typically an additional 30 percent of wages. Salaries are counted for the entire crew, which depending on the aircraft type can consist of a captain, copilot and flight engineer. Crew salaries and benefits are divided by Conklin & de Decker’s estimated annual flight hours for that model in order to obtain hourly crew costs. The
Aircraft Cost Evaluator also provided the following fixed costs:
Hangar Rental Insurance
Hull Single Limit Liability
Miscellaneous Overhead Recurrent Training Aircraft Modernization Navigation Chart Services Refurbishing Computerized Maintenance Management Program Weather Service Other Fixed Cost Fractional Cost/Year + Tax
The Aircraft Cost Evaluator provides different cost categories based on the type
of operation for which an aircraft is used. It was assumed that piston and turboprops (categories 1-8) are used in business operations; turbojets (categories 9-11) are used in corporate operations; piston engine rotorcraft (categories 12 and 14) are used in utility operations; and turbine rotorcraft engine (categories 13 and 15) are used in commercial operations. Business operating
11 Conklin & de Decker classify crew costs as fixed in The Aircraft Cost Evaluator. As noted earlier in this section, whether crew costs are best considered fixed or variable depends on the nature of the operation and the employment arrangements. GRA converted annual salary and benefit costs to an hourly rate by dividing them by C & D’s utilization rate (annual hours flown), on a per-model basis.
Aircraft Operating Costs 4-14
costs from Conklin & de Decker assume that the aircraft is owner-flown and therefore no crew salaries are included as costs. However, for the purposes of economic analysis, the costs of pilot’s time should be considered.
All piston engine and turboprop airplanes for which air taxi hours are a small percentage
of total hours flown (i.e., all piston and turboprop airplanes with fewer than 10 seats—see Table 3-13) use an hourly crew cost equal to the value of Intercity Business air travel time, or $60.0012 per hour. Air taxi hours are also a small percentage of total hours flown for piston rotorcraft. Therefore, it was assumed that the crew cost per hour equals the value of time ($60.00).
4.3.2. Depreciation
In order to reflect general aviation aircraft ownership costs, estimates based on replacement costs were developed for this report. Depreciation is a significant component of the fixed costs for general aviation aircraft. In this report we use Conklin & de Decker’s market-based depreciation values, which assume that aircraft lose a fixed percentage of their original purchase price each year, with no residual value. The percentage used varies by aircraft type, as follows:
Jets: 4% Rotorcraft: 5% Turboprops and Pistons: 6% Table 4-10 summarizes general aviation aircraft operating cost per flight hour by each of
the economic values categories. While the average total cost per hour is about $1,600, it ranges from about $300 per hour to over $10,000 per hour, depending on the size, complexity and age of the aircraft within each group. Average variable costs per hour including flight crews are $1,098, while they are $903 per hour if crew costs are not counted.
12 DOT, Office of Economic and Strategic Analysis, Revised Departmental Guidance on Valuation of Travel Time
in Economic Analysis (Washington, DC, July 9, 2014).
Aircraft Operating Costs 4-15
Table 4-10: GA and Air Taxi Operating and Fixed Costs (Weighted by Annual Hours)
Aircraft Category Certification
Col. 1
Crew
Col. 2
Fuel & Oil
Col. 3
Maintenance
Col. 4 Variable
Operating Costs
(Including Crew)
Col. 5 Variable
Operating Costs
(Excluding Crew)
Col. 6 Annual
Fixed Cost Other
(Without Depreciation)
Col. 7
Annual Depreciation
Col. 8
Fixed Cost Per
Hour
Col. 9 Total Cost
Per Hour (Including
Crew)
Col. 10
Average Annual Hours
Piston engine airplanes 1-3 seats
Part 23 $60 $80 $46 $187 $127 $14,955 $11,944 $119 $306 226
Piston engine airplanes 4-9 seats one-engine
Part 23 $60 $119 $79 $258 $198 $19,567 $16,785 $223 $481 168
Piston engine airplanes 4-9 seats multi-engine
Part 23 $60 $302 $189 $551 $491 $31,022 $27,390 $454 $1,005 128
Piston engine airplanes 10 or more seats
Part 23 $86 $401 $336 $822 $737 $60,623 $39,625 $338 $1,161 372
Turboprop airplanes 1-9 seats one-engine
Part 23 $60 $217 $161 $438 $378 $37,975 $64,132 $393 $831 262
Turboprop airplanes 1-9 seats multi-engine
Part 23 $60 $699 $651 $1,410 $1,350 $87,391 $45,257 $295 $1,704 466
Turboprop airplanes 10-19 seats
Part 23 $208 $635 $508 $1,350 $1,143 $92,076 $106,729 $380 $1,731 556
Turboprop airplanes 20 or more seats
Part 25 $489 $840 $673 $2,003 $1,514 $117,661 $110,373 $556 $2,559 392
Turbojet/turbofan airplanes <= 12,500 lbs.
Part 23/25 $308 $875 $589 $1,772 $1,464 $111,926 $104,030 $409 $2,181 531
Turbojet/turbofan airplanes > 12,500 lbs. and <= 65,000 lbs.
Part 25 $648 $1,9
06 $1,099 $3,652 $3,004 $213,268 $365,300 $1,374 $5,026 428
Turbojet/turbofan airplanes > 65,000 lbs.
Part 25 $1,048 $3,8
38 $1,833 $6,719 $5,671 $461,702 $1,132,583 $3,818 $10,536 417
Rotorcraft piston <= 6,000 lbs.
Part 27 $60 $114 $157 $331 $271 $42,404 $18,002 $124 $455 498
Rotorcraft turbine <= 6,000 lbs.
Part 27 $211 $315 $393 $920 $709 $155,799 $110,479 $604 $1,524 447
Rotorcraft piston > 6,000 lbs.
Part 29 NR NR NR NR NR NR NR NR NR NR
Rotorcraft turbine > 6,000 lbs.
Part 29 $224 $558 $786 $1,568 $1,344 $198,658 $144,365 $782 $2,350 462
Other
NR NR NR NR NR NR NR NR NR NR
Experimental
NR NR NR NR NR NR NR NR NR NR
Light Sport
NR NR NR NR NR NR NR NR NR NR
All Aircraft--Weighted Averages $194 $547 $357 $1,098 $903 $80,767 $113,741 $542 $1,639 289
Sources: GRA analysis of responses to the FAA's General Aviation and Part 135 Activity Survey CY2013, Conklin & de Decker's Aircraft Cost Evaluator (v14.2.0, 2014). NR = Not Reported Col 1: Crew: for Categories 1-3, 5-6 and 12, crew cost = value of time = $60; for other categories, crew cost includes salaries and benefits, divided by annual utilization hours, as reported by Conklin and deDecker Col 2: Fuel, oil and additives used per hour, with fuel at $8.01 per gallon for pistons and $7.16 per gallon for all other economic values groups Col 3: Total Maintenance cost, including labor, parts, engine allowances, propeller/thrust reverser overhaul, and APU overhaul if applicable Col 4: Columns 1 + 2 + 3 Col 5: Columns 2 + 3 Col 6: Annual fixed cost including hangar cost, insurance cost, training cost, services typically used by air taxi and commercial operators (e.g., Weather service, maintenance programs, etc.) Col 7: Average annual aircraft depreciation using Conklin and de Decker Market depreciation rates: 4% annually for turbojet/turbofan, 5% annually for rotorcraft and 6% annually for piston and turboprop Col 8: Fixed Cost per hour, assuming hours of utilization reported in Column 10 = (Column 6 + Column 7)/Column 10 Col 9: Total Cost per Hour: Column 4 + Column 8 Col 10: Average (weighted) annual hours of utilization for each Category
Aircraft Operating Costs 4-16
Table 4-11 shows variable and total aircraft operating costs for aircraft under the various parts of the operating regulations. Among Economic Values Categories, Part 125 aircraft have the highest total cost per hour ($8,370) because they are much larger than the aircraft in other groups. Part 91 costs per hour ($1,234) are a little less than one-half of the costs per flight hour ($2,680) for Part 135 aircraft operations.
Calculation of costs by operating rule part
For each aircraft, multiply its operating cost elements (Columns 1, 2, 3, 6, 7 and 10 in
Table 4-10) by the number of hours it operated under uses corresponding to each of the operating rule parts.
Sum these products by Economic Values Category, producing a single value for each cost element, for each operating rule part.
Divide these sums by the total hours flown by aircraft in that Economic Values Category under that operating rule part.
That is, for each operating rule part, the mean of a cost element is calculated reflecting only the hours flown under that rule part, not all hours flown by all aircraft. If flights under an operating rule part are conducted disproportionately by aircraft with higher operating costs within an Economic Values Category, the costs under that rule part in Table 4-11 will be higher than the overall costs for that Category shown in Table 4-10.
Aircraft Operating Costs 4-17
Table 4-11: GA Operating and Fixed Costs by Operating Rule Part (Weighted by Part Hours)
Aircraft Category Certification
PART 91 PART 125 PART 133 PART 135 PART 137
Col. 1 Variable
Operating Costs
(Including Crew)
Col. 2 Total Cost
Per Hour (Including
Crew)
Col. 1 Variable
Operating Costs
(Including Crew)
Col. 2 Total Cost
Per Hour (Including
Crew)
Col. 1 Variable
Operating Costs
(Including Crew)
Col. 2 Total Cost
Per Hour (Including
Crew)
Col. 1 Variable
Operating Costs
(Including Crew)
Col. 2 Total Cost
Per Hour (Including
Crew)
Col. 1 Variable
Operating Costs
(Including Crew)
Col. 2 Total Cost
Per Hour (Including
Crew)
Piston engine airplanes 1-3 seats
Part 23 $186 $305 NR NR NR NR $188 $309 $186 $305
Piston engine airplanes 4-9 seats one-engine
Part 23 $257 $481 NR NR NR NR $276 $493 $273 $491
Piston engine airplanes 4-9 seats multi-engine
Part 23 $534 $991 NR NR NR NR $622 $1,068 $645 $997
Piston engine airplanes 10 or more seats
Part 23 $899 $1,355 NR NR NR NR $811 $1,131 $804 $1,120
Turboprop airplanes 1-9 seats one-engine
Part 23 $440 $834 NR NR NR NR $387 $754 $282 $617
Turboprop airplanes 1-9 seats multi-engine
Part 23 $1,398 $1,689 NR NR NR NR $1,461 $1,729 $1,537 $2,148
Turboprop airplanes 10-19 seats
Part 23 $1,427 $1,855 NR NR NR NR $1,245 $1,575 $1,284 $1,576
Turboprop airplanes 20 or more seats
Part 25 $1,684 $2,192 $2,801 $3,663 NR NR $1,908 $2,426 $2,289 $2,720
Turbojet/turbofan airplanes <= 12,500 lbs.
Part 23/25 $1,787 $2,193 NR NR NR NR $1,707 $2,128 $1,958 $2,393
Turbojet/turbofan airplanes > 12,500 lbs. and <= 65,000 lbs.
Part 25 $3,517 $4,801 $4,812 $7,226 NR NR $3,671 $4,990 $4,705 $5,780
Turbojet/turbofan airplanes > 65,000 lbs.
Part 25 $6,382 $11,811 $6,956 $10,013 NR NR $6,627 $9,965 $7,521 $11,349
Rotorcraft piston <= 6,000 lbs.
Part 27 $325 $448 NR NR $369 $520 $364 $511 $406 $502
Rotorcraft turbine <= 6,000 lbs.
Part 27 $908 $1,493 NR NR $891 $1,437 $941 $1,579 $861 $1,365
Rotorcraft piston > 6,000 lbs.
Part 29 NR NR NR NR NR NR NR NR NR NR
Rotorcraft turbine > 6,000 lbs.
Part 29 $1,518 $2,211 NR NR $1,751 $2,356 $1,565 $2,532 $1,694 $2,228
Other
NR NR NR NR NR NR NR NR NR NR
Experimental
NR NR NR NR NR NR NR NR NR NR
Light Sport
NR NR NR NR NR NR NR NR NR NR
All Aircraft--Weighted Average Cost per Hour
$808 $1,234 $5,741 $8,370 $1,096 $1,648 $1,877 $2,680 $461 $767
Sources: GRA analysis of responses to FAA's General Aviation and Part 135 Activity Survey CY2013, Conklin & de Decker's Aircraft Cost Evaluator (v14.2.0, 2014) NR = Not Reported Col 1: Variable operating costs include crew, fuel and oil, and maintenance costs Col 2: Total costs per hour include variable costs (Col 1) and fixed costs
Aircraft Operating Costs 4-18
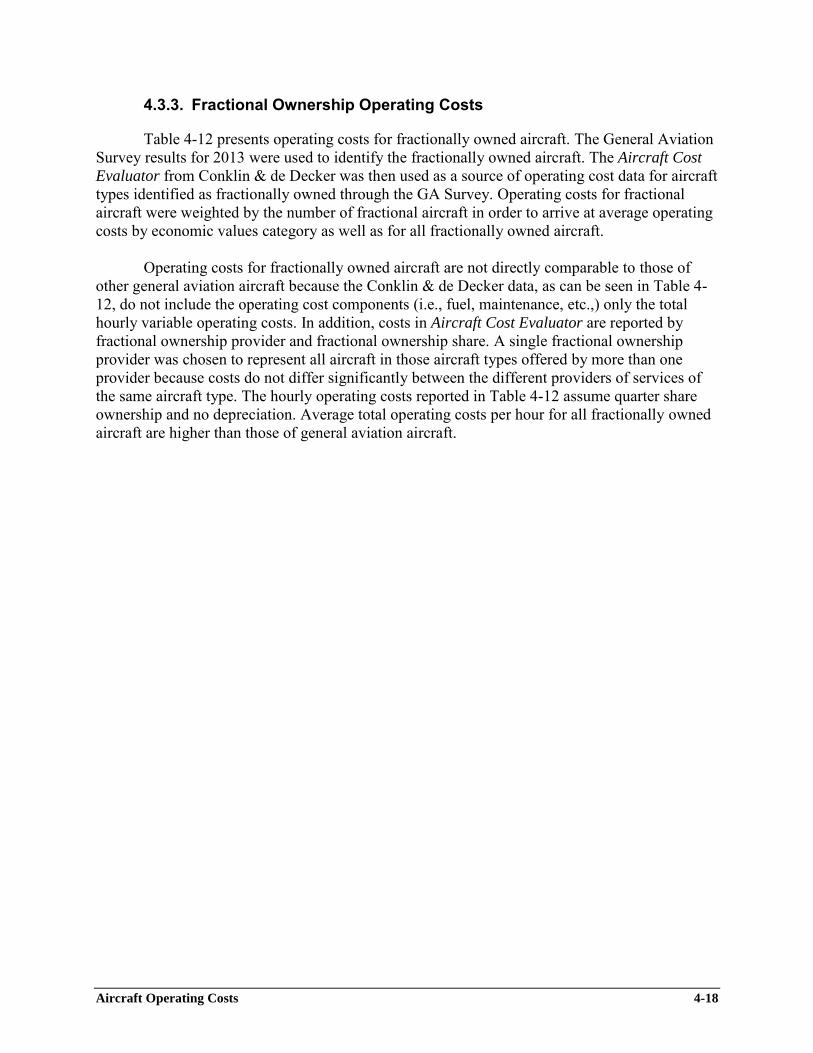
4.3.3. Fractional Ownership Operating Costs
Table 4-12 presents operating costs for fractionally owned aircraft. The General Aviation Survey results for 2013 were used to identify the fractionally owned aircraft. The Aircraft Cost
Evaluator from Conklin & de Decker was then used as a source of operating cost data for aircraft types identified as fractionally owned through the GA Survey. Operating costs for fractional aircraft were weighted by the number of fractional aircraft in order to arrive at average operating costs by economic values category as well as for all fractionally owned aircraft.
Operating costs for fractionally owned aircraft are not directly comparable to those of
other general aviation aircraft because the Conklin & de Decker data, as can be seen in Table 4-12, do not include the operating cost components (i.e., fuel, maintenance, etc.,) only the total hourly variable operating costs. In addition, costs in Aircraft Cost Evaluator are reported by fractional ownership provider and fractional ownership share. A single fractional ownership provider was chosen to represent all aircraft in those aircraft types offered by more than one provider because costs do not differ significantly between the different providers of services of the same aircraft type. The hourly operating costs reported in Table 4-12 assume quarter share ownership and no depreciation. Average total operating costs per hour for all fractionally owned aircraft are higher than those of general aviation aircraft.
Aircraft Operating Costs 4-19
Table 4-12: Fractional Ownership Costs (Average Weighted by the Number of Aircraft)
Aircraft Category
Col. 1
Total Aircraft
Col. 2
Quarter Share
Acquisition
Col. 3
Fixed Annual Budget
Col. 4
Fixed Cost Per
Hour
Col. 5 Hourly
Variable Operating
Cost + Tax
Col. 6
Total Operating
Cost Per Hour
Col. 7
Contract Block Hours
Per Year
Piston engine airplanes 1-3 seats
N/A N/A N/A N/A N/A N/A N/A
Piston engine airplanes 4-9 seats one-engine
N/A N/A N/A N/A N/A N/A N/A
Piston engine airplanes 4-9 seats multi-engine
N/A N/A N/A N/A N/A N/A N/A
Piston engine airplanes 10 or more seats
N/A N/A N/A N/A N/A N/A N/A
Turboprop airplanes 1-9 seats one-engine
5 N/A N/A N/A N/A N/A N/A
Turboprop airplanes 1-9 seats multi-engine
18 N/A N/A N/A N/A N/A N/A
Turboprop airplanes 10-19 seats
110 $1,236,000 $222,480 $1,112 $1,106 $2,218 200
Turboprop airplanes 20 or more seats
N/A N/A N/A N/A N/A N/A N/A
Turbojet/turbofan airplanes <= 12,500 lbs.
48 N/A N/A N/A N/A N/A N/A
Turbojet/turbofan airplanes > 12,500 lbs. and <= 65,000 lbs.
774 $2,685,589 $535,997 $2,680 $4,021 $6,701 200
Turbojet/turbofan airplanes > 65,000 lbs.
117 $11,500,000 $882,816 $4,414 $6,962 $11,376 200
Rotorcraft piston <= 6,000 lbs.
N/A N/A N/A N/A N/A N/A N/A
Rotorcraft turbine <= 6,000 lbs.
49 N/A N/A N/A N/A N/A N/A
Rotorcraft piston > 6,000 lbs.
N/A N/A N/A N/A N/A N/A N/A
Rotorcraft turbine > 6,000 lbs.
N/A $2,065,000 $648,000 $6,480 $2,263 $8,743 100
Other N/A N/A N/A N/A N/A N/A N/A
Experimental 2 N/A N/A N/A N/A N/A N/A
Light Sport N/A N/A N/A N/A N/A N/A N/A
Evaluated Aircraft--Weighted Average per Aircraft
1,001 $3,558,243 $542,237 $2,711 $4,046 $6,757 200
Total Fractional Aircraft 1,122 N/A N/A N/A N/A N/A N/A
Sources: Aircraft types and counts come from FAA's General Aviation and Part 135 Activity Survey CY2013, fractional ownership costs come from Conklin & de Decker's Aircraft Cost Evaluator (v14.2.0 2014). Col 1: Total number of fractionally owned aircraft by economic values category, as reported in GA Survey Col 2: Quarter share acquisition, from Conklin & deDecker Col 3: Fixed annual cost, does not include depreciation, Conklin & deDecker Col 4: Fixed costs per hour: column 3 divided by column 7 Col 5: Variable hourly operating cost with tax, Conklin & deDecker. Does not include any applicable fuel cost adjustment (FCA) imposed by fractional provider Col 6: Total operating costs per hour: column 4 plus column 5 Col 7: Contract block hours as reported by Conklin & deDecker

Aircraft Operating Costs 4-20
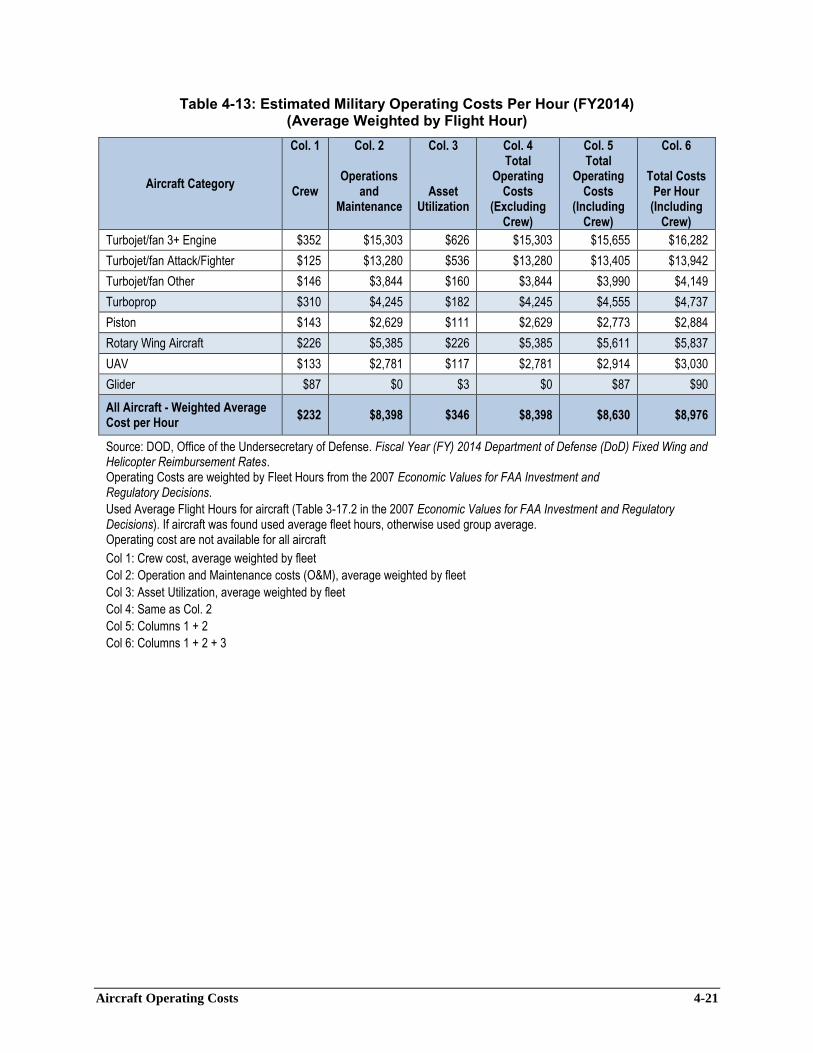
4.4 MILITARY OPERATING COSTS
Data on military aircraft operating costs were developed in consultation with the various branches of the armed services. Available data were obtained both from public websites as well as telephone interviews with appropriate DOD and FAA personnel. In general, the values were applied on an aircraft-type-by-aircraft type basis where there were cost observations from at least one military air service. In cases where there were no observed costs for a specific aircraft type, the group average was applied. In the table below, the average weighted total is based on the hourly weighted operating costs of each aircraft type.
The cost data were taken from data on aircraft reimbursement rates for various types of
aircraft.13 Reimbursement rates are reported for four categories of users: DOD, Federal Agency, Foreign Military Sales Users, and All Other Users. This report uses the all other category because it is the most complete cost metric. The aircraft operating costs include crews and reflect the varying sizes of crews for a specific aircraft. For example, most military rotary wing aircraft operate with a pilot, co-pilot and one or two other crew members. Some of the larger turbojet aircraft with three or more engines conduct electronic surveillance operations and have large on-board crews. The crew costs reported in Table 4-13 reflect this. In addition to crew cost, the reimbursement costs include operations and maintenance costs and an asset utilization factor.14 The asset utilization factor includes an allocation of healthcare costs for military personnel.
DOD does not include an element of ownership costs in the reimbursement rates. Asset
valuation for DOD aircraft is extremely complex because the assets are long lived and have had many major upgrades over the useful life. For example the Boeing B-52 has been in operation by the military service since 1954, approximately 60 years. It has had upgrades to its engines, avionics, weapons systems and offensive and defensive electronic systems.15 Aircraft replacement costs are described in Section 5.
13 DOD, Office of the Undersecretary of Defense, Fiscal Year (FY) 2014 Department of Defense (DoD) Fixed Wing
and Helicopter Reimbursement Rates. Accessed February 12, 2015, http://comptroller.defense.gov/Portals/45/documents/rates/fy2014/2014_f_h.pdf; DOD, Office of the Undersecretary of Defense, Comptroller, “Collections for Reimbursements of DoD-Owned Aircraft (Rotary Wing),” in Financial
Management Regulation, Volume 11A: Reimbursable Operations Policy. DoD 7000.14-R, Chapter 6, Appendix G. Accessed February 12, 2015, http://comptroller.defense.gov/Portals/45/documents/fmr/Volume_11a.pdf. 14 The asset utilization factor is 4 percent times the sum of costs for: fuel, depot level repairables, depot maintenance, other and crew salary for each specific aircraft. 15 Boeing B-52. Accessed March 23, 2015, http://www.boeing.com/defense/b-52-bomber/.
Aircraft Operating Costs 4-21
Table 4-13: Estimated Military Operating Costs Per Hour (FY2014) (Average Weighted by Flight Hour)
Aircraft Category
Col. 1
Crew
Col. 2
Operations and
Maintenance
Col. 3
Asset Utilization
Col. 4 Total
Operating Costs
(Excluding Crew)
Col. 5 Total
Operating Costs
(Including Crew)
Col. 6
Total Costs Per Hour
(Including Crew)
Turbojet/fan 3+ Engine $352 $15,303 $626 $15,303 $15,655 $16,282
Turbojet/fan Attack/Fighter $125 $13,280 $536 $13,280 $13,405 $13,942
Turbojet/fan Other $146 $3,844 $160 $3,844 $3,990 $4,149
Turboprop $310 $4,245 $182 $4,245 $4,555 $4,737
Piston $143 $2,629 $111 $2,629 $2,773 $2,884
Rotary Wing Aircraft $226 $5,385 $226 $5,385 $5,611 $5,837
UAV $133 $2,781 $117 $2,781 $2,914 $3,030
Glider $87 $0 $3 $0 $87 $90
All Aircraft - Weighted Average Cost per Hour
$232 $8,398 $346 $8,398 $8,630 $8,976
Source: DOD, Office of the Undersecretary of Defense. Fiscal Year (FY) 2014 Department of Defense (DoD) Fixed Wing and Helicopter Reimbursement Rates. Operating Costs are weighted by Fleet Hours from the 2007 Economic Values for FAA Investment and Regulatory Decisions.
Used Average Flight Hours for aircraft (Table 3-17.2 in the 2007 Economic Values for FAA Investment and Regulatory Decisions). If aircraft was found used average fleet hours, otherwise used group average. Operating cost are not available for all aircraft
Col 1: Crew cost, average weighted by fleet
Col 2: Operation and Maintenance costs (O&M), average weighted by fleet
Col 3: Asset Utilization, average weighted by fleet
Col 4: Same as Col. 2
Col 5: Columns 1 + 2
Col 6: Columns 1 + 2 + 3