Embed Size (px)
Citation preview
Tehran, 20‐23 February 2017
Airline Operating Costs and Productivity
2
Airline Economics: Costs and Productivity
1. Airline Operating Costs• DOT Form 41 Data• Objective vs. Functional Cost Categories• Percentage Break Down of Operating Expenses
2. Functional Operating Expense Comparisons• Flight Operating Costs• Example: B-757 Operating Costs• Cost comparisons across aircraft types
3. Airline Cost and Productivity Comparisons• Unit Costs per ASM• Aircraft and Employee Productivity
3
1. Airline Operating Costs
• DOT Form 41 traffic, financial, and operating cost data reported to the DOT by US Major airlines– Data is reported and published quarterly for most tables– Detail of reporting differs for different expense categories
• Aircraft operating expenses by aircraft type and region of operation• Other expenses more difficult to allocate by aircraft type
• DOT Form 41 includes the following schedules:– P12 : Profit and Loss statement – P52 : Aircraft Operating Expenses– P6 : Operating Expenses by Objective Groupings– P7 : Operating Expenses by Functional Groupings– P10 : Employment Statistics– B1 : Balance Sheet
4
Objective Cost Categories
• Salaries and related fringe benefits– General management, flight personnel, maintenance labor, aircraft & traffic handling
personnel, other personnel• Materials purchased
– Aircraft fuel & oil, maintenance materials, passenger food, other materials• Services purchased
– Advertising & promotions, communications, insurance, outside maintenance, commissions, other services
• Separate categories for:– Landing fees, rentals (including aircraft), depreciation (including aircraft), other expenses
5
Functional Cost Categories
• Aircraft operating costs– Expenses associated with flying aircraft, also referred to as “Direct Operating Costs” (DOC)
• Aircraft servicing costs– Handling aircraft on the ground, includes landing fees
• Traffic service costs– Processing passengers, baggage and cargo at airports
• Passenger service costs– Meals, flight attendants, in-flight services
• Reservation and Sales costs– Airline reservations and ticket offices, travel agency commissions
• Other costs, including:– Advertising and publicity expense– General and administrative expense
6
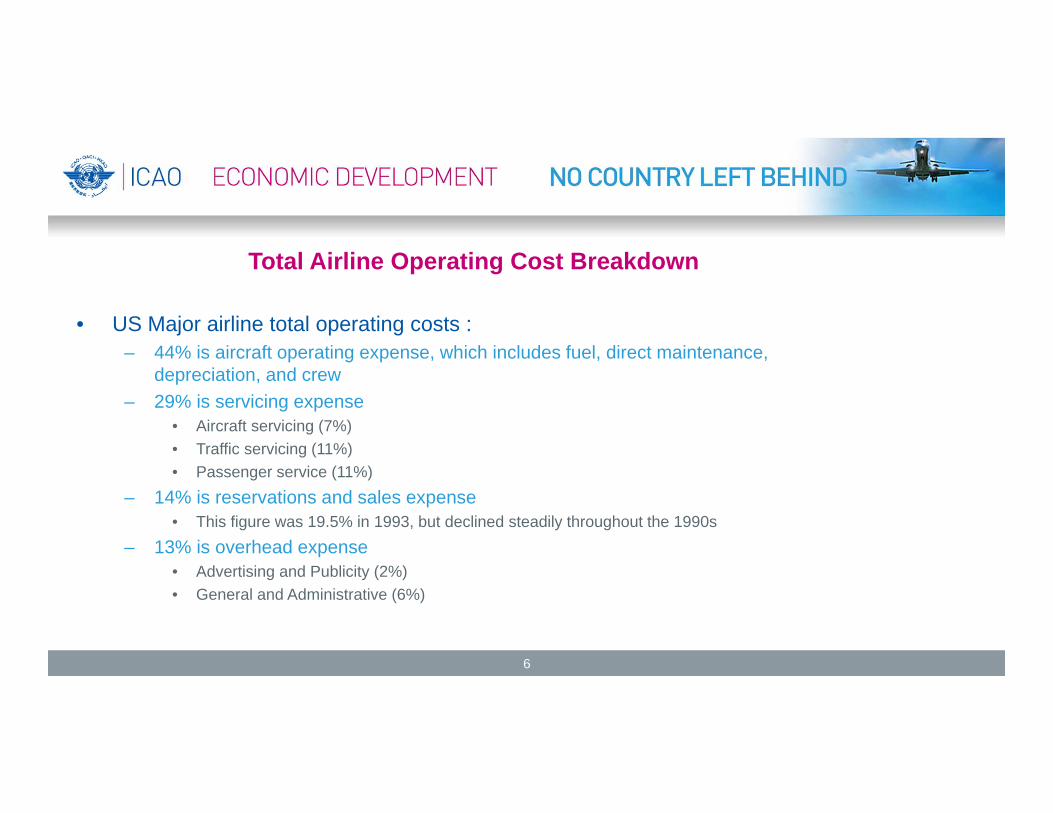
Total Airline Operating Cost Breakdown
• US Major airline total operating costs :– 44% is aircraft operating expense, which includes fuel, direct maintenance,
depreciation, and crew– 29% is servicing expense
• Aircraft servicing (7%)• Traffic servicing (11%)• Passenger service (11%)
– 14% is reservations and sales expense• This figure was 19.5% in 1993, but declined steadily throughout the 1990s
– 13% is overhead expense• Advertising and Publicity (2%)• General and Administrative (6%)
7
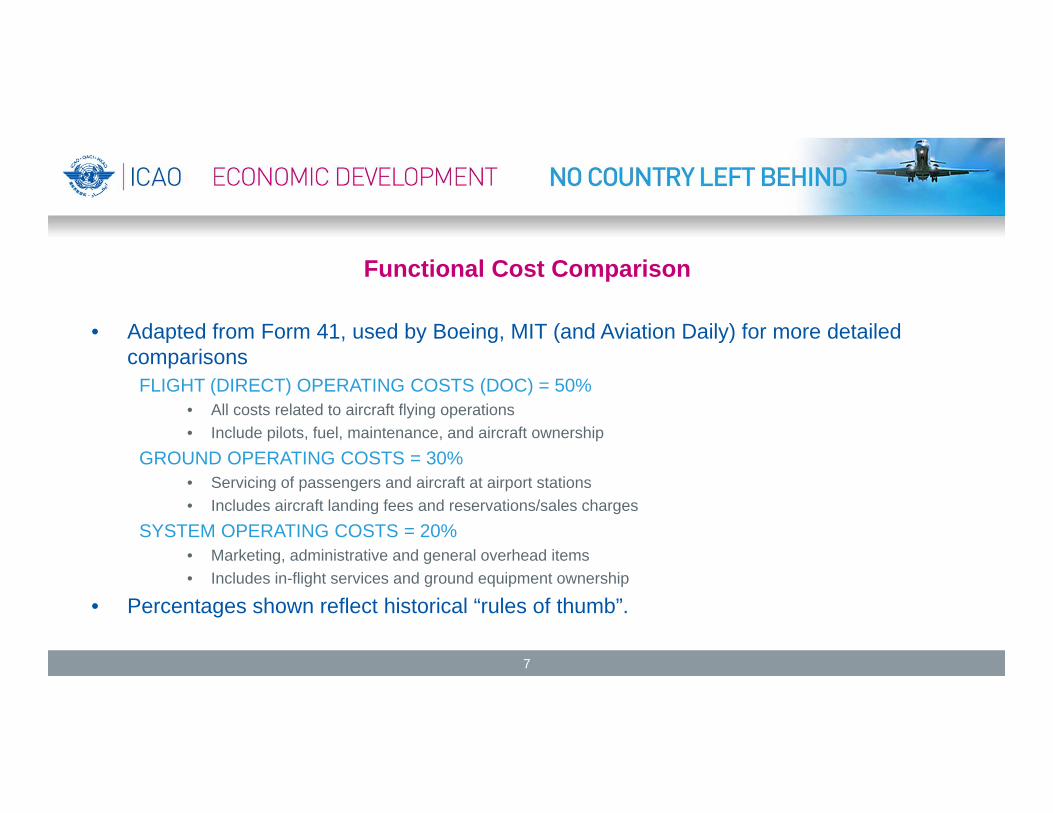
Functional Cost Comparison
• Adapted from Form 41, used by Boeing, MIT (and Aviation Daily) for more detailed comparisons
FLIGHT (DIRECT) OPERATING COSTS (DOC) = 50%• All costs related to aircraft flying operations• Include pilots, fuel, maintenance, and aircraft ownership
GROUND OPERATING COSTS = 30%• Servicing of passengers and aircraft at airport stations• Includes aircraft landing fees and reservations/sales charges
SYSTEM OPERATING COSTS = 20%• Marketing, administrative and general overhead items• Includes in-flight services and ground equipment ownership
• Percentages shown reflect historical “rules of thumb”.

8
Activity Drivers per Functional Category
• Aircraft Operating Costs– Per Block Hour (for example, $2550 for 185-seat B757-200)
• Aircraft Servicing Costs– Per Aircraft Departure (average $800)
• Traffic Servicing Costs– Per Enplaned Passenger (average $15)
• Passenger Servicing Costs– Per RPM (average $0.015)
• Reservations and Sales Costs– % of Total Revenue (average 14%)
• Other Indirect and System Overhead Costs– % of Total Operating Expense (average 13%)

9
Flight Operating Costs
• Flight operating costs (FOC) by aircraft type:– Reflect an average allocation of system-wide costs per block hour, as reported by airlines for
each aircraft type– Can be affected by specific airline network or operational patterns– Collected by US DOT as Form 41 operating data from airlines
• Typical breakdown of FOC for US carrier:CREW: Pilot wages and benefitsFUEL: Easiest to allocate and most clearly variable costMAINTENANCE: Direct airframe and engine maintenance cost, plus “burden” or overhead (hangars
and spare parts inventory)OWNERSHIP: Depreciation, leasing costs and insurance
10
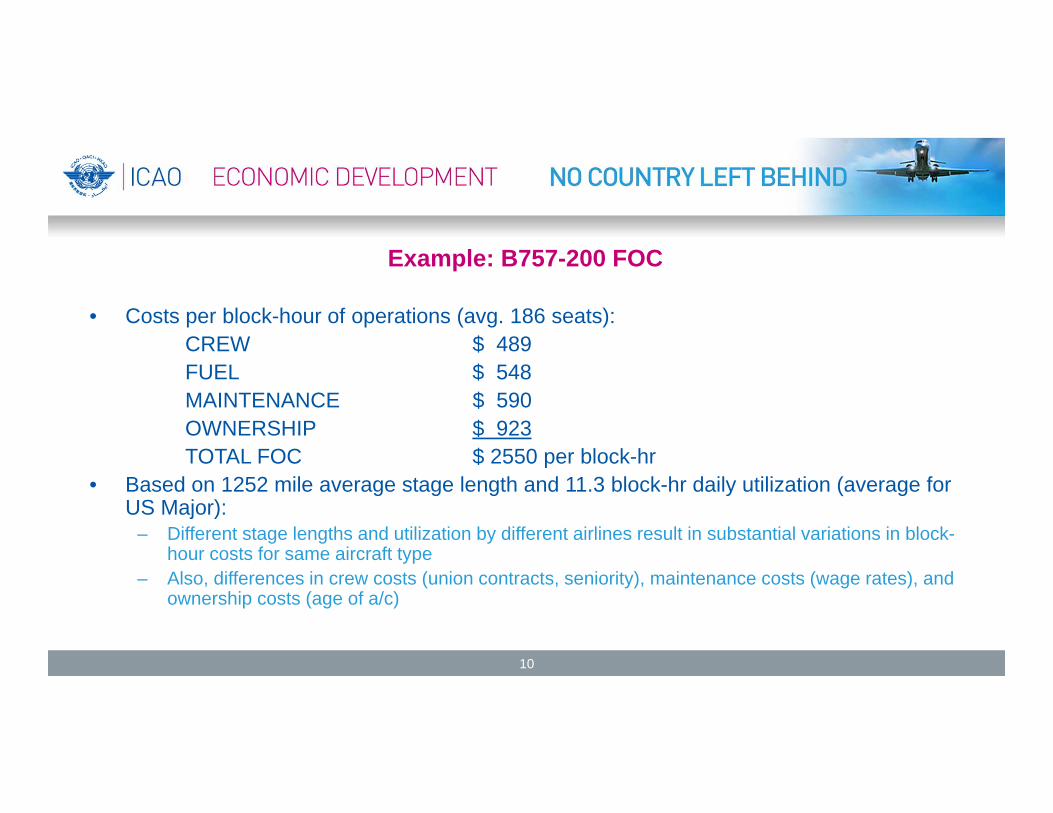
Example: B757-200 FOC
• Costs per block-hour of operations (avg. 186 seats):CREW $ 489FUEL $ 548MAINTENANCE $ 590OWNERSHIP $ 923TOTAL FOC $ 2550 per block-hr
• Based on 1252 mile average stage length and 11.3 block-hr daily utilization (average for US Major):
– Different stage lengths and utilization by different airlines result in substantial variations in block-hour costs for same aircraft type
– Also, differences in crew costs (union contracts, seniority), maintenance costs (wage rates), and ownership costs (age of a/c)
11
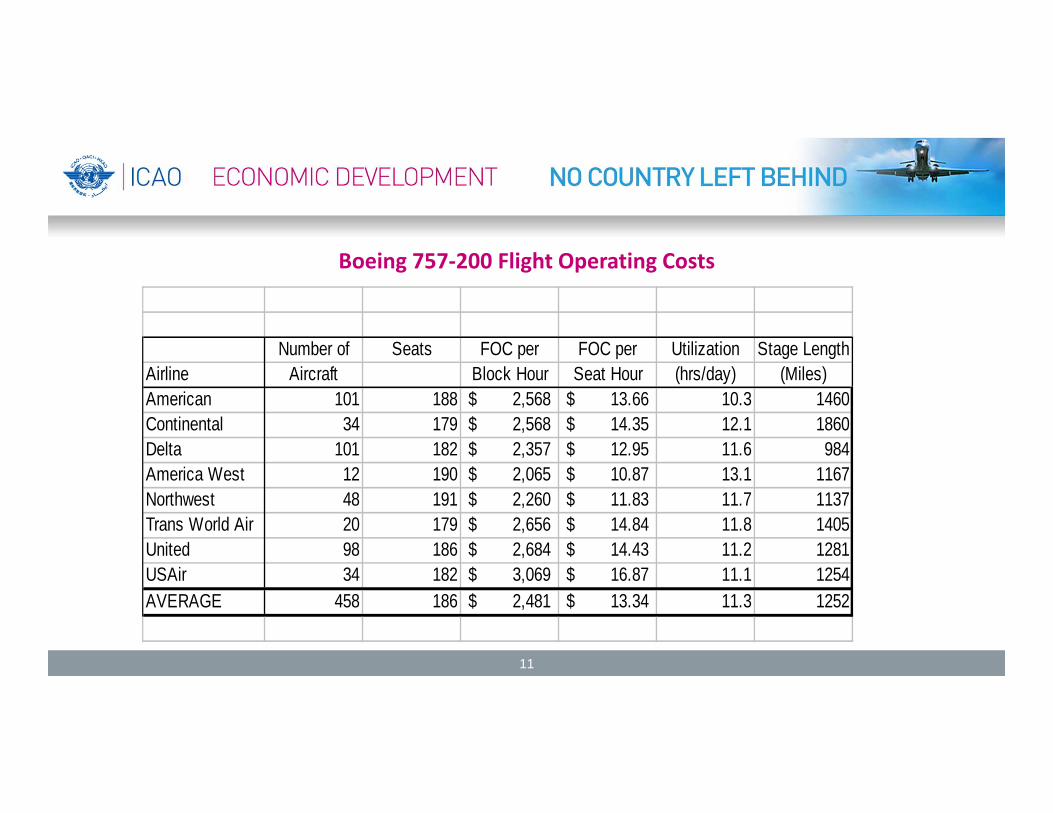
Number of Seats FOC per FOC per Utilization Stage LengthAirline Aircraft Block Hour Seat Hour (hrs/day) (Miles)American 101 188 2,568$ 13.66$ 10.3 1460Continental 34 179 2,568$ 14.35$ 12.1 1860Delta 101 182 2,357$ 12.95$ 11.6 984America West 12 190 2,065$ 10.87$ 13.1 1167Northwest 48 191 2,260$ 11.83$ 11.7 1137Trans World Air 20 179 2,656$ 14.84$ 11.8 1405United 98 186 2,684$ 14.43$ 11.2 1281USAir 34 182 3,069$ 16.87$ 11.1 1254AVERAGE 458 186 2,481$ 13.34$ 11.3 1252
Boeing 757‐200 Flight Operating Costs
12
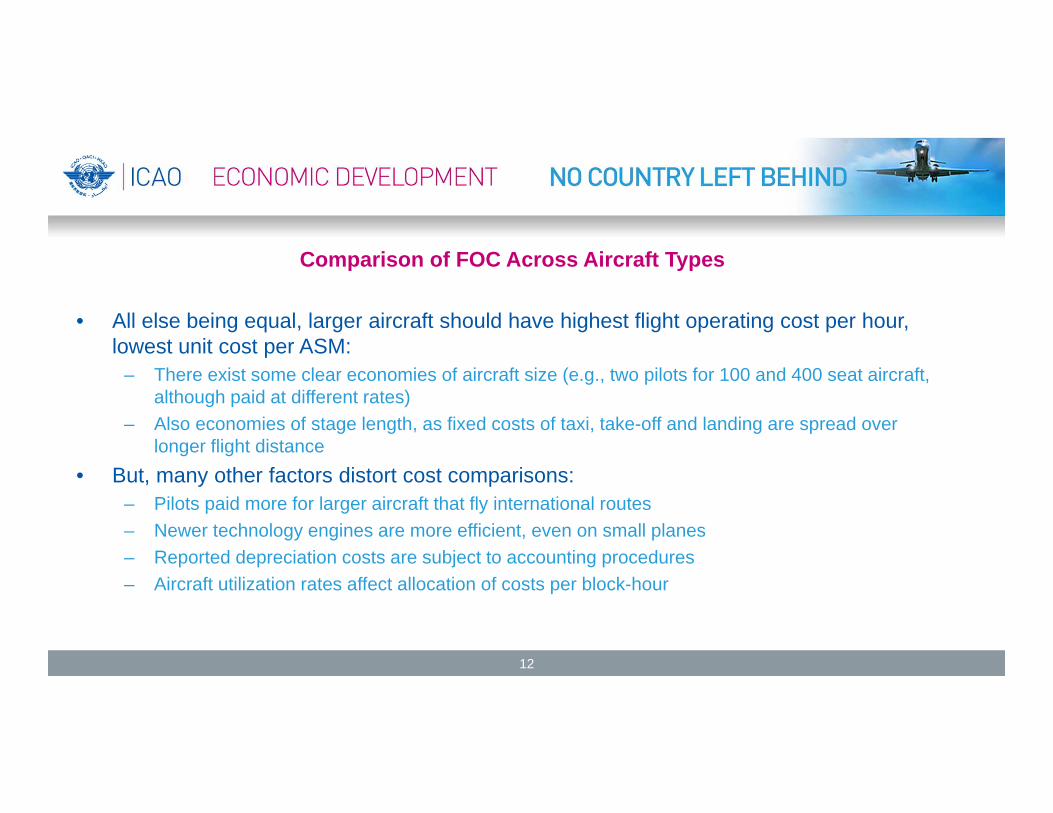
Comparison of FOC Across Aircraft Types
• All else being equal, larger aircraft should have highest flight operating cost per hour, lowest unit cost per ASM:
– There exist some clear economies of aircraft size (e.g., two pilots for 100 and 400 seat aircraft, although paid at different rates)
– Also economies of stage length, as fixed costs of taxi, take-off and landing are spread over longer flight distance
• But, many other factors distort cost comparisons:– Pilots paid more for larger aircraft that fly international routes– Newer technology engines are more efficient, even on small planes– Reported depreciation costs are subject to accounting procedures– Aircraft utilization rates affect allocation of costs per block-hour
13
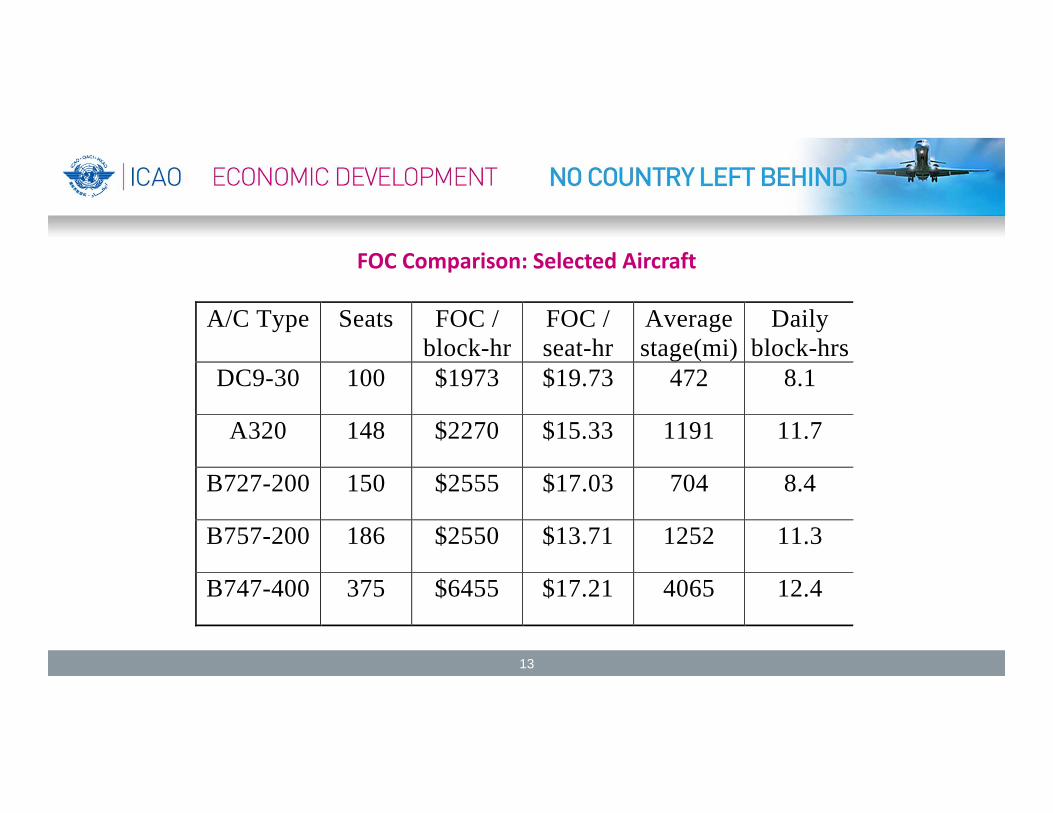
A/C Type Seats FOC / block-hr
FOC / seat-hr
Average stage(mi)
Daily block-hrs
DC9-30 100 $1973 $19.73 472 8.1
A320 148 $2270 $15.33 1191 11.7
B727-200 150 $2555 $17.03 704 8.4
B757-200 186 $2550 $13.71 1252 11.3
B747-400 375 $6455 $17.21 4065 12.4
FOC Comparison: Selected Aircraft

14
FOC Comparisons (cont’d)
• Flight operating cost comparisons on previous slide provide insights into different aircraft characteristics:
– Largest B747-400 aircraft has highest total FOC per block hour, while smallest DC9-30 has highest FOC per seat hour, as expected
– However, lowest cost per seat hour (and in turn per ASM) provided by new technology mid-sized B757, followed by A320
– B747-400 costs suffer from high wage rates paid to senior pilots who fly international services on this aircraft type
– Comparisons of same-sized B727 and A320 show newer A320 with lower costs:• A320 more fuel efficient, with two pilots (vs 3 on B727)• A320 has higher daily utilization, due to longer stage length
15
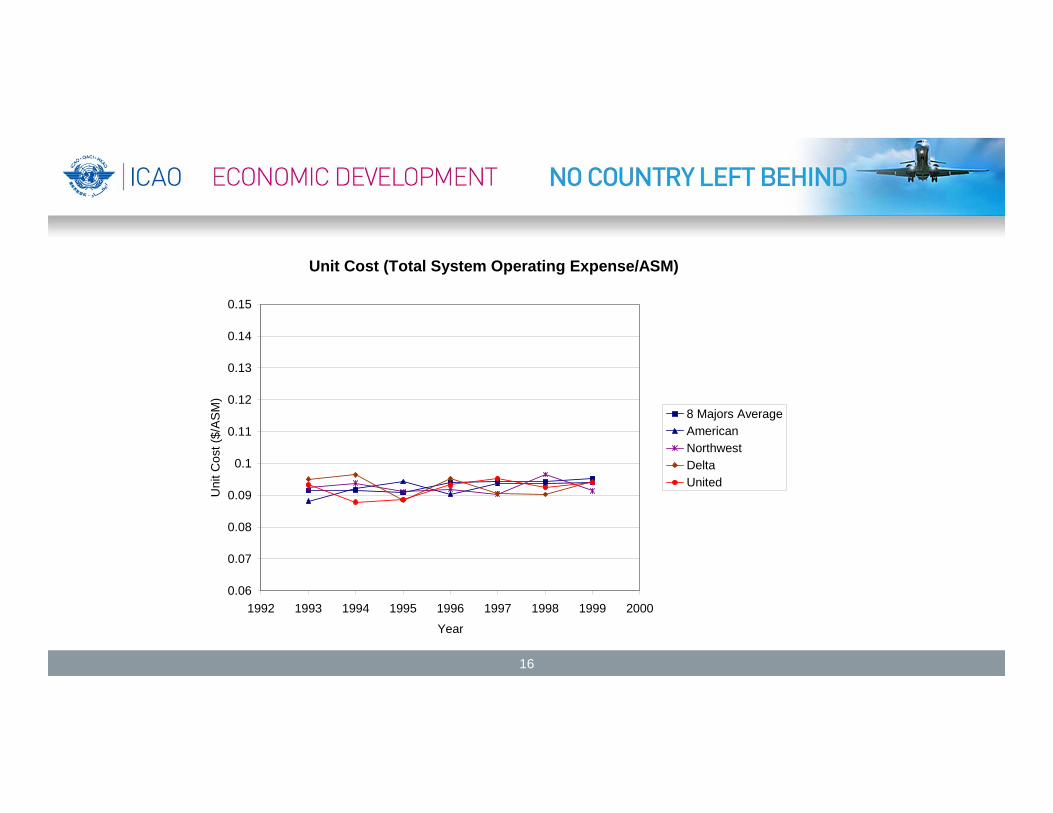
Cost and Productivity Comparisons
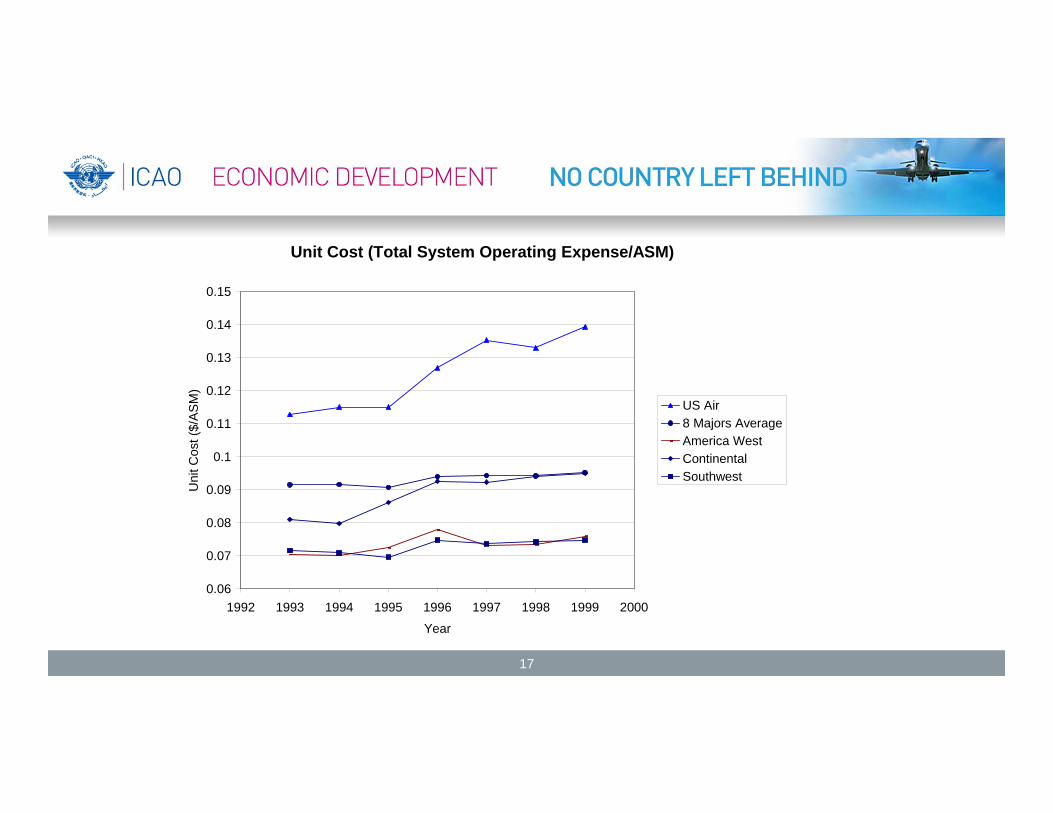
• Average unit cost for 8 selected majors increased from 9.15 to 9.53 cents (4%) between 1993-1999
• The top four major carriers have very similar unit costs in this time period
• Unit cost increased dramatically between 1993 and 1999 for Continental (17%) and USAir (24%)
• Southwest and America West had the lowest unit cost, while USAir had the highest unit cost
16
Unit Cost (Total System Operating Expense/ASM)
0.06
0.07
0.08
0.09
0.1
0.11
0.12
0.13
0.14
0.15
1992 1993 1994 1995 1996 1997 1998 1999 2000
Year
Uni
t Cos
t ($/
AS
M)
8 Majors AverageAmericanNorthwestDeltaUnited
17
Unit Cost (Total System Operating Expense/ASM)
0.06
0.07
0.08
0.09
0.1
0.11
0.12
0.13
0.14
0.15
1992 1993 1994 1995 1996 1997 1998 1999 2000
Year
Uni
t Cos
t ($/
AS
M)
US Air8 Majors AverageAmerica WestContinentalSouthwest

18
Aircraft Productivity
• Measured in ASMs generated per aircraft per day:= # departures X average stage length X # seats
• Aircraft “utilization” measured in block-hours/day:– Block hours begin at door close (blocks away from wheels) to door open (blocks under wheels)– Gate-to-gate time, including ground taxi times
• Increased aircraft productivity achieved with:– More flight departures per day, either through shorter turnaround (ground) times or off-peak
departure times– Longer stage lengths (average stage length is positively correlated with increased aircraft
utilization = block hours per day)– More seats in same aircraft type (no first class seating and/or tighter “seat pitch”)

19
Airline Flights per Day
Block Hours
Stage Length
Seats ASMs
Continental 3.9 8.3 719 104 291,246
United 4.3 7.5 564 109 264,284
Southwest 8.2 10.2 400 122 399,746
Example: Boeing 737‐500 Productivity
20
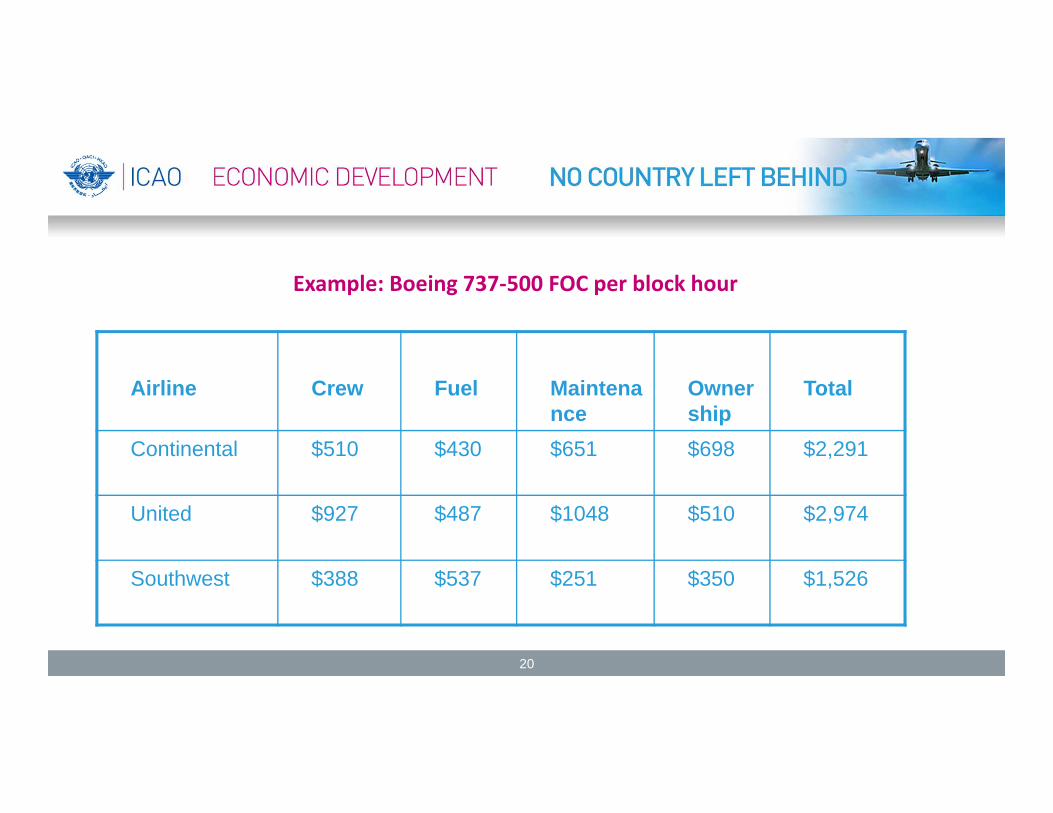
Airline Crew Fuel Maintenance
Ownership
Total
Continental $510 $430 $651 $698 $2,291
United $927 $487 $1048 $510 $2,974
Southwest $388 $537 $251 $350 $1,526
Example: Boeing 737‐500 FOC per block hour
21
8
8.5
9
9.5
10
10.5
11
11.5
12
98-1 98-2 98-3 98-4 99-1 99-2 99-3 99-4 00-1 00-2 00-3 00-4 01-1 01-2 01-3 01-4 02-1 02-2
Blo
ck H
ours
/Day
AAUADLWN
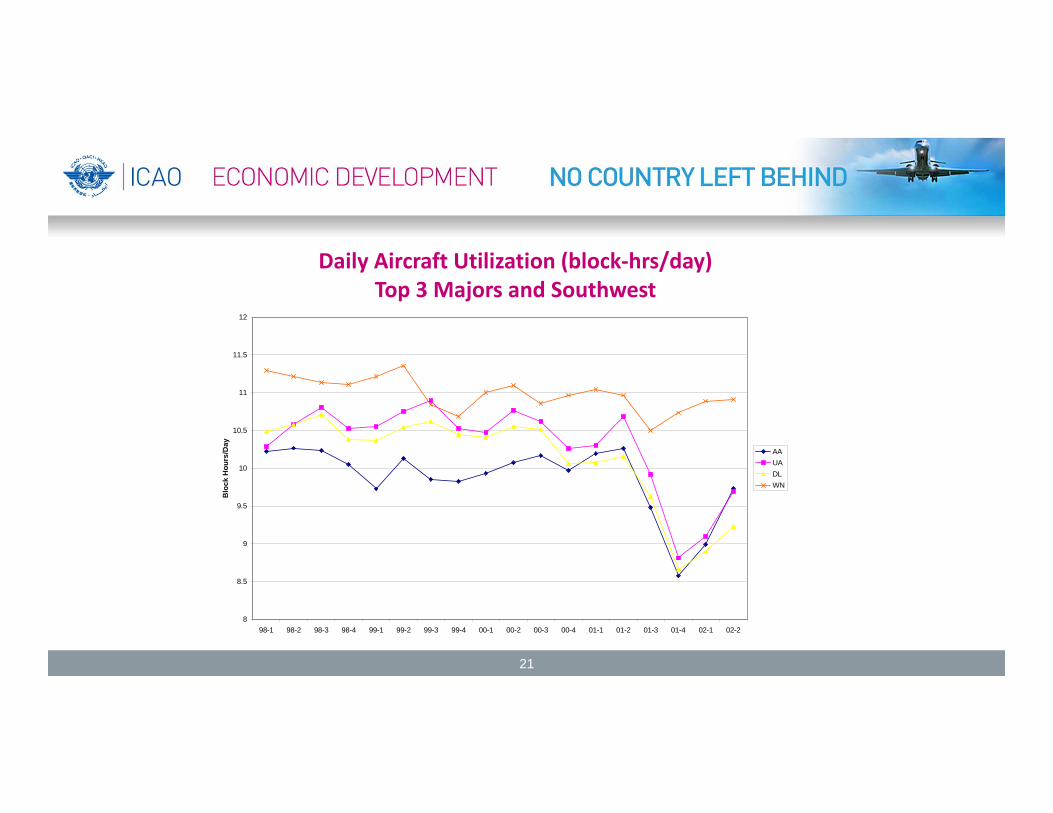
Daily Aircraft Utilization (block‐hrs/day)Top 3 Majors and Southwest
22
0.03
0.035
0.04
0.045
0.05
0.055
19981
19982
19983
19984
19991
19992
19993
19994
20001
20002
20003
20004
20011
20012
20013
20014
20021
20022
$/A
SM
AAUADLW N
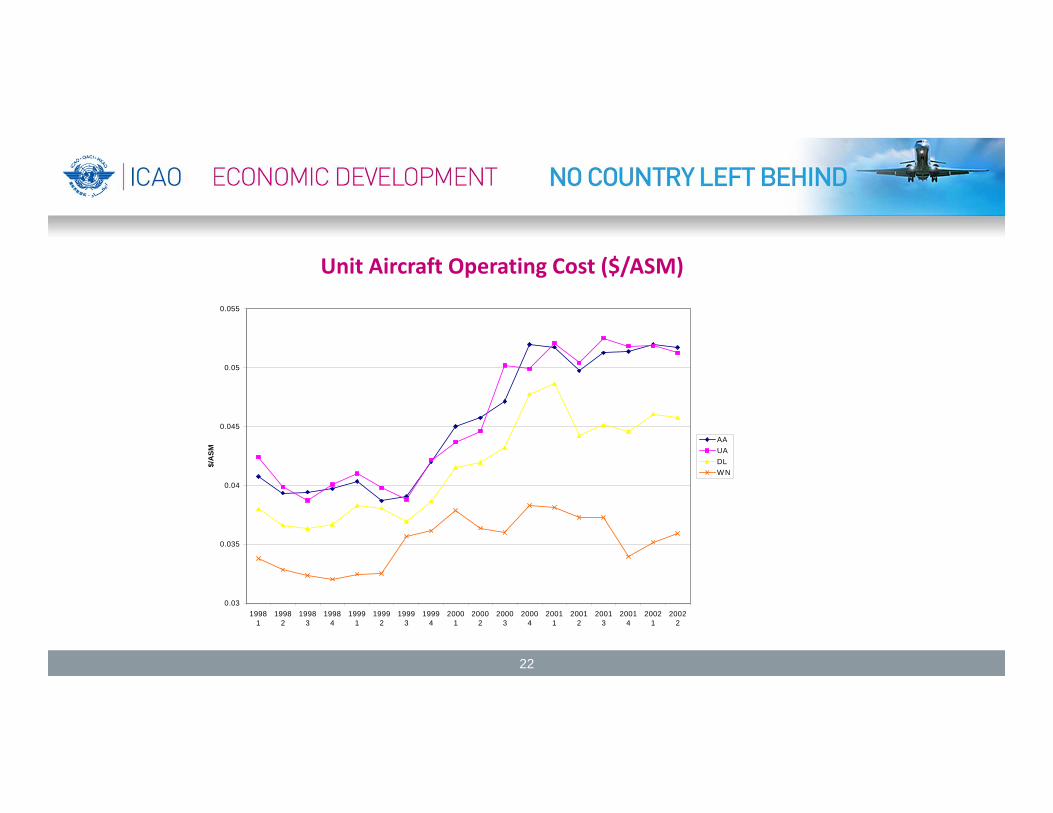
Unit Aircraft Operating Cost ($/ASM)
23
• Measured in ASMs per employee per period• As with aircraft, employee productivity should be higher with:
– Longer stage lengths (amount of aircraft and traffic servicing for each flight departure not proportional to stage length)
– Larger aircraft sizes (economies of scale in labor required per seat for each flight departure)
– Increased aircraft productivity due to shorter turnaround times (more ASMs generated by aircraft contribute to positive employee productivity measures)
• Yet, network airlines with long stage lengths and large aircraft have lower employee productivity rates
Employee Productivity

24
ASMs/employee and Average Stage Length
25
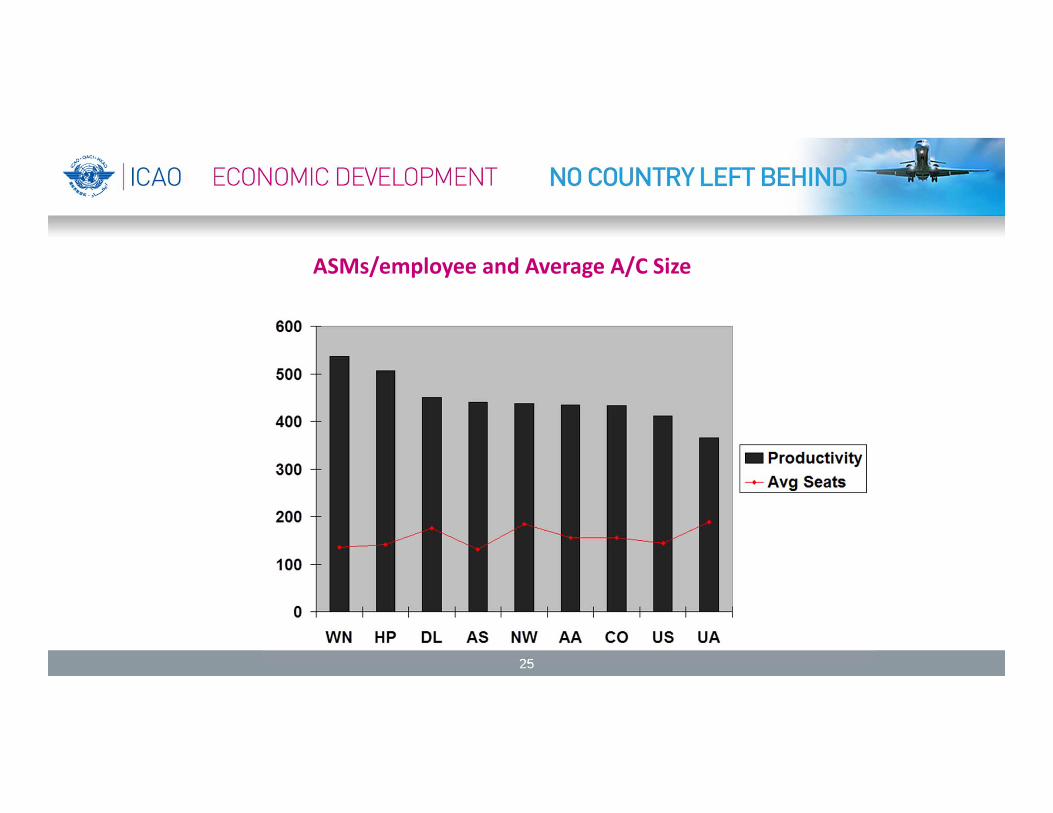
ASMs/employee and Average A/C Size
26
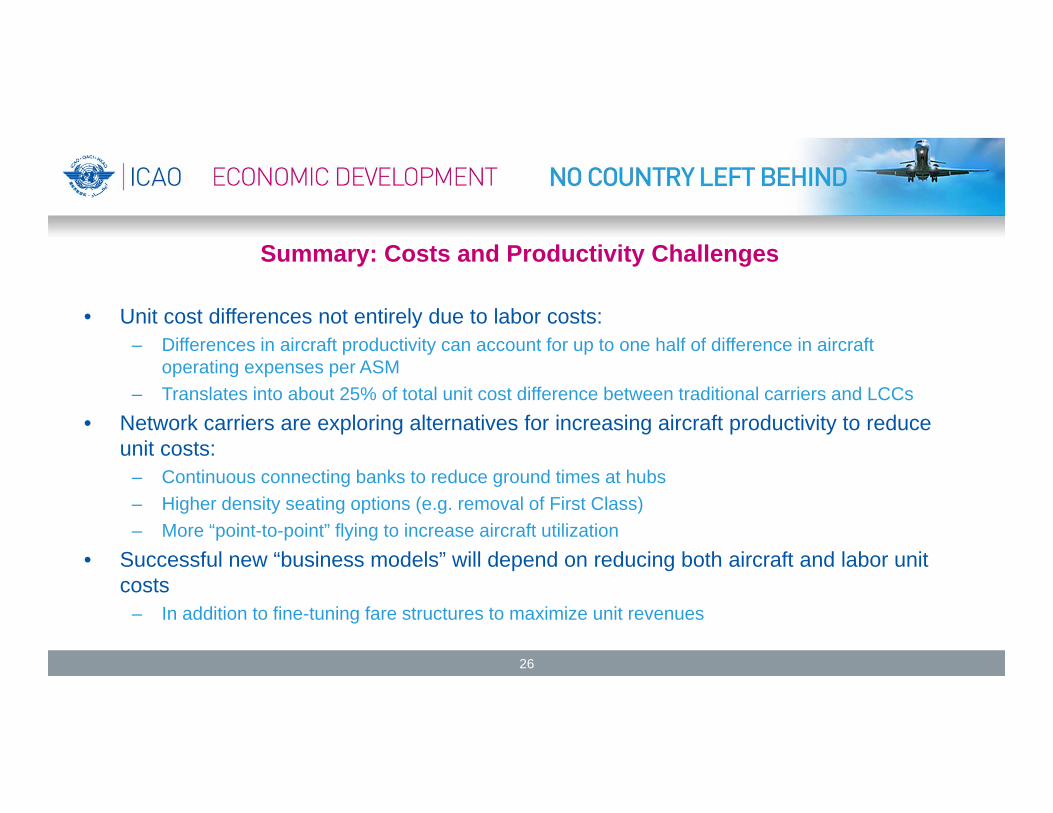
Summary: Costs and Productivity Challenges
• Unit cost differences not entirely due to labor costs:– Differences in aircraft productivity can account for up to one half of difference in aircraft
operating expenses per ASM– Translates into about 25% of total unit cost difference between traditional carriers and LCCs
• Network carriers are exploring alternatives for increasing aircraft productivity to reduce unit costs:
– Continuous connecting banks to reduce ground times at hubs– Higher density seating options (e.g. removal of First Class)– More “point-to-point” flying to increase aircraft utilization
• Successful new “business models” will depend on reducing both aircraft and labor unit costs
– In addition to fine-tuning fare structures to maximize unit revenues
27
https://www4.icao.int/newdataplus