Embed Size (px)
Citation preview

Atmos. Chem. Phys., 13, 1193–1202, 2013www.atmos-chem-phys.net/13/1193/2013/doi:10.5194/acp-13-1193-2013© Author(s) 2013. CC Attribution 3.0 License.
EGU Journal Logos (RGB)
Advances in Geosciences
Open A
ccess
Natural Hazards and Earth System
Sciences
Open A
ccess
Annales Geophysicae
Open A
ccessNonlinear Processes
in Geophysics
Open A
ccess
Atmospheric Chemistry
and PhysicsO
pen Access
Atmospheric Chemistry
and Physics
Open A
ccess
Discussions
Atmospheric Measurement
Techniques
Open A
ccess
Atmospheric Measurement
Techniques
Open A
ccess
Discussions
Biogeosciences
Open A
ccess
Open A
ccess
BiogeosciencesDiscussions
Climate of the Past
Open A
ccess
Open A
ccess
Climate of the Past
Discussions
Earth System Dynamics
Open A
ccess
Open A
ccess
Earth System Dynamics
Discussions
GeoscientificInstrumentation
Methods andData Systems
Open A
ccess
GeoscientificInstrumentation
Methods andData Systems
Open A
ccess
Discussions
GeoscientificModel Development
Open A
ccess
Open A
ccess
GeoscientificModel Development
Discussions
Hydrology and Earth System
Sciences
Open A
ccess
Hydrology and Earth System
Sciences
Open A
ccess
Discussions
Ocean Science
Open A
ccess
Open A
ccess
Ocean ScienceDiscussions
Solid Earth
Open A
ccess
Open A
ccess
Solid EarthDiscussions
The Cryosphere
Open A
ccess
Open A
ccess
The CryosphereDiscussions
Natural Hazards and Earth System
Sciences
Open A
ccess
Discussions
Qualitative and quantitative determination of water in airborneparticulate matter
S. Canepari1,2, C. Farao1, E. Marconi1, C. Giovannelli1, and C. Perrino2
1Department of Chemistry, Sapienza University of Rome, P.le Aldo Moro, 5, Rome, 00185, Italy2CNR Institute of Atmospheric Pollution Research, Via Salaria, Km 29 300, Monterotondo St., Rome, 00015, Italy
Correspondence to:S. Canepari ([email protected])
Received: 2 October 2012 – Published in Atmos. Chem. Phys. Discuss.: 18 October 2012Revised: 16 January 2013 – Accepted: 22 January 2013 – Published: 1 February 2013
Abstract. This paper describes the optimization and valida-tion of a new simple method for the quantitative determi-nation of water in atmospheric particulate matter (PM). Theanalyses are performed by using a coulometric Karl-Fishersystem equipped with a controlled heating device; differentwater contributions are separated by the application of an op-timized thermal ramp (three heating steps: 50–120◦C, 120–180◦C, 180–250◦C).
The analytical performance of the method was verifiedby using standard materials containing 5.55 % and 1 % byweight of water. The recovery was greater than 95 %; the de-tection limit was about 20 µg. The method was then appliedto NIST Reference Materials (NIST1649a, urban particulatematter) and to real PM10 samples collected in different geo-graphical areas. In all cases the repeatability was satisfactory(10–15 %).
When analyzing the Reference Material, the separation offour different types of water was obtained. In real PM10 sam-ples the amount of water and its thermal profile differed as afunction of the chemical composition of the dust. Mass per-centages of 3–4 % of water were obtained in most samples,but values up to about 15 % were reached in areas where thechemical composition of PM is dominated by secondary in-organic ions and organic matter. High percentages of waterwere also observed in areas where PM is characterized bythe presence of desert dust.
A possible identification of the quality of water releasedfrom the samples was tried by applying the method to somehygroscopic compounds that are likely contained in PM(pure SiO2, Al2O3, ammonium salts, carbohydrates and di-carboxylic acids) and by comparing the results with thoseobtained from field samples.
1 Introduction
The interaction of water with atmospheric particulate matter(PM) has been described in many research papers, mainlyfocused on the study of the relationship between relative hu-midity and water adsorbed on PM and on the effects the inter-action with water may exert on the physico-chemical behav-ior of PM. Because of this interaction, the original physicaland chemical features of the atmospheric particles may un-dergo significant variations, mainly in their size distribution(Swietlicki et al.,1999), optical properties and residence timein the atmosphere (Sloane and Wolfe, 1985; Pilinis et al.,1995; Kreidenweis et al., 2001). Moreover, it is well knownthat high values of relative humidity (RH) favor the occur-rence of acid-base reactions leading to the formation of sec-ondary inorganic salts (Baek et al., 2004; Squizzato et al.,2012). Finally, from the point of view of PM sampling, theamount of adsorbed water affects the solid-vapour equilib-ria of secondary ammonium salts collected on the filters, amechanism that is among the main responsible for samplingartifacts (Vecchi et al., 2009). Although in most cases the ar-tifact is negative (loss of NH4NO3 due to release of NH3and HNO3) (Chow et al., 2005; Yuc et al., 2006; Pathaket al., 2009), in the presence of very high RH values itbecomes positive, as the formation of particulate NH4NO3from gaseous NH3 and HNO3 is favored (Gysel et al., 2007;Khlystov et al., 2009; Hu et al., 2011).
Of interest is also the contribution of water to the massconcentration of PM. The presence of considerable amountsof water in PM samples, in fact, causes an increase ofPM mass concentration that might be responsible for ex-ceedances of the regulatory limit values. It is worth noting
Published by Copernicus Publications on behalf of the European Geosciences Union.

1194 S. Canepari et al.: Determination of water in airborne particulate matter
that the knowledge of this contribution may be of interestfor a correct evaluation of the health effects of PM: wateris harmless in itself, but it may cause a relevant variation ofthe aerodynamic diameter of the particles and thus of theirability to penetrate into the respiratory tree.
Moreover, in many papers attempting PM mass closure,the unidentified mass (difference between gravimetric deter-mination and reconstruction from single chemical analyses)is generally attributed to the presence of water and/or to thedifficulty in determining an adequate conversion factors tocalculate organic matter (OM) from the measurement of or-ganic carbon (OC) (Balasubramanian et al., 2003; Harrisonet al., 2003; Tsyro, 2005; Almeida et al., 2006; Sasaki andSakamoto, 2006; Perrino et al., 2007; Perrino et al., 2009;Perrone et al., 2012). A quantitative determination of theamount of water collected on the filter would make it pos-sible to distinguish the weight of these two factors and toimprove the definition of OC/OM conversion factors.
Finally, the interaction with water seems to play a rolein the different performance exhibited by Teflon and quartzmembrane filters in sampling PM (Perrino et al., 2012).
In spite of the relevant role played by water in the studyof atmospheric PM, a quantitative determination of adsorbedwater was attempted only in a few papers. Water content wasgenerally determined by indirect methods, consisting of thedifferential determination of particle dimension (Dick et al.,2000; Hu et al., 2001; Rees et al., 2004; Stanier et al., 2004;Kitamori et al., 2009) or collected mass amount (Speer etal., 1997; Speer et al., 2003) before and after the exposure tocontrolled RH conditions. These studies showed that watermay constitute up to 20–30 % of the total PM mass and in-dicated a dependence of the water uptake on the dimensionsand chemical composition of the particles. Water adsorptionresulted to be relevant for fine particles, characterized by highsurface area, and for particles containing water-soluble inor-ganic salts, mainly ammonium sulphate (Speer et al., 1997;Stanier et al., 2004; Kitamori et al., 2009), and hygroscopicorganic species such as dicarboxylic acids (Ansari and Pan-dis, 2000; Dick et al., 2000; Decesari et al., 2001; Speer et al.,2003). In the paper of Rees et al. (2004), the addition of thewater content, measured by Dry-Ambient Aerosol Size Spec-trometer (DAASS), to the amount of PM macro-componentsallowed a significant improvement of the mass closure. Itis worth noting, however, that these differential techniquesevaluate only the amount of surface-adsorbed water and arenot able to give information about further contributions dueto structurally-bound water.
To our knowledge, only two papers reporting a direct an-alytical determination of water on PM filters by the Karl-Fisher method have been published up to now (Ohta et al.,1998; Tsai et al., 2005). The first one was based on the ther-mal desorption of water at 150◦C from Teflon filters sampledfor two weeks; the results showed that a percentage of thetotal PM2.0 mass ranging from 0.4 % to 3.2 % could be at-tributed to the crystallization water of (NH4)2SO4, NH4NO3
and NaCl. In the second paper, the water contained on quartzfilters conditioned at 60 % RH was extracted by using anhy-drous methyl alcohol; in these conditions water resulted tobe the individual component at highest concentration (about30 % of the total PM mass). In spite of the different opera-tive conditions employed in these two studies, these resultsdemonstrate that the Karl Fisher technique is suitable for de-termining water in PM samples; the described methods, how-ever, are not appropriate for a routine use in intensive moni-toring campaigns because of too high detection limits (Ohtaet al., 1998) and/or method complexity (Tsai et al., 2005).
The present work reports the optimization and validationof a new method for the determination of water in atmo-spheric PM samples, easily applicable to routine field cam-paigns. The method is based on the use of a thermal rampfor the selective desorption of different water contributions,retained by the sample with different strength. The analy-sis is carried out by coulometric Karl Fisher (KF) technique.This approach is based on the results of a previous work,where three different water contributions, released at differ-ent temperatures, had been identified by analyzing the Cer-tified Material NIST 1649a by thermogravimetry (TG) (Per-rino et al., 2012). In that study, however, it was not possibleto carry out a quantitative determination of the three contri-butions because other volatile species were released in thesame temperature ranges.
The proposed method has been applied to pure hygro-scopic materials that are commonly contained in atmosphericPM and to real PM10 samples collected in various geograph-ical areas, so as to highlight the relationship between thechemical composition of PM and the thermal behavior of wa-ter.
2 Experimental
2.1 Materials
For the validation of the method we used two standardmaterials: HYDRANAL Water Standard KF-Oven 220◦C–230◦C (HYD; Fluka Analytical) and Water Standard Oven1 %, (WSO; ACS Merck KGaA), containing 5.55± 0.05 %and l.0± 0.03 % water, respectively.
SiO2, Al2O3, NH4HSO4, NH4Cl, NH4NO3, (NH4)2SO4,glucose, lactose, fructose, sucrose, levoglucosan, tartaricacid, citric acid, succinic acid, oxalic acid, phenylalaninewere analytical grade (ACS Merck KGaA).
The other materials (Saharan dust, road dust, soot fromvehicular exhaust, skin, bacteria, moulds, pollens) were takendirectly from the environment and analyzed without any pre-treatment.
2.2 Karl-Fisher analysis
Karl-Fisher is a well-established analytical technique devel-oped in the first half of the XX century (Fisher, 1935). It
Atmos. Chem. Phys., 13, 1193–1202, 2013 www.atmos-chem-phys.net/13/1193/2013/
S. Canepari et al.: Determination of water in airborne particulate matter 1195
is based on the quantitative reaction between water and I2,which is generally electrochemically generated inside a cellcontaining a specific solution. In the coulometric version ofthe technique, the total amount of water inside the cell is de-termined by measuring the total electric charge needed togenerate I2. Iodine generation stops when the end point oftitration is reached. The end point is indicated voltammet-rically by the drastic lowering of the voltage difference be-tween the wires of a double Pt electrode.
In this study we used a 831 KF Coulometer (Metrohm AG,Herisau, CH) equipped with an oven (874 Oven Sample Pro-cessor; Metrohm). The samples are inserted into glass vials(6 ml, Metrohm) and placed inside the oven; water releasedwhen heating the sample is transferred to the measurementcell by a carrier gas and measured. This instrumental config-uration implies the presence of a signal drift, being unfeasibleto eliminate all the water contained in the system (mainly inthe carrier gas). In these conditions, the detection of the endpoint takes into account also the value of the drift.
Karl Fisher reagent (Hydranal-Coulomat AG-Oven,Sigma-Aldrich, 100 mL) was used in the titration cell. Fortransferring the sample from the oven to the measurementcell we used ambient air at the flow rate of 20 mL min−1, pre-viously filtered and dried by using molecular sieves (0.3 nmpore size, Metrohm AG, Herisau, CH). To avoid clogging ofthe carrier gas transfer line due to the condensation of speciesdesorbed from PM (e.g.: ammonium salts) the line and theneedle entering the titration cell were accurately cleaned ev-ery day.
Before each measurement the sample vials were kept inoven at 250◦C for 12 h, then placed in a desiccator and trans-ferred inside an AtmosBag (Sigma-Aldrich) filled with Ar-gon dried by using molecular sieves. Samples were weightedby using an analytical balance Gibertini E505 (sensitivity0.01 mg; Gibertini Elettronica, Novate Milanese, Milan, I)and put inside the AtmosBag, where they were inserted intothe vials.
The instrument used in this study was equipped with atemperature-programmable oven that allows the setting oftailor-made heating ramps. This instrumental feature wasnecessary to obtain the selective desorption of different wa-ter contributes. However, the use of heating ramps requiredto perform some modifications to the default settings of theinstrument software. As previously outlined, the instrumentis equipped with an automatic system that identifies the endpoint of the titration according to the return of the baselinedrift to its initial value. When using a thermal ramp, it is nec-essary to exclude the end point identification, as each returnof the drift to the initial value indicates the separation of a dif-ferent water contribution. As a consequence, the minimumvalue of the voltage difference between the indicator plat-inum electrodes was set at 30 mV, the limit value of the driftwas set at 1 µg min−1 and the total duration of the analysis(extraction time) was fixed at 3000 s.
Furthermore, the instrument software calculates theamount of desorbed water by subtracting the contribution dueto the baseline drift from the final water amount; the base-line drift contribution is calculated by extrapolating its initialvalue to the end of the analysis. In our case, the use of thethermal ramp caused the increase of the analytical time witha consequent increase of the drift contribution to the final wa-ter amount, which becomes comparable with the amount ofwater in the PM samples. Also, the drift value is variable,and the influence of this variability on the repeatability of theanalytical results also increases with the duration of the anal-ysis. In our conditions, the intra-day and inter-day variationswere 0.05 µg min−1 and 0.9 µg min−1, respectively (10 repli-cate analyses of the operative blank). To reduce the effectof the drift variability as much as possible, the measurementof the operative blank was carried out every two samples,and the KF curve of each sample (water vs. time) was ob-tained by subtracting the blank value to each point of thegraph (see Fig. 1). This process allows a direct reading of thewater amount on the y-axes of the graph; also, this methodallows a direct subtraction of the water contribution due tothe humidity of air inside the vial, the adsorption on the vialwalls and the content of the plastic vial cap.
The limit of detection (LOD) and limit of quantification(LOQ) were calculated as three times and ten times thestandard deviation of the blank (10 replicates). For a typi-cal intra-day variability we obtained the following results:LOD = 7 µg; LOQ= 25 µg.
2.3 Real PM10 samples
Twenty pairs of equivalent real PM samples were collectedduring the period November-Dicember 2011 in three differ-ent geographical areas. The location in Rome (Central Italy,41◦54′03.69′′ N, 12◦30′44.93′′ E) was a traffic site, about 50meter from the nearest road (8 pairs of samples); the loca-tion in Ferrara (Po valley, Northern Italy, 44◦50′55.44′′ N,11◦33′40.96′′ E) was an industrial site, about 5 km fromthe city center and 1 km from the nearest industrial plant(10 pairs); the location in Tel Aviv (Israel, 32◦06′54.16′′ N,34◦48′16.74′′ E) was the roof of the Tel Aviv University (2pairs).
Daily PM10 samples were collected on 47 mm diameterPTFE membranes, 1 µm pore size (PALL Corporation, USA)by means of dual-channel samplers (HYDRA Dual Sampler,FAI Instruments, Fontenuova, Rome, I) equipped with twoindependent PM10 sampling heads compliant with EN 12341(1998). In Rome and Tel Aviv the two channels were oper-ated at the flow rate of 2.3 m3 h−1. In Ferrara, which is char-acterized by very high relative humidity, the sampling headswere modified in order to reduce the flow rate to 1.15 m3 h−1
and to avoid clogging of the sampling membranes.An additional collection of six parallel samples was car-
ried during the period 14–20 December 2011 at the Fer-rara site, by using three HYDRA Dual Samplers placed
www.atmos-chem-phys.net/13/1193/2013/ Atmos. Chem. Phys., 13, 1193–1202, 2013

1196 S. Canepari et al.: Determination of water in airborne particulate matter
FIGURE 1
0
200
400
600
800
1000
1200
1400
0 500 1000 1500 2000 2500 3000
wat
er [
µg]
time [s]
Blank signalNIST1649a
0
100
200
300
400
500
600
700
800
0 500 1000 1500 2000 2500 3000
wat
er [µ
g]
time [s]
NIST1649a - Blank
Fig. 1. Karl-Fisher analysis of the reference material NIST1649a. Left panel: original sample signal and blank signal. Right panel: samplesignal after blank subtraction.
side-by-side. These samples were used to evaluate the effectof sample conservation.
Teflon filters were allowed to equilibrate for two days at20◦C and 50 % RH before weighting. After sampling, fil-ters were placed in Petri dishes and stored at 5◦C. Differentprocedures were used to evaluate the effect of storage con-ditions. Before the analysis all samples were re-equilibratedand re-weighted and the plastic rings of the filters were cutoff by using a steel scalpel.
3 Results and discussion
3.1 Method optimization
The proposed method was optimized by using the ReferenceMaterial NIST1649a (National Standard Institute of Tech-nology – USA), consisting of urban atmospheric particu-late matter. Although its water content is not certified andit show some differences with respect to real PM10 samples(Canepari et al., 2006), this material makes it possible to per-form the optimization phases on a rather representative ho-mogeneous material.
The first optimization phase concerned the heating rampand was aimed to obtain a satisfactory separation of thedifferent water contributions to atmospheric PM. Figure 2shows some examples of thermal ramp (left panels) and ofKF curves obtained when applying the ramp to NIST 1649a(right panels). The total amount of water was 100± 6 g kg−1,irrespective of the selected ramp. Instead, the curve profilestrongly depends on the thermal ramp, as shown by the driftgraph (grey lines in Fig. 2). When the heating temperatureis constant, the operational mode generally used in this typeof instruments, we obtain only one signal that is relative tothe total water amount (Fig. 2, upper panels). The use ofa linear thermal ramp allows the differentiation of severalwater contributions that are released from the sample at in-creasing temperatures (Fig. 2, middle panels). In these condi-tions, however, the contributions are insufficiently separated.It is worth noting that this linear ramp was used in previ-ous scientific works regarding the TG analysis of NIST 1648(Matuschek et al., 2004; Perrino et al., 2012). These papers
reported two well-defined weight losses in the range 80◦–120◦C and 150◦–180◦C, which were attributed to particle-bound water, and one wider loss in the range 225◦C–310◦Cthat was due to the release of several organic and inorganicspecies, with a possible contribution of crystallization water.Although the results obtained by KF and TG are qualitativelysimilar, the separation of the water contributions by the KFmethod is lower, probably because of a higher thermal inertiain the heat transfer to the sample.
The lower panels of Fig. 2 reports the optimized ther-mal ramp, obtained by a trial and error procedure, that wasused to perform all subsequent analyses (5 min at 50◦C,from 50◦C to 120◦C at 14◦C min−1, 5 min at 120◦C,from 120◦C to 180◦C at 12◦C min−1, 2 min at 180◦C, from180◦C to 250◦C at 14◦C min−1, 20 min at 250◦C). In theseconditions, we obtained a significant improvement in the an-alytical resolution, and a profile very similar to that obtainedby TG (Perrino et al., 2012). The first peak in the drift graph,which had not been detected by the TG analysis, identifieswater that can be desorbed at low temperature (50◦C), prob-ably due to moisture weakly adsorbed on the particles. Thefollowing three peaks (in the range 400–700 s, 700–1100 s,1100–2300 s) are in very good agreement with the results ofthe TG analysis and confirm the presence of different watercontributions, bound to atmospheric particles with differentstrength.
3.2 Method validation
3.2.1 Recovery
To calculate the exactness, we used two standard materials(HYD e WSO) containing different amounts and qualities ofwater. Figure 3 reports the KF curves and the drift graphs ofthe two certified materials. HYD (upper graph) shows onlyone water contribution, desorbing over 200◦C, that is due tocrystalization water. WSO (lower graph) shows two differentcontributions: the first one, weakly retained, is released atthe beginning of the analytical run at about 50◦C, the secondone is released in the range 500–800 s, at the temperature ofabout 120◦C.
Atmos. Chem. Phys., 13, 1193–1202, 2013 www.atmos-chem-phys.net/13/1193/2013/

S. Canepari et al.: Determination of water in airborne particulate matter 1197
FIGURE 2
0.0
0.5
1.0
1.5
2.0
0
20
40
60
80
100
120
140
160
0 200 400 600 800 1000
drift
[µg
s-1]
wat
er [µ
g]
time [s]
KF curvedrift
NIST1649aQ = 1.6 mg
0
50
100
150
200
250
300
0 200 400 600 800 1000
tem
pera
ture
[C°]
time [s]
50
100
150
200
250
300
0 500 1000 1500 2000 2500
tem
pera
ture
[°C
]
time [s]
50
100
150
200
250
300
0 500 1000 1500 2000 2500 3000
tem
pera
ture
[°C
]
time [s]
0.0
0.2
0.4
0.6
0.8
1.0
0
50
100
150
200
250
300
350
0 500 1000 1500 2000 2500
drift
[µg
s-1]
wat
er [µ
g]
time [s]
KF curve drift
NIST1649aQ = 3.0 mg
0.0
0.4
0.8
1.2
1.6
0
100
200
300
400
500
600
700
800
0 500 1000 1500 2000 2500 3000
drift
[µg
s-1]
wat
er [µ
g]
time [s]
KF curvedrift
NIST1649aQ = 6.5 mg
Fig. 2.Different thermal ramps (left panels) and resulting Karl-Fisher curves (right panels) for the analysis of Reference Material NIST1649a.
Table 1. Recovery of water from standard materials HYDRANAL(HYD) and Water Standard Oven (WSO).N = 10.
Certified Measured Recoveryµg µg %
HYD Low (5 mg) 278± 3 272± 15 98± 6High (50 mg) 2775± 25 2817± 67 102± 3
WSO Low (10 mg) 100± 3 101± 8 101± 11High (50 mg) 500± 15 497± 28 99± 9
Table 1 shows the recovery of different amounts of thetwo standard materials. We did not consider amounts lowerthan 5 mg in order to avoid the introduction of a high un-certainty contribution due to the gravimetric determinationand transfer of very small sample amounts. In all cases therecovery was close to 100 %, while the repeatability was bet-ter for HYD (high amounts: about 3 %; low amounts: about6 %) than for WSO (high amounts: about 9 %; low amounts:about 11 %), probably because of the lower stability of thewater contained in WSO.
A further validation phase concerned the recovery fromsilica and alumina, which are among the hydrophilic speciescontained in PM. These compounds are thermally stable andavailable on the market at high purity level; it is thus possi-ble to carry out a gravimetric determination of the water that
Table 2.Comparison of gravimetric and Karl Fisher determinationof the water content.N = 10.
Water content g Kg−1 Recovery %
Gravimetry Karl FisherSiO2 46± 1 45± 3 98± 9Molecular sieves 165± 4 167± 6 101± 6Al2O3 50± 2 48± 2 96± 8
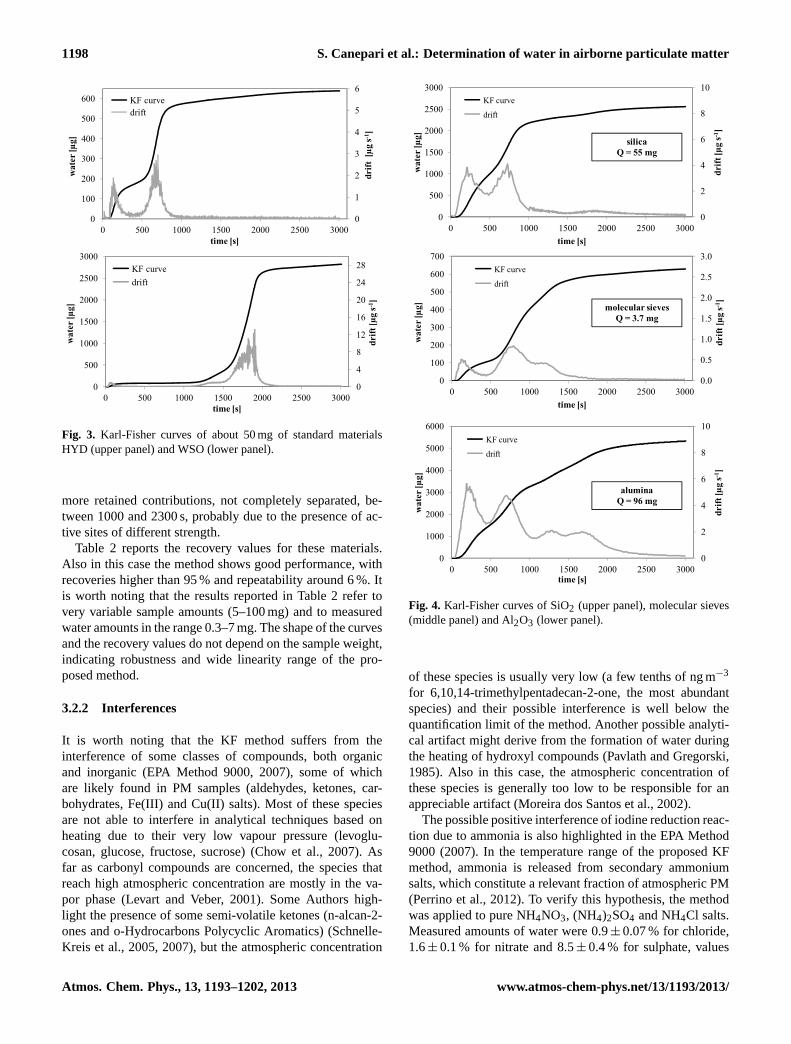
is desorbed when heating in oven (105◦C for 24 hours). Wealso tested the molecular sieves used to dry the carrier gasof the KF (silicate with inorganic binder), in order to verifythe influence of the material porosity on the profile of the KFcurve. The KF curves obtained for these materials are shownin Fig. 4. All three materials show a contribution in the range0–500 s, probably due to moisture weakly adsorbed on theparticles; the following part of the curves, instead, are quitedifferent. The curve of silica (upper graph) shows only a fur-ther single contribution in the range 500–1000 s. Molecularsieves (middle graph) show a very similar behavior in the firstpart of the curve; with respect to silica, however, molecularsieves release a relevant amount of water also in the secondpart of the analysis (1000–1500 s), likely due to the releaseof water adsorbed inside pores. Alumina shows the same pro-file in the range 500–1000 s (lower graph), but also two other
www.atmos-chem-phys.net/13/1193/2013/ Atmos. Chem. Phys., 13, 1193–1202, 2013
1198 S. Canepari et al.: Determination of water in airborne particulate matter
FIGURE 3
0
4
8
12
16
20
24
28
0
500
1000
1500
2000
2500
3000
0 500 1000 1500 2000 2500 3000
drift
[µg
s-1]
wat
er [µ
g]
time [s]
KF curve drift
0
1
2
3
4
5
6
0
100
200
300
400
500
600
0 500 1000 1500 2000 2500 3000
drift
[µg
s-1]
wat
er [µ
g]
time [s]
KF curvedrift
Fig. 3. Karl-Fisher curves of about 50 mg of standard materialsHYD (upper panel) and WSO (lower panel).
more retained contributions, not completely separated, be-tween 1000 and 2300 s, probably due to the presence of ac-tive sites of different strength.
Table 2 reports the recovery values for these materials.Also in this case the method shows good performance, withrecoveries higher than 95 % and repeatability around 6 %. Itis worth noting that the results reported in Table 2 refer tovery variable sample amounts (5–100 mg) and to measuredwater amounts in the range 0.3–7 mg. The shape of the curvesand the recovery values do not depend on the sample weight,indicating robustness and wide linearity range of the pro-posed method.
3.2.2 Interferences
It is worth noting that the KF method suffers from theinterference of some classes of compounds, both organicand inorganic (EPA Method 9000, 2007), some of whichare likely found in PM samples (aldehydes, ketones, car-bohydrates, Fe(III) and Cu(II) salts). Most of these speciesare not able to interfere in analytical techniques based onheating due to their very low vapour pressure (levoglu-cosan, glucose, fructose, sucrose) (Chow et al., 2007). Asfar as carbonyl compounds are concerned, the species thatreach high atmospheric concentration are mostly in the va-por phase (Levart and Veber, 2001). Some Authors high-light the presence of some semi-volatile ketones (n-alcan-2-ones and o-Hydrocarbons Polycyclic Aromatics) (Schnelle-Kreis et al., 2005, 2007), but the atmospheric concentration
FIGURE 4
0
2
4
6
8
10
0
1000
2000
3000
4000
5000
6000
0 500 1000 1500 2000 2500 3000
drift
[µg
s-1]
wat
er [µ
g]
time [s]
KF curve
drift
aluminaQ = 96 mg
0
2
4
6
8
10
0
500
1000
1500
2000
2500
3000
0 500 1000 1500 2000 2500 3000
drift
[µg
s-1]
wat
er [µ
g]
time [s]
KF curve
drift
silicaQ = 55 mg
0.0
0.5
1.0
1.5
2.0
2.5
3.0
0
100
200
300
400
500
600
700
0 500 1000 1500 2000 2500 3000
drift
[µg
s-1]
wat
er [µ
g]time [s]
KF curve
drift
molecular sievesQ = 3.7 mg
Fig. 4. Karl-Fisher curves of SiO2 (upper panel), molecular sieves(middle panel) and Al2O3 (lower panel).
of these species is usually very low (a few tenths of ng m−3
for 6,10,14-trimethylpentadecan-2-one, the most abundantspecies) and their possible interference is well below thequantification limit of the method. Another possible analyti-cal artifact might derive from the formation of water duringthe heating of hydroxyl compounds (Pavlath and Gregorski,1985). Also in this case, the atmospheric concentration ofthese species is generally too low to be responsible for anappreciable artifact (Moreira dos Santos et al., 2002).
The possible positive interference of iodine reduction reac-tion due to ammonia is also highlighted in the EPA Method9000 (2007). In the temperature range of the proposed KFmethod, ammonia is released from secondary ammoniumsalts, which constitute a relevant fraction of atmospheric PM(Perrino et al., 2012). To verify this hypothesis, the methodwas applied to pure NH4NO3, (NH4)2SO4 and NH4Cl salts.Measured amounts of water were 0.9± 0.07 % for chloride,1.6± 0.1 % for nitrate and 8.5± 0.4 % for sulphate, values
Atmos. Chem. Phys., 13, 1193–1202, 2013 www.atmos-chem-phys.net/13/1193/2013/

S. Canepari et al.: Determination of water in airborne particulate matter 1199
that are consistent with the hygroscopicity of these salts.As reported in Perrino et al. (2012), at the maximum oper-ative temperature of the oven (250◦C) the thermal releaseof ammonia from NH4Cl and NH4NO3 is almost quantita-tive, while it is about 20 % from (NH4)2SO4. To evaluate theinterference of ammonia we considered NH4Cl, that is thespecies that yields the lowest signal. Considering that all theammonia content of the salt is transferred in the cell, we ob-tain a maximum signal equivalent to a water amount of 0.9 %of the salt weight.
Considering a total ammonium amount on the sampled fil-ter as high as 500 µg (very high values, corresponding to anammonia concentration of about 10 µg m−3 for 24-h sam-plings at the flow rate of 2.3 m3 h−1) even if the measuredsignal were totally attributed to interfering ammonia (anhy-drous salt) we would obtain a signal equivalent to only 14 µgof water (0.9 % of 500 µg multiplied by the molecular weightof ammonium chloride and divided by the molecular weightof ammonium). We can thus conclude that ammonia interfer-ence, if present, would in any case be negligible.
3.3 Real samples
Some preliminary tests addressed the analysis of the mostcommon sampling media (Teflon and quartz) and the effectof the sampled filters conservation procedure on the watercontent.
The profile of KF curves from the analysis of quartz fiberfilters resembles the profile of molecular sieves, in agreementwith the common siliceous composition. Blank values, as ex-pectable, were quite high (about 1400 µg per filter). The pro-file of Teflon membrane filters, instead, was indistinguish-able from the blank, both before and after conditioning at50 % RH, in agreement with their hydrophobic characteris-tics. Teflon filters were thus considered as suitable media forPM sampling aimed at water content determination.
The influence of the sample conservation procedure wasstudied by analyzing six groups of six equivalent PM10 sam-ples sampled side-by-side. One filter of each group was re-moved from the sampler immediately after the end of thesampling, conditioned at 20◦C and 50 % RH for 48 hoursand then analyzed. The other five filters were left inside theunloader of the sampler until the end of the last samplingperiod. A second element of each group was directly con-ditioned and analyzed, while other three filters were placedinside Petri dishes, sealed with parafilm and kept for threemonths at ambient temperature, 5◦C or−18◦C, respectively.The last element of each group was kept for six monthsat 5◦C, before being conditioned and analysed. No signif-icant differences were observed among the six profiles ofeach group of samples; the analytical repeatability was about10 %, indicating a good stability of the water retained by theparticles. Storage temperature was then set at 5◦C.
The validation of the method on real samples was com-pleted by analyzing 20 pairs of PM10 samples collected at
FIGURE 5
y = 0.99x + 0.15R² = 0.96
0
2
4
6
8
10
12
14
16
18
20
0 2 4 6 8 10 12 14 16 18 20
sam
ple A
[μg
m-3
]
sample B [µg m-3]
Fig. 5. Scatter plot of the water content of PM10 samples collectedside-by-side (20 pairs).
very different locations: a traffic site in Rome, an industrialsite in Ferrara (Po Valley, (Northern Italy), a urban site inTel Aviv (Israel). The collected amount of dust was vari-able (range: 0.5–2.9 mg); the wide differences in the emis-sion sources and meteo-climatic conditions at these threesites should also assure a variety in the chemical composi-tion of the collected dust.
According to EN 14902 (2005), the repeatability was cal-culated as follows:
rrel =r
X· 100; r =
√√√√√ N∑i=1
(miA − miB)2
2N;
X =
N∑i=1
(miA + miB)
2N
wheremiA and miB are the water amount determined oneach component of the filter pair, andN is the total num-ber of PM10 sample pairs (N = 20). The obtained value(rrel = 10.2 %) was satisfactory and consistent with the re-peatability values determined for NIST 1649a and for purematerials.
Figure 5 shows the scatter plot of the results obtained fromeach filter pair. The regression parameters (slope: 0.98; inter-cept: 0.15 µg m−3; Pearson’s coefficient: 0.96) confirm thegood analytical performance of the method also when ap-plied to real samples.
It is worth noting that the water content of our samples wasvery variable and reached remarkably high values, especiallyin Ferrara and Tel Aviv. In general, water constituted about3–4 % of the total PM mass of the samples collected in Rome,while in Ferrara and in Tel Aviv we obtained percentages
www.atmos-chem-phys.net/13/1193/2013/ Atmos. Chem. Phys., 13, 1193–1202, 2013

1200 S. Canepari et al.: Determination of water in airborne particulate matter
FIGURE 6
0.0
0.5
1.0
1.5
0 500 1000 1500 2000 2500 3000
drift
[µg
s-1]
time [s]
ammonium sulfateammonium nitrateammonium bisulfate
0.0
0.4
0.8
1.2
1.6
0
100
200
300
400
500
0 500 1000 1500 2000 2500 3000
drift
[µg
s-1]
wat
er [µ
g]
time [s]
KF curvedrift
FERRARA - PM10H2O = 16 μg m-3
0.0
0.4
0.8
1.2
1.6
0
100
200
300
400
500
0 500 1000 1500 2000 2500 3000
drift
[µg
s-1]
wat
er [µ
g]
time [s]
KF curvedrift
TEL AVIV - PM10H2O = 7 μg m-3
0.0
1.0
2.0
3.0
0 500 1000 1500 2000 2500 3000
drift
[µg
s-1]
time [s]
sootroad dust
0.0
0.1
0.2
0.3
0.4
0.5
0
50
100
150
200
250
0 500 1000 1500 2000 2500 3000
drift
[µg
s-1]
wat
er [µ
g]
time [s]
KF curvedrift
ROME - PM10H2O = 4 μg m-3
0
1
2
3
4
5
6
0 500 1000 1500 2000 2500 3000
drift
[µg
s-1]
time [s]
Al2O3SiO2desert dust
Fig. 6. Examples of the Karl-Fisher curves of PM10 paired samples collected side-by-side at the three sites (left panels) and drift profiles ofsome single hydrophilic components of PM (right panels).
over 10 %, with a contribution of more than 20 µg m−3 to theenvironmental concentration of PM10.
In the left panel of Fig. 6 we report examples of the KFcurves obtained from pairs of samples collected at the threesites. The KF profiles of the two elements of each pair arealike; the three examples, however, show very different pro-files.
The first water contribution, in the range 0–500 s, is dueto weakly adsorbed moisture and is contained in all sam-ples; the amounts are in the range 50–150 µg. From 500 son, the profiles become characteristics of the sampling site,with small inter-day variations. The release of water fromthe samples collected in Rome occurs in many steps, dur-ing the whole analytical run. The samples collected in Fer-rara show a sharp signal at about 1500 s, superimposed to abroader signal in the interval 1000–2000 s. Tel Aviv samplesshow, instead, two well-defined contributions, in the range700–1100 s and after 1500 s.
Since these differences are very probably due to a differ-ent chemical composition of PM at the three sites, we car-ried out some exploratory qualitative analyses of some hy-drophilic components of PM (see the drift profiles of all theanalyzed materials in the Supplementary Material). The mostinteresting results are reported in the right panels of Fig. 6.
The profiles of soot (sampled inside the exhaust silencer ofa diesel car) and of road dust (sampled at the kerbside of ahigh-density traffic road) were very similar to the profile ofPM10 sampled in Rome, in agreement with the relevance oflocal traffic sources in the composition of PM in this area(Canepari et al., 2009; Perrino et al., 2009). Water containedin secondary salts and in some hydrophilic species (carbohy-drates and dicarboxylic acids) is detected mainly in the range1000–2000 s. It is likely that the curve obtained by analyzingthe samples collected in Ferrara is due to water associated tothese compounds. In the area of Ferrara, in fact, particularlyduring the winter, the formation of organic and inorganic sec-ondary species is favored by the occurrence of frequent andlong-lasting atmospheric stability conditions (Matta et al.,2003). Saharan dust (collected at Erfoud, Morocco) in agree-ment with its composition, shows a profile close to those ofSiO2 and Al2O3, with a sharp contribution between 700 and1100 s. This contribution is very similar to one of the con-tributions detected in the filters collected in Tel Aviv, wherethe dust intrusions from the nearby desert are very frequent(Ganor, 1994). It is worth noting that the last contribution inthese filters resembles the road dust and soot profile, as ex-pected for an urban site.
Atmos. Chem. Phys., 13, 1193–1202, 2013 www.atmos-chem-phys.net/13/1193/2013/
S. Canepari et al.: Determination of water in airborne particulate matter 1201
4 Conclusions
The described method, employing a coulometric Karl Fishersystems, allows a direct determination of water in atmo-spheric particulate matter. It shows a good analytical perfor-mance, does not require any filter pre-treatment and is appli-cable to routine field studies.
The method was applied to a series of PM10 samples col-lected in different geographical areas. The results of thesefield studies show that the water content of PM samplesis variable and can reach values over 20 µg m−3. Such anamount of water constitute a relevant fraction of the totalmass of PM and may seriously affect the exceedance of theregulatory concentration limit values.
The use of a thermal ramp for the desorption of water al-lows the separation of different water contributions that arebound to atmospheric particles with different strength. Theprofile of the curve resulted to be characteristic of the sam-pling site; the amount and variety of water is then probablylinked to the chemical characteristics of the dust.
Supplementary material related to this article isavailable online at:http://www.atmos-chem-phys.net/13/1193/2013/acp-13-1193-2013-supplement.pdf.
Acknowledgements.This work was financed by private founds.The Authors gratefully acknowledge C. Ragazzini and G. Simonettifor their collaboration and D. Petrocchi (Metrohm) for his valuablesuggestions.
Edited by: M. C. Facchini
References
Almeida, S. M., Pio, C. A., Freitas, M. C., Reis, M. A., and Tran-coso, M. A.: Approaching PM2.5 and PM2.5–10 source appor-tionment by mass balance analysis, principal component analysisand particle size distribution, Sci. Total Environ., 368, 663–674,2006.
Ansari, A. S. and Pandis, S. N.: Water Absorption by SecondaryOrganic Aerosol and Its Effect on Inorganic Aerosol Behavior,Environ. Sci. Technol., 34, 71–77, 2000.
Baek, B. H., Aneja, V. P., and Tong, Q.: Chemical coupling betweenammonia, acid gases, and fine particles, Environ. Pollut., 129,89–98, 2004.
Balasubramanian, R., Qian, W. B., Decesari, S., Facchini, M. C.,and Fuzzi, S.: Comprehensive characterization of PM2.5 aerosolsin Singapore, J. Geohys. Res., 108, 4523–4539, 2003.
Canepari, S., Cardarelli, E., Pietrodangelo, A., and Strincone, M.:Determination of metals, metalloids and non-volatile ions in air-borne particulate matter by a new two-step sequential leachingprocedure. Part B: validation on real equivalent samples, Talanta,69, 588–595, 2006.
Canepari, S., Pietrodangelo, A., Perrino, C., Astolfi, M. L., andMarzo, M. L.: Enhancement of source traceability of atmo-spheric PM by elemental chemical fractionation, Atmos. Envi-ron. 43, 4754–4765, 2009.
Chow, J. C., Watson, J. G., and Lowenthal, D. H.: Loss of PM2.5Nitrate from Filter Samples in Central California, J. Air WasteManage. Assoc., 55, 1158–1168, 2005.
Chow, J. C., Yu, J. Z., Watson, J. G., Hang Ho, S. S., Bohannan,T. L., Hays, M. D., and Fung, K. K.: The application of thermalmethods for determining chemical composition of carbonaceousaerosols: A review, J. Environ. Sci. Health., Part A, 42, 1521–1541 2007.
Decesari, S., Facchini, M. C., Matta, E., Lettini, F., Mircea, M.,Fuzzi, S., Tagliavini, E., and Putaud, J. P.: Chemical featuresand seasonal variation of fine aerosol water-soluble organic com-pounds in the Po Valley, Italy, Atmos. Environ., 35, 3691–3699,2001.
Dick,W. D., Saxena, P., and McMurry, P. H.: Estimation of wateruptake by organic compounds in submicron aerosols measuredduring the Southeastern aerosol and visibility study, J. Geophys.Res., 105, 1471–1479, 2000.
EN12341: Air Quality. Determination of the PM10 fraction of sus-pended particulate matter – Reference method and field test pro-cedure to demonstrate reference equivalence of measurementmethods, Brussels, 1998.
EN 14902: 2005 Ambient air quality – standard method for the mea-surement of Pb, Cd, As and Ni in the PM10 fraction of suspendedparticulate matter, 2005.
EPA Method 9000: Determination of water in waste materials byKarl Fischer titration, 2007.
Fisher, K.: Neues Verfahren zur maßanalytischen Bestimmung deswassergehaltes von Flussigkeiten und festen Korpern, Angew.Chem., 48, 394–396,1935.
Ganor, E.: The frequency of Saharan dust episodes over TelAviv,Israel, Atmos. Environ., 28, 2867–2871, 1994.
Gysel, M., Crosier, J., Topping, D. O., Whitehead, J. D., Bower, K.N., Cubison, M. J., Williams, P. I., Flynn, M. J., McFiggans, G.B., and Coe, H.: Closure study between chemical compositionand hygroscopic growth of aerosol particles during TORCH2,Atmos. Chem. Phys., 7, 6131–6144,doi:10.5194/acp-7-6131-2007, 2007.
Harrison, R. M., Jones, A. M., and Lawrence, R. G.: A prag-matic mass closure model for airborne particulate matter at urbanbackground and roadside sites, Atmos. Environ., 37, 4927–4933,2003.
Hu, D., Chen, J., Ye, X., Li, L., and Yang, X.: Hygroscopicity andevaporation of ammonium chloride and ammonium nitrate: Rel-ative humidity and size effects on the growth factor, Atmos. En-viron., 45, 2349–2355, 2011.
Khlystov, A., Lin, M., Bolch, M. A., and Ma, Y.: Investigation of thepositive artifact formation during sampling semi-volatile aerosolusing wet denuders, Atmos. Environ., 43, 364–370, 2009.
Kitamori, Y., Mochida, M., and Kawamura, K.: Assessment of theaerosol water content in urban atmospheric particles by the hy-groscopic growth measurements in Sapporo, Japan, Atmos. Env-iron., 43, 3416–3423, 2009.
Kreidenweis, S. M., Remer, L. A., Bruintjes, R., and Dubovik, O.:Smoke aerosol from biomass burning in Mexico: Hygroscopicsmoke optical model, J. Geophys. Res., 106, 4831–4844, 2001.
www.atmos-chem-phys.net/13/1193/2013/ Atmos. Chem. Phys., 13, 1193–1202, 2013
1202 S. Canepari et al.: Determination of water in airborne particulate matter
Levart, A. and Veber, M.: Determination of aldehydes and ketonesin air samples using cryotrapping sampling, Chemosphere, 44,701–708, 2001.
Matta, E., Facchini, M. C., Decesari, S., Mircea, M., Cavalli, F.,Fuzzi, S., Putaud, J.-P., and Dell’Acqua, A.: Mass closure onthe chemical species in size-segregated atmospheric aerosol col-lected in an urban area of the Po Valley, Italy, Atmos. Chem.Phys., 3, 623–637,doi:10.5194/acp-3-623-2003, 2003.
Matuschek, G., Saritas, Y., Karg, E., and Schroeppel, A.: Character-isation of aerosol particles using combined termoanalitycal tech-niques, J. Therm. Anal. Calorim., 78, 575–586, 2004.
Moreira dos Santos, C. Y., de Almeida Azevedo, D., and Radlerde Aquino Neto, F.: Selected organic compounds from biomassburning found in the atmospheric particulate matter over sugar-cane plantation areas, Atmos. Environ., 36, 3009–3019, 2002.
Ohta, S., Hori, M., Yamagata, S., and Murao, N.: Chemical charac-terization of atmospheric fine particles in Sapporo with determi-nation of water content, Atmos. Environ., 32, 1021–1025, 1998.
Pathak, R. K., Wu, W. S., and Wang, T.: Summertime PM2.5 ionicspecies in four major cities of China: nitrate formation in anammonia-deficient atmosphere, Atmos. Chem. Phys., 9, 1711–1722,doi:10.5194/acp-9-1711-2009, 2009.
Pavlath, A. E. and Gregorski, K. S.: Atmospheric pyrolysis of car-bohydrates with thermogravimetric and mass spectrometric anal-yses, J. Anal. Appl. Pyrolysis, 8, 41–48, 1985.
Perrino, C., Canepari, S., Cardarelli, E., Catrambone, M., and Sar-golini, T.: Inorganic constituents of urban air pollution in theLazio region (Central Italy), Environ. Monit. Assess., 128, 133–115, 2007.
Perrino, C., Canepari, S., Catrambone, M., Dalla Torre, S., Rantica,E., and Sargolini, T.: Influence of natural events on the concentra-tion and composition of atmospheric particulate matter, Atmos.Environ., 43, 4766–4779, 2009.
Perrino, C., Marconi, E., Tofful, L., Farao, C., Materazzi, S., andCanepari, S.: Thermal behavior of atmospheric particulate mat-ter, Atmos. Environ., 54, 36–43, 2012.
Perrino, C., Canepari, S., and Catrambone, M.: Comparing perfor-mance of Teflon and quartz membrane filters collecting PM: in-fluence of atmospheric water, Aerosol Air Qual. Res., 13, 137–147, 2013.
Perrone, M. G., Larsen, B. R., Ferrero, L., Sangiorgi, G., De Gen-naro, G., Udisti, R., Zangrando, R., Gambaro, A., and Bolzac-chini, E.: Sources of high PM2.5 concentrations in Milan, North-ern Italy: Molecular marker data and CMB modeling, Sci. TotalEnviron., 414, 343–355, 2012.
Pilinis, C., Pandis, S. N., and Seinfeld, J. H.: Sensitivity of directclimate forcing by atmospheric aerosols to aerosol size and com-position, J. Geophys. Res., 100, 18739–18754, 1995.
Rees, S. L., Robinson, A. L., Khlystov, A., Stanier, C. O., and Pan-dis, S. N.: Mass balance closure and the PM2.5 Federal Refer-ence Method in Pittsburgh, Pennsylvania, Atmos. Environ., 38,3305–3318, 2004.
Sasaki, K. and Sakamoto, K.: Diurnal characteristics of suspendedparticulate matter and PM2.5 in the urban and suburban atmo-sphere of the Kanto plain, Japan, Water Air Soil Pollut., 171,29–47, 2006.
Schnelle-Kreis, J., Sklorz, M., Peters, A., Cyrys, J., and Zimmer-mann, R.: Analysis of particle- associated semi-volatile aromaticand aliphatic hydrocarbons in urban particulate matter on a dailybasis, Atmos. Environ., 39, 7702–7714, 2005.
Schnelle-Kreis, J., Sklorz, M., Orasche, J., Stolzel, M., Peters, A.,and Zimmermann, R.: Semi volatile Organic Compounds in Am-bient PM2.5. Seasonal Trends and Daily Resolved Source Con-tributions, Environ. Sci. Technol., 4, 3821–3828, 2007.
Sloane, C. S. and Wolfe, G. T.: Prediction of ambient light scatter-ing using a physical model responsive to relative humidity: Val-idation with measurements from Detroit, Atmos. Environ., 19,669–680, 1985.
Speer, R. E., Barnes, H. M., and Brown, R.: An instrument for mea-suring the liquid content of aerosols, Aerosol Sci.Technol., 27,50–61, 1997.
Speer, R. E., Edney, E. O., and Kleindienst, T. E.: Impact of or-ganic compounds on the concentration of liquid water in ambientPM2.5, J. Aerosol Sci., 34, 63–77, 2003.
Squizzato, S., Masiol, M., Brunelli, A., Pistollato, S., Tarabotti,E., Rampazzo, G., and Pavoni, B.: Factors determining the for-mation of secondary inorganic aerosol: a case study in the PoValley (Italy), Atmos. Chem. Phys. Discuss., 12, 16377–16406,doi:10.5194/acpd-12-16377-2012, 2012.
Stanier, C., Khlystov, A., Chan, W. R., Mandiro, M., and Pandis, S.N.: A method for the in-situ measurement of aerosol water con-tent of ambient aerosols: The Dry-Ambient Aerosol Size Spec-trometer (DAASS), Aerosol Sci. Technol., 38, 215–228, 2004.
Swietlicki, E., Zhou, J., Berg, O. H., Martinsson, B. G., Frank, G.,Cederfelt, S., Dusek, U., Berner, A., Birmili, W., Wiedensohler,A., Yuskiewicz, B., and Bower, K. N.: A closure study of sub-micrometer aerosol particle hygroscopic behavior, Atmos. Res.,50, 205–240, 1999.
Tsai, Y. I. and Kuo, S. C.: Aerosol Water Content and ChemicalComposition in a Metropolitan and a Coastal Area in SouthernTaiwan, Atmos. Environ., 39, 4827–4839, 2005.
Tsyro, S. G.: To what extent can aerosol water explain the dis-crepancy between model calculated and gravimetric PM10 andPM2.5, Atmos. Chem. Phys., 5, 515–532,doi:10.5194/acp-5-515-2005, 2005.
Vecchi, R., Valli, G., Fermo, P., D’Alessandro, A., Piazzalunga, A.,and Bernardoni, V.: Organic and inorganic sampling artefacts as-sessment, Atmos. Environ., 43, 1713–1720, 2009.
Yuc, X. Y., Lee, T., Ayres, B., Kreidenweis, S. M., Malm, W., andCollett Jr., J. L.: Loss of fine particle ammonium from denudednylon filters, Atmos. Environ., 40, 4797–4807, 2006.
Atmos. Chem. Phys., 13, 1193–1202, 2013 www.atmos-chem-phys.net/13/1193/2013/