Embed Size (px)
Citation preview

AMERICAN JOURNAL OF PHYSICAL ANTHROPOLOGY 99:4345 (1996)
Ontogeny of Body Size Variation in African Apes STEVEN R. LEIGH AND BRIAN T. SHEA Department of Anthropology, University of Illinois, Urbana, Illinois 61801-3672 (S.R.L.), Departments of CMS Biology and Anthropology, Northwestern University Medical School, Chicago (B. TS.), Illinois 60611-3008
KEY WORDS Primates, Growth and development, Growth spurt
ABSTRACT Size variation in African apes (Gorilla gorilla [gorilla], Pan paniscus [pygmy chimpanzee], and Pan troglodytes [“common” chimpanzee]) is substantial, both within and between species. We investigate the possible evolutionary significance of this variation through an analysis of the ontogeny of size variation in this group. In addition, we highlight possible areas of future endocrinological research, and evaluate recently proposed alternative models that attempt to account for ontogenetic variation in apes. The present study shows that intergeneric variation in size is largely a consequence of differences among species in the rate of body weight growth. Interspecific size variation in Pan is a product of both rate and duration differences in growth. The ontogenetic bases of sexual dimorphism vary in this group. Dimor- phism is largely a result of sex differences in the duration of body weight growth in gorillas and pygmy chimpanzees, but results from differences in the rate of growth in common chimpanzees. Ontogenetic analyses largely confirm earlier interpretations, but with better data and methods. The great degree of ontogenetic variation within and among these species, especially in the timing and magnitude of “pubertal” growth spurts, implies that studies of endocrine growth control in African apes could be a productive line of future research. We also suggest that ontogenetic variation can be understood with respect to ecological risks. Growth rates seem to be negatively correlated with ecological risk in African apes, suggesting links between ontogenetic patterns and social and ecological variables. High growth rates in gorillas compared to Pan are most consistent with this model. Variation between chimpanzees and pygmy chimpanzees (especially females) also seem to fit predictions of this model. o 1996 Wiley-Liss, Inc.
Adult size variation within and among Af- rican ape species (Gorilla gorilla [gorilla], Pan paniscus [pygmy chimpanzee], and Pan troglodytes [“common” chimpanzeel) is rela- tively well documented (Harvey et al., 1986; Fleagle, 1988; Jungers and Susman, 1984; Shea, 1983; Uehara and Nishida, 1987). This information is critical to understanding nearly all aspects of ape biology and has sig- nificant implications for a broad range of research questions (Calder, 1984; Doran, 1993; Fleagle, 1985; Jungers, 1985; Schmidt- Nielson, 1984). Despite fairly good documen-
tation of adult size variation in African apes, there is uncertainty about the exact nature and evolutionary significance of this varia- tion within and among these species (cf. Doran, 1993). More importantly, reliable data about the ontogenetic bases of adult size variation in these species are rare, pre-
Received February 22, 1994; accepted September 28, 1994. Address reprint requests to Steven R. Leigh, Department of
Anthropology, University of Illinois, 109 Davenport Hall, 607 S. Mathews St, Urbana, IL 61801-3672.
0 1996 WILEY-LISS. INC.

44 S.R. LEIGH AND B.T. SHEA
cluding detailed assessments of the signifi- cance of sexual and specific size differences in this group.
Information about ontogeny is central to the interpretation of adult size variation be- cause ontogenies are subject to evolutionary pressures (e.g., natural and sexual selection) (see Gould, 1977; Shea, 1983, 1990, 1992). In addition, ontogenetic differences within and among species may be related to alterna- tive evolutionary forces that are not neces- sarily strongly correlated with terminal adult size (DeRousseau, 1990; Shea, 1990). This problem is clearly illustrated in studies of sexual size dimorphism in which similar levels of adult body size dimorphism can be shown to have variable ontogenetic bases (Leigh, 1992a,b; Shea, 1986). An ontogenetic perspective provides insight into the evolu- tionary significance of size variation by allowing direct investigation of key life his- tory variables that ultimately control adult size, including growth rates (Janson and van Schaik, 1993) and ages at maturation (Stearns, 1992). Thus, the present analysis attempts to link information about size on- togeny to hypotheses about life history varia- tion in apes. Our basic objectives are to eval- uate and extend Shea’s (1983) proposal that two distinct processes result in adult size differences within and among ape species. His comparisons indicated that sex differ- ences in the duration of growth were mainly responsible for sexual size dimorphism within species. On the other hand, differ- ences in rates of growth seemed to account for variation in adult size among species. These results suggested that the allometric extensions within and among African ape species could be accounted for by differing heterochronic processes. Furthermore, Shea suggested that differences in growth rates and durations that influenced heterochronic processes could be linked to sexual selection (intraspecifically) and to ecological differ- ences (interspecifically).
Shea’s absolute growth data were quite variable in terms of sample size and quality, limiting his conclusions to rather general statements. The comparatively low quality of absolute growth data available at that time obviously precluded insight into more subtle aspects of ontogeny (e.g., variation in
growth spurts), which have significant con- sequences for adult size and may be associ- ated with important evolutionary variables (Leigh, 1992a,b, 1994a,b). In addition, a much better understanding of African ape socioecology (Wrangham, 1986) and life history strategies (Watts and Pusey, 1993) has become available since Shea’s (1983) analysis. These new data create an opportu- nity for more detailed knowledge of the onto- genetic processes that result in terminal adult size in these species. Finally, powerful analytical methods for the analysis of onto- genetic data have been developed in the last decade.
Information about variation in ontogeny serves as a foundation for extension of Shea’s previous research into two major areas. First, an understanding of variation in body weight ontogeny is a necessary initial step for investigations of the endocrine control of growth in apes, particularly since other measures of size growth (e.g., trunk length) from individuals of known age are very rare. We explicitly intend our analyses to provide information that could be relevant to endo- crinological analyses of these species. Sec- ond, hypotheses about evolutionary factors that influence adult size can be presented. We develop these hypotheses within a theo- retical framework that makes predictions about the adaptive significance of ontoge- netic variation in primates. Specifically, we present a preliminary evaluation of Janson and van Schaik’s (1993) hypothesis that growth at a slow rate is a risk aversion strat- egy in social primates. This life history strat- egy evolves as a consequence of ecological risks that result primarily from intraspecific feeding competition. Growth a t a slow rate is a feasible response to feeding competition because it minimizes chances of death per unit time by reducing metabolic costs of growth. This ontogenetic “option” is avail- able to primates because group life is thought to moderate predator pressure, which otherwise favors rapid maturation. Evaluation of Janson and van Schaik‘s (1993) hypothesis is especially important for apes because a previous analysis (Watts and Pusey, 1993) raises important questions about the ability of this model to adequately explain ontogenetic variation in apes. There-

SIZE ONTOGENY IN AFRICAN APES 45
TABLE 1. Comparative developmental information for African apes
Variable Gorilla porilla Pan Daniscus Pan trododvtes
Sample size Average birthweight Average gestation length‘ Average prenatal growth rate Mean captive adult weight (g)
Male Female
Male Female
Literature-reported Adult Weight (gI2
Weaning age3 First labial swelling First adult-sized sexual swelling Age at menarche Female first birth Start testes growth accel. First ejaculation Adult-sized scrotum
72 F, 64 M 2,327 g 259 days 8.98 g/day
169,000 80,250
169,500 71,500 3 4 8
7-8 10-12
ca. 9 ca. 9
-
-
13F, 23M 1,467 g 228 days 6.43 g/day
46,870 33,940
45,000 33,200
ca. 7
ca. 9 ca. 13-15 ca. 9
-
-
-
22 F, 23 M 1,766 g 232 days 7.61 g/day
57,150 45,000
60,000 47,400 5 6-7 10 11 14-15 9 9 12-13
IArdito (1976)
?These and all subsequent data from Watts and Pusey (1993) and expressed in years Jungers and Susman (1984).
fore, we present a preliminary evaluation of this hypothesis with absolute growth data from African apes.
MATERIALS AND METHODS Materials
Chronological age and weight measures were derived from 222 captive African apes housed a t zoological parks and primate cen- ters throughout the world (Table 1). All weight measures were derived from clini- cally normal animals, and additional infor- mation about this sample is detailed else- where (Leigh, 1992a,b, 1994a,b; Leigh and Shea, 1995). With the exception of a small number of individuals (10 gorillas older than 19 years of age and 5 pygmy chimpanzees older than 13 years of age) all ages are exact to the day. Both absolute (weight for age) and specific growth are investigated. Spe- cific growth rates are measured by dividing growth rate at each age by predicted size at that age. These estimates can be used in appraising differences in growth rates inde- pendent of size.
Analyses of subspecies are not under- taken. Gorillas are represented solely by the western lowland subspecies (Gorilla gorilla gorilla). Pygmy chimpanzees are not cur- rently allocated to different subspecies. The “common” chimpanzees in this sample are of unknown subspecies. Subspecific variation
(Groves, 1970; Morin et al., 1994; Shea et al., 1993) in ontogeny could be important for these species, but data for various subspe- cies are not available. In addition, ontoge- netic data from wild animals are currently unobtainable. Thus, data from captive ani- mals supply information about ontogeny in these species. We assume that captivity does not radically alter the general pattern of in- terspecific differences in ontogeny, although precise rates and durations of growth may differ from wild populations. It can be noted that correlations between captive and wild- shot weights are high (Leigh, 1994b) and that the relevance of captive data to evolu- tionary problems has been discussed pre- viously (Leigh, 1992a,b, 1994a,b).
Estimates of gestation length are obtained from literature sources (Ardito, 1976; Har- vey et al., 1986). Gestation lengths for each species are averaged from multiple values given by Ardito, and are used to calculate total age (age from conception) and mean prenatal growth rates.
Methods
Data treatment. All mixed-longitudinal data are treated cross-sectionally in this study. This procedure precludes analyses of individual variation in ontogeny, but does provide information that is adequate for comparisons of growth among groups (spe-

46 S.R. LEIGH AND B.T. SHEA
cies or sexes within a species) (Eveleth and Tanner, 1990; Tanner, 1978). Description of cross-sectional growth can be shown to give an approximation of the average of growth trajectories based on longitudinal treatment of the data (Leigh, 1992a; Dielman, 1989), and can thus be considered appropriate for group comparisons.
Nonparametric regression. Nonpara- metric lowess and loess regressions (Cleve- land, 1979; Cleveland and Devlin, 1988; Efron and Tibshirani, 1991) are employed to provide an empirical description of growth for each sex in each species. These methods are extremely flexible, and are optimal in interspecific comparisons of ontogeny be- cause the resulting descriptions of growth are not dependent on the functional form of a particular regression model. Both forms of regression iteratively fit a line through segments of a bivariate distribution in a number of steps (Efron and Tibshirani, 1991).
Lowess smoothing robustly fits a scat- terplot because residuals are inversely weighted (Cleveland, 1979). Lowess is used for basic description of ontogenetic trajector- ies. However, 95% bootstrapped confidence intervals are generated using loess (nonro- bust) fits to the data with S-Plus statistical software (S-Plus, 1991). Programs that ac- complish bootstraps with lowess fits are, to our knowledge, presently unavailable. In ad- dition, confidence intervals from loess re- gression are more conservative than those based on lowess fits because residuals are not inversely weighted. Confidence intervals are presented for intraspecific plots and in selected interspecific comparisons. We should note that the structure of the data (unbalanced and longitudinal) greatly com- plicates traditional significance testing (see Dielman, 1989; Schneiderman, 1992).
Parametric regression. The “JPPS” para- metric regression model, developed by Joli- coeur et al. (1988,1991), is used in this study to describe absolute growth in mass. Al- though originally developed to describe hu- man statural growth, this model appears to describe weight growth in African apes well, and has been shown to model a wide range
of variation in human growth (including pathological cases [Pontier, et al., 19881). The JPPS model, like others developed by Jolicouer and colleagues, relies on estimates of total age (=postnatal age plus length of gestation period). The main advantage of us- ing total age is that the regression line pas- ses through the origin (X = 0, Y = 0). Joli- couer (1985) suggests that this feature is desirable because it is biologically realistic to consider the size at fertilization (that of a single cell) negligible and nearly equal for all animals. Thus, a curve that passes through the origin is biologically more plau- sible with respect to somatic growth than are curves designed to describe population growth (as are most commonly encountered growth curves). The JPPS growth curve is given by the equation
Wt = A(1 - 1/[1 + (Age/D1)C1 + (Age/D2)C2 + (Age/D3)C31).
Jolicouer et al. (1991, Table 1) describe D1, D2, and D3 as time scale factors (in years) and Cl-C3 as dimensionless exponents. They find that the JPPS model fits human growth curves more adequately than Preece- Baines models because the JPPS model pas- ses through the origin, and describes human growth a t all ages equally well (unlike some kinds of Preece-Baines models).
Estimates of growth rates for both nonpar- ametric and parametric regressions are cal- culated by dividing the difference in succes- sive predicted weight values (Y) by the difference in successive age values (X) (equivalent to Coelho et a1.k [19841 pseudo- velocity curves). Pseudo-velocity curves yield approximations of the first derivative for each sex in each species and are useful in detecting the presence of growth “spurts.” Although longitudinal data are ideal in the detection and calibration of growth spurts (Tanner, 19781, cross-sectional data can re- veal their presence. It is possible that cross- sectional data consistently underestimate the magnitude of peak velocity, but this de- pends on the level of variation in individual growth within a group. In essence, cross- sectional data can be expected to provide conservative estimates of both the presence of a growth spurt and peak velocity if individ-

SIZE ONTOGENY IN AFRICAN APES 47
ual variance in growth is high. We are also investigating species in which growth dura- tions are short compared to humans, lim- iting the degree of possible variance in the timing of growth spurts. Finally, specific growth rates are intended to evaluate size- independent rates of growth.
Interpretations of distance and pseudo-ve- locity curves are supplemented by compari- sons of “size trajectories” among groups (e.g., among species by sex or within species be- tween sexes). These curves compare sizes for each species or sex a t equal ages and are bivariate plots of the JPPS model’s predicted size values for each group a t common ages. Size trajectories provide direct information about intersexual and interspecific ontoge- netic size differences. In these plots, a line of identity (Y = X) represents completely shared ontogenetic trajectories. Deviations from this line indicate size differences at common ages that are a consequence of growth rate discrepancies (or differences in the duration of growth). In size trajectory plots, the case with the smallest adult size is plotted on the X axis, while larger cases are plotted on the Y axis.
Lowess regressions and several statistical tests are accomplished with either with Sys- tat (Wilkinson, 1990) or StatXact (Mehta and Patel, 1992). StatXact uses exact permu- tational methods in statistical tests. Con- fidence intervals for loess regressions are calculated with S-Plus statistical software (S-Plus, 1991). All confidence intervals are calculated a t the 95% level. Finally, a proba- bility value of .05 is chosen as a critical value for estimates of statistical significance.
R ES U LTS Birth weight and average prenatal
growth rates Birth weights among African apes vary in
directions that are consistent with adult size (Table 1, Fig. 1). Gorilla neonates are, on average, the largest (2,327 g), followed by common chimpanzees (1,766 g), and pygmy chimpanzees (1,467 g). Samples for gorillas and pygmy chimpanzees are rather small. Exact permutational Kruskall-Wallis tests for gorillas and common chimpanzees sug- gest that there are no significant differences
in sexual size dimorphism at birth in these species (P = .1905 for gorillas; P = .1183 or .7335 for chimpanzees, depending upon whether or not an aberrantly small male value is used). Male gorillas tend to be con- sistently larger then females, a pattern not observed in the other species. The lowest birthweight of any animal is observed for a male common chimpanzee.’ Differences in birthweight between gorillas and either Pan species (sexes combined) are statistically significant, as are differences between pygmy and common chimpanzees (Table 2).
Average prenatal growth rates, calculated by dividing average birthweight by average gestation length, vary among these species (Table 1). Gorillas grow a t the highest aver- age prenatal growth rate (8.98 g/day). The average prenatal growth rate in common chimpanzees is slightly slower (7.61 g/day), and the average pygmy chimpanzee growth rate is the slowest (6.43 g/day). Unfortu- nately, statistical tests on these values are not possible with the available data. How- ever, some estimate of the range of variation is provided by dividing average birthweight by the extremes of reported gestation lengths (Table 3). Ranges suggests that go- rillas and pygmy chimpanzees do not overlap in terms of average prenatal growth rate. On the other hand, common chimpanzee growth rates could overlap with the other African apes. Maximum possible ranges (lowest birthweight divided by longest reported ges- tation and highest birthweight divided by shortest reported gestation) overlap to a great degree among these species.
Post-natal growth Comparisons among species
Gorilla us. Pan. Estimates of growth curves based on parametric and nonpara- metric models are consistent in their mea- surement of growth differences among spe- cies (Figs. 2, 3; see Table 4 for parameter
’It should he noted that this very small male survived birth and was alive for its most recent weight a t the age of 4 years. All early postnatal weights for this animal are very low, implying that measurement error is not responsible for the low birthweight. Our records are not sufficient to determine if this animal was premature or if there were clinical complications to the pregnancy.

48 S.R. LEIGH AND B.T. SHEA
MALE FEMALE
3
h - 5 * + I
W I? s ; 1 c
0 PP PT GG PP PT
SPECIES SPECIES
Fig. 1. Box and whiskers plots of birthweights for male and female African apes. In this and in subsequent plots, “ G G refers to Gorillagorilla, “ P P refers to Pan paniscus, and “IT’ to Pan troglodytes.
TABLE 2. Exact permutational tests for significant differences in birthweight among species
(sexes are combined)
Gorilla gorilla vs. Pan paniscus Gorilla gorilla vs. Pan troglodytes Pan paniscus vs. Pan troglodytes Gorilla gorilla vs. Pan troglodytes
(excludes unusually low value) Pan paniscus vs. Pan troglodytes
(excludes unusually low value)
0.0004 0.0000 0.0150 0.0000
0.0074
TABLE 3. Estimated minimum and maximum average prenatal growth rates for African apes’
Gorilla gorilla Pan paniscus Pan troglodytes
Minimum 8.05 5.64 6.54 Maximum 9.27 7.48 8.41
‘Values are calculated by dividing the average birthweight by mini- mum and maximum reported gestation lengths IArdito, 19761. All values in glday.
values; bivariate data plots of age and mass data and confidence intervals are presented along with intraspecific comparisons). Goril- las can be expected to grow faster than either pygmy chimpanzees or common chimpan- zees during postnatal growth, continuing a prenatal trend. Growth durations vary such
that female gorillas cease growth earlier than female common chimpanzees but later than female pygmy chimpanzees. On the other hand, male gorillas cease growth later than Pan males. Curves of specific growth rates plotted against age suggest that female gorillas generally exhibit relatively higher growth rates than either Pan paniscus or Pan troglodytes, with the most pronounced differences early in ontogeny (Fig. 4). Spe- cific growth rates for male gorillas are also generally higher than specific growth rates for Pan.
Size trajectory curves confirm results based on inspection of distance and pseudo- velocity curves. Curves for males suggest that gorillas do not overlap in size with ei- ther chimpanzees or pygmy chimpanzees (Figs. 5, 6). Comparisons of size trajectories for females present a similar situation. Thus, female gorillas do not, on average, share size trajectories with either of the other two species.
Pan paniscus us. Pan troglodytes. Size differences between the Pan species are re- lated to both rate and duration of growth.

SIZE ONTOGENY IN AFRICAN APES 49
i GG .
Male
Female
200
160
- a Y - !i 100 a E
50
0 0 10 20 30
AGE (YEARS)
20
16 - a >
-5 0 5 10 15 20 25
AGE (YEARS)
2 0
1s
0
-6 0 5 10 15 20 25
AGE (YEARS) AQE (YEARS)
Fig. 2. Lowess-estimated (robust locally weighted least squares) growth curves for African apes by sex. The left-hand column contains distance (estimated weight for postnatal age), and the right-hand column presents pseudo-velocity curves (kg/year by age). Individual weight and age observations are presented in plots for intraspecific analyses. “GG’ refers to Gorilla gorilla (solid line), ‘ ‘ I T to Pan troglodytes (dotted line), and “ P P to Pan paniscus (dashed line) .
Early postnatal growth rates are quite com- parable between these species for both sexes (Figs. 2, 3). However, both parametric and nonparametric regressions suggest that growth rates and durations vary between sexes and species. Male growth in Panpanis- cus proceeds at a slower rate than Pan trog- lodytes between the ages of one and four years, but a clear male €? paniscus growth spurt eliminates any average size difference
between 6 and 8 years. On the other hand, female pygmy chimps are, on average, con- sistently smaller than female common chimps, despite higher growth rates between 4 and 6 years of age. Growth rates in Pan paniscus are more varied than Pan troglo- dytes prior to 8 years of age. Adult female common chimpanzees are larger than adult pygmy chimpanzees mainly because they have higher growth rates very early and

50 S.R. LEIGH AND B.T. SHEA
Male
Female
0 10 2 0 30
AGE (YEARS) AGE (YEARS)
100
80
8 60
E m
s 40
Y - -
20
0 0 10 2 0 30
AQE (YEARS) AQE (YEARS)
Fig. 3. Parametric growth curves (JPPS model) for African ape species.
grow for a much longer period of time. In females, more rapid later growth in pygmy chimpanzees does not, on average, compen- sate for slower early growth. Confidence in- tervals on slopes comparing female growth in Pan (Fig. 7) indicate that the predicted size trajectory for common chimpanzees is at the extreme upper confidence interval for pygmy chimpanzees at around three years of age. However, upper and lower confidence intervals for pygmy chimpanzees exceed their counterparts for common chimpanzees by about 7 years of age. Finally, plots of spe-
cific growth rates show that the relation be- tween these two species size-adjusted growth rates vary through time in a manner similar to absolute growth trajectories (Fig. 4).
Analyses of covariance suggest the pres- ence of statistically significant differences for females (Table 5). For females (assuming a linear growth rate, and independence among observations), the average growth rate for Pan troglodytes between the ages of one and six years of age significantly exceeds the average growth rate for Pan paniscus. The difference is not statistically significant

SIZE ONTOGENY IN AFRICAN APES 51
TABLE 4. Parameter estimates and standard errors for parameters from the JPPS model
Case A D1 c1 D2 c2 D3 c 3
Male Gorilla 162 9.44 6.94 SE 1.68 7.73 0.93
Female Gorilla 81.79 8.73 5.51 SE 1.06 132.30 4.24
Male E! paniscus 47.01 39.02 5.24 (SEs not computable)
Female P paniscus 34.42 35.09 5.90 (SEs not computable)
SE 0.51 0.53 2.50 Female E! troglodytes 46.04 8.48 1.92
SE 0.69 8.30 3.32
Male P troglodytes 57.33 9.19 4.79
11.85 10.75 10.40 1.78 7.39
6.85
9.97 0.40 8.93 1.05
1.44 0.10 1.18 0.17 5.30
5.90
19.03 6.24 6.95 2.51
16.21 562.67
6.33 15.80 12.89
9.28
12.12 5.39
44.81 747.54
6.94 27.03
4.94 1.13 1.12
1.07
1.22 0.29 0.79 2.76
between the ages of 2 and 6 years, and a higher growth rate is observed in Pan panis- cus. Male growth rates during these inter- vals are not significantly different.
Size trajectories clearly illustrate inter- specific contrasts in absolute growth. Males follow a very similar ontogenetic trajectory almost until pygmy chimpanzees reach adult size (Fig. 5). However, females can be ex- pected to share common sizes a t common ages only for the earliest part of ontogeny (Fig. 5). Female size trajectories show that female common chimpanzees are consis- tently larger than pygmy chimpanzees, even though growth rates in Pan paniscus are higher later in ontogeny.
Comparisons within species Gorilla. The African ape species all at-
tain a t least moderate levels of sexual size dimorphism (Jungers and Susman, 1984; Leigh and Shea, 1995; Shea, 1985, 1986). Nonparametric lowess regressions suggest that male and female gorilla growth curves diverge at approximately 6-7 postnatal years (Fig. 8). Female growth then ceases at approximately 9.5-10 years of age. Males continue growth beyond this age. Pseudo- velocity curves for gorillas suggest that fe- male and male growth rates are stable for the first year. After this point, the male growth rate increases, while the female growth rate decreases The female growth rate then increases, attaining a cross-sec- tionally defined peak velocity of about 11 kg/ year a t 5 years of age. The growth rate then declines steadily. Male peak velocity is at- tained at approximately 8 years of age at slightly under 19 kglyear, then declines.
Fluctuation of growth rates at older ages is a consequence of variation in sample size. Specific growth rates are very similar, and differences in the shapes of the curves are most obvious at the peak of the male growth spurt (Fig. 9).
Parametric curves modeled by the JPPS curve suggest a pattern consistent with other methods (Fig. 10). However, these curves indicate minimal average divergence until around eight years of age, and the fe- male growth period appears to be slightly longer when growth is described in this man- ner. Pseudo-velocity curves indicate very high early growth rate in male gorillas, sug- gesting the initiation of a “pubertal” growth spurt at about five years of age. Peak velocity measured by the JPPS curve for males is comparable to peak velocity measured through lowess regression. However, the JPPS curve shows that the velocity peak is later than suggested by lowess regression for both females and males. Parametric curves imply that average female growth rate ex- ceeds the male growth rate between 4 and 6 years of age. This contrasts with the non- parametric model which suggests that, on average, female growth rates after 1 year of age can be expected to be lower than male growth rates.
The intraspecific size trajectory for Gorilla is nonlinear (Fig. 111, indicating fluctuations in growth rate differences between sexes. Substantial differences in size trajectories arise as both sexes approach the 60 kg size range.
Pan paniscus. Pygmy chimpanzees ex- hibit a pattern of dimorphic ontogeny that is similar to Gorilla in its general features
52 S.R. LEIGH AI
FEMALE
47
0
n v)
-5 0 5 10 15 20
AGE (YEARS)
MALE
3
2 -
1 -
0 -
1
-1 -5 0 5 10 1s 20
AQE (YEARS)
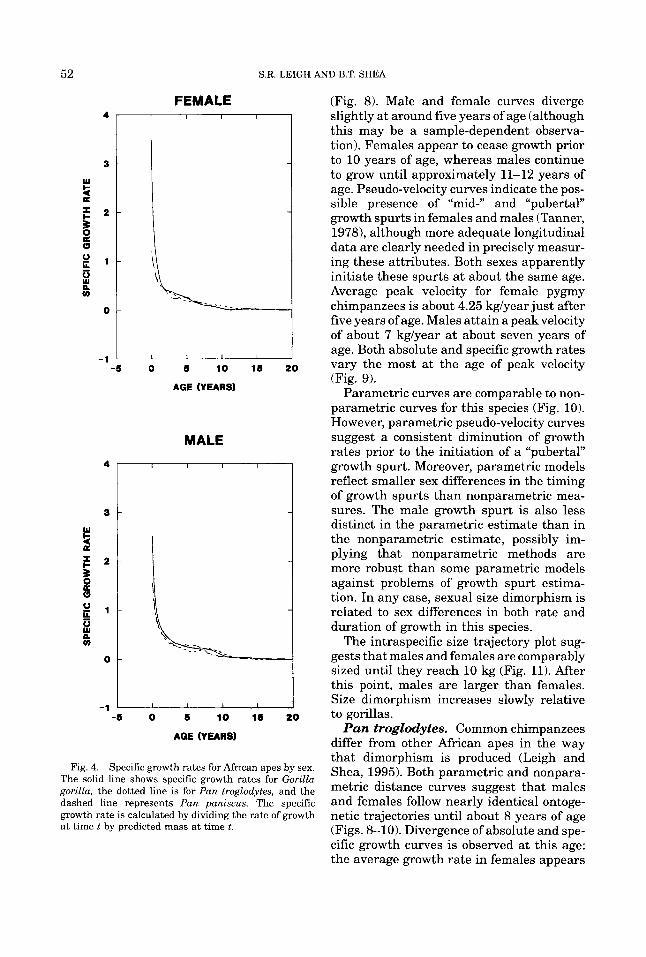
Fig. 4. Specific growth rates for African apes by sex. The solid line shows specific growth rates for Gorilla gorilla, the dotted line is for Pan troglodytes, and the dashed line represents Pan paniscus. The specific growth rate is calculated by dividing the rate of growth at time t by predicted mass a t time t.
\ID B.T. SHEA
(Fig. 8). Male and female curves diverge slightly at around five years of age (although this may be a sample-dependent observa- tion). Females appear to cease growth prior to 10 years of age, whereas males continue to grow until approximately 11-12 years of age. Pseudo-velocity curves indicate the pos- sible presence of “mid-” and “pubertal” growth spurts in females and males (Tanner, 1978), although more adequate longitudinal data are clearly needed in precisely measur- ing these attributes. Both sexes apparently initiate these spurts at about the same age. Average peak velocity for female pygmy chimpanzees is about 4.25 kglyear just after five years of age. Males attain a peakvelocity of about 7 kglyear at about seven years of age. Both absolute and specific growth rates vary the most at the age of peak velocity (Fig. 9).
Parametric curves are comparable to non- parametric curves for this species (Fig. 10). However, parametric pseudo-velocity curves suggest a consistent diminution of growth rates prior to the initiation of a “pubertal” growth spurt. Moreover, parametric models reflect smaller sex differences in the timing of growth spurts than nonparametric mea- sures. The male growth spurt is also less distinct in the parametric estimate than in the nonparametric estimate, possibly im- plying that nonparametric methods are more robust than some parametric models against problems of growth spurt estima- tion. In any case, sexual size dimorphism is related to sex differences in both rate and duration of growth in this species.
The intraspecific size trajectory plot sug- gests that males and females are comparably sized until they reach 10 kg (Fig. 11). After this point, males are larger than females. Size dimorphism increases slowly relative to gorillas.
Pan troglodytes. Common chimpanzees differ from other African apes in the way that dimorphism is produced (Leigh and Shea, 1995). Both parametric and nonpara- metric distance curves suggest that males and females follow nearly identical ontoge- netic trajectories until about 8 years of age (Figs. 8-10). Divergence of absolute and spe- cific growth curves is observed at this age: the average growth rate in females appears

SIZE ONTOGENY IN AFRICAN APES
MALE
53
FEMALE
180 y rm rm I 0 10 20 30 40 50 60
P' pudscus (kg)
Fig. 5. Size trajectory curves for comparisons among species. These curves are obtained by plotting predicted size values a t equal ages for each species. The solid straight lines represent identity (y = XI. The uppermost solid lines are plots of predicted gorilla mass against predicted pygmy chimpanzee mass at equal ages. The
to be stable, but the average male growth rate increases. Pseudo-velocity curves sug- gest that males exhibit a pronounced puber- tal growth spurt, but that females do not. Specifically, nonparametric curves for fe- males indicate a slight increase and then fluctuation of average growth rate, with two possible and nearly equivalent peak veloci- ties. Parametric pseudo-velocity curves are comparable, possibly suggesting that growth rates in females increase slowly until about 8 years of age. The apparently more promi- nent growth spurt in the parametric model is expected because the JPPS curve includes parameters that are intended to measure growth spurts, but these are difficult to spec- ify because parameters are highly corre- lated. Both measures of ontogeny suggest that rate differences in growth account for the moderate level of dimorphism in this spe- cies (Leigh and Shea, 1995).
Size trajectory plots show that females
100
80 n D Y
e,
9 60
Y
E
% 8 8 40
20
I
0 10 20 30 40 50
Hd8CUS (kg)
dashed lines represent plots of chimpanzee mass against pygmy chimpanzee mass. The solid line at Y = X would represent values for pygmy chimpanzees plotted against themselves. These plots show the deviation in size among species a t each point along a size trajectory for pygmy chimpanzees.
and males are similarly sized until about 22 kg (Fig. 11). After this point, size differences gradually arise, accelerating as the male growth spurt is initiated. Comparable ages at cessation of growth are reflected by the plateau at the upper end of the size tra- jectory.
DISCUSSION This analysis facilitates emendment of
previous analyses of the ontogeny of size dif- ferences within and between African ape species (Shea, 1983, 1985). First, Shea's (1983) general interpretations concerning absolute size growth within and between species were accurate, particularly for com- parisons among species. We should stress that the present analysis does not explore heterochronic correlates of absolute size growth variation as did Shea (1983). How- ever, our new data and methods reveal that

54 S.R. LEIGH AND B.T. SHEA
FEMALE
160
& 80
40
- D Y Y
8
8 P
mr
0 k
MALE
-
0 10 20 30 40 50 60
Pan trog/odyres (kg)
100
80
60
40
20
0 0 10 20 30 40 50
pat? troglodytes (kg)
Fig. 6. Plot of gorilla mass against common chimpanzee mass at equal ages. The straight line repre- sents identity (y = x) .
adult size variation within and among spe- cies appears to involve greater variation in growth rates and durations than previously determined. Second, we can suggest that the present descriptions of mass growth have implications with respect to endocrine con- trol of growth. Third, we can refine Shea’s suggestion that sexual selection accounts for intraspecific size differences in apes while natural selection can account for interspe- cific size variation.
Ontogenetic processes Differences in the rate of body weight
growth are broadly responsible for the varia- tion in adult size among these species, espe- cially when gorillas are compared to either of the other two species. The effects of rate differences pervade ontogenetic compari- sons: a t no point during ontogeny (assuming linear prenatal growth trajectories) do either of the Pan species grow absolutely faster than gorillas. In addition, several matura- tion events occur earlier in gorillas (particu- larly females) than in Pan (especially com-
mon chimpanzees) (Table 1; Watts and Pusey, 1993).
Rate differences between gorillas and Pan are achieved through fluctuating growth rates. This is summarized most effectively by pseudo-velocity curves and by nonlinear- ity in size trajectory plots. Variation in the timing and magnitude of growth spurts ap- pears to be particularly important in leading to size differences among these species. Al- though rate differences describe variation between Gorilla and Pan for both males and females, this general pattern is complicated by variation in growth duration. Specifically, a high growth rate in female gorillas relative to common chimpanzees is coupled with early maturation in female gorillas (Leigh and Shea, 1995; Shea, 1985,1986; Watts and Pusey, 1993). This finding implies that fac- tors responsible for the evolution of variation in both rate and time processes distinguish these species. The effects of differences in growth rate exceed the effects of differences in growth duration when female gorillas are compared to female common chimpanzees.

SIZE ONTOGENY IN AFRICAN APES 55
PAN FEMALES
40
2 30 I- I
- P 5 20
10
I I I 1 0 5 10 15 20
AGE (YEARS)
Fig. 7. Loess-estimated confidence intervals for pygmy and common chimpanzee females. The predicted slope for pygmy chimpanzees is not presented. The solid line represents the predicted slope for common chimpan- zees, the dotted lines are upper and lower confidence intervals on the slope for common chimpanzees, and the dashed lines represent confidence intervals on the regression slope for female pygmy Chimpanzees.
TABLE 5. Probability values for analyses of convariance for tests of significant differences in slope for selected age ranges in pygmy chimpanzees and common chimpanzees
Age (years) Female Male
1-6 .01 21 2-6 .06 .10
On the other hand, only minimal differences in growth duration distinguish female goril- las from female pygmy chimpanzees. Com- parisons among males suggest that rate differences mainly account for the size differ- ence between gorillas and either of the two Pan species. However, extension of the male growth period in Gorilla contributes sub- stantially to the final size differences be- tween males of these genera. Thus, duration differences magnify intergeneric size differ- ences among males that are initiated by growth rate differences. Contrasts in growth duration are largest when male gorillas are compared to male pygmy chimpanzees.
Differences in the duration of body weight growth are mainly responsible for size differ- ences between Pan troglodytes and Pan pan- iscus. This pattern is especially obvious for males. Although common sizes are observed throughout much of ontogeny, differences in the timing of growth spurts are evident. Common sizes are maintained despite differ- ences in underlying growth rates because an earlier growth spurt in male Pan paniscus allows this species to “catch-up’’ to common chimpanzees. This may imply that evolu- tionary forces have acted on different ontoge- netic attributes or phases to yield animals of comparable size throughout the middle portion of ontogeny, and is consistent with the close similarities in allometric (Inouye, 1992; Shea, 1981, 1983, 1985) and behav- ioral (Doran, 1992) trajectories. Females do not share the striking similarities in dis- tance curves and size trajectories a t young ages that are apparent for males. Both abso- lute and specific growth rates in pygmy chimpanzee females do exceed those of com- mon chimpanzee females for a substantial period of time, but size trajectories and dis- tance curves show that pygmy chimpanzees do not exceed the size of common chimpan- zees. I t is possible that selection has resulted in greater differentiation among females than among males in Pan. Consequently, variation among females in the ontogeny of body size may be associated with important differences in female life history strategies (see below).
Sexual size dimorphism in African apes appears to have variable ontogenetic founda- tions. Modifications of Shea’s (1983, 1985) assessments are required because data available in the early 1980s did not allow detailed specification of rate and time com- ponents of dimorphism. First, in each spe- cies, rate differences in body weight growth, including differences in the timing and mag- nitude of the growth spurt, influence adult dimorphism (Leigh, 1995; Shea, 1985,1986). Second, differences in the duration of growth distinguish the sexes in each species, but gorillas and pygmy chimpanzees exhibit higher degrees of bimaturism than common chimpanzees. The sex differences in growth duration are lowest in common chimpan- zees, leading to dimorphism that is produced

56
200
150
- CI - 5 100
i cr
50
"
S.R. LEIGH AND B.T. SHEA
GORL LA GOR/LLA
I
0 10 20 30 40
AGE (YEARS)
PAN
so 7 0 l-----7 AGE (YEARS)
PA NISCUS 8
7 - $ 8 \
I 2 5
6 4
y 3
>
s
z 2
0 D
v) a
1
0 0 5 10 15 20 25
AGE (YEARS)
TROGLODYTES
AGE (YEARS)
PAN
0 5 10 15 20
AGE (YEARS)
0 5 10 15 20 25
AGE (YEARS)
Fig. 8. Loess-estimated distance and pseudo-velocity curves for ontogenetic data by species. Males are represented by circles, females are shown by triangles for each species. In pseudo-velocity curves, females are depicted by solid lines, males by dashed lines.

SIZE ONTOGENY IN AFRICAN APES 57
Wff/LLA Wff/LLA
‘7
-1 h _ _ - -:k= -5 0 5 10 15 20 25 30
AOE (YEARS)
PAN PANISCUS
w
i 1
E 8 p o P
m I
-1 -5 0 5 10 15 20 25 90
AQE (YEARS)
PAN TffOGLODYTES
I I I I I I
-5 0 5 10 15 20 25
AQE (YEARS)
- FEMALE MALE _ _ -
largely through sex differences in the rate of growth (Leigh and Shea, 1995; Shea, 1985, 1986). The elevated level of bimaturism in Pan paniscus relative to Pan troglodytes re- sults in a slight increase in sexual size di- morphism in the former species. Thus, the African apes become dimorphic in different ways; dimorphism in gorillas and pygmy chimpanzees is largely a consequence of dif- ferences in the duration of growth, and rate differences lead to sexual size dimorphism in common chimpanzees.
Endocrinological and evolutionary implications
This study clearly demonstrates that onto- genetic diversity in African apes is substan- tial. In view of this variation, we can articu- late two major avenues of continuing research into analyses of ontogenetic and adult size variation within and among these species. First, i t is apparent that this group of species offers an excellent opportunity to investigate the proximal (i.e., endocrine) de- terminants of variation in growth trajector- ies. Analyses of the hormonal bases of “pu- bertal” growth spurts in apes would seem to be an especially profitable line of research because the timing and magnitude of growth spurts vary within and between species. This variability implies that these very closely related species offer a good “natural experiment” for endocrinological research. Second, the present study evaluates the ap- plicability of a hypothesis that predicts a negative correlation between growth rates and ecological risks in primates (Janson and van Schaik, 1993). Difficulties in the applica- tion of Janson and van Schaik’s model to apes have recently been identified (Watts and Pusey, 1993), and the present analysis permits some resolution of these problems.
Endocrine growth control. Analyses of endocrine control in humans (Baumann et al., 1989; Merimee et al., 1987, 1991; Zach- mann, 1992) may provide insight into ontogenetic variation in African apes. In humans, a multi-component cascade of bio- chemical events mediates the endocrine growth axis and associated receptor pro- teins, implying that comparable adult sizes can be produced through a variety of endo- crine mechanisms (see review by Shea,
Fig. 9. Specific growth rates by sex for each species.

58 S.R. LEIGH AND B.T. SHEA
GOR/LLA GORILLA 200
150
- a Y Y
!i 100 cr $
50
0
1 " " 1 " " , ' " ' 9 .
9.. .- 20
15 - U
5 y 10
Y
> - t u s s W >
0
-5 0 10 20 30 40 0 5 10 15 20 25
TOTAL AGE (YEARS) TOTAL AGE (YEARS)
PAN PAN/SCUS
50 - a Y 40 1
5 5 30
20
10
n - 0 5 10 15 20
7
6 - 5 5 5
y 4 \ a
>
$ 3
W > 2
1
n - 0 5 10 15 20 25
7 0
60
50 - a Y 40
l- a i 30 3
1
20
10
n
TOTAL AGE (YEARS)
PAN TROGLODYTES 10
> 0 t
>
~
0 5 10 15 20
TOTAL AGE (YEARS)
TOTAL AGE (YEARS)
I " ' ' I ' ' ' r
0 5 10 15 2 0 25
TOTAL AGE (YEARS)
Fig. 10. Parametric models of growth data for African apes (JPPS model)

SIZE ONTOGENY IN AFRICAN APES
OOR/LLA P. PANS/CUS
FEMALE SIZE
Fig.
0 10 20 30 40 SO
1992). Variation in the control of growth is clearly shown by human studies that com- pare Efe pygmies with other populations. Merimee et al. (1987) report that low levels of insulin-like-growth-factor I (IGF-I) in the Efe are associated with decreased growth rates and depressed growth spurts despite levels of growth hormone (GH) that are com- parable to individuals from other popula- tions (see also Geffner e t al., 1994). The Efe also appear to be resistant to supplemental GH. Baumann et al.’s (1989) study compli- cates this problem by indicating that low levels of IGF-I in the Ef6 are associated with decreased levels of growth hormone binding protein (GH-BP) receptors relative to other human groups. This result, coupled with re- sistance to growth hormone, suggests that the Ef6 have reduced numbers of growth hor- mone receptors relative to other humans (Baumann et al., 1989).
Sex differences in the hormonal control of growth are suggested by Merimee et al. (1991). They report that male growth accel- eration (pubertal growth spurt) is a conse- quence of the increased sensitivity of the GH-receptor-IGF-I system brought about by testosterone (or another unknown gonadal growth hormone). Other sources indicate that testosterone induces the growth spurt by increasing growth hormone production (Zachmann, 1992). For females, on the other hand, Merimee et al. (1991) suggest that
59
P. TROGLODYTES
FEMALE SIZE
11. Size trajectory curves by sex for each species.
FEMALE SIZE
growth acceleration results from increased GH secretion. The magnitude of the female growth spurt appears to be independent of estrogen levels. The presence of ovarian es- trogens, but not adrenal androgens, is re- quired for normal female growth spurts (Zachmann, 1992). Thus, human studies show that the hormonal bases of growth spurts vary between sexes and among popu- lations. We can speculate that similarly di- verse mechanisms influence African ape growth, given that insights based on control of human skeletal growth can be applied to mass growth.
The present analysis provides information that is required for analyses of growth con- trol in apes. Variability in growth rates, du- rations, and especially in the timing and magnitude of growth spurts in African apes described by the present study strongly im- plies that these species provide an excellent opportunity to gain significant and funda- mental insight into the endocrine control of growth. In addition, the present study, in assembling data for over 200 individual ani- mals, implies that endocrinological studies of these species in captivity (and possibly in the wild) are feasible.
Evolutionary processes. A second set of implications revealed by the present re- search centers on investigation of the evolu- tionary factors that have resulted in ontoge-
60 S.R. LEIGH AND B.T. SHEA
netic variability within and among these species. We have discussed factors that may be related to the evolution of ape sexual size dimorphism (Leigh and Shea, 19951, but have neither specified nor considered hypotheses to account for interspecific onto- genetic variation.
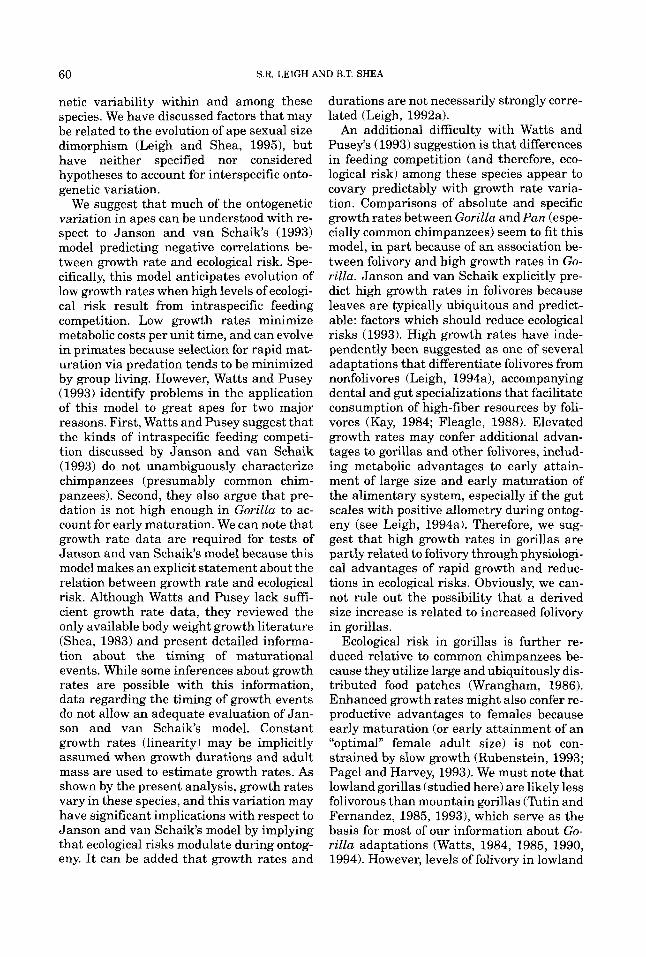
We suggest that much of the ontogenetic variation in apes can be understood with re- spect to Janson and van Schaik‘s (1993) model predicting negative correlations be- tween growth rate and ecological risk. Spe- cifically, this model anticipates evolution of low growth rates when high levels of ecologi- cal risk result from intraspecific feeding competition. Low growth rates minimize metabolic costs per unit time, and can evolve in primates because selection for rapid mat- uration via predation tends to be minimized by group living. However, Watts and Pusey (1993) identify problems in the application of this model to great apes for two major reasons. First, Watts and Pusey suggest that the kinds of intraspecific feeding competi- tion discussed by Janson and van Schaik (1993) do not unambiguously characterize chimpanzees (presumably common chim- panzees). Second, they also argue that pre- dation is not high enough in Gorilla to ac- count for early maturation. We can note that growth rate data are required for tests of Janson and van Schaik‘s model because this model makes an explicit statement about the relation between growth rate and ecological risk. Although Watts and Pusey lack suffi- cient growth rate data, they reviewed the only available body weight growth literature (Shea, 1983) and present detailed informa- tion about the timing of maturational events. While some inferences about growth rates are possible with this information, data regarding the timing of growth events do not allow an adequate evaluation of Jan- son and van Schaik’s model. Constant growth rates (linearity) may be implicitly assumed when growth durations and adult mass are used to estimate growth rates. As shown by the present analysis, growth rates vary in these species, and this variation may have significant implications with respect to Janson and van Schaik’s model by implying that ecological risks modulate during ontog- eny. I t can be added that growth rates and
durations are not necessarily strongly corre- lated (Leigh, 1992a).
An additional difficulty with Watts and Pusey’s (1993) suggestion is that differences in feeding competition (and therefore, eco- logical risk) among these species appear to covary predictably with growth rate varia- tion. Comparisons of absolute and specific growth rates between Gorilla and Pan (espe- cially common chimpanzees) seem to fit this model, in part because of an association be- tween folivory and high growth rates in Go- rilla. Janson and van Schaik explicitly pre- dict high growth rates in folivores because leaves are typically ubiquitous and predict- able: factors which should reduce ecological risks (1993). High growth rates have inde- pendently been suggested as one of several adaptations that differentiate folivores from nonfolivores (Leigh, 1994a), accompanying dental and gut specializations that facilitate consumption of high-fiber resources by foli- vores (Kay, 1984; Fleagle, 1988). Elevated growth rates may confer additional advan- tages to gorillas and other folivores, includ- ing metabolic advantages to early attain- ment of large size and early maturation of the alimentary system, especially if the gut scales with positive allometry during ontog- eny (see Leigh, 1994a). Therefore, we sug- gest that high growth rates in gorillas are partly related to folivory through physiologi- cal advantages of rapid growth and reduc- tions in ecological risks. Obviously, we can- not rule out the possibility that a derived size increase is related to increased folivory in gorillas.
Ecological risk in gorillas is further re- duced relative to common chimpanzees be- cause they utilize large and ubiquitously dis- tributed food patches (Wrangham, 1986). Enhanced growth rates might also confer re- productive advantages to females because early maturation (or early attainment of an “optimal” female adult size) is not con- strained by slow growth (Rubenstein, 1993; Page1 and Harvey, 1993). We must note that lowland gorillas (studied here) are likely less folivorous than mountain gorillas (Tutin and Fernandez, 1985, 19931, which serve as the basis for most of our information about Go- rilla adaptations (Watts, 1984, 1985, 1990, 1994). However, levels of folivory in lowland

SIZE ONTOGEM! IN AFRICAN APES 61
gorillas are probably sufficient to reflect ad- aptations that characterize other folivorous primates (over 40-45% of annual time spent feeding on folivorous resources seems to be sufficient to reflect this adaptation [Leigh, 1994a1). Thus, the present analysis suggests that Janson and van Schaik's (1993) model has predictive power for explaining why go- rillas grow more rapidly than other African apes, and contributes to an understanding of adult size differences between genera.
Evaluations of the applicability of Janson and van Schaik's model to ontogenetic differ- ences within Pan are complicated because contrasts between species are often subtle. However, our data seem consistent with this model, particularly with respect to female ontogeny. Our analysis shows that growth rates for males of each species are quite com- parable, with differences in growth duration mainly accounting for the size variation be- tween adult averages. Thus, factors that are associated with male size differences in Pan probably are most important late in ontog- eny. It is difficult to precisely speculate what such factors might be because of insufficient (to our knowledge) behavioral studies that address the transition from the pre-adult to adult period, especially for pygmy chimpan- zees. It is plausible, however, that a higher degree of arboreality in Pan paniscus may favor smaller size (Doran, 1993) that is achieved through truncating the duration of ontogeny relative to Pan troglodytes. Despite differences in adult locomotor behavior, the ecological risks encountered by males of each species are probably very similar. Socioeco- logical information seems to suggest that levels of intermale aggression do not appear to differ greatly between species (Wrang- ham, 1986).
Female pygmy and common chimpanzees likely do encounter different risk profiles throughout ontogeny and as adults, leading to distinctive ontogenies. We suggest that female common chimpanzees face greater overall risks than pygmy chimpanzees be- cause of relatively high levels of interfemale competition (White and Wrangham, 1988). Although female common chimpanzees do not form foraging groups (Watts and Pusey, 1993; White and Wrangham, 1988), clear in- terfemale competition in common chimpan-
zees has been related to foraging strategies that focus on frugivorous resources that oc- cur in small, dispersed patches (White, 1989; White and Wrangham, 1988). This implies high levels of ecological risk, and would re- quire modification of Janson and van Schaik's model to include species that en- counter high ecological risks as a result of intraspecific feeding competition whether or not they form large groups. Competition for fruit resources that occur in relatively small and dispersed patches have virtually the same effect as competition within a large foraging group that utilizes large, evenly dis- tributed patches.
Selection should favor large adult size for female Pan troglodytes as a result of feeding competition, conferring metabolic as well as direct competitive and antipredator advan- tages. However, the attainment of large size may be constrained by high ecological risks during ontogeny, resulting in depressed growth rates. One way to circumvent this constraint may be to extend the growth pe- riod, reaching large size and avoiding in- creased metabolic costs that would be in- curred by supporting a growth spurt. Therefore, we hypothesize that a prolonged growth period has evolved in response to in- terfemale feeding competition in Pan troglo- dytes. This resource competition is directly analogous to sexual selection for prolonged growth in males that can evolve as a re- sponse to mate competition in some species (Jarman, 1983; Leigh, 1995; Wiley, 1974).
Pygmy chimpanzee females tend to be highly affiliative, an attribute that has been related to foraging for ubiquitously distrib- uted resources that occur in large patch sizes (White, 1989; White and Wrangham, 1988). Elevated use of high fiber resources (Ma- lenky and Wrangham, 1994) may help re- duce feeding competition in Pan paniscus (Wrangham, 1986) and require high growth rates as an adaptation to such resources (Leigh, 1994a). Despite large group sizes in pygmy chimpanzees, we suggest that lower levels of feeding competition may be re- flected by high peak velocities in pygmy chimpanzees relative to Pan troglodytes. Therefore, reduced feeding competition plus possible increases in utilization of folivorous resources may account for the presence of a

62 S.R. LEIGH AND B.T. SHEA
distinct growth spurt in female Pan panis- cus, even though this species grows slower than common chimpanzees during the earli- est phases of ontogeny. This pattern is inter- pretable within the framework of Janson and van Schaik’s (1993) model if the pro- nounced growth spurt in Pan paniscus (espe- cially females) reflects low levels of ecological risk, possibly only during a particular age range.
Competitive advantages to large size would not be expected for female Pan panis- cus, in contrast to common chimpanzees. As for males, smaller size relative to common chimpanzees may be favored by selection for efficient arboreal locomotion (Doran, 1992, 1993), leading to smaller size relative to com- mon chimpanzees. Despite strong similari- ties in the ontogeny of locomotor behavior between Pan species, adult locomotor behav- iors are very distinct (Doran, 19921, possibly implying differences in selective pressures late in ontogeny.
Consideration of detailed ontogenetic data seems to suggest that Janson and van Schaik’s (1993) model can be applied to apes. Growth rates appear to vary in directions that are predictable based on knowledge of variation in feeding competition for these species. While this analysis offers inferential support to this model, we must stress that direct measures of growth rate and ecologi- cal risk in free-ranging populations are re- quired for further testing.
CONCLUSIONS Analyses of mass growth in African apes
show that the ontogenetic processes that lead to adult size in African apes vary (see Shea, 1983). The present analysis clarifies and extends Shea’s previous analysis by more clearly defining the developmental pro- cesses that result in size differences within and among these species. Growth rate differ- ences mainly account for differences in size between Gorilla and Pan. However, both rate and duration differences in growth ac- count for size variation in Pan (common and pygmy chimpanzees), and the relative con- tribution of these differences varies by sex. Comparisons within Pan suggest that inter- specific rate differences in growth are more
pronounced in females than in males. Sexual size dimorphism has variable bases in these species. Duration differences drive dimor- phism in Gorilla, and are emphasized in Pan paniscus. Sex differences in the rate of growth almost exclusively result in dimor- phism in Pan troglodytes.
This study documents substantial inter- and intraspecific variation in the timing and magnitude of “pubertal” growth spurts in African apes. Female common chimpanzees are unique in this group by not showing a clearly defined and unambiguous growth spurt. Analyses of absolute growth provide a foundation for endocrinological analyses of these species. The potential sex and popula- tion variation in human growth might imply that variation in ape growth control mecha- nisms is significant.
The variability in African ape size ontog- eny can be interpreted within the context of a recent model that specifies a negative correlation between growth rate and ecologi- cal risk (Janson and van Schaik, 1993). An association between growth rates and eco- logical risks may be particularly important in influencing the evolution of growth in go- rillas relative to Pan. Ecological risks seem to be high in female Pan troglodytes. Differ- ences in risks faced by males between Pan species seem to be less obvious. These obser- vations are consistent with predictions based on Janson and van Schaik‘s model.
ACKNOWLEDGMENTS We thank Drs. Robert Anemone and Linda
Winkler for inviting us to participate in their symposium. This research was aided by the dedicated curatorial and animal care staffs at the institutions from which data were ob- tained. We thank these individuals and in- stitutions, including Dr. Anne Baker (Brook- field Zoo); Drs. Tom Meehan, Jim Letcher and Ms. Pat Sass (Lincoln Park Zoo); Dr. Andy Teare and Mr. J an Rafert (Milwaukee County Zoo); Ms. Ingrid Portan (St. Louis Zoo), Dr. Amy Shima and Ms. Kay Munduate (San Diego Zoo and San Deigo Wild Animal Park); Dr. Doug Armstrong and Ms. Sarah Junior (Henry Doorly Zoo, Omaha); Dr. Tim Reichard (Toledo Zoo); Dr. Albert Lewandow- ski (Cleveland Zoo); Dr. Richard Cambre

SIZE ONTOGENY IN AFRICAN APES 63
(Denver Zoo); Dr. Mike Burton (Cheyenne Mountain Zoo, Colorado Springs, Colorado); Drs. Paul Calle, Danny Wharton, Fred Koontz, and Robert Cook (Bronx Zoo); Dr. Lynne Kramer (Columbus Zoo); Dr. Mark Campbell (Cincinatti Zoo); Dr. Julian Duvall (Indianapolis Zoo); Drs. Debra Forthman, Beth Stevens, and Rita Macmanamon and Ms. Cindy Thorstad (Atlanta Zoo); Dr. Roy Burns (Louisville Zoo); Dr. Mark Peckham, Dr. Joe Flanagan, and Ms. Barbara Lester (Houston Zoo); Ms. Donna Todd and Dr. Rod- ney Walker (Jackson Zoo); Drs. Mark Stetter and Susan Wells (Audubon Park Zoo, New Orleans); Mr. Jake Yelverton (Louisiana Purchase Gardens and Zoo, Monroe, LA); Ms. Linda Sanders (Baton Rouge Zoo); Mr. Will Sugg, Drs. Edwin Gould and Benjamin Beck (National Zoological Park); Drs. Ben Gonzales, Gary Kuehn and Mr. Victor Bo- lanos (Los Angeles Zoo); Dr. Les Shobert (North Carolina Zoo); Ms. Greta Macmillan (Knoxville Zoo); Mr. Donald Moore (Syracuse Zoo); Drs. Jim Else, Harold McClure, Jeremy Dahl and Ms. Sue Setzekorn (Yerkes Re- gional Primate Research Center, and grant number RR00165); Dr. Freeland Dunker, Ms. Gail Hedberg, and Dr. Myron Sulak (San Francisco Zoo); Mr. Robert Evans (San Anto- nio Zoo); Dr. James Kwkwood (London Zoo); Mr. F.M. Lockyear and Mr. Peter Halliday (Port Lympne and Howletts Zoo Parks); and Dr. Nate Flessness (International Species Information System). Dr. David Watts pro- vided helpful comments and advice. Dr. Lau- rie Godfrey and two anonymous reviewers offered constructive comments during the review process. Financial support for this research was provided by Northwestern University, Sigma Xi, the Wenner-Gren Foundation, and the National Science Foun- dation grant number DBS9225084.
LITERATURE CITED Ardito G (1976) Check-list of the data on the gestation
length of primates. J . Hum. Evol. 5:213-222. Baumann G, Shaw MA, and Merimee TJ (1989) Low
levels of high-affinity growth hormone-binding pro- tein in African pygmies. N. Engl. J . Med. 320:
Calder WA (1984) Size, Function, and Life History. Cam- 1705-1709.
bridge: Harvard Univ. Press.
Cleveland WS (1979) Robust locally weighted regression and smoothing scatterplots. J. Am. Stat. Assoc.
Cleveland WS, and Devlin SJ (1988) Locally weighted regression: an approach to regression analysis by local fitting. J . Am. Stat. Assoc. 83:596-610.
Coelho AM, Glassman DM, and Bramblett CA (1984) The relation of adiposity and body size to chronological age in olive baboons. Growth 48t445-454.
DeRousseau CJ (1990) Life history thinking in per- spective. In CJ DeRousseau (ed.): Primate Life History and Evolution. New York: Wiley-Liss, Inc., pp. 1-13.
Dielman TE (1989) Pooled Cross-sectional and Time Se- ries Data Analysis. New York Marcel Dekker.
Doran D (1992) The ontogeny of chimpanzee and pygmy chimpanzee locomotor behavior: A case study of pae- domorphism and its behavioral correlates. J . Hum. Evol. 23:139-157.
Doran D (1993) Comparative locomotor behavior of chimpanzees and bonobos: The influence of morphol- ogy on locomotion. Am. J . Phys. Anthropol. 91t83-98.
Efron B, and Tibshirani R (1991) Statistical data analy- sis in the computer age. Science 253~390-395.
Eveleth PB, and Tanner JM (1990) World-Wide Varia- tion in Human Growth. Cambridge: Cambridge Univ. Press.
Fleagle J G (1985) Size and adaptation in primates. In WL Jungers (ed.): Size and Scalingin Primate Biology. New York: Plenum Press. pp. 1-20.
Fleagle J G (1988) Primate Adaptation and Evolution. New York, Academic Press.
Geffner ME, Bersch N, Bailey RC, and Golde DW (1994) Growth hormone induces resistance to the mitogenic action of insulin through local IGF-I: Studies in nor- mal and pygmy cell lines. Diabetes 43~68-72.
Gould SJ (1977) Ontogeny and Phylogeny. Cambridge: Bellknap Press.
Groves CP (1970) Population systematics of the gorilla. J. Zool. (Lond.) 161t287-300.
Harvey PH, Martin RD, and Clutton-Brock TH (1986) Life histories in a comparative perspective. In BB Smuts, DL Cheney, RM Seyfarth, RW Wrangham, TT Struhsaker (eds.): Primate Societies. Chicago: Univ. Chicago Press, pp. 181-196.
Inouye SE (1992) Ontogeny and allometry of African ape manual rays. J. Hum. Evol. 23:107-138.
Janson CH, and van Schaik CP (1993) Ecological risk aversion in juvenile primates: slow and steady wins the race. In ME Pereira and LA Fairbanks (eds.): Juve- nile Primates. New York: Oxford Univ. Press, pp. 57-74.
Jarman PJ (1983) Mating system and sexual dimor- phism in large terrestrial mammalian herbivores. Biol. Rev. 58:485-520.
Jolicouer P (1985) A flexible 3-parameter curve for lim- ited or unlimited somatic growth. Growth49:271-281.
Jolicouer P, Hassane A, and Pontier J (1991) Human stature: which growth model? Growth Dev. Aging 55:129-132.
Jolicouer P, Pontier J, Pernin M-0, and Sempe M (1988) A lifetime asymptotic growth curve for human height. Biometrics 44~995-1003.
Jungers WL (1985) Body size and scaling of limb propor- tions in primates. In WL Jungers (ed.): Size and Scal-
74:829-836.

64 S.R. LEIGH AND B.T. SHEA
ing in Primate Biology. New York: Plenum Press,
Jungers WL, and Susman RL (1984) Body size and al- lometry in African apes. In RL Susman (ed.): The Pygmy Chimpanzee. New York: Plenum Press, pp. 131-178.
Kay RF (1984) On the use of anatomical features to infer foraging behavior in extinct primates. In PS Rodman and JGCant(eds.1: AdaptationsforForaginginNonhu- man Primates. New York: Columbia Univ. Press, pp.
Leigh SR (1992a) Ontogeny and Body Size Dimorphism in Anthropoid Primates. Ph.D. Dissertation. Evans- ton, IL: Northwestern Univ.
Leigh SR(1922b) Patterns ofvariation in the ontogeny of primate body size dimorphism. J. Hum. Evo1.23t27-50.
Leigh SR(1994a)Ontogeneticcorrelatesofdietin anthro- poid primates. Am. J. Phys. Anthropol. 94:499-522.
Leigh SR (199413) The relations between captive and wild-shot weights in anthropoid primates. Zoo Biol. 132-44 .
Leigh SR (1995) Socioecology and the ontogeny of sexual size dimorphism in anthropoid primates. Am. J . Phys. Anthropol. 97t339-356.
Leigh SR, and Shea BT (1995) Ontogeny and the evolu- tion of adult body size dimorphism in apes. Am. J. Primatol. 36:37-60.
Malenky RK, and Wrangham RW (1994) A quantitative comparison of terrestrial herbaceous food consump- tion by Panpaniscus in the Lomako Forest, Zaire, and Pun troglodytes in the Kibale Forest, Uganda. Am J. Primatol. 32 -12 .
Mehta C, and Pate1 N (1992) StatXact: Statistical Soft- ware for Exact Nonparametric Inference. Cambridge: Cytel, Inc.
Merimee TJ, Russell B, Quinn S, and Riley W (1991) Hormone and receptor studies: relationship to linear growth in childhood and puberty. J. Clin Endocrinol. Metab. 73t1031-1037.
Merimee TJ, Hewlett BS, Wood W, Bowcock AM, and Cavalli-Sforza LL (1987) The growth hormone recep- tor gene in the African pygmy. Trans. Assoc. Am. Phys. lZOt163-169.
Morin PA, Moore J J , Chakroborty R, Jin L, Goodall J , and Woodruff DS (1994) Kin selection, social struc- ture, gene flow, and the evolution of chimpanzees. Science 265t1193-1201.
Page1 MD, and Harvey PH (1993) Evolution of the juve- nile period in mammals. In ME Pereira and LA Fair- banks (eds.): Juvenile Primates. New York: Oxford Univ. Press, pp. 28-37.
Pontier J , Jolicoeur P, Pernin M-0, Abidi H, and Sempe M (1988) Modelisation de la courbe de croissance sta- turale chez l’enfant: le modele JPPS. Cah. Anthropol. Biometrie Hum. (Paris) VI:71-85.
Rubenstein DI (1993) On the evolution of juvenile life- styles in mammals. In ME Pereira and LA Fairbanks (eds.): Juvenile Primates. New York: Oxford Univ. Press, pp. 38-56.
Schmidt-Nielson K (1984) Scaling: Why Is Animal Size So Important. Cambridge: Cambridge Univ. Press.
Schneiderman ED (1992) Facial Growth in the Rhesus Monkey. Princeton: Princeton Univ. Press.
Shea BT (1981) Relative growth of the limbs and trunk
pp. 345-382.
21-53.
of the African apes. Am. J. Phys. Anthropol. 56: 179-202.
Shea BT (1983) Allometry and heterochrony in African apes. Am. J . Phys. Anthropol. 622t275-290.
Shea BT (1985) The ontogeny of sexual dimorphism in the African Apes. Am. J . Primatol. 8:183-188.
Shea BT (1986) Ontogenetic approaches to sexual dimor- phism in anthropoids. Hum. Evol. 1t97-110.
Shea BT (1990) Dynamic morphology: growth, life his- tory, and ecology in primate evolution. In CJ DeRous- seau (ed.): Primate Life History and Evolution. New York: Wiley-Liss, Inc., pp. 325-352.
Shea BT (1992) Developmental perspective on size change and allometry in evolution. Evol. Anthropol. 1:125-134.
Shea BT, Leigh SR, and Groves CP (1993) Multivariate craniometric variation in chimpanzees: implications for species identification in paleoanthropology. In WH Kimbel and LB Martin (eds.): Species, Species Con- cepts, and Primate Evolution. New York: Plenum Press, pp. 265-296.
S-Plus (1991) S-Plus for DOS 2.0. Seattle: Statistical Sciences Inc.
Stearns SC (1992) The Evolution of Life Histories. Ox- ford: Oxford Univ. Press.
Tanner JM (1978) Fetus into Man. Cambridge: Harvard Univ. Press.
Tutin CEG, and Fernandez M (1985) Foods consumed by sympatric populations of Gorilla gorilla gorilla and Pan troglodytes troglodytes in Gabon: Some prelimi- nary data. Int. J. Primatol. 6:27-43.
Tutin CEG, and Fernandez M (1993) Composition of the diet of chimpanzees and comparisons with that of sympatric lowland gorillas in the Lope’ Reserve, Gabon. Am. J. Primatol. 30:195-212.
Uehara S, and Nishida T (1987) Body weights of wild chimpanzees (Pan troglodytes schweinfurthiij of the Mahale Mountains National Park. Am. J. Phys. An- thropol. 72t315-322.
Watts DP (1984) Composition and variability of moun- tain gorilla diets in the Central Virungas. Am. J . Pri- matol. 7t323-356.
Watts DP (1985) Relations between group size and com- position and feeding competition in mountain gorilla groups. h i m . Behav. 33t72-85.
Watts DP (1990) Ecology of gorillas and its relationship to female transfer in mountain gorillas. Int. J . Prima- tol. 11:2145.
Watts DP (1994) Social relationships of immigrant and resident female mountain gorillas, 11: Relatedness, residence, and relationships between females. Am. J. Primatol. 32r13-30.
Watts DP, and Pusey AE (1993) Behavior of juvenile and adolescent great apes. In ME Pereira and LA Fairbanks (eds.): Juvenile Primates. New York: Ox- ford Univ. Press, pp. 148-167.
White FJ (1989) Social organization of pygmy chimpan- zees. In PG Heltne and LA Marquardt (eds.): Under- standing Chimpanzees. Cambridge: Harvard Univ. Press, pp. 194-207.
White FJ, and Wrangham RW (1988) Feeding competi- tion and patch size in the chimpanzee species Pun paniscus and Pan troglodytes. Behavior (Leiden) 105t148-164.

SIZE ONTOGENY IN AFRICAN APES 65
Wiley RH (1974) Evolution of social organization and RW Wrangham (eds.): Ecological Aspects of Social life history patterns among grouse. Q. Rev. Biol. Evolution. Princeton: Princeton Univ. Press, pp.
Zachmann M (1992) Interrelations between growth hor- mone and sex hormones: physiologic and therapeutic consequences. Hormone Res. 38(Suppl. 1):l-8.
49:201-226. 354-378. Wilkinson LE (1990) Systat The System for Statistics.
Evanston, IL: Systat. Wrangham RW (1986) Ecology and social relationships
in two species of chimpanzee. In DI Rubenstein and