Embed Size (px)
Citation preview

ELSEVIER Surface Science 375 (1997) 340-352
s u r f a c e s c i e n c e
On the dependence with bond lengths of the observed energies of NEXAFS resonances of diatomic molecules
V.L. Shneerson, D.K. Saldin, W.T. Tysoe *
Departments of Chemistry and Physics and Laboratory for Surface Studies, University of Wisconsin-Milwaukee, Milwaukee, WI 53211, USA
Received 5 August 1996; accepted for publication 28 October 1996
Abstract
An analytical theory is developed for the position of the resonances in near-edge X-ray absorption fine structure (NEXAFS) which yields extremely good agreement with experiment and allows a universal curve to be calculated for the resonance energies. The analytical calculations indicates that, if scattering events are taken as purely atomic, the product kp = constant, where k is the wavevector of the outgoing electron at resonance and p the internuclear distance. This is in accord with a rule previously proposed by Natoli. It is found, however, that both the constant and the muffin-tin zero energy in the NEXAFS region depend on internuclear distance. Their variation as a function of bond length is determined and reveals a more appropriate form of the dependence of sigma resonance energy d (measured relative to the ionization potential) with bond length should be: d = A + B/p + C/p 2. This equation shows good agreement with the experimentally observed variation in resonance position with bond lengths for series of molecules with constant values of (Z1 + Zz) where Z1 and Z2 are the atomic numbers of the scattering nuclei. In fact, this function is rather linear over the bond length range commonly encountered in organic molecules. Finally, the observation that empirical rules for the variation in resonance energy versus geometry are obeyed for molecules with constant (Z1 + Z2) is also rationalized. © 1997 Elsevier Science B.V. All rights reserved.
Keywords: Computer simulations; Electron emission; Extended X-ray absorption fine structure (EXAFS); Near edge extended X-ray absorption fine structure (NEXAFS); Nitrogen; Oxygen
1. Introduction
X-ray absorption techniques, in which electron transitions from core levels into states above the vacuum or Fermi level are excited, have proven extremely useful in determining the short-range order of both the bulk phase as well as surface species. The oscillation of the X-ray absorption coefficient above the energy thresholds for the excitation of core electrons are formally divided
* Corresponding author. Fax: + 1 414 229 5530; e-mail: [email protected]
into the so-called NEXAFS (near-edge X-ray absorption fine structure) region, which refers to the parts of the absorption spectra up to about 50eV from an absorption edge, and EXAFS (extended X-ray absorption fine structure) for the parts of the spectra more distant from the edge. In both regimes, oscillations are found in the absorp- tion cross section which originate from a modi- fication of the photoelectron final state by the back scattering of the ejected photoelectron. The formal division between the two regimes arises since, for electrons ejected from the atomic cores with relatively high energies, the atomic scattering factor
0039-6028/97/$17.00 Copyright © 1997 Elsevier Science B.V. All rights reserved PI1 S0039-6028 (96) 01271-X

v.L. Shneerson et al./ Surface Science 375 (1997) 340 352 341
exhibits a strong maximum in the forward direction so that the X-ray absorption coefficient as a func- tion of energy is dominated by single-scattering processes. This significantly simplifies the analysis of the spectra. However, the structural information that can be extracted from this experiment is limited to atomic radial distribution functions. In contrast, in the NEXAFS regime (EK<50eV), multiple scattering predominates, so that analysis of these spectra can yield much more structural information, for example, the coordination geo- metry, molecular orientations, and the density and symmetry of unoccupied valence electron states. This also means, however, that all scattering pro- cesses must be taken into account to accurately describe the positions of the resonances in NEXAFS.
it has also been recently demonstrated [ I ] that it is possible to accurately compute the positions of the resonances for small, primarily diatomic, molecules using a prescription in which the chemical potential is kept constant throughout the molecule and where the calculation is performed within the local density approximation. This strategy allows the positions of the resonances to be calculated which are within ~ 1 eV of those found experimentally. This method, while allowing accurate computation of the experimental data, does not allow any direct insights into the way in which resonance positions vary with, for example, parameters such as bond length or the nature of the molecule. Several empirical formulae have been proposed for the variation in the positions of resonances in NEXAFS data with bond length (see for example Ref. [2]). It has been suggested, for example, that the energy of the cy resonance with respect to the vacuum level varies linearly with p where p is the bond length. This "bond length with a ruler" approach potentially provides an extremely powerful method for establishing adsorbate geo- metries without resorting to complex computer calculations. It has also been suggested [3] that a more theoretically realistic formulation of this empirical rule should be that kp = constant, where k is the wavevector of the outgoing wave. This latter empirical rule becomes equivalent to the former for small changes in bond length ~p << p. However, it is important that there be a firm
theoretical basis for any empirical rule in order that the regimes over which such a rule can be applied is properly understood. In order to do this, an analytical theory for the positions of the resonances of NEXAFS spectra has been developed based on our previous strategy [ 1 ] that has proven successful in accurately predicting resonance positions.
2. General theory of X-ray absorption
The transition rate for X-ray absorption from an initial core state of energy E¢ to a final energy E~ + o3 under the influence of a perturbation A(r) can be calculated using the Fermi golden rule as:
W~(E) = 2nlM(E)lZ pr(E), (1)
where pf(E) is the density of final states and M(E) is the excitation matrix element. Using the dipole approximation, it can be shown [4] that, in the case of K-edge excitation, this is given by:
W(E) = - 2 k l M ~ ( E ) I 2
x Im "Clm'lm' m,m -1 sin2 ~il Ylm(g)Y~m'(i) , (2)
M~d(E) is the radial part of the transition matrix. Scattering events contribute through the phase shifts ~1 of the final p-wave-like state of the adsorbing (central) atom and through the scatter- ing path operator z which accounts for multiple back-scattering from neighboring atoms. The spherical harmonics Y~m(f) depend on the X-ray polarization g.
3. Analytical theory for linear molecules
It is possible to find analytical solutions for this equation, at least in the case of linear molecules with C~v or D~h symmetry. It should be noted that this still includes a wide range of molecules of interest to surface science and catalysis, for example, CO, N 2 and H2, as well as a large number of "pseudo" linear molecules, for example ethylene or acetylene, where the hydrogen atoms scatter only weakly. In these cases, because of the presence of the C~ rotation axis, there is no azimuthal

342 EL. Shneerson et aL / Surface Science 375 (1997) 340-352
dependence in the absorbance so that only the spherical harmonics in which m = m' contribute to the right hand side of Eq. (2). It thus simplifies to yield:
3k W(E) - - 2re sin 2 31 [M~]d(E)[2
x Im {z,1,11 sin e 0 + Z,O, lO cos 2 0}, (3)
where 0 is the angle between the polarization direction g and the z axis which is taken to be oriented along the Coo axis. This can be further simplified, in the case of gas-phase molecules, since the free rotation in this case allows the equation to be integrated over all angles to yield:
k W(E) = IM~O(E) I 2
27c sin 2 31
x Im {2Zlla1 + z10,1o}, (4)
where the matrix element rlL n is identified with the appearance of a n resonance and the element z10,1o with the presence of a ~ peak. This scattering path operator can be written in terms of the atomic scattering matrix of the central (i.e., source) atom t o and the reflection matrix for scattering from neighboring atoms R~,.,,,,.,(E) I-4,5] as:
z = it°( 1 -- Rt°) - ' , (5)
where t°(E) is given by:
t°(E) = i sin ill(E) exp(i3,(E)). (6)
There are two complications which arise in deriving an analytical scattering theory. The first appears in the calculation of the z operator since that involves the inversion of a multidimensional matrix. The second complication comes from the form of the reflection matrix R,m,l'm' which is given by:
R,ml 'm ' Z Z Z oi TiJ ,o i , = g 'm, ' lml l lml , '2m2~'2m2,1 'm'~ i.j l l ,m I 12,m 2
(7)
where the term g describes the propagation of spherical outgoing waves from the central atom to a neighboring atom. The T matrix (which is the inverse of the real space K K R matrix H ij = (t- ')g~j -- gU) represents the propagation of
the wave scattered from a neighboring atom back to the source atom so that T = ( t - ' - g ) -1. The difficulty in inverting these matrices is ameliorated in the case of a diatomic molecule, first, since only two elements, namely 7711,, 1 a n d TlO,l O are required for the calculation and second, in any diatomic molecule the surrounding cluster only consists of a single other atom. Thus i = j = 1 and:
T]~,x,~, (E) = 6il 3 j, 6mm,~l,, t 1 (E). (8)
This results in a much simplified form of the matrix R as:
RI,,,,,,,,(E)= ~ oi t ,o glm, , ,ml(E) ,x(E)gllml,l ,m,. (9) l l m l
Finally, symmetry restrictions on the form of R and g also allow further simplifications to be made and these are discussed below.
4. Symmetry effects
Application of an n-fold rotation operation to the angular momentum wavefunctions is represented by:
C, Ylm = exp( 2~im/n) Yl,,. (10)
This rotation initiates a transformation of the reflection matrix:
C n R l m , l ' m ' = exp(2xi(m -- m')/n)Rama'm'. (11)
This is because, from Eq. (9), the transformation properties of the R matrix with respect to the first pair of indices (1, m) are identical to those for the propagator g, ...... which transforms like the func- tion I11.,. For a molecule with an n-fold symmetry axis, the reflection matrix should remain unchanged under the transformation in Eq. (1 i) so that the possible range of m and m' values are restricted by the condition:
m - m ' = O , +n, +_2n, +_3n, . . . . (12)
In the case of the Coo axis, this yields the condition that m = m ' . The reflection matrix is therefore subdiagonal with respect to the magnetic quantum numbers m as:
R - .~ o(,,) (13) ,m,, 'm' -- Vmra' *X l l "

V.L. Shneerson et al. / Surface Science 375 (1997) 340-352 343
A new index N defined as N = 1 (1+ 1 ) + m + 1 is introduced for convenience which gives the structure of the reflection matrix as:
Rl1 0 R13 0
0 R22 0 0
R13 0 R33 0
0 0 0 R4a
(14)
In order to finally derive an analytical expression, an explicit form of g is required. This is given by Ref. [4]:
gilJ,l,m,(krij ) = 4n ~ i 1 - 1 ' - I " ( _ 1)m'+m"h(ll,) l"m"
x Yl",-m"(~)n(lm, l'm', l"m"), (15)
where hi 1) is the Hankel function, k (= ~ ) is the wavenumber of the propagating electron, ri~ is the position vector connecting atoms i and j, and:
B(lm, l'm',l"m")= f YlmYcm'Yy,-m'df2. (16)
Taking the unit vector f to be oriented along the internuclear axis (taken to be the z axis), this allows g to be simplified as:
ij glm,l,m,:(~mm, k f ~ Z N / ~ + l(--1) rail-l"-1" 1"
× @)(krij)B(lm, i'm', 1"0). (17)
5. Analytical solution for resonances of diatomic molecules
NEXAFS probes relatively small energies above the absorption edge resulting in rather low (< 50 eV) values of the kinetic energy of the out- going photoelectron. This suggests that the angular momentum contributions to the scattering ampli- tude t o are likely to be restricted to only s and p waves. This is shown below to be true and is in accord with chemical experience which suggest that the anti-bonding levels into which the electron is scattered can be effectively described using s and
p orbitals. A matrix X is introduced where:
X = ( 1 --Rt°) -1, (18 )
which allow the 17 matrix to be represented as:
17 = it°X. (19)
In order to evaluate the transition rate, W(E), only two elements of this matrix, namely X33 and X44 are required. The first term describes excitation into a a state and the second term a transition into a n state. The element X44 can be found from a 1 x 1 matrix as:
( 1 -- R44t°)X,a = 1, (20)
and to find X33, a 2 x 2 matrix must be solved:
( 1 - - R l l t° --R13t° ~ ( X 1 3 ) (01) --n,3 t° 1 - R 3 3 t ° / \ X33 = , (21)
which finally yields the following expressions for the elements of 17:
it ° = (22) T l l , l l = 1744 = 1722 1 -- R44t 6'
and
i t o T10,10 -~ 1733 - - 2 0 0" (23)
1 - R3a o ( R t 3 ) t s tp t p - I S R,,t~
More general forms of these matrix elements up to rz2 have been described elsewhere [6] .
It is interesting to note that the element 1711,11 does not depend on the s-wave phase shifts. This is because of the symmetry restrictions (Eq. (13)) imposed by the reflection matrix R. This ensures that the off-diagonal matrix elements R1_+1,oo are zero which prevents mixing of s- and p-like waves in the final molecular n state.
6. Analytical solution of the equation for the N E X A F S spectrum
The forms of the reflection matrix are derived elsewhere [6] and are displayed below for just s

344 V. L. Shneerson et al. /Surface Science 375 (1997) 340-352
and p scattering in terms of x(=kp) where p is the internuclear separation as:
R 44 P’
R33 = (&W’(X))2~, +
2 t p,
RI3 = &@(~)h~~‘(x)t, - 3&\‘)(x)Ttp,
RI1 = (h&“(~))~t, + 3(h\“(~))~t,. (24)
The expression for the z matrix may be written as:
iti
211J1 - 1 - 4t’ it:
~10.10 - 1 _ &’
where the Z functions are given by:
(25)
(26)
These together with Eq. (4) constitute the analytic expressions for the NEXAFS spectra. The analytical results (----) are shown compared with the exact computer calculation (- ) in Fig. 1. Clearly the agreement between the two sets of data is good indicating that the accurate calculation corres- ponds well with the full computer calculation. Note that the analytical solution was derived using only s and p waves and the discrepancy between the full calculation and the analytical solution is evi- dent from slight differences between the two curves between 25 and 35 eV kinetic energy. This dis- crepancy disappears if d functions are included in the analytical expression.
7. Calculation of resonance position
In most cases, the whole form of the spectrum is not required, merely the values of the energy at the peak of the resonances. One can expect that in the vicinity of the maximum of a resonance, the
5 10 15 20 25 30 35 40 45
Kinetic Energy (eV)
Fig. 1. Calculated NEXAFS spectrum of gas-phase nitrogen
NI: solid line is the exact computer calculation and the dashed
line is that from the analytical solution with only two (s and p)
spherical harmonics. When d spherical harmonics are added,
the analytical spectrum is indistinguishable from the exact
computer simulation.
corresponding matrix element (either rll,ll for the r-t resonance or rlo,lo for the cr resonance) should be large and lead to a peak in the absorption coefficient. According to Eq. (25) this condition should be fulfilled if the real and imaginary parts of 1 - .Zz or 1 - C, become small. It can be shown that this condition is fulfilled if -Im(Z) becomes equal to 1 - Re(C) with the stipulation that both of these values are simultaneously small. The behavior of the real and imaginary parts of C, are displayed in Fig. 2 between 5 and 40 eV kinetic energy for nitrogen gas. These are equal for energies of - 14 and 29 eV. However, the real and imaginary parts of Z, are simultaneously small only for the higher kinetic energy. Marked as an asterisk is the position of the cr resonance for nitrogen and this agrees well with the prediction. This is further illustrated in Fig. 3 which displays the calculated NEXAFS spectra for both oxygen

KL. Shneerson et al./Surface Science 375 (1997) 340 352 345
6 I I I I I I
l-Re (Xo)
I ~ I ~ I ~ I ~ I J I ,
15 20 25 30 35 40 45
Kinetic Energy (eV)
Fig. 2. Real and imaginary parts of the function 1 - X,, for gas-phase N2 versus kinetics energy. Note the coincidence between the intersection point and the position of the cy resonance indicated by an asterisk.
-I f - 2
150
100
50
0
15
10
I I -Re(E )
_ _ ~ x150
I "-Im(Xx) I
5 I * I
I I
(a) 0 2
-.m~Zojt r ~ • . .
/ xT° 10 15
I I I
(b) N2
, I , I , I , I , I ,
I0 15 20 25 30
20
35
Kinetic Energy (eV))
Fig. 3. Correspondence between the NEXAFS peak positions and the intersection of the points of the real and imaginary parts of the 1 - £ function for (a) oxygen and (b) nitrogen molecules.
and nitrogen (both of which correctly reproduce the experimental data) and also display the values of 1 - Re(X~) and - Im(X~) for the cr resonance and corresponding values for the n resonance. Clearly the crossover in all cases coincides well with the resonance position.
8. Empirical curves for resonance positions in NEXAFS
Such a method for deriving the position of a resonance, along with the ability to be able to analytically calculate the forms of the matrix, allows the possibility of formulating empirical relationships between molecular geometry and the positions of the resonances and for these relation- ships to be based on a firm theoretical footing. The criterion for the appearance of the resonances
from the variation in Z as a function of energy suggests that, from Eq. (26), the resonance position depends on the scattering amplitude t as well as internuclear distance. This will be illustrated for the position of the rc resonance. The Z-functions for diatomic molecules are given by Eq. (26) with t(10)= tx, and where:
Re(t1) -= fl = -s in2 61, Im(tl) - t; = ½ sin 231.
(27)
It follows that t~' can be expressed through the value of fl as:
t~' = ( - 1 ) "x / - t't(1 + t'l), (28)
where n is equal to the integer part of the ratio 261/m The method is illustrated for 7t-resonances since this is simpler to address analytically since only tp and the h(~l)(x) functions are involved in the
346 V.L. Shneerson et al. /Surface Science 375 (1997) 340 352
calculation of Z~:
9 2 (1) 2 Z'~ = ~ tp ( h l (x)) . (29) X-
As explained above, the resonance positions are given in terms of the product x = kp and the real parts of tp by the roots of Re(Z~) - Im(Z~) = 1. It is merely necessary to manipulate the Hankel function h~l)(x) = - ( 1 + i/x) exp(ix)/x to separate the real and imaginary parts of the Z~-function. This results in an explicit form of the condition of the appearance of a resonance as:
[1 + 2tp - 2 ( - 1 ) " x / - tp(1 + t~)]
x [(x 2 - 1) cos 2x - 2x sin 2x]
+ [1 + 2t~ + 2 ( - 1 ) "x / - t'p(1 + t~)]
X 6 x [(x 2 - 1) sin 2x + 2x cos 2x] - 9tp" (30)
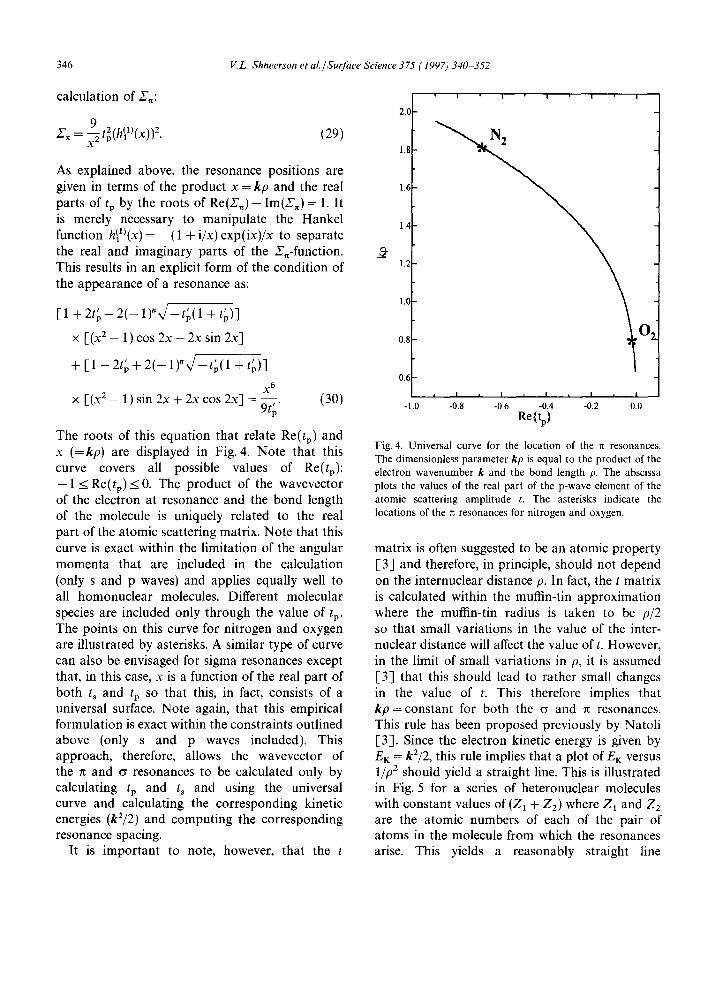
The roots of this equation that relate Re(tp) and x (=kp) are displayed in Fig. 4. Note that this curve covers all possible values of Re(tp): - 1 _< Re(tp) _< 0. The product of the wavevector of the electron at resonance and the bond length of the molecule is uniquely related to the real part of the atomic scattering matrix. Note that this curve is exact within the limitation of the angular momenta that are included in the calculation (only s and p waves) and applies equally well to all homonuclear molecules. Different molecular species are included only through the value of tp. The points on this curve for nitrogen and oxygen are illustrated by asterisks. A similar type of curve can also be envisaged for sigma resonances except that, in this case, x is a function of the real part of both ts and tp SO that this, in fact, consists of a universal surface. Note again, that this empirical formulation is exact within the constraints outlined above (only s and p waves included). This approach, therefore, allows the wavevector of the n and cr resonances to be calculated only by calculating tp and ts and using the universal curve and calculating the corresponding kinetic energies (k2/2) and computing the corresponding resonance spacing.
It is important to note, however, that the t
2.0
1.8
1.6
1.4
1.2
1.0
0.~ O:
0.~
-1.0
I I I i I
i I I I I I i I I I
-0.8 -0.6 -0.4 -0.2 0.0 Re{tp}
Fig. 4. Universal curve for the location of the n resonances. The dimensionless parameter kp is equal to the product of the electron wavenumber k and the bond length p. The abscissa plots the values of the real part of the p-wave element of the atomic scattering amplitude t. The asterisks indicate the locations of the • resonances for nitrogen and oxygen.
matrix is often suggested to be an atomic property [3] and therefore, in principle, should not depend on the internuclear distance p. In fact, the t matrix is calculated within the muffin-tin approximation where the muffin-tin radius is taken to be p/2 so that small variations in the value of the inter- nuclear distance will affect the value of t. However, in the limit of small variations in p, it is assumed [3] that this should lead to rather small changes in the value of t. This therefore implies that kp = constant for both the ~ and n resonances. This rule has been proposed previously by Natoli [-3]. Since the electron kinetic energy is given by EK = k2/2, this rule implies that a plot of E K versus 1/p 2 should yield a straight line. This is illustrated in Fig. 5 for a series of heteronuclear molecules with constant values of (ZI + Z2) where Z1 and Z2 are the atomic numbers of each of the pair of atoms in the molecule from which the resonances arise. This yields a reasonably straight line
V.L. Shneerson et al./ SurJace Science 3 75 (1997) 340-352 347
-2
~ to
"7' 6 - ~ • ~ 4-
2 -
0- -2
0.4
15 10 5 0
-5 -10 -15 -20 -25 -30
0.0
I ' I ' I ' I ' I ' I
H 3 C ~ . . . . . - , . ' ' ' ~ F 3 C N O
I I I I I I
0.45 0.50 0.55 0.60 0.65 0.70 ' I ' I ' I ' I ' 1
H 2 C O
.11" N 2 H 4 ~ , ~ ' - H 3 C O H -
015 016 017 0'.8 019 I I I ' I " I ' I ' I '
F3CNO ~ HsCN
I I I I I I I
0.1 0.2 0.3 0.4 0.5 0.6 0.7
1/p2(,~ "2 )
0.8
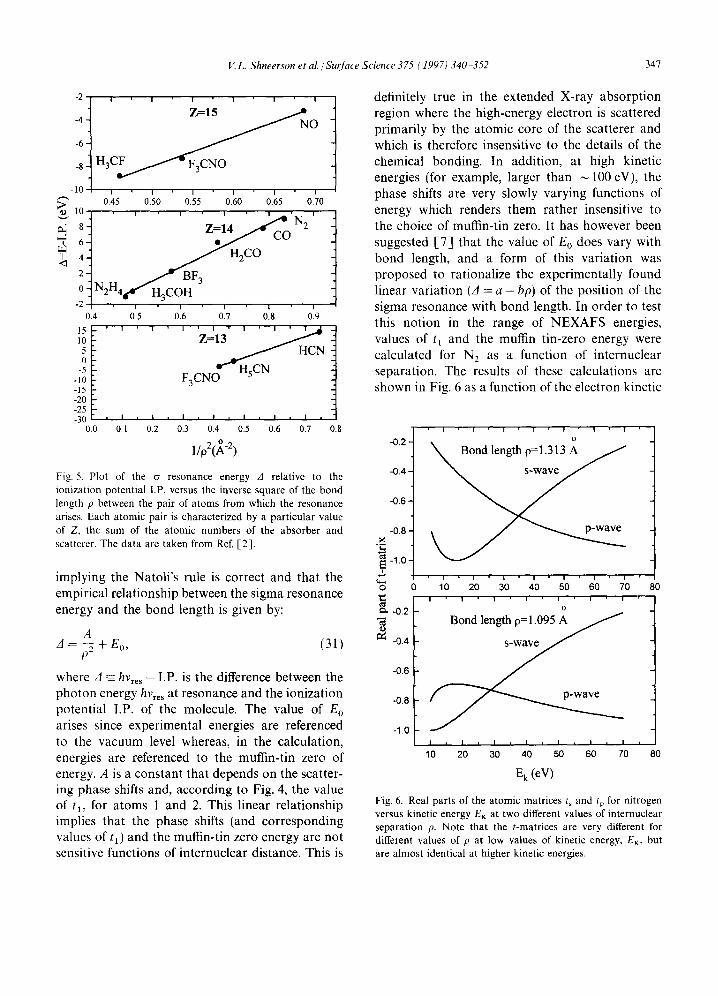
Fig. 5. Plot of the a resonance energy A relative to the ionization potential I.P. versus the inverse square of the bond length p between the pair of a toms from which the resonance arises. Each atomic pair is characterized by a particular value of Z. the sum of the atomic numbers of the absorber and scatterer. The data are taken from Ref. [2] .
implying the Natoli's rule is correct and that the empirical relationship between the sigma resonance energy and the bond length is given by:
A 3 = ~ + E0, (31)
F)"
where A =_ h v r e s - I.P. is the difference between the photon energy hvro s at resonance and the ionization potential I.P. of the molecule. The value of E o arises since experimental energies are referenced to the vacuum level whereas, in the calculation, energies are referenced to the muffin-tin zero of energy. A is a constant that depends on the scatter- ing phase shifts and, according to Fig. 4, the value of tl, for atoms 1 and 2. This linear relationship implies that the phase shifts (and corresponding values of tl) and the muffin-tin zero energy are not sensitive functions of internuclear distance. This is
definitely true in the extended X-ray absorption region where the high-energy electron is scattered primarily by the atomic core of the scatterer and which is therefore insensitive to the details of the chemical bonding. In addition, at high kinetic energies (for example, larger than ~ 100 eV), the phase shifts are very slowly varying functions of energy which renders them rather insensitive to the choice of muffin-tin zero. It has however been suggested [-7] that the value of Eo does vary with bond length, and a form of this variation was proposed to rationalize the experimentally found linear variation ( 3 = a - b p ) of the position of the sigma resonance with bond length. In order to test this notion in the range of NEXAFS energies, values of tt and the muffin tin-zero energy were calculated for N2 as a function of internuclear separation. The results of these calculations are shown in Fig. 6 as a function of the electron kinetic
-0.2
- 0 . 4
- 0 . 6 ¸
-0.8
~ -1.0
o
-0.2
- 0 . 4
- 0 . 6
-0.8
-1.0
I I I I I I I
0
- - - < a
10 2'0 310 ;0 5'0 60 ;0 I I I I I I I
0
Bond length p=1.095
I i I I I I I I
10 20 30 40 50 60 70 E k (eV)
80
80
Fig. 6. Real parts of the atomic matrices t~ and tp for nitrogen versus kinetic energy EK at two different values of internuclear separation p. Note that the t-matrices are very different for different values of p at low values of kinetic energy, EK, but are almost identical at higher kinetic energies.
348 V.L. Shneerson et al./ Surface Science 375 (1997) 340-352
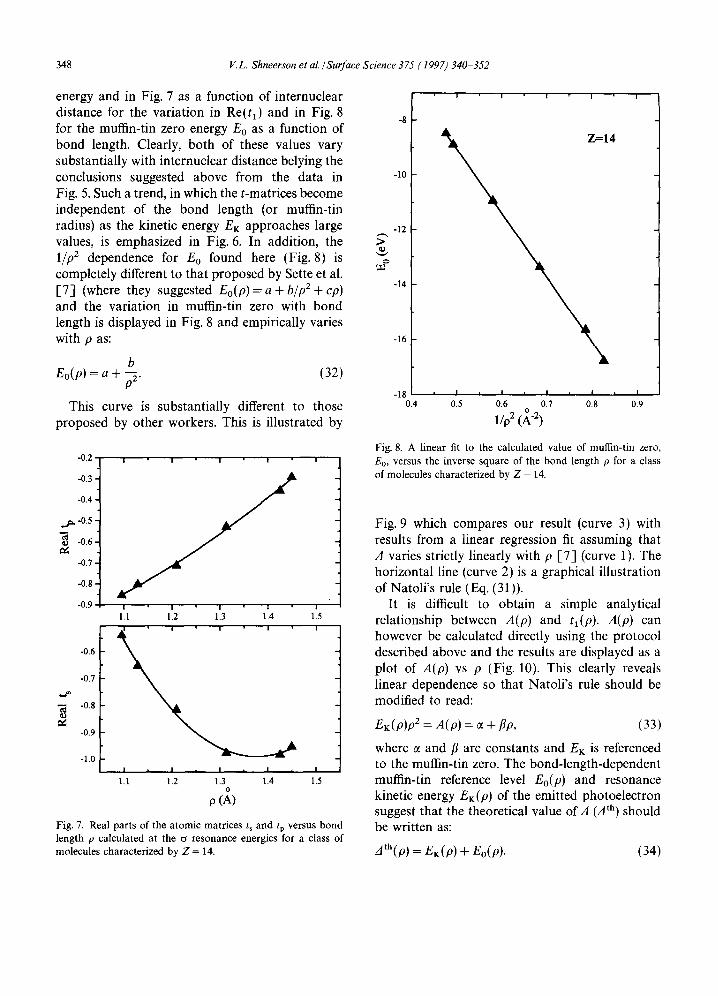
energy and in Fig. 7 as a function of internuclear distance for the variation in Re(h) and in Fig. 8 for the muffin-tin zero energy E0 as a function of bond length. Clearly, both of these values vary substantially with internuclear distance belying the conclusions suggested above from the data in Fig. 5. Such a trend, in which the t-matrices become independent of the bond length (or muffin-tin radius) as the kinetic energy EI~ approaches large values, is emphasized in Fig. 6. In addition, the l i p 2 dependence for Eo found here (Fig. 8) is completely different to that proposed by Sette et al. [7] (where they suggested Eo(p) = a + b/p 2 + cp) and the variation in muffin-tin zero with bond length is displayed in Fig. 8 and empirically varies with p as:
b Eo(p) = a + ~ . (32)
This curve is substantially different to those proposed by other workers. This is illustrated by
> &
-8
-I0
-12
-14
-16
| I I I I
-18 ' I 0.4 0.9
- 4
I , I , I , I i
0.5 0.6 0.7 0.8 l / p 2 ( ~ t "2)
-0.2 , i i , i
-0.31 -0.4
._d~ -0.5
061 -0.71 -0.8
-0.9 ll.1 112
O
-0.6
-0.7
-0.8
-0.9
- l . 0 l I
1.1 , I
1.2
Fig. 7. Real parts of the atomic
113 114 115 I I i
I , I I
1.3 1 .4 1.5 o
o (A)
matrices ts and tp versus bond length p calculated at the o resonance energies for a class of molecules characterized by Z = 14.
Fig. 8. A linear fit to the calculated value of muffin-tin zero, Eo, versus the inverse square of the bond length p for a class of molecules characterized by Z = 14.
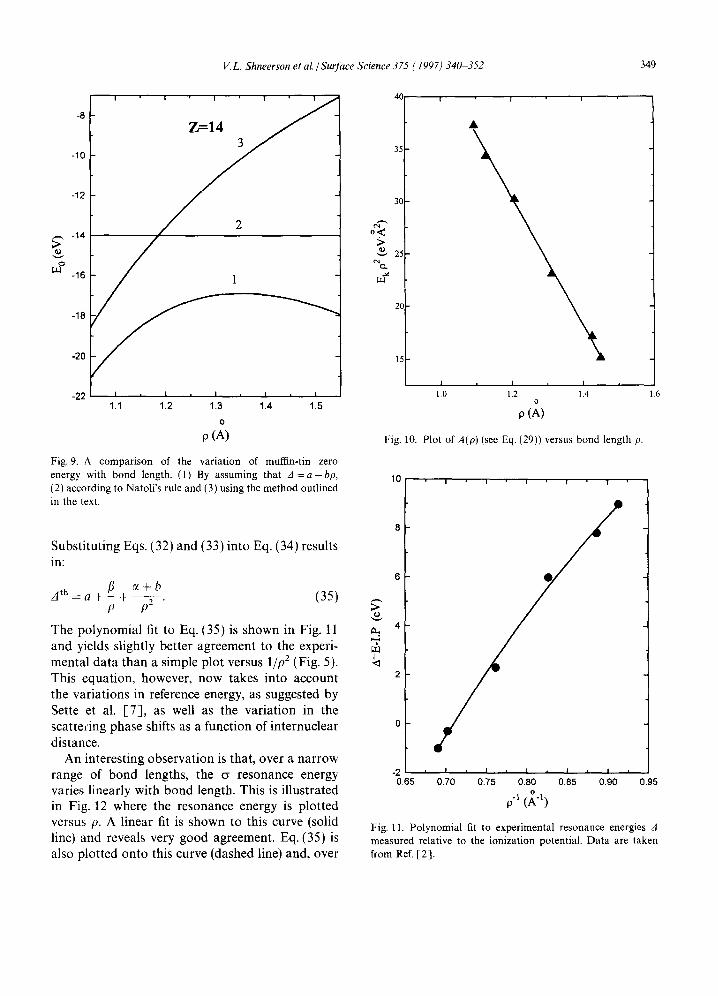
Fig. 9 which compares our result (curve 3) with results from a linear regression fit assuming that A varies strictly linearly with p [7] (curve 1). The horizontal line (curve 2) is a graphical illustration of Natoli's rule (Eq. (31)).
It is difficult to obtain a simple analytical relationship between A(p) and q(p) . A(p) can however be calculated directly using the protocol described above and the results are displayed as a plot of A(p) vs p (Fig. 10). This clearly reveals linear dependence so that Natoli's rule should be modified to read:
EK(p)p 2 = A(p) = ot + tip, (33)
where ~ and/3 are constants and EK is referenced to the muffin-tin zero. The bond-length-dependent muffin-tin reference level Eo(p) and resonance kinetic energy EI((p) of the emitted photoelectron suggest that the theoretical value of A (A th) should be written as:
Ath(p) = EK(p) -b Eo(p). (34)
V.L. Shneerson et al. / Surface Science 375 (1997) 340 352 349
-8
-10
-12
, - , -14 >
-16
-18
-20
-22
Z=14
1.1 1.2 1.3 1.4 1.5
0
p (A)
Fig. 9. A comparison of the variation of muffin-tin zero energy with bond length. (1) By assuming that 3 = a - b p , (2) according to Natoli 's rule and (3) using the method outlined in the text.
Substituting Eqs. (32) and (33) into Eq. (34) results in:
7 + b zl th = a + -fl + - - ( 3 5 ) p p2 •
The polynomial fit to Eq. (35) is shown in Fig. 11 and yields slightly better agreement to the experi- mental data than a simple plot versus 1/p 2 (Fig. 5). This equation, however, now takes into account the variations in reference energy, as suggested by Sette et al. 1-73, as well as the variation in the scattering phase shifts as a function of internuclear distance.
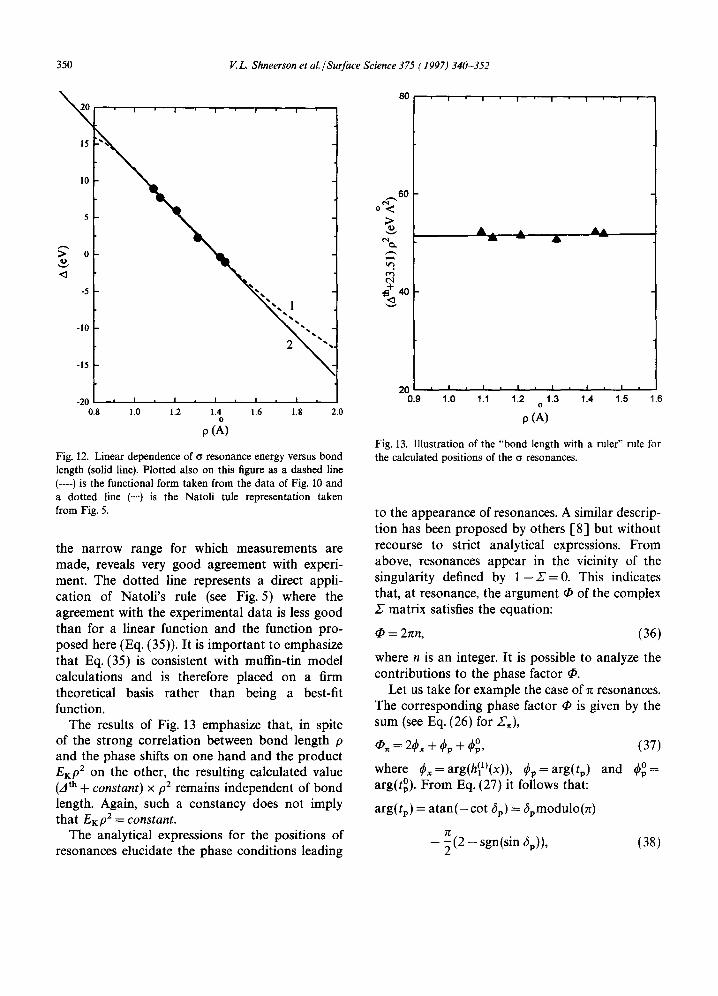
An interesting observation is that, over a narrow range of bond lengths, the ~ resonance energy varies linearly with bond length. This is illustrated in Fig. 12 where the resonance energy is plotted versus p. A linear fit is shown to this curve (solid line) and reveals very good agreement. Eq. (35) is also plotted onto this curve (dashed line) and, over
40 t
35
30
o <
25 c,tQ.
20
1.0 1.2 1.4 o
0 (A)
Fig. 10. Plot of A(p) (see Eq. (29)) versus bond length p.
1.6
;>
10
-2 0.65
I I l I I
I ~ I , I , . I , I
0.70 0.75 0.80 0.85 0.90 i
1.95
Fig. 11. Polynomial fit to experimental resonance energies 3 measured relative to the ionization potential. Data are taken from Ref. [23.
15
I0
-I0
5
%" o
I I I I I
-15
-20
0.8
• i .
1.0 1.2 1.4 1.6 1.8 2.0 o
p (A)
350 V.L. Shneerson et al. / Surface Science 375 (1997) 340-352
Fig. 12. Linear dependence of cr resonance energy versus bond length (solid line). Plotted also on this figure as a dashed line (----) is the functional form taken from the data of Fig. 10 and a dotted line (...') is the Natoli tule representation taken from Fig. 5.
the narrow range for which measurements are made, reveals very good agreement with experi- ment. The dotted line represents a direct appli- cation of Natoli's rule (see Fig. 5) where the agreement with the experimental data is less good than for a linear function and the function pro- posed here (Eq. (35)). It is important to emphasize that Eq. (35) is consistent with muffin-tin model calculations and is therefore placed on a firm theoretical basis rather than being a best-fit function.
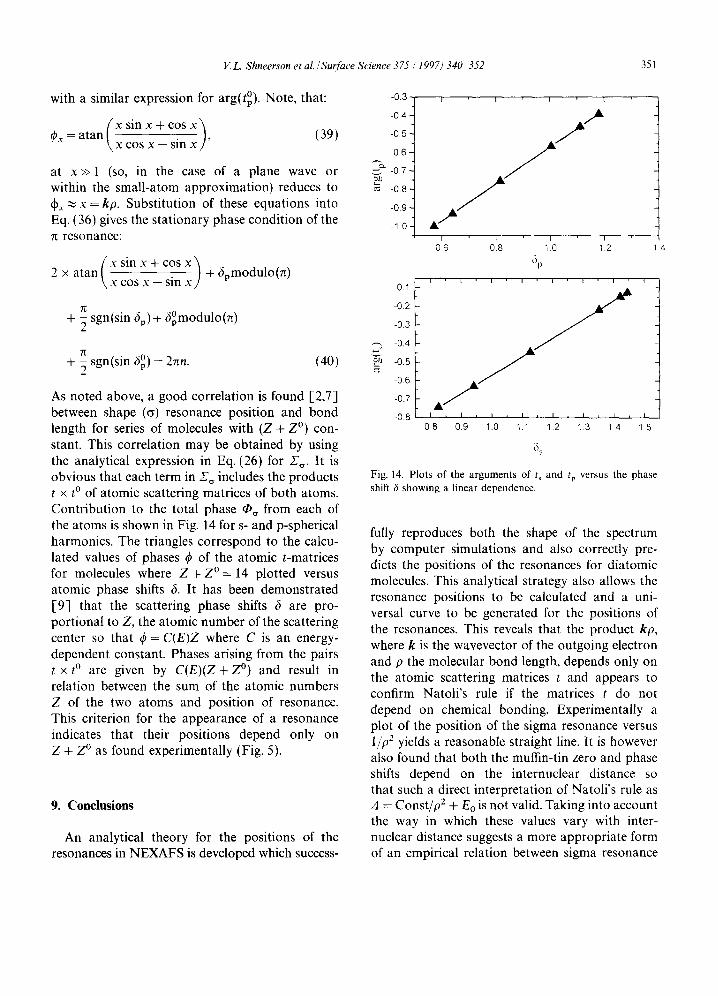
The results of Fig. 13 emphasize that, in spite of the strong correlation between bond length p and the phase shifts on one hand and the product EKp 2 on the other, the resulting calculated value (zt th + constant) x p2 remains independent of bond length. Again, such a constancy does not imply that EKp 2 = constant.
The analytical expressions for the positions of resonances elucidate the phase conditions leading
80 ~ , , , , , ,
6O
;>
¢**3
4o
• . • A A
20 , I i I , I , I , I , I ,
0.9 1.0 1.1 1.2 o 1.3 1.4 1.5 1.6
p (A)
Fig. 13. Illustration of the "bond length with a ruler" rule for the calculated positions of the (r resonances.
to the appearance of resonances. A similar descrip- tion has been proposed by others [8] but without recourse to strict analytical expressions. From above, resonances appear in the vicinity of the singularity defined by 1 - 27= 0. This indicates that, at resonance, the argument • of the complex Z matrix satisfies the equation:
= 2rm, (36)
where n is an integer. It is possible to analyze the contributions to the phase factor ~.
Let us take for example the case of rt resonances. The corresponding phase factor • is given by the sum (see Eq. (26) for Z~),
~ = 2~b x + ~bp + ~b °, (37)
where (~x=arg(h]l)(x)), ~p=arg(tp) and ~b°= arg(tv°). From Eq. (27) it follows that:
arg(tp) = a tan(-cot 6p) = 6pmodulo(n)
7E - ~(2 -sgn(sin 6v)), (38)
V.L. Shneerson et al./Surface Science 375 (1997) 340 352 351
with a similar expression for arg(t°). Note, that:
( x s i n x + cos x ) Cx=a tan - - , (39)
COS X - - s i n X
at x >> 1 (so, in the case of a plane wave or within the small-atom approximation) reduces to dpx ~ x = kp. Substitution of these equations into Eq. (36) gives the stationary phase condition of the n resonance:
2 × atan - + ~pmodulo(n) cos x - - sin
7~ + ~ sgn(sin ~p)- ' [- 3°modulo(n)
7~ + ~ sgn(sin 6 °) = 2gn. (40)
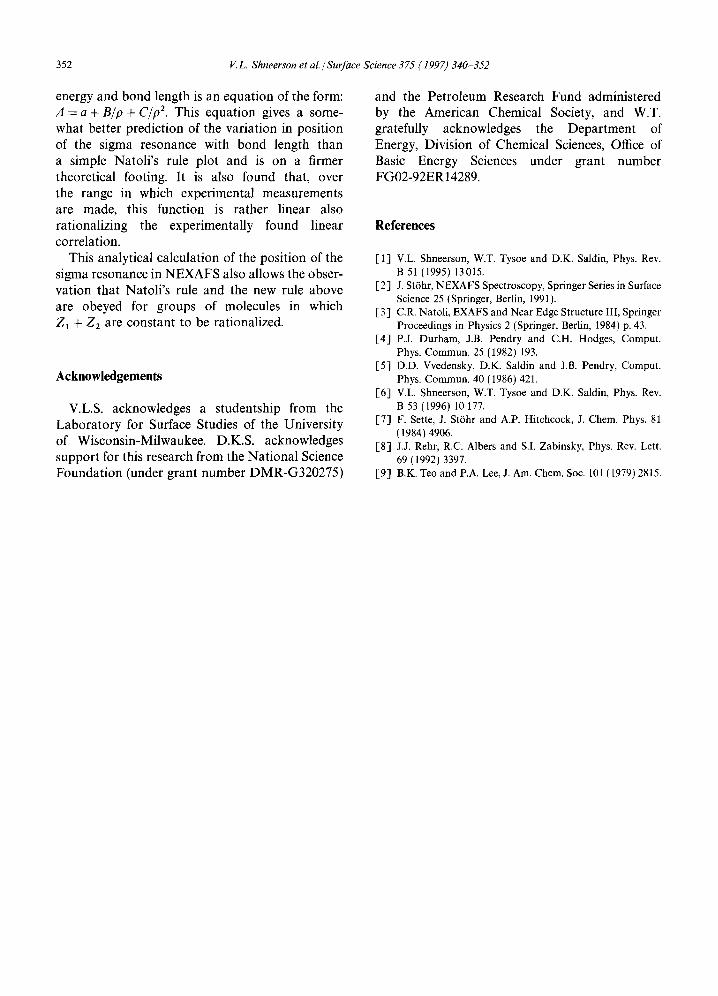
As noted above, a good correlation is found [2,7] between shape (~) resonance position and bond length for series of molecules with (Z + Z °) con- stant. This correlation may be obtained by using the analytical expression in Eq. (26) for X~,. It is obvious that each term in 22~, includes the products t x t o of atomic scattering matrices of both atoms. Contribution to the total phase ~ , from each of the atoms is shown in Fig, 14 for s- and p-spherical harmonics. The triangles correspond to the calcu- lated values of phases ~b of the atomic t-matrices for molecules where Z + Z ° = 14 plotted versus atomic phase shifts 6. It has been demonstrated [9] that the scattering phase shifts ~ are pro- portional to Z, the atomic number of the scattering center so that ¢ = C(E)Z where C is an energy- dependent constant. Phases arising from the pairs t x t o are given by C ( E ) ( Z + Z °) and result in relation between the sum of the atomic numbers Z of the two atoms and position of resonance. This criterion for the appearance of a resonance indicates that their positions depend only on Z + Z ° as found experimentally (Fig. 5).
9. Conclusions
An analytical theory for the positions of the resonances in NEXAFS is developed which success-
-0.3
-0.4 -
-0.5 [
-0.6
- 07
- 08
- o e i
- 10 ]
-0.1
-0.2
- 03
-0.4
-0.5
- 0 6
-0.7
-0.8
I i i t
0'8 Sp
i ' i ' i ' i ' i , 1 , i
0 8 0.9 1.0 1.1 1.2 1 3 14 I
1.5
Fig. 14. Plots of the arguments of t~ and tv versus the phase shift 6 showing a linear dependence.
fully reproduces both the shape of the spectrum by computer simulations and also correctly pre- dicts the positions of the resonances for diatomic molecules. This analytical strategy also allows the resonance positions to be calculated and a uni- versal curve to be generated for the positions of the resonances. This reveals that the product kp, where k is the wavevector of the outgoing electron and p the molecular bond length, depends only on the atomic scattering matrices t and appears to confirm Natoli's rule if the matrices t do not depend on chemical bonding. Experimentally a plot of the position of the sigma resonance versus 1/p 2 yields a reasonable straight line. It is however also found that both the muffin-tin zero and phase shifts depend on the internuclear distance so that such a direct interpretation of Natoli's rule as A = Const /p 2 + Eo is not valid. Taking into account the way in which these values vary with inter- nuclear distance suggests a more appropriate form of an empirical relation between sigma resonance
352 V.L. Shneerson et al./ Surface Science 375 (1997) 340-352
energy and bond length is an equation of the form: A = a + B / p + C / p 2. This equation gives a some- what better prediction of the variation in position of the sigma resonance with bond length than a simple Natoli 's rule plot and is on a firmer theoretical footing. It is also found that, over the range in which experimental measurements are made, this function is rather linear also rationalizing the experimentally found linear correlation.
This analytical calculation of the position of the sigma resonance in NEXAFS also allows the obser- vation that Natoli 's rule and the new rule above are obeyed for groups of molecules in which Z1 + Z2 are constant to be rationalized.
Acknowledgements
V.L.S. acknowledges a studentship from the Labora tory for Surface Studies of the University of Wisconsin-Milwaukee. D.K.S. acknowledges support for this research from the National Science Foundation (under grant number DMR-G320275)
and the Petroleum Research Fund administered by the American Chemical Society, and W.T. gratefully acknowledges the Department of Energy, Division of Chemical Sciences, Office of Basic Energy Sciences under grant number FG02-92ER14289.
References
[1] V.L. Shneerson, W.T. Tysoe and D.K. Saldin, Phys. Rev. B 51 (1995) 13015.
I-2] J. St6hr, NEXAFS Spectroscopy, Springer Series in Surface Science 25 (Springer, Berlin, 1991).
1-3] C.R. Natoli, EXAFS and Near Edge Structure III, Springer Proceedings in Physics 2 (Springer, Berlin, 1984) p. 43.
1-4] P.J. Durham, J.B. Pendry and C.H. Hodges, Comput. Phys. Commun. 25 (1982) 193.
1-5] D.D. Vvedensky, D.K. Saldin and J.B. Pendry, Comput. Phys. Commun. 40 (1986) 421.
1-6] V.L. Shneerson, W.T. Tysoe and D.K. Saldin, Phys. Rev. B 53 (1996) 10 177.
1-7] F. Sette, J. StOhr and A.P. Hitchcock, J. Chem. Phys. 81 (1984) 4906.
[-8] J.J. Rehr, R.C. Albers and S.I. Zabinsky, Phys. Rev. Lett. 69 (1992) 3397.
1-9] B.K. Teo and P.A. Lee, J. Am. Chem. Soc. 101 (1979) 2815.