Embed Size (px)
Citation preview
Office of Coast Survey
NOAA’s Storm Surge Modeling NOAA’s Storm Surge Modeling CapabilitiesCapabilities
Jesse C. FeyenStorm Surge Roadmap Portfolio Manager

Office of Coast Survey
NOAA’s Tropical Storm Surge ProductsSLOSH-based storm surge products
Office of Coast Survey
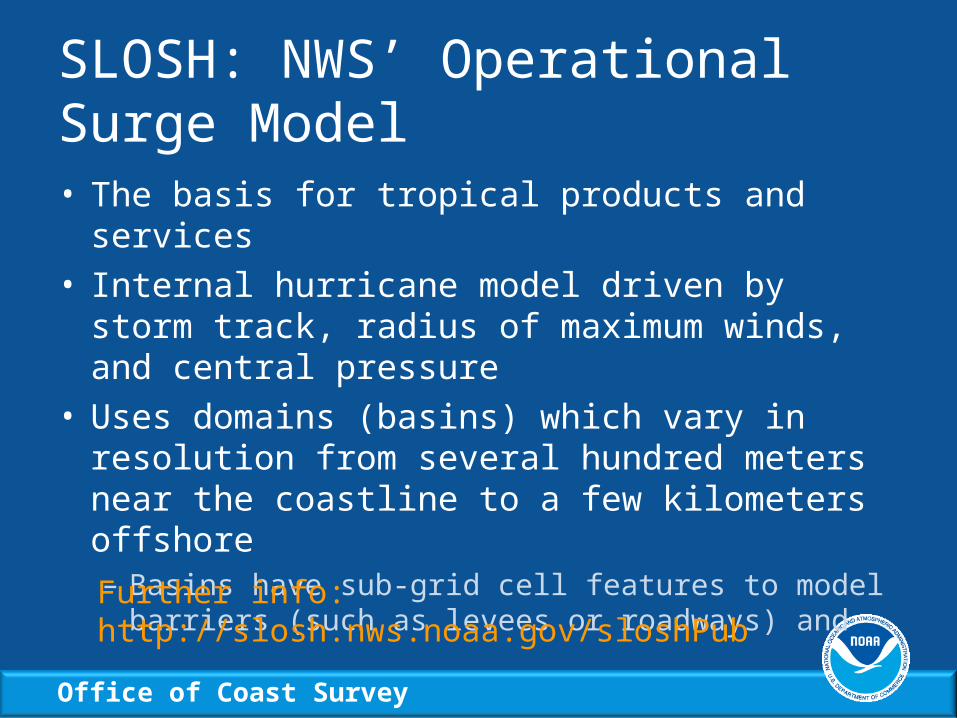
SLOSH: NWS’ Operational Surge Model
• The basis for tropical products and services• Internal hurricane model driven by storm track,
radius of maximum winds, and central pressure• Uses domains (basins) which vary in resolution
from several hundred meters near the coastline to a few kilometers offshore– Basins have sub-grid cell features to model barriers
(such as levees or roadways) and
Further info: http://slosh.nws.noaa.gov/sloshPub

Office of Coast Survey
Generating MEOWs and MOMs• Primary purpose for SLOSH is to estimate
potential surge for hurricane evacuation studies– NHC runs thousands of hypothetical storms through a
basin to create composites of potential surge in the form of MEOWs and MOMs
– More info: http://www.iwr.usace.army.mil/nhp/
MEOW = Maximum Envelopes of WaterWorst case snapshot for a particular storm category, forward speed, trajectory, and initial tide level, incorporating uncertainty in landfall location
MOM = Maximum of MaximumsCombines all MEOWs for a particular storm category

Office of Coast Survey
How a MEOW is Assembled

Office of Coast Survey
Predicting Imminent Events
• Real-time deterministic runs– National Hurricane Center (NHC) begins operational
SLOSH runs when a hurricane watch is issued (48 hours before landfall) based upon NHC’s official forecast
– Used by NHC and local Weather Forecast Offices to guide advisories and statements
Office of Coast Survey
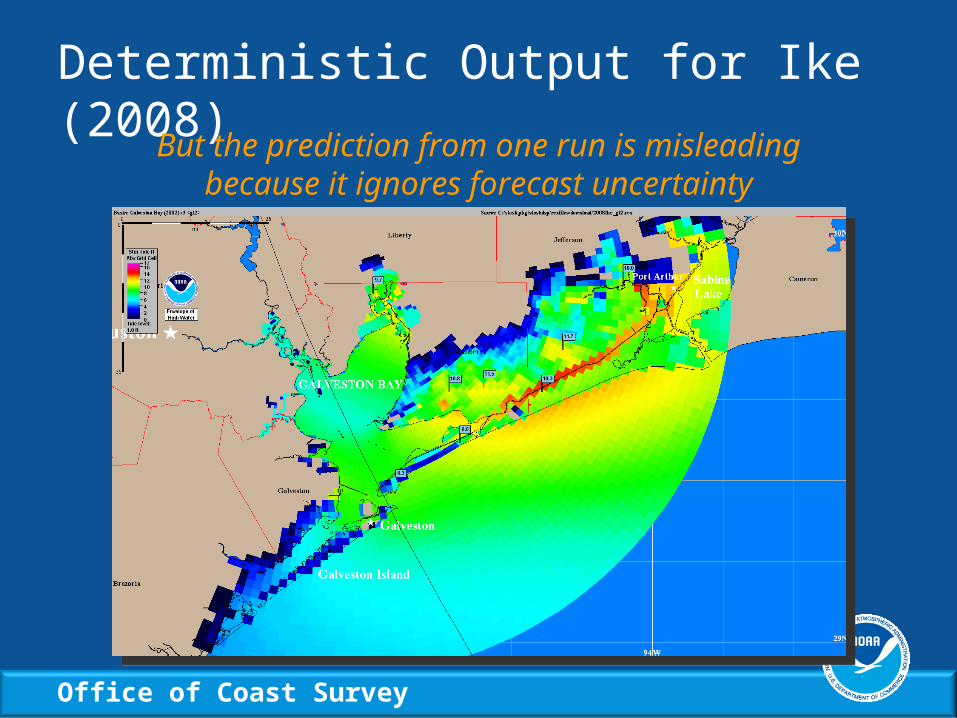
Deterministic Output for Ike (2008)But the prediction from one run is misleading
because it ignores forecast uncertainty

Office of Coast Survey
Hurricane Advisory – Approximately 12 hr. before landfall
NHC TRACK ERROR 12 hr. OUTNHC TRACK ERROR 12 hr. OUT
133 mph, 933 mb.

Office of Coast Survey
Actual Hurricane Track 30 mi. E of 12 hr. Advisory Forecast Track
TRACK FORECAST
ACTUAL TRACK
133 mph, 933 mb.

Office of Coast Survey
Rmax=25 mi(forecast)
Surge Based on NHC 12 hr. Advisory

Office of Coast Survey
Rmax=40 mi
Surge Based on NHC Storm Best Track

Office of Coast Survey
Filling the Gap: P-Surge
• Probabilistic storm surge predictions• Ensemble based on NHC forecast advisory
– Perturbation of cross-track error, along-track error, intensity error, and size error
• Computes probabilities and exceedance heights– “Probability of water exceeding X feet” available on
NHC’s website: http://www.nhc.noaa.gov/index.shtml– “Height exceeded by X%” of ensemble available at
MDL: http://www.weather.gov/mdl/psurge/
• Available in .kml, .shp, GRIB2

Office of Coast Survey
Perturbing the Forecast• Include 90% of
possible cross track error (roughly 3 times the size of the cone of error)
• Similar perturbations applied to size, speed, and intensity
• Results in hundreds of simulations
Office of Coast Survey
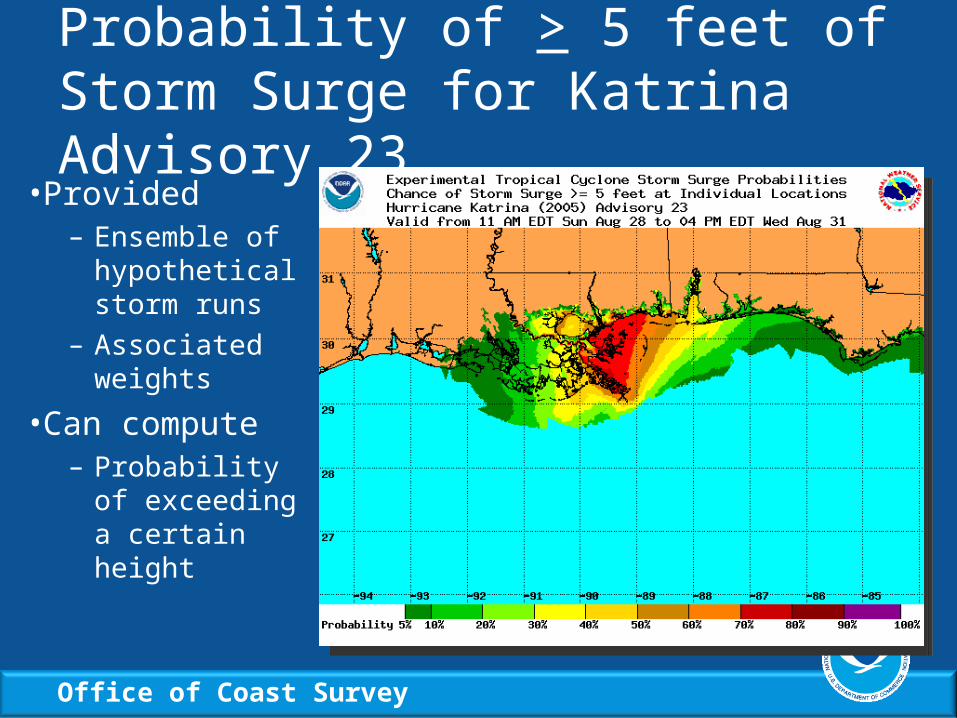
Probability of > 5 feet of Storm Surge for Katrina Advisory 23
•Provided– Ensemble of
hypothetical storm runs
– Associated weights
•Can compute– Probability of
exceeding a certain height

Office of Coast Survey
Height Exceeded by 10% of the Ensemble for Katrina Advisory 23
•Provided– Ensemble of
hypothetical storm runs
– Associated weights
•Can compute– Height
exceeded by a certain probability

Office of Coast Survey
Pacific SLOSH Basins- MOMs and MEOWs haven’t been generated- Operational?

Office of Coast Survey
SLOSH Display Package (SDP)
• Allows for viewing and exploring SLOSH data– Displays basins, MOMs, MEOWs, and historical
storms for viewing and analysis– Can animate and explore native .rex files– Can output .shp and .kml
• SDP is intended to be used by trained emergency managers, FEMA personnel, and NWS forecasters
Download: http://slosh.nws.noaa.gov/sloshPub/disclaim.php
Office of Coast Survey
Extratropical Storm Surge (ETSS)
• Operational modeling system based on SLOSH– Uses a larger grid since it is a larger phenomena and
driven by the Global Forecast System (GFS) model– 96 hourly surge forecasts are made every 6 hours, 24
x 7– Predictions given at points around U.S. coasts:
http://www.nws.noaa.gov/mdl/etsurge/– Visualizations also available:
http://www.opc.ncep.noaa.gov/et_surge/et_surge_info.shtml
Office of Coast Survey
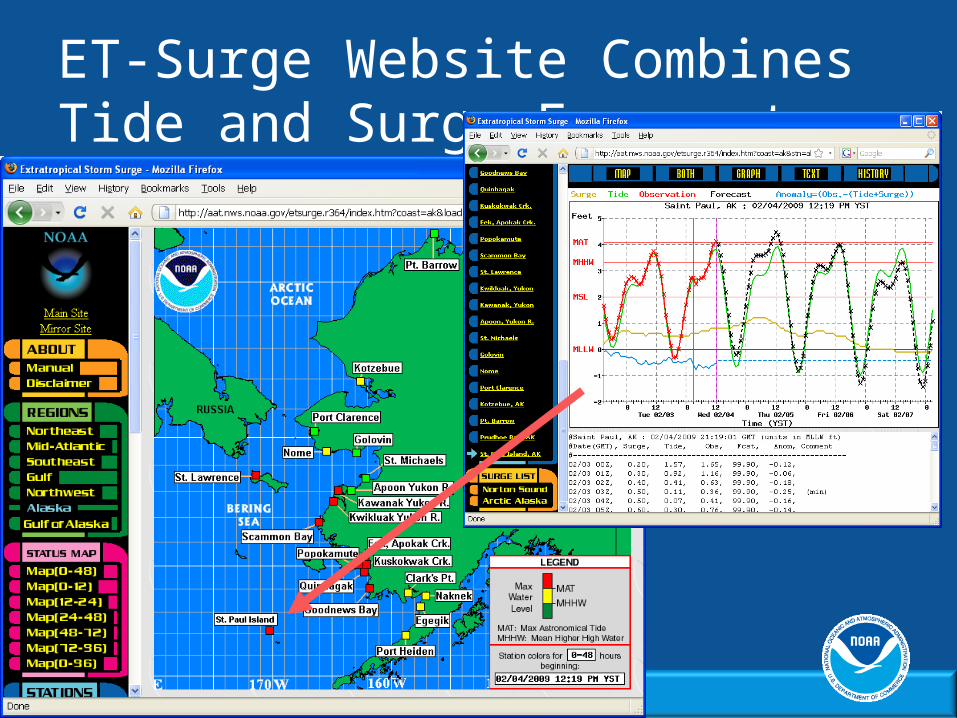
ET-Surge Website Combines Tide and Surge Forecasts

Office of Coast Survey
Visualization of Gridded ETSS Predictions

Office of Coast Survey
Coverage of ETSS
Office of Coast Survey
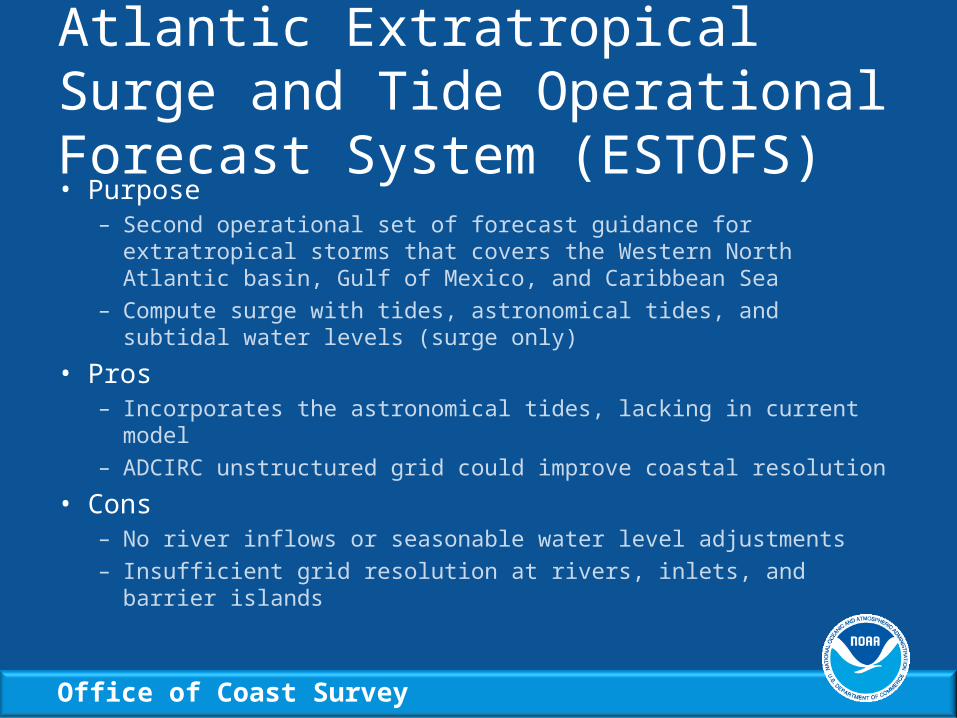
Atlantic Extratropical Surge and Tide Operational Forecast System (ESTOFS)• Purpose
– Second operational set of forecast guidance for extratropical storms that covers the Western North Atlantic basin, Gulf of Mexico, and Caribbean Sea
– Compute surge with tides, astronomical tides, and subtidal water levels (surge only)
• Pros– Incorporates the astronomical tides, lacking in current model– ADCIRC unstructured grid could improve coastal resolution
• Cons– No river inflows or seasonable water level adjustments– Insufficient grid resolution at rivers, inlets, and barrier islands

Office of Coast Survey
ESTOFS-Atlantic
• Applies widely validated ADCIRC model
• East Coast 2001 tidal database grid (EC2001)
• 254,565 nodes• Coastal resolution ≈ 3
km• Specify the tidal forcing
at 60o W

Office of Coast Survey
Operational Set-up
• 4 times per day running cycle– Time is 00z, 06z, 12z, and 18z
• Total 8 days simulation– 12-hr nowcast followed by 180-hr forecast
• Surface forcing from GFS – 10 m winds and sea level pressure every 3 hours
• Tidal forcing from OSU TPXO v6.2• Scheduled to be operational at NCO FY12 Q2

Office of Coast Survey
ESTOFS Output• Deliver three types of water level
– Combined Water Level (CWL): Surge + tides
– Harmonic Tidal Prediction (HTP): Astronomical tides
– Subtidal Water Level (SWL): SWL = CWL – HTP
• Provide both field and point output– 6 minute water level at points, hourly water level for fields
• Output on grid (NetCDF) and 2.5 km NDFD (GRIB2)
2009 Veteran’s Day Nor’Ida2009 Veteran’s Day Nor’Ida

Office of Coast Survey
Water Level as Fields
EC2001 grid (NetCDF) NDFD CONUS grid (GRIB2)

Office of Coast Survey
Water Level as Fields
EC2001 grid (NetCDF) NDFD CONUS grid (GRIB2)

Office of Coast Survey
Hindcast Skill Assessment(ESTOFS CWL vs ETSS + CO-OPS TP + Anomaly)
East Coast Gulf of Mexico

Office of Coast Survey
Ensemble Model Development• Uncertainty in initial
conditions• Evaluate the extent of
model predictability• Model uncertainty:
dynamics• Model uncertainty:
Physics
• Deterministic model only consider one IC
• Single model can not give us probability clue
• Only one numerical method for single model
• Only one set of physical parameterizations can be used

Office of Coast Survey