Embed Size (px)
Citation preview
Sea Level Rise and Hurricane Florence storm surge research methodology
FirstStreet.org
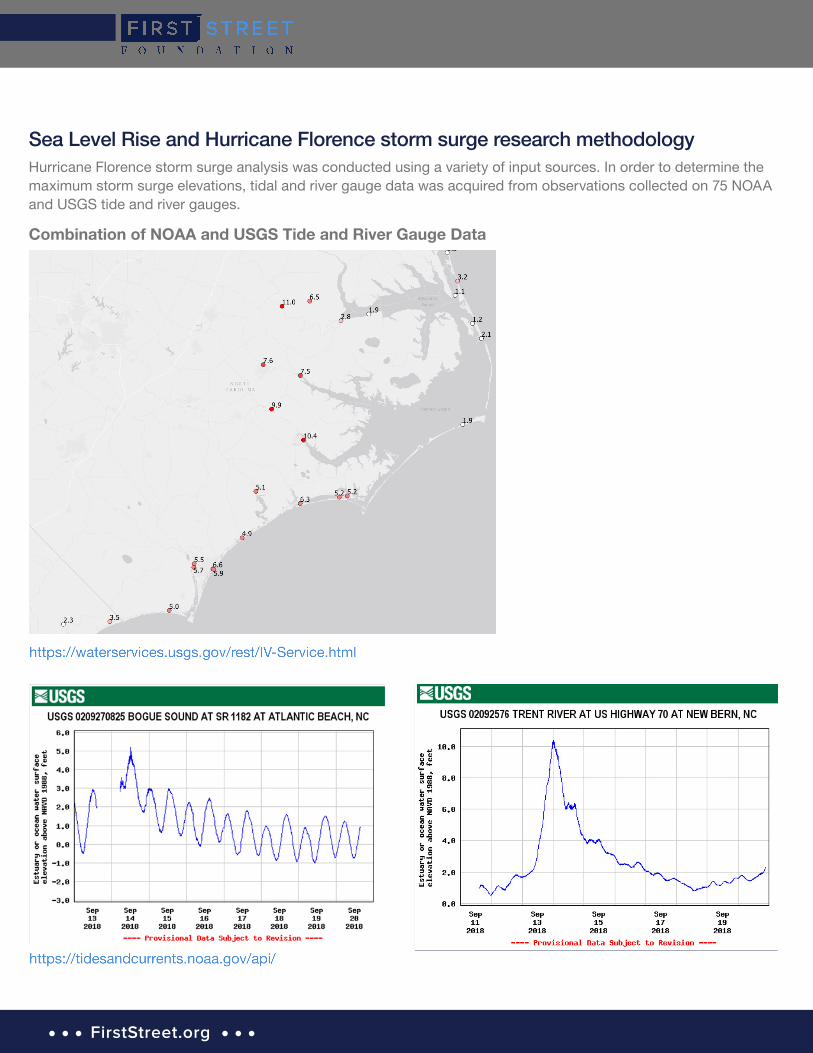
Hurricane Florence storm surge analysis was conducted using a variety of input sources. In order to determine the maximum storm surge elevations, tidal and river gauge data was acquired from observations collected on 75 NOAA and USGS tide and river gauges.
Combination of NOAA and USGS Tide and River Gauge Data
FirstStreet.org
NOAA chart 1
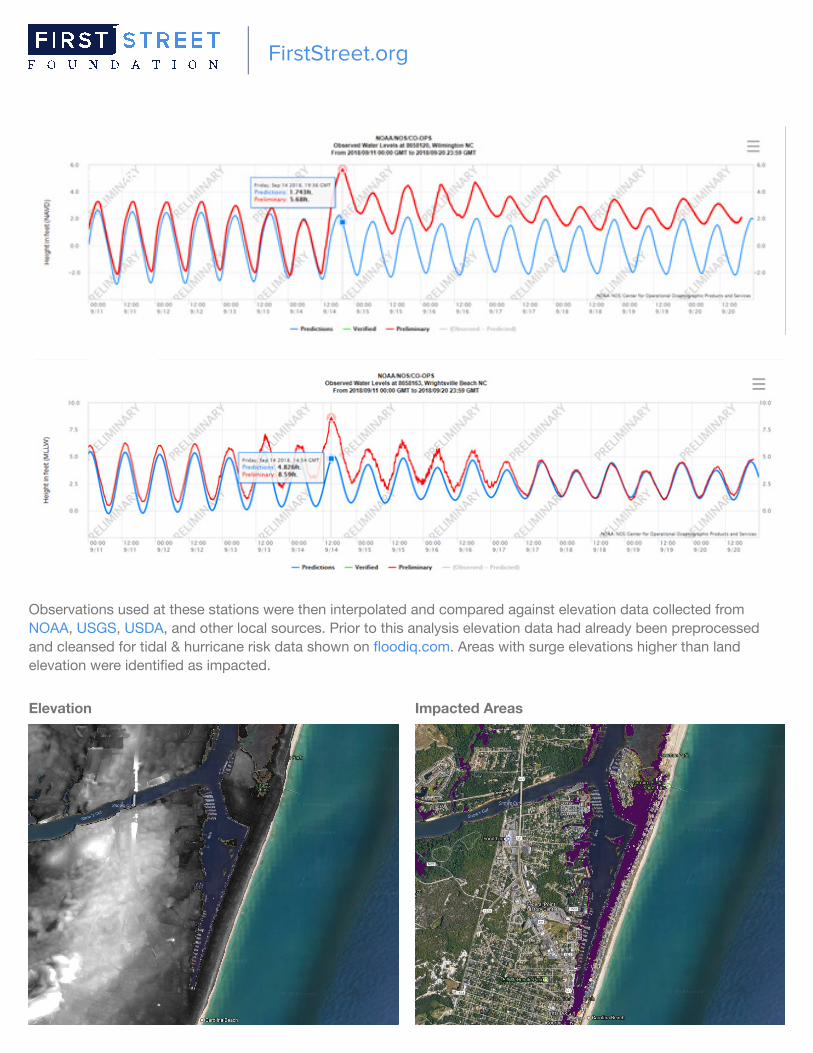
Observations used at these stations were then interpolated and compared against elevation data collected from NOAA, USGS, USDA, and other local sources. Prior to this analysis elevation data had already been preprocessed and cleansed for tidal & hurricane risk data shown on floodiq.com. Areas with surge elevations higher than land elevation were identified as impacted.
Elevation Impacted Areas
FirstStreet.org
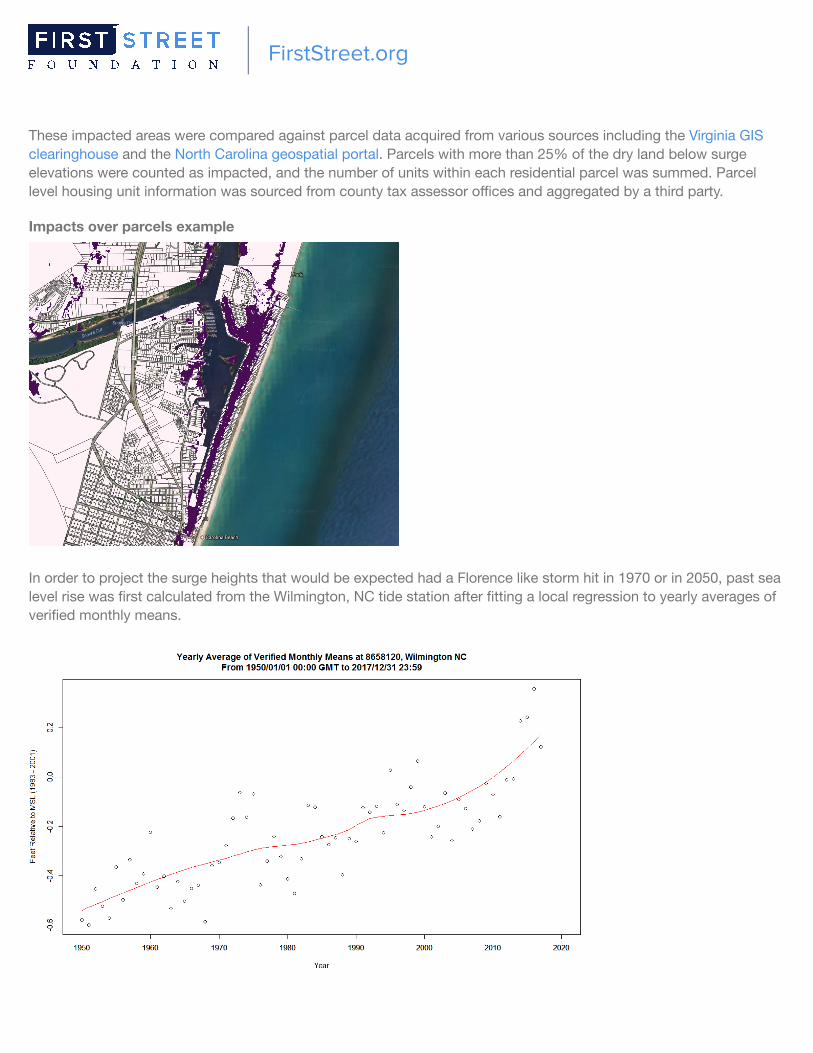
These impacted areas were compared against parcel data acquired from various sources including the Virginia GIS clearinghouse and the North Carolina geospatial portal. Parcels with more than 25% of the dry land below surge elevations were counted as impacted, and the number of units within each residential parcel was summed. Parcel level housing unit information was sourced from county tax assessor offices and aggregated by a third party.
In order to project the surge heights that would be expected had a Florence like storm hit in 1970 or in 2050, past sea level rise was first calculated from the Wilmington, NC tide station after fitting a local regression to yearly averages of verified monthly means.
Impacts over parcels example
9/20/2018 Photo note
https://keep.google.com/u/1/#NOTE/1a1_XWo-bMEyCzgKzRF_O1TkGDTcFBAw2d_hP1_r-VF1s-BFzlSacrORY2ZFjmQ 1/1
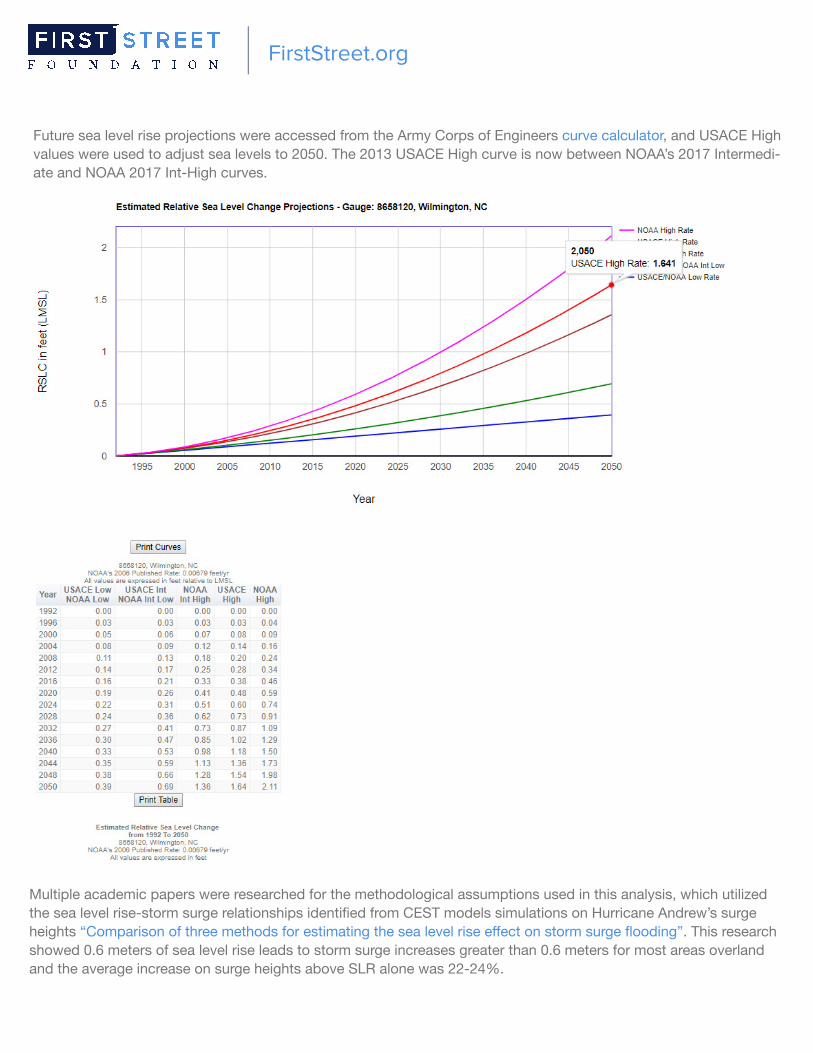
Future sea level rise projections were accessed from the Army Corps of Engineers curve calculator, and USACE High values were used to adjust sea levels to 2050. The 2013 USACE High curve is now between NOAA’s 2017 Intermedi-ate and NOAA 2017 Int-High curves.
FirstStreet.org
Multiple academic papers were researched for the methodological assumptions used in this analysis, which utilized the sea level rise-storm surge relationships identified from CEST models simulations on Hurricane Andrew’s surge heights “Comparison of three methods for estimating the sea level rise effect on storm surge flooding”. This research showed 0.6 meters of sea level rise leads to storm surge increases greater than 0.6 meters for most areas overland and the average increase on surge heights above SLR alone was 22-24%.
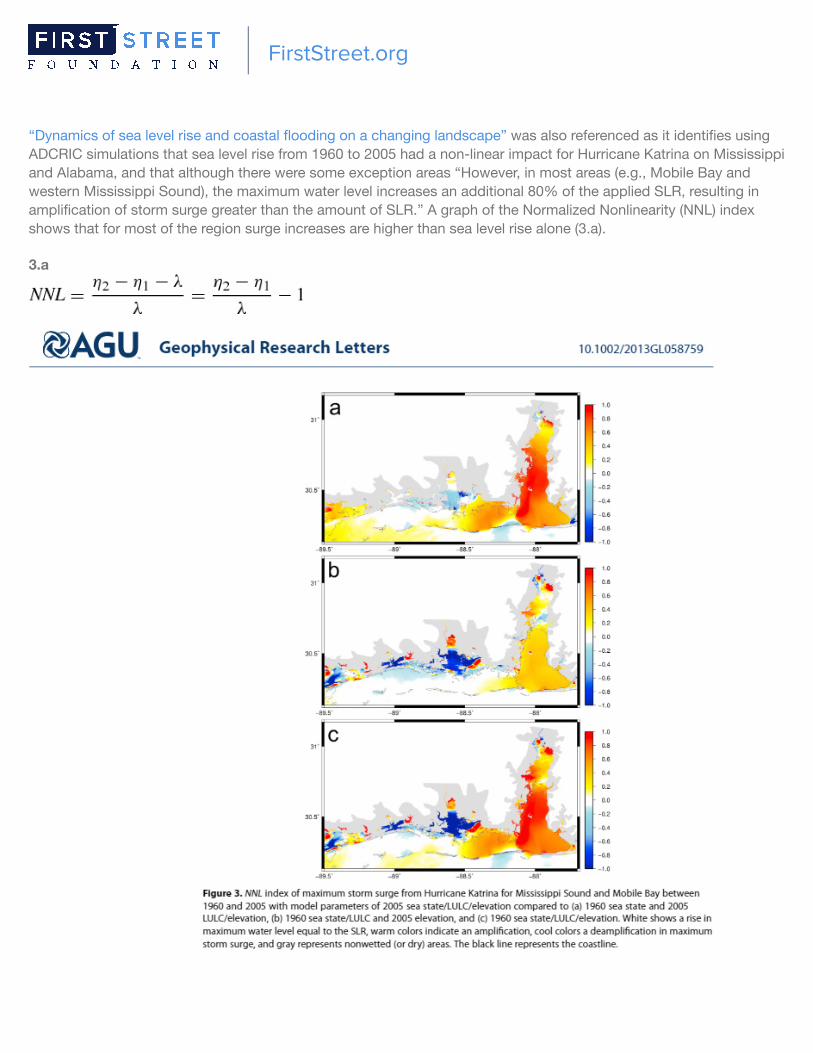
“Dynamics of sea level rise and coastal flooding on a changing landscape” was also referenced as it identifies using ADCRIC simulations that sea level rise from 1960 to 2005 had a non-linear impact for Hurricane Katrina on Mississippi and Alabama, and that although there were some exception areas “However, in most areas (e.g., Mobile Bay and western Mississippi Sound), the maximum water level increases an additional 80% of the applied SLR, resulting in amplification of storm surge greater than the amount of SLR.” A graph of the Normalized Nonlinearity (NNL) index shows that for most of the region surge increases are higher than sea level rise alone (3.a).
3.a
FirstStreet.org

Four numbers were ultimately used to adjust the surge heights mapped against parcels in the Carolinas and Virginia: 1.24 feet of SLR from 2017 - 2050 from the USACE, 1.5252 feet in surge addition applied to Florence surge predic-tions due to the ~23% additional increase of surge over SLR identified in the Hurricane Andrew analysis, 0.51 feet of sea level rise from 1970 to 2017 identified with an analysis of the Wilmington, NC tide gauge, and 0.63 feet of surge reduction applied to Florence surge heights to estimate the surge impact of a similar storm in 1970.
Lastly, two methodologies were combined in order to quantify the impact of development on the number of residential units that have been developed in the region between 1970 and 2018. The first method used the build date of proper-ties found in tax assessment data to identify parcels that could have been impacted by a Florence like storm impact-ing the region in 1970. The second method utilized 2010 housing unit Census data, A Longitudinal Tract Database, and USGS Land Use Trend data to map storm surge extents against development patterns within non-water / wetland areas within tracts. The two methodologies provided similar results (within 25% of one another) and after the tract analysis was benchmarked against the 2018 parcel impacts, the two 1970s projections were averaged.
This analysis does not include additional flooding due to wave run-up, heavy precipitation and poor drainage, riverine flooding, or damage due to wind, so overall underestimates the full impact of Florence. Research consistently showssea level rise has a non-linear impact on storm surge, and in most areas increases surge heights above the magnitude of sea level rise alone. For the purpose of the analysis the conservative additional increase of 23% was applied across the region, however topography and bathymetry would likely cause this increase to be 200-300% in many areas over land that would have had smaller surges (1 - 3 meters) but likely even decrease surge heights changes in a few areas below the magnitude of sea level changes. Any temporary measures setup to mitigate storm surge were not included. These measures could have protected homes from storm surge that elevation alone would not have protected.
FirstStreet.org
2050 1970SLR 1.24 -0.50887Surge change 1.5252 -0.62591