Embed Size (px)
Citation preview

OECD Teaching and Learning International Study (TALIS)
Summary Report for Ireland
Gerry Shiel Rachel Perkins
Lorraine Gilleece
Educational Research Centre June 16, 2009


Table of Contents
TALIS National Advisory Group iv What is TALIS? 1 1 The Context of TALIS 2 2 Background on Schools and Teachers 3 3 Professional Development of Teachers 4 4 Teachers’ Beliefs About Teaching and Their Pedagogical
Practices 6
5 School Evaluation and Teacher Appraisal and Feedback 13 6 School Leadership and Management Styles 17 7 Key Factors in Developing Effective Learning Environments 20 8 Summary of Main Findings 25 References
This is a Summary Report on the outcomes of the OECD Teaching and Learning Survey in Ireland. Readers who seek a broader or more detailed perspective on TALIS should visit www.oecd.org/edu/TALIS, where they will find:
• Creating Effective Teaching and Learning Environments: First Results from TALIS. Executive Summary; and
• Creating Effective Teaching and Learning Environments: First Results from TALIS. Main Report.
The data in this Summary Report are drawn from these two reports. A detailed national report for Ireland, including additional analyses and recommendations arising from the TALIS outcomes, is currently in preparation, and should be available at www.erc.ie from December 2009. The Educational Research Centre acknowledges the support of principal teachers, TALIS co-ordinating teachers, and subject teachers in participating post-primary schools.
iii

TALIS National Advisory Group
An Advisory Group, appointed by the Minister for Education and Science, advises the Educational Research Centre (ERC) on the implementation of the TALIS study and on the interpretation of outcomes. Members of the Group are: Eamonn Murtagh (Chair), Inspectorate, Department of Education and Science Clive Byrne, National Association of Principals and Deputy Principals Sr. Marie Clegg, Association of Community and Comprehensive Schools (to March 2009) Ann Dinan, Joint Managerial Board for Secondary Schools Ciarán Flynn, Association of Community and Comprehensive Schools (from April 2009) Bernie Judge, Teachers’ Union of Ireland Paddy Lavelle, Irish Vocational Educational Association Moria Leydon, Association of Secondary Teachers of Ireland Ann Rickard, National University of Ireland, Maynooth Alan Wall, Teacher Education Section, Department of Education and Science Lorraine Gilleece, ERC (from January 2009) Laura McAvinue, ERC (National Project Manager, to September 2007) Rachel Perkins, ERC (National Project Manager from October 2007) Maeve Proctor, ERC (October 2007 to September 2008) Gerry Shiel, ERC (Representative for Ireland, TALIS Board of Participating Countries)
Note on Technical Terminology The TALIS Summary Report for Ireland includes a number of technical terms. Two of them are briefly explained here. Ipsative Mean Scores: Calculating ipsative mean scores is an approach to standardising individual responses to express them as preferences between two or more options, and thus helps reduce the effects of response bias. Ipsative mean scores are used in chapter 4 to illustrate differences between teachers in their beliefs about learning and their instructional practices, and in chapter 6 to highlight differences between principal teachers’ management styles. Mean scores are calculated for two or more indices (based on their individual items) and for an overall index (based on all items combined). For each teacher, the score on the index based on all items is subtracted from the score on each separate index. The resulting scores are averaged across teachers in a country and give a relative endorsement of one index compared with the other. More positive mean scores indicate that one index is more strongly supported than the other(s). Multiple Regression: In chapters 4, 6 and 7, the outcomes of multiple regression analyses are discussed. Multiple regression is used to ascertain the effects of one or more predictor (or independent) variables on dichotomous (yes/no) or continuous predicted (dependent) variables. Multiple regression allows for the identification of a statistical effect (or relationship) between two variables (for example, teacher-student relations and teacher self-efficacy), while controlling for other, related variables, including teacher and school characteristics. An effect may be positive or negative. Readers are cautioned not to assign causality to significant associations between variables that are confirmed by multiple regression analysis.
iv

What is TALIS?
TALIS, the Teaching and Learning International Survey, is a project of the Organisation for Economic Cooperation and Development (OECD). TALIS focuses on the learning environments and teaching conditions in post-primary schools. Its purpose is to ‘assist countries to review and develop policies to make the teaching profession more attractive and more effective’ (OECD, 2009a, p. 3). TALIS looks at: aspects of teacher professional development; teachers’ beliefs, attitudes and practices; teacher appraisal and feedback; and school leadership. In 2007 (Southern hemisphere countries) and 2008 (Northern hemisphere countries), questionnaires were administered to representative samples of class (subject) teachers and principals in lower secondary schools (those attended by Junior Cycle pupils) in 24 countries (17 in the OECD; 7 ‘partner’ countries) (Table 1). TABLE 1: COUNTRIES PARTICIPATING IN TALIS (2007-08)
OECD Countries Partner Countries Australia Ireland Poland Brazil Austria Italy Portugal Bulgaria Belgium (FL) Korea Slovak Republic Estonia Denmark Mexico Spain Lithuania Hungary Netherlands* Turkey Malaysia Iceland Norway Malta Slovenia *Not included in data tables, as TALIS sampling standards were not achieved. TALIS was implemented at international level by the International Association for the Evaluation of Educational Achievement (IEA), on behalf of the OECD. In Ireland, the survey was administered by the Educational Research Centre. Data were collected in February-March 2008. The achieved sample in Ireland was 2227 teachers in 142 schools. TALIS was administered in two formats: print and electronic. In Ireland, the vast majority of responding teachers and principals chose the print versions of the questionnaires. This summary is divided into 7 chapters. The first describes the context of the survey. The second provides background on the participating teachers and schools, while the third considers the professional development of teachers. The fourth chapter is about teachers’ beliefs about teaching and their pedagogical practices, and the fifth concerns the evaluation of schools and teachers. The sixth chapter describes the management styles of principal teachers, while the seventh looks at factors associated with classroom learning environments (that is, factors related to classroom disciplinary climate and teacher self-efficacy). Throughout the report, particular attention is drawn to comparisons between Ireland and a subset of TALIS countries – Austria, Belgium (Flemish Community), Norway, Denmark and Poland – as well as the TALIS country average (the average percentage or score across the 23 TALIS countries for which data are available). Readers are advised that the findings reported here are based on the subjective views of principals and subject teachers. Moreover, a number of scales used in chapters 4 and 6 reflect cultural differences, and hence may not be fully comparable across countries. Finally, statistically significant associations between variables should not be interpreted as causal links.
1
Chapter 1: The Context of the TALIS Study TALIS has been developed as part of the OECD Indicators in Education Systems (INES) project which develops indicators with which to compare the functioning and performance of educational systems (see, for example, the annual Education at a Glance publication). An earlier OECD study, Teachers Matter: Attracting, Developing and Retaining Effective Teachers (OECD, 2005) referred to a need to develop better national and international information on teachers. As part of the same study, a Country Background Report for Ireland was prepared by Coolahan (2003). In it, he refers to some issues also addressed in TALIS – initial teacher education, induction and in-career development. A number of recent developments in Irish education are relevant to TALIS. These include: the publication of the Review of Post-Primary Education (Byrne, 2002) in which proposals for the future development of teachers in the sector were laid out; the establishment of the Teaching Council in 2005, which seeks, among other things to ‘establish best practice at all stages on the continuum of teacher education’ (Teaching Council, 2008); the implementation by schools of activities such as school self-evaluation and review with support from the School Development Planning Initiative; and the implementation of pilot induction/mentoring programmes for teachers in post-primary schools (Killeavy & Murphy, 2006). In 2007, the Teacher Education section of the Department of Education and Science published a review of the impact of programmes for which it provides funding, including teacher in-career development (DES, 2007). A renewed emphasis on quality is also evident in the educational system. The participation of Ireland, along with other OECD countries in the Programme for International Student Assessment (PISA), which involves the assessment of representative national samples of 15-year olds in reading, mathematics and science every three years (e.g., Eivers, Shiel & Cunningham, 2008), bears testimony to this emphasis. A focus on quality of teaching is evident in the implementation of more frequent whole school evaluations and subject inspections by the Inspectorate of the Department of Education and Science. In 2008, 60 whole-school evaluations were conducted in post-primary schools, as were 443 stand-alone subject inspections, 225 subject inspections within whole-school inspections, 32 stand-alone programme inspections, and 10 programme inspections within whole-school inspections. Since 2006, inspection reports have been published on the Department of Education and Science website (www.education.ie). Finally, the role of school principals has come into focus with the publication of the OECD Report, Improving School Leadership (Pont, Nusche & Moorman, 2008), and the Irish country background report on the same topic (OECD, 2007). In these reports, effective management is associated not only with effective school leadership but also with strong management of instruction.
2

Chapter 2: Background on Schools and Teachers In Ireland, 69% of teachers of lower-secondary students are female (Table 2.1). This is similar to the TALIS country average (69%) but greater than in Norway (60%) and Denmark (58%). Thirty-five percent of teachers in Ireland have 20 or more years teaching experience, again about the same as the TALIS country average (36%), but fewer than in Austria (57%). Fewer teachers in Ireland (73%) are permanently employed, compared with the TALIS average of 85%, 90% in Norway and 97% in Denmark. TABLE 2.1: PERCENTAGES OF TEACHERS OF LOWER-SECONDARY STUDENTS WITH VARIOUS CHARACTERISTICS – IRELAND, SELECTED COMPARISON COUNTRIES AND TALIS COUNTRY AVERAGE (2007-08) Female
teachers Teachers with 20+ years of Experience
Teachers permanently employed
Austria 67.9 57.2 89.3 Belgium (Fl) 68.9 34.0 80.7 Denmark 58.1 38.5 96.6 Ireland 68.6 35.3 73.4 Norway 60.4 39.1 89.9 Poland 76.3 30.7 77.1 TALIS Average 69.3 35.5 84.5 Source: OECD (2009b), Tables 2.1, 2.3 The ratio of pedagogical support persons (teacher aides, laboratory assistants, special needs assistants) to teaching staff in Ireland is 16 to one (i.e., 1 support person for every 16 teachers) (Table 2.2). This is marginally less favourable than the TALIS country average ratio (13:1). The ratio of teachers to administrative and management personnel (non-teaching principals and deputy principals, secretarial staff) is higher in Ireland (11:1) than on average across TALIS countries (8:1). Among comparison countries, Denmark and Norway enjoy more favourable ratios than Ireland for both pedagogical support and administrative/management personnel, while Austria has less favourable ratios for both. TABLE 2.2: RATIO OF TEACHERS TO PERSONS FOR PEDAGOGICAL SUPPORT AND TO ADMINISTRATIVE/MANAGEMENT PERSONNEL, AND AVERAGE CLASS SIZE – IRELAND, SELECTED COMPARISON COUNTRIES AND TALIS COUNTRY AVERAGE (2007-08) Ratio of teachers to
personnel for pedagogical support
Ratio of teachers administrative or
management personnel Average Class Size
Austria 24.1 22.6 21.1 Belgium (Fl) 20.5 11.7 17.5 Denmark 9.1 7.5 20.0 Ireland 15.8 11.1 21.9 Norway 7.0 8.3 21.4 Poland 9.4 9.0 20.8 TALIS Average 13.3 8.4 23.5 Source: OECD (2009b), Table 2.4 Principal teachers in TALIS were asked to identify resource issues that hindered instruction. Eighty-three percent of teachers in Ireland (the highest percentage amongst TALIS countries) taught in schools whose principals reported that a shortage of laboratory technicians hindered instruction ‘a lot’ or ‘to some extent’. Other areas that concerned Irish principals to a greater extent than their TALIS counterparts were a lack of instructional support personnel (64% of teachers teach in schools where this is reported to be a problem), shortage or inadequacy of computers for instruction (63%), and shortage or inadequacy of library materials (66%) (OECD, 2009b, Table 2.5).
3

Chapter 3: Professional Development of Teachers TALIS defines professional development as ‘activities that develop an individual’s skills, knowledge, expertise and other characteristics as a teacher’ in the form of courses and workshops, education conferences and seminars, qualification programmes, observation visits to schools, participation in networks of teachers, individual or collaborative research, and mentoring and/or peer observation and coaching. Teachers in TALIS were asked about their participation in these professional development activities in the 18 months prior to the survey. In Ireland, 90% of teachers reported that they had participated in some professional development. This is about the same as the TALIS country average (89%), and greater than Denmark (76%). On average, teachers in Ireland attended fewer days of professional development (6 days) than their counterparts in other TALIS countries (OECD, 2009b, Table 3.1). The TALIS country average is 15 days (Table 3.1). For Irish teachers, 41% of all professional development days taken are compulsory – a figure that is also lower than the corresponding TALIS country average (51%) (Table 3.1). TABLE 3.1: PARTICIPATION IN PROFESSIONAL DEVELOPMNET IN 18 MONTHS PRIOR TO TALIS SURVEY (2007-08) – IRELAND, SELECTED COMPARISION COUNTRIES, AND TALIS COUNTRY AVERAGE Percent of teachers
undertaking some professional development in
previous 18 months
Average number of days of professional development across
all teachers
Average percent of professional
development days that were compulsory
Austria 96.6 10.5 31.4 Belgium (Fl) 90.3 8.0 33.6 Denmark 75.6 9.8 34.6 Ireland 89.7 5.6 41.4 Norway 86.7 9.2 55.5 Poland 90.4 26.1 41.0 TALIS Average 88.5 15.3 51.0 Source: OECD (2009b), Tables 3.1 The types of professional development undertaken by teachers in Ireland in the 18 months prior to TALIS included attendance at courses and workshops (86% of teachers)1, participation in professional development networks (51%), attendance at education conferences and seminars (42%), and individual and collaborative research (26%). Relative to the corresponding TALIS country averages, proportionately fewer teachers in Ireland participated in mentoring and peer observation (18% vs. 35%), qualification programmes (11% vs. 25%), or observation visits to other schools (8% vs. 28%). Teachers in Ireland identified the following as areas in which they had high levels of unmet professional development needs:
• ICT teaching skills (34% in Ireland, vs. 24% on average across TALIS countries)
• Teaching special learning needs students (38% vs. 31%) • Teaching in a multi-cultural setting (24% vs. 14%) • Student counselling (25% vs. 17%).
1 Percentages in the remainder of this chapter only refer to teachers who had participated in professional development in the 18 months prior to the TALIS study.
4

Areas in which relatively few Irish teachers indicated high levels of need were: content and performance standards, student assessment, classroom management, subject field(s) and instructional practice. Seventy-nine percent of teachers in Ireland who participated in professional development reported that they paid no costs. This compares favourably with most TALIS countries (TALIS country average = 65%). Ninety-five percent of teachers in Ireland reported that they received scheduled time in which to participate in professional development. Again, this was well above the TALIS country average (63%), and perhaps reflects the more centralised nature of professional development in Ireland. Just 6% of teachers in Ireland who had undertaken professional development reported that they had received a salary supplement. The corresponding TALIS country average was 11%. In Ireland, 54% of teachers indicated that they had wanted to participate in more professional development in the previous 18 months than was possible – about the same as the corresponding TALIS country average (55%). Reasons for non-participation among teachers in Ireland who wished to do so included lack of suitable professional development (45%), conflict with work schedule (43%), and family responsibilities (29%). Fewer teachers reported lack of prerequisites (6%), lack of employer support (14%) and expense (12%) as reasons. The percentages are similar to the corresponding TALIS country average percentages. When asked about the impact of various types of professional development on their development as teachers, activities undertaken by smaller proportions of teachers were reported to have the greatest impact, including qualification programmes (93% of teachers in Ireland who participated in these report a high or moderate impact), individual and collaborative research (87%), courses and workshops (82%) and professional development networks (79%). Areas where the impact is lower include educational conferences and seminars (75%), mentoring and observation (71%), and reading professional literature (71%). Eighty-four percent of teachers in Ireland taught in schools whose principal teachers report that a formal induction programme was in place for all new teachers to the school. The corresponding TALIS country average is 45%. In Ireland, principals indicated that 64% of teachers are in schools with mentoring programmes for all new teachers to the school. This exceeds the TALIS country average of 37%. No information was requested in TALIS on the content or duration of induction or mentoring programmes.
5

Chapter 4: Teachers’ Beliefs about Teaching and Their Pedagogical Practices This chapter describes a number of scales related to teachers’ beliefs about teaching, their teaching practices, their classroom disciplinary climate and their self-efficacy as teachers. These scales are used in more complex multivariate analyses described at the end of the chapter and in chapter 7. Instructional beliefs TALIS sought to describe and compare teachers’ beliefs about the nature of teaching and learning. Teachers were invited to indicate their levels of agreement with statements such as ‘Instruction should be built around problems with clear, correct answers, and around ideas that students can grasp quickly’ and ‘Students learn best by finding solutions to problems on their own’. Arising from such questions, two scales were devised by the OECD: a measure of teachers’ direct transmission beliefs on learning and instruction; and a measure of teachers’ constructivist beliefs about teaching. Figure 4.1 shows adjusted (ipsative) mean scores for these scales. Positive mean scores indicate endorsement of one scale to a greater extent than the others. In Ireland, and in all 5 comparison countries, teachers indicated stronger endorsement for constructivist beliefs about teaching than direct transmission beliefs. Teachers in Ireland were somewhat less supportive of constructivist beliefs, and somewhat more supportive of direct transmission beliefs than their counterparts in all five comparison countries. FIGURE 4.1: ADJUSTED (IPSATIVE) MEAN SCORES FOR DIRECT TRANSMISSION AND CONSTRUCTIVIST BELIEFS ABOUT TEACHING AMONG TEACHERS OF LOWER SECONDARY STUDENTS– IRELAND AND SELECTED COMPARISON COUNTRIES (2007-08)
Source: OECD (2009b), Figure 4.2
-0.30
-0.20
-0.10
0.00
0.10
0.20
0.30
Austria Denmark Belgium(Fl)
Norway Poland Ireland
Ipsa
tive
Mea
n Sc
ore
Direct Transmission Beliefs Constructivist Beliefs
In Ireland, the correlation between constructivist and direct transmission beliefs is 0.21, indicating that as teachers’ scores on one scale increase, they tend to increase on the other. In contrast, the correlation between these scales for Austria is -0.24, indicating that, as support for one set of beliefs increase, support for the other tends to decline (i.e., teachers tend to align themselves more strongly with constructivism than with direct transmission beliefs and vice versa). In general, across TALIS countries, correlations between constructivist and direct transmission beliefs are positive.
6

Instructional Practices TALIS also queried teachers about their instructional practices by asking them to indicate the frequency with which they engaged in such activities as ‘I state learning goals explicitly’, ‘Students work in small groups to come up with a joint solution to a problem or task’, and ‘Students work on projects that require at least one week to complete’. Following factor analysis, three scales, describing different (though not mutually exclusive) sets of teaching practices, emerged:
• structuring practices (e.g., stating learning goals, summarising earlier lessons, homework review, checking exercises books, checking student understanding);
• student-orientated practices (e.g., allowing student co-determination of lesson content, employing ability grouping, giving students individually-adapted tasks); and
• enhanced activities (e.g., assigning projects, debates, essays and the creation of products).
FIGURE 4.2: ADJUSTED (IPSATIVE) MEAN SCORES FOR STRUCTURED PRACTICES, STUDENT-ORIENTATED PRACTICES AND ENHANCED ACTIVITIES AMONG TEACHERS OF LOWER SECONDARY STUDENTS – IRELAND AND SELECTED COMPARISON COUNTRIES (2007-08)
-1.50
-1.00
-0.50
0.00
0.50
1.00
1.50
2.00
Ireland Belgium(Fl)
Austria Poland Norway Denmark
Ipsa
tive
Mea
n Sc
ore
Structuring Practices Student-orientated Practices Enhanced Activities
Source: OECD (2009b), Figure 4.4 Figure 4.2 provides adjusted (ipsative) mean scores on these scales. The data show that, across all comparison countries, teachers show a preference for structured teaching practices. Among comparison countries (and across all TALIS countries), teachers in Ireland indicate a stronger relative preference for such practices, while teachers in Norway and Denmark express the weakest preference. In all comparison countries, student-orientated practices are more prevalent than enhanced activities. Of course, differences across countries in the frequency of these practices may be attributed to system-level influences as well as the requirements of specific subjects. Across TALIS countries, structuring practices are more in evidence in mathematics and science (than other practices), student orientated practices occur more often in practical and vocational subjects and in technology, while enhanced activities are more clearly evident in the humanities (e.g., language, religion) (OECD, 2009b, Figure 4.5).
7

Co-operation Among Teachers Given the emphasis in schools on complex task objectives such as educational quality and school development, TALIS sought to describe the nature of co-operation among teachers in schools. Based on the reported frequency of teachers’ engagement in a range of co-operative activities, two scales were developed:
• exchange and co-ordination for teaching (e.g., exchanging teaching materials with colleagues, discussing the learning development of individual students, ensuring common standards for assessing student progress)
• professional collaboration (e.g., taking part in professional learning activities, engaging in joint activities across different classes and age groups, such as projects, observing other teachers to provide feedback, co-ordinating homework practice across subjects)
Using adjusted (ipsative) mean scores, Figure 4.3 indicates that exchange and coordination for teaching was engaged in relatively more often by teachers across all comparison countries than the more complex professional collaboration. However, there are somewhat larger gaps between the two types of co-operation in Belgium (Fl), Austria and Ireland, indicating a relatively stronger emphasis on exchange of co-ordination for teaching compared with professional collaboration in these countries. FIGURE 4.3: ADJUSTED (IPSATIVE) MEAN SCORES FOR EXCHANGE AND CO-ORDINATION FOR TEACHING AND PROFESSIONAL COLLABORATION AMONG TEACHERS OF LOWER SECONDARY STUDENTS – IRELAND AND SELECTED COMPARISON COUNTRIES (2007-08)
-0.8
-0.6
-0.4
-0.2
0
0.2
0.4
0.6
0.8
Belgium(Fl)
Austria Ireland Norway Denmark Poland
Ipsa
tive
Mea
n Sc
ore
Exchange and Co-ordination for Teaching Professional Collaboration .
Source: OECD (2009b), Figure 4.4 Actual Time Spent Teaching Teachers in TALIS were asked to indicate the proportion of class time (for a specific lesson) that was spent on administrative tasks, keeping order in the classroom (maintaining discipline), and actual teaching and learning. On average across TALIS countries, teachers reported that 79% of class time was spent on teaching and learning (Figure 4.4). The average for teachers in Ireland (81%) was marginally above this, and about the same as in the other comparison countries, except Belgium (Fl) (78%).
8

The percentages of time spent by teachers in Irish classrooms on administrative tasks (7%) and keeping order (11%) are below the corresponding TALIS country averages (8% and 13% respectively). Allocation of time to administrative tasks is marginally lower in Denmark (6%) than in Ireland, while teachers in Austria spend proportionately more time on keeping order (13%) compared with Ireland. FIGURE 4.4: PROPORTIONS OF CLASS TIME SPENT ON ADMINISTRATIVE TASKS, KEEPING ORDER IN THE CLASSROOM AND ACTUAL TEACHING AND LEARNING – IRELAND, COMPARISON COUNTRIES, AND TALIS COUNTRY AVERAGE (2007-08)
Source: OECD (2009b), Figure 4.9
0%10%20%30%40%50%60%70%80%90%
100%
Poland Ireland Denmark Norway Austria Belgium(Fl)
TALISAverage
Perc
ent o
f Cla
ss T
ime
Actual Teaching and Learning Administrative TasksKeeping Order in the Classroom
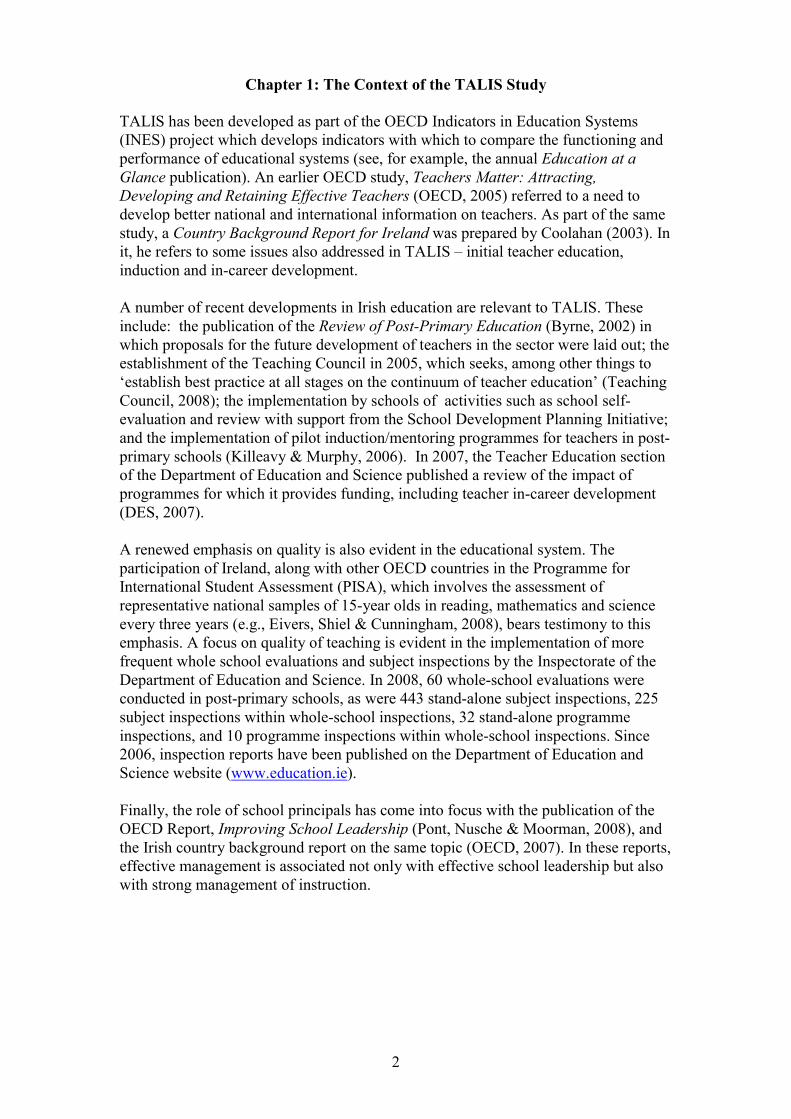
Classroom Disciplinary Climate Teachers in TALIS were asked to indicate their level of agreement with a series of questions linked to disciplinary climate during a specified (target) lesson (the first lower-secondary class they taught after 11.00 a.m. on a Tuesday). The statements included: ‘when the lesson begins, it is necessary to wait quite a long time for students to calm down’ (just 20% of teachers in Ireland agreed or strongly agreed, compared with 29% across TALIS countries); ‘students in this class take care to create a pleasant learning environment’ (68% vs. 72%); ‘quite a lot of time is lost because of students interrupting lessons’ (26% vs. 29%), and ‘there is much noise in this classroom’ (22% vs. 24%). Using responses across all teachers in TALIS, an overall scale for classroom disciplinary climate, with a TALIS country mean of 0.00, and a standard deviation of 1.0, was developed. A high score on the scale represent a good disciplinary climate and vice versa. As shown in Figure 4.5, classroom disciplinary climate is strong in Austria, Ireland and Poland, relative to the TALIS country average, and weak in Denmark and Norway.
9
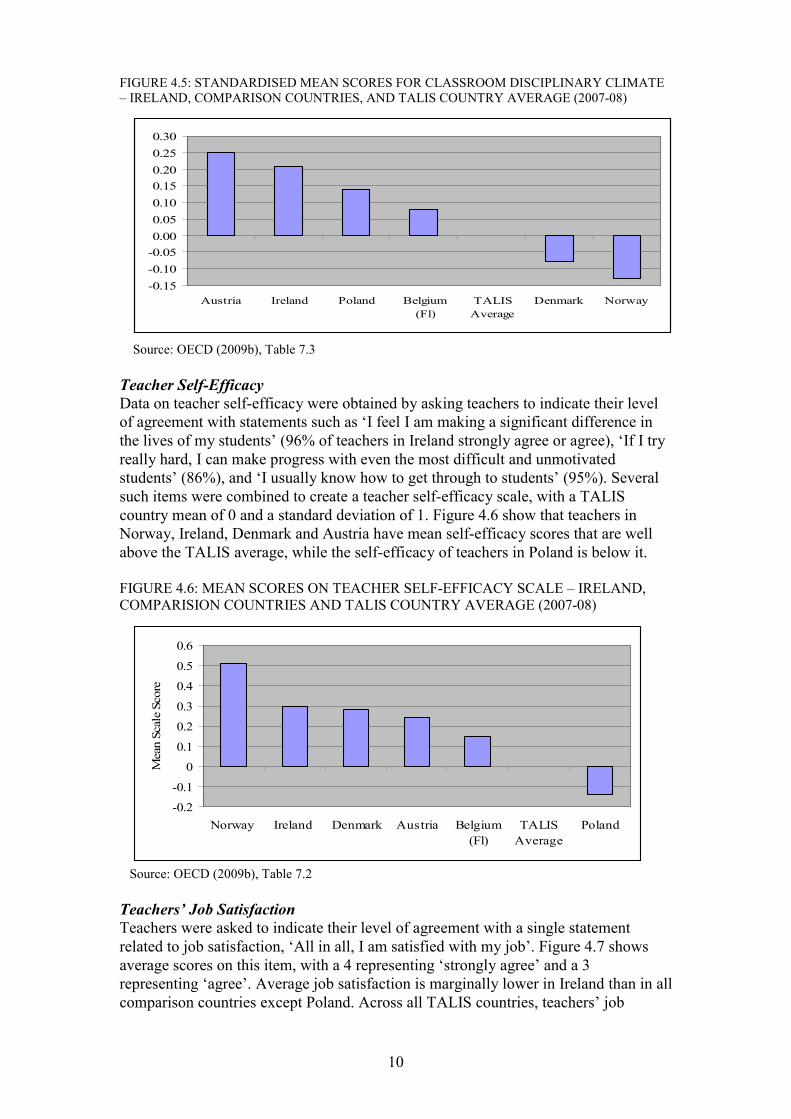
FIGURE 4.5: STANDARDISED MEAN SCORES FOR CLASSROOM DISCIPLINARY CLIMATE – IRELAND, COMPARISON COUNTRIES, AND TALIS COUNTRY AVERAGE (2007-08)
Source: OECD (2009b), Table 7.3
-0.15-0.10-0.050.000.050.100.150.200.250.30
Austria Ireland Poland Belgium(Fl)
TALISAverage
Denmark Norway
Teacher Self-Efficacy Data on teacher self-efficacy were obtained by asking teachers to indicate their level of agreement with statements such as ‘I feel I am making a significant difference in the lives of my students’ (96% of teachers in Ireland strongly agree or agree), ‘If I try really hard, I can make progress with even the most difficult and unmotivated students’ (86%), and ‘I usually know how to get through to students’ (95%). Several such items were combined to create a teacher self-efficacy scale, with a TALIS country mean of 0 and a standard deviation of 1. Figure 4.6 show that teachers in Norway, Ireland, Denmark and Austria have mean self-efficacy scores that are well above the TALIS average, while the self-efficacy of teachers in Poland is below it. FIGURE 4.6: MEAN SCORES ON TEACHER SELF-EFFICACY SCALE – IRELAND, COMPARISION COUNTRIES AND TALIS COUNTRY AVERAGE (2007-08)
Source: OECD (2009b), Table 7.2
-0.2
-0.1
0
0.1
0.2
0.3
0.4
0.5
0.6
Norway Ireland Denmark Austria Belgium(Fl)
TALISAverage
Poland
Mea
n Sc
ale
Scor
e
Teachers’ Job Satisfaction Teachers were asked to indicate their level of agreement with a single statement related to job satisfaction, ‘All in all, I am satisfied with my job’. Figure 4.7 shows average scores on this item, with a 4 representing ‘strongly agree’ and a 3 representing ‘agree’. Average job satisfaction is marginally lower in Ireland than in all comparison countries except Poland. Across all TALIS countries, teachers’ job
10

satisfaction is positively related to classroom disciplinary climate, teacher-student relations and self-efficacy. FIGURE 4.7: MEAN JOB SATISFACTION SCORES OF TEACHERS – IRELAND AND COMPARISION COUNTRIES (2007-08)
Source: OECD (2009b), Figure 4.19
2.95
3.00
3.05
3.10
3.15
3.20
3.25
3.30
3.35
3.40
3.45
Norway Belgium(Fl)
Austria Denmark Ireland Poland
Mea
n Sc
ore
Teacher Student Relations Teachers in TALIS were asked to indicate their agreement with statements such as ‘In this school, teachers and students usually get on well with each other’ and ‘Most teachers in this school are interested in what students have to say’. Responses for four such questions were combined, and a TALIS-wide scale with a mean of 0 and a standard deviation of 1 was established. Figure 4.8 shows that teacher-student relations are stronger in Ireland than on average across TALIS countries, and that, among comparison countries, teachers in Norway reported the strongest relations. FIGURE 4.8: INDEX OF TEACHER STUDENT RELATIONS – IRELAND, COMPARISION COUNTRIES AND TALIS COUNTRY AVERAGE (2007-08)
Source: OECD (2009b), Figure 4.13
-0.50
-0.25
0.00
0.25
0.50
0.75
1.00
1.25
1.50
1.75
Norway Denmark Ireland Austria Belgium(Flemish)
TALISAverage
Poland
Sca
le S
core
11

Associations among Teachers’ Beliefs and Pedagogical Practices Findings described in this section are based on multivariate data analyses (multiple regression) that use teacher (but not school) responses. Key findings across TALIS countries include the following:
• Female teachers are less likely than males to hold direct transmission beliefs about teaching
• Teachers of mathematics/science report hold stronger constructivist beliefs about teaching than teachers of other subject areas, and are more likely to espouse structuring teaching practices; on average, teachers of mathematics/science have lower self-efficacy than teachers of other subjects.
• More experienced teachers report a stronger classroom disciplinary climates than less experienced teachers
In Ireland, the following relationships were observed, after controlling for gender, years of teaching experience, level of education, subject taught in the target class, class size, average ability of the students as estimated by the teacher, and percentage of students in the class speaking a language different from the language of instruction:
• Structuring teaching practices, but not student-orientated practices or enhanced activities are associated to a significant degree with classroom disciplinary climate.
• Attendance at workshops, participation in networks of teachers, involvement in mentoring, but not number of days professional development, are associated with exchange and co-ordination for teaching and professional collaboration.
• Higher teacher self-efficacy, stronger teacher-student relations and positive classroom disciplinary climate are associated with job satisfaction.
• Exchange and co-ordination for teaching, but not professional collaboration, is associated with positive teacher-student relations.
Finally, using a three-level multi-level model, TALIS decomposed the variance in a number of scales into between-country variance, between-school variance, and between-teacher variance. For key scales such as classroom disciplinary climate, teacher self-efficacy, teacher-student relations and time on task, between 70% and 90% of the variance was between teachers. The OECD (2009a) interpreted this as suggesting that efforts to improve teacher functioning in any of these areas would need to be directed at individual teachers rather than at schools or larger organisational units. The outcomes of additional multi-level models focusing specifically on classroom disciplinary climate and teacher self-efficacy are described in chapter 7.
12
Chapter 5: School Evaluation and Teacher Appraisal and Feedback This chapter looks at two related issues – school evaluation and teacher appraisal. It considers the frequency of evaluation and appraisal across countries, factors taken into consideration in evaluating schools and/or appraising teachers, and effects of evaluation and appraisal. Links between school evaluation and teacher appraisal are also considered. School Evaluation Principal teachers in TALIS countries were asked to indicate the frequency with which two types of school evaluation occurred:
• school self-evaluations • external evaluations (excluding single subject evaluations conducted
independently of whole-school evaluations) Table 5.1 shows that 57% of teachers in Ireland worked in schools in which no self-evaluation had been conducted in the previous 5 years. This compares with 20% on average across TALIS countries. Just 10% of teachers in Poland worked in schools in which no self-evaluations had taken place, while 76% worked in schools in which more than one such evaluation had occurred. TABLE 5.1: PERCENAGES OF TEACHERS IN SCHOOLS IN WHICH SCHOOL SELF-EVALUATIONS AND EXTERNAL SCHOOL EVALUATIONS HAVE OCCURRED WITH VARYING LEVELS OF FREQUENCY IN PREVIOUS 5 YEARS – IRELAND, COMPARISON COUNTRIES, AND TALIS COUNTRY AVERAGE (2007-08)
School Self-evaluations External Evaluations of School
Never Once More than Once
Never Once More than Once
Austria 41.7 28.2 30.1 58.3 22.9 18.8 Belgium (Flemish) 22.0 33.4 44.6 10.4 54.6 35.1 Denmark 32.4 15.1 52.5 53.0 22.4 24.5 Ireland 56.5 25.2 18.3 56.9 36.5 6.6 Norway 25.5 14.3 60.2 35.6 34.9 29.5 Poland 10.4 13.8 75.9 13.6 51.5 34.8 TALIS Average 20.2 16.2 63.6 30.4 30.8 38.9 Source: OECD (2009b), Table 5.1 Table 5.1 shows that external schools evaluations occur less frequently across countries than school self-evaluations. In Austria, Denmark and Ireland, more than half of teachers worked in schools in which no external evaluation had taken place. On the other hand, over one-third of teachers in Belgium (Fl) and Poland worked in schools in which such evaluations had taken place more than once. Principal teachers of schools that had participated in self-evaluations or external (whole-school) evaluations were asked to indicate the relative importance of each of several criteria in such evaluations. In Ireland, the following criteria were those to which ‘high’ or ‘moderate’ importance was attributed most often (percentages of teachers in brackets): teaching students with special learning needs (97.6%); relations between teachers and students (94.5%); professional development undertaken by teachers (93.2%); and teachers’ knowledge and understanding of instructional practices in their main field (91.6%). Criteria to which principals attributed these levels of importance less frequently were: feedback from parents (76.1%); teaching in a multi-cultural setting (62.9%); and student feedback on the teaching they receive
13

(55.7%). In Ireland, 64.9% of teachers taught in schools whose principals indicated that the results of school evaluations were published. This may be regarded as high because whole school evaluations were not published prior to 2006. Aspects of school life on which the outcomes of school evaluations had a ‘high’ or ‘moderate’ level of influence in Ireland (percentages of teachers in brackets) were: performance feedback to the school (87.0%); performance appraisal of school management (86.1%); and assistance provided to teachers to improve teaching skills (74.0%). Areas on which whole school evaluations had small impact were: level of school budget or its distribution within school (36.7%) and teacher remuneration and bonuses (1.2%). For teacher remuneration and bonuses, only Poland (40.7%) among comparison countries had an impact level (‘high’ or ‘moderate’) above 5%. Teacher Appraisal and Feedback TALIS defines teacher appraisal as a review of a teacher’s work by the principal, an external inspector or by his or her colleagues and states that an appraisal can be conducted in a range of ways from a more formal, objective approach (e.g. as part of a formal performance management system, involving set procedures and criteria) to a more informal, more subjective approach (e.g. through informal discussions between the teacher and the evaluator). In Ireland, 44% - the highest percentage among comparison countries – reported that they had not received an appraisal of their teaching and/or feedback on it from the principal teacher in their current school, while 42% reported receiving appraisal/ feedback at least once a year (Table 5.2). Similarly, more teachers in Ireland (52%) than in any of the comparison countries reported that they never received appraisal/feedback from other teachers or members of school management team in the school in which they taught. TABLE 5.2: FREQUENCY OF APPRAISAL/FEEDBACK ON TEACHING FROM SCHOOL PRINCIPAL AND FROM OTHER TEACHERS/MEMBERS OF THE SCHOOL MANAGEMENT TEAM (PERCENTAGES OF TEACHERS) – IRELAND, COMPARISON COUNTRIES, AND TALIS COUNTRY AVERAGE (2007-08)
Appraisal/feedback from Principal
Appraisal/feedback from Other Teachers/ School Management
Never Once every two years
or less
Once a year or more
Never
Once every two years
or less
Once a year or more
Austria 18.0 29.0 52.9 34.8 14.4 50.8 Belgium (Fl) 19.1 34.0 46.9 41.9 13.5 44.6 Denmark 14.2 18.1 67.7 21.3 8.6 70.1 Ireland 43.3 14.5 42.2 52.3 9.5 38.1 Norway 26.2 18.2 55.6 28.1 13.1 58.8 Poland 9.6 31.5 58.9 30.0 17.0 53.0 TALIS Average 22.0 13.7 64.2 28.6 9.5 61.8 Source: OECD (2009b), Table 5.3 In Ireland, and on average across TALIS countries, just over one half of teachers reported that their work had been appraised, and/or that they had received feedback on it, by/from an external individual (e.g., an inspector) or body in their current school (Table 5.3).
14

TABLE 5.3: FREQUENCY OF APPRAISAL/FEEDBACK ON TEACHING FROM EXTERNAL INDIVIDUAL OR BODY (PERCENTAGES OF TEACHERS) – IRELAND, COMPARISON COUNTRIES, AND TALIS COUNTRY AVERAGE (2007-08)
Appraisal/feedback from External Individual or Body
Never Once every two years or less
Once a year or more
Austria 42.5 39.8 17.7 Belgium (Fl) 39.9 48.8 11.3 Denmark 69.7 11.0 19.2 Ireland 53.0 37.2 9.8 Norway 77.8 13.1 9.1 Poland 60.5 32.6 6.9 TALIS Average 50.7 24.5 24.8
Source: OECD (2009b), Table 5.3 According to teachers in Ireland, the criteria considered most important in teacher appraisal and/or feedback include relations with students (86.1%)2, classroom management (84.7%), teacher knowledge and understanding of their main subject field(s) (82.4%), teacher knowledge and understanding of instructional practices in their main subject field (80.1%), student discipline and behaviour (79.9%), and student test scores (72%). Aspects not considered as important include professional development undertaken (58.0%), teaching students with special needs (56.4%) and teaching in a multi-cultural setting (40.1%) (though the relatively low importance attributed to teaching children with special needs and teaching in a multi-cultural setting may reflect differences in the student composition of classes taught by teachers in TALIS). The criteria reported by teachers in Ireland are broadly in line with those of the comparison countries, though student test scores tend to be emphasised to a lesser extent in teacher appraisals in Austria (45.2%), Belgium (Fl) (53.2%) and Norway (47.3%) than in Ireland. What are the effects of appraisal and feedback on teachers’ working conditions? In Ireland, just 1.4% of teachers reported that appraisal and feedback had led to a ‘moderate’ or ‘large’ extent to a financial bonus, 3.5% that they resulted in a change in salary, 13.4% that they resulted in opportunities for professional development activities, and 23.2% that they resulted in public recognition from the principal teacher or colleagues (OECD, 2009b, Table 5.5). Appraisal and feedback also had limited impact in these areas in four of the five comparisons countries, with impacts somewhat greater in Poland than elsewhere. What about effects of appraisal and feedback on aspects of teaching? Teachers in Ireland reported that appraisal and feedback had a moderate or large impact on teaching students in a multi-cultural setting (12% of teachers), teaching students with special learning needs (19%), handling of student discipline and behaviour problems (23%), and improving student test scores (27%). The impact on most of these areas was similar in four of the five comparison countries (Poland was the exception), and greater than on average across TALIS countries. Most teachers in Ireland (87.9%) and on average across TALIS countries (82.9%) reported that the appraisal and feedback they received had been fair, and that it was helpful in their development as teachers (Ireland, 78.8%, TALIS average, 78.6%). 2 Percentages in the remainder of this chapter refer to teachers whose teaching had been appraised and/or who had received feedback.
15

However, only a minority of teachers in a number of countries including Norway (28.2%), Ireland (40.3%) and Austria (41.4%) agreed that the appraisal/feedback they received contained suggestions for improving aspects of their work as teachers. Just over one half (50.2%) of teachers in Ireland reported either a ‘large’ or a ‘small’ increase in job satisfaction as a consequence of the appraisals/feedback they had received, while just one sixth (16.4%) reported a large or small increase in job security – percentages that are broadly in line with those for four of the five comparison countries. In the fifth, Poland, 58.9% of teachers reported an increase in job satisfaction while 41.0% reported an increase in job security. Finally, teachers (including those whose work had never been appraised) were asked to indicate their levels of agreement with a series of statements related to teacher appraisal and feedback more generally. In Ireland, 60% of teachers ‘strongly agreed’ or ‘agreed’ that the review of teachers’ work had little impact on the way teachers teach in the classroom, while 59% indicated similar levels of agreement with the view that, in their school, sustained poor performance of a teacher would be tolerated by the rest of the staff. On the other hand, 10% or fewer of teachers strongly agreed or agreed with the view that ‘If I improve the quality of my teaching, I will receive increased monetary or non-monetary rewards’. While the general pattern of responses across comparison countries was similar to Ireland, almost twice as many teachers in Poland (75%) indicated agreement with the statement, ‘in this school, the principal uses effective methods to determine whether teachers are performing well or badly’ compared with Ireland (39%).
16

Chapter 6: School Leadership and Management Styles
This chapter describes the management styles of school principals, and examines associations between principals’ management styles and aspects of teachers’ activities. Management Behaviours Based on a series of 25 questions about school management, TALIS identified 5 management scales, as follows:
• Framing and communicating the school’s goals and curricular development: Principals scoring high on this scale indicate frequent engagement with activities implied by statements such as: ‘I ensure that teachers work according to the school’s educational goals’, ‘I take examination results into account in decisions regarding curriculum development’ and ‘I ensure that there is clarity concerning responsibility for co-ordinating the curriculum.’
• Instructional improvement and professional development: Principals scoring high on this scale say they often engage in the following: ‘When a teacher has problems in his/her classroom, I take the initiative to discuss matters’, ‘I inform teachers about possibilities for updating their knowledge and skills’, and ‘I pay attention to disruptive behaviour in classrooms’.
• Direct Supervision of Instruction in the School – High scorers report that they often do the following: ‘I observe instruction in classrooms’, ‘I give teachers suggestions on how they can improve their teaching’, and ‘I monitor the work of individual students’.
• Accountability-based Management – High scorers on this scale see their job as making the school accountable internally and externally. Principals agreed or strongly agreed with statements such as: ‘An important part of my job is to ensure that instructional approaches sanctioned by the ministry are explained to new teachers, and that more experienced teachers are using these approaches’, ‘An important part of my job is to ensure that teachers are held accountable for attaining the goals of the school’, and ‘An important part of my job is to present new ideas to the parents in a convincing way’.
• Bureaucratic Management – Principals scoring high on this scale ensure that everyone in the school follows official rules. They report that: ‘An important part of my job is to resolve problems with the timetable and/or lesson planning’, ‘An important part of my job is to create an orderly atmosphere in the school’, and ‘I promote a task-orientated atmosphere in this school’.
The five scales are not fully comparable across countries (OECD, 2009b). Nevertheless, it is valid to relate mean scores to the corresponding TALIS country averages. Scales on which the mean scores for Ireland are below the TALIS average are Instructional Management and Direct Supervision of Instruction (Table 6.1), indicating that teachers in Ireland are more likely to work in schools where the principal tends not to emphasise these aspects to the same extent as, for example, in Poland. On the other hand, mean scores for Ireland are significantly higher than the TALIS average for ‘Management – School Goals’, and ‘Accountability Management’. Ireland is not significantly different from the TALIS average on Bureaucratic Management. None of the five comparison countries exactly matches the profile of responses for Ireland
17

TABLE 6.1: COMPARISON OF COUNTRY AVERAGE SCORES ON FIVE MANAGEMENT SCALES WITH THE CORRESPONDING TALIS COUNTRY AVERAGE SCORES – IRELAND AND COMPARISION COUNTRIES (2007-08)
Country Management – School Goals
Instructional Management
Direct Supervision of
Instruction
Accountability Management
Bureaucratic Management
Austria – + – 0 0 Belgium (Fl) – – – – – Denmark – + – – – Ireland + – – + 0 Norway – 0 – + + Poland + + + – – +: above TALIS country average; 0: not significantly different from TALIS country average; and –: significantly below TALIS country average. Source: OECD (2009b), Table 6.2 Leadership Styles Using factor analysis, the five scales were combined by the OECD to form two management scales – instructional leadership (based on the first three scales) and administrative leadership (based on the last two). The leadership style scales are not intended to be mutually exclusive, in that principal teachers could exhibit aspects of the behaviours associated with both. As in Chapter 4, ipsitative scores are reported (Figure 6.1). In Ireland, principals indicate a stronger engagement in administrative leadership than in instructional leadership, a pattern that is also observed in Norway and Austria. In contrast, principal teachers in Poland tend to prioritise instructional leadership over administrative leadership. In Denmark, principals report that they rarely engage in administrative leadership at all. It is argued in the literature (e.g., Pont, Nusche & Moorman, 2008) that an instructional leadership style is more strongly associated with effective school management. Principals in Poland and Denmark seem to operate more often on this basis than principals in Ireland, Norway and Austria. FIGURE 6.1: COUNTRY MEAN SCORES ON INSTRUCTIONAL AND ADMINISTRATIVE LEADERSHIP SCALES – IRELAND, COMPARISION COUNTRIES AND TALIS AVERAGES (2007-08)
-2
-1.5
-1
-0.5
0
0.5
1
1.5
Poland TALISAvg.
Denmark Norway Belgium(Fl)
Ireland Austria
Mea
n Sc
ore
Instructional Leadership Administrative Leadership
Source: OECD (2009b), Table 6.3
18

Associations between Leadership Styles and Other Activities TALIS used multi-level regression analysis to examine associations between the management styles of principals and aspects of teachers’ work. The findings include the following:
• In several TALIS countries, including Belgium (Fl) but not Ireland, principals who hold constructivist views about teaching are more likely to demonstrate an instructional leadership style
• Similarly, in seven countries, including Austria and Norway but not Ireland, principals who have a more pronounced instructional leadership style work in schools where school self-evaluations are frequent
• In almost one-half of TALIS countries, including Ireland (but none of the comparison countries), a principal’s use of a more pronounced instructional leadership style is associated with teacher appraisals that take into account the professional development undertaken by teachers.
• In seven TALIS countries including Austria and Ireland, use of an instructional leadership style is associated with use of retention and pass rates of students as a criterion in school evaluations.
19

Chapter 7: Key Factors in Developing Effective Learning Environments In order to better understand relationships between a range of teacher characteristics, beliefs and practices, and aspects of classroom learning environments, a series of multi-level models were run on two dependent variables described in Chapter 4, which may be taken as indicators of learning environments – classroom disciplinary climate and teacher self-efficacy. Seven blocks of independent variables were identified:
1. Socioeconomic background (e.g., Teacher level: ability of students in class relative to average at same grade level, % of students in reference class speaking language of instruction; School level: % of students in school speaking language other than language of instruction)
2. Teacher characteristics (e.g., gender, employed on full-time vs. temporary contract; education)
3. Teacher professional development (e.g., number of days of professional development completed; school providing induction process for teachers)
4. Teacher beliefs and practices (e.g., indices of teacher-student relations, structuring, student orientated practices, enhanced activities, professional co-operation)
5. Teacher appraisal and feedback (e.g., frequency of appraisal or feedback from any source; appraisal impact: opportunities for professional development)
6. School leadership (e.g., index of promoting instructional improvement and professional development)
7. School autonomy and resources (e.g., index of school climate: student delinquency; index of school resources: shortage of materials; index of shortage of personnel).
Separate multi-level models were developed for classroom disciplinary climate and teacher self-efficacy for each TALIS country. First, the socioeconomic block of variables was entered in each model. Then the remaining blocks were each entered separately, and significant variables were identified. The final models include only those variables that are statistically significant after controlling for other relevant (and significant) variables from the other blocks.
Factors Associated with Classroom Disciplinary Climate and Self-Efficacy Across Comparison Countries Although the final models for the five comparison countries (Austria, Belgium (Fl), Denmark, Norway, Poland) and for Ireland for classroom disciplinary climate and teacher self-efficacy differ from one another in a number of ways, there are some commonalities. Table 7.1 summarises the variables that are significantly associated with classroom disciplinary climate; for each variable, there is an indication of whether its relationship with classroom climate is positive or negative. Table 7.1 shows that, in all or almost all countries, more years teaching, positive student teacher relations and high average student ability are positively associated with classroom disciplinary climate, while high levels of parental education are associated with positive classroom disciplinary climate. Conversely, low student achievement is associated with poor classroom disciplinary climate in all countries compared.
20

Constructivist beliefs about teaching are positively associated with classroom disciplinary climate in one country (Poland), while direct transmission beliefs are negatively associated with disciplinary climate in three. In Belgium (Fl) and in Ireland, lower levels of teacher education (a diploma, but not a degree) are negatively associated with classroom disciplinary climate. However, whereas in Belgium (Fl), 84% of teachers hold a diploma but not a degree, in Ireland, just 4% do so. TABLE 7.1: MAIN VARIABLES IN FINAL MULTIVARIATE MODELS OF CLASSROOM DISCIPLINARY CLIMATE – IRELAND AND COMPARISION COUNTRIES (2007-08)
Variables Associated with Classroom Disciplinary Climate in ‘Final Model’.
Aus
tria
Bel
gium
(Fl)
Den
mar
k
Irel
and
Nor
way
Pola
nd
Teacher Variables: Female + + Number of years teaching + + + + + Teacher employed full time + + Teacher contract status permanent + + + + High average student ability + + + + + + Low average student ability – – – – – – Percent of students in class with at least one parent with ISCED 5 (degree) or higher
+ + + + +
Index of teacher-student relations + + + + + + Teacher education (1=ISECD 5B or below; 2=ISCED 5A or higher) – – Index of constructivist beliefs + Index of direct transmission beliefs – – – Index of teaching practices – structuring + + + Index of teaching practices – student-orientated + + Index of teaching practices – enhanced activities – – School Variables Index of school autonomy in hiring teachers and determining salary – + Index of school resources: shortage of materials – + School average class size – – – – – Public school – +: positive relationship with classroom disciplinary climate; –: negative relationship with classroom disciplinary climate. Source: OECD (2007b), Tables 7.4 to 7.9a In general, school-level variables (which typically measure aspects of socioeconomic status) are negatively associated with classroom disciplinary climate, though there are few discernible patterns across countries. In Ireland, classroom disciplinary climate is poorer in publicly managed schools, compared to those that are privately managed. In Ireland, and in four other countries, school-level average class size is negatively associated with classroom disciplinary climate, indicating a less-favourable climate where average class sizes are larger. Table 7.2 shows the variables that are significantly associated with teacher self-efficacy (again after controlling for other relevant variables). Among the teacher-level variables that are positively associated with teacher self-efficacy in five or six countries are good teacher-student relations, high average student ability, constructivist beliefs about teaching, and direct transmission beliefs about teaching. Hence, it seems that teachers holding either or both of these beliefs can have high self-efficacy. In four countries, including Ireland, teachers who receive public recognition from principal or colleagues in relation to effective teaching have higher
21

self-efficacy than those who do not. In four comparison countries, but not in Ireland, teachers who report engaging in professional collaboration with colleagues have higher self-efficacy. Whereas in Ireland, teaching in a publicly-managed school is associated with lower teacher self-efficacy, in Norway, the opposite is the case, though just 3% of teachers in that country teach in privately-managed schools, compared with 55% in Ireland. TABLE 7.2: MAIN VARIABLES IN FINAL MULTIVARIATE MODELS OF TEACHER SELF-EFFICACY – IRELAND AND COMPARISION COUNTRIES
Variables Associated with Teacher Self-Efficacy in ‘Final Model’.
Aus
tria
Bel
gium
(Fl)
Den
mar
k
Irel
and
Nor
way
Pola
nd
Teacher Variables: Teacher contract status permanent + + + Teacher employed full time + + + Teacher education (1=ISECD 5B or below; 2=ISCED 5A or higher) – + Index of teacher-student relations + + + + + + High average student ability + + + + + Low average student ability – – – – Percent of students in class with at least one parent with ISCED 5 (degree) or higher
+
Appraisal impact: public recognition from principal/colleagues + + + + Index of constructivist beliefs + + + + + Index of direct transmission beliefs + + + + + + Index of teaching practices – structuring + + + + – Index of teaching practices – student-orientated + Index of teaching practices – enhanced activities - + + Index of exchange and co-ordination for teaching Number of days of professional development + + + + Index of professional collaboration + + + + School Variables: Public school – + +: positive relationship with teacher self-efficacy; –: negative relationship with teacher self-efficacy Source: OECD (2007b), Tables 7.4 to 7.9a It is of particular interest that school level appraisal and feedback are not related to either classroom disciplinary climate or teacher self-efficacy, once other relevant variables are taken into account.
22

8: Summary of Main Findings In this chapter (as in earlier chapters), reference is made to outcomes for Ireland and for five comparison countries. These countries are: Austria, Belgium (Fl.), Denmark, Norway and Poland. The key findings are abstracted from earlier chapters in this report. Background on Teachers and Schools:
• Sixty-nine percent of teachers teaching in lower secondary schools (First to Third years) in Ireland are female. This is almost the same as the TALIS country average (69%), but greater than in Denmark (58%) and Norway (60%).
• Thirty-five percent of lower-secondary teachers in Ireland have 20 or more years of experience, about the same as the TALIS country average. However, there are fewer permanently employed teachers (73%) in Ireland than the TALIS country average (85%).
• The ratio of teachers to pedagogical support persons in Ireland (15.8) is greater (less favourable) than the corresponding TALIS country average, as is the ratio of teachers to administrative or management personnel (11.1). Both ratios are more favourable in Denmark, Norway and Poland than in Ireland.
• Eighty-three percent of teachers in Ireland (the highest among TALIS countries) teach in schools whose principal teachers reported that a shortage of laboratory technicians hindered instruction at least to some extent.
Professional Development of Teachers
• Ninety percent of teachers in Ireland participated in some form of professional development in the 18 months prior to the TALIS survey – about the same as the TALIS country average. However, on average, teachers in Ireland attended fewer days of professional development (6 days) than the TALIS country average (15 days). Forty-one percent of professional development days for Irish teachers were compulsory – fewer than the TALIS average (51%), but more than in Austria, Belgium (Fl), Denmark or Poland.
• The most common form of professional development for teachers in Ireland is attendance at courses and workshops. Relative to the corresponding TALIS country averages, fewer teachers in Ireland participate in mentoring and peer observation, qualification programmes or observation visits to schools.
• Teachers in Ireland identified pressing professional development needs in the areas of ICT skills (34%), teaching students with special learning needs (38%), teaching in a multi-cultural setting (24%), and student counselling (25%).
• The types of professional development which teachers in Ireland reported as having the highest levels of impact on their work are qualification programmes, individual and collaborative research, and courses and workshops.
Teachers’ Beliefs about Teaching and Their Pedagogical Practices • Teachers in Ireland tend to support constructivist beliefs about teaching (e.g.,
they view their role as facilitator of active learning by students) to a lesser extent than teachers in Austria, Denmark, Belgium (Fl), Norway and Poland. Conversely, teachers in Ireland hold stronger direct transmission beliefs (e.g., they see their role as transmitting knowledge, and providing correct solutions) than teachers in these countries.
23

• Teachers in Ireland report favouring structuring teaching practices (e.g., stating learning goals, homework review, checking student understanding) more than teachers on average across TALIS countries, and report less support for student-orientated practices (e.g., allowing student co-determination of lesson content, giving students individually-adapted lessons) or enhanced activities (e.g., assigning projects or debates, asking students to create products). Across TALIS countries, teachers generally favour structuring teaching practices, with teachers of mathematics more supportive of such practices on average than teachers of other subjects.
• Along with their colleagues in Belgium (Fl.) and Austria, teachers in Ireland are more likely to report engaging in basic co-operative activities (called exchange and co-ordination for teaching) and less likely to report engaging in more higher-level co-operation (called professional collaboration), even though the latter is associated with more effective teaching.
• Teachers in Ireland report spending 81% of class time on actual teaching – marginally more than the TALIS country average of 79%. In Ireland, 7% of lesson time is spent on administrative tasks and 11% on disciplinary matters.
• Relative to other TALIS countries, including comparison countries Denmark and Norway, the classroom disciplinary climate in classrooms in Ireland is strong. Indeed, among comparison countries, only Austria reports stronger disciplinary climate.
• Levels of teacher self-efficacy (confidence in teaching) are stronger in Ireland than on average across TALIS countries. Among comparison countries, only teachers in Norway report stronger self-efficacy.
• In Ireland, after controlling for teacher demographic factors such as gender and experience, structuring teaching practices, but not student-orientated practices or enhanced activities, are positively associated with classroom disciplinary climate.
• Also, in Ireland, attendance at workshops, participation in networks of teachers, and involvement in mentoring, but not number of day of professional development attended, are associated with both exchange and co-ordination for teaching and professional collaboration.
School Evaluation and Teacher Appraisal and Feedback
• Forty-four percent of teachers in Ireland work in schools in which a self-evaluation had taken place in the five years prior to the TALIS survey. This compares with 80% on average across TALIS countries, and 90% in Poland.
• Forty-three percent of teachers in Ireland work in schools in which an external school evaluation had taken place in the five years prior to the TALIS survey. Though below the TALIS country average of 70%, the figure for Ireland is about the same as for Austria and Denmark. It should be noted that TALIS did not ask about subject evaluations. As indicated earlier, 443 stand-alone subject inspections and 225 subject inspections within whole-school evaluations were conducted by the Inspectorate in Irish post-primary schools in 2008.
• In Ireland, the criteria that principal teachers indicated are allocated most importance in school evaluations (self-evaluations and external evaluations combined) are teaching students with special learning needs, relations between teachers and students, professional development undertaken by teachers, and teachers’ knowledge and understanding of instructional practices in their main field. Criteria to which less importance is attributed include student feedback
24
on the teaching they receive, teaching in a multi-cultural setting (which may not have the same relevance in all schools), and feedback from parents.
• According to school principals in Ireland, school evaluations had most impact on performance feedback to the school, performance appraisal of school management, and assistance provided to teachers to improve skills. School evaluations are considered to have a moderate effect on the level of the school budget and/or its distribution within the school, and no little or no impact on teacher remuneration or bonuses.
• In Ireland, 43% of teachers report that they had never received an appraisal of their teaching and/or feedback on it from the principal teacher in their current school. The corresponding TALIS country average is 22%. Similarly, 52% of teachers in Ireland reported that they had never received an appraisal and/or feedback from other teachers or school management (TALIS average = 29%). On the other hand, 42% of teachers in Ireland reported receiving appraisal/feedback from the school principal at least once a year, and 38% reported receiving appraisal/feedback from other teachers or school management with the same frequency.
• Fewer teachers in Ireland (53%) than in Denmark (70%) or Norway (78%) report that their work had never been appraised by an external individual or body (e.g., an inspector). The corresponding TALIS country average is 51%.
• Teachers in Ireland indicate that the criteria to which most importance is attributed during appraisal/feedback are relations with students, classroom management, teacher knowledge and understanding of main subject field, student discipline and behaviour, and student test scores. Less attention is paid to professional development undertaken, teaching students with special needs and teaching in a multi-cultural setting, though again, these aspects may not be equally relevant in all classrooms. Among comparison countries, student test scores are less important in teacher appraisals in Austria, Belgium (Fl.), and Norway than in Ireland.
• Most teachers in Ireland (88%) and on average across TALIS countries (83%) report that the appraisal and feedback they receive is fair, while 79% of teachers in Ireland and across TALIS countries report that appraisal and feedback has been helpful in their development as teachers However, only a minority of teachers in a number of countries including Norway (28%), Ireland (40%) and Austria (41%) agree that the appraisal/feedback they receive contains suggestions for improving aspects of their work as teachers.
School Leadership and Management Styles
• In Ireland, principal teachers indicate a stronger engagement in administrative leadership than in instructional leadership, even though instructional leadership has been more strongly associated with effective school management in the literature. Principal teachers in Norway and Austria also espouse an administrative leadership style, while principal teachers in Poland focus more strongly on instructional leadership.
• In almost one-half of TALIS countries, including Ireland (but in none of the comparison countries), a principal’s use of a more pronounced instructional leadership style is associated with teacher appraisals that take into account the professional development undertaken by teachers.
• In seven TALIS countries including Austria and Ireland, use of an instructional leadership style is associated with use of retention and pass rates of students as a criterion in school evaluations.
25

Key Factors in Developing Effective Learning Environments
• Two key aspects of effective learning environments were identified by TALIS – classroom disciplinary climate and teacher self-efficacy. Multi-level models that included a range of teacher- and school-level factors were developed for each country for both classroom disciplinary climate and teacher self-efficacy. The summary statements below relate to net effects (i.e., after controlling for teacher demographic and other relevant factors).
• Higher levels of student ability are associated with higher levels of classroom disciplinary climate and teacher self-efficacy in Ireland and in all comparison countries, while, conversely, lower levels of student ability are associated with lower levels of disciplinary climate and self-efficacy in Ireland and in four comparison countries.
• In Denmark and Ireland, teaching in a publicly-managed school is associated with lower levels of classroom disciplinary climate, while in Ireland, teaching in a publicly-managed school is also associated with lower teacher self-efficacy.
• Teachers reporting stronger teacher-student relations in Ireland and in all 5 comparison countries also report stronger levels of classroom disciplinary climate and higher self-efficacy.
• In Ireland and in four comparison countries, holding constructivist beliefs about teaching is associated with stronger teacher self-efficacy. The relationship between holding constructivist views and classroom disciplinary climate is weaker across countries and is not significant in Ireland.
• In three comparison countries and in Ireland, teachers who receive public recognition from the principal or colleagues in relation to effective teaching have higher self-efficacy than those who do not.
• In Ireland, and in four comparison countries, school-level average class size is negatively associated with classroom disciplinary climate, indicating a less-favourable climate where average class sizes are larger. School-level average class size is not significantly related to teacher self-efficacy.
26

References
Byrne, K. (2002). Report of the Advisory Group on Post-primary Education. Dublin: Dept. of Education and Science.
Coolahan, J. (2003). Attracting, developing and retaining effective teachers: Country
background report for Ireland. Dublin: Department of Education and Science. Department of Education and Science. Inspectorate. (2006). A guide to whole-school
evaluation in post-primary schools. Dublin: Author. Accessed at http://www.education.ie/servlet/blobservlet/insp_wse_pprimary_guide.pdf
Department of Education and Science. Teacher Education Section. (2007). A value for
money assessment of programmes managed by the teacher education section. Dublin: Author.
Eivers, E., Shiel, G., & Cunningham, R. (2008). Ready for tomorrow’s world. The
competencies of Ireland’s 15-year-olds in PISA 2006. Dublin: Educational Research Centre.
Killeavy, & Murphy, R. (2006). The national pilot project on teacher induction: Final
report. Dublin: Stationery Office. OECD. (Organisation for Economic Co-operation and Development). (2005).
Teaching matters: Attracting, developing and retaining effective teachers. Paris: Author.
OECD. (2007). Improving school leadership. Background report: Ireland. Paris:
Author. OECD. (2009a). Creating effective teaching and learning environments: First results
from TALIS. Executive summary. Paris: Author. OECD. (2009b). Creating effective teaching and learning environments: First results
from TALIS. Main report. Paris: Author. Pont, B., Nusche, D., & Moorman, H. (2008). Improving school leadership. Vol 1:
Policy. Paris: OECD. Teaching Council. (2008). Fás agus forbairt: Strategic plan 2008-2011. Maynooth:
Author.
27