Embed Size (px)
Citation preview

NutriNET 2012
Proceedings of International Animal Nutiriton PhD Students Conference
The conference is organized in the framework of the project number
CZ.1.07/2.3.00/20.0005
November 21- 22, 2012 Brno

Reviewers: Prof. Ing. Jiří Zelenka, CSc.
Mgr. Ing. Ludmila Křížová, Ph.D.
The conference is organized in the framework of the project number
CZ.1.07/2.3.00/20.0005
ISBN 978-80-7375-667-3

3
CONTENTS
Effect of the preservative inoculants on silage Fermentation process of Dactylis Glomerata
Alba Mejía J. E. - Skládanka J. - Mlejnková V. ......................................... 7
The effect of inorganic and organic form of zinc on levels of macro minerals and trace elements in blood of dairy cows
Balabánová, M. ─ Hošková, Š. ─ Zeman, L. ........................................... 15
What is the effect of high ambient temperature on the growth parameters and utilization of nitrogen in growing pigs?
Brestenský, M. – Nitrayová, S. - Patráš , P. - Heger, J. ............................ 25
Shortened dry period of 35 days in dairy cows
Čermáková J. - Doležal P. - Kudrna V. .................................................... 33
The effect of the age and the type of the liquid feed on the HE SGLT1 mRNA expression in the jejunum of neonatal calves
Flaga J. - Górka P. - Barteczko A. - Kowalski, Z.M. ............................... 43
Nutrition of high-pregnant heifers and cows and its influence on the content of total proteins in the serum of calves
Frӧhdeová, M. – Mlejnková, V. – Lukešová, K. – Doležal, P ................ 47
Plants extract with anti-hyperuricemic activity in rats
Frublingová, L. – Havlík, J. – Doskočil, I. – Plachý, V. – Staňková, L ... 55
Comparsion energy prediction of silage using detergent fractions of fiber or detergent fiber digestibility
Hlaváčová, A., Plachý, V., Kodeš, A., Mudřík, Z . .................................. 63
The effect of organic chromium source on the quality ejaculate with boars
Horký, P. - Zeman, L ............................................................................... 71
Effect of corn conservation technique on phosphorus digestibility in growing pigs
Humer, E. - Schedle, K. ............................................................................ 83
The difference in the chemical composition of breast and thigh muscle of chukar partridge (Alectoris chukar)
Jůzl, R. – Rusníková, L. – Suchý, P. – Straková, E. ................................. 91

4
Carcass characteristics of fattened pheasant males and females at the age of 118 days
Karásková, K., Straková, E., Suchý, P., Jámbor, M ................................. 99
Analysis of selected markers of energy metabolism in dairy cows in the peripartal period
Krempanský, M. –Maskaľová, I. –Bujňák, L. –Vajda, V. ...................... 107
Silages of red clover – the effect of different preparations for the quality parameters in 1st and 2nd cut
Kubát, V. – Petrášková, E. – Jančík, F. – Čermák, B. – Hnisová, J. – Homolka, P. – Lád, F ............................................................................. 115
Effect of the addition of taurines on the antioxidant activity and SOD
Lukešová, K., Krobot, R., Mlejnková, V., Frӧhdeová, M., Zeman, L ... 123
Effect of the Feed AdditIve Clinoptilolite on Blood plasma Parameter of Laying Hens
Macháček, M.- Suchý, P.- Straková E. ................................................... 131
Effect of Evening Primrose Oil on Biochemical Parameters of Thoroughbred Horses under Maximal Training Conditions
Mikešová, K. - Härtlová, H. - Zita, L. - Hučko, B. – Mareček, E. ........... 137
The study of factors influencing the microbial microflora of silages Mlejnková, V. – Fröhdeová, M. – Přichystalová, J. – Lukešová - K. – Kalhotka, L. – Doležal, P. ....................................................................... 149
The effect of inoculant containing Lactobacillus plantarum and Enterococcus faecium on mycotoxin contamination of high dry matter grass silage
Pasterik, O. – Šimko, M. – Juráček, M. – Bíro, D. – Gyöngyová, E ...... 157
The content of amino acids and N-spektrum in pasture for cattle in 2 year of grazing in conventional systems
Pejchová, K. – Čermák, B. – Ingvortová, M. – Martínková, L. .............. 171
Effect of bacterial or chemical additives on microbiological composition of high moisture corn grain silage
Pyś, J.B. - Szałata, A. – Frączek, K. – Chmielarz, S. ............................ 179

5
Quality and yield of forage in relation to different grassland management
Raus, J. – Knot, P. .................................................................................. 185
Effect of a phytogenic feed additive on digestive physiological parameters in broilers
Rohrer, E. – Windisch, W. – Wetscherek, W. – Schedle, K................... 191
Monitoring the quality of vegetable oils
Rusníková, L. - Straková, E. - Suchý, P ................................................. 199
The effect of feeding rumen-protected CLA to lactating dairy cows on fatty acid profile of milk fat
Ryšavý, J – Křížová, L. – Janštová, B....................................................... 205
Chemical composition and in vitro true digestibility of heat- and lignosulfonate- treated rapeseed cake
Słota K. - Micek, P ................................................................................ 215
Fermentation characteristics of maize silages with chemical additive
Ševčík, P. – Bíro, D. – Juráček, M. – Šimko, M. – Gálik, B. – Rolinec, M. ................................................................................................................ 221
Influence of mineral fertilization and pasture management on forage quality
Štýbnarová, M. – Pozdíšek, J. ................................................................ 227

6

7
EFFECT OF THE PRESERVATIVE INOCULANTS ON SILAGE
FERMENTATION PROCESS OF DACTYLIS GLOMERATA
ALBA MEJÍA J. E. - SKLÁDANKA J. - MLEJNKOVÁ V.
Department of Animal Nutrition and Forage Production, Mendel
University in Brno
ABSTRACT
The objective of the performed experiments was to determine the
effect of preservatives inoculants. The variant A was a control treatment
without any additive. The variant B was treated by bacterial-enzymatic
additives 4 l per ton (Lactobacillus plantarum DSM 16568, L. buchneri
DSM 22501/CCM1819, and Enterococcus faecium DSM 22502/
NCIMB). And the variant C was supplied by chemical additives with its
dose 2 g per ton. (formic acid, propionic acid, benzoic acid and
ammonium formate) on the aerobic stability of silages. In the experiment
were monitored parameters such as, contents of ammonia, lactic acid,
propionic acid, acetic acid, butyric acid, and ethanol acid water extract.
The silage models were evaluated after 90 days of conservation at average
laboratory temperature 26–28 °C, from each treatment were the final
laboratory samples taken and analysed.
The research results showed a higher concentration of pH (4,53)
and lower percentage of ethanol (0.576 %) in contrast with others
varieties. On the other hand, in silage additives (Microsil and Kemisile)
trial were found lowers levels of ammonia (0.027 %) and also lowers
percentage of acetic acid (0.32 %) and (0.33 %), respectively, in
comparison with untreated model.

8
Effect of the varieties on the fermentation process was significant
(P<0.05). The use of microbiological preservative additives had positive
influence (P<0.05) because increased level of lactic acid and also reduced
the content of acetic acid; established very well in contrast to chemical
inoculants.
Key words: Acids, Dactylis glomerata, Chemical additives, Fermentation
silages, Microbial inoculants.
INTRODUCTION
Orchardgrass is more digestible and palatable than most other
grasses. It develops best on well-drained soils and, at the same time, can
withstand short periods of drought (Hall, 2008). It is grown both in simple
mixtures with alfalfa or red clovers, which operates under the meadow,
and in complex mixtures for grazing (Moisuc et al., 2002).
The principal objective of silage making is to conserve the grass
with minimal loss of nutritive value by fermentation of soluble
carbohydrates in an anaerobic environment into organic acids, preferably
lactic acid, which reduce pH (Saarisalo et al., 2007).
Recently, a heterofermentative LAB inoculant species,
Lactobacillus buchneri, has been used as a silage inoculant to produces
high concentrations of acetic acid in silage, which inhibit fungi and thus
preserve silages susceptible to spoilage upon exposure to air (Weinberg et
al., 2002; Filya, 2003a,b). It is important to employ special additives in
the process of ensiling, which enhance this process, protect the plant
material against the activity of harmful microflora and prolong the aerobic
stability of silages after the opening of silos (Selwet, 2004). For example,
the application of preparations based on organic acids can reduce the
number of protozoa in the rumen (Dönmez et al. 2003).

9
MATERIALS AND METHODS
Forage sampling
The analysis was carried out on 4 varieties, Dana and Vega from Czech
Republic, Otello from Italy and SW Luxor form Sweden. The trial was
conducted in year 2011. The paper present results from first evaluated
year (2012). The samples of forages were cultivated and harvested in the
Experimental Fodder Production Station Vatín 49°31′38″ N, 15°57′55″ E
in Czech-Moravian Highland. Harvest of whole plant grass was in the
phase of heading. Cut of the variety Otello was first on 23.05.2012 and the
another varieties such as Dana, Vega and SW Luxor were cut out on
30.05.2012 and left to wilt for 20 h. in the land, to reduce water content.
Dry matter content after wilting was 45-50%. The wilted forage was then
chopped to a length of 4 to 6 cm. To initiate the fermentation treatment,
the microbial and biological inoculants solution were sprayed evenly onto
the dried plant particles and mixed thoroughly for the application of 3
treatments, one of this was a control sample (A) without inoculants and
the others two with bacterial-enzymatic additives and chemical additives,
respectively. The probiotic inoculants “Microsil” were applied in variant
(B) at a rate of 2 g per ton (Lactobacillus plantarum DSM 16568,
Lactobacillus buchneri DSM 22501/CCM1819, and Enterococcus
faecium DSM 22502/ NCIMB) and organic acids “Kemisile” in variant
(C) at a rate of 4 L per ton (Formic acid, Propionic acid, Benzoic acid and
Ammonium formate). The trial was established in 3 replications.
The chopped forage was inserted into equal portions (7 kg) an
experimental polyethylene cylinder vessel and compacted with a pressure
of 400 kg.m-3 and immediately covered with a lid, and sealed to their
respective storage. The silage vessels were then maintained in a storage
room without direct light exposure and fermented at room temperature of
20–25 °C. The vessels were opened 90 days after ensiling and samples of
the raw material were taken from each variant for chemical analyses.

10
Chemical analyses
Chemical analysis include evaluated of pH, acidity of water extract
(AWE), contents of lactic acid (LA), acetic acid (AA), (AOAC, 1980).
The content of alcohol was established by a method described by
Hartman (1974). Analytical procedures including the preparation of water
extract were in details characterized in paper Doležal (2002). The statistic
evaluation was carried out by applying the multivariate analysis and a
subsequent verification by the Scheffé's test.
The aim of this paper is describe differences in the silage
fermentation process among 4 varieties of orchardgrass and describe
influence of silage additives on silage process. In this investigation we
used four varieties of orchardgrass two of them from Czech Republic
(Dana and Vega) and the remaining varieties are from Italy (Otello) and
from Estonia (SW Luxor), and that were cultivated in Vatín in Czech-
Moravian Highland.
RESULTS AND DISCUSSION
In the variety Dana show significant evidential difference in the
pH levels because the value was increased (P < 0.05) as opposed to the
other varieties. On the other hand, the pH value in the silage of varieties
Vega, Otello and SW Luxor tended to be under 4.5, considered acceptable
for grass silages. Moreover, in the variety Vega we can see a high
concentrations level (P < 0.05) of Lactic Acid (LA, 5.08 %) and Acetic
acid (AA, 0.43 %) in contrast with Dana. The lowest concentration of
ethanol value (P≤0.05) was detected in the microbiologically treated
silage (0.604 %) while significant differences were found between the
remaining variants and the lower concentration depend about the
concentration of Lactic acid in the treatment with bacterial-enzymatic
additives. The influence of varieties and silage additives on quality of

11
silage fermentation process of whole plants after ensiling is shown in
Table 1.
In the models silages with treatment were not found any
significant differences in the content of ammonia and also in the content
of Acetic acid. The highest titration acidity in the SW Luxor (2026.6 mg
KOH/100 g) variety showed significant evidential difference in
comparison with the lowest titration acidity (1238.5 mg KOH/100 g) of
Dana variety. Moreover, not found any significant evidential difference
between the models of silage additives. Contents of the butyric acid and
propionic acid are not determined at evaluated silages. In our experiments,
the addition of LAB inoculants improved the aerobic stability of silages.
Moreover, the findings are in a good agreement with the studies reported
by McAllister et al. (1995) and Kung and Ranjit (2001), the application of
E. faecium accelerated the post-ensiling decline in pH, increased the LA
concentration and reduced the concentrations of AA and BA. On the other
hand, when bacterial-enzymatic additives was used for silage inoculation,
a higher increase in the concentration of LA was found by Winters et al.
(2000), compared to the results reported by us.

12
Table 1: The fermentation characteristics of different varieties of Dactylis
glomerata.
Factor NH3 %
pH LA %
AA %
Ethanol %
AWE (KOH) Varieties (V)
SW Luxor 0.030 4.08a 3.63a 0.51a 1.082a 2026.6a Otello 0.030 4.17a 4.17a 0.35b 1.052a 1717.5b Dana 0.032 4.53b 3.98a 0.39b 0.576b 1238.5c Vega 0.033 4.17a 5.08b 0.43ab 0.947ab 1793.5b p 0.6994 0.0001 0.0001 0.0005 0.0019 0.0001 Silage Additives (SA) Control (A)
0.039a 4.29 5.22a 0.61a 1.018a 1799.9a Microsil (B)
0.027b 4.18 4.39b 0.32b 0.604b 1661.1ab Kemisile (C)
0.027b 4.26 3.03c 0.33b 1.121a 1621.1b p 0.0002 0.1056 0.0001 0.0001 0.0002 0.0108 V x SA 0.1990 0.0012 0.0001 0.0001 0.0039 0.0001
NH3– ammonia, LA–lactic acid, AA–acetic acid, AWE–acidity water extract.
Mean values in the same column with different superscripts (a,b,c) are significant at a level
of P<0.05.
CONCLUSIONS
This investigation shows that Dana variety has a high level of pH value
and a low concentration of ethanol in contrast with others varieties. On the
other hand, Vega shows high contents of lactic acid.
Moreover, in silages additives (Microsil and Kemisile) were found lowers
concentration of ammonia and lowers concentration of acetic acid in
comparison with untreated silage. The microbial inoculants had a positive
effect on grass silage characteristics in terms of pH, lactic acid and
ethanol concentration, and were established in the grass silage very well in
contrast to chemical additives because this decrease the concentration of
lactic acid (LA).
However, wide variation occurred. Possible effects on silage palatability
and ruminant’s health are discussed. In the future, these inoculants silages

13
will be used to study their effect on the formation of mycotoxins and
biogenic amines, respectively.
Acknowledgments: This investigation was financed by the project TP
IGA AF MENDELU in Brno 3/2012. Effectivity in Base Material
Utilization and Environment Preservation through Animal Feed
Production and Nutrition Systems.
REFERENCES
AOAC (1980): Official Methods of Analysis. 13th ed., Washington, DC:
AOAC. p.1018
Doležal P. (2002): Vliv přídavku Lactobacillus plantarum DSM 12771 na
kvalitu siláží silně zavadlé vojtěšky a trávy (Effect of supplements of
Lactobacillus plantarum DSM 12771 on the quality of ensiled alfalfa and
grass with a high content of dry matter). Acta univ. agric. et silvic Mend.
Brun., 51, 5: p. 37-44.
Dönmez N., Karsli M.A., Cinar A., Aksu T., and Baytok E. (2003): The
effects of different silage additives on rumen protozoan number and
volatile fatty acid concentration in sheep fed corn silage. Small Rum Res.
48: p. 227-231.
Filya I. (2003a): The effect of Lactobacillus buchneri and L. plantarum on
the fermentation, aerobic stability, and ruminal degradability of low dry
matter corn and sorghum silages. J. Dairy Sci. 86: p. 3575-3581.
Filya I. (2003b): The effect of Lactobacillus buchneri, with or without
homofermentative lactic acid bacteria, on the fermentation, aerobic
stability, and ruminal degradability of wheat, sorghum, and maize silages.
J. Appl. Microbiol. 95: p. 1080-1086.
Hall M. H. (2008): Orchardgrass. Agronomy Facts. 25: p. 1-4.
Hartman M. (1974): Stanovení neutrálních těkavých látek v silážích a
senážích plynovou chromatografií. Živočišná výroba. 20, 4: p. 209-216.

14
Kung L. Jr. and Ranjit N. K. (2001): The effect of Lactobacillus buchneri
and other additives on the fermentation and aerobic stability of barley
silage. Journal of Dairy Science. 84: p. 1149-1155.
McAllister T. A., Selinger L. B., McMahon L. R., Bae H. D., Lysyk T. J.,
Oosting S. J. and Cheng K. J. (1995): Intake, digestibility and aerobic
stability of barley silage with mixtures of Lactobacillus plantarum and
Enterococcus faecium. Canadian Journal of Animal Science. 75: p. 425-
432.
Moisuc A. and Dukic D. (2002): Cultura plantelor furajere. Editura
Orizonturi Universitare. Timişoara. p. 16-24.
Saarisalo E., Skyttä E., Haikara A., Jalava T. and Jaakkola S. (2007):
Screening and selection of lactic acid bacteria strains suitable for ensiling
grass. Journal of Applied Microbiology. 102: p. 327-336.
Selwet M. (2004): Influence of formic acid on bacterial growth during the
ensilage of grass-legume mixtures. Medycyna Wet. 60: p. 763-765.
Weinberg Z. G., Ashbell G., Hen Y., Azrieli A., Szakacs G. and Filya I.
(2002): Ensiling whole-crop wheat and corn in large containers with
Lactobacillus plantarum and Lactobacillus buchneri. J. Ind. Microbiol.
Biotechnol. 28: p. 7-11.
Winters A. L., Cockburn J. E., Dhanoa M. S. and Merry R. J. (2000):
Effects of lactic acid bacteria in inoculants on changes in amino acid
composition during ensilage of sterile and nonsterile ryegrass. Journal of
Applied Microbiology. 89:p. 442–451.

15
THE EFFECT OF INORGANIC AND ORGANIC FORM OF ZINC
ON LEVELS OF MACRO MINERALS AND TRACE ELEMENTS
IN BLOOD OF DAIRY COWS
BALABÁNOVÁ, M. ─ HOŠKOVÁ, Š. ─ ZEMAN, L.
Department of Animal Nutrition and Forage Production, Faculty of
Agronomy, Mendel University in Brno, Czech Republic
ABSTRACT
The aim of our experiment was to compare the effect of feeding
inorganic and organic forms of zinc in premix on levels calcium,
phosphorus, magnesium, iron, zinc and copper in blood. The experiment
was carried out on 20 cows that were divided into two groups and it lasted
74 days (from the fourteenth day before calving to the sixtieth day after
calving). The first group of nine cows designated as "Inorganic zinc form"
(IZF) was fed a diet supplemented with mineral premix containing
inorganic form of zinc and second group of ten cows designated as
"Organic zinc form" (OZF) had zinc oxide replaced with zinc fixed to
methionine. During the experiment samples of feeding ration and blood
were taken. The samples of blood were taken approximately 14th day
before calving, day of calving, 7th, 30th and 60th day after calving.
The group IZF was higher (P < 0.05) levels of zinc in the blood
than group OZF before calving (17.18 µmol Zn/l and 13.98 µmol Zn/l).
Sixtieth day after calving, the results show that cows with organic form of
zinc in the diet had a statistically significantly higher (P < 0.01) levels of
zinc in the blood than cows with an inorganic form of zinc in the diet
(14.22 µmol Cu/l and 17.57 µmol Cu/l).

16
MATERIALS AND METHODS
The aim of our experiment was to compare the effect of feeding
inorganic and organic forms of zinc in premix on levels calcium,
phosphorus, magnesium, iron, zinc and copper in blood.
The experiment included cows whose feeding ration, composed of
roughage and concentrate feed, was supplemented with a premix of
mineral substances with the inorganic or organic forms of zinc. The
studied cows of Holstein breed originated from the stock of the
agricultural farm Žabčice of Mendel University in Brno. The monitoring
each cow lasted 74 days (from 14th day before calving to 60th day after
calving. The adaptation period lasted three weeks.
Animals
The experiment included two groups of cows. The first group (2
heifers, 3 first parity cows and 5 multiparous cows) and the second group
(3 heifers, 3 first parity cows and 4 multiparous cows) were fed the same
feeding ration except premix. The first group, which was fed a standard
feeding ration and mineral premix with inorganic form of zinc (ZnO), was
designated as IZF (Inorganic zinc form). The second group was
designated as OZF (Organic zinc form) and it had zinc oxide replaced
with zinc, which was fixed to methionine (Khei-chelate Zn powder 15%
by Kheiron). Both groups of cows were housed in groups.
Feeding ration
There were three types of feeding rations during our experiment (a
detailed list of feeding rations is presented in Tab. 1). The first type of
feeding ration was fed during transition period to 2nd day after calving, the
second type of feeding ration was fed from 3rd day to 30th day after
calving and the third type of feeding ration was fed from 31st day to 60th
17
day after calving. Prior experiment cows were assigned to respective diet
60th day before expected calving for adaptation.
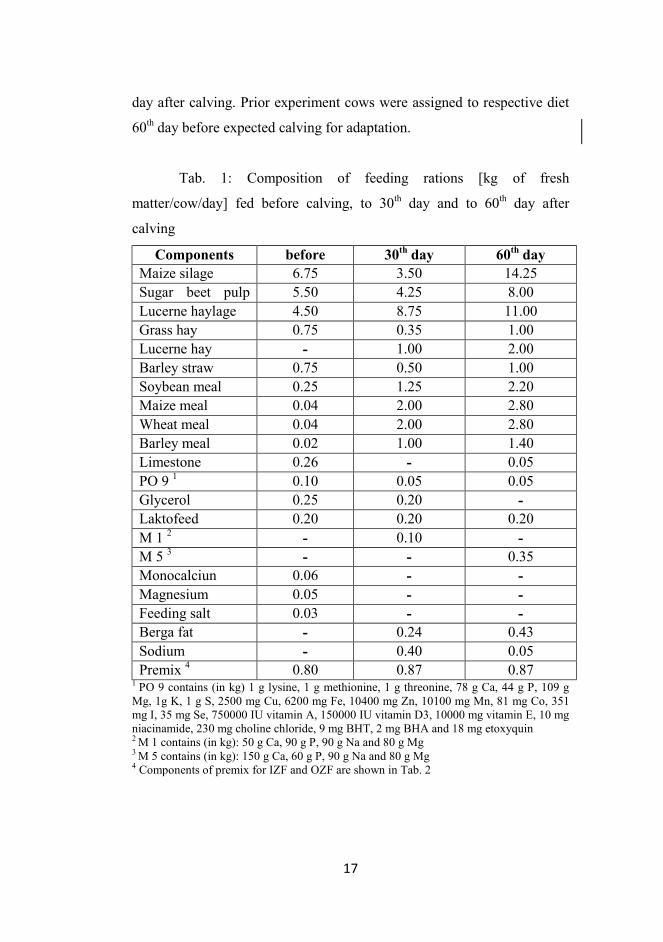
Tab. 1: Composition of feeding rations [kg of fresh
matter/cow/day] fed before calving, to 30th day and to 60th day after
calving
Components before 30th day 60th day Maize silage 6.75 3.50 14.25 Sugar beet pulp 5.50 4.25 8.00 Lucerne haylage 4.50 8.75 11.00 Grass hay 0.75 0.35 1.00 Lucerne hay - 1.00 2.00 Barley straw 0.75 0.50 1.00 Soybean meal 0.25 1.25 2.20 Maize meal 0.04 2.00 2.80 Wheat meal 0.04 2.00 2.80 Barley meal 0.02 1.00 1.40 Limestone 0.26 - 0.05 PO 9 1 0.10 0.05 0.05 Glycerol 0.25 0.20 - Laktofeed 0.20 0.20 0.20 M 1 2 - 0.10 - M 5 3 - - 0.35 Monocalciun 0.06 - - Magnesium 0.05 - - Feeding salt 0.03 - - Berga fat - 0.24 0.43 Sodium - 0.40 0.05 Premix 4 0.80 0.87 0.87
1 PO 9 contains (in kg) 1 g lysine, 1 g methionine, 1 g threonine, 78 g Ca, 44 g P, 109 g Mg, 1g K, 1 g S, 2500 mg Cu, 6200 mg Fe, 10400 mg Zn, 10100 mg Mn, 81 mg Co, 351 mg I, 35 mg Se, 750000 IU vitamin A, 150000 IU vitamin D3, 10000 mg vitamin E, 10 mg niacinamide, 230 mg choline chloride, 9 mg BHT, 2 mg BHA and 18 mg etoxyquin 2 M 1 contains (in kg): 50 g Ca, 90 g P, 90 g Na and 80 g Mg 3 M 5 contains (in kg): 150 g Ca, 60 g P, 90 g Na and 80 g Mg 4 Components of premix for IZF and OZF are shown in Tab. 2

18
Tab: 2 Components [%] of premix for group with inorganic zinc form in diets (IZF) and for group with organic zinc form in diets (OZF)14th day before calving, 30th day after calving and 60th day after calving.
Components [%] IZF OZF Monocalcium phosphate 4.5 4.5 Feeding salt 2.5 2.5 NaHCO3 27.3% 5.0 5.0 Hamag Kauster 82 1 2.7 2.7 Propionan Ca 1.3 1.3 CuSO4 25% 0.1 0.1 Bioplex Cu 10 % 0.025 0.025 ZnO 76 % 0.15 - Khei-chelate Zn 15 % - 0.81 MnO 0.17 0.17 Optimin Mn 15 % 0.05 0.05 CoSO4 22 % 0.003 0.003 Optimin Co 2.5 % 0.001 0.001 Ca(IO3)2 0.004 0.004 Selenite 0.012 0.012 Alkosel 0.2 % 0.02 0.02 Vit A 1000 0.012 0.012 Vit D3 50 % 0.004 0.004 Vit.E 45 % 0.134 0.134 Antioxidant 0.012 0.012 Lacto-feed 70 2 30 30 Toxi-Tect 3 1.5 1.5 Energizer RP 10 4 20 20
1 Hamag Kauster 82 – active form of MgO, contains 85.6 %MgO, 5.9 % CaO, 0.4 % SiO2, 7.5 % Fe2O3 and 0.1 % Al2O3. 2 Lacto-feed 70 contains 70.0 % lactose, 11.5 % protein, 7.5 % ash, 0.3 % fat. 3 Toxi-Tect had enzyme-inhibiting effect of mycotoxins. 4 Energizer RP 10 was a rumen protected fat produced using the latest in fat processing technology from palm oil.
Each premix was incorporated into TMR (Total mixture ration)
every day during the experiment. TMR were served twice a day and
pushed over the manger several times a day. Refusals did not exceed 1%
of daily portion of diet.

19
Sampling
The samples of feeding rations were taken approximately 14th day
before the expected calving and then 30th day and 60th day after calving.
Samples were transported to the laboratory of the Department of Animal
Nutrition and Fodder Production of MENDELU where they were
adequately modified for laboratory analyses (drying, grinding). In these
laboratories, dry matter was analyzed according to POŠTULKA and
DOLEŽAL (2010). The levels of macro elements (calcium, phosphorus
and magnesium) and trace elements (iron, zinc and copper) were analyzed
in laboratory of Department of Morphology, Physiology and Animal
Genetics (Konelab T20xt by THERMO ELECTRON OY, Finland).
The samples of blood were taken to test tube with anticoagulant
K3 EDTA from vena caudalis mediana each of monitored cows
approximately 14th day before calving, the day of calving, 7th, 30th and 60th
day after calving by veterinarian.
These samples of blood were mixed with contained anticoagulants
in the test tubes and marked each ones of tubes. The EDTA-blood was
centrifuged by MPW-350e centrifuge (20 min., 1500 speed) in laboratory
of Department of Animal Nutrition and Forage Production, in Mendel
University in Brno. The levels of macro elements (calcium, phosphorus
and magnesium) and trace elements (iron, zinc and copper) were analyzed
from the EDTA´s plasma in laboratory of Department of Morphology,
Physiology and Animal Genetics (Konelab T20xt by THERMO
ELECTRON OY, Finland).
The statistic evaluation was made using the Scheffe´s test
(SNEDECOR and COCHRAN, 2012).
20
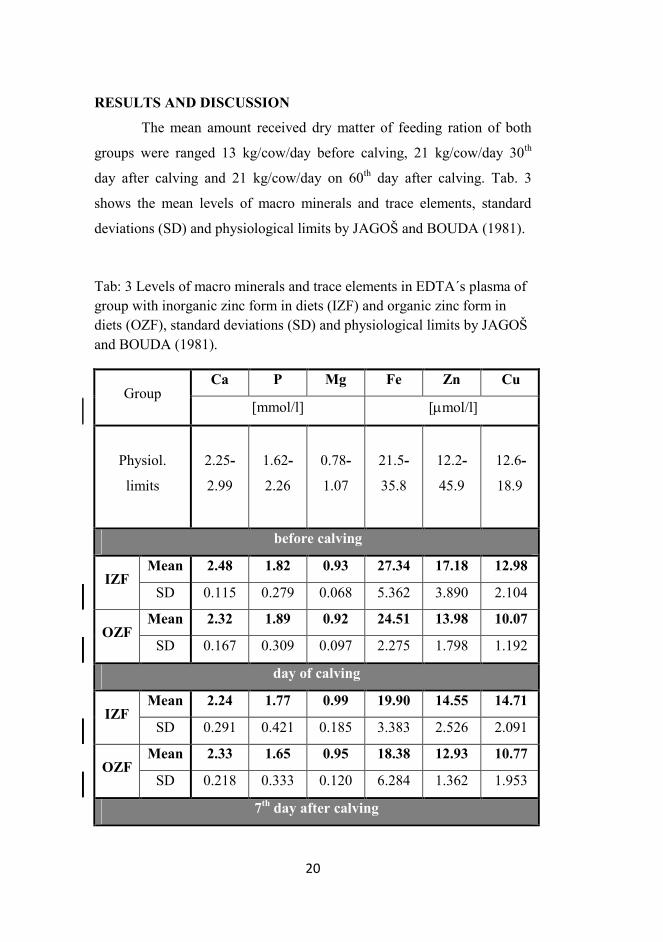
RESULTS AND DISCUSSION
The mean amount received dry matter of feeding ration of both
groups were ranged 13 kg/cow/day before calving, 21 kg/cow/day 30th
day after calving and 21 kg/cow/day on 60th day after calving. Tab. 3
shows the mean levels of macro minerals and trace elements, standard
deviations (SD) and physiological limits by JAGOŠ and BOUDA (1981).
Tab: 3 Levels of macro minerals and trace elements in EDTA´s plasma of group with inorganic zinc form in diets (IZF) and organic zinc form in diets (OZF), standard deviations (SD) and physiological limits by JAGOŠ and BOUDA (1981).
Group Ca P Mg Fe Zn Cu
[mmol/l] [µmol/l]
Physiol.
limits
2.25-
2.99
1.62-
2.26
0.78-
1.07
21.5-
35.8
12.2-
45.9
12.6-
18.9
before calving
IZF Mean 2.48 1.82 0.93 27.34 17.18 12.98
SD 0.115 0.279 0.068 5.362 3.890 2.104
OZF Mean 2.32 1.89 0.92 24.51 13.98 10.07
SD 0.167 0.309 0.097 2.275 1.798 1.192
day of calving
IZF Mean 2.24 1.77 0.99 19.90 14.55 14.71
SD 0.291 0.421 0.185 3.383 2.526 2.091
OZF Mean 2.33 1.65 0.95 18.38 12.93 10.77
SD 0.218 0.333 0.120 6.284 1.362 1.953
7th day after calving

21
IZF Mean 2.32 1.59 0.88 17.50 10.08 14.64
SD 0.129 0.255 0.120 5.476 2.347 1.831
OZF Mean 2.28 1.61 0.92 19.02 10.69 13.72
SD 0.141 0.226 0.140 4.399 1.792 1.186
30th day after calving
IZF Mean 2.38 1.67 0.99 17.96 13.52 14.35
SD 0.510 0.455 0.021 3.707 2.455 2.868
OZF Mean 2.39 1.86 1.04 21.29 15.09 11.46
SD 0.958 0.406 0.093 7.309 2.249 2.000
60th day after calving
IZF Mean 2.43 1.86 1.04 21.16 14.22 11.43
SD 0.062 0.349 0.082 3.484 2.157 1.491
OZF Mean 2.39 2.02 1.06 25.03 17.57 11.06
SD 0.096 0.383 0.030 6.008 1.536 2.073
Mean levels of the whole experiment
IZF Mean 2.86 1.74 0.97 20.77 13.91 13.62
SD 0.211 0.352 0.095 4.282 2.675 2.077
OZF Mean 2.34 1.81 0.98 21.65 14.05 11.42
SD 0.316 0.331 0.096 5.255 1.747 1.681
Overall means for macro minerals throughout the period were at
levels of calcium in the blood 2.86 ± 0.211 mmol/l (group IZF) and 2.34 ±
0.316 mmol/l (group OZF), at the level of phosphorus in the blood of 1.74
± 0.352 mmol/l (group IZF) and 1.81 ± 0.331 mmol/l (group OZF), and
the mean level of magnesium 0.97 ± 0.095 mmol/l (group IZF) and 0.98 ±
0.096 mmol/l (group OZF).
GOFF (2006) states that the mean level of calcium adult cow is
2.1 to 2.5 mmol/l, the mean phosphorus level of 1.3 to 2.6 mmol/l,
magnesium 0.75 to 1.0 mmol/l. The both groups of monitored cows
22
corresponded to the values indicated by this author, except calcium level
in the blood of group fed inorganic zinc form. The calcium values of our
groups are 3.9 to 15.9 % lower in compare with calcium values by
POLÁKOVÁ et al. (2010). POLÁKOVÁ et al. (2010) demonstrated the
rising trend in blood levels of phosphorus too, but the values were slightly
higher than that POLÁKOVÁ et al. (2010). POLÁKOVÁ et al. (2010)
recorded rapid growth level of magnesium in blood (3.5 times) in the
postpartum period, we have not observed such a big difference in our
experiment.
Over the entire period, the mean level of iron in the blood 20.77 ±
4.282 µmol/l in group IZF and 21.65 ± 5.255 µmol/l in group OZF, the
mean level of zinc in blood was 13.91 ± 2.675 µmol/l (group IZF) and
14.05 ± 1.747 µmol/l (group OZF), and the mean level of blood copper
levels were 13.62 ± 2.077 µmol/l (group IZF) and 11.42 ± 1.681 µmol/l
(group OZF).
PAVLATA, PECHOVÁ, DVOŘÁK (2004) to 12 clinically
healthy cows of the breed Red-Holstein fed the same ration consisting of
corn silage, grass silage, meadow hay and three weeks before the birth of
3 kg forage feed observed mean level of zinc 11.62 ± 2.35 µmol/l and
copper level 8.95 ± 1.95 µmol/l These values are found in period from day
of calving to the end colostral period. We watched the values of zinc and
copper higher about 20 % and 40 %. It could be caused by a higher
amount of these elements in the feeding ration than in feeding ration
PAVLATA, PECHOVÁ, DVOŘÁK (2004).
The zinc levels in the blood can be seen that the variability of the
group with organic form of zinc in the diet was smaller than in the group
with an inorganic form of zinc in the diet. The group IZF had levels of
zinc in the blood than group OZF before calving (P < 0.05). Sixtieth day
after calving contrary, the results show that cows with organic form of

23
zinc in the diet had higher levels of zinc in the blood than cows with an
inorganic form of zinc in the diet (P < 0.01), differences in the levels of
other minerals were not significant.
CONCLUSION
We monitored the different sampling times and focused on the
level of zinc and copper. It was possible monitored the negative
correlation between the level of zinc and copper in the blood. The trend of
zinc level in blood was decreasing to the seventh day after birth and
subsequently increasing. This trend was the same in the group with an
inorganic form of zinc was an organic form of zinc in the diet. On the
contrary, it was with copper levels in blood of monitored cows, where the
trend was rising to the seventh day after birth and subsequently declined
in both groups.
Acknowledgements: The work was written within the framework of
Grant TP3/2012 funded by the Internal grant Agency of Mendel
University in Brno (IGA).
REFERENCES
GOFF, J.P. Macromineral physiology and application to the feeding of the
dairy cow for preventive of milk fever and other periparturient mineral
disorders. Animal Feed Science and Technology [online]. 2006, 126, 237-
257 [cit. 17.4.2011]. ISSN 0377-8401. Dostupné z:
http://naldc.nal.usda.gov/download/35067/PDF
JAGOŠ, P., BOUDA, J. Základní biochemické a hematologické hodnoty u
domácích zvířat a nové způsoby vyjadřování výsledků laboratorních
vyšetření. 1. vyd. Pardubice: SVS-Oddělení veterinární osvěty, 1981. 29 s.

24
PAVLATA, L., PECHOVÁ, A., DVOŘÁK, R. Microelements in
colostrum and blood of cows and their calves during colostral nutrition.
Acta Veterinaria Brno. 2004, 73, 421-429. ISSN 0001-7213.
POLÁKOVÁ, K., KUDRNA, V., KODEŠ, A., HUČKO, B., MUDŘÍK,
Z. Non-structural carbohydrates in the nutrition of high-yielding dairy
cows during a transition period. Czech Journal of Animal Science, 2010.
55 (11): 468-478. ISSN 1212-1819
POŠTULKA, R., DOLEŽAL, P. The influence of locality, treatment
against european corn borer (Ostrinia Nubilalis), hybrid and silage
additive on the ruminal degradability of starch of maize silage. Acta
Universitatis Agriculturae. et Silviculturae Mendelianae Brunensis, 2010.
58 (2): 175–180.
SNEDECOR, G W., COCHRAN, W.G. Snedecor and Cochran's
Statistical Methods, 6. vyd., Blackwell Pub, 2012. s. 576. ISBN 978-
0813808642.

25
WHAT IS THE EFFECT OF HIGH AMBIENT TEMPERATURE
ON THE GROWTH PARAMETERS AND UTILIZATION OF
NITROGEN IN GROWING PIGS?
BRESTENSKÝ, M.1 – NITRAYOVÁ, S. - PATRÁŠ , P. - HEGER, J.
Animal Production Research Centre Nitra, Institute of Nutrition, 95141
Lužianky, Slovakia 1 Corresponding author: [email protected]
ABSTRACT
During the 28-d experiment we observed the effect of high
environmental temperature on average daily weight gains (ADG) and
nitrogen (N) metabolism in pigs. The 7 gilts (initial BW 50.5 ± 1.7 kg)
were housed in metabolism cages in a climate-controlled room. After the
1-st 14-d period during which the animals were housed at thermo-neutral
temperature (NT; 20.61 ± 0.1 ºC) followed 2–nd 14-d period at high
environmental temperature (HT; 30.41 ± 0.4 ºC). In each experimental
period, two 24-h balance periods were carried out during which faeces and
urine (via bladder catheters) were collected and subsequently pooled for N
analysis. Feed intake (FI) was recorded daily and animals were weighed in
7-d intervals. Based on N intake and N excretion, N balance was
calculated. At HT conditions, N intake was 4.1 % lower (P = 0.028) due to
the 2.6 % lower FI (P = 0.017), urinary N excretion increased by 18.8 %
(P = 0.040) and N retention decreased (P = 0.001) by 21 % in comparison
at NT conditions. We observed insignificantly lower ADG by 5.2 % in
animals housed at HT in comparison with NT. When the animals are
exposed to continuous high environmental temperatures FI decreases due
to the decrease in heat production in the body and N retention decreases

26
presumably due to decreased utilization of metabolizable energy during
respiration.
Key words: growth, heat stress, nitrogen, pigs
MATERIAL AND METHODS
All experimental procedures were reviewed and approved by the
Animal Care Committee of the Animal Production Research Center.
Seven gilts with initial average body weight of 50.5 ± 1.7 kg were housed
in balance cages. After a 4-d adaptation period, two 14-d experimental
periods followed. During the 1-st period, the animals were housed in a
room with the environmental temperature at 20.6 ± 0.1 ºC. After this
period, 2-nd 14-d period followed in which the environmental temperature
increased to 30.4 ± 0.4 ºC.
The animals were fed with a standard diet (Table 1) twice a day in
2 equal doses at daily amount of 90 g/kg 0.75. Water was offered ad
libitum. On days 6 and 13 of each experimental period, two 24-h balance
periods were performed during which urine (via bladder catheters) and
faeces were collected. Feed consumption was recorded daily. Animals
were weighed weekly. Samples of diets and faeces were analyzed for dry
matter and total N and samples of urine, for total N according to the
methods of AOAC (1990). The retention and digestibility of N were
calculated based on nitrogen excretion in urine and faeces and nitrogen
intake.
The experimental data were subjected to ANOVA using
Statgraphic Plus 3.1. package. When significant value for treatment effect
(P < 0.05) was observed, the differences between means were assessed
using Fisher's LSD procedure.

27
RESULTS AND DISCUSSION
Parameters for growth and feed intake at different environmental
temperatures are in Table 2. At HT feed intake was 2.6 % lower (P=
0.017) than at NT. Similar Collin et al. (2001) reported lower feed intake
at high environmental temperature due to of reducing heat production in
the body. As a result of decreased feed intake at high temperature there
were observed lower ADG (Le Bellego et al., 2002). We observed an
insignificant decrease of ADG by 5.2 % at HT probably due to the fact
that decrease of feed intake was only 2.6 %.
Nitrogen digestibility was not affected by different temperatures
(Table 3). Liao and Veum (1994) reported that digestibility of nitrogen
was unchanged in sows housed at constant high temperatures in
comparison with thermo-neutral temperatures but the lower digestibility
of nitrogen in piglets exposed to high temperature reported Elias
and Cline (1991). These conflicting results may be due to the different
categories of animals with different body weight and their reaction to heat
stress (Quiniou, et al., 2000) and also the different type of diets because
the diets with highly digestible protein may attenuate the effect of high
temperature on protein digestibility (Bonnet et al., 1997).
There was observed 21 % lower (P = 0.001) daily nitrogen
retention at high temperatures than at thermo neutral temperatures (Table
3). Similarly other authors (Collin et al., 2001; Ferguson and Gous 2002)
reported lower nitrogen retention in young pigs housed neither at 33 ºC or
30 ºC in comparison with 20; 23 or 25 ºC. It seems that the decline in
utilization of nitrogen in the body is associated with a decreased in
utilization of metabolizable energy. When the ambient temperature
exceeds upper critical temperature of animals, utilization of energy
decreases (Elias and Cline, 1991). A higher nitrogen excretion in urine in
pigs exposed to high temperatures indicates a high level of nitrogen
degradation and oxidation of body amino acids (Elias a Cline, 1991) for

28
thermoregulation purpose. Contrary to these results, Le Divich et al.
(1980) found no differences in nitrogen retention in piglets housed at
temperatures 20 ºC and 28 ºC. It seems that nitrogen metabolism in body
influence high temperatures (Liao and Veum 1994, Ferguson and Gous
2002) exceeding the upper critical temperature of animals.
CONCLUSION
At constantly high environmental temperatures, which are close to
or exceed the upper critical temperature of the animals, feed intake
decreases due to a reduction of heat production in the body and nitrogen
retention decreases presumably as a result of increased energy expenditure
during respiration.
Acknowledgment: This article was written during realization of the
project "BELNUZ No. 26220120052" supported by the Operational
Programme Research and Development funded from the European
Regional Development Fund.
REFERENCE
AOAC. 1990. Official Methods of Analysis. 15th ed. Assoc. Off. Anal.
Chem., Arlington, VA.
Bonnet, S., P. A. Geraert, M. Lessire, B. Carre, and S. Guillaumin. 1997.
Effect of high temperature on feed digestibility in broilers. Poult. Sci.
76:857-863.
Collin, A., J. Van Milgen, S. Dubois, and J. Noblet. 2001. Effect of high
temperature and feeding level on energy utilization in piglets. J. Anim.
Sci. 79:1849-1857.
Elias, T. F., and T. R. Cline. 1991. Influence of environmental
temperature on nitrogen retention apparent digestibility of protein and

29
amino acids and energy balance in growing pigs. Pesq. Agropec. Bras.
26:1237-1253.
Ferguson, N. S., and R. M. Gous. 2002. The response of growing pigs to
amino acids as influenced by environmental temperature: tryptophan.
Anim. Sci. 74:103-110
Le Bellego, L., Van Milgen, J. and Noblet, J. 2002. Effect of high
temperature and low-protein diets on the performance of growing-
finishing pigs. J Anim Sci. 80:691-701.
Le Dividich, J., M. Vermorel, J. Noblet, J. C. Bouvier and, A. Aumaitre.
1980. Effects of environmental temperature on heat production, energy
retention, protein and fat gain in early weaned piglets. Br. J. Nutr. 4:313-
323.
Liao, C. W., and T. L. Veum. 1994. Effects of dietary energy intake by
gilts and heat stress from days 3 to 24 or 30 after mating on embryo
survival and nitrogen and energy balance. J. Anim. Sci. 72:2369-2377.
Quiniou, N., S. Dubois, and J. Noblet. 2000. Voluntary feed intake and
feeding behaviour of group-housed growing pigs are affected by ambient
temperature and body weight. Liv. Prod. Sci. 63:245-253.

30
Table 1. Component and nutritional composition of diet (as-fed basis)
Component % Diet Maize (8% CP) 54.0 Barley (10.8% CP) 8.0 Soya-bean meal (46% CP) 18.0 Alfalfa meal (18% CP) 8.0 Rapeseed meal (33% CP) 4.0 Sunflower oil 4.0 Limestone 0.2 Mono calcium phosphate 1.2 Salt 0.4 Vitamin -Mineral premix 1 1.5 L-Lys. HCl (78%) 0.30 DL- Met (99%) 0.04 L- Thr (98%) 0.05 L-Trp 0.01 Cr2O3 0.30
1 Provide the following amounts per kilogram of diet: vitamin A, 10 000 IU; α-tocopheryl acetat 60 mg; vitamin K3, 3000 mg; vitamin B1, 2.0 mg; vitamin B2, 6.0 mg; Vitamin B6, 4.0 mg; vitamin B12, 30 mg; selenium 0.30 mg. 2 Calculated content of nutrients: ME 13.4 MJ/kg; CP 180.7 g/kg; Lys 12.7 g/kg; Met 2.2 g/kg; Thr 7.5 g/kg
Table 2. Performance parameters at different environmental temperatures
Parameter Treatment1
P-value NT HT SEM SEM
Feed intake, g/d 2000 a 45.2 1948 b 35.0 0.017 Average daily weigh gain, g/d 824 50.0 781 70.0 0.612 Gain:feed, g/kg 412 22.6 398 33.6 0.720 Feed conversion rate, kg 2.5 0.2 2.9 0.4 0.405 1Treatment: NT - thermo-neutral temperature 20.6 ± 0.1 ºC, HT – high temperature 30.4 ± 0.4 ºC

31
Table 3. Parameters of nitrogen metabolism at different environmental
temperatures
Parameter Treatment1
P-value NT HT SEM SEM
Nitrogen intake, g/d 57.8 a 1.8 55.46 b 3.8 0.028 Nitrogen excretion in urine, g/d 18.1 a 0.9 21.45 b 1.3 0.040 Nitrogen excretion in faeces, g/d 7.2 0.5 8.3 0.6 0.180 Nitrogen retention, g/d 32.6 a 1.0 25.8 b 1.5 0.001 Nitrogen utilization, % 56.4 a 1.7 46.4 b 2.6 0.003 Total tract digestibility of N, % 87.6 0.8 85.2 1.0 0.070
1Treatment: NT - thermo-neutral temperature 20.6 ± 0.1 ºC, HT – high temperature 30.4 ± 0.4 ºC

32

33
SHORTENED DRY PERIOD OF 35 DAYS IN DAIRY COWS
ČERMÁKOVÁ J.1,2 - DOLEŽAL P.2 - KUDRNA V.1
1Institute of Animal Science, Praha Uhříněves, Czech Republic
2Mendel University in Brno, Brno, Czech Republic
ABSTRACT
In this experiment two strategies of dairy cow management and
feeding were compared during the dry-off period and their effect on dry
matter intake and milk production was evaluated. Shortening dry period to
35 (± 6.3; STDEV) days and feeding a late lactation diet increased
prepartum dry matter intake of the cows about 4.11 kg per day (P<0.001)
compared with cows given traditional dry period 57.1 (± 5.9; STDEV)
days. Shortening the dry period however, did not increase postpartum dry
matter intake. In contrary, postpartum dry matter intake was about 0.70
kg/cow/day higher in the control group (P<0.001). The strategy of
shortened dry period decreased milk yield about 3.23 kg/cow/day during
the first 100 days of lactation. Due to reduced milk production there was
no benefit of extra milk production (396 kg) during extended lactation of
the cows with shortened dry period.
Key words: nutrition, dry period, dry matter intake, milk production
INTRODUCTION
Periparturient period has been widely characterised as the period
with decreased dry matter intake (DMI; Bertics et al., 1992; Hayirli et al.,
2002), negative energy balance (NEB) and increased occurrence of
metabolic and infection diseases (Duffield, 2006; Goff, 2006). Nutrition
and feeding before calving is one of the most important factors
influencing milk production, reproduction and health of dairy cows in

34
early lactation. Traditionally, cows are dried off approximately 60 days (6
to 8 weeks) before expected calving and fed a low energy diet based on
roughages. Approximately three weeks before expected calving the
energy density of the diet is gradually increased (about 0.5 kg each two
days) by addition of concentrates up to about 4 to 5 kg per day for high-
producing dairy cows.
However, recently it has been hypothesised that reduced length of
the dry period would increase DMI and alleviate NEB in early lactation
and consequently decrease incidence and severity of metabolic and
infectious diseases and improve reproductive performance of the cows
(Gümen et al., 2005; Watters et al., 2009). Based on the previous
research, shortening or even omitting the dry period seems to shift milk
production from the critical period shortly after calving to the weeks
before calving, when the energy demands of mammary gland for the milk
production can be easily matched by feed intake. Increased dry matter
intake and reduced milk yield in following lactation improved energy
balance of dairy cows with reduced dry period at early lactation (Rastani
et al., 2005; Klusmeyer et al., 2009; Jolicoeur et al., 2010). With better
energy balance the incidence of health disorders would decrease (Watters
et al., 2008), the fertility (Gümen et al., 2005; Watters et al., 2009), rumen
function (Pezeshki et al., 2008) and lactation persistency is improved and
live body weight (LW) and body condition scores (BCS) of the cows
would increase (Gulay et al., 2003; Rastani et al., 2005; Pezehski et al.,
2008). In addition, good energy balance optimizes milk protein synthesis
(Coulon and Rémond, 1991; Rémond et al., 1992). On the other hand,
potential risks of reduced dry period are reduction in milk yield in
subsequent lactation, impaired udder health (Enevoldsen and Sørensen,
1992; Whist et al., 2006) and reduction of colostrum quality, potentially
affecting calf health (Annen et al., 2004; Rastani et al., 2005; Klusmeyer
et al., 2009).
35
The aim of this study was to compare traditional (60 d) and
shortened (35 d) dry period strategies and evaluate their effect on dry
matter intake and milk production.
MATERIAL AND METHODS
The experiment included 34 high-yielding dairy cows, from which
29 were chosen for the final statistical analysis. Cows were blocked into
two groups according to breed (3 Czech Fleckvieh, 22 Holstein-Friesian
and 4 crossbreds), parity (1 – 4; average 2 ± 0.86; STDEV), produced
8939 (± 2063) kg of milk in the previous lactation (299 ± 11 d) and their
average live body weight (LW) was 607 (± 72) kg. The control group (C;
n=14) assigned to traditional dry period of 57 (± 5.9) d was fed a diet
corresponding with nutrition requirements of dried cows. Approximately
three weeks before expected calving the concentrate mixture
(3 kg/cow/day) was added into their diet. Cows of experimental group
assigned to shortened dry period (S; n=15) were continuously fed a diet
for cows in the 2nd period of the lactation until calving. After calving all
cows in both groups were fed the same lactation diet, corresponding their
lactation requirements. Diets were based on maize silage, lucerne silage,
lucerne hay, ensiled maize cobs with bracts (LKS), fresh Brewer’s grains
and concentrate mixture. The diets were fed as total mixed ration (TMR)
ad libitum. Cows were provided with chips identifying the cows to allow
automatic measurement of their feed intake which was recorded
electronically by software using the automatic feeding system INSENTEC
(Marknesse, The Netherlands) with troughs on tensometric scales. Cows
were milked twice a day with intervals about 12 to 14 hours. After calving
cows were followed for 100 days in milk (DIM). Milk yield was recorded
after each milking. The blended milk samples after both the morning and
evening milkings for the analysis of milk components (fat, protein, lactose
and total casein) and urea were collected with intervals of 14 days. The

36
data were collected and calculated using the Microsoft Excel and Quattro
(Corel Wordperfect Office) software packages, and statistically analyzed
by the procedure ANOVA.
RESULTS AND DISCUSSION
Changes in DMI and milk yield are shown in graph 1. As shown
in table 1, shortening the dry period increased average dry matter intake
before calving (S; 17.1 kg) about 4.11 kg per day compared with
traditional dry period (C; 13.0; P<0.001). After calving however, average
DMI was about 0.70 kg/cow/day higher in the control group (21.6 kg)
compared with the group S (20.9; P<0.001). Prepartum DMI of cows with
shortened dry period was not altered in two out of three studies (Gulay et
al., 2003; Jolicoeur et al., 2010) and one study (Rastani et al., 2005)
reported an increase. Two out of three studies reported no changes in
postpartum DMI of cows with shortened dry period (Gulay et al., 2003;
Rastani et al., 2005) and one study (Jolicoeur et al., 2010) reported an
increase. Table 2 shows milk production during the 1st 100 DIM. Cows
with shortened dry period produced in the average 37.3 kg of milk which
was about 3.23 kg/d less then produced cows in the control group (40.5
kg; P<0.001). This means that milk production of the cows in the group
with traditional dry period (C) during the 1st 100 DIM was about 323
kg/cow greater. Average milk production of the cows in group S during
extended lactation prepartum (about 25 days) was 15.8 kg/day (± 1. 67;
STDEV), which means approximately 396 kg of additional milk
production. The difference 73 kg of milk (396 – 323) due to the additional
prepartum milk production of the cows with shortened dry period would
be compensated on approximately 123 DIM as cows in control group
yielded in the average about 3.23 kg/d more milk then produced cows
with shortened dry period. Similarly to our results, many previous studies
(e.g. Watters et al., 2008; Klusmeyer et al., 2009; Soleimani et al., 2010)

37
showed that reducing dry period length decreases milk yield in the
subsequent lactation. In contrast, in study Jolicoeur et al. (2010)
shortening the dry period to 35 days increased milk yield by 3% to
compare with dry period of 65 days. Several studies indicate that
shortening the dry period to 30 – 35 days has a positive effect on milk
composition in early lactation. For example in studies Gulay et al. (2003),
Watters et al. (2008) and Soleimani et al. (2010) milk protein content
increases on average 0.12% accompanied by minor or no change in milk
fat content. Reported increase in the milk protein content could be
attributed to better postpartum energy balance of cows with reduced dry
period and thereby sparing amino acids and energy for protein synthesis
(Coulon and Rémond, 1991; Rémond et al., 1992). In the present study
the concentrations of milk protein were relatively low and about 0.08%
higher in group C (3.08%) to compare with S (3.16%; P<0.05). In
contrast, the concentrations of milk fat were rather high in both groups (C
4.32% and S 4.38%, respectively). The concentrations of milk fat were
high particularly during the first 14 DIM: on average C = 4.79% (± 0.67;
STDEV) and S = 5.45% (± 1.05; STDEV), respectively. The content of
milk protein, fat, lactose and urea during the 1st 100 DIM is shown in
graph 2.

38
Graph 1. Changes in DMI and milk yield (moving average)
Table 1. Dry matter intake (DMI) of cows with typical (C) and shortened (S) dry period prepartum and during the first 100 days in milk (DIM)
Period Prepartum (-60 d to Postpartum (1-100 DIM) Group C S SE P C S SE P DMI 13.0 17.1 4.59 <0.00 21.5 20.8 4.87 <0.00
Table 2. Milk production of of cows with typical (C) and shortened (S)
dry period during the first 100 days in milk (DIM)
Item C S SEM P Milk yield (kg/cow/d) 40.53 37.32 4.20 <0.001 Fat (%) 4.32 4.38 0.87 ns Protein (%) 3.08 3.16 0.27 <0.05 Lactose (%) 4.84 4.86 0.18 ns Urea (mg/L) 321.39 324.87 65.46 ns ns = P>0.05
DMI and MILK YIELD(moving average)
0
5
10
15
20
25
30
35
40
45
50
-60 -55 -50 -45 -40 -35 -30 -25 -20 -15 -10 -5 0 5 10 15 20 25 30 35 40 45 50 55 60 65 70 75 80 85 90 95 100
days prepartum/postpartum
DM
I + n
ádoj
(kg)
calving
S-milk yield
C-milk yield
S-DMI
S-milk yield
C-DMI
period without data between drying-off and calving

39
Graph 2. Changes in milk components concentrations
CONCLUSION
Shortening the dry period length (35 ± 6.3 d) increased prepartum
dry matter intake, but decreased dry matter intake and reduced milk
production after calving. The reduction in milk yields of the cows with
shortened dry period would not be compensated by additional milk
production during extended lactation. In both groups the cows produced
milk with relatively low concentrations of milk protein and concentrations
of milk fat were rather high, particularly during the first 14 DIM. This
data suggests negative energy balance of cows in early lactation.
Acknowledgment: This study was supported by the Institutional research
plan MSM 6215648905 - Biological and technological aspects of
sustainability of controlled ecosystems and their adaptability to climate
change.
CHANGES IN MILK COMPONENTS CONCNETRATIONS
2.00
2.50
3.00
3.50
4.00
4.50
5.00
5.50
6.00
- 60 - 40 14 28 42 56 70 84 98
days prepartum/postpartum
milk
com
pone
nts
S-fat %
C-fat %S-protein %
C-protein %
S-lactose % C-lactose %
S-urea mg/l*0,01 C-urea mg/l*0,01

40
REFERENCES
Annen EL, Collier RJ, McGuire MA, Vicini JL, Ballam JM, Lormore MJ.
2004. Effect of modified dry period lengths and bovine somatotropin on
yield and composition of milk from dairy cows. J Dairy Sci. 87(11):3746–
3761.
Bertics SJ, Grummer RR, Cadorniga-Valino C, Stoddard EE. 1992.
Effect of prepartum dry matter intake on liver triglyceride concentration
and early lactation. J. Dairy Sci. 75(7):1914-1922.
Coulon JB, Rémond B. 1991. Variations in milk output and milk protein
content in response to the level of energy supply to the dairy cow: a
review. Livest Prod Sci. 29:31-47.
Duffield TF. 2006. Minimizing subclinical metabolic diseases in dairy
cows. Adv Dairy Technol. 18:43–55.
Enevoldsen C, Sørensen JT. 1992. Effects of dry period length on clinical
mastitis and other major clinical health disorders. J Dairy Sci. 75(4):1007-
1014.
Goff JP. 2006. Major advances in our understanding of nutritional
influences on bovine health. J Dairy Sci. 89(4):1292–1301.
Gulay MS, Hayen MJ, Bachman KC, Belloso T, Liboni M, Head HH.
2003. Milk production and feed intake of Holstein cows given short (30-d)
or normal (60-d) dry periods. J Dairy Sci. 86(6):2030–2038.
Gümen A, Rastani, RR, Grummer RR, Wiltbank MC. 2005. Reduced dry
periods and varying prepartum diets alter postpartum ovulation and
reproductive measures. J Dairy Sci. 88:2401–2411.
Hayirli A, Grummer R.R., Nordheim E.V., Crump P.M. (2002): Animal
and dietary factors affecting feed intake during the pre-fresh transition
period in Holsteins. Journal of Dairy Science, 85(12):3430–3443.
Jolicoeur M, Brito AF, Pellerin D, Lefebvre D, Berthiaume R, Girard CL.
2010. Short dry period management to improve feed efficiency in early
lactation. Advances in Dairy Technology 22, Abstract, p. 388.

41
Klusmeyer TH, Fitzgerald AC, Fabellar AC, Ballam JM, Cady RA,
Vicini JL. 2009. Effect of recombinant bovine somatotropin and a
shortened or no dry period on the performance of lactating dairy cows. J
Dairy Sci. 92(11):5503–5511.
Pezeshki A, Mehrzad J., Ghorbani GR, De Spiegeleer B, Collier RJ,
Burvenich C. 2008. The effect of dry period length reduction to 28 days
on the performance of multiparous dairy cows in the subsequent lactation.
Can J Anim. Sci. 88:449-456.
Rastani RR, Grummer RR, Bertics SJ, Gümen A, Wiltbank MC, Mashek
DG, Schwab MC. 2005. Reducing dry period length to simplify feeding
transition cows: Milk production, energy balance, and metabolic profiles.
J Dairy Sci. 88(3):1004–1014.
Rémond B, Ollier A, Miranda G. 1992. Milking cows in late pregnancy:
Milk production during this period and during the succeeding lactation. J
Dairy Res. 59(3):233–241.
Soleimani A, Moussavi AH, Mesgaran MD, Golian A. 2010. Effects of
dry period length on, milk production and composition, blood metabolites
and complete blood count in subsequent lactation of Holstein dairy cows.
World Academy of Science, Engineering and Technology 68:628-633.
Watters RD, Guenther JN, Brickner AE, Rastani RR, Crump PM, Clark
PW, Grummer RR. 2008. Effects of dry period length on milk production
and health of dairy cattle. J Dairy Sci. 91(7):2595–2603.
Watters RD, Wiltbank MC, Guenther JN, Brickner AE, Rastani RR,
Fricke PM, Grummer RR. 2009. Effect of dry period length on
reproduction during the subsequent lactation. J Dairy Sci. 92(7):3081–
3090.
Whist AC, Østerås O, Sølverød L. 2006. Clinical mastitis in Norwegian
herds after a combined selective dry-cow therapy and teat-dipping trial. J
Dairy Sci. 89(12):4649-59.

42

43
THE EFFECT OF THE AGE AND THE TYPE OF THE LIQUID
FEED ON THE SGLT1 MRNA EXPRESSION IN THE JEJUNUM
OF NEONATAL CALVES
FLAGA J. - GÓRKA P. - BARTECZKO A. - KOWALSKI Z.M.
Department of Animal Nutrition and Feed Management,
University of Agriculture in Krakow
ABSTRACT
The objective of the study was to determine the effect of age and
the type of the liquid feed on the mRNA expression of sodium-glucose
transporter type 1 (SGLT1) in the jejunum of neonatal calves. Thirty bull
calves were randomly allocated to five experimental groups (6 animals per
group). Calves from group 1 were slaughtered immediately after
allocation to the trial at the age of 5 days. Calves from the group 2, 3 and
4 were fed milk replacer and slaughtered at week intervals (on 12., 19.,
26. day of life, respectively). Calves from group 5 were fed whole milk
and slaughtered at the 26. day of life. Tissues from the jejunum were
collected subsequently to slaughter. Expression of mRNA of SGLT1 was
evaluated using the real-time RT-PCR method. Changes in the SGLT1
mRNA expression in jejunum included initial increase – up to 12 d of life,
subsequential decrease – up to 19 d of life, and then increase again. The
amount of transcript for this transporter was significantly higher in the
jejunum of calves fed whole milk.
INTRODUCTION
Sodium-dependent glucose transporter type 1 (SGLT1) is
probably one of the most important member of the SGLT transporter
proteins family. It is expressed mostly in the brush border membrane in

44
mature enterocytes where it mediates also in the galactose transport
(Wright et al., 1994).
The objective of the study was to determine the effect of age and
the type of the liquid feed on the mRNA expression of SGLT1 in the
jejunum of neonatal calves.
MATERIAL AND METHODS
Thirty bull calves were randomly allocated to five experimental
groups (6 animals per group). Calves from group 1 were slaughtered
immediately after allocation to the trial at the age of 5 days. Calves from
the group 2, 3 and 4 were fed milk replacer and slaughtered at week
intervals (on 12., 19., 26. day of life, respectively). Calves from group 5
were fed whole milk and slaughtered at the 26. day of life. Groups 2, 3, 4
and 5 were offered starter mixture ad libitum during whole study period.
Tissues from the jejunum were collected subsequently to slaughter.
Expression of mRNA of SGLT1 was evaluated using the real-time RT-
PCR method. β-actin mRNA expression was used as a reference gene.
RESULTS AND DISCUSSION
Changes in the SGLT1 mRNA expression in jejunum included
initial increase – up to 12 d of life (P ≤ 0.05), subsequential decrease – up
to 19 d of life (P ≤ 0.10), and then increase again (Fig. 1). The amount of
transcript for this transporter was significantly higher in the jejunum of
calves fed whole milk (P = 0.03).
In the current study SGLT1 mRNA expression observed in the
jejunum increased during the first week of calves life. Such effect may be
the result of diet change, from the colostrum and whole milk to the milk
replacer, which contained the higher amount of lactose than whole milk.

45
Fig. 1. SGLT1 mRNA expression in relation to β-actin mRNA expression in the jejunum of calves
Subsequent decrease in the mRNA expression of this transporter
may be explained with the decreasing amount of glucose absorbed in the
intestines which is the natural process in the cattle and other ruminants. In
this context, so big amount of SGLT1 transcript in the group of calves fed
whole milk observed in this study is very surprising. The role of the
SGLT1 in this part of the gastrointestinal tract is not fully explained. It is
possible that apart from glucose and sodium it may transport other
molecules.
CONCLUSION
Expression of the mRNA of SGLT1 changes with age of calves
and the level of this expression is influenced by the type of liquid feed.
**
*
0
5
10
15
20
25
30
day 5 day 12 day 19 day 26 day 26
SGLT
1/A
CTB
Milk replacer
JejunumContrasts:L: P < 0.01Q: P = 0.05
Whole milk
P = 0.03

46
REFERENCE
Wright E. M., B. A. Hirayama, D. D. F. Loo, E. Turk, K. Hager, 1994.
Intestinal sugar transport. In: Johnson, LR (ed) Physiology of
gastrointestinal tract, 3rd Edn. Raven Press, New York p.:1751–1772.

47
NUTRITION OF HIGH-PREGNANT HEIFERS AND COWS AND
ITS INFLUENCE ON THE CONTENT OF TOTAL PROTEINS IN
THE SERUM OF CALVES
FRÖHDEOVÁ, M. – MLEJNKOVÁ, V. – LUKEŠOVÁ, K. –
DOLEŽAL, P.
Department of Animal Nutrition and Forage Production , Mendel
University in Brno
ABSTRACT
Our experiment included 14 breeding cows of the Czech Spotted
Cattle and their calves. The aim of the experiment was to evaluate
changes in the level of total proteins (TP) in the serum of heifers (H) and
cows (C) fed a uniform ration during the entire experimental period. The
level of total proteins in the serum was assessed in terms of age and blood
sampling time.
Mean TP values in the serum detected in the first samples taken
ca. 23 days prior to the parturition were 70.00 ± 5.12g.l-1 in heifers and
74.95 ± 4.14g.l-1 in cows. In the second sampling, which was made after
the parturition (+2), the values amounted to 72.01 ± 4.14g.l-1 in the first-
calf heifers and 74.78 ± 3.19g.l-1 in the other cows. TP level in the serum
of calves from the first-calf heifers and from the cows on higher lactations
was 56.71 ± 6.56g.l-1 and 62.92 ± 6.83g.l-1, respectively. The detected
dependence was y = 0.643x + 26.799 (R2 = 0.7393), which suggests that
the level of total proteins in the serum of breeding cows before the
parturition significantly (P≤0.05) affected also the TP level in the
breeding cows after the parturition.
Keywords: Red Spotted Cattle, total protein, blood serum, calves

48
MATERIAL AND METHODS
The aim of our experiment was to establish total proteins in the
first-calf heifers, cows and subsequently in their calves, and to
demonstrate dependences in the samples. The establishment of TP can tell
more about the health condition of the individual and suggest the
existence of abnormalities. The research included two age groups of
breeding cows of the Czech Spotted Cattle and their calves. The groups of
breeding cows received an identical feeding ration (Tab. 1) and (Tab.2).
The content of nutrients in the feeding ration was calculated from tabular
values. Calves were fed according to the principles of good feeding and
rearing. Each group consisted of 7 animals in the respective age category.
The breeding cows’ blood was sampled from the vena coccygea
ca. 23 days before the parturition and on the second day after the
parturition. The blood of calves was sampled 3-5 days after birth from the
vena jugularis. The blood samples were brought to a laboratory where the
blood serum was separated on the laboratory centrifuge at 3500 rpm for
10 minutes. The values of total proteins were established in the laboratory
photometrically by using the biuret reaction. The obtained results were
statistically evaluated by using Microsoft Excel and Statistica programmes
according to methods described by SNEDECOR and COCHRAN (2012).
Table 1: Composition of feeding ration in the original mass for breeding
cows
Fodder kg brewer’s grains 2
meadow hay 2 maize silage 6
alfalfa-grass haylage 18

49
Table 2: Characteristics of dry matter in the ration for cows
Nutrients Units of measure NEL 64.54 MJ NEL/day
DM/NEL 176.94 g DM/MJ NEL PDIE/NEL 13.54 g PDIE/MJ NEL PDIN/NEL 14.86 g PDIN/MJ NEL NL/NEL 24.49 g NL/MJ NEL
RESULTS AND DISCUSSION
Basic statistical indicators expressing the values of total proteins
in the first and second blood samples and in the blood samples of calves
are presented in Tab. 3 below:
Table 3: Selected statistical data
Heifers Cows H - H +2 H C - C +2 C
Number 7 7 7 7 7 7 Mean 70.0 72.0 56.71 74.95 74.7 62.92
Standard deviation 5.12 4.14 6.56 4.14 3.19 6.83 Standard errors of the 5.53 4.47 7.09 4.47 3.44 7.38
Note: -23 = 23 days prior to the parturition, +2 = 2 days after the
parturition
Mean TP values in the heifers were 70.00g.l-1 in the blood sample
taken ca. 23 days before the parturition and 72.01g.l-1 in the blood sample
taken two days after the parturition. Mean TP values in the calves of the
first-calf heifers were 56.71g.l-1 and were lower than the values found in
the calves from the cows. By contrast, mean TP values in the cows were
74.95g.l-1 in the first sample and 74.78g-l-1 in the second sample. Mean TP
value of calves from the cows on higher lactations were 62.92g.l-1.
TP values mentioned by various authors for adult animals
considerably differ sometimes. Therefore, each reference laboratory

50
should establish minimum and maximum values for healthy animals for
the use of standard procedures in that particular laboratory (BÁRTA et al.,
2008). Some works mention a range from 60-74g.l-1 (BÁRTA et al., 2008)
and some other state a range from 65-85g.l-1 (e.g. DVOŘÁK et al., 2005);
RADOSTITS et al. (2007) mentions a narrower range from 60-70g.l-1. On
the other hand, a wider range (74±9g.l-1) is mentioned in BOUDA and
JAGOŠ (1979).
The TP value can be increased because of dehydration of the
organism and during chronic inflammatory processes (DVOŘÁK et al.,
2005). Another reason for the increased TP level can be parasitic or
combined infections, myeloma and auto-immunity disorders (BÁRTA et
al., 2008).
A decreased TP level can indicate long-term starvation
(DVOŘÁK et al., 2005) or a liver disease, loss of proteins due to
glomerulonephritis, IgG deficiency or food digestion and absorption
disorders (BÁRTA et al., 2008).
A work discussing metabolism disorders in calves (PAVLATA et
al., 2012) informs of mean TP values detected on 23 farms to be 56.20g.l-
1, which corresponds with the values measured in our experiment in calves
from the first-calf heifers but not in calves from the cows on higher
lactations. In their work, PODHORSKÝ et al. (2007) mention the
measured average TP values at 53.63g.l-1. That level was exceeded by
both the calves from the first-calf heifers and by the calves from the cows
on higher lactations. According to BÁRTA et al. (2008), healthy new-
borns should reach 60-80% of the value of adult animals. Then the level
of proteins gradually increases until sexual maturity. According to
ŠLOSÁRKOVÁ et al. (2011), the lower TP boundary for calves is 55g.l-1,
which corresponds to a sufficient supply of colostral substances in the
calf. The calves after the first-calf heifers reached the values of 61.6 ±
10.27g.l-1 and the calves after the cows on higher lactations reached the

51
values of 65.3 ± 13.86g.l-1. Compared with these results we can state that
the calves in our experiment exhibited sufficiently high TP levels. No
statistically significant difference was found after the division of the
calves’ serum samples according to parity.
We investigated also the influence of the TP level in the serum of
breeding cows before the parturition on the TP level in the serum after the
parturition (Fig. 1). Our research results suggest that the TP level in the
serum of the breeding cows before the parturition significantly (P˂0.05)
affected the TP level in the serum of the breeding cows after the
parturition (y = 0.643x + 26.799 (R2 = 0.7393)).
Fig. 1: Influence of total proteins before parturition on the TP level after
parturition in heifers and cows
Further, we explored the influence of the level of total proteins in
the serum of breeding cows before the parturition on the level of total
proteins in the serum of calves. The above-described dependence shows
that the relation between the TP level in the serum of cows after the
parturition and the TP level in the serum of calves was not statistically
significant – see Fig. 2.
Influence of total proteins before parturition on the TP level after parturition in heifers and cows
y = 0,643x + 26,799R2 = 0,7393
(linear)
y = -0,0108x2 + 2,1955x - 28,535R2 = 0,7502
(polynomial)60
70
80
90
55 60 65 70 75 80 85
TP in heifers and cows before parturation [g/l]
TP in
hei
fers
and
cow
s af
ter
part
urat
ion
[g/l]
heifers+cows heifers+cows (linear) heifers+cows (polynomial)
52
Fig. 2: Influence of total proteins before parturition on the TP level in
calves
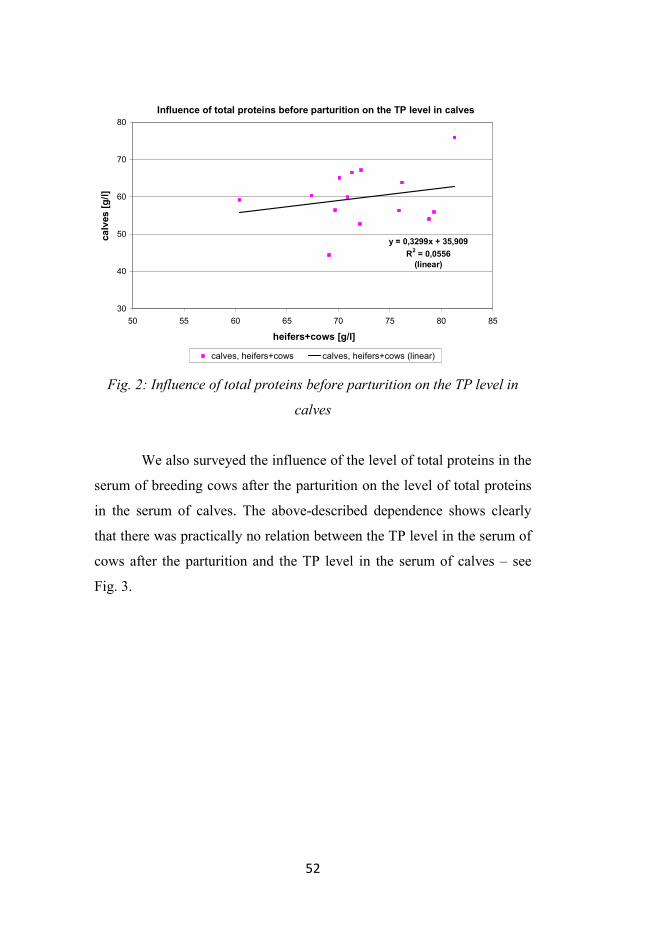
We also surveyed the influence of the level of total proteins in the
serum of breeding cows after the parturition on the level of total proteins
in the serum of calves. The above-described dependence shows clearly
that there was practically no relation between the TP level in the serum of
cows after the parturition and the TP level in the serum of calves – see
Fig. 3.
Influence of total proteins before parturition on the TP level in calves
y = 0,3299x + 35,909R2 = 0,0556
(linear)
30
40
50
60
70
80
50 55 60 65 70 75 80 85
heifers+cows [g/l]
calv
es [g
/l]
calves, heifers+cows calves, heifers+cows (linear)

53
Fig. 3: Influence of total proteins in the serum of breeding cows after
parturition on the TP level in calves
CONCLUSION
It was confirmed in our experiment that the TP level in adult
animals should range about 75g.l-1. The detected TP values were 70.00 ±
5.12g.l-1 (H -23) and 72.01 ± 4.14g.l-1 (H +23). The average increase in
heifers during the experiment was by 2g.l-1. In cows on higher lactations,
no change of the parameter was recorded. The values of total protein were
higher in the cows; however, no significant difference was found between
the heifers and the dairy cows on higher lactations. The mean TP value of
calves after the first-calf heifers was 56.71 ± 6.56g.l-1 and the mean TP
value of calves after the cows on higher lactations was 62.92 ± 6.83g.l-1.
Compared with the latest discussed results we can claim that the TP levels
of calves in our experiment were sufficiently high.
Acknowledgement: The project was supported by IGA MENDELU Brno
No IP 20/2012.
Influence of total proteins in the serum of breeding cows after parturition on the TP level in calves
y = 0,6258x + 13,887R2 = 0,1119
(linear)
y = 0,0573x2 - 7,6482x + 311,62R2 = 0,1285
(polynomial)
30
40
50
60
70
80
60 62 64 66 68 70 72 74 76 78 80
heifers+cows [g/l]
calv
es [g
/l]
calves, heifers+cows calves, heifers+cows (linear) calves, heifers+cows (polynomial)

54
REFERENCES
• Bárta Ota, Codner Ellen C., Pickett J. P., Shell L. G. (2008):
Veterinary Clinical Imunology (in Czech). CERM, ISBN 978-80-7204-
553-2, 322 pp.
• Bouda J., Jagoš P. (1979): Proteins and enzyme activities in the
blood of cows in late pregnancy and in their foetuses. Acta Veterinaria,
48: 15-18.
• Dvořák R. et al. (2005): Cattle nutrition from the viewpoint of
production and preventive medicine (in Czech). Clinic of ruminant
diseases FVL VFU Brno, ISBN 80-86542-08-4, 117 pp.
• Pavlata L., Podhorský A., Pechová A. (2012): Metabolic disorders
in calves as a cause of their increased morbidity (in Czech). Veterinářství,
62(5): 307-311.
• Podhorský A., Pechová A., Dvořák R., Pavlata L. (2007):
Metabolic disorders in dairy calves in postpartum period. Acta Veterinaria
Brno, 76: 45-53.
• Radostits O. M. et al. (2007): Veterinary medicine: a textbook of
the diseases of cattle, horses, sheep, pigs, and goats. Saunders Elsevier,
2156 pp.
• Snedecor, G W., Cochran, W.G. (2012): Snedecor and Cochran's
Statistical Methods, 6. vyd., Blackwell Pub, ISBN 978-0813808642, p.
576.
• Šlosárková S., Fleischer P., Pěnkava O., Skřivánek M. (2011):
Securing colostral immunity in the newly born calves of dairy cattle and
verifying its level in breeding and veterinary practice. Certified
methodology. (in Czech). University of Veterinary and Pharmaceutical
Sciences Brno, ISBN 978-80-7305-601-8, 24 pp.

55
PLANT EXTRACT WITH ANTI-HYPERURICEMIC ACTIVITY
IN RATS
FRUBLINGOVA, L. – HAVLIK, J. – DOSKOCIL, I. – PLACHY, V.
– STANKOVA, L.
Department of Microbiology, Nutrition and Dietetics, Faculty of
Agrobiology, Food and Natural Resources, Czech University of Life
Sciences Prague.
ABSTRACT
Xanthine oxidase inhibitory activity and hypouricemic activity of
black poplar (Populus nigra L.) buds ethanolic extract in hyperuricemic
rats model was evaluated. Poplar buds are rich sources of flavonoid
glycosides and their use in traditional anti-gout therapy has been recorded
in central Europe. The extract was administered to hyperuricemic rats in
concentrations of 100 and 500 mg/kg for 3 consecutive days. Allopurinol
(10 mg/kg), was used as a reference drug. Uric acid in urine and serum
urate were determined at the end of the experiment. Moreover, xanthine
oxidase and xanthine dehydrogenase activities were determined in the
liver homogenate.
Poplar extract in concentration 500 mg/kg significantly (P < 0.05)
reduced serum urate levels in rats by 27% compared to hyperuricemic
control group which was an effect similar to that of allopurinol at a dose
10 mg/kg. Liver xanthine oxidase activity was not different in the poplar
group vs. control, but was expectedly significantly lower in the allopurinol
group.
In conclusion, P. nigra ethanolic extract reduced serum urate
levels in rats after oral administration but was devoid of direct XO in vivo
inhibitory action.

56
Key words: Xanthine oxidase, hypouricemic effect, hyperuricemia, gout,
enzyme inhibition, Populus nigra, black poplar extract
INTRODUCTION
Gout is an inflammatory disease caused by impairment of uric
acid metabolism and consequent deposition of sodium urate crystals in
joints (Richette and Bardin, 2010). Uric acid (UA) present in plasma in
form of a monosodium urate (SU), is the end product of purine
metabolism in human and its concentrations in plasma is maintained near
its solubility limits of 0.42 mmol/L. Unlike in human, most other species
further metabolize UA to allantoin which is easily excreted. However, in
analogy to human, some other species such as snakes or dalmatian breed
dogs may develop gout.
Search for natural extracts inhibiting xanthine oxidase among
traditional herbal medicinal products or common dietary sources is of
recent scientific interest as xanthine oxidase is not just a therapeutic target
in hyperuricemia, but also as a mediator of cardiovascular disease or a
potential pro-oxidative enzyme, generator of reactive oxygen species
under various pathological conditions (George and Struthers, 2008).
The aim of our study was to evaluate, if the black poplar buds
extract has the potential to inhibit the xanthine activity in vivo or
positively influences renal exretion of uric acid. Despite its use in
traditional medicine and reports on potent in vitro activity, its potency in
vivo remains unknown.
MATERIALS AND METHODS
The experiment was performed according to (Vogel, 2008). Male
Wistar rats weighing 150 g were distributed into five groups (each either 6
or 12 individuals, see table 1) and were offered a standard ST-1 diet
(Velaz, CZ) enriched with 3% dried yeast for 2 days prior to the

57
experiment to get accustomed to the experimental conditions. Out of five
groups, four recieved 2.5% potassium oxonate in food and 0.5% in wate
to induce experimental hyperuricemia. The fifth group was maintained
without potassium oxonate, serving as a normouricemic control group
(N). Starting from day 3 to day 5, hyperuricemic rats started receiving
experimental diet (Table 1), also based on a standard diet enriched with
3% yeast. Three intervention groups recieved 100 and 500 mg of extract
(P-100 and 0-500) or 10 mg of allopurinol (A-10) per 1 kg of body
weight. One group was left as a hyperuricemic control (H). An overview
of complete dietary composition and number of animals in each group
may be seen in Table 1. Daily feed intake of animals averaged 15 g. They
were maintained at a 12 h light/dark cycle at 23°C and water and food
were available ad libitum. The experiment was terminated at day 5.
Table 1. Composition of diet and water fed ad libitum for each experimental group (g/kg)
N H A-10 P-100 P-500 n=12 n=12 n=6 n=6 n=6 Diet ST-1 standard diet 945 945 945 944 940 Dried yeast 30 30 30 30 30 Potassium oxonate - 25 25 25 25 Allopurinol - - 0.1 - - EtOH poplar extract - - - 1 5 Water Potassium oxonate - 5 5 5 5 P-100 (100 mg/kg P. nigra extract daily); P-500 (500 mg/kg P. nigra extract); A-10 (10 mg/kg allopurinol); N, normouricemic control; H, hyperuricemic control.
Urine was collected each experimental day. At day 5 animals
were aenestized using diethyl ether. Liver was excised and stored at –
80°C immediately after collection. Blood was allowed to clot for 1 h at
room temperature and serum was centrifuged at 2,500 × g and analyzed

58
immediately. Urine from day 5 was used for the analyses after filtration.
Both serum urate and uric acid in urine were determined by colorimetric
coupled uricase method (Dialab, CZ) on an Architect c16000 automated
immunochemistry system (Abbott Diagnostics, IL, USA).
Frozen liver was homogenized and xanthine oxidase (XO) and
xanthine dehydrogenase (XDH) activities were determined in the
homogenate spectrophotometrically using xanthine solution as substrate
(Havlik et al., 2010). For determination of XDH activities, 0.2 mM NAD+
was present in the assay mixture. Blank, negative control (ultrapurified
water instead of the inhibitor) and positive control were assayed for each
sample set.
All data were expressed as the mean ± standard error of the mean
(S.E.M.) and statistical analysis was performed with an analysis of
variance followed by Newman-Keuls test using a Statistica software
(Statsoft CR, CZ). The results were considered significant at P < 0.01,
P < 0.05 and P < 0.001 as mentioned.
RESULTS AND DISCUSSION
In hyperuricemic groups, SU levels were significantly elevated
compared to normouricemic group and thus, potassium oxonate
administration was shown to be a good model for inducing animal
hyperuricemia. Administration of both reference allopurinol at 10 mg/kg
and poplar extract at 500 mg/kg reduced uricemia from 197.3 µmol/L to
149.7 and 144.0 µmol/L (P < 0.01), thus showing a decrease of 24 and
27%. However, the decrease was still significantly different from the
normouricemic group (86.8 µmol/L) (table 2).
Lower dose of poplar extract of 100 mg/kg showed a low not
significant decrease of SU by 9%. In urine, no significant difference has
been observed, however, a trend towards higher urate excretion has been

59
observed when considering the cummulated urine data from previous days
(data not shown).
Table 2. Uric acid/urate levels in collected urine and urate in blood serum
after 3-day administration of ethanolic extract from P. nigra buds.
N H A-10 P-100 P-500 Serum urate (µmol/L) 86.8 ± 7.0 197.3±14.3* 149.7 ± 15.2*,# 180.3 ± 10.7* 144.0±16.7*,#
Urine UA (mmol/L) 0.89 ± 0.15 0.10 ± 0.03* 0.08 ± 0.02* 0.10 ± 0.04* 0.15 ± 0.06*
#, different vs. hyperuricemic control (#P < 0.05); *, different vs. normouricemic control (*P < 0.01) as calculated using Newman-Keuls posthoc test; values represent Means ± S.E.M.
There was no effect of administration of poplar extract on liver
XO/XDH. Both poplar concentrations maintained liver XO activity at
102–109% activity of hyperuricemic control. The only significant effect
was seen expectedly in allopurinol group (Table 3).
Table 3. XO and XDH activities in rat liver homogenate after 3-day administration of ethanolic extract from P. nigra buds.
Treatment Liver enzyme activity XO XDH
Mean ± S.E.M. Activitya Mean ± S.E.M. Activitya N 1.28 ± 0.06 - 1.18 ± 0.05 - H 1.29 ± 0.10 - 1.26 ± 0.14 - A-10 0.63 ± 0.21** 49 0.69 ± 0.18** 55 P-100 1.40 ± 0.06 109 1.29 ± 0.08 102 P-500 1.31 ± 0.10 102 1.43 ±0.06 113 P-100 (100 mg/kg P. nigra extract daily); P-500 (500 mg/kg P. nigra extract); A-10 (10 mg/kg allopurinol); N, normouricemic control; H, hyperuricemic control; n=6 (12 for N, H). a vs. hyperuricemic control; * P < 0.001; values in mU/g liver mass.
Our experiment showed, that although poplar buds extract has
been previously shown to be an excellent inhibitor in vitro (Havlik, 2010),

60
it was devoid of the same activity in vivo. However, its administration
reduced serum urate in experimental hyperuricemic rats in a dose-
dependent manner in the range of 100-500 mg/kg body weight, probably
due to some effect on renal tubular transport proteins. Similar effects have
been reported in other studies evaluating hypouricemic and XO-inhibitory
effects of flavonoid-rich foods and medicines in rats or mice. Feeding
quercetine derivatives-rich onion or artychoke extract showed has led to
similar conclusion (Haidari et al., 2008; Sarawek et al., 2008). It can thus
be concluded, that flavonoid-based drugs or food/feed supplements may
lead to reduction uricemia, however, the mechanism is different from
inhibition of XO/XDH as seen in vitro.
CONCLUSION
Administration of P. nigra buds ethanolic extract to
hyperuricemic rats at concentrations 100 and 500 mg/kg exhibits a
moderate hypouricemic effect, however, this effect is not based on
xanthine oxidase inhibition.
REFERENCES
George, J., Struthers, A.D., 2008. The role of urate and xanthine oxidase
inhibitors in cardiovascular disease. Cardiovascular Therapeutics 26, 59-
64.
Haidari, F., Rashidi, M. R., Eshraghian, M. R., Mahboob, S. A., Shahi, M.
M., Keshavarz, S. A., 2008. Hypouricemic and antioxidant activities of
allium cepa lilliaceae and quercetin in normal and hyperuricemic rats.
Saudi Medical Journal 29, 1573-1579.
Havlik, J., de la Huebra, R. G., Hejtmankova, K., Fernandez, J.,
Simonova, J., Melich, M., Rada, V., 2010. Xanthine oxidase inhibitory
properties of Czech medicinal plants. Journal of Ethnopharmacology 132,
461-465.

61
Richette, P., Bardin, T., 2010. Gout. The Lancet 375, 318-328.
Sarawek, S., Feistel, B., Pischel, I., Butterweck, V., 2008. Flavonoids of
cynara scolymus possess potent xanthinoxidase inhibitory activity in vitro
but are devoid of hypouricemic effects in rats after oral application. Planta
Medica, 74, 221-227.
Vogel, H.G., 2008. Drug discovery and evaluation: Pharmacological
assays, 3rd completely rev., updated, and enl. ed. Springer, Berlin; New
York.

62

63
COMPARISON ENERGY PREDICTION OF SILAGE USING
DETERGENT FRACTIONS OF FIBER OR DETERGENT FIBER
DIGESTIBILITY
HLAVÁČKOVÁ, A., PLACHÝ, V., KODEŠ, A., MUDŘÍK, Z.
Department of Microbiology, Nutrition and Dietetics, Czech University of
Life Sciences Prague
ABSTRACT
It was compared prediction net energy of lactation (NEL),
depending on the content of neutral detergent fiber (NDF) and its
digestibility (NDFD). Was determined neutral detergent fiber method
according to Van Soest and digestibility of neutral detergent fiber in vitro
enzymatic method on the unit Ankom DaisyII Incubator. Were used in the
analysis of samples of corn silage and legume silage. Regression
coefficients in all cases showed a very strong dependence on legume
silage but were lower. Average content of NDF in corn silage was 401.6
g.kg-1 and legume silage 442.5 g.kg-1. The average value of corn silage
NDFD was 26.85% and 29.94% for grass silage. Vencl equation were
calculated according to the average energy value of corn silage and
legume silage 6.39 MJ.kg-1 and 6.01 MJ.kg-1 respectively. Values are
given in dry matter. This phenomenon is probably caused by the very
different contents of crude protein. For practical use, it would be better to
use NDF as it is faster and simple analysis.
MATERIAL AND METHODS
The aim of the study was to compare the prediction possibilities
net energy of lactation for two types of roughage, depending on the
content of neutral detergent fiber and its digestibility.

64
The samples of forages, analyzed in this study, included samples
of corn silage (n=10) and silage from legumes (n=9) were randomly
selected from dairy farms in the Czech Republic. Samples with higher
moisture content were lyofilized (Jouan LP3). Samples were grind in a
grinder Cyclotec Sample Mill passing a 1- mm screen.
All samples were analysed in duplicate for dry matter (DM), ash,
crude protein (CP), and ether extract (EE) according to the procedures
outlined by the Commission regulation (EC) No 152/2009. For mineral
estimation dried sample was ignited in a muffle furnace at 550 °C for 4 h.
Neutral and acid detergent fibre were determined with the
ANKOM Fiber analyzer 220 (ANKOM Technology Corp., Fairport, NY),
is presented ash-free and detergent analysis was not done in the sequential
mode. For NDF determination was added to the solution sodium sulphite
and heat stable α – amylase (ANKOM Alpha-Amylase). For the NDF
analyses were used filter bags (ANKOM F57, 25 μm, ANKOM
Technology Corp., Fairport, NY), 0.5 g samples were weighed into
individual pre-weighed and numbered filter bags which were then heat
sealed.
For the in vitro digestibility of neutral detergent fiber (NDFD)
were used ANKOM F57 filter bags (ANKOM Technology Corp.,
Fairport, NY), 0.25 g samples were weighed into individual pre-weighed
and numbered filter bags which were then heat sealed. Heat seal bags
closed were placed into the DaisyII Incubator (ANKOM Technology
Corp., Fairport, NY). In vitro digestibility analyses were conducted for 48
h using DaisyII Incubator system and enzymatic method.
Net energy of lactation (NEL) was calculated by Vencl (Table 1).
Data were statistically analyzed in Statistica 9 (StatSoft Inc.). It
was performed basic statistical analysis and regression analysis and
correlation.

65
Table 1. Net energy of lactation was calculated according formula
(Sommer et al. 1994):
RESULTS AND DISCUSSION
Table 2 lists mean values, ranges and standard error of the mean
for chemical composition, energy value and in vitro digestibility of the
corn silage and lemuge silage.
Vencl NEL = ME . (0.463 + 0.24
(ME/BE))
BE = 0.00588 .CP + 0.01918 . OM
ME = 0.00137 . CPD + 0.01504 .
OMD
NEL - Net energy of lactation (MJ.kg-1)
BE - Bruto energy (MJ.kg-1)
ME – Metabolizable energy (MJ.kg-1)
CP - Crude protein (g.kg-1)
CPD - Crude protein digestibility ( g.kg-1)
OM - Organic matter (g.kg-1)
OMD - Organic matter digestibility (g.kg-1)

66
Table 2. Chemical composition (g.kg-1), digestibility (%) and energy value
(MJ.kg-1) of the corn silage and legume silage
Items Corn silage Legume silage n= 10 n= 9 Mean Range SEM Mean Range SEM Dry matter * (DM) 313.2 194.6– 1.83 290.9 231.6- 1.67 Crude protein (CP) 76.5 64.3– 0.24 187.5 156.3- 0.83 Ether extracts (EE) 31.4 28.3– 0.08 29.6 24.6- 0.08 Neutral detergent 401.6 341.1– 1.52 442.5 324.3- 1.80 Ash 40.3 31.7- 0.22 109.7 84.3- 0.54 Neutral detergen 26.85 21.82- 1.46 29.94 19.34- 2.49 Net energy of 6.39 5.22- 1.46 6.01 4.69- 0.32 The nutrient content is given in 1 kg-1 of dry matter.
Graph 1. Relationship between NDF content and NEL in corn silage
32 34 36 38 40 42 44 46 48 50
NDF (%)
5,0
5,2
5,4
5,6
5,8
6,0
6,2
6,4
6,6
6,8
7,0
7,2
7,4
NE
L (M
J/kg
)
NDF:NEL: y = 11.205 - 0.1199*x;r = -0.9664; p = 0.00001; r2 = 0.9339

67
Graph 2. Relationship between NDFD content and NEL by corn silage
Graph 3. Relationship between NDF content and NEL in legume silage
27 28 29 30 31 32 33 34 35 36 37
NDFD (%)
5,0
5,2
5,4
5,6
5,8
6,0
6,2
6,4
6,6
6,8
7,0
7,2
7,4
NE
L (M
J.kg
-1)
NDFD:NEL: y= 1.9411 + 0.1399*x;r= 0.6516; p= 0.0412; r2 = 0.4245
30 32 34 36 38 40 42 44 46 48 50 52
NDF (%)
4,5
5,0
5,5
6,0
6,5
7,0
7,5
8,0
8,5
NE
L (M
J/kg
)
NDF:NEL: y = 12.5766 - 0.1484*x;r = -0.8485; p = 0.0038; r2 = 0.7200

68
Graph 4. Relationship between NDFD content and NEL by legume silage
CONCLUSION
Most energy value are predicted from fiber analyses because fiber
is negatively related to the animal´s ability to digest and use nutriet in the
feed (Undersander et al., 1993). Most commercial laboratories estimate
energy content of feeds using regression equations that are based on the
negative relationship between ADF concentration and available energy
(Beauchemin, 1996). For the various groups of forages were developed
equations for predicting energy value (Undersander et al., 1993). In the
Czech Republic is used to estimate the energy content of forages the
regression equation according to Vencl, which is listed in the publication
from Sommer et al. (1994).
The mean value of NDF corn silage was 313.2 g.kg-1 and range
was from 194,6 – 432.4 g.kg. For legume silage was calculated mean
value 290.9 g.kg and 231.6 – 371 g.kg of range of values.
Mean value of NDFD by corn silage was 26-18.5 g.kg-1 and range
was from 218.2 – 364 g.kg. By legume silage was detected mean value of
NDFD 299.4 g.kg-1 and range of values was 193.4 – 409 g.kg-1.
18 20 22 24 26 28 30 32 34 36 38 40 42
NDFD (%)
4,5
5,0
5,5
6,0
6,5
7,0
7,5
8,0
8,5
NE
L (M
J/K
G)
NDFD:NEL y = 2.7313 + 0.1096*xr = 0.8649; p = 0.0026; r2= 0.7480

69
NEL content was calculated according Vencl (Sommer et al.,
1994) for corn silage in the range from 5.22 to 7.24 MJ.kg-1 DM and for
silage from legumes from 4.69 to 7.89 MJ.kg-1 DM. Average calculation
values of NEL were by corn silage 6.88 MJ.kg and for legume silage 5.69
MJ.kg-1 respectively.
This study confirms the existence of high variability in forage
quality among and within forage types, as described in the NRC (2001).
Average values for the content of fibrous fractions of corn silage and
silage from legumes were lower than stated in the NRC (2001) and in
Catalog of feeds (Zeman et al., 1995). When comparing the regression
coefficients (NEL : NDF x NEL : NDFD) were found almost the same
value in both types of silage. In relation NEL: NDF regression coefficient
was slightly higher than in relation NEL: NDFD. This was true for corn
silage. For legume silage that was reversed.
When comparing the regression coefficients (NEL : NDF x NEL :
NDFD) were found almost the same value in both types of silage. In
relation NEL : NDF regression coefficient was slightly higher than in
relation NEL : NDFD. This was true for corn silage. The protein silage it
was vice versa.
The regression coefficient for NDF (r = - 0.966) of corn silage
(Graph 1) was greater than that of legume silage (r = - 0.849) (Graph 3).
The same was true even coefficients related to NDFD (corn silage: r =
0.652; alfalfa silage: r = 0.865) (Graph 2; 3). When comparing the content
of NDF and NEL, found a very strong correlation dependence. This fact
applied for both types of silage. Mean difference was found when
comparing the content of and NDFD NEL as well in both types of silage.
Therefore, it appears advantageous in terms of energy use prediction of
neutral detergent fiber content. In all cases, however, one can speak of a
very strong dependence. These differences were probably caused by the

70
difference in crude protein content. In practice, it would be better use
prediction using NDF, because it is faster and less demanding on the
equipment.
This study was financed by the project CIGA ID No. 20112024 of the
Czech University of Life Sciences Prague in the Czech Republic.
REFERENCE
Beauchemin K.A. 1996: Using ADF and NDF in dairy cattle diet
formulation-a western Canadian perspective, Animal Feed Science
Technology 58: 101-111
Comission regulation (EC) No. 152/2009: http://eur-
lex.europa.eu/LexUriServ/LexUriServ.do?uri=OJ:L:2009:053:0008:0012:
EN:PDF
National Research Council, 2001: Cutrient requirements of dairy cattle.
7th rev. ed. Natl. Acad. Sci., Washington, DC.
Sommer A., Čerešňáková Z., Frydrych Z., Králík O., Králíková Z., Krása
A., Pajtáš M., Petrikovič P., Pozdíšek J., Šimek M., Třináctý J., Vencl B.,
Zeman L., 1994: Potřeba živin a tabulky výživné hodnoty krmiv pro
přežvýkavce. VÚVZ Pohořelice, s. 198, ISBN 80-901598-1-8
Undersander D., Mertens D.R., Thiex N., 1993: Forage analyses,
procedures. National Forage Testing Association,
http://www.foragetesting.org/files/LaboratoryProcedures.pdf
Zeman L., Šimeček K., Krása A., Šimek M., Lossmann J., Třináctý J.,
Rudolfová Š, Veselý P., Háp I., Doležal P., Kráčmar S., Tvrzník P.,
Michele P., Zemanová D., Šiške V., 1995: Katalog krmiv, vyd.1., s. 465,
ISBN 80-901598-3-4

71
THE EFFECT OF ORGANIC CHROMIUM SOURCE ON THE
QUALITY EJACULATE WITH BOARS
HORKÝ, P. - ZEMAN, L.
Department of Animal Nutrition and Forage Production, Faculty of
Agronomy, Mendel
University in Brno, Zemědělská 1, 613 00 Brno, Czech Republic
E-mail: [email protected]
ABSTRACT
The experiment was based on feeding organic form of chromium
(picolinate) and its influence on changes of laboratory sperm values
(sperm motion, volume ejaculate, concentration of sperms, percentage of
pathological sperms and total count of sperms) by breeding boars. There
were given 20 boars (Duroc) who were divided into two similar groups.
The chromium dose was not got higher to control group (n = 9) of boars.
The experimental group (n = 11) was fed on 181.8 µg/kg of chromium
dose in feeding mixture orally.
The experiment was dividend into 4 periods and lasted in total 95
d. The total count of sperms by the end of the experiment was decreased
by 20.3 bill in the experimental group (P < 0.05) and by 12.3 bill of
sperms in control group in comparison to the beginning of the trial. This
decrease was cause rather by effect of period than by the chromium
supplementation. Concentration sperm was reduced by 43.1 ths/mm3 in
the experimental group and 15.7 ths/mm3 by control group. Sperm
motility was the experimental and control groups boars practically without
difference. Ejaculate volume was reduced by 18.2 ml in the experimental
group and 11.4 ml in the control group of animals. The percentage of

72
pathological spermatozoa was higher in the experimental group boars by
0.4%, while the control group of animals had a reduced percentage of
pathological spermatozoa by 1.7%. The increase of chromium level did
not have direct influence on these parameters.
Key words: boars, ejaculate, chromium picolinate
INTRODUCTION
Chromium (Cr) as an essential trace element in animal nutrition
(Schwarz and Mertz, 1959; cit., Underwood and Suttle, 1999) is
indispensable for normal carbohydrate (Mertz, 1975; Amoikon et al.,
1995; Evock-Clover et al., 1993), lipid (Balk et al., 2007; Cefalu and Hu,
2004; Uusitupa et al., 1992) and protein metabolism (Evans and Bowman,
1992; Roginksi and Mertz, 1969). Cr increases the effect of insulin, the
count of insulin receptors on the cell surface and the sensitivity of cells to
insulin (Anderson, 1997; Anderson, 1998) by which means the cell
absorption of blood glucose increases (Mooradian and Morley, 1987). The
demand for Cr increases under conditions of higher stress – e.g. during
fatigue, injury, reproduction load, various forms of metabolic, physical
and emotional stress as well as effects of the environment (Anderson,
1994; cit., Anderson, 1997; Wright et al., 1994; Lindemann, 1999). At
present a legislative ban has been imposed in EU countries on the
administration of Cr (Pechová and Pavlata, 2007).
Up to the present time, research activities exploring the effect of
chromium on the reproductive ability of pigs have been successfully
performed with sows (Lindemann et al. 1995; Page et al., 1993; Amoikon
et al., 1995). The objective of the present study was to determine if the
recommended daily rate of chromium had a direct impact on the changes
in the laboratory values of the ejaculate of breeding boars.

73
MATERIAL AND METHODS
The experiment was conducted at the boar insemination station
(BIS) in Velké Meziříčí and involved breeding boars divided into two
groups (experimental and control). The were used for the experiment
breed Duroc. The experimental animals were housed in individual boxes
(2.5 x 2.5 m) and had ad-libitum access to water. The boars ware 1 to 3
years old and average weight of boars was 300 kg).
All the animals were fed 3.3 kg of the basic feed ration (Tab. I)
containing 62 µg of Cr per kg. The total uptake of Cr by boars of the
control group (n = 9) was 205 µg/day, what is only 31 % of the
recommended daily supply according to Close and Cole (2003). In
addition to that boars of the experimental group (n = 11) received
organically bound chromium applied per orally as chromium picolinate in
the form of pills at a rate of 181.81 µg per kg of the feed mixture. These
pills were administered during morning feeding. Boars were fed twice
daily.
To demonstrate spermatogenesis (ca 42 days) the experiment was
established to last 95 days. Monitoring was commenced in the first half of
December 2010 and was terminated in mid-March 2011. The experiment
was divided into four periods lasting 18, 31, 28 and 18 days, respectively.
Samples of boars’ sperm were taken according to the current demands for
the production of insemination doses considering the health condition and
age of the boar; minimally 3 times a month. The veterinarian monitored
the health condition of the animals.
Macroscopic and microscopic evaluation of the ejaculate was
performed in the laboratory of the insemination station. The ejaculate
volume was assessed using a graduated cylinder. Sperm motility was
determined microscopically within 15 minutes of sampling using sperm
that had been gently stirred. The evaluation of motility was done by
microscopic method. Subjectively it was assessed straight forward

74
movement behind head. Sperm concentration was determined by
photometry using the Spekol 11 instrument. The per cent of pathological
sperm was determined microscopically from the first sampling in the
month. Chromium content in the diet was determined with atomic
absorption spectrometry ContrAA 700 – wavelength: 357.868 nm
(ANALYTIK JENA, Germany).
The results were evaluated statistically using the Statistika
programme and the differences between the means were evaluated by
Student’s t – test.
Tab. 1. The composition of the feed ration for boars (dry matter 88 %)
Component % in feed ration
Barley grain Wheat grain Oat grain SBM (soybean meal) EKPO T BergaFat Calcium carbonate Monodicalciumphosphate Mineral vitamin premix for boars Sodium chloride Magnesium oxide L-Lysine HCl L - Threonine Methionine DL
36.00 20.36 20.00 14.50 3.00 2.10 1.50 1.20 0.50 0.40 0.15 0.14 0.09 0.06
Bergafat (Berg + Schmidt, Germany) – palm oil; EKPOT (Delika-Pet, Czech Republic) – biskvit meal

75
RESULTS
In an experiment conducted with 20 boars it was observed that
feeding the organic form of chromium had an impact on changes in
laboratory values of the ejaculate of breeding boars.
During the experiment we collected data from laboratory
evaluations of the ejaculate of boars. Tab. II shows the average value of
the monitored parameters, their standard deviations and statistical
correlations. From the table it is evident that the intervention into the feed
ration of the boars did not significantly change of the sperms motility,
ejaculate volume, sperm concentration and pathological sperms. However,
the total count of sperms was significantly reduced by 17.2 % (P < 0.05).
This decrease was probably affected to the influence of different periods.
76
Tab. II. Representation of changes in laboratory values of the boar ejaculate
Period Skupina Average number of samplings per one
boar
Ejaculate indicators
Total count of sperms (bill)
Sperm motility
(%)
Ejaculate volume (ml)
Sperm concentration
(ths/mm3)
Pathological sperms (%)
I. Control 2.6 107.2 ± 35.9 70.4 ± 3.5 287.2 ± 70.3 372.9 ± 89.5 10.3 ± 8.5
Experimental 2.7 118.3 ± 35.4 68.5 ± 6.2 237.0 ± 69.2 505.9 ± 87.7 9.3 ± 4.5
II. Control 3.2 115.4 ± 28.1 70.0 ± 0.0 267.2 ± 74.1 450.6 ± 110.9 9.6 ± 6.5
Experimental 3.5 132.2 ± 34.3 69.2 ± 7.1 233.6 ± 60.1 579.3 ± 134.7 9.3 ± 5.1
III. Control 3.3 116.9 ± 40.9 70.0 ± 0.5 280.0 ± 63.6 434.2 ± 171.7 12.6 ± 4.9
Experimental 3.5 123.7 ± 33.6 67.3 ± 8.7 217.6 ± 53.4 575.4 ± 106.0 8.4 ± 3.6
IV. Control 2.1 94.9 ± 30.5 72.8 ± 3.6 275.8 ± 86.4 357.2 ± 95.2 8.6 ± 4.0
Experimental 2.6 98.0 ± 27.9 x 68.6 ± 7.5 218.8 ± 60.5 462.8 ± 125.5 9.7 ± 6.2
x - Symbol expressing statistically significant changes (as against period I, i.e. the start of the experiment) P < 0.05 x

77
DISCUSSION
Dsehmukh et al. (2009) evaluated the motility, sperm
concentration and morphological changes on sexual organs after
supplementing doses of 0, 4, 15 and 60 µg of chromium per kg of feed
ration of trivalent chromium for rats. These authors determined that
during the entire experimental period no changes in the quality of the
ejaculate were detected which could be ascribed to increased rates of
chromium. The best results in motility and sperm concentration were
achieved at a dose of 4 µg of chromium per kg of feed ration of
chromium; these results however were not statistically significant. In a
similar experiment with rats Anderson and Polansky (1981) determined
that the overall sperm count in rats fed a feed ration containing less than
100 µg of chromium per kg of feed ration of chromium decreased. Along
with this also successful fertilisation decreased by 25 % as compared with
the group which received a supplement of chromium in the feed ration.
Anderson (1988) also discussed the negative impact of chromium
insufficiency on fertility and sperm count in laboratory rats. Gall et al.
(2003) tested a supplement of chromium picolinate in 153 boars divided
into two groups. The boars received 2.27 kg of feed ration with a
supplement of 200 µg of chromium per kg of feed ration of chromium,
similarly as in our experiment. The boars were sampled on average three
times a week and the experiment lasted 135 days. This research team also
reached the conclusion that supplementing the feed ration of the boars
with chromium has no radical effect on reproductive parameters. In their
publication Close and Cole (2003) stated that it is suitable to supplement
the feed ration of boars in reproduction with chromium to improve the
reproduction parameters. According to these authors chromium
supplementation increased the concentration of sperm and overall fertility
in male laboratory rats. They further mentioned that a 200 µg of

78
chromium per kg of feed ration supplement of chromium had a positive
effect on the overall reproductive potential of breeding boars. According
to Wilson et al. (2004) supplementing the feed ration of boars with
chromium may also have a positive effect on overcoming stressful
situations and improving reproduction parameters.
CONCLUSION
In an experiment conducted on 20 boars it was observed that
feeding the organic form of chromium had no direct impact on changes in
laboratory values of the ejaculate of breeding boars although the total
number of sperms in experimental group had been significantly reduced
by the and of the experiment (P < 0.05) in comparison to its beginning.
This decrease was probably cause by the effect of period. The sperms
motility, sperms concentration, semen volume and percentage of sperms
pathologic changes were not affected by the addition of chromium
picolinate.
Acknowledgement: This project was funded by grant IGA TP 2/2011 and
TP 3/2012
REFERENCE
AMOIKON, E. K., FERNANDEZ, J. M., SOUTHER, L. L.,
THOMPSON, D. L., WARD, T. L., OLCOTT, B. M. 1995: Effect of
chromium tripicolinate on growth, glucose-tolerance, insulin sensitivity,
plasma metabolites, and growth-hormone in pigs. Journal of Animal
Science, 73: 1123–1130.
ANDERSON, R. A., POLANSKY, M. M. 1981: Dietary chromium
deficiency. Effect on sperm count and fertility in rats. Biological Trace
Element Research, 3: 1-5. ISSN 01634984.

79
ANDERSON, R. A. 1988: Chromium. In Smith KT (ed): ‘‘Trace Minerals
in Foods.’’ New York: Marcel Dekker, pp. 231–247.
ANDERSON, R. A. 1998: Chromium, glucose intolerance and diabetes.
Journal of American College Nutrition, 17: 548–555.
ANDERSON, R. A. 1997: Nutritional factors influencing the
glucose/insulin system: Chromium. Journal of American College
Nutrition, 16: 404–410.
BALK, E. M., TATSIONI, A., LICHTENSTEJN, A. H., LAU, J.,
PITTAS, A. G., 2007: Effect of Chromium Supplementation on Glucose
Metabolism and Lipids. Diabetes Care, 30: 2154–2163.
CEFALU, W. T., HU, F. B. 2004: Role of Chromium in Human Health
and in Diabetes. Diabetes care, 27: 2741–2751.
CLOSE, W. H., COLE, D. J. A. 2003: Nutrition of Sows and Boars. Vyd.
1. Nottingham: Nottingham University Press, s. 377 ISBN 978-1-897676-
530.
DSEHMUKH, N. S., BAGCHI, M., LAU, F. C., BAGCHI, G. 2009:
Safety of a novel oxygen-coordinated niacin-bound chromium next term
(III) complex (NBC): I. Two-generation previous term reproduction next
term toxicity study. Journal of Inorganic Biochemistry, 103: 1748–1754 .
EVANS, G. W., BOWMAN, T. D. 1992: Chromium Picolinate Increases
Membrane Fluidity and Rate of Insulin Internalization. Journal of
Inorganic Biochemistry, 46: 243–250.
EVOC-CLOVERE, CH., POLANSKY, M. M., ANDERSON, R. A.,
STEELE, N. C. 1993: Dietary Chromium Supplementation with or
without Somatotropin Treatment Alters Serum Hormones and Metabolites
in Growing Pigs without Affecting Growth Performance. The Journal of
Nutrition, 123: 1504–1512.
GALL, T. J., ROSEBOOM, K. J., MOSER, R. A., ORR, D. E., PURSER,
P. R. 2003: Effect of feeding chromium tripicolinate as a top dress to
boars upon sperm production. Journal of Dairy Science, 85: 161–163.

80
LINDEMANN, M. D. 1999: Chromium and swine nutrition. The Journal
of Trace Elements in Experimental Medicine, 12: 149–161.
LINDEMANN, M. D., WOOD, C. M., HARPER, A. F., KORNEGAY, E.
T., ANDERSON, R. A. 1995: Dietary chromium picolinate additions
improve gain/feed and carcass characteristic in growing-finishing pigs and
increase litter size in reproducing sows. Journal of Animal Science, 73:
457–465.
MERTZ, W. 1975: Effects and metabolism of glucose tolerance factor.
Nutrition Revue, 33: 129–35.
MOORADIAN, A.D., MORLEY, J.E. 1987: Micronutrient status in
diabetes mellitus. The American Journal of Clinical Nutrition, 45: 877–
895.
PAGE, T. G., SOUTHERN, L. L., WARD, T. L., THOMPSON, D. L.
1993: Effect of chromium picolinate on growth and serum carcass traits of
growing-finishing pigs. Journal of Animal Science, 71: 656–662.
PECHOVA, A., PAVLATA, L. 2007: Chromium as an essential nutrient:
a review. Veterinarni Medicina, 52: 1–18.
ROGINSKI, E.E., MERTZ, W. 1969: Effects of Chromium (III)
Supplementation on Glucose and Amino Acid Metabolism in Rats Fed a
Low Protein Diet. The Journal of Nutrition, 97: 525–530.
UNDERWOOD, E. J., SUTTLE, N. F. 1999: The Mineral Nutrition of
Livestock. Vyd.3. London: CABI Publishing, 614 s. ISBN 0851991289.
UUSITUPA, B., MYKKANEN, L., SIITONEN, O., LAKKSO, M.,
SARLUND, H., KOLEHMAINEN, O., RASANEN, T.,
KUMPULAINEN, J., PIORALA, K. 1992: Chromium supplementation in
impaired glucose tolerance of elderly: effects on blood glucose, plasma
insulin, C-peptide and lipid levels. British Journal of Nutrition, 68: 209–
216.

81
WILSON, M. E., ROZEBOOM, K. J., CRENSHAW, T. D. 2004: Boar
Nutrition for optimum Sperm Production. Advances in Pork Production,
15: 295–306.
WRIGHT, A. J., MOWAT, D. N., MALLARD, B. A. 1994: Supplemental
chromium and bovine respiratory disease vaccines for stressed feeder
calves. Canadian Journal of Animal Science, 74: 287–295.

82

83
EFFECT OF CORN CONSERVATION TECHNIQUE ON
PHOSPHORUS DIGESTIBILITY IN GROWING PIGS
HUMER, E. - SCHEDLE, K.
Institute of Animal Nutrition, Products and Nutrition Physiology,
University of Natural Resources and Life Sciences Vienna
ABSTRACT
Two experiments were carried out following 3x3 Latin square
designs to determine the effect of corn conservation technique with or
without phytase addition on apparent total tract digestibility of P
(ATTDP) in growing pigs. Corn was either dried (dried corn), ensiled
after milling (corn silage) or tight-closed-stored as whole grain (TCS-
corn). ATTDP was greater when corn was fermented (+54% in corn silage
and +33% in TCS-corn). Phytase addition increased P digestibility in all
conservation types. Although the enhancement was relatively lower in
ensiled corn (+37% in corn silage and +50% in TCS-corn) compared to
dried corn (+76%), still differences in respect of conservation type
remained. In conclusion the application of the fermentation technique
enables lower P-supplementations and reduces P-excretions with manure.
Although phytase application improves ATTDP, fermentation enables
additional enhancement.
INTRODUCTION
60 to 90% of phosphorus (P) in corn occurs in the form of
phytates (Nuss and Tanumihardjo, 2010). Due to the fact that monogastric
animals lack intestinal phytase enzymes at the level needed to hydrolyze
sufficient amounts phytate-bound P, the majority of P in corn is
unavailable for pigs (Jongbloed et al., 1992). It is well known that storage

84
procedures using fermentation techniques can lead to phytate-degradation
in seeds. Hence, the aim of the present studies was to determine the effect
of three different corn conservation techniques with or without addition of
microbial phytase on apparent total tract digestibility (ATTD) of P in
growing pigs.
MATERIAL AND METHODS
In two experiments each time 9 crossbred ((Duroc x Landrace) x
Pietrain) barrows were allotted randomly according to initial BW and
litter to metabolic cages. The experiments were carried out as 3 x 3 Latin
square designs. Each experimental period comprised 7 days of diet
adaption followed by a 7 day sampling period. The barrows were fed
twice times daily equal amounts of feed. Feed intake was limited to the
2.5 fold of ME requirements for maintenance according to GfE (2006).
The diets were conducted referring to the guidelines of GfE (1994) for
determination of apparent total tract digestibility of P (ATTDP).
Corn used in the experiment (P9400, Pioneer, Austria) was either
dried (dried corn), milled and ensiled (corn silage) or tight closed stored
as whole-grain (TCS-corn). Diets consisted of the corn alone with
addition of amino acids and a mineral and vitamin source. To achieve P-
deficient diets, no P was supplemented.
The calculation for energy intake was based on dry matter,
because conservation of corn resulted in different dry matter contents
(88% in dried corn, 76% in corn silage, 74% in TCS-corn. Hence varying
amounts of conserved corn were mixed with the premix, to achieve a
constant corn-premix proportion on dry matter basis.
In the second experiment, diets (same composition and feed stuffs were
used as in experiment one) were supplemented with 750 phytase units
(FTU) per kg phytase derived from Schizosaccharomyces pombe
(Phyzyme® XP 5000 G, Danisco, England).

85
Feces were collected quantitatively and stored at −20°C. Daily
amount of urine was recorded and an aliquot was stored at -20°C until
further analysis. After each collecting period feces were defrosted,
homogenized and analyzed for dry matter. Subsamples of feces and urine
were freeze dried for further analysis. P was determined photometrically
using the vanado-molybdate method after wet-ashing samples of feces,
urine and feeds via microwave. Chemical analyses were performed in
duplicate according to the official methods of VDLUFA (Naumann and
Bassler, 2007).
Data were subjected to ANOVA using the MIXED procedure of
SAS (Version 9.2), with the experimental period and the individual animal
as random effects. Differences between all pair-wise mean comparisons
were evaluated using the Tukey-Kramer-Test. Statistically significant
differences (P<0.05) among LSMeans are indicated by superscripts.
RESULTS AND DISCUSSION
Corn ensiling after milling as well as tight-closed-storage
significantly enhanced ATTD of P compared to dried corn (corn silage:
+54%, TCS-corn: +33%) (Figure1). The daily P-amounts excreted in
urine didn`t differ between treatments (Figure 2).
Addition of 750 FTU/kg phytase led to an increased ATTDP as
well as P- excretion with urine. Although the enhancement of ATTDP was
relatively lower in ensiled corn (+37% in corn silage and +50% in TCS-
corn) compared to dried corn (+76%), still differences in respect of
conservation type remained.

86
Figure 1: Apparent Total Tract Digestibility of P Figure 2: P- Excretion via urine;
different superscripts indicate differences (P<0.05)
The obtained ATTDP of 27% for dried corn is in agreement with
previous findings from 12% to 29% (Bohlke et al., 2005; Calvert et al.,
1978; Spencer et al., 2000).
Fermentation led to an increase in ATTD of P. Similar results
were found by several other authors (Blaabjerg et al., 2010; Hotz and
Gibson, 2001; Lyberg et al., 2008; Marfo et al., 1990). One possible
explanation could be the activation of endogenous plant phytase as a
consequence of decreasing pH value (Konietzny and Greiner, 2002;
Kozlowska et al., 1996). Further on lactic acid bacteria seem to be able to
decrease phytic acid contents (Hotz and Gibson, 2001; Lopez et al., 2000;
Skrede et al., 2007). Pieper et al. (2011) measured a higher ATTDP in
triticale and wheat with a low or high moisture content compared to dried
grains, which indicates a decrease in the phytic acid content during
ensiling. A dry matter content of 75% led to the highest digestibility
coefficients, whereas a higher moisture content (about 65% dry matter)
failed to increase digestibility compared to dried grains. Consequently the
dry matter contents of 76% for corn silage as well as 74% for TCS-corn
seem to be optimal for high digestibility by the use of fermentation. Niven
et al. (2007) found a release of phytat-bound P in high moisture corn

87
during storage, whereby this release was accelerated by addition of
exogenous phytase.
Addition of 750 FTU/kg phytase enhanced ATTDP. Hence our
study confirms the results of other experiments with a similar study design
(Jendza et al., 2005; Mroz et al., 1994).
If swine diets do not reach P requirements, only a small amount of
P is excreted via urine, because increased P-reabsorption in the kidneys
takes place (Columbus et al., 2010). On average 7.5 mg of P was excreted
via urine in Experiment 1. The addition of phytase enhanced P- excretion
for all conservation types, which is in agreement with findings from
Columbus et al. (2010). Nevertheless pigs consumed corn silage excreted
more P. The overall low amounts confirm the suboptimal P-supply in the
study.
CONCLUSION
Air proofed conservation of corn increases the P-digestibility in
growing pigs. Therefore lower inorganic P-supplementations are required
and P- excretion with manure will be reduced. Although further
improvement through microbial phytase addition is achievable, still
differences relating to conservation technique remain.
Acknowledgements: This research was financially supported by the H.
Wilhelm Schaumann Stiftung (Hamburg, Germany).
REFERENCE
Blaabjerg, K., H. Jorgensen, A. H. Tauson, and H. D. Poulsen. 2010.
Heat-treatment, phytase and fermented liquid feeding affect the presence
of inositol phosphates in ileal digesta and phosphorus digestibility in pigs
fed a wheat and barley diet. Animal 4: 876-885.

88
Bohlke, R. A., R. C. Thaler, and H. H. Stein. 2005. Calcium, phosphorus,
and amino acid digestibility in low-phytate corn, normal corn, and
soybean meal by growing pigs. Journal of Animal Science 83: 2396-2403.
Calvert, C. C., R. J. Besecker, M. P. Plumlee, T. R. Cline, and D. M.
Forsyth. 1978. Apparent digestibility of phosphorus in barley and corn for
growing swine. Journal of Animal Science 47: 420-426.
Columbus, D., S. J. Niven, C. L. Zhu, and C. F. M. de Lange. 2010.
Phosphorus utilization in starter pigs fed high-moisture corn-based liquid
diets steeped with phytase. Journal of Animal Science 88: 3964-3976.
GfE. 1994. Die bestimmung des verdaulichen phosphors beim schwein.
In: M. Kirchgeßner (ed.) Mitteilung des ausschusses für bedarfsnormen
der gesellschaft für ernährungsphysiologie No. 2. p 113-119. Proc. Soc.
Nutr. Physiol., Weihenstephan.
GfE. 2006. Empfehlungen zur energie- und nährstoffversorgung von
schweinen. DLG Verlag, Frankfurt am Main.
Hotz, C., and R. S. Gibson. 2001. Assessment of home-based processing
methods to reduce the phytate content and phytate/zinc molar ratio of
white maize (zea mays). Journal of Agricultural and Food Chemistry 49:
692-698.
Jendza, J. A., R. N. Dilger, S. A. Adedokun, J. S. Sands, and O. Adeola.
2005. Escherichia coli phytase improves growth performance of starter,
grower, and finisher pigs fed phosphorus-deficient diets. Journal of
Animal Science 83: 1882-1889.
Jongbloed, A. W., Z. Mroz, and P. A. Kemme. 1992. The effect of
supplementary aspergillus-niger phytase in diets for pigs on concentration
and apparent digestibility of dry-matter, total phosphorus, and phytic acid
in different sections of the alimentary-tract. Journal of Animal Science 70:
1159-1168.

89
Konietzny, U., and R. Greiner. 2002. Molecular and catalytic properties of
phytate-degrading enzymes (phytases). International Journal of Food
Science and Technology 37: 791-812.
Kozlowska, H., J. Honke, J. Sadowska, J. Frias, and C. VidalValverde.
1996. Natural fermentation of lentils: Influence of time, concentration and
temperature on the kinetics of hydrolysis of inositol phosphates. Journal
of the Science of Food and Agriculture 71: 367-375.
Lopez, H. W. et al. 2000. Strains of lactic acid bacteria isolated from sour
doughs degrade phytic acid and improve calcium and magnesium
solubility from whole wheat flour. Journal of Agricultural and Food
Chemistry 48: 2281-2285.
Lyberg, K., M. Olstorpe, V. Passoth, J. Schnurer, and J. E. Lindberg.
2008. Biochemical and microbiological properties of a cereal mix
fermented with whey, wet wheat distillers' grain or water at different
temperatures. Animal Feed Science and Technology 144: 137-148.
Marfo, E. K., B. K. Simpson, J. S. Idowu, and O. L. Oke. 1990. Effect of
local food-processing on phytate levels in cassava, cocoyam, yam, maize,
sorghum, rice, cowpea, and soybean. Journal of Agricultural and Food
Chemistry 38: 1580-1585.
Mroz, Z., A. M. Jongbloed, and P. A. Kemme. 1994. Apparent
digestibility and retention of nutrients bound to phytate complexes as
influenced by microbial phytase and feeding regimen in pigs. Journal of
Animal Science 72: 126-132.
Naumann, C., and R. Bassler. 2007. Die chemische untersuchung von
futtermitteln. VDLUFA Verlag, Darmstadt.
Niven, S. J., C. Zhu, D. Columbus, J. R. Pluske, and C. F. M. de Lange.
2007. Impact of controlled fermentation and steeping of high moisture
corn on its nutritional value for pigs. Livestock Science 109: 166-169.

90
Nuss, E. T., and S. A. Tanumihardjo. 2010. Maize: A paramount staple
crop in the context of global nutrition. Comprehensive Reviews in Food
Science and Food Safety 9: 417-436.
Pieper, R. et al. 2011. Effect of ensiling triticale, barley and wheat grains
at different moisture content and addition of lactobacillus plantarum
(dsmz 8866 and 8862) on fermentation characteristics and nutrient
digestibility in pigs. Animal Feed Science and Technology 164: 96-105.
Skrede, A., S. Sahlstrom, O. Ahlstrom, K. H. Connor, and G. Skrede.
2007. Effects of lactic acid fermentation and gamma irradiation of barley
on antinutrient contents and nutrient digestibility in mink (mustela vison)
with and without dietary enzyme supplement. Archives of Animal
Nutrition 61: 211-221.
Spencer, J. D., G. L. Allee, and T. E. Sauber. 2000. Phosphorus
bioavailability and digestibility of normal and genetically modified low-
phytate corn for pigs. Journal of Animal Science 78: 675-681.

91
THE DIFFERENCE IN THE CHEMICAL COMPOSITION OF
BREAST AND THIGH MUSCLE OF CHUKAR PARTRIDGE
(ALECTORIS CHUKAR)
JUZL, R. – RUSNIKOVA, L. – SUCHY, P. – STRAKOVA, E.
Department of Animal Husbandry and Animal Hygiene, VFU Brno
ABSTRACT
The aim of our study was to evaluate the chemical composition as
regards the breast and thigh muscle of chukar partridge (Alectoris
chukar) under intensive fattening conditions. In experimental animals, we
first watched their live weight within 90 days of fattening for a total of 60
experimental animals (birds were not sexed). No large growth was
recorded towards its end whereas the live weight in the 90th day of age
reached 0.452 kg. In the 90th day of age after the fattening was
finished, 30 subjects were selected to monitor the carcass yield. Regarding
the obtained samples of breast and thigh muscles, it was performed a
chemical analysis which showed a statistically highly significant
difference (P ≤ 0.01) between the breast and thigh muscle, specifically as
for the following analyzed indicators: crude protein, fat, ash, gross energy
(BE). The calcium content demonstrated a significant difference (P ≤
0.05). The breast muscle contained higher amounts of CP and Ca. The
thigh muscle contained higher amounts fat, ash and BE. These results
were compared with outcomes available in literature. Due to
the lack of published work on the chemical analysis of partridge meat, we
compared the results also with studies addressing the chemical
composition of meat from broiler chickens, pheasants and other types of
feathered game.

92
MATERIAL AND METHODS
As a material, meat samples from partridges – namely thigh and
breast muscle – were used. These samples originated from a biological
experiment which was carried out in an experimental barn of the
Department of Nutrition, Animal Husbandry and Animal Hygiene,
University of Veterinary and Pharmaceutical Sciences Brno. The
experiment included 60 individuals of chukar partridge and took place
under a specified lighting regime (23 hours / light + 1 hour / darkness)
with housing on litter. Experimental animals were fed with complete
feeding mixtures for fattening broiler chickens. Feeding mixtures were
applied according to the following scheme: BR 1 – from the 1st day till
the 20th day of age, BR 2 – from the 20th day till the 81st day of age, BR
3 – from the 81st day to 90th day of age. Dry matter composition of
feeding mixtures was as follows:
BR 1: CP 235.4 g.kg-1; fat 47.8 g.kg-1; ash 58.9 g.kg-1; ME 13.6 MJ.kg-1.
BR 2: CP 244.9 g.kg-1; fat 100.1 g.kg-1; ash 62.0 g.kg-1; ME 15.3 MJ.kg-1.
BR 3: CP 245.8 g.kg-1; fat 112.0 g.kg-1; ash 63.6 g.kg-1; ME 15.5 MJ.kg-1.
Partridges were fed “ad libitum” and all types of FM were
pelleted. No animals perished during the experiment. In the course
of fattening period, the experimental animals (all sixty monitored
individuals) were checked for their live weight, namely on the 1st, 11th,
20th, 29th, 40th, 50th, 60th, 70th, 81st and 90th day of age. On the 90th
day of age, 30 subjects (without sexing) were picked out and checked for
selected indicators relating to the breast and thigh and drumstick meat.
The original sample mass was analyzed with regard to its dry matter
content (g.kg-1); subsequently, the dry matter was analyzed with respect to
the following indicators: crude protein (g.kg-1), fat (g.kg-1), ash (g.kg-1),
calcium Ca (g.kg-1), phosphorus P (g.kg-1), magnesium Mg (g.kg-1) and
gross energy (MJ.kg-1). Further, it was evaluated the carcass yield, breast
muscle yield and thigh yield (%). After determining the pre-dry and dry

93
matter, the sample was homogenized and then subjected to further
analyses. The nitrogen content was determined according to Kjeldahl
using the Büchi Kjeldahl apparatus (Büchi). We expressed the crude
protein content in the sample by multiplying with the factor of 6.25.
Fat was determined through the use of ANKOMXT10 Fat Analyzer (O.K.
Servis BioPro, Czech Republic). Ash was determined by weight after
incineration at 550°C in a muffle furnace under prescribed conditions.
Calcium, magnesium and phosphorus were determined from the sample
ash: calcium and magnesium – by leaching and subsequent titration,
phosphorus – by HELIOS α spectrophotometer (Fisher Stientific). Gross
energy was measured at AC 500 calorimeter (Leco, USA). We carried out
a statistical evaluation of chemical analysis results using the
Unistat program (5.6 for Excel).
RESULTS AND DISCUSSION
Table 1 shows the results of monitoring the body weight (kg)
during the fattening of partridges from the 1st day till 90th day of their age.
The live weight was increasing throughout the fattening period whereas
the increase was not so expressive in the final stage. Deviations from the
average body weight grew together with the weight. Furthermore, we
monitored the carcass yield in the experimental animals. The carcass yield
at slaughter age of 90 days was 73.7%, breast muscle yield was 18.1% and
thigh yield was 20.8%. Table 2 shows that the dry matter content in
partridge breast muscle is significantly higher (P ≤ 0.01) than in the thigh
muscle. In comparison with the thigh muscle, the breast muscle contained
by 4.51 % more dry matter. As regards the crude protein content in dry
matter, it was significantly higher (P ≤ 0.01) in the breast muscle than in
the thigh muscle (by 8.37 %). In terms of fat content, on the contrary, the
partridge breast muscle contained significantly lower (P ≤ 0.01) amount
of fat in dry matter (by 81.99 %) compared to the thigh muscle. Dry

94
matter resulting from the breast muscle showed significantly lower (P ≤
0.01) ash content (by 6.15 %) in comparison with the thigh muscle.
Regarding calcium, a higher content (P ≤ 0.05) in the dry matter was
found in the breast muscle compared to the thigh muscle (by 10.67 %). No
statistically significant differences were confirmed between the dry matter
contents of phosphorus and magnesium when comparing breast and thigh
muscles. In the dry matter, the breast muscle contained by 5.73 % (P ≤
0.01) less gross energy than the thigh muscle. Feeding mixtures for broiler
chickens were used to fatten the partridges; these mixtures contain higher
levels of energy as well as crude protein in comparison with
recommendations provided by the authors. Higher energy amount could
have an effect on the higher carcass yield, breast muscle and thigh muscle
weight but it should not affect the live weight, weight gain, carcass
properties, feed consumption and conversion (Ozek et al.2003, Ozek
2004, Cufadar et al. 2010). Ozek (2006), however, discovered the
influence of a higher CP amount (28%) in the diet on the body weight
which decreases with high protein concentrations. Such influence cannot
be observed as regards our chosen diet (24% of CP); live weight reached
higher values in this period. Vitula et al. (2011) reported lower dry matter
content values for the breast muscle and higher dry matter content values
for the thigh muscle. In the dry matter, they determined higher value of
gross energy regarding the breast and thigh muscles than presented in this
work, and also the gross fat reached higher values in their experiment. The
CP value corresponded to our CP values measured in the muscle. On the
84th day of age, the partridges reached higher average body weight values
than stated by Gulsen et al. (2010). Even the value of carcass yield was
higher in our experiment; however, we came to lower yield values with
respect to the breast and thigh muscles. When compared with data from
literature concerning the quality of meat from broiler and pheasant
chickens, it can be seen a noticeable difference in the meat

95
composition. The partridge meat contains less CP in the breast muscle
than pheasant but more than broiler. As for the thigh muscle, it contains
more CP than pheasant and broiler. Partridge thigh muscle contains less
fat than the thigh muscle of pheasant and broiler. The amount of ash
in breast and thigh muscles of partridges is comparable with the muscle of
pheasant; partridge muscle contains the highest quantity of calcium and
the lowest amount of magnesium. The amount of phosphorus in the
partridge muscle is lower than in the muscle of pheasant (Suchý et al.
2002, Večerek et al. 2005, Straková et al. 2011). Gross energy content in
the breast and thigh muscles is the lowest in partridge followed by
pheasant; the highest values of gross energy are achieved in broiler. In all
the species, higher gross energy values are measured for the thigh muscle
(Vitula et al. 2011).
Table 1. Body weight development during the fattening
day 1 11 20 29 40 50 60 70 81 90
n 60 60 60 60 60 60 60 60 60 60
live weight
(kg)
0,02 0,04 0,09 0,15 0,23 0,29 0,35 0,39 0,44 0,45
SD 0,00 0,00 0,01 0,01 0,02 0,03 0,03 0,04 0,05 0,05

96
Table 2. Chemical analysis of breast and thigh muscle in dry matter (g.kg-
1) (x±SD)
n x dry matter * breast 30 272.75 ± 14.17 (P ≤ 0,01)
thigh 30 260.44 ± 8.99 CP (g.kg-1) breast 30 922.54 ± 28.34 (P ≤ 0,01)
thigh 30 845.32 ± 25.75 fat (g.kg-1) breast 30 17.60 ± 11.55 (P ≤ 0,01)
thigh 30 97.70 ± 30.55 ash (g.kg-1) breast 30 46.33 ± 1.04 (P ≤ 0,01)
thigh 30 49.36 ± 1.77 Ca (g.kg-1) breast 30 2.44 ± 0.50 (P ≤ 0,05)
thigh 30 2.18 ± 0.49 P (g.kg-1) breast 30 8.75 ± 0.30 NS
thigh 30 8.78 ± 0.56 Mg (g.kg-1) breast 30 1.29 ± 0.19 NS
thigh 30 1.32 ± 0.26 BE (MJ.kg-1) breast 30 21.21 ± 0.33 (P ≤ 0,01)
thigh 30 22.50 ± 0.70 * in the original sample mass (g.kg-1)
CONCLUSION
The results thus show the difference between breast and thigh
muscles in the chemical analysis. The breast muscle could be considered a
more valuable part of partridge´s carcass because it contains higher
amounts of CP and less fat than thigh muscles (as in the case of broiler or
pheasant). This finding ranks the partridge meat among the nutritionally
valued feathered game meat.
Acknowledgements: This study was funded by the grant IGA
78/2011/FVHE.
REFERENCES
Cufadar Y, Olgun O, Bahtiyarca Y, Yildiz AO 2010: Effects of dietary
energy and protein on performance, reproduction traits and nitrogen-

97
excretion of breeder chukar partridges (Alectoris chukar). Rev Med Vet
161: 151-156
Gulsen N, Umucalilar HD, Kirikci K, Hayirli A, Aktumsek A, Alasahan S
2010: Sunflower oil supplementation alters meat quality but not
performance of growing partridges (Alectoris chukar). J Anim Physiol An
N, 94: 196-203
Ozek K, Yazgan O, Bahtiyarca Y 2003: Effects of dietary protein and
energy concentrations on performance and carcase characteristics of
chukar partridge (Alectoris chukar) raised in captivity. Brit Poultry Sci 44:
419-426
Ozek K, Bahtiyarca Y 2004: Effects of sex and protein and energy levels
in the diet on the blood parameters of the chukar partridge. Brit Poultry
Sci 45: 290-293
Ozek K 2006: The optimum protein content in high energy starter diet for
chukar partridge (Alectoris chucar). Int J Poultry Sci 5: 522–525
Straková E, Suchý P, Karásková K, Jámbor M, Navrátil P 2011:
Nutritional value of pheasant meat and its comparison with the meat of
broiler chickens. Acta Vet Brno 80: 249-254
Suchý P, Jelínek P, Straková E, Hucl J 2002: Chemical composition of
muscles of hybrid broiler chicken during prolonged feeding. Czech J
Anim Sci 47: 511-518
Večerek V, Suchý P, Straková E, Vitula F, Mikundová M 2005: Variation
in the chemical composition of muscles in young pheasants during their
growth. Arch Tierzucht 48: 290-298
Vitula F, Suchy P, Strakova E, Karaskova K, Zapletal D, Kroupa L 2011:
Energy value of meat in selected species of feathered game. Acta Vet
Brno 80: 197-202

98

99
CARCASS CHARACTERISTICS OF FATTENED PHEASANT
MALES AND FEMALES AT THE AGE OF 118 DAYS
1KARÁSKOVÁ, K., 1STRAKOVÁ, E., 1SUCHÝ, P., 2JÁMBOR, M.
1Faculty of Veterinary Hygine and Ecology,University of Veterinary and
Pharmaceutical Sciences, Brno 2Állatorvosi rendelő Székesfehérvár
ABSTRACT
The aim of this study was to compare weights of carcasses and
their dressing percentages and yields of edible organs and tissues in
females and males of common pheasant (Phasianus colchicus L.) at the
age of 118 days. Within the gender there were found high significant
differences (P ≤ 0.01) in live weight and in the weight of carcass, neck,
heart, liver, stomach, legs with and without skin, thighs, drumsticks and in
leg meat, where higher values were recorded in males. High significant
differences (P ≤ 0.01) were found in yields of neck, heart, breast muscles
without skin, legs without skin, drumsticks and muscles of drumstick –
except breast muscles without skin higher values were recorded in males.
Keywords: pheasant, slaughter weight, dressing percentage, edible organs
INTRODUCTION
Types of meat, which are consumed in the Czech republic, have
been changed over time. In 2001 a total meat consumption was 77.8 kg
for one resident per year, from this amount the amount of venison was
only 0.3 kg. In 2010 the total meat consumption increased on 79.1 kg, but
the venison consumption was already 0.9 kg, this was an important
increase (Český statistický úřad, 2012). Pheasant meat can be considered
to be a high quality foodstuff, primarily because of higher amount of

100
proteins, lower amount of fat (Straková et al., 2010) and higher amount of
essential fatty acids (Adamski et al., 2006, Uherova et al., 1992) than we
can find in a broiler chicken meat.
For the purpose of production of high quality venison a
technology of pheasant fattening has been developed for the past several
years. Effectively it is possible in pheasants to utilize a technological
systems which are given up to most species of poultry (Zapletal et al.,
2012). Straková et al. (2005) states that under the intensive fattening
pheasants can achieve approximately 90 % of final weight of adult animal
during 90 days. Fattening of the pheasants and their slaughter value were
also studied in the work of Adamski et al. (2006), Kokoszynski et al.
(2011) or Sarica et al. (1999).
The aim of this study was to compare the slaughter value, the dressing
percentage and the yields of organs and tissues of pheasant males and
females at the age of 118 days.
MATERIALS AND METHODS
Group of the pheasants was reared on a deep bedding in an
approved experimental enclosure equipped stable with air conditioning,
light and temperature controls and with controlled zoo-hygienic and
feeding systems at the Department of Animal Nutrition. Till the age of 15
days they were fed ad libitum by BR 1 diet (CP – Crude Protein 208.9
g/kg, BE – Brutto Energy 16.8 MJ/kg), during the age of 16 - 30 days by
BR 2 diet (CP 193.0 g/kg, BE 17.0 MJ/kg) and till the end of fattening by
BR 3 diet (CP 229.3 g/kg, BE 17.4 MJ/kg). We work on the assumption,
according to the findings from our experiments, that diets which are
primaly designated for pheasants - do not agree very well with their
requirements and our intention was to put to the test the influence of
feeding mixtures for boiler chickens on fattened pheasants and on their
characteristics of carcasses, dressing percentages, yields of edible organs

101
and tissues, growing intensity, feed conversion rate and chemical
composition of their bodies.
At the age of 118 days, at the time when an average daily
liveweight gain was only 0.004 kg and a feed conversion rate greatly
increased, in total 60 pheasants, 30 females and 30 males, were stunt and
slaughtered. After plucking and evisceration, where heart, liver, stomach,
abdominal fat and also neck were removed, the carcasses were divided to
obtain the following parts: breast muscles, legs with and without skin,
muscles of thighs and of drumsticks. These individuals parts were
weighed and their yields (%), as a ratio to live weight, were determinated.
The collected datas were statistically verified by programme
Unistat CZ, version 5.6 for Excel (2005), in which the mean values and
their differences were compared at the level of significance (P ≤ 0.01 and
P ≤ 0.05) by Tukey´s HSD test.
RESULTS AND DISCUSSION
It is obvious, from Table 1, that there is a high significant
difference (P ≤ 0.01) in live weight and in the weight of eviscerated
carcass, neck, liver, stomach, legs with and without skin, thighs,
drumsticks, thigh and drumstick muscles in pheasant females and males at
the age of 118 day. Significant difference (P ≤ 0.05) was found in the
weight of breast muscles without skin.
Similar findigs were also reported by Straková et al. (2005).
Higher live weights in pheasant males during their rearing were recorded
in the study of Kokoszynski et al. (2011) and significant difference was
also (P ≤ 0.05) confirmed by Sarica et al. (1999). Adamski and Kuzniacka
(2006) in their study report that average body weight at slaughter of
pheasant males at the age of 112 days is 1198 g, average body weight of
females is 874 g, and also in males they report higher content of thigh

102
muscles, of skin with subcutaneous fat, higher weight of giblets and
higher weight of eviscerated carcass with neck.
Table 1. Slaughter weight of carcass and of edible tissues and organs in
pheasant females and males at the age of 118 days
Weight (g):
Females Males M - F n x SD n x SD Differenc
e P
Live weight 30
991,500
71,064
30
1189,414
77,5271
197,914 0,01
Eviscerated carcass
30
736,700
55,610
30
883,448 60,5575
146,748 0,01
Neck 30
29,273 3,686 30
39,9380 3,671 10,665 0,01
Heart 30
5,780 0,766 29
8,538 1,274 2,758 0,01
Liver 30
15,250 2,684 30
17,893 2,948 2,643 0,01
Stomach 30
19,653 3,414 30
23,359 4,729 3,705 0,01
Abdominal fat
30
6,233 7,116 30
3,676 4,966 2,557 NS
Breatch muscles
without skin
30
169,440
20,686
30
182,359 26,879 12,919 0,05
Skinned legs 30
216,127
22,610
30
268,301 27,437 52,174 0,01
Legs without skin
30
192,680
16,570
30
246,579 24,191 53,899 0,01
Thighs 30
106,900
13,732
30
134,234 20,756 27,334 0,01
Drumsticks 30
84,940 8,4199
30
114,3517
10,661 29,412 0,01
Muscles of thighs
30
93,913 12,274
30
113,683 16,717 19,769 0,01
Muscles of Drumsticks
30
61,160 6,852 30
84,338 8,790 23,178 0,01
(n – number of pheasants, x – arithmetic mean, SD –standard deviation, M - males, F - females, NS – statistically non significant)
High significant difference (P ≤ 0.01) in yield, Table 2, was
found in pheasant females and males at the age of 118 days in neck, heart,
103
breast muscles without skin, legs without skin, thighs and thigh muscles.
Significant difference (P ≤ 0.05) was found in yield of abdominal fat. In
contrast, there were not significant differences in dressing percentage and
in yield of liver, stomach, skinned legs, thigs and muscles of thigs.
Also Sarica et al. (1999) presents that heavier eviscerated
carcasses, lower amount of abominal fat and higher amount of thigh
muscles are in pheasant males. Adamski and Kuzniacka (2006) in their
study report that dressing percentage of pheasant males at the age of 112
days is 73,2 % and in females 73,0 %.
Table 2. Dressing percentage and yields of edible tissues and organs in pheasant females and males at the age of 118 days
Yield (%):
Females Males M - F n x SD n x SD Difference P
Eviscerated carcass -
DP
30 74,294 1,274 30 74,288 2,014 0,006 NS
Neck 30 2,965 0,407 30 3,355 0,324 0,391 0,01 Heart 30 0,586 0,089 30 0,719 0,103 0,133 0,01 Liver 30 1,539 0,266 30 1,510 0,262 0,029 NS
Stomach 30 1,981 0,291 30 1,969 0,393 0,012 NS Abdominal
fat 30 0,608 0,658 30 0,298 0,394 0,311 0,05
Breatch muscles without
skin
30 17,089 2,160 30 15,333 20,034 1,757 0,01
Skinned legs
30 21,785 1,492 30 22,546 1,695 0,761 NS
Legs without
skin
30 19,445 1,192 30 20,723 1,438 1,278 0,01
Thighs 30 10,780 1,177 30 11,258 1,387 0,477 NS Drumsticks 30 8,582 0,788 30 9,625 0,791 1,044 0,01 Muscles of
thighs 30 9,467 1,021 30 9,527 1,040 0,060 NS
Muscles of Drumsticks
30 6,1737 0,601 30 7,096 0,631 0,923 0,01
(DP - dressing percentage)

104
CONCLUSION
It follows from the results that by intensive fattening of pheasants
till the age of 118 days, it is possible to achieve a good dressing
percentage in females and males (74,3 %). However there are significant
differences in weights and yields of their edible tissues and organs.
Acknowledgements: This research was supported by IGA
88/2010/FVHE.
REFERENCES
ČESKÝ STATISKTICKÝ ÚŘAD. Spotřeba potravin 2010, [online].
c2012 [cit. 02.02.2012].
Dostupné z: <
http://www.czso.cz/csu/2011edicniplan.nsf/tab/53004FB2E4>
STRAKOVÁ, E., VITULA, F., SUCHÝ, P., VEČEREK, V. Growth
intensity and carcass characteristics of fattend pheasant poults. Krmiva,
2005, vo. 47, no. 2, p. 73-82.
KOKOSZYNSKI, D., BERNACKI, Z., CISOWSKA, A. Growth and
development of young game pheasants (Phasianus colchicus). Archiv Fur
Tierzucht-Archives of Animal Breeding, 2011, vol. 54, no. 1, p. 83-92.
SARICA, M., KARACAY, N., CAMCI, O. Slaughter age and carcass
traits of pheasants. Archiv fur Geflugelkunde, 1999, vol. 63, no. 4, p. 182-
184.
ADAMSKI, M., KUZNIACKA, J. 2006: The effect of age and sex on
slaughter traits of pheasants (Phasianus colchicus L.). Animal Science
Papers and Reports, 2006, vol. 24, suppl. 2, p. 11-18.
STRAKOVÁ, E., SUCHÝ, P., KROUPA, L., ZAPLETAL, D.,
STEINHAUSER, L. Nutriční hodnota proteinů svaloviny bažanta
obecného (Phasianus colchicus). Veterinářství 2010, vol. 8, p. 466-468.

105
UHEROVA, R., BUCHTOVA, V., TAKACSOVA, M. Nutritional factors
in game. Fleischwitschaft. 1992, vol.72, no. 8, p. 1155-1156.
ZAPLETAL, D., SUCHÝ, P., STRAKOVÁ, E. Technologie výkrmu
bažantích kuřat pro produkci masa. Brno: VFU Brno, 2012, p. 39.
Address for correspondence: Kateřina Karásková, MVDr., Ústav výživy
zvířat, FVHE VFU Brno, Palackého 1-3, 612 42 Brno, [email protected]

106

107
ANALYSIS OF SELECTED MARKERS OF ENERGY
METABOLISM IN DAIRY COWS IN THE PERIPARTAL PERIOD
KREMPASKÝ, M. –MASKAĽOVÁ, I. –BUJŇÁK, L. –VAJDA, V.
Department of Nutrition, Dietetics and Animal Husbandry, University of
Veterinary Medicine and Pharmacy in Kosice
ABSTRACT
The present study evaluated under practical conditions the level of
nutrition in relation to rumen fermentation and its influence on adaptation
of energy metabolism of saccharides and fat. The degree of
lipomobilisation and metabolic transformation of non-esterified fatty acids
(NEFA) in relation to functional state of the liver was evaluated in two
groups of dairy cows in dependence on the level and technological
discipline of phase nutrition of dairy cows in the peripartal period.
Allocation of the examined dairy cows to group I or group II was based on
analytical determination of molar proportion of propionic acid in the
rumen fluid that was affected by the proportion of fibrous and non-fibrous
saccharides in the rations. The mean level of propionic acid in the rumen
of cows of the group I (6 herds fed bulk type rations) was 16.44 ± 2.54
mmol. l-1 and the mean serum level of NEFA in this group reached
0.52±0.18 mmol. l-1. In the group II (6 herds fed total mixed rations of the
concentrate type), the mean propionic acid level reached 21.32 ± 2.13
mmol. l-1 and NEFA mean level was 0.24 ± 0,04 mmol. l-1,which
indicated significantly lower level of lipomobilisation.

108
INTRODUCTION
The peripartal period is associated with dramatic changes in
coordination of metabolism required for covering the needs of the
mammary gland on energy, glucose, amino acids (AA) and calcium
during early lactation. The nutrient requirements on day 4 of lactation
compared to day 250 of gestation are about 2-fold higher for AA (Bell
et al., 1995), 4-fold for Ca (Horst et al., 1997), 5-fold for NEFA and 3-
fold higher for glucose (Bell et al., 1995). Serum glucose levels are
important for synthesis of lactose, determine the milk yield and are the
limiting factor of the degree of lipomobilisation and supply of liver with
NEFA. In ruminants, glucose is synthetized mostly from propionic acid.
During the transition period, the contribution of propionic acid to
gluconeogenesis remains approximately at the level of 50 – 60%. In this
phase of negative energy balance, low voraciousness and deficiency of
precursors of glucose synthesis, amino acids play an important role. They
enter the metabolism as a result of muscle proteolysis and, particularly,
from TMR and may support the energy metabolism even at 20 – 30%
level (Reynolds et al., 2003). Increased energy intake through total mixed
rations (TMR) during the peripartal phase is associated with decrease in
excessive lipomobilisation and production of ketones. The key
preventative measure is the support of gluconeogenesis and physiological
level of blood glucose. The essential substrate for production of glucose in
the liver is propionic acid that develops particularly during fermentation
of rapidly fermenting saccharides in the rumen. Content of nutrients and
particularly of easily fermentable and fibrous saccharides is an important
criterion for optimisation and evaluation of the quality of rations during
preparation for parturition with the aim to maximise production of
propionic acid in the rumen and stabilise metabolism of glucose. The aim
of the study was to evaluate the influence of the quantity of produced
propionic acid on the degree of lipomobilization and metabolic load on

109
the liver in the period of preparation for calving. Production of propionic
acid is related to formulation of TMRs fed in this period.
MATERIAL AND METHODS
Biological control of the level of nutrition of 12 herds of Holstein
cows kept in a lowland area was carried out by means of samples of TMR,
rumen fluid obtained by oesophagus probe and blood drawn from vena
jugularis of dairy cows. Samples of rumen fluid and blood were collected
from 5-6 cows from the following groups: periparturient period 21 days
before calving, up to 21 days after parturition; cows at the peak of
lactation. Samples of TMR supplied to the described groups were
collected in parallel and examined for the content of nutrients (dry mater,
CP, crude fat, NDF, ADF) by the methods according to Commission
Regulation (EC) No. 152/2009 of January 2009, laying down the methods
of sampling and analysis for the official control of feed. Altogether 69
cows only from the group in preparation for calving were included in this
experiment. A selective criterion for division of cow herds into two
groups (group I and group II) was the level of rumen fermentation,
evaluated analytically by means of molar proportion of propionic acid in
the rumen fluid as the level of this acid is closely related to the type of the
supplied TMR (bulk or concentrate type rations). Based on the level of
propionic acid and quality of the supplied TMR, 6 herds formed the group
I (5 – 6 selected cows from each herd in the stage of preparation for
calving) consisting of altogether 34 cows that were fed bulk type rations
and the level of propionic acid in their rumen was below the
recommended 20 mmol.l-1. Group II consisted of cows from another 6
herds (5 – 6 selected cows from each herd in the stage of preparation for
calving), altogether comprising 35 cows fed the concentrate type of
rations. These cows exhibited more intensive fermentation with propionic
acid levels above 20 mmol.l-1. In all examined herds we summarised and

110
evaluated TMRs and rumen profiles as a direct response to the consumed
feed, effect on energy metabolism, level of lipomobilization and
metabolic load on the liver. The level of VFA in the rumen fluid was
determined by isotachophoresis based on a two-column system,
employing an EA 102 analyser. The levels of NH3 were determined
according to Kjeldahl and pH was measured by a potentiometric method.
Percentage proportions and VFA ratios were obtained by calculations.
Blood serum markers, such as glucose, cholesterol, AST and bilirubin,
were determined by means of a biochemical analyser „Ellipse“ and for
photometric determination we used the respective diagnostic kits. The
levels of NEFA were determined by the method of Ducomb, using copper
reagents, and BHBA and AcAc acids were analysed by isotachophoresis
based on a two-column system, employing an EA 102 analyser.
RESULTS AND DISCUSSION
Evaluation of TMR during preparation for parturition: in the
group I the mean level of neutral detergent fibre (NDF) in TMR reached
394.1 g.kg-1 DM and the recommended upper limit of NDF was exceeded
in 5 of 6 examined herds. The mean level of non-fibre saccharides (NFS)
in this group was 372 g.kg-1 DM and 3 herds exceeded the recommended
upper limit of NFS. In the group II the mean level of NDF reached 382
g.kg-1 DM and 2 herds exceeded the limit.
The mean level of NFS in TMR supplied to group I. cows was
390.9 g.kg-1 DM and 4 herds exceeded the maximum limit. Rumen profile
level is shown in Table 2. Mean acidity of the rumen content in the group
I (6.80) exceeded the upper reference level so did the acidity in 65 % of
cows. In the group II the mean level of pH in the rumen and rumen acidity
in 71 % of cows were within the reference range. The mean level of VFA
in the group I (86.4 mmol.l-1) was close to the lower limit with 44 % of

111
cows below the lower reference limit. In the group II the mean level of
VFA was in the middle (104.45 mmol.l-1) of the reference range and 88 %
of animals had VFA in the reference range.
Table 1. Mean content of analysed nutrients in TMR in the pre-partum
period. Parameter
Recommended
range Group I
x range Group II x range
Dry matter (DM) g.kg-1 450 – 500 465.3 394 - 544 425.4 352 - 498 CP g.kg-1DM 130 – 150 136.0 102 – 157 124.7 107 – 145 Fat g.kg-1 DM 38.1 31 – 47 35.8 26 – 55 NDF g.kg-1 DM 320 – 380 394.1 366 – 406 382.8 333 – 435 ADF g.kg-1 DM 230 – 250 237.3 179 – 258 222.5 188 – 263 NFC g.kg-1 DM 300 – 350 372.9 314 – 434 390.9 346 – 467 Starch g.kg-1 DM 220 - 250 245.6 182 – 299 269.6 222 – 337 NEL MJ.kg-1 DM 6.2 – 6.5 6.4 6.15 - 6.71 6.5 6.27 - 6.68 DM – dry matter; CP – crude protein; NDF – neutral detergent fibre; ADF – acid detergent fibre; NFC – non-fiber carbohydrates; NEL – net energy for lactation. Source: Biologická kontrola úrovne výživy v chove dojníc, page 21. Table 2. Mean pre-partum levels of rumen metabolism parameters in the cows.
Rumen content Reference Values
Group I ± SEM
Group II ± SEM
Signification 1
pH 6.4 - 6.6 6.80 ± 0.15 6.52 ± 0.14 P<0.001 NH3 mg.100ml-1 15 – 25 17.49 ± 3.05 16.46 ± 3.64 NS Sum of VFAs mmol.l-1 80 - 130 86.37 ± 12.83 104.45 ± 10.20 P<0.001 Propionic acid mmol.l-1 > 20 16.44 ± 2.54 21.32 ± 2.13 P<0.001 Acetic acid mmol.l-1 59.37 ± 9.60 69.76 ± 7.64 P<0.01 Acetic acid % 60 – 65 68.71 ± 1.82 66.54 ± 1.79 NS Propionic acid % 20 – 25 18.84 ± 1.30 20.55 ± 1.52 P<0.01 Butyric acid % 10 – 20 12.45 ± 1.44 12.90 ± 0.98 NS C3:C2 1 : 2.5 - 3.0 1 : 3.75 ±
0.34 1 : 3.29 ± 0.34 P<0.01
NH3 – ammonia; VFA - volatile fatty acids; C3 – acetic acid; C2 – propionic acid; NS – not significant. Source: Biologická kontrola úrovne výživy v chove dojníc, page 43. 1Graph Pad Prism 5
The mean propionic acid level in the group I reached 16.44
mmol.l-1. In 61.8 % of cows the propionic acid in the rumen was below 20
mmol.l-1 and in 32 % of animals even below 15.0 mmol.l-1. In the group II

112
the mean level of propionic acid was 21.32± 2.33mmol.l-1 and 25.6 % of
cows had these levels lower than 20 mmol.l-1.
Energy metabolism and internal environment
Selected indicators of the internal environment of dairy cows
related to energy metabolism quantify the degree of lipomobilization.
Table 3. Serum levels of parameters of energy metabolism in dairy cows
in the pre-partum period.
Blood serum parameters
Reference Values
Group I x SD
Group II x SD Signification 1
Glucose mmol. l-1 2.2 - 4.1 3.00 0.71 3.32 0.22 NS Cholesterol mmol. l-1 2.3 - 4.2 2.24 0.43 2.39 0.57 NS NEFA mmol. l-1 ˂ 0.35 0.52 0.12 0.24 0.07 P<0.001 AcAc mmol. l-1 ˂ 0.5 0.30 0.07 0.28 0.10 NS BHBA mmol. l-1 0.2 -1.24 0.75 0.14 0.53 0.08 P<0.001 AST μkat. l-1 0.76 - 1.38 0.80 0.50 1.35 0.19 P<0.001 Bilirubín μmol. l-1 0.17 - 5.13 5.33 2.16 3.33 1.43 P<0.01 NEFA – non-esterified fatty acids; AcAc – acetoacetic acid; BHBA – beta-hydroxybutyric acid; AST – aspartate aminotransferase; SD – standard deviation; NS – not significant. Source: Biologická kontrola úrovne výživy v chove dojníc, page 43. 1Graph Pad Prism 5
In this respect NEFA are a direct marker. In the group I of animals
mean level of NEFA reached 0.52 ± 0.18 mmol.l-1 with increased levels
observed in 70 % of cows. Some of these showed also increased level of
AST (52.9%) and bilirubin (61.7%) indicating metabolic load on the liver.
In the group II of dairy cows the mean NEFA was 0.24 ± 0.04 mmol. l-1
and increased level of AST and bilirubin was found in 31.4% and 34.3%
of cows, resp. High level of lipomobilisation was observed in the group I,
with propionic acid level in the rumen below 20 mmol.l-1 in 61.8% of
cows and increased NEFA (>0.35mmol. l-1) in 86% of cows. Load on the
liver was indicated by increased AST in 66% of animals and increased
bilirubin in 48 % of the cows from this group.

113
CONCLUSION
The level of blood glucose and the related level of insulin and
glucagon are the key factors in management of metabolic adaptation and
prevention of metabolic disorders. Our observations showed that in the
group I of herds fed TMR of the bulk type with mean level of propionic
acid in the rumen reaching 16.44 ± 2.54 mmol. l-1, there was considerably
higher degree of lipomobilisation and metabolic load on the liver then in
the group II of dairy cows with production of propionic acid in the rumen
exceeding the minimum recommended level of 20 mmol.l-1. Increasing
the amount of energy supplied through dietary carbohydrate result in
generally positive effect on metabolism and performance of transition
cows (Overton et al., 2004). Rapid fermentation of sugars and sufficient
and synchronised supply of proteins degradable in the rumen support
synthesis of microbial proteins and the absorbed propionic acid stabilises
level of blood glucose in peripartal dairy cows.
Acknowledgement: The study was supported by the grant VEGA
1/0970/11.
REFERENCES
1. Bell, A. W. 1995. Regulation of organic nutrient metabolism during
transition from late pregnancy to early lactation. J. Anim. Sci.73:2804–
2819.
2. Horst, R. L., J. P. Goff, T. A. Reinhardt, and D. R. Buxton.
1997.Strategies for preventing milk fever in dairy cattle. J. Dairy
Sci.80:1269–1280.
3. Overton, T. R., Waldron M.R. 2004. Nutritional Management of
Transition Dairy Cows: Strategies to Optimize Metabolic Health. J. Dairy
Sci. 87:(E. Suppl.):E105–E119

114
4. Reynolds, C. K., P. C. Aikman, B. Lupoli, D. J. Humphries, and D.
E.Beever. 2003. Splanchnic metabolism of dairy cows during the
transition from late gestation through early lactation. J. Dairy
Sci.86:1201–1217.
5. Vajda, V., Maskaľová, I., Mitrík, T., Bujňák, L., 2007. Biologická
kontrola úrovne výživy v chove dojníc. Edičné stredisko UVL v
Košiciach. 978-80-8077-075-4.

115
SILAGES OF RED CLOVER – THE EFFECT OF DIFFERENT
PREPARATIONS FOR THE QUALITY PARAMETERS IN 1ST
AND 2ND CUT
KUBÁT, V.1,2 – PETRÁŠKOVÁ, E.1 – JANČÍK, F.2 – ČERMÁK, B.1
– HNISOVÁ, J.1 – HOMOLKA, P.2 – LÁD, F.1
1 Department of Genetics, Breeding and Nutrition, Faculty of Agriculture,
University of South Bohemia, Studentska 13, 370 05 Ceske Budejovice,
Czech Republic, 2 Department of Nutrition and Feeding of Farm Animals,
Institute of Animal Science, Pratelstvi 815, 104 00 Praha Uhrineves,
Czech Republic
ABSTRACT
The set of tested red clover silages from the first cut (25-06-2010)
was divided into 7 groups; each of them included 4 samples. First group
of the samples was untreated (C α). The second group of silage samples
was treated using BIOS (BIOS α) preparation. The third group contained
the silage samples treated with combination of BIOS and B 1 : 100 (BIOS
+ B 100 α) preparations. The fourth group was treated usingB 1 : 50 (B 50
α), fifth group B 1 : 100 (B 100 α), sixth group B 1 : 200 (B 200 α) and
seventh B 1 : 500 (B 500 α). The distribution of samples was similar for
the second cut (07-09-2010)as for the first cut: C β, BIOS β, B 100 β, B
200 β and B 500 β. Group of the samples BIOS + B 10 β and B 10 β were
treated with B in concentration 1 : 10.
In the first cut the group C α and B 100 α positively affected the
quality of silage. The highest values of lactic acid showed the groups C α
and B 100 α (both in average 34.73 g . kg-1).
In the second cut the best results were achieved in the group BIOS
β with value of pH 4.26.

116
MATERIAL AND METHODS
The aim of this study was to evaluate the effect of seaweed
Biopolym (B) and bacterial preparation Biostabil (BIOS) for qualitative
parameters of silage from wilted red clover under laboratory conditions.
The effects of brown seaweed extract Ascophyllum nodosum –
Biopolym (B) preparation and bacterial preparation (homo and
heterofermentative lactic acid bacteria) Biostabil (BIOS) were tested for
qualitative parameters of silage from wilted red clover under laboratory
conditions. The dosage of Biopolym was recommended 0.02 l Biopolym
+ 2 l water.m-3 (1 : 100). Biostabil preparation was dosed (4 g.t-1)
according to the instructions of producers. Growth stage was late flower in
both cuts. The content of dry matter at the first cut was 41 %. In the
second cut content of dry matter was 45 %. Forage was cut to the length
of 40 – 80 mm. The samples of forage were placed into glass bottles (vol.
3.7 l) and were stored at 20 °C. Samples were evaluated and analyzed
after fermentation period 24 weeks.
In the first (α) cut (25-06-2010) seven groups with four samples in
each were evaluated:
a) control group without any preservative (C α), b) with using BIOS
(BIOS α) preparation,
c) treated with combination of BIOS and B 1 : 100 (BIOS + B 100 α)
preparations,
d) with using B 1 : 50 (B 50 α), e) B 1 : 100 (B 100 α), f) B 1 : 200 (B 200
α), g) B 1 : 500 (B 500 α).
The distribution of samples was similar for the second β cut (07-
09-2010) as for the first cut: h) C β, i) BIOS β, j) B 100 β, k) B 200 β and
l) B 500 β. Group of the samples m) BIOS + B 10 β and n) B 10 β were
treated with B in concentration 1 :10. In total, 28 representative samples
were collected in each cut.

117
Samples were analysed for contents of dry matter (DM), by
drying at 103 °C (Regulation No. 415/2009, 2009).The lactid acid was
analysed using an isotachoforetic analyser IONOSEP 2001 (Recman CZ).
The values determined were statistically tested using program
STATISTICA 9.1 including ANOVA and Tukey’s HSD test.
RESULTS AND DISCUSSION
First α cut
The lower pH values (P < 0.01) was found in group B 100 α
compared with groups BIOS α and BIOS + B α. The results of pH show
that the value of groups C α, B 50 α, B 100 α, B 200 α, and B 500 α are
within recommended range, it is by Rada (2009) from 4.0 to 4.2.
Vanhatalo et al. (2009) tested red clover in late flowering, with an average
value of pH 4.1. This value is most similar to silage group B 500 α. The
results are presented in Fig. 1.
Fig. 1. The development of the dry matter contents and pH values
The highest values of lactic acid were observed in the groups C α
and B 100 α. (both in average 34.73 g.kg-1 DM). The lowest value of
lactic acid had group BIOS α (26.22 g.kg-1 DM). The results are shown in
41
42
43
44
45
46
47
48
C α BIOS α BIOS + B α B 50 α B 100 α B 200 α B 500 α
Groups
Con
tent
of d
ry m
atte
r (%
)
3.85
3.9
3.95
4
4.05
4.1
4.15
4.2
4.25
4.3
pH
dry matterpH

118
Fig. 2. Slottner and Rammer (2001) measured value of lactic acid 14.36
g.kg-1 DM for red clover silage with DM 35.6 %.
Fig. 2. The contents of dry matter and lactic acid between groups
Second β cut
Dewhurst et al. (2003) reported pH value of 4.24 in clover silage
(DM content 37.6 %) in the farm conditions. In the present study, group of
silage BIOS β had a pH value 4.26 (DM content 46.26 %). In other
groups, our values were higher in comparison with author mentioned
above. The silage group B 100 β (pH 4.46) differed more than 5 %
increase compared to results of Dewhurst et al. (2003). Narasimhalu and
Sanderson (1993) presented a pH value 4.8 in experiment with the plastic
silos. Very high statistical significance (P < 0.001) was found for pH in
group BIOS β compared with B 10 β, B 100 β, B 200 β and B 500 β. The
lowest value of pH showed the group BIOS β (4.26). The results of pH are
illustrated in Fig. 3.
42
43
44
45
46
47
48
C α BIOS α BIOS + B α B 50 α B 100 α B 200 α B 500 α
Groups
Con
tent
of d
ry m
atte
r (%
)
15
20
25
30
35
40
Cont
ent o
f lac
tic a
cid
(g.k
g-1
)
dry matterlactic acid

119
Fig. 3. Dry matter contents and pH values between groups in the second
cut
The highest value of lactic acid showed group BIOS β (in average
30.27 g.kg-1 DM), and then BIOS + B β (29.90 g.kg-1 DM), C β (29.38
g.kg-1 DM), B 200 β (27.69 g.kg-1 DM), B 500 β (23.35 g.kg-1 DM) and B
10 β (23.13 g.kg-1 DM). The lowest value was found for silage B 100 β
(21.59g.kg-1 DM). The Fig. 4 shows the comparison of dry matter and
lactic acid.
Fig. 4. The comparison of dry matter and lactic acid in the second cut
43
44
45
46
47
48
49
C β BIOS β BIOS + B β B 10 β B 100 β B 200 β B 500 β
Groups
Cont
ent o
f dry
mat
ter (
%)
4.15
4.2
4.25
4.3
4.35
4.4
4.45
4.5
pH
dry matterpH
43
44
45
46
47
48
49
C β BIOS β BIOS + B β B 10 β B 100 β B 200 β B 500 β
Groups
Cont
ent o
f dry
mat
ter (
%)
15
20
25
30
35
40
Cont
ent o
f lac
tic a
cid
(g.k
g-1
)
dry matterlactic acid

120
Dewhurst et al. (2003) present a concentration of lactic acid 19.68
g.kg-1 DM. We found by comparison with our values that each group
showed a higher value. In the experiment of Narasimhalu and Sanderson
(1993) was the average value of lactic acid 24 g.kg-1 DM. The content of
lactic acid increases with increasing content of dry matter. This is the
opposite trend in comparison with first cut.
CONCLUSION
In the first cut the group C α and B 100 α positively affected the
quality of silage. The lowest pH value was observed in group B 100 α
(4.01). The highest values of lactic acid showed the groups C α and B 100
α (both in average 34.73 g.kg-1 DM). In the second cut the best results
were achieved in the group BIOS β (pH value 4.26 and content of lactic
acid 30.27 g.kg-1 DM).
Acknowledgment: This study was supported by project NAZV no. QH
92252 and MZE 0002701404.
REFERENCE
Dewhurst R. J., Fisher W. J., Tweed J. K. S. Wilkins R. J. (2003):
Comparison of grass and legume silages for milk production. 1.
Production responses with different levels
of concentrate. J. Dairy Sci., 86, 2598-2611.
Narasimhalu P. and Sanderson J. B. (1993): Composition and utilization
in sheep of unwilted and wilted silages prepared from seeding year red
clover (Triforium pratense L.) cut at two maturity stages. Can. J. Plant
Sci., 87-91.
Rada V. (2009): Siláž a zdraví zvířat. Vědecký výbor výživy zvířat, Praha,
40 s.

121
Slottner D. and Rammer C. (2001): Ensiling of different legumes
compared to grass. Uppsala, Sweden, ID # 21-13. [online]. [cit. 16. 7.
2012]. Dostupný na WWW:
<
http://www.internationalgrasslands.org/files/igc/publications/2001/id2113.
pdf >.
Vanhatalo A., Kuoppala K., Ahvenjärvi S a Rinne M. (2009): Effects of
feeding grass or red clover silage cut at two maturity stages in dairy cows.
1. Nitrogen metabolism and supply of amino acids. J. Dairy Sci., 92, 11,
5620-5633.
Vyhláška č. 415/2009 Sb. o stanovení požadavků na odběr vzorků a
způsobu zveřejnění metod laboratorního zkoušení produktů ke krmení.
[online]. [cit. 10. 1. 2011]. Dostupný na
WWW:<http://www.ukzuz.cz/Folders/Articles/108374-2
Seznam+metod+zkouseni+krmiv.aspx>.

122

123
EFFECT OF THE ADDITION OF TAURINES ON THE
ANTIOXIDANT ACTIVITY AND SOD
LUKEŠOVÁ, K., KROBOT, R., MLEJNKOVÁ, V., FRÖHDEOVÁ,
M., ZEMAN, L.
Department of Animal Nutrition, Mendel University in Brno
ABSTRACT
The work aimed at detecting the influence of taurine addition on
the antioxidant activity and on the level of superoxide dismutase in
erythrocytes. Experimental animals were males of the common laboratory
rat (Wistar Han), which received feed mixtures with taurine added at 0mg,
1000mg, 1500mg, 2000mg, 2500mg and 3000mg. The animals were
divided into six groups, each of 8 animals. The duration of the experiment
was 28 days.
Our research results demonstrated positive relations between the
level of taurine and antioxidants. The results show a significant effect of
taurine on the antioxidant activity established by ABTS (2.2´-azinobis (3-
ethyl-2,3-dihydrobenzothiasol-6-sulphonic acid) and the SOD antioxidant
enzyme (superoxide dismutase) at a level of significance P ≤ 0.01. A
statistically significant difference in establishing the antioxidant activity
by means of ABTS was observed between Group 2 (mean 201.06μg.ml-1)
and Groups 4, 5 and 6 (mean of Group 6 was 256.51μ.ml-1). The SOD
level in Group 3 was significantly lower than in Groups 4, 5 and 6. The
mean of Group 2 (125.49) was statistically significantly lower also in
Groups 4 (144.45) and 5 (156.63).
Key words: Taurine, antioxidant activity, superoxide dismutase, rats,
ABTS

124
MATERIAL AND METHODS
The work aimed at monitoring the influence of taurine addition on
the level of superoxide dismutase and antioxidant activity.
The trial was conducted in the experimental facility operated by
the Department of Animal Nutrition and Forage Production, Faculty of
Agronomy, Mendel University in Brno (according to Act no. 246/1992
Coll.).
The laboratory animals were stocked in and divided into groups.
The day of their introduction into the trial was marked as "Day 0" and the
animals were given time to acclimate in boxe
and develop a hierarchy while being offered a control feed mixture. The
fourth day after the stocking-in of the animals was marked as
"Experimental day 1".
The laboratory monitoring was focused on microclimate
conditions, which are limited namely by temperature that was measured
by "DATA LOGGER Model S 3120" and maintained within a range from
23 °C ± 1 °C. The same instrument was used to monitor permanent air
humidity, which was maintained at 60% by an air-conditioning unit. The
photoperiod was controlled artificially according to the following scheme:
day 12 hours, night 12 hours, at a maximum intensity of 200lx.
The experimental animals were growing males of the common
laboratory rat (Wistar han outbred phylum)), which were introduced into
the trial at an age of 28 days and grouped so that a maximum weight
difference between the experimental groups was up to 5g
(KACEROVSKY, 1990).
The experimental monitoring lasted for 28 days. The rats were
kept in plastic cages by eight males each and they were marked by colours
for easy resolution. In total there were 48 animals divided into 6 groups by
8 males. Feeding rations were composed of unobjectionable components
and differed only in the addition of taurine (see Tab. 1).

125
Parameters monitored during the experiment were as follows: net
intake of experimental feed mixtures, health condition, weight increment,
feed intake and conversion. The litter for the animals was replaced once a
week. Feed leftovers of each group were collected and weighed.
The haematological examination was made with 2ml of whole
blood sampled into a test-tube with EDTA and a blood count was
established for erythrocytes (ERY), leucocytes (LEU), trombocytes
(TROMBO), haemoglobin (Hb) and haematocrit (Ht). In the following
step, the levels of taurine and metallothionein in the blood were
determined. In the last step, the antioxidant activity was established by
using different methods (SOD, GPx, GST etc.).
The experiment was ended by heart puncture, collection of blood samples,
brain and liver samples and by the subsequent freezing of the remaining
body parts.
Table 1: Taurine additions in the groups
Group TAU addition (mg) 1 0 2 1000 3 1500 4 2000 5 2500 6 3000
RESULTS AND DISCUSSION
Our experiments demonstrated a positive influence of taurine on
the antioxidant chain. Selected parameters included the level of
superoxide dismutase and the establishment of antioxidant activity by
means of ABTS ((2.2´-azinobis(3-ethyl-2,3-dihydrobenzothiasol-6-
sulphonic acid). As obvious from Graph no. 1, the antioxidant activity of

126
ABTS was gradually increasing with the growing amount of taurine in the
feeding ration of the animals. A statistically significant difference can be
seen between Group 2 and Groups 4, 5 and 6 with the mean of Group 2
being statistically significantly lower than in the other groups. No
significant differences were found between Group 2 and Groups 1 and 3
(see Fig. 1).
Taurine affected also the most important antioxidant enzyme
produced in the reproduction system of mammal males – superoxide
dismutase (SOD). Graph 2 shows the increasing trend of the SOD level in
erythrocytes in dependence on the dose of taurine. Fig. 2 indicates that the
SOD level in Group 3 was lower than in Groups 4, 5 and 6. The mean of
Group 2 was significantly lower than in Groups 4 and 5 and the mean of
Group 5 was higher than the mean of Group 1.
Comprehensive results of the experiment including means of
individual groups and standard deviations are presented in Tab. 2.
Statistical results were processed at a level of significance P ≤ 0.01.
Graph 1: Antioxidant activity measured by means of ABTS
y = 0,0283x + 182,14R2 = 0,3894
y = -2E-05x2 + 0,1208x + 101,22R2 = 0,4802
0,00
50,00
100,00
150,00
200,00
250,00
300,00
350,00
0 500 1000 1500 2000 2500 3000 3500
TAU
AB
TS a
ntio
xida
nt a
ctiv
ity –
ery
thro
cyte
s
Řada1
Linear (ABST antioxidant activity – erythrocytes)
Polynomial (ABTS antioxidant activity –erythrocytes)

127
Fig. 1: Statistical table of ABTS
Cell Tukey HSD test, Variable antioxidant activity Prom Antioxidant activity of ABS– ery, 1 2
2 2 201.0605 **** 3 3 222.9778 **** **** 1 1 237.2675 **** **** 5 5 253.6866 **** 6 6 256.5118 **** 4 4 259.7031 ****
Graph 2: Level of superoxide dismutase
Fig. 2: Statistical table of SOD
Cell Tukey HSD test, Variable SOD – ery, homogeneous groups, alpha Prom 1 SOD-ery, 1 2 3 4
3 3 121.0913 **** 2 2 125.4862 **** **** 1 1 126.6538 **** **** **** 6 6 140.0338 **** **** **** 4 4 144.4525 **** **** 5 5 146.6263 ****
y = -7E-06x2 + 0,0402x + 88,104R2 = 0,3556
y = 0,0109x + 113,69R2 = 0,3075
0,0
20,0
40,0
60,0
80,0
100,0
120,0
140,0
160,0
180,0
0 500 1000 1500 2000 2500 3000 3500
TAU
SO
D –
ery
thro
cyte
s
Řada1Polynomial (SOD – erythrocytes)Linear (SOD – erythrocytes)

128
Table 2: Summary of results
Group TAU(mg) Antioxidant Standard SOD- Standard 1 0 237.27 31.23 126.65 9.62 2 1000 201.06 19.75 125.49 13.17 3 1500 222.98 28.90 121.09 8.94 4 2000 259.70 18.91 144.45 9.41 5 2500 253.69 24.32 146.63 9.25 6 3000 256.51 26.21 140.03 8.55
Anand et al. (2011) demonstrated the relation between taurine and
the antioxidant chain. Their study showed that the long-term peroral
administration of taurine to common laboratory rats affected the levels of
glutathione peroxidase, glutathione reductase and glutathione. Anand et
al. (2010) conducted their taurine studies repeatedly and found also the
influence of taurine on common haematological parameters. The
connection of taurine with the antioxidant chain was also demonstrated by
Nandhini et al. (2005) from the work of who followed that animals, which
were administered taurine, exhibited a higher SOD value.
CONCLUSION
In our experiment, we demonstrated positive relations between the
level of taurine and antioxidants. Our experimental results show a
significant effect of taurine on the antioxidant activity ascertained by
means of ABTS and SOD at a level of significance P ≤ 0.01. The
significant difference can be seen in the establishment of antioxidant
activity by means of ABTS between Group 2 (mean 201.06μg.ml-1) and
Groups 4, 5 and 6 (Group 6 mean 256.51μg.ml-1). The level of antioxidant
enzyme SOD in Group 3 was statistically significantly lower than in
Groups 4, 5 and 6. The mean of Group 2 (125.49) was also statistically
significantly lower than in Groups 4 (144.45) and 5 (156.63). Thus, it

129
follows from our results that the addition of taurine into feed mixtures had
a positive effect on the selected blood parameters.
Acknowledgement: The project was supported by IGA MENDELU Brno
No IP 4/2012.
REFERENCES
ANAND, P., RAJAKUMAR, D., FELIX, A. J., BALASUBRAMANIAN,
T. 2010: Effects of oral administration of antioxidant taurine on
haematological parameters in Wistar rats. Pak J Biol Sci. 13(16):785-93.
ANAND, P., RAJAKUMAR, D., JERAUD, M., FELIX, A. J.,
BALASUBRAMANIAN, T. 2011: Effects of taurine on glutathione
peroxidase, glutathione reductase and reduced glutathione levels in rats.
Pak J Biol Sci. 14(3):219-25.
KACEROVSKY, O. 1990: Testing and assessment of fodders. (in Czech),
Prague, 1st Edition, SZN:216-217. ISBN 80-209-0098-5.
NANDHINI, A.T.A., THIRUNAVUKKARASU, V.,
RAVICHANDRAN, M.K., ANURADHA, C.V. 2005: Effect of taurine on
biomarkers of oxidative stress in tissues of fructose-fed insulin-resistant
rats. Singapore Med J. 46(2):82.

130

131
EFFECT OF THE FEED ADDITIVE CLINOPTILOLITE ON
BLOOD PLASMA PARAMETER OF LAYING HENS
MACHÁČEK, M.1- SUCHÝ, P.1- STRAKOVÁ E.2
1 Department of Animal Husbandry and Animal Hygiene
2 Department of Animal Nutrition
SUMMARY
The aim of our study was to set the effect of clinoptilolite
(ZeoFeed), natural additive, in feedstuff in amount 2 % and 4 % on blood
plasma parameters as total protein, glucose, cholesterol, triglyceride, AST
and minerals as calcium, phosphorus and magnesium in Bovans Goldine
hybrid. The study set, that the clinoptilolite in doses up to 4 % in feedstuff
haven´t statistical significant effect on blood plasma parameters and the
parameters were in physiological range.
Key words: Clinoptilolite, total protein, cholesterol, triglyceride, AST,
calcium, phosphorus, magnesium
INTRODUCTION
Feeding additives are important for correct animal grown and for
ensure optimal production. One of these feed additives is clinoptilolite.
Clinoptilolite is mineral from zeolite group. Zeolite is crystallic
aluminosilicate with cubic structure (Noori et al., 2006). The effect of
zeolite is ion changing from environment (Pond et al., 1984). They can
eliminate ammonium and mycotoxins (aflatoxin) from feedstuff in
digestive tract (Ortatatli et al., 2005). Feeding additives have positive
effect on feedstuff conversion and on meat utilization (Acosta et al.,
2005). Zeolite is too added in to the bedding, where they can eliminate the
ammonium from stable air and then they can improve the stable

132
microclimate and then they can ensure animal health and productivity
increasing (Eleroglu a Yalcin, 2005). In laying were set higher feedstuff
utilization, laying increasing and higher shell stability (Olver, 1997).
Zeolite increase the egg weight and have the positive effect on chemical
and quantitative eggs parameters (Papaioannou et al., 2005). The literature
didn´t set the clinoptilolite effect on hematological and biochemical blood
parameters. So the aim of our study was to set, if the clinoptilolite in
laying hens hasn´t negative effect on this parameters.
MATERIALS AND METHODS
For our study, we selected 24 Bovans Goldine, hybrid laying
hens. These laying hens were divided in to three balanced groups. One
group was control (C) and two were experimental (E1 and E2). Laying
hens were separated individually in experimental cages. In cages were
with automatic watering and manual feeding. The drinking water and
feeding mixture eat hens ad libitum. The stable parameters as temperature
and lighting environment were continual controlled and the parameters
were set for this hybrid. Laying hens were feeding by complete feeding
mixture of same composition. In the feeding mixture for first experimental
group E1 were given 2 % of zeolite and for the second experimental group
E2 were given 4 % of zeolite (ZeoFeed).The clinoptilolite was a substitute
for the same part of wheat. After 28 days, at the end of the experiment,
we take from all laying hens the blood from vena basilica and this samples
were examined for biochemical values.
RESULTS
The results of our experiment are in the Table 1. From the results
you can see, that there were no statistical significant differences between
controlled parameters. The amount of glucose in plasma in experimental
groups with added clinoptilolite (E1 and E2), were higher, than in control
133
group (C), but this different wasn´t statistical consequence. The value of
glucose in C group was 11.8 mmol/l, in the group E1 was 12.42 mmol/l
and in the group E2 was 12.46 mmol/l. There were lower values of total
protein, cholesterol and triglyceride in blood plasma in experimental
groups with clinoptilolite, but there were so big differences between
laying hens, so that the differences weren´t statistical consequence. AST
values in control group (C) were 2.49 µkat/l, in experimental group E1
(with 2 % of clinoptilolite) 2.19 µkat/l and in group E2 (with 4 % of
clinoptilolite) 2.79 µkat/l. Mg values in blood plasma were in all three
groups around 1.40 mmol/l. Values of Ca were in each group from 6.84 to
7.34 mmol/l. Values of P were in control group (C) 3.15 mmol/l and in
experimental group E1 3.12 mmol/l. In experimental group E2 with 4 %
of clinoptilolite were the values lover, it was only 2.56 mmol/l. All blood
plasma parameters were in physiological range.
Table 1. Results of blood plasma examination in laying hens (n = 8) after
28 days of experiment (x ± SD)
C E1 2 % E2 4 % Total protein (g/l) 57.26 ± 5.782 52.81 ±
4.880 54.28 ± 5.935
Cholesterol (mmol/l)
5.35 ± 1.422 4.32 ± 1.202 4.71 ± 1.284 AST (µkat/l) 2.49 ± 1.019 2.19 ± 0.481 2.76 ± 1.092 Triglyceride (g/l) 27.68 ±
11.460 24.43 ± 6.576
25.75 ± 10.030 Glucose (mmol/l) 11.81 ± 0.439 12.42 ±
0.746 12.46 ± 1.372
Mg (mmol/l) 1.39 ± 0.255 1.41 ± 0.108 1.40 ± 0.105 Ca (mmol/l) 7.09 ± 1.880 6.84 ± 1.246 7.34 ± 1.097 P (mmol/l) 3.15 ± 0.675 3.12 ± 0.395 2.56 ± 0.704
CONCLUSION
In experiment was the clinoptilolite apply in to the nutrition of
laying hens. We were study the clinoptilolite effect on blood plasma in
134
laying hens. We didn´t see any statistical consequence differences of
biochemical parameters in blood plasma in control group and in
experimental groups where we added the clinoptilolite in to the feeding
mixture in dose 2 % and 4 % of clinoptilolite. In experimental groups (E1
and E2) were higher concentration of glucose and lower concentrations of
total protein, cholesterol and triglyceride than in control group (C), but
these differences wasn´t statistical consequence. We can say, that the
clinoptilolite which is added in to the feeding mixture for laying hens in
doses 2 % and 4 % have any effect on blood plasma parameters.
Acknowledgements: Financial support from the Ministry of Education,
Youth, and Sports of the Czech Republic (Grant No MSMT 6215712402)
is gratefully acknowledged.
REFERENCES
Acosta, A., Dieppa, O., Lon-Wo, E. Effect of the natural zeolite
(Clinoptilolite) and of the different feeding schemes on the productive
performance of broilers. Cuban Journal of Agricultural Science, 2005,
vol. 39, no. 3, p. 311-316.
Noori, M., Zendehdel, M., Ahmadi, A., 2006. Using natural zeolite for
improvement of soil salinity and crop yield. Toxicol. Environ. Chem. vol.
88, p. 77–84.
Olver, M.D., Effect of feeding clinoptilolite (zeolite) on the performance
of three strains of laying hens. British Poultry, 1997, vol. 38, p. 220-222
Ortatatli, M., Oğuz, H., Hatipoğlu, F., Karaman, M. Evaluation of
pathological changes in broilers during chronic aflatoxin (50 and 100 ppb)
and clinoptilolite exposure, Veterinary Science, 2005, vol. 78 p. 61–68
Papaioannou, D., Katsoulos, P.D., Panousis, N., Karatzias, H. The role of
natural and synthetic zeolites as feed additives on the prevention and/or

135
the treatment of certain farm animal diseases, Microporous and
Mesoporous Materials, 2005, vol. 84, p. 161–170
Pond, W. G., Laurent, S. M., Orloff, H., D. Effect of dietary clinoptilolite
or zeolite Na-A on body weight gain and feed utilization of
growing lambs fed urea or intact protein as a nitrogen supplement,
Zeolites, 1984, vol.4, p. 127-132
Eleroglu, H., Yalcin, H., Use of natural zeolite – supplemented liter
increased broiler production. South Africa Journal of Animal Science,
2005, vol. 35, no. 2, p. 90-97

136

137
EFFECT OF EVENING PRIMROSE OIL ON BIOCHEMICAL
PARAMETERS OF THOROUGHBRED HORSES UNDER
MAXIMAL TRAINING CONDITIONS
MIKEŠOVÁ, K.1 - HÄRTLOVÁ, H.2 - ZITA, L.3 - HUČKO, B.1 –
MAREČEK, E.4
1 Czech University of Life Sciences Prague, Faculty of Agrobiology, Food
and Natural Resources, Department of Microbiology, Nutrition and
Dietetics, Czech Republic 2 Czech University of Life Sciences Prague, Faculty of Agrobiology, Food
and Natural Resources, Department of Veterinary Sciences, Czech
Republic 3 Czech University of Life Sciences Prague, Faculty of Agrobiology, Food
and Natural Resources, Department of Animal Husbandry, Czech
Republic 4 Independent expert for animal nutrition
Abstract
The aim of the study was to examine changes in antioxidant
capacity of the organism after administration of Evening Primrose Oil and
its influence on the change of activity of selected muscle enzyme in blood
serum. The sixteen-week experiment was performed on 10 clinically
healthy Thoroughbred horses. Each of these horses was been in a regular
training program. First 8 weeks of experiment the horses were fed of diet
without Evening Primrose Oil (blood sampling 3 times) and next 8 week
with diet supplemented of 150 ml of Evening Primrose Oil (blood
sampling 3 times). Analysis of total antioxidant activity (TAS), aspartate
aminotransferase (AST), creatine kinase (CK), lactate dehydrogenase
(LD) and gamaglutamyl transafrase (γ GT) were analyzed with

138
commercially available kits. The values of TAS of the horses after
supplementation of Evening Primrose Oil were gradually rising and
detected values were significantly higher (P ≤ 0.05) than values of the
horses without oil. Closely correlation was found out between values of
TAS and activity of LD in 5th and 6th sampling. At the end of the
experiment (6th sampling) the close correlation was also found between
TAS and activity AST. In conclusion, we could say that total antioxidant
activity of the Thoroughbred horses fed with diet of the Evening Primrose
Oil was higher and enabled to stabilize permeability of the muscle cells
membranes in the horses at full workload.
INTRODUCTION
Physical exercise enhances production of reactive oxygen species
(ROS) which cause lipoperoxidation of cell membranes and damage
tissue, especially musculoskeletal system (Chiaradia et al., 1998;
Kinnunen et al., 2005). The reason is that skeletal muscles exhibit lower
levels of antioxidants compared to other tissues (Morrow et al., 1990).
Indicators of disturbance of muscle cells permeability in blood serum are
activity of enzymes aspartate aminotransferase (AST), creatine kinase
(CK) and lactate dehydrogenase (LD) (McGowan et al., 2008). In case
that activity of muscle enzymes is in the reference limits, AST does not
exceed 5.0 µkat.l-1 and CK is less than 1.7 µkat.l-1, integrity of muscle
cells membrane are not overloaded (Harris, 2000). However, activity of
CK has a short half-life up – 2 hours and will therefore be increased only
from 4 to 12 hours after cell membrane disruption, unlike AST activity
whitch has half life up to 7 days (Harris et al., 1998; Harris, 2000). Also
changes of enzyme activity γ – glutamyltransferase (γ GT) was associated
with overtraining of horses (Snow, 1987), but recent studies have not
confirmed this assessment completely (Rivero et al., 2008).

139
Effective antioxidant defence system protects the organism
against overproduction of reactive oxygen species (ROS) (Sacheck and
Blumberg, 2001). The defence system is made from enzyme and non-
enzyme antioxidants, which remove ROS and thereby limit their
destructive effect on tissue (Avellini et al., 1999; Sacheck and Blumberg,
2001). Animals do not have such a high concentration of non-enzymatic
antioxidants in comparison with man (White et al., 2001; De Moffarts et
al., 2005). Therefore intake of antioxidants in the feed, especially in
horses, is necessary. Addition of Evening Primrose Oil with a higher
content of gamma-linolenic acid and a number of antioxidants such as
catechin, epicatechin, gallic acid and α-tocopherol (Wettasinghe et al.,
2002; Lu and Foo, 1995) to the diet can change the situation in favor of
increased antioxidant capacity of the race horses organism (Belch and
Hill, 2000). The effect of Evening Primrose Oil on oxidative stress is
related not only to its inhibitory effect on lipid peroxidation, but also with
the support of the glutathione synthesis (De La Cruz et al., 1997).
The aim of the study was to examine changes in antioxidant
capacity of the organism after administration Evening Primrose Oil and its
influence on the change of activity selected muscle enzyme in blood
serum.
MATERIALS AND METHODS
The experiment was performed from June 2012 to October 2012
on 10 clinically healthy Thoroughbred horses (5 male, 5 female, age 3-5
years, weight 470 ± 30 kg). Each of these horses had been in a regular
training program prior to the study.
The diet of the horses was based on oats, meadow hay, Fitmin
Horse House müsli (Dibaq a. s., ČR), Fitmin Horse Opti (Dibaq a. s., ČR),
Fitmin Horse Energy (Dibaq a. s., ČR) (Table 1) and supplement of
vitamins and minerals (Equistro, Vetoquinol, s.r.o.). An examination of

140
the diet compounds was performed by laboratory of Czech University of
Life Sciences Prague. The horses had free access to water. Feeding doses
were related to the rate of maximal workload.
First 8 weeks of the experiment all horses were fed with the diet
without Evening Primrose Oil – sampling 1, 2, 3. Next 8 weeks all horses
continued with this diet and the food dosage was supplemented with 150
ml of Evening Primrose Oil – sampling 4, 5, 6.
The exercise of horses in experiment was maximal through the
whole time of experiment and training protocol (Table 2).
The blood samples were collected every 2 weeks into
polyethylene tubes from jugular vein (Vacutainer system Sarstedt, s.r.o.,
UK) in 6. 30 a.m. (which is ½ hour after feeding) and were immediately
processed in the laboratory. The biochemical parameters of enzymes -
aspartate aminotransferase (AST), gamaglutamyl transferase (γ GT),
creatine kinase (CK) and lactate dehydrogenase (LD) were determined by
commercial kits (Erba Lachema, s.r.o., ČR) and total antioxidant activity
was determined by commercial kit ((RANDOX Laboratories Ltd, UK) on
an automatic analyser XL – 200 (Erba Lachema s.r.o., ČR).
The data were first subjected to repeated measures, split-plot
design analysis of variance using the SAS statistical software package
(SAS V91, SAS Institute Inc.) and treatment alignments were done using
the least squares significant difference method (Duncans̕ Multiple Range
Test). For all the statistical analyses, the level of significance was set at
P < 0.05, and the data were presented as means ± SE.

141
Table 1. Composition of the nutrients feedstuff (Thoroughbred horses 500 kg, maximal workload)
Nutrients Meadow Oats Fitmin Fitmin Fitmin ∑ Dry matter 6521.2 3569.2 468.85 744.56 905 12208.81 N- 398.3 388 767 61.84 106.1 1721.24 Ash (g) 364 128 40.65 10.8 59.2 602.65 Ether 114.1 157.2 33.5 81.6 49.2 435.6 Fiber (g) 2695 389.2 26 14.56 55 3166.76
Table 2. Training program protocol of the Thoroughbred horses
Days of week Gait Duration Speed
Monday and Thursday
Walk 10 min 100 m/min Trot 20 min 200 m/min
Canter 6 min 350 m/min Walk 10 min 100 m/min
Tuesday and Friday
Walk 15 min 100 m/min Trot 20 min 200 m/min
Galop 3 min 800 m/min Walk 10 min 100 m/min
Wensday and Saturday
Walk 15 min 100 m/min Trot 8 min 300 m/min Walk 15 min 100 m/min Walk 15 min 100 m/min
RESULTS
The activity of aspartate aminotransferase (AST) in blood serum
of the monitored horses with respect to time and supplementation of
Evening Primrose Oil was in the 4th sampling significantly higher (P ≤
0.05) than in sampling 5th and 6th. Similarly as activity of gamaglutamyl
transferase (γ GT).

142
The value of activity creatine kinase (CK) in 5th sampling was
significantly higher (P ≤ 0.05) than other sampling . The reason was
extremely high value of CK one horse of monitored group (28.8 µkat.l-1).
Activity of lactate dehydrogenase (LD) of the horses fed with diet
supplemented of Evening Primrose Oil (4th, 5th and 6th) were
significantly higher (P ≤ 0.05) than values of activity LD of horses fed the
diet without Evening Primrose Oil (1st, 2nd and 3rd).
Table 3. Activity of muscle enzymes and total antioxidant status
in blood serum before (sampling 1, 2, 3) and after application of Evening
Primorose Oil (sampling 4, 5, 6).
Statistically significant differences (P<0.05) in the rows are indicated by different
alphabetic superscripts.
The values of total antioxidant activity (TAS) gradually rose and
were detected significantly higher (P ≤ 0.05) at the last two sampling (5th,
6th) than sampling 1st-4th. Closely correlation was reported between
values of TAS of horses who were fed with diet supplemented of Evening
Primrose Oil and activity of LD in 5th and 6th sampling. At the end of the
experiment (6th sampling) was found close correlation between the values
of activity AST and the value of TAS (Table 4).
Measure
ments n
Date/sampling 13.6.12/ 4.7.12/2 8.8. 2/3 5.9.12/4 19.9. 3.10.12/6
means ± SE TAS 1 0.65±0. 0.69±0.1 0.89±0.0 0.79±0.1 1.25±0.4 1.16±-AST 1 5.936±1 7.006±0. 5.829± 7.325±0. 5.956±0. 6.512±0.γ GT 1 0.480±0 0.555±0. 0.508±0. 0.657±0. 0.543±0. 0.464±0.CK 1 1.543±0 2.03±0.7 3.998±1. 3.214±0. 6.128±7. 3.887±1.LD 1 2.515±0 3.192±0. 4.848±0. 4.384±1. 4.881±1. 4.725±0.

143
Table 4. Correlation between activity of muscle enzymes and total
oxidation activity in blood serum in the 5th and 6th sampling
Parameter/date AST
(µkat.l
γ GT
(µkat.l-1)
CK
LD
(µkat.l
TAS
(mmol.l-1) AST
(µkat.l-1)
19.9.12./5
3.10.12/6
γ GT
(µkat.l-1)
19.9.12./5 0.115
3.10.12/6 0.162
CK
(µkat.l-1)
19.9.12./5 0.226 -0.484
3.10.12/6 0.661 0.539
LD
(µkat.l-1)
19.9.12./5 0.340 -0.489 0.863
3.10.12/6 0.690 -0.127 0.609
TAS
(mmol.l-
1)
19.9.12./5 0.182 0.078 0.519 0.646A 3.10.12/6 0.765
A
0.287 0.468 0.661A Statistically significant differences (P<0.05) in the rows are indicated by alphabetic
superscripts.
DISCUSSION AND CONCLUSION
The aim of this work was to confirm that the addition of Evening
Primrose Oil in the diet can increase the antioxidant capacity of the
organism of racehorse at full load. The effect of Evening Primrose Oil
with a higher content of gamma - linolenic and many antioxidants such as
catechin, epicatechin, gallic acid and α-tocopherol (Wettasinghe et al.,
2002; Lu and Foo, 1995) shown increase of total antioxidant activity. This
effect was well observed in 5th and 6th sampling, i. e. after six weeks of
saturation with Evening Primrose Oil. There were values of TAS
significantly higher in comparison with period when the diet did not
contain the oil. Although that the activities of muscle enzymes AST and
CK exceeded the values of activities, marked by Harris (2000) as the
reference and thus it could be indicative of greater permeability of cell
membranes of muscle cells (Valberg, 2009), there was non significant

144
dynamic during the reporting period. This fact would correlated to the
statement of Jagrič et al. (2012) who shows the values of the activities of
these enzymes after exercise, comparable with the values we identified.
Minimal changes in the activities of gamaglutamyl transferase (γGT) were
consistent with the conclusions of the study Rivero et al. (2008) more than
with the findings that publicated in their studies, Snow (1987). LD
activities were significantly higher in the period when horses were
saturated Evening Primrose Oil, compared with the period without the
addition of this oil. Values of LD activities were half compared with
values reported 32 hours after exercise in endurance horses (Teixeira-Neto
et al., 2008), which can be considered as a positive finding. It can be
assumed that the higher antioxidant capacity keep tissue from continuing
to such maximum load levels of oxidative stress, which prevented the
massive release of enzymes from these tissues.
On behalf of our trial it was found out that intake of Evening
Primrose Oil in dosage of 150 ml per horse statistically and significantly
influenced AST, LD. We are not known to fact that these values could be
influenced by different manner.
For this reason, it can be stated that the intake of antioxidants
through Evening Primrose Oil is beneficial and it allows to thoroughbred
horses to compensate with the maximal load without significant disruption
of musculoskeletal disorders.
If our findings were confirmed by other experiments considering
thisissue, usage of Evening Primrose Oil could be effective method for
improvement of health condition of horses in load.
REFERENCES
1. Avellini, L., Chiaradia, E., Gaiti, A. 1999. Effect of exercise training,
selenium and vitamin E on some free radical scavengers in horses

145
(Equus caballus).Comparative Biochemistry and Physiology Part B:
Biochemistry and Molecular Biology. 123(2): 147 – 154.
2. Belch, J.J., Hill, A. 2000. Evening primrose oil and borage oil in
rheumatologic conditions. American Journal of Clinical Nutrition.
71(1): 352 - 356.
3. De La Cruz, J.P., Martín-Romero, M., Carmona, J.A., Villalobos,
M.A., Sánchez de la Cuesta, F. 1997. Effect of evening primrose oil
on platelet aggregation in rabbits fed an atherogenic diet. Thrombosis
Research. 87(1): 141 – 149.
4. De Moffarts, B., Kirschvink, N., Art, T., Pincemail, J., Lekeux, P.
2005. Effect of oral antioxidant supplementation on blood antioxidant
status in trained thoroughbred horses. Veterinary Journal. 169(1): 65 –
74.
5. Harris, P.A. 2000. Myopatie koní a jejich vztah k výživě. In: Sborník
referátů pracovního semináře ČHS. Brno. 1 - 37.
6. Harris, P.A., Martin, D.J., Gray, J. 1998. Plasma aspartate
aminotransferase and creatine kinase activities thoroughbred
racehorses in relation to age, sex, exercise and training. The
Veterinary Journal. 155(3): 295 - 304.
7. Chiaradia, E., Avellini, L., Rueca, F., Spaterna, A., Porciello, F.,
Antonioni, M.T. 1998. Physical exercise, oxidative stress and muscle
damage in racehorses. Comparative Biochemistry and Physiology and
Molecular Biology, Part B. 119(4): 833 – 836.
8. Jagrič, M.S, Nemec, S.A., Zrimšek, P., Kramarič, P., Kos, K.V.,
Vovk, T., Kobal, S. 2012. Plasma malondialdehyde, biochemical and
haematological parameters in standardbred horses during a selected
field exercise test. Acta veterinaria (Beograd). 62(1): 53 - 65.
9. Kinnunen, S., Atalay, M., Hyyppä, S., Lehmuskero, A., Hänninen, O.,
Oksala, N. 2005. Effects of prolonged exercise on oxidative stress and

146
antioxidant defense in endurance horse. Journal of Sports Science and
Medicine. 4: 415 - 421.
10. Lu, F., Foo, L.Y. 1995. Phenolic antioxidant components of evening
primrose. In: Nutrition, Lipids, Health, and Disease, Ed. A. S. H. Ong,
E. Niki, L. Packer, AOCS Press, Champaign Il (USA), 86 - 95.
11. Morrow, J.D., Hill, K.E., Burk, R.F., Nammour, T.M., Bard, K.F.,
Roberts, L.J. 1990. A series of prostaglandin F2 – like compounds are
produced in vivo in humans by a non-cycloxygenase, free radical-
catalyzed mechanism. Proceedings of the National Academy of
Sciences USA. 87(23): 9383 - 9387.
12. McGowan, C. 2008. Clinical pathology in the racing horse: The role
of clinical pathology in assessing fitness and performance in the
racehorse. Veterinary Clinics of North America - Equine Practice.
24(2): 405 - 421.
13. Rivero, J.L., Piercy, R.J. 2008. Muscle physiology: responses to
exercise and training. In: Equine Exercise Physiology, The Science of
Exercise in the Athletic Horse. 30 – 80.
14. Sacheck, J.M., Blumberg, J.B. 2001. Role of vitamin E and oxidative
stress in exercise. Nutrition. 17(10): 809 – 814.
15. Snow, D.H. 1987. Exercise and training. In: Horse management. 2nd
ed., Academic Press Ltd. 331 – 397.
16. Teixeira-Neto, A.R., Ferraz, G.C., Moscardini, A.R.C., Balsamao,
G.M., Souza, J.C.F., Queiroz-Neto, A. 2008. Alterations in
muscular enzymes of horses competing long-distance endurance rides
under tropical climate. Arquivo Brasileiro de Medicina Veterinaria e
Zootecnia. 60(3): 543 - 549.
17. Valberg, S.J. 2009. The musculoskeletal system. Heritable muscle
diseases. N. E. Robinson, K. A. Sprayberry (Eds.), Current Therapy
in Equine Medicine, Saunders Elsevier. 461 – 468.

147
18. White, A., Estrada, M., Walker, K., Wisnia, P., Filgueira, G., Váldes,
F., Araneda, O., Behn, C., Martinéz, R. 2001. Role of exercise and
ascorbate on plasma antioxidant capacity in thoroughbred race horses.
Comparative Biochemical Physiology, Part A. 128(1): 99 – 104.
19. Wettasinghe, M., Shahidi, F. 2002. Iron (II) chelation activity of
extracts of borage and evening primrose meals. Food Research
International. 35(1): 65 – 71.

148

149
THE STUDY OF FACTORS INFLUENCING THE MICROBIAL
MICROFLORA OF SILAGES
MLEJNKOVÁ, V. – FRÖHDEOVÁ, M. – PŘICHYSTALOVÁ, J. –
LUKEŠOVÁ,
K. – KALHOTKA, L. – DOLEŽAL, P.
Department of Animal Nutrition and Forage Production, Mendel
University in Brno
ABSTRACT
The contamination of animal fodders with soil is important from
the viewpoint of the occurring clostridium spores, introduced into silages
with the contaminated forage. The subsequent feeding of such silages
leads to the transmission of undesirable microorganisms onto humans
through milk and milk products. Our trial included
6 different variants of experimental silages. Variants P0, P20 and P40
were without the ensiling additive with soil admixed at 0, 20 and 40g.kg-1
DM, while variants CH0, CH20 and CH40 were treated with a chemical
ensiling additive with the admixture of soil at 0, 20 and 40g.kg-1 DM.
Parameters monitored in the trial were the number of clostridium colonies,
the number of sporulating (spore-forming) microorganisms, and the total
number of microorganisms, moulds and yeasts. No statistically significant
difference was demonstrated for the admixed soil. The statistically
significant differences (P˂0.05) were found between the variants treated
and untreated with the chemical ensiling additive for clostridia between
the variants P0 (1.30E+03 ± 1.48E+02) and CH0 (3.18E+01 ± 1.96E+01),
and for moulds between the variants P40 (1.36E+01 ± 1.36+01) and CH40
(1.50E+02 ± 1.82E+01).

150
MATERIAL AND METHODS
The aim of the presented work is to evaluate the effect of soil
admixture in the chemical ensiling additive on the occurrence of
microorganisms in alfalfa silages by means of a micro-biological analysis.
In our model trial, we used alfalfa (Medicago sativa, var. Palava) from the
first cut of the experimental plots. The alfalfa was harvested in the phase
of floral buds formation and shortly wilted (4 hours) to 33% DM. A two-
factor model trial was established, in which the first factor was the soil
admixture at 0, 20 and 40g.kg-1 DM. The soil admixture was dosed with
regard to the expected ash content in the original matter (ca. 8% DM) and
to the intention that the ash content in the contaminated silages should
exceed 10%, which is considered to be limit value for the content of ash in
practice. The soil for contamination was obtained from the surface layer
of experimental plots (max. depth up to 1cm). The second factor was the
chemical ensiling additive and its influence on the microbiological
analysis of silages. In our trial, we used a control variant (with the
addition of the equivalent amount of drinking water to achieve the same
dry weight) and a chemical ensiling additive based on organic acids
(formic acid, propionic acid, benzoic acid and ammonium formate). The
trial included six variants of silages in three repetitions according to the
following scheme:
Table 1: Scheme of the experiment
P0 – control (untreated) CH0 – chemical additive P20 – control with soil admixture 20g/kg
CH20 – chemical additive and soil admixture 20g/kg of dry
P40 – control with soil admixture 40g/kg
CH40 – chemical additive and soil admixture 40g/kg of dry
The material of 6 kg in weight was rammed into special ensiling
containers, the design of which provided for their hermetic sealing and

151
permanent application of load onto the ensiled material. The model silages
were stored in the laboratory at an average laboratory temperature 24 – 26
°C for 8 weeks after which the ensiling containers were opened and a
representative sample was taken from each variant for the microbiological
analysis.
The cultivation medium for establishing the total number of
microorganisms was the PCA agar; the incubation occurred at 30 °C for
72 hours. The total amounts of yeasts and moulds were established by
using the Chloramphenicol glucose agar; the incubation occurred at 25 °C
for 120 hours. The sulphide-reducing clostridia (Clostridium perfringens)
were established with the use of TSN agar; the incubation occurred under
anaerobic conditions at 46 °C for 24 hours. The number of anaerobic
spore-forming microorganisms was ascertained on the PCA agar at 30 °C
within 48-72 hours, after the pasteurization at 85 °C for 5 minutes. After
the incubation, the grown colonies were counted on the Petri dishes and
results of the analyses were expressed in CFU per gram of the silage.
The results were statistically processed by using the ANOVA
method and differences between the respective groups were evaluated by
using Scheffe’s test according to SNEDECOR and COCHRAN (1967).
Differences between all the variants and differences between the variants
with the soil admixture and chemical ensiling additive were established.
The statistically significant difference is presented in the table by means
of coefficients with different indices (ab). The data are presented in the
text as average ± standard deviation.
RESULTS AND DISCUSSION
The aim of the experiment was to establish the influence of
admixed soil and chemical ensiling additive onto the occurrence of
clostridia in experimental alfalfa silages by means of the microbiological
analysis. Apart from the clostridia, complementary analyses during the

152
trial were to reveal the total number of microorganisms, spore-forming
microorganisms, moulds and yeasts.
The addition of soil into the initial alfalfa material did not increase
the abundance of clostridia in the silages. A statistically significant
difference (P˂0.05) was found between the silages treated with the
chemical ensiling additive (variant CH0) and silages untreated with the
chemical ensiling additive (variant P0) – see Tab. 2, Graph 1.
Graph 1: Statistically significant difference (P˂0.05) in clostridia
between variants P0 and CH0
In the other variants, the statistically significant difference was not
demonstrated (Tab. 2). The highest numbers of clostridia in the untreated
silages with the admixed soil as well as without the admixed soil reached
the maximum values of 103 CFU.g-1. The highest numbers of clostridia in
the silages treated with the chemical ensiling additive without the soil
admixture reached the maximum values ranging from 101 CFU.g-1 to 102
CFU.g-1. ZEMAN et al. (2006) inform that the highest number of
clostridia should be within up to 5 × 10³ CFU.g-1.
0,0200,0400,0600,0800,0
1 000,01 200,01 400,01 600,0
aver
age
valu
es o
f cl
ostri
dia
in C
FU/g
varinat P0 variant CH0

153
Table 2: The content of clostridia in experimental silages in CFU/g
soil admixture untreated (P) chemical additive (CH) index average ± st.dev. average ± st.dev.
0 1.30E+03 ± 1.48E+02 3.18E+01 ± 1.96E+01 ab 20 8.08E+02 ± 2.16E+02 1.23E+02 ± 1.11E+01 aa 40 8.80E+02 ± 3.71E+02 2.53E+02 ± 3.43E+01 aa
The number of sporulating microorganisms was gradually
increasing with the increasing soil admixture 0, 20 and 40 g.kg-1 DM but
no statistically significant difference was found. The evaluation of the
effect of the chemical ensiling additive in the variants with and without
the admixed soil (CH0, CH20, CH40) revealed no statistically significant
difference (Tab. 3).
Table 3: The content of spore-forming microorganisms in experimental
silages in CFU/g
soil admixture untreated (P) chemical additive (CH) index average ± st.dev. average ± st.dev.
0 3.55E+02 ± 1.19E+02 2.52E+02 ± 6.35E+01 aa 20 1.07E+03 ± 2.70E+02 6.14E+02 ± 3.74E+02 aa 40 6.62E+03 ± 8.49E+03 5.39E+02 ± 1.43E+02 aa
The total number of microorganisms did not show any statistically
significant difference either after the treatment of samples with the
chemical ensiling additive or after the addition of soil (Tab. 4). The total
number of microorganisms ranged from 107 CFU.g-1 in the untreated
variant to 105-106 CFU.g-1 in the variant treated with the chemical ensiling
additive. This group of microorganisms was ascertained to establish a
total level of the microbial colonization of the silages.

154
Table 4: The content of total number of microorganisms in experimental
silages in CFU/g
soil admixture untreated (P) chemical additive (CH) Index average ± st.dev. average ± st.dev.
0 1.67E+07 ± 1.38E+07 4.27E+06 ± 1.25E+06 aa 20 2.36E+07 ± 3.16E+06 4.61E+06 ± 2.22E+06 aa 40 2.19E+07 ± 9.67E+06 3.18E+05 ± 9.82E+04 aa
Yeasts are considered the main cause for the anaerobic instability
of silages. Acetic acid and propylene glycol developing during
fermentation are strong inhibitors of yeasts and mould strains (MATHIES,
2000). As to the yeasts, their abundance was decreasing with the
increasing amount of admixed soil but no statistically significant
difference was found (P˂0.05). As shown in Tab. 5, no statistically
significant difference (P˂0.05) was found between the silages treated with
the chemical ensiling additive and the untreated silages with or without
the admixed soil. Maximum numbers of yeasts in all the experimental
variants reached values of 102 CFU.g-1. No admissible limits are currently
stipulated for the amounts of yeasts and moulds. According to ZEMAN et
al. (2006), however, maximum concentrations of yeasts should be up to
104 CFU.g-1.
Table 5: The content of yeasts in experimental silages in CFU/g
soil admixture untreated (P) chemical additive (CH) index average ± st.dev. average ± st.dev.
0 1.97E+01 ± 1.19E+01 5.32E+02 ± 3.49E+02 aa 20 0.00E+00 ± 0.00E+00 2.41E+02 ± 2.07E+02 aa 40 1.52E+00 ± 2.14E+00 4.09E+01 ± 3.86E+01 aa
A statistically significant difference (P˂0.05) in the number of
moulds was demonstrated to exist between the silages treated (CH40) and

155
untreated (P40) with the chemical additive in the variants with the soil
admixture at 40 g.kg-1 DM (Tab. 6).
Graph 2: Statististically significant difference (P˂0.05) in moulds
between variants P40 and CH40
No statistically significant difference was demonstrated to occur
in the number of moulds with the admixed soil. In all the experimental
variants, the numbers of moulds reached maximum values ranging from
102 to 103 CFU.g-1. MUDŘÍK et al. (2006) as well as ZEMAN (2006)
consider the values of up to 105 CFU.g-1 to be a suitable limit for moulds.
The experimental silages complied with the required hygienic quality of
silages.
Table 6: The content of moulds in experimental silages in CFU/g
soil admixture untreated (P) chemical additive (CH) index average ± st.dev. average ± st.dev.
0 1.42E+02 ± 8.07E+01 2.41E+02 ± 7.78E+01 aa 20 8.03E+01 ± 7.82E+01 3.95E+02 ± 5.15E+02 aa 40 1.36E+01 ± 1.36E+01 1.50E+02 ± 1.82E+01 ab
0,0
50,0
100,0
150,0
200,0
aver
age
valu
es o
f mou
lds
in C
FU/g
varinat P40 variant CH40

156
CONCLUSION
Statistically significant differences (P˂0.05) were found for the
clostridia between the variants P0 and CH0, and for the moulds between
the variants P40 and CH40. The effect of the soil was recorded only in the
spore-forming microorganisms, in which the admixed soil increased the
amount of spore-formers. As to the yeasts, their number was decreasing
with the increasing amount of soil. These variants however did not show
any statistically significant differences (P˂0.05).
Acknowledgement: The study was supported from the Research Plan and
internal grant project (IGA) No IP 2/2012 "The risk incidence of clostridia
in silage."
REFERENCES
MATHIES E. (2002): Der natűrliche weg zu hőheren futterwertern. Erfolg
im Stall, No. 1, p. 2 – 4.
MUDŘÍK Z., DOLEŽAL P., KOUKAL, P. et al. (2006): Rudiments of
modern beef cattle nutrition (in Czech), Czech University of Life Sciences
Prague, Prague, 270 pp., ISBN 80-213-1559-8.
SNEDECOR, G. W., COCHRAN, W. G. (1976): Statistical Methods. 6th
Ed., Iowa. Iowa State University Press, 579 pp.
ZEMAN L., VESELÝ P., RYANT P. et al. (2006): Nutrition and feeding
of farm animals (in Czech), Profi Press, Prague, 360 pp. ISBN 80-86726-
17-7.

157
THE EFFECT OF INOCULANT CONTAINING LACTOBACILLUS
PLANTARUM AND ENTEROCOCCUS FAECIUM ON
MYCOTOXIN CONTAMINATION OF HIGH DRY MATTER
GRASS SILAGE
PASTIERIK, O.1 – ŠIMKO, M.1 – JURÁČEK, M.1 – BÍRO, D.1 –
GYÖNGYOVÁ, E.2
1 Department of Animal Nutrition, Slovak University of Agriculture in
Nitra, Tr. A. Hlinku 2, 949 76 Nitra, Slovakia 2 Schaumann Slovensko spol.s.r.o., Černyševského 26, 851 01 Bratislava
5, Slovakia
Corresponding author: tel: +421 37 6414 321, fax: 00421 37 741 1451,
e-mail: [email protected]
ABSTRACT
The aim of this experiment was to determine the effect of
multistrain, homofermentative silage inoculant in granulated form
containing L. plantarum and E. faecium on the mycotoxins contamination
of high dry matter grass silage. The wilted biomass from extensive
pernament grassland was inoculated (INO) in a rate 500 g per 1 t,
collected and ensiled to glasses in laboratory conditions. Uninoculated
herbage ensiled in the same way served as control (CON). The content of
FUM (P<0,05) and ZEA (P<0,001) was significantly lower in INO than in
CON silage. The maximal detected mean values were FUM 39,88 μg.kg-1,
ZEA 475,75 μg.kg-1, DON 395,3 μg.kg-1 and OTA 10,1 μg.kg-1 all in
CON silage. There were no significant differences (P>0,05) found
between CON and INO silage in T-2, DON and OTA content. The
ethanol content was found to be significantly higher (P<0,05) in CON
than in INO silage (6,19 vs. 3,52 g.kg-1, respectively). Lactic to acetic acid

158
ratio increased in INO (7,9) compared to CON silage (8,4). Silage
inoculants used in this experiment may moderately reduce mycotoxins
content in high dry matter silage.
MATERIAL AND METHODS
Grassland and forage description
Extensively managed permanent grassland located in the surrounding
of cooperative farm in Klenovec (Slovakia, Hnúšťa, 48°57’N, 19°90’E;
472 a.s.l.) was harvested for the high dry matter grass silage. There is a
heavy loam soil, the temperate climate, average annual temperature 7,7 °C
and an average annual rainfall of 744 mm, in this locality. In 2007, there
was extremely dry April and wet May reaching 12 % and 170 %
respectively of normal precipitation in this locality. In the 12 -14 June
2007, conditions for mowing and wilting were characterized by an
average temperature 20 °C, no rain and increasing cloud formation in the
afternoon. Agrostis gigantea was the prevalent species from flora
consisted of 80 % of grasses and minor presence of weeds and herbs.
Among others most abundant detected grass species were Agrostis
stolonifera L. and Alopecurus pratensis L. Grass was in the elongation
stage of development in the first cut.
Herbage treatment and ensiling
The herbage had been left on the field for 48 hours after harvest to
increase dry matter content. There was the chopping for 4 – 6 cm long
particles proceeded on silage cutter (self-propelled forage harvester)
Toron SP8-050 (Agrozet Prostějov, a.s., CZE) during the collection of
wilted mass from the field. The dose of 500 g per 1 t of wilted biomass
was applied by applicator for granulated inoculant at the chopper spout.
There were two consequent batches prepared: first untreated (CON) and
second treated by inoculant (INO). The granulated biological silage

159
additive contained multiple strains of Lactobacillus plantarum in
concentration 5 x 10⁸ CFU.g-1 and Enterococcus faecium in concentration
2 x 10⁸ CFU.g-1 with dry whey as a carrier. The effectivity of additive was
proven by test according to Regulation (EC) No 429/2008 on material
with the same botanical origin but different water-soluble carbohydrate
(WSC) content. The required amount of CON and INO wilted herbage to
fill 20 glasses (volume 4 dm3), 10 glasses for each treatment, was
withdrawn from treated and untreated herbage respectively. Glasses were
hermetically sealed and stored for 8 weeks in room temperature to the date
of sampling.
Sample collection and silage analyses
After 8 weeks of fermentation, the content of glasses for each
treatment was mixed separately and random sampling of CON and INO
took place. The analysis of silage for nutritional value, fermentation
characteristics, and some mycotoxins concentration was done in three
replicates for each treatment (n=3).
All samples were dried in forced-air oven at 60 °C for 48 h for
measurement of DM content and then ground through 1 mm diameter
screen using a laboratory mill (Fritsch, Germany). The chemical analysis
of were done according to standard procedures AOAC (1990). The dry
matter of all feed samples was determined by gravimetric method and
crude protein content by Kjehldahl method on Kjeltec system 1002
(Tecator, Sweden) resulting in calculation of crude protein as N x 6.25.
Ash content was obtained after 3h long combustion in a Muffle furnace
(530±20 °C) and consequent weighting of inorganic residue. Fat (ether
extract) was determined as the residue after extraction in petrol-ether by
Soxhlet-Henkel method on Soxtec HT 1043 Extraction Unit (Tecator,
Sweden). Crude fibre was determined by automatic analyzer Fibertec
System 1010 Heat Extractor (Tecator, Sweden). The OM was calculated

160
by substracting the ash from the DM content. The parameters of
fermentation characteristic were determined from aqueous extract
obtained after dilution of silages in the destilled water and filtering. pH
was measured in the diluted juice with pH-meter fitted with a glass
electrode. Consumption of 0,1 N KOH was measured after titration up to
pH = 8,5 to determine free acidity. The concentrations of acetic, lactic and
butyric were analysed by isotachophoresis on EA 100 (Villa Labeco,
SVK). Ethanol content was determined by microdiffusion method.
There were made detection of fumonisine (FUM), zearalenone
(ZEA), deoxynivalenol (DON), T-2 toxin (T-2), and total ochratoxins
(OTA) by enzyme-linked immunosorbent assay for the quantitative
analysis on ELISA Reader (Noack, SR) with using VERATOX test kit
(Neogen, Ltd., USA).
Statistical analysis
For statistical analysis, we used SAS software (SAS Institute,
2008) for ANOVA procedure to test differences in variability of the
means. The concentrations of mycotoxins are reffered as mean values
together with standard deviation and P-value.
RESULTS AND DISCUSSION
The nutritional value and fermentation characteristics of the grass
silage are recorded in Table 1. EE content was significantly higher
(P<0.05) in CON than in INO silage and that difference accounted for 7,8
%. Other differences between nutrient concentrations were not
significantly affected (P>0,05) by the treatment. The concentration of EE
between 24,4 – 32,2 g.kg-1 of DM falls into the range on similar DM
content in grass silage (Andrighetto et al., 1997). Contents of CP, EE and
OM were higher in CON silage, on the other hand Ash and CF were
higher in INO silage. In comparison with nutritional value of species such

161
as Lolium perrene or Festufolium braunii (Skládanka et al., 2009) the
treatment by biological preservative had no effect on organic nutrients of
silage.
The DM proportion of final grass silage was higher in both CON
(403.6 g.kg-1) and INO (408.1 g.kg-1) than DM content of LAB inoculant
treated and untreated grass silages measured by Rajčáková and Mlynár
(2009) who recorded bigger difference (± 11,6 g.kg-1). DM of INO was
higher than CON, but INO silage demonstrated high variability (table 1).
High dry matter of silage is a risk factor making biomass in fermentation
more prone to growth of fungi due to possible aerobic conditions (Boudra,
Morgavi, 2008). DM content of the high dry matter grass silage is in close
relationship with harvest date and intensity of grassland management
(Müller, 2009). The high quality silage has to meet strict requirements for
phenological phase of harvest, equal reduction of pH in the whole biomass
and anaerobic conditions stimulating proliferation of lactic acid bacteria
(Rolinec, 2006). ZEA, FUM, T-2 and DON are products of Fusarium
spp., which is most common in temperate regions producing mycotoxins
in strictly aerobic environment (Döll, Dänicke, 2011). We may assume
that two days long wilting appeared to be bordering with optimal length of
wilting in a given weather conditions. Increasing duration of wilting is in
positive relationship with fungal contamination (Skaar, 1996).
There was found significantly higher (P<0.05) ethanol content in
CON silage than in INO silage. Ethanol in high dry matter grass silage
without additive used to occur in higher concentrations (Driehuis,
Wikselaar, 2000). However, the lactic acid prevailed as a main
fermentation product being efficiently produced what is shown on high
lactic to acetic acid ratio reaching 7,9 in CON silage and 8,4 in INO
silage. Increase of lactic to acetic ratio compared to control is also
reported by Jalč et al. (2009) in grass silage inoculated by E. faecium and
L. plantarum. Butyric acid was absent in all silages (<0,2 g.kg-1),

162
indicating that both treatments were well preserved. The pH measured in
the final silage was 4,24±0,04 for CON and 4,27±0,012 for INO silage
(table 1). Fast decrease of pH in ensiled grass is the primary goal of silage
inoculants with LAB strains (Driehuis, Elferink, 2000). Fusarium toxins
might be binded by LAB, mainly ZEA and DON, but the binding of FUM
is greatly reduced with pH > 4 (Niderkorn et al., 2006).
Table 1. Mean values and standard deviation of the grass silage nutritional value and fermentation characteristics treated and untreated by inoculant
n=3 Unit CON INO
mean SD mean SD DM g.kg-1 of fresh matter 403,6 ±4,62 408,1 ±22,70 CP g.kg-1
of DM 126,5 ±2,95 124,1 ±3,97
EE 32,2* ±1,52 24,4* ±0,53 CF 308,8 ±8,62 315,9 ±5,91 Ash 98,4 ±0,42 100,4 ±0,49 OM 901,6 ±0,42 899,6 ±0,49
Fermentation characteristics pH 4,24 0,04 4,27 0,012 free acidity mg KOH/100g 1519,7 121,2 1581,4 177,6 butyric acid g.kg-1 ND - ND - acetic acid g.kg-1 9,2 0,55 7,81 0,42 lactic acid g.kg-1 72,6 5,2 65,7 7,3 ethanol g.kg-1 6,19* 0,93 3,52* 0,51
ND – not detected (<0,2 g.kg-1); mean values in the same row with * are significantly different at the level P<0,05
The treatment by homofermentative lactic acid bacteria (LAB)
presented a difference in terms of reduction of mycotoxins concentration
comparing CON and INO silage. The content of FUM and ZEA was
significantly lower (P<0.05 and P<0.001, respectively) in INO than in

163
CON silage (table 2). Considering FUM and ZEA content which highly
differs between treatments, we may assume relationship between silage
inoculant treatment and concentration of mycotoxins. The biomass for the
silage is usually colonized by most of the moulds during vegetation before
harvest and storage (Nedělník, Moravcová, 2006). However, this depends
on microclimate (Golinski et al., 2006), intensity of management
(Behrendt et al., 1997), floristic composition (Nedělník et al., 2010) and
other factors. Fermentation cannot alter mycotoxins content (Lepom et al.,
1990), but there are also opposite findings (Juodeikiene et al., 2012;
Storm et al., 2008). The detectable content of ZEA was found in grass
silage preserved by biological inoculants and ensiled as herbage without
mycotoxins contamination (Skládanka et al., 2009). Inoculant reduced
mycotoxins content of INO silage, but inclusion of biological inoculant
does not appear as the determining factor from the fermentation point of
view.
There is a large evidence of moulds species responsible for production
of mycotoxins in silage (Scudamore, Livesey, 1998; Jouany et al., 2009).
O´Brien et al. (2006) identified three types of secondary metabolites at the
level up to 20 mg.kg-1 and 7 types of mycotoxins present (0,1 – 5 mg.kg-1)
in baled grass silage. We were looking for 5 most common and well
described mycotoxins (table 2). In Netherland, average ZEA concentration
was 93 μg.kg-1 and maximum concentration 308 μg.kg-1 in grass silage
within a range of two years. Just 6 % of grass silages were contaminated
by ZEA (Driehuis et al., 2007). Lower mean value of ZEA concentration
found in INO silage (table 2) is 4 times higher than average ZEA
concentration mentioned by Driehuis et al. (2007). The diversity of
mycotoxins roots from the ability to colonize large scale of environments.
Driehuis et al. (2007) did not find FUM in grass silage in agreement with
Jouany et al. (2009) who reported that fumonisins were detected only in
maize silage. In contrary, Nědelník and Moravcová (2006) found high

164
content of FUM (1110 μg.kg-1) in grass silage samples taken from farms.
Finally, contents of mycotoxin vary greatly among samples obtained even
within the same type of feeds and the diversity is important in assessment
of toxic effect as mycotoxins can act synergistically.
Table 2 Mean values and standard deviation of the tested mycotoxins concentration of the grass silage n=3
Unit CON INO P-value mean SD mean SD
FUM μg.kg-1
μg.kg-1
μg.kg-1
μg.kg-1
μg.kg-1
39,88* ±0,3 24,27* ±1,1 P<0,0026 ZEA 475,75** ±0,8 386,95** ±1,8 P<0,0002 T-2 208,8 ±5,8 207,95 ±3,2 P<0,8725 DON 395,3 ±9,9 370,6 ±6,2 P<0,0962 OTA 10,1 ±2,5 7,05 ±0,2 P<0,2334
FUM: fumonisine, ZEA: zearalenone, DON: deoxynivalenol, T-2: T-2 toxin, OTA: total ochratoxins; mean values with * are significantly different at the level P<0,05, and with ** at the level of P<0,001
There were no statistically significant (P>0,05) differences found
between CON and INO silage in OTA, DON and T-2 content. However,
numerical difference of OTA concentration between CON and INO silage
is large (30,1 %) also reflected by standard deviation. The concentration
of OTA ranged from 8.3 to 11.9 μg.kg-1 of grass silage. The trend
(P<0.0962) for DON and for OTA (P<0.2334) was the lower
concentration in INO than in the CON silage. Some strains of
Lactobacillus genera are able to bind between 8 – 28 % of OTA
(Piotrowska, Zakowska, 2005). Surprisingly, mean value of DON
concentration was higher in this experiment than in haylage from horse
farms (167 μg.kg-1) observed by Buckley et al. (2004). The difference 3,7
% in value of standard deviation accounted for 24,7 μg of DON per kg of
dry matter. Nedělník and Moravcová (2006) found average DON content

165
550 μg.kg-1 and T-2 toxin 207 μg.kg-1 of grass silage. As it comes to
toxicity, 440 ppb of DON resulted in poor consumption and depressed
milk production (Coppock et al., 1990). Detected level of T-2 toxin
ranged from 204.7 to 212.9 μg.kg-1 in CON silage, which is very high
comparing to Acosta Aragon et al. (2010) who found 17,2 μg.kg-1 as the
maximal content of T-2 toxin in grass silage. Silage inoculants made
practically no difference between treatments (table 2) in T-2 toxin content.
CONCLUSION
The homofermentative lactic acid bacteria inoculant caused reduction
of ethanol content in INO silage indicating sucesffull lactic acid
fermentation. The most effective improvement of hygienic quality was
evident in ZEA content which was significantly lower in INO than CON
silage. Beside of that, tendency to reduce OTA and DON content occurred
in this experiment, though T-2 toxin was not affected by the treatment. In
conclusion, adition of LAB inoculant to high dry matter grass silage may
moderately reduce mycotoxin contamination.
Acknowledgement: This study and experiment were financially
supported by project n. 1/0662/11.
REFERENCES
ACOSTA ARAGÓN Y. – RODRIGUES, I. 2009. Contaminación de
ensilados con micotoxinas. In Proceedings of the XIVth Latin American
Congress of Buiatrics 2009, Lima, Peru: IVIS, 2009, pp. 12-15.
ANDRIGHETTO, I. et al. 1997. Conservation of Spring Cut Italian
Ryegrass as Round Bale Silage: Effect of Stage of Maturity on Ensiling
Characteristics and Forage Nutritive Value. In Journal of Agronomy &
Crop Science, vol. 179, 1997, n. 4, pp. 251-256.

166
AOAC (1990): Official Methods of Analysis. 15th ed. Association of
Official Analytical Chemists. Arlington, VA, USA, 1230 pp.
BEHRENDT, U. – MÜLLER, T. – SEYFARTH, W. 1997. The influence
of extensification in grassland management on the populations of micro-
organisms in the phyllosphere of grasses. In Microbiological Research,
vol. 152, 1997, n. 1, pp. 75-85. BOUDRA, H. – MORGAVI, D.P. 2008.
Reduction in Fusarium Toxin Levels in Corn Silage with Low Dry Matter
and Storage Time. In J. Agric. Food Chem., vol. 56, 2008, n. 12, pp.
4523-4528.
BUCKLEY, T. et al. 2004. Concentration of Different Mycotoxins in
Feed and Straw on 6 Irish Racehorse Farms. In Procceedings of In
Between Congress of the ISAH – Animal Production in Europe: The way
forward in a changing world. Ploufragan: ZOOPOLE, 2004, p. 447.
COPPOCK, R.W. - MOSTROM, M.S. – SPARLING, C.G. –
JACOBSEN, B.- ROSS, S.C. 1990. Apparent zearalenone intoxication in
a dairy herd from feeding spoiled
acid-treated corn. In Vet. Hum. Toxicol., vol. 32, n. 3, pp. 246-248.
DÖLL, S.- DÄNICKE, S. 2011. The Fusarium toxins deoxynivalenol
(DON) and zearalenone (ZON) in animal feeding. In Preventive
Veterinary Medicine, vol. 102, n. 2, pp. 132-145.
DRIEHUIS, F. – OUDE ELFERINK S.J.W.H. 2000. The impact of the
quality of silage on animal health and food safety: a review. In Veterinary
Quarterly, vol. 22, n. 4, pp. 212-216.
DRIEHUIS, F. – WIKSELAAR, P.G. 2000 The occurrence and
prevention of ethanol fermentation in high-dry-matter grass silage. In
Journal of the Science of Food and Agriculture, vol. 80, 2000, n. 6, pp.
711-718.
DRIEHUIS, F. et al. 2007. Occurrence of mycotoxins in maize, grass and
wheat silage for dairy cattle in the Netherlands. In Food Additives and
Contaminants: Part B: Surveillance, vol. 1, 2008, n. 1, pp. 41-50.

167
GOLINSKI, P. et al. 2006. Accumulation of Secondary Metabolites
Formed by Field Fungi in Autumn-Saved Herbage. In Journal of
Agronomy and Crop Science, 2006, vol. 192, n. 5, p. 344 – 351.
JALČ, D. et al. 2009. The use of bacterial inoculants for grass silage :
their effects on nutrient composition and fermentation parameters in grass
silages. In Czech Journal of Animal Science, vol. 54, 2009, n. 2, pp. 84-
91.
JOUANY, J.P. – YIANNIKOURIS, A. – BERTIN, G. 2009. Risk
assessment of mycotoxins in ruminants and ruminant products. In Options
Méditerranéennes : Série A. Séminaires Méditerranéens, vol. 84, n. 12,
pp. 205-224.
JUODEIKIENE, G. et al. 2012. Mycotoxin Decontamination Aspects in
Food, Feed and Renewables Using Fermentation Processes. In
BARTKIENE et al. (2012) Structure and Function of Food Engineering,
Rijeka: InTech, pp. 171-204, ISBN 978-953-51-0695-1.
LEPOM, P. – KNABE, O. – BAATH, H. 1990. Occurrence of Fusarium
strains and their mycotoxins in corn silage. 7. Formation of
deoxynivalenol (DON) in a silage corn plot artificially inoculated with
Fusarium culmorum and the effect of silaging on the stability of the DON
formed. In Arch. Tierernahr., vol. 40, 1990, n. 10, 1005-1012.
MÜLLER, C.E. 2009. Influence of harvest date of primary growth on
microbial flora of grass herbages and haylage, and on fermentation and
aerobic stability of haylage conserved in laboratory silos. In Grass and
Forage Science, vol. 64, n. 3, pp. 328-338.
NEDĚLNÍK, J.- MORAVCOVÁ, H. 2006. Mykotoxiny a pícniny.
Problematika výskytu mykotoxinú v krmivech pro zvířata. In Conference
Proceedings of 12th International Symposium of Forage Conservation.
Brno: MU Brno, 2006, pp.13 – 24.
NEDĚLNÍK, J. et al. 2010. Forage of Perennial Grasses as a Source of
Mycotoxins in the Food Chain In Conference Proceedings of 14th

168
International Symposium of Forage Consevation. Brno: MU Brno, 2010,
pp. 127-129.
NIDERKORN, V. – BOUDRA, H. – MORGAVI, D.P. 2006. Binding of
Fusarium mycotoxins by fermentative bacteria in vitro. In Journal of
Applied Microbiology, vol. 101, n. 4, pp. 849-856.
O´BRIEN, M. – NIELSEN, K.F. – O´KIELY, P. – FORRISTAL, P.D. –
FULLER, H.D. – FRISVAD, J.C. 2006. Mycotoxins and Other Secondary
Metabolites Produced in Vitro by Penicillium paneum Frisvad and
Penicillium roqueforti Thom Isolated from Baled Grass Silage in Ireland.
In Journal of Agricultural and Food Chemistry, vol. 54, n. 24, pp. 9268-
9276.
PIOTROWSKA, M. – ZAKOWSKA, Z. 2005. The limitation of
ochratoxin A by lactic acid bacteria strains. In Polish Journal of
Microbiology, vol. 54, 2005, n. 4,pp. 279-286.
Regulation (EC) No 429/2008 Official Journal of 25 April 2008, L 133
page 1.
RAJČÁKOVÁ, Ľ. – MLYNÁR, R. 2009. Zásady využívania potenciálu
silážnych a konzervačných prípravkov pri výrobe kvalitných a hygienicky
nezávadných konzervovaných krmív: metodická príručka. Nitra: CVŽV,
2009. 44 s.
ROLINEC, M. 2006. Konzervovanie vlhkého miaganého kukuričného
zrna organickými kyselinami: diplomová práca. Nitra: SPU, 2006. 47 s.
SAS Institute Inc. 2008. What’s New in SAS ® 9.2. Cary, NC: SAS
Institute Inc.
SCUDAMORE, K.A. – LIVESEY, CH.T. 1998. Occurrence and
Significance of Mycotoxins in Forage Crops and Silage: a Review. In
Journal of the Science of Food and Agriculture, vol. 77, 1998, n. 1, pp. 1-
17.

169
SKAAR, I. 1996. Mycological survey and characterisation of the
mycobiota of big bale grass silage in Norway. Ph.D. thesis, Oslo:
Norwegian College of Veterinary Medicine.
SKLÁDANKA, J. et al. 2009. Quality of green matter and silages from
perennial grasses during the growing season. In AWETH, vol. 5, 2009, n.
4, pp. 123-130.
STORM, I. - SØRENSEN, J.L. - RASMUSSEN, R.R. – NIELSEN, K.F.-
THRANE, U. 2008. Mycotoxins in silage. In Stewart Postharvest Review,
vol. 4, 2008, n. 6, pp. 1-12.

170
171
THE CONTENT OF AMINO ACIDS AND N-SPEKTRUM IN
PASTURE FOR CATTLE IN 2 YEAR OF GRAZING IN
CONVENTIONAL SYSTEMS.
PEJCHOVÁ K. - ČERMÁK B. - INGVORTOVÁ M. -
MARTÍNKOVÁ L.
Department of Animal Nutrition, The Agriculture faculty of South
Bohemian university in České Budějovice,CZ
ABSTRACT
This study is a part of other observations which took place at
higher altitudes organic farms in comparison to the conventional systems
at lower altitudes. The Quality of pasture at an altitude of 450 m above sea
level was evaluated. The experiment took place in a conventional
breeding with fertilization. Dry matter, crude protein, ash and amino acids
were analyzed. There was compared the growth of pasture crop, it was
depending on the fertilization of N, P and K fertilizer (this is showed in
table No.1). It was found that fertilizer improves the yield of pasture. The
increase in the content of most amino acids was observed at doses 100-
200kg/ha. But in the composition of nitrogenous substances higher doses
as 200 kg N ha-1 caused depression content of crude protein. Statistically
significant was the increase in yield in all monitoring. Changes in the
content of crude protein were unequivocal. The aim was to determine the
influence of nitrogen fertilization on the N-spectrum in the pasture
vegetation in 2 cut during 2 years. Expected target increase of nitrogenous
substances influence fertilization was not showed.
Key words: cattle, grazing, pasture, amino acids
172
INTRODUCTION
Grazing management should notably regulate the pasture
composition. Good pasture and grazing management can improve
nutrients and botanical structure (Čermák et al., 2004).A high botanical
biodiversity expressed by the presence of many herbs is especially
characteristic for the pastures located at higher altitudes. Herbs contribute
to the improved pasture quality having a beneficial influence on the
digestion process, animal health and quality of animal products (Søegaard
et al., 2009). There are appreciable differences in preference or
deprecation various plant species out at pasture. Some of plant species
have positive influence on animal health and digestion. (Hejduk, 2007).
Grasslands fertilizing is used for increasing of forage yields and quality
and simultaneously for soil fertility maintenance (Hejduk, 2011). The
yield and quality of forage is determined primarily by fertilization and
intensity of use (Nawrath et al, 2012).
The yield of grassland is different. The annual production of dry
feed is about 1.0 to 15.0 t.ha-1 dry weight (Hejduk et al, 2012). During the
grazing season in a sward reduced crude protein content while increasing
fiber content (Volfová et al, 2012). The aim was to demonstrate the effect
of different nitrogen fertilization on forage spectrum in 2 cut monitored
for 2 years. The results were statistically evaluated.
MATERIAL AND METHODS
The selected pasture at an altitude of 450 m above sea level there
were marked parcels in 4 repetitions. Each of these parcels had a size
3x10m2. These parcels were applied following a dose of fertilizer in table
No. 1. There is the same dose M3 and M4, but M3 was given 2times
during the vegetation and M4 was given 4times during the vegetation.
Experiment took place over two years (2010 and 2011) in the first and
second cut, always separately. Samples were dried at room temperature to

173
constant weight and ground in a mill. Then they were analyzed for ash and
crude protein (CP). Concentration of nitrogen (N) and proteins were
determined by the Kjeldahl method. Dry matter (DM), fat and NO3
content was determined by standard methods ÚKZÚZ. Amino acids were
analyzed after acid hydrolysis with using Amino Acid Analyzer AAA
400. The work has been performed all analyzes, but this part is focused on
the crude protein content. In the first and second year of the experiment
was monitored the hay yield. This is showed in table No. 2. The results
were statistically evaluated.
RESULTS AND DISCUSSION
The table No. 2 shows the average values calculated on hay yields
by parcels. The rise in production of pasture vegetation was found in all
experimental plots. The increase is not only hay, but are consistent with
the results of other nutrients that are not subject to monitoring. In the
second year of monitoring was found the increase of yield. Similar results
were reported by Hejduk (2012) and Nawrath et al.(2012). The values of
crude protein content, proteins and NO3 fluctuated. The nitrogen spectrum
in pasture is shown in table No. 3. This table shows that nitrogen
fertilization increases the NPN with increasing dose. And the yield of
crude protein and protein fluctuate. A similar tendency was observed in
the second year of monitoring (1.and 2. cut in the 2.year). The difference
was on behalf of crude protein content and protein. At a dose of 200kg/ha
found increasing representation of crude protein and proteins. And the
dose of 300kg/ha on the contrary showed depression in their contents. In
the second cut trends are similar, but the differences are not so great.
The increase in the content of most amino acids was observed at
doses 100-200kg/ha. These results are given in table No. 4. While higher
doses of nitrogen fertilization similarly showed instability and depression
in their content with the exception of essential amino acids. In the second

174
cut were found in lower values all the results. In the second year, this
depression related to the first and second cut. Results from the second
year of observation are shown in table No. 5. Other results were
indifferent or had lower parameters, which also shows in work Čermák et
al.(2004) and Volfová et al.(2012).
The comprehensive evaluation of statistical results is presented in
table No. 6. Statistically significant results are marked with the number 1
and are proven to using higher doses of fertilizers. Due to the ambiguity of
the results is needed in monitoring continue.
CONCLUSION
Analysis findings were in accordance with generality that
nitrogenous substances and dry matter content increases during forage
maturing. It was found positive effect fertilization on crude protein
content of pasture plants after two monitored years. Increasing the content
of components of the nitrogen spectrum was not clear. In the composition
of crude protein, amino acids and proteins occurred at higher doses of
nitrogen fertilizer to depression. The content of amino acids at higher
doses of fertilizers fluctuated. Expected target increase of nitrogenous
substances influence fertilization was not showed.
Experiments serve to the overall characteristics and quality of
pasture vegetation. A comprehensive evaluation of grazing is still in
progress. The next step will be to evaluate the spectrum of the fiber
compared with the content of crude protein. The aim is to choose the
appropriate fertilization to access the impact of grazing on milk protein
composition.
REFERENCES
ČERMÁK, B., DONALD M. BALL, CARL S. HOVELAND, GARRY
D. LACEFIELD, FRELICH, J.: Vliv kvality krmiv na produkci a

175
zdravotní nezávadnost mléka a masa. Vědecko-odborná publikace, České
Budějovice 2004, s. 167, ISBN 80-7040-744-1
HEJDUK, S.: Kvalita píce při extenzivním využívání pastvin. Náš chov,
2007, č. 3, s. 102-106.
HEJDUK, S.: Changes of soil agrichemical characteristics in pastures
influenced by mineral fertilizing. Acta Universitatis Agriculturae et
Silviculturae Mendelianae Brunensis. 2011. sv. 59, č. 1, s. 113–119. ISSN
1211-8516.
HEJDUK, S., SOCHOREC, M., RAUS, J.: Ekosystémové funkce travních
porostů, Mendelova univerzita v Brně, 2012
NAWRATH, A., SKLÁDANKA, J., HRABĚ, F.: Vliv hnojení a intenzity
využívání na produkci, druhovou diverzitu a kvalitu travního porostu,
Mendelova univerzita v Brně, 2012
SØEGAARD K., ERIKSEN J., ASKEGAARD M.: Herbs in the
grassland. ICROFS news, 3, 5-6. 2009.
VOLFOVÁ, K., FRELICH, J., ČERMÁK, B., PETRÁŠKOVÁ, E.
KOBES, M.: Kvalitativní parametry pastevních porostů v různých
nadmořských výškách, Jihočeská univerzita v Českých Budějovicích,
2012
Table 1: The fertilizer scheme in kg/ha-1
N P K M0 0 0 0 M1 100 22 83 M2 200 22 83 M3 300 22 83 M4 300 22 83
Table 2: The yield of hay in t/ha-1
M0 M1 M2 M3 M4 in 1. year 3,55 6,45 7,48 9,11 7,72 in 2. year 5,26 7,46 9,08 8,13 8,06

176
Table 3: The content of nitrogenous spectra of pasture in %
NL prote NP N03 NL prote NP N03
1.cut in 2. cut in M0 15, 12,78 2,6 99,6 M0 12, 11,42 1,1 98,1 M1 15, 11,86 3,3 105,9 M1 11, 10,10 1,5 38,2 M2 18, 14,52 3,7 156,4 M2 12, 11,86 0,7 93,0 M3 14, 11,88 3,0 118,0 M3 11, 9,66 1,7 97,0 M4 15, 12,08 3,6 147,4 M4 14, 12,52 1,8 108,6
Table 4: The amino acid content in pastures in % of total DM (1. and 2.
cut in 1. year)
1.cut M1 M2 M3 M4 M0 2.cut M1 M2 M3 M4 M0 LYZ 0,48 0,59 0,44 0,49 0,45 LYZ 0,41 0,43 0,37 0,49 0,47 HIS 0,27 0,17 0,15 0,17 0,15 HIS 0,2 0,14 0,19 0,16 0,16 ARG 0,39 0,48 0,35 0,41 0,4 ARG 0,33 0,35 0,31 0,41 0,39 ASP 1,12 1,43 1,05 1,2 1,01 ASP 0,96 1,23 0,78 1,04 1,02 THR 0,49 0,59 0,51 0,58 0,54 THR 0,46 0,56 0,4 0,46 0,51 SER 0,46 0,53 0,45 0,51 0,5 SER 0,41 0,51 0,36 0,43 0,48 GLU 1,2 1,4 0,6 1,29 1,21 GLU 1,07 1,38 0,96 1,23 1,17 PRO 0,59 0,63 0,46 0,65 0,89 PRO 0,58 0,62 0,53 0,69 0,67 GLY 0,5 0,61 0,49 0,59 0,53 GLY 0,47 0,51 0,47 0,63 0,55 ALA 0,94 1,1 0,88 1,04 0,81 ALA 0,79 0,86 0,72 0,96 0,82 VAL 0,53 0,66 0,84 0,59 0,54 VAL 0,73 0,65 0,49 0,63 0,55 ILEU 0,46 0,59 0,49 0,54 0,52 ILEU 0,42 0,47 0,43 0,6 0,51 LEU 0,77 0,97 0,78 0,88 0,84 LEU 0,7 0,79 0,69 1 0,84 TYR 0,29 0,37 0,32 0,34 0,39 TYR 0,33 0,32 0,39 0,31 0,43 PHE 0,61 0,75 0,49 0,6 0,65 PHE 0,54 0,58 0,47 0,51 0,68 CYS 0,16 0,18 0,15 0,16 0,15 CYS 0,16 0,16 0,14 0,14 0,15 MET 0,38 0,35 0,24 0,21 0,21 MET 0,38 0,19 0,19 0,31 0,29 TRY 0,19 0,16 0,17 0,17 0,18 TRY 0,17 0,18 0,16 0,14 0,19

177
Table 5: The amino acid content in pastures in % of total DM (1. and 2.
cut in 2. year)
1.cut M1 M2 M3 M4 M0 2.cut M1 M2 M3 M4 M0 LYZ 0,44 0,68 0,57 0,67 0,65 LYZ 0,44 0,49 0,63 0,7 0,53 HIS 0,13 0,26 0,26 0,26 0,26 HIS 0,19 0,17 0,24 0,3 0,27 ARG 0,46 0,55 0,49 0,57 0,53 ARG 0,5 0,43 0,52 0,58 0,43 ASP 1,32 1,58 1,59 1,58 1,79 ASP 1,41 1,32 1,56 2,06 1,64 THR 0,57 0,65 0,65 0,65 0,64 THR 0,67 0,64 0,63 0,77 0,71 SER 0,55 0,58 0,58 0,6 0,6 SER 0,61 0,57 0,59 0,73 0,66 GLU 1,39 1,59 1,57 1,6 1,63 GLU 1,52 1,48 1,49 1,79 1,63 PRO 0,68 0,72 0,64 0,7 0,84 PRO 0,71 0,63 0,68 0,98 0,72 GLY 0,57 0,67 0,71 0,69 0,69 GLY 0,69 0,67 0,67 0,77 0,71 ALA 1,01 1,13 1,14 1,17 1,14 ALA 1,11 1,1 1,13 1,3 1,18 VAL 0,63 0,67 0,72 0,79 0,68 VAL 0,71 0,71 0,73 0,83 0,76 ILEU 0,56 0,63 0,66 0,65 0,63 ILEU 0,65 0,62 0,62 0,74 0,69 LEU 0,92 1,01 1,07 1,11 1,04 LEU 1,05 0,96 0,99 1,19 1,1 TYR 0,36 0,44 0,34 0,42 0,43 TYR 0,43 0,35 0,39 0,46 0,41 PHE 0,63 0,76 0,68 0,75 0,77 PHE 0,71 0,67 0,68 0,82 0,75 CYS 0,14 0,18 0,16 0,19 0,19 CYS 0,13 0,16 0,18 0,18 0,17 MET 0,35 0,28 0,4 0,35 0,49 MET 0,23 0,37 0,3 0,42 0,41 TRY 0,2 0,16 0,2 0,2 0,2 TRY 0,18 0,14 0,17 0,16 0,18
Table 6: The influence of N- fertilizer on Nitrogen content of pastures
M1- statistically significantly
improved compared to the control
M2- statistically equivalent to the
control
M3- statistically significant
worsening compared to the control
M0- control pasture
M1 M2 M3 M4 M0 NL 3 2 2 1 2 Proteins 3 2 3 2 2 NPN 2 2 2 1 2 LYZ 2 2 2 2 2 SER 2 2 3 2 2 PRO 3 3 3 2 2 GLY 3 2 3 2 2 ALA 2 2 2 1 2 IZOLEU 3 2 3 1 2 LEU 3 2 2 2 2 TYR 3 3 3 3 2 PHE 3 2 3 2 2 TRY 2 3 2 3 2 Rank 34 29 33 24 26

178

179
EFFECT OF BACTERIAL OR CHEMICAL ADDITIVES ON
MICROBIOLOGICAL COMPOSITION OF HIGH MOISTURE
CORN GRAIN SILAGE
PYŚ, J.B.1 - SZAŁATA, A.1 - FRĄCZEK K.2 - CHMIELARZ S.2
1Department of Animal Nutrition and Feed Management, Faculty of
Animal Science 2Department of Microbiology, Faculty of Agriculture and Economics,
University of Agriculture in Krakow, 30-059 Kraków, Al. Mickiewicza
24/28
ABSTRACT
High moisture corn grain (dry matter 601.5 g·kg-1) was ensiled
alone (Z0) or in combination with bacteria inoculant containing various
species of Lactobacillus sp. (Z1), bacteria inoculant and potassium sorbate
(Z2) or mixture of chemical preservatives (Z3). After fermentation and
storage period silage was sampled for measurement of microbiological
composition both qualitatively and quantitatively. The largest (P<0.05)
population of fungi (5.87 log10 cfu·g-1) was found in silage without any
additives (Z0). No Salmonella and Clostridium bacteria were detected in
silages with addition Lactobacillus sp. bacteria and with potassium
sorbate (Z1, Z2).
MATERIAL AND METHODS
The aim of the study was to determine the effects of various
additives on microbiological composition of high moisture corn grain
silage. Grounded high moisture corn grain (variety DKC 3511, FAO 290,
dry matter 601.5 g·kg-1) was ensiled without any addition - Z0, and with
addition of bacteria inoculant: Lactobacillus buchneri, L. plantarum, L.

180
rhamnosus (7.5×10⁶ cfu·g-1 of grain) - Z1, L. buchneri, L. plantarum, L.
rhamnosus (7.5×10⁶ cfu·g-1 of grain) and potassium sorbate (5 g·kg-1 of
grain) - Z2, propionic acid - 73%, ammonium propionate - 21%, 1,2
propandiol - 4% (5 ml·kg-1 of grain) - Z3. Silage in microsilo of 15 l
capacity was stored at temperature 13±2°C during 60 days period, each
variant was performed in four replications. pH value, dry matter content
and number of lactic acid bacteria was determined in silages - after 48
hours of incubation in temperature 28oC on broth agar with lactose and
chinese blue medium (Biolacta Texel-CRhodia). Number of acetic acid
bacteria was determined after 48 hours of incubation in temperature 28oC
on Henneberg`s medium, Clostridium - after 48 hours of incubation in
anaerobic conditions, in temperature 28oC on selective medium
Clostridium pasteurianum and total yeast and mould fungi number - after
72 hours of incubation on Czapek-Dox medium (Fluka). The results of
microbiological analyzes were statistically evaluated using one-way
analysis of variance and Tukey `s test, with computer program SAS
version 8.2 (9).
RESULTS AND DISCUSSION Dry matter in silages ranged from 596.3 to 604.7 g·kg-1. The
results of the microbiological analyzes are shown in Table 1. Silage Z1
was characterized by the highest (P<0.05) number of lactic, acetic and
propionic acid bacteria due to the presence of those bacteria in inoculants
(5). The lowest (P<0.05) population of these bacteria occurred in silage
Z3 which is caused by bactericidal activity of chemical preparations,
especially propionic acid and absence of additives (6, 7). Largest number
of Salmonella, Clostridium and Coli bacteria were isolated from silage Z0
where - according to cited authors - high values of pH allowed growth of
undesirable microorganisms (1). Also in silage Z0 largest (P<0.05)
population of fungi was found because of the appropriate conditions for

181
their development - high values of pH and lack of compounds limiting
their growth - such silage is dangerous to animals because of the
possibility of poisoning caused by harmful fungal mycotoxins (1, 3). It
should be pointed that in silage Z1 and Z2 did not occur Salmonella and
Clostridium bacteria. Such effect may be the result of presence lactic acid,
acetic acid and other active compounds produced by bacteria from
inoculants which strongly reduce growth and development of undesirable
microorganisms (2, 4, 8, 10). In silage Z2 no fungi were found which is
probably caused by the presence of potassium sorbate, which is
characterized by strong antifungal properties (6).
CONCLUSION
The best effect, in relation to reducing the so-called health indicators -
number of Salmonella and Clostridium bacteria, as well as fungi, was
obtained by ensiling high moisture corn grain with addition of
Lactobacillus buchneri, L. plantarum, L. rhamnosus in combination with
potassium sorbate. Ensiling high moisture corn grain with bacterial-
chemical preparation had a positive impact on development of desirable
fermenting bacteria in silage biomass.
REFERENCE
1. Bíro D., Juráček M., Gálik B., Ńimko M., Kačániová M. 2006.
Influence of chemical inhibitors on fermentation process and
hygienic quality of high moisture corn. Slovak Journal of Animal
Science, 39, 1-2, 108 - 112.
2. Doležal P., Zeman L. 2005. Effect of different forms of bacterial
inoculants on the fermentation process of ensiled crushed maize
moisture grains. Czech Journal of Animal Science, 50, 5, 201-207.
3. Filya I., Sucu E., Karabulut A. 2006. The effect of Lactobacillus
buchneri on the fermentation, aerobic stability and ruminal

182
degradability of maize silage. Journal of Applied Microbiology,
101,141-150.
4. Holzer M., Mayrhuber E., Danner H., Braun R. 2003. The role of
Lactobacillus buchneri in forage preservation. Trends in
Biotechnology, 21, 282-287.
5. Kung L. Jr., Schmidt R.J., Ebling T.E., Hu W. 2007. The effects
of Lactobacillus buchneri 40788 on the fermentation and aerobic
stability of ground and whole-moisture corn. Journal of Dairy
Science, 90, 2309-2314.
6. Kung L. Jr., Myers C.L., Neylon J.M., Taylor C.C., Lazartic J.,
Mills J.A., Whiter A.G. 2004. The effects of buffered propionic
acid-based additives alone or combination with microbiological
inoculation on the fermentation of high moisture corn and whole-
crop barley. Journal of Dairy Science, 87, 1310-1316.
7. Nishino N., Wada H., Yoshida M., Shiota H. 2004. Microbial
counts, fermentation products, and aerobic stability of whole crop
corn and a total mixed ration ensiled with and without inoculation of
Lactobacillus casei or Lactobacillus buchneri. Journal of Dairy
Science, 87, 2563-2570.
8. Ranjit N.K., Kung L. Jr. 2002. Effect of Lactobacillus buchneri
40788 on the fermentation, aerobic stability and nutritive value of
maize silage. Journal of Dairy Science, 57, 73-81.
9. SAS, 2001. SAS/STAT Users Guide (Release 8.2). SAS Inst.
Inc.Cary, NC.
10. Taylor C.C., Kung L. Jr. 2002. The effect of Lactobacillus
buchneri 40788 on the fermentation and aerobic stability of high
moisture corn in laboratory silos. Journal of Dairy Science, 85,1526-
1532.

183
Table 1. Microbial composition of high moisture corn grain silage (log10 cfu•g-1).
Silage
Z0 Z1 Z2 Z3 Bacteria: - lactic 5,20b 6,86a 6,56a 4,05c - acetic 4,56b 5,05a 5,03a 3,80c - propionic 4,00b 5,30a 5,26a 4,08b - Coli 3,68a 2,17b 2,05b 2,43b - Clostridium 2,89a 0,00c 0,00c 1,61b -Salmonella 1,90a 0,00b 0,00b 1,37a Mould fungi 5,87a 4,00b 0,00c 3,85b
Description: Z0 - grounded high moisture corn grain ensiled without any addition; Z1 - with addition of bacteria inoculant containing Lactobacillus sp.; Z2 - with addition of bacteria inoculant and potassium sorbate; Z3 - with addition of mixture of chemical preservatives.

184

185
QUALITY AND YIELD OF FORAGE IN RELATION TO
DIFFERENT GRASSLAND MANAGEMENT
RAUS, J. – KNOT, P.
Department of Animal Nutrition and forage Production, Faculty of
Agronomy, Mendel University in Brno, Czech Republic
ABSTRACT
In 2003 the small-plot trial was established in Vatín, Vysočina
Region, the Czech Republic to assess effect of fertilization rates and
exploitation intensity on properties of meadow sward. In this paper,
production of dry mass, crude protein, fibre and NEL are analysed in
relation to four levels of fertilization (no fertilization; N0 + P30 + K60 kg∙ha-
1; N90 + P30 + K60 kg∙ha-1; N180 + P30 + K60 kg∙ha-1) and four intensities of
exploitation (4, 3, 2 early and 2 late cuts per season). Data from years
2008 – 2010 were used.
NPK fertilization affected mainly the production of forage; there
were significant differences (P<0.05) observed between N180 + P30 + K60
(8.85 t∙ha-1) and N90 + P30 + K60 (7.44 t∙ha-1) and sward without
nitrogenous fertilization (4.49 and 3.87 t∙ha-1 in N0 + P30 + K60 and non-
fertilized treatment, respectively). Effect of intensity of exploitation on
yield of forage was negligible. Production of crude protein, fibre and NEL
was positively affected by higher level of fertilization. Production of
crude protein was also increased by higher number of cuts, while the
production of fibre was lower. Exploitation intensity affected significantly
(P<0.05) concentration of NEL; the highest concentration was observed in
4-cut treatment (5.35 MJ∙kg-1 DM) compared to the 2-late-cut sward (5.07
MJ∙kg-1 DM).
Keywords: meadow, forage quality, fertilization, grassland management

186
INTRODUCTION
This paper deals with effect of grassland management on quality
and yields of meadow forage. Levels of fertilization and exploitation
intensity are the two most important measures to affect floristic
composition and productivity of meadow stand. Fertilization affects
forage quality both directly and indirectly. Fertilization enhances the
mineral nutrition status of the soil and thus nutrition concentrations in
plants are higher as well (FRAME, 1994). Indirect effect is through the
change of floristic composition. Especially nitrogenous fertilization cause
large and rapid changes. It supports growth of tall grasses and suppresses
legumes and small forbs. Legumes may be supported by long-term supply
of potash and phosphorous fertilizers (MRKVIČKA et VESELÁ, 2002).
Forage quality depends also on phenophases of dominant plant species.
As the grass gets old, proportion of stalks increases on expense of leafs.
Digestibility of organic matter of stalks declines quickly – senescence of
stalks is faster than of leafs. A term of harvest must be a compromise
between high yield and quality. Meadows, especially in the first cut of the
year, should be harvested when dominant grass species start heading
(FRAME, 1994).
MATERIAL AND METHODS
A small plot trial was established in 2003 within the permanent
meadow, which was set up in the 1990s. Site is located near Vatín,
Vysočina Region, the Czech Republic, in the floodplain of the Oslava
River, at 535 m above sea level. Annual rainfall averages 618 mm; mean
annual temperature is 6.9 °C. Soil is stagnosol on the quaternary fluvial
deposits, bedrock is biotitic paragneiss. The trial was designed in the form
of split blocks with four replications. Area of the plot was 10 m2. There
were four treatments of nutrition level combined with four treatments of
exploitation intensity. Exploitation intensity is described in Tab. I.

187
Nutrition levels were (with abbreviations used in textand figures): no
fertilization (0); N0 + P30 + K60 kg∙ha-1 (PK); N90 + P30 + K60 kg∙ha-1
(N90PK); N180 + P30 + K60 kg∙ha-1 (N180PK). Total amount of nitrogen
was dosed in each cut in a ratio of 1:1:1:0, 1:1:1 and 1:1 depending on
exploitation intensity. Yields of dry matter were calculated through using
the weight difference of fresh and dry forage samples (after drying at 60
°C). Concentrations of crude protein and fibre were analysed by NIRS
method. Results from years 2008–2010 are presented in this paper.
Results were processed by ANOVA and subsequent Tukey’s HSD test in
the STATISTICA software.
I. Exploitation intensity
Exploitation intensity 1st cut 2nd cut 3rd cut 4th cut
intensive May 15 June 30 Aug. 15 Sept. 30
mid-intensive May 30 July 30 Sept. 30 -
low-intensive June 15 Sept. 15 - -
extensive June 30 Sept. 30 - -
RESULTS AND DISCUSSION
Effect of exploitation intensity on concentration of crude protein,
fibre and NEL and yields of dry mass is pictured in Fig. 1. The highest
concentration of crude protein (138.3 g∙kg-1 DM) was detected in
intensive treatment and the lowest in low intensive (119.2 g∙kg-1 DM) and
extensive (120.0 g∙kg-1 DM) treatments. Concentration of fibre showed
opposite trend; the lowest concentrations were observed in intensively
exploited swards, which were harvested in early phonological stages.
These results resemble those by NERUŠIL et al. (2008) obtained in
similar trial from another site (Jevíčko). Concentration of NEL was higher
in young forage as well. There was a significant difference (P<0.05)
detected between intensive (5.35 MJ∙kg-1 DM) and extensive treatments

188
(5.07 MJ∙kg-1 DM). Number and term of harvest did not significantly
affect the yield of forage. The highest yield was from extensive sward
(6.62 t∙ha-1) whilst the lowest yield was in intensive treatment (5.64 t∙ha-1).
Fig. 2 shows the effect of fertilization levels on yields and forage
quality. KNOT et HRABĚ (2011) refer, that fertilization affects forage
quality more than term and number of cuts. Nevertheless, our results show
just small differences between different levels of fertilization. The highest
concentration of crude protein was 142.4 g∙kg-1 DM in sward fertilized
with 180 kg N∙ha-1, which significantly differed (P<0.05) from lowest
concentration in treatment fertilized with PK (119.2 g∙kg-1 DM).
Concentration of crude protein in PK treatment was even lower than in
sward without any fertilization, which result is in agreement with
NERUŠIL et al. (2008). Concentration of fibre and NEL increased
together with increasing level of fertilization, but observed differences
were not significant. Yield of forage was strongly affected by level of
fertilization. There were significant differences (P<0.05) observed
between N180PK (8.85 t∙ha-1) and N90PK (7.44 t∙ha-1) and sward without
nitrogenous fertilization (4.49 and 3.87 t∙ha-1 in PK and non-fertilized
treatment, respectively).
CONCLUSION
Production of forage was affected mostly by level of fertilization
as there were significant differences (P<0.05) observed between N180PK
(8.85 t∙ha-1) and N90PK (7.44 t∙ha-1) and sward without nitrogenous
fertilization (4.49 and 3.87 t∙ha-1 in PK and non-fertilized treatment,
respectively). Production was not significantly affected by exploitation
intensity. Concerning qualitative parameters of forage, exploitation
intensity affected significantly (P<0.05) concentration of NEL – the
highest concentration was observed in intensive treatment (5.35 MJ∙kg-1
DM) compared to the extensive one (5.07 MJ∙kg-1 DM).

189
Fig. 1 Concentration of NEL, fibre and crude protein and yields of dry mass in relation to
exploitation intensity (average of all years and fertilization levels) (Using Tukey post-hoc
test, values marked with different letter are significant at a level of P<0.05)
Fig. 2 Concentration of NEL, fibre and crude protein and yields of dry mass in relation to
level of fertilization (average of all years and exploitation intensities) (Using Tukey post-
hoc test, values marked with different letter are significant at a level of P<0.05)
138,
3 a
235,
2a
53,5
a
56,4
a
133,
2a
238,
7a
52,0
ab
58,8
a
119,
2a
244,
5a
51,9
ab
65,2
a
120,
0a
251,
6a
50,7
b
66,2
a
0,0
50,0
100,0
150,0
200,0
250,0
300,0
Crude protein (g∙kg-1)
Fibre (g∙kg-1)
NEL (10∙MJ∙kg-1)
Yield of DM (10∙t∙ha-1)
Intensive
Mid-intensive
Low-intensiwe
Extensive
121,
9 ab
225,
9a
51,3
a
38,7
a
119,
2a
242,
6a
51,8
a
44,9
a
127,
3ab
250,
5a
52,1
a
74,4
b
142,
4b
250,
9a
53,1
a 88,5
c
0,0
50,0
100,0
150,0
200,0
250,0
300,0
Crude protein (g∙kg-1)
Fibre (g∙kg-1) NEL (10∙MJ∙kg-1)
Yield of DM (10∙t∙ha-1)
0
PK
N90PK
N180PK

190
Increasing level of fertilization caused increase in concentrations
of crude protein, fibre and NEL.
Acknowledgement: This study was supported by the research project
NAZV No. QH 81280 “Study of main factors with influence on the
stability of a sustainable system of grassland management in the Czech
Republic“.
REFERENCES
FRAME, J. 1994. Improved Grassland Management. Ipswitch, UK:
Farming Press Books, 351 pp. ISBN 0-85236-246-3.
HRABĚ F., KNOT P. The effect of trophism level and exploitataion
intensity on the production characteristics of grassland community
dominated by Festuca arundinacea Schreb. Plant Soil Environment, 2011,
57 (4): 160-165.
MRKVIČKA J., VESELÁ M. Influence of fertilization rates on species
composition, quality and yields of the meadow fodder. Rostlinná výroba,
2002, 48 (11): 494 – 498.
NERUŠIL, P., KOHOUTEK, A., KOMÁREK, P., ODSTRČILOVÁ, V.
Effects of utilisation intensity and fertilization level on forage production
and quality of permanent grassland on a fluvisoil. Acta Universitatis
Agriculturae Et Silviculturae Mendelianae Brunensis, 2008, 56 (5): 153-
162.

191
EFFECT OF A PHYTOGENIC FEED ADDITIVE ON DIGESTIVE
PHYSIOLOGICAL PARAMETERS IN BROILERS
ROHRER, E.1) - WINDISCH, W.2) - WETSCHEREK, W.1) -
SCHEDLE, K.1)
1) Department for Agrobiotechnology, Institute of Animal Nutrition,
Products, and Nutrition Physiology, University of Natural Resources
and Life Sciences, Vienna 2) Technische Universität München
ABSTRACT
The aim of this study was to assess the impact of a phytogenic
feed additive (PFA) on digestive physiological parameters (gene
expression in pancreas and liver as well as microbial metabolites in
chime) of broilers. Therefore, 432 sexed one-day old broilers were divided
into three treatments of 144 birds each and PFA was added to the diets as
follows: (1) no addition (control), (2) 150 ppm PFA, (3) 1500 ppm PFA.
There were significant (p < 0.05) effects of dietary treatments on mRNA
expression rates, biogenic amines and dry matter at 36 days of age. Birds
fed the diet containing 150 ppm PFA showed lower expression rates of
trypsinogen in pancreas compared to control group and an up-regulation
of cyclin D1 in liver in comparison to the 1500 ppm supplementation. In
jejunum, higher histamine levels as an effect of dietary 1500 ppm and
increased amounts of methylamine due to 150 ppm PFA addition
compared to control broilers were observed. In general, phytobiotics
raised total amount of biogenic amines in jejunum when applied at 150
ppm level, versus control group.
Dry matter in jejunum increased as a response to 150 ppm PFA in
diet versus control group. Changes by trend (p < 0.10) were observed in

192
putrescine in colon, where 150 ppm diet led to increased concentrations
on this biogenic amine and in jejunum, pH was highest in chime of
broilers given 1500ppm, in comparison to control chicks.
It can be concluded that PFA in both concentrations did not show
negative impacts on broiler´s digestive physiology.
MATERIAL AND METHODS
Diets and animals
The experiment was conducted with a total of 432 sexed one day
old broiler chicks (ROSS 308). The broilers were divided into three
treatments of 144 (72 male and 72 female) birds each and allotted
according to their sex and initial body weight (44g±0,16g) among 36
pens, containing 12 animals each. The trial was split into starter diet (12.4
MJ AMEN/kg, 22% CP) during the first 14 days, a grower diet (12.8 MJ
AMEN/kg, 21% CP) from day 15-28 and a finisher diet (12.7 MJ
AMEN/kg, 19% CP) from day 29 to 35. The PFA based on micro-
encapsulated essential oils (minimum 7.4%) of thyme and star-anise with
a guaranteed thymol content of 0.2% in an excipient based on mixed,
dried herbs and spices and was added to the diets as follows: (1) no
addition (control), (2) 150 ppm PFA (recommended dose), (3) 1500 ppm
PFA. Ground feed and water were provided ad libitum.
Sampling
At day 36, chicks were professionally slaughtered and 72
representative tissue samples of pancreas and liver were collected,
immediately snap frozen in liquid nitrogen and stored at -80°C until
proximate real time RT-qPCR analysis of specific digestibility marker
genes (pancreas: IL6, IL1β, cyclin D1, amylase, pancreatic lipase,
trypsinogen and liver: TNFα, IL1β, Caspase3, Cyclin D1).

193
For chime analyses the intestinal tract (the proximal jejunum, the
terminal ileum and the colon) was removed and opened in order to sample
chime, which was put into narrow – mouth bottles and immediately frozen
at -20°C. As to maintain sufficient amounts of chime, homogenous mixed
samples were pooled per pen (4 chicks each).
Analyses
Analyses of mRNA were conducted using real-time qRT-PCR.
Quantification based on three reference genes [beta–actin (β-Actin),
ubiquitin and glucose-6-phosphate dehydrogenase (G6PDH)]. PCR
analyses were conducted according to MIQE-guidelines on Bustin (2009)
and total RNA was extracted following a modified extraction method (Li
et al. 2011).
Biogenic amines (methylamine, agmatine, histamine, putrescine,
cadaverine, spermidine and spermine) were detected using a high
performance liquid chromatography (HPLC) according to the method of
Saarinen (2002).
Concentrations of volatile fatty acids (acetic acid) were
determined by the use of a gas chromatograph according to the method of
Zhao (2005).
Contents of ammonia and entire lactate (D and L) were analyzed
photometrically, using a commercial enzymatic test kit for the UV-method
from Roche® (Roche, Germany) which was applied as specified by the
manufacturer.
Analyses for dry matter (DM) of chime were done onto standard
methods according to Naumann and Bassler (1976).
Statistical analyses were performed applying the Statistical
Analysis System software package 9.1.3 (SAS Inst., Inc., Cary, NC, USA,
2002-2003). The data were submitted to analyses of variance to determine
treatment effects using the GLM procedure of SAS. Significant

194
differences among lsmeans were reported for p < 0.05 and indicated by
superscripts. Trends were analyzed at p < 0.10 and indicated by
superscripts in parentheses.
RESULTS AND DISCUSSION
Table 1. Results of different parameters in tissues and chime of broilers
Treatment, ppm SEM p-value
0 150 1500
mRNA expression
Trypsinogen pancreas 30112.05a 9633.77b 16042.43ab 3886.1 0.0249
Cyclin D1 liver 13.72ab 15.91a 6.42b 1.49 0.0317
Biogenic amines, jejunum
Methylamin, mmol/ kg 20.59b 52.46a 28.96ab 4.65 0.0076
Histamine, mmol/ kg 58.36b 69.08ab 71.44a 2.72 0.0136
Biogenic Amines total, mmol/ kg 239.27b 337.27a 271.01ab 21.54 0.0372
Biogenic amines, colon
Putrescine, mmol/ kg 4.81(b) 12.06(a) 10.55(ab) 1.2 0.0501
Dry matter & pH, jejunum
Dry matter, % 21.33a 18.99b 19.86ab 0.38 0.0207
pH 6.19(b) 6.24(ab) 6.31(a) 0.03 0.057 a b means within a row without similar superscripts differ significantly (p < 0.05) (a b) means within a row without similar superscripts differ by trend (p < 0.10)
Significant results are presented in
Table 1. In pancreas, m-RNA expression of trypsinogen, a
precursor form of trypsin, was down regulated by 150 ppm of the PFA
treatment (p < 0.05) compared to control group. These unexpected
findings are contrary to other studies where essential oils have been
shown to enhance stimulation of digestive enzyme activities (Platel and
Srinivasan 2000; Lee et al. 2003a).

195
In liver tissue samples cyclin D1, a proliferation and cell cycle
marker gene, was significantly (p < 0.05) up-regulated due to the 150 ppm
phytobiotic diet compared to the 1500 ppm treatment. This stimulatory
effect of herbs on the expression of cyclin D1 was also observed by Tan
(2010), when he analyzed the effect of ginsenosides on granulose cells of
chicken´s prehierarchical follicles.
In general, the analyses of chime in jejunum revealed most
changes in investigated parameters due to experimental factors, presenting
higher histamine levels (p < 0.05) in broilers as an effect of 1500 ppm
dietary supplementation compared to control animals.
Histamine is importantly involved in immune response (Banu and
Watanabe 1999), hence PFAs seem to be able to influence immune status
of broilers.
Furthermore, 150ppm supplementation led to increased amounts
of methylamine in broilers, compared to control diet chicks yet this
response was not continued due to overdose. Nevertheless, phytobiotics
consequently raised total amount of biogenic amines (p < 0.05) in jejunum
when applied at 150ppm level, versus control group.
Dietary phytobiotic supply did not influence parameters of chime
in ileum and colon except a change by trend in putrescine in colon (p <
0.10), where 150 ppm PFA led to increased concentrations of this
biogenic amine compared to control birds. However, it seems as shown in
our study, phytobiotics failed to reduce amounts of biogenic amines which
is in contrast to the observations from other reports, where antimicrobial
properties of essential oils have been assessed in vitro (Dorman and Deans
2000) and in vivo (Mitsch et al. 2004; Kroismayr et al. 2008).
In the course of further chime analyses, treatment did not alter
contents of lactic acid, SFCA and ammonia in all investigated intestinal
sections. Contrary to our study, Hong et al. (2012) observed a decrease in
ileum ammonia due to antibiotic (100 ppm oxytetracycline) and essential
196
oils (125 ppm essential oil derived from oregano, anis and citrus peel) in
their study.
Changes in the analyzed parameters DM and pH value only
occurred in jejunum where addition of 150ppm to basal diet led to
significantly lower (p < 0.05) amounts of DM in chicken digesta samples
in comparison to control group. Differences in DM may be based upon
more or less absorption of nutrients in chime, suggesting that broilers as a
response to 150ppm of PFA (in jejunum) may tend to have more rapid
degradation and absorption, which would constitute a benefit.
Further, dietary treatment (p < 0.10) caused changes by trend in
pH, namely having highest pH values in chime of broilers given
1500ppm, in comparison to control broilers.
CONCLUSION
Findings of the present study appear rather inconsistent, making
clear declarations about benefits of the used PFA rather difficult.
However, results suggest that a 10-fold overdose will not impinge
animal´s health and performance at all, though it is to say that dietary
inclusion of phytobiotics requires further research to allow specific
statements on the mode of action of these alternatives to antibiotics, thus
ensuring safety for animals, humans, and environment.
REFERENCES
Banu, Y. and T. Watanabe (1999). "Augmentation of antigen receptor-
mediated responses by histamine H1 receptor signaling." J Exp Med
189(4): 673-82.
Bustin, S. A., V. Benes, et al. (2009). "The MIQE guidelines: minimum
information for publication of quantitative real-time PCR experiments."
Clin Chem 55(4): 611-22.

197
Dorman, H. J. and S. G. Deans (2000). "Antimicrobial agents from
plants: antibacterial activity of plant volatile oils." J Appl Microbiol 88(2):
308-16.
Hong, J.-C., T. Steiner, et al. (2012). "Effects of supplemental essential
oil on growth performance, lipid metabolites and immunity, intestinal
characteristics, microbiota and carcass traits in broilers." Livestock
Science 144: 253-262.
Kroismayr, A., J. Sehm, et al. (2008). "Effects of avilamycin and
essential oils on mRNA expression of apoptotic and inflammatory
markers and gut morphology of piglets." Czech Journal of Animal Science
53(9): 377-387.
Lee, K. W., H. Everts, et al. (2003a). "Effects of dietary essential oil
components on growth performance, digestive enzymes and lipid
metabolism in female broiler chickens." Br Poult Sci 44(3): 450-7.
Li, Q., K. H. Domig, et al. (2011). "Evaluation of potential reference
genes for relative quantification by RT-qPCR in different porcine tissues
derived from feeding studies." International Journal of Molecular Sciences
12: 1727-1734.
Mitsch, P., K. Zitterl-Eglseer, et al. (2004). "The effect of two different
blends of essential oil components on the proliferation of Clostridium
perfringens in the intestines of broiler chickens." Poult Sci 83(4): 669-75.
Naumann, C. and R. Bassler (1976). Methodenbuch. Die chemische
Untersuchung von Futtermitteln. 3. Ergänzungslieferung 1993. Darmstadt,
VDLUFA-Verlag.
Platel, K. and K. Srinivasan (2000). "Influence of dietary spices and
their active principles on pancreatic digestive enzymes in albino rats."
Nahrung 44(1): 42-6.
Saarinen, M. T. (2002). "Determination of biogenic Amines as dansyl
derivatives in intestinal digesta and Feces by reversed phase HPLC."
Chromatographia 55(5-6): 297-300.

198
Tan, T. Q., C. Ge, et al. (2010). "Ginsenosides promote proliferation of
granulosa cells from chicken prehierarchical follicles through PKC
activation and up-regulated cyclin gene expression." Cell Biol Int 34(7):
769-75.
Zhao, G., M. Nyman, et al. (2005). "Rapid determination of short-chain
fatty acids in colonic contents and faeces of humans and rats by acidified
water-extraction and direct-injection gas chromatography." Biomedical
Chromatography(20): 674-682.

199
MONITORING THE QUALITY OF VEGETABLE OILS
RUSNÍKOVÁ, L.1 - STRAKOVÁ, E.1 - SUCHÝ, P.2
1Department of Animal Nutrition 2Department of Animal Husbandry and Animal Hygiene
Faculty of Veterinary Hygiene and Ecology, University of Veterinary and
Pharmaceutical Sciences Brno
ABSTRACT
In the study was compared nutritional value of selected legumes:
soybean, field peas, broad beans, and lupin. In these legumes we
determined content and quality of the oil. We focused especially on the
content of fatty acids. Fatty acids were divided into groups according to
the saturation. We monitored the total content of saturated fatty acids
(SFA), unsaturated fatty acids (UFA), monounsaturated fatty acids
(MUFA), and polyunsaturated fatty acids (PUFA). We also divided them
to group n-3, n-6, and n-9 fatty acids (FA). Legumes have a favorable
ratio of n-3 FA:n-6 FA, especially lupin oil (1:4.3), which is in accordance
with ratio 1:5 recommended for human diet.
Key words: Vegetable oil; fatty acid; UFA; n-3, n-6, n-9 FA
The work is focused on nutritional properties of selected legume
species. The main usability of legumes in nutrition is for them high
content of crude protein. However, there is also a very positive fat
composition, which is very interesting in terms of dietetics. Legumes
contain little fat and are not grown to obtain a fat in addition to soybean
seeds. Fat content in soybean seeds exceeds fat content in other pulses.
Karaaslan (2008) reviewed the fat content in soybean seeds about 190
g/kg. Thanks to higher content of fat 70.4–75.5 g/kg (Chiofalo et al.,

200
2012) lupin differs from beans and peas 15 g/kg (Campos-Vega et al.,
2010). An important measure for evaluation of fat is fatty acid (FA) ratio
between saturated fatty acids (SFA) and unsaturated fatty acids (UFA).
Content of monounsaturated (MUFA) and polyunsaturated fatty acids
(PUFA) preferably reflects about oil quality. PUFA contain essential fatty
acids very important with respect to human and animal nutrition. In
particular, the focus is on adequate intake of n-3 FA and the ratio n-3
FA:n-6 FA in the diet. The ratio 1:5 is recommended (Straková et al.,
2008). Sujak et al. (2006) dealt with composition of lupin seeds. Their
results indicate that lupin oil is dietetically very good. When lupin is used,
is necessary to take into account the individual species and varietal
differences. Chiofalo et al. (2012) confirm this in their study. L.
angustifolius showed the highest content of SFA and L. luteus showed the
highest levels of n-6 PUFA. The data obtained suggests L. albus as the
most interesting lupin species for aiding the crop-livestock food chain and
L. luteus as a promising crop due to its high nutritive traits for the
Mediterranean environment. L. albus had the highest n-3 FA:n-6 FA
PUFA ratio. The most satisfactory in terms of human and livestock
nutrition marked Sujak et al. (2006) L. albus. Wood and Fearon (2009)
refer to lupin and field peas novel feeds to increase levels of beneficial
UFA in products.
MATERIAL AND METHODS
The aim of this work was on its own analyzes to compare dietary
and nutritional quality of oil seeds in selected major legumes in the Czech
Republic. The material to be analyzed consisted of whole seeds of species
given below were used: Soybean (Soja hispida) - 7 cultivars (Rita,
Tundra, Moravians, Suito, Korada, Bohemians, Vision), field peas (Pisum
sativum) - 11 cultivars (Zekon, Herold, Sponzor, Hardy, Terno, Baryton,
Tudor, Concorde, Proplet, Slovan, Sully), broad bean (Faba bean) - 10

201
cultivars (Carola, Gloria, Borek, Merkur, Stabil, Albi, Mistral, Amazon,
Merlin, Fuego) and lupin (Lupinus sp.) - 8 cultivars (Amiga, Boregine,
Bornal, Boruta, LAL, Oležka, Probor, Wodjil), respectively. Fat content
was determined by Soxhlet method. Fatty acids were detected by gas
chromatography analyzer GAS Chromatograph GC-2010 (SHIMADZU).
RESULTS AND DISCUSSION
For each species of legume was fat content in seed evaluated.
Data are expressed on a dry matter basis (DM). The highest fat content
was reported in soybean seeds (216.0 g/kg), it was higher than reported
Karaaslan (2008), followed by lupin (67.2 g/kg) with a lower value than
reported Chiofalo et al. (2012), to field peas (7.4 g/kg) and broad bean
(4.8 g/kg), value lower than reported Campos-Vega et al. (2010). The
results of contents of individual groups of fatty acids, expressed in g/100 g
of oil, are shown in figures 1-3. Figure 1 shows sums of SFA and UFA.
The individual oils are very similar in low representation of SFA and high
proportion of UFA that corresponds with the results of Sujak et al. (2006).
Lupin oil contains on average approximately the same amount of MUFA
and PUFA. That is significant difference from other oils, as documented
in Figure 2. Soybean, field peas and broad bean oils have higher values of
PUFA than MUFA.
The greatest qualitative differences can be observed in various
oils for distribution by the FA group n-3, n-6, and n-9 FA, as shown in
Figure 3. According this dealing legumes can be evaluated positively.
Especially the lupin oil, where the ratio n-3:n-6 reaches 1:4,3. This
corresponds with ratio suitable in human nutrition - 1:5 - recommended by
Straková et al. (2008). Following fatty acid predominate in lupin oil: oleic
acid from n-9 FA, linoleic acid from n-6 FA and α-linolenic acid from n-3
FA.

202
If we look for lupin as an alternative to soybean, lupin brings us
the best results compared to both broad bean and field peas in the
assessment of dietary fatty acids. Thanks to the advantageous dietary
properties of lupin it should be more included in feeding rations in the
future, as recognized by Wood and Fearon (2009).

203
CONCLUSION
The results of analyses can be concluded that the legumes oils are
suitable dietetic oils in human and animal nutrition. In terms of the ratio
between n-3 and n-6 FA are even better than some used oil of oil crops.
Specifically, lupin oil, despite the higher proportion of SFA, contains
balanced proportions of individual fatty acids as well as MUFA and
PUFA ratio, and appropriate representation of each group n-3 FA, n-6 FA
and n-9 FA. Lupin is appropriate with respect to fat content. Its content is
the highest compared with peas and broad bean. However, care must be
taken on the choice of species and varieties, because the individual results
of fatty acids are different. With proper choice of species and varieties of
lupin, it is a good source of crude protein, but also fatty acids in the
correct proportion. Mentioned characteristics allow the use of lupin in the
diet and replacing it partially soybean.
Acknowledgements: This work was performed as a part of the Research
Plan IGA 5/2012/FVHE.
REFERENCES
CAMPOS-VEGA, R.; LOARCA-PIŇA, g.; oomah, D.b. Minor
components of pulses and their potential impact on human health. Food
Res Int. 2010, vol. 43, p. 461-482.
Chiofalo, B.; Presti, L.V.; Chiofalo, V.; Gresta, F. The productive traits,
fatty acid profile and nutritional indices of three lupin (Lupinus spp.)
species cultivated in a Mediterranean environment for the livestock. Anim
Feed Sci Tech. 2012, vol. 171, p. 230-239.
Karaaslan, D. Determination of total protein and fatty acid composition of
soybean seed as affected by sowing dates. Asian J Chem, 2008, vol. 20,
no. 1, p. 767-775.

204
STRAKOVÁ, E.; SUCHÝ, P.; HERZIG, I.; STAŇA, J.; ZEHNÁLEK, P.
Dietetic importance of fatty acids in animal and human nutrition.
Veterinářství, 2008, no. 11, p. 708-712.
SUJAK, A.; KOTLARS, B.; STROBEL, W. Compositional and
nutritional evaluation of several lupin seeds. Food Chem, 2006, vol. 98,
no. 4, p. 711-719.
Wood, V.B.; Fearon, A.M. Dietary sources of unsaturated fatty acids for
animals and their transfer into meat, milk and eggs: A review. Livest Sci,
2009, vol. 126, p. 1-20.
Corresponding author contact information: Lucie Rusníková, Mgr.,
Department of Animal Nutrition, VFU Brno, Palackého tř. 1-3, 612 42
Brno, [email protected]

205
THE EFFECT OF FEEDING RUMEN-PROTECTED CLA TO
LACTATING DAIRY COWS ON FATTY ACID PROFILE OF
MILK FAT
RYŠAVÝ, J1. – KŘÍŽOVÁ, L.2 – JANŠTOVÁ, B.1
1University of Veterinary and Pharmaceutical Sciences Brno, 2
Agroresearch Rapotín s.r.o. - workplace Pohořelice
ABSTRACT
The experiment was carried out on 12 lactating dairy cows
(lactation 1 to 5, 26 weeks of lactation). Cows were divided into 2 groups
of 6 animals with similar milk yield. During the whole experiment cows
were fed on a basal diet based on maize silage (30 kg/d), lucerne hay (3
kg/d) and supplemental mixture (8 kg/d, all as fed basis). Control cows
(C) received the basal diets while experimental animals (CLA) received
the basal diet supplemented daily with 100.0 g/head of ruminally-
protected CLA. As criteria of response intake of nutrients, milk yield and
composition and fatty acid profile of milk fat were studied.
The intake of nutrients was not affected by the treatment (P >
0.05). Milk yield was similar in both groups (P > 0.05) however yield of
milk expressed in 4% FCM or in ECM was higher in C than in CLA (P <
0.05). Content of milk components did not differ between groups (P >
0.05) but concentration of fat tended to be higher in C (3.83 g/100 g) than
in CLA (3.41 g/100 g, P=0.0624). Yield of milk fat was higher in C (0.92
kg/d) in comparison to CLA (0.79 kg/d, P < 0.05). Content of SFA and
UFA in milk was 68.94 % and 30.98 % in C and was similar to that in
CLA being 68.27 % and 31.71%, respectively (P>0.05). Total content of
short-, medium- and long-chain FA was not affected by the treatment
(P>0.05). Content of individual selected FA did not differ significantly

206
between groups except of C17:1 and C20:0 that was higher in C than in
CLA (P < 0.05).
Key words: fatty acids, CLA, dairy cows
INTRODUCTION
Conjugated linoleic acid (CLA) is a term used for a mixture of
positional and geometric isomers of linoleic acid (cis- 9, cis-12
octadecadienoic acid) that contain conjugated unsaturated double bonds.
CLA is a naturally occurring fatty acid in foods derived from ruminants.
Average CLA content in milk varies between 0.3 and 0.6% of total fatty
acids. More than 82% of the CLA in dairy products is the cis-9, trans-11
isomer (Dhiman et al., 2000).
Conjugated linoleic acid has been shown to have anticarcinogenic
properties and possibly other effects that would be positive for human
health such us antiatherogenesis, antiobesity, enhancement of the immune
system, and the ability to prevent diabetes. Thus, increasing the
concentration of CLA in milk may be beneficial to public health and
enhance the consumption of dairy products (Solomon et al., 2000).
Typical consumption of CLA by humans is lower (on an
equivalent BW basis) than the dose that has been shown to be effective in
reducing tumors in animal models. Intake of CLA can be increased by
increasing the consumption of foods from ruminant origin or by
increasing the CLA content of foods derived from ruminant origin.
If these effects are found to occur in humans, increases in the
concentration of CLA would increase the nutritive and therapeutic value
of milk and milk products (Dhiman et al., 2000).
The CLA in ruminant milk and meat originates from CLA
produced from incomplete biohydrogenation of dietary linoleic acid in the
rumen, and endogenous synthesis of CLA from trans-11 octadecadienoic
acid, another intermediate of biohydrogenation. As summarized by

207
Griinari and Bauman (2003) several dietary factors can affect the
concentration of CLA in milk fat, including rumen-protected CLA as
documented in many recent studies (e.g. Dhimat et al., 2000, Cabria et al.,
2007, Solomon et al., 2000) However, isomers of CLA have also had an
inhibitory effect on bovine milk fat synthesis (Loor and Herbein, 1999).
Thus rumen-protected CLA may therefore be beneficial as a tool to
increase the protein to fat ratio in milk (Bauman and Griinari, 2001), and
potentially improve the energy balance of early lactation cows (Perfield II
et al., 2002).
The aim of the study was to determine the effect of feeding rumen
protected CLA to lactating dairy cows in mid-lactation with regards to
lactating performance and fatty acids profile of milk fat.
MATERIAL AND METHODS
Animals and experimental design
The experiment was carried out on 12 lactating dairy cows
(lactation 1 to 5, 26 weeks of lactation). Cows were divided into 2 groups
of 6 animals with similar milk yield. During the whole experiment cows
were fed on a basal diet based on maize silage (30 kg/d), lucerne hay (3
kg/d) and supplemental mixture (8 kg/d, all as fed basis). Control cows
(C) received the basal diets while experimental animals (CLA) received
the basal diet supplemented daily with 100.0 g/head of ruminally-
protected CLA (CLA CLAM ™ - P10, VVS Verměřovice, containing cis-
9, trans-11 and trans-10, cis-12 CLA isomers with palmitic acid as a
carrier). The experiment was carried out in the form of cross-over design
and was divided into 2 periods of 10 days. Each period consisted of 7
days of preliminary period followed by a 3-day experimental (collecting)
period.

208
Sampling and analyses:
Feed intake and respective refusals were monitored daily. In each
experimental period representative sample of individual feedstuffs and
respective refusals were taken for the determination of chemical
composition. Dry matter (DM) was determined by drying at 55 ºC for 24
h, followed by milling through a 1 mm screen and drying for another 4h at
103 ºC. Content of crude protein (CP), crude fiber (CF), ash and fat were
estimated according to AOAC (1984). Neutral detergent fiber (NDF, with
α-amylase) was estimated according to Van Soest et al. (1991), ash-free
acid detergent fiber (ADF) was estimated according to Goering and Van
Soest (1970).
Cows were milked twice a day (5.00 and 16.00 h). Milk yield was
recorded at each milking. During the experimental period, samples of milk
were taken from each milking. Samples for determination of basic
constituents were conserved by 2-bromo-2-nitropropane-1.3-diol
(Bronopol; D&F Control Systems, Inc. USA), cooled to the 6 °C and
analysed by infrared analyser (Bentley Instruments 2000, Bentley
Instruments Inc., USA). The urea content was determined using
UREAKVANT apparatus (AGROSLUŽBY Olomouc, s.r.o., Czech
Republic). Samples for determination of fatty acids (FA) profile were
taken at each milking. Morning and evening samples were mixed in
proportion corresponding to milk yield centrifuged and milk fat was kept
frozen at - 20°C until subsequent analyses.
FA profile was determined as follows: extracted milk fat (50–60
mg) was dissolved in isooctane and homogenised in ultrasound. After the
addition of sodium methanolate the mixture was heated under a reverse
cooler. FA were released in the form of fatty acid methyl esters (FAMEs)
which were separated using a gas chromatograph HP 4890D (Hewlett-
Packard, USA) with capillary column DB–23 (60 m × 0.25 mm × 0.25
μm). The column was held at 100 °C for 3 min after injection, the

209
temperature was programmed at 10 °C/min to 170 °C, then the
temperature was programmed at 4 °C/min to 230 °C and held at 250 °C
for 15 min, then the temperature was programmed at 5 °C/min to 250 °C.
The injector and detector temperature was 270 °C and 280 °C,
respectively. Nitrogen was used as a carrier gas. FAMEs were detected
with the flame ionisation detector (FID) and identified according to the
retention times using external standards of fatty acids Supelco 37
component FAME Mix (Supelco, USA) and linoleic acid conjugated
methyl ester (Sigma-Aldrich, Germany).
Statistical analyses
Data presented in this study are preliminary, calculated for 7
animals in each period and as a mean from 3 days of sampling.
Data obtained in the experiment were analysed using the GLM
procedure of the Statgraphics 7.0 package (Manugistics Inc. and
Statistical Graphics Corporation, Rockville, Maryland, USA) according to
the following model:
Yijkl = µ + Ti + Cj + Pk + εijkl,
where µ = general mean, Ti = treatment effect (i = 2), Cj = cow effect (j =
7), Pk = period effect (k = 2) and εijkl = error term.
RESULTS AND DISCUSSION
Results presented in the study are preliminary because analyses of
samples have not been finished yet, thus results described herein represent
n=7 (out of n=10). The nutrient intake is given in Table 1. Daily intake of
nutrients did not differ significantly between groups (P > 0.05). Milk
yield, content and daily production of milk components are presented in
Table 2. Milk yield was similar in both groups (P > 0.05) however yield

210
of milk expressed in 4% FCM or in ECM was higher in C than in CLA (P
< 0.05). Concentration of milk constituents did not differ between groups
(P > 0.05) but concentration of fat tended to be higher in C than in CLA
(P=0.0624). Similar results were reported by e.g. Medeiros et al. (2009).
Daily yield of milk fat was higher in C in comparison to CLA (P < 0.05),
that is in agreement with Madeiros et al. (2009), while yield of protein,
casein and lactose did not differ significantly (P > 0.05), which is in
accordance with findings of Sigl et al. (2010).
The fatty acid profile of milk fat is shown in Table 3. Content of
SFA and UFA in milk was 68.94 % and 30.98 % in C and was similar to
that in CLA being 68.27 % and 31.71%, respectively (P>0.05). Total
content of short-, medium- and long-chain FA was not affected by the
treatment (P>0.05). On the other hand Sigl et al. (2010), Bernal-Santos et
al. (2003) or Odens et al. (2007) found contents of short chain and middle
chain FA were reduced and the amount of long chain FA was increased.
However, latter mentioned studies were performed on cows in early
lactation when effect of rumen-protected CLA is more substantial.
Content of individual selected FA did not differ significantly between
groups except of C17:1 and C20:0 that was higher in C than in CLA (P <
0.05), the result of C20:0 is in agreement with Perfield et al. (2002).

211
Table 1. Average daily intake of nutrients
Units C CLA SEM Dry matter kg/d 18.5 18.5 0.13 CP1 kg/d 3.0 3.0 0.01 Fat kg/d 0.9 0.9 0.01 Ash kg/d 1.4 1.4 0.01 CF2 kg/d 2.9 2.9 0.01 NDF3 kg/d 5.8 5.8 0.01 ADF4 kg/d 3.6 3.6 0.01 NEL5 MJ/d 118.6 118.6 0.01 C = control group CLA = CLA group - supplemented daily with 100.0 g/head of ruminally-protected CLA 1CP= crude protein 2CF = crude fibre 3NDF = neutral detergent fibre 4ADF = acid detergent fibre 5NEL = net energy of lactation
Table 2. Milk yield, content and daily production of milk components
Units C CLA SEM Milk yield kg/d 23.84 23.15 0.273 FCM1 kg/d 23.31* 21.17* 0.439 ECM2 kg/d 23.23* 21.24* 0.386 Fat g/100 g 3.83 3.41 0.124 Protein g/100 g 3.27 3.17 0.034 Casein g/100 g 2.56 2.49 0.045 Lactose g/100 g 4.70 4.74 0.015 Urea mg/100 ml 28.56 28.70 0.205 FFA3 mmol/100g 1.72 2.04 0.359 Daily yield of milk components Fat kg/d 0.92* 0.79 * 0.028 Protein kg/d 0.78 0.73 0.015 Casein kg/d 0.61 0.58 0.014 Lactose kg/d 1.10 1.12 0.014 * P < 0,05 C = control group CLA = CLA group - supplemented daily with 100.0 g/head of ruminally-protected CLA 1 FCM = fat corrected milk 2 ECM = energy corrected milk calculated according Sjaunja et al. (1991) 3 FFA = free fatty acids

212
Table 3. Profile of selected FA (%)
C CLA SEM C 4:0 1.17 1.18 0.080 C 6:0 0.87 1.10 0.102 C 8:0 0.58 0.73 0.073 C 10:0 1.58 2.04 0.173 C 12:0 2.34 2.95 0.220 C 14:0 10.85 11.80 0.529 C 14:1 0.66 0.80 0.083 C 15:0 0.90 1.046 0.104 C 16:0 35.82 33.85 1.172 C 16:1 1.31 1.27 0.145 C 17:1 0.21* 0.26* 0.008 C 17:0 0.15 0.15 0.019 C 18:0 13.79 13.85 0.990 C 18:1 n9 24.54 23.50 1.105 C 18:2 n6t 2.19 2.59 0.750 C 18:2 n6c 1.81 1.48 0.585 C 18:3 n6 0.02 0.02 0.015 C 18:3 n3 0.24 0.28 0.036 C 20:0 0.09* 0.13* 0.013 C 22:0 0.02 0.05 0.012 Sum of: 1 SFA2 68.94 68.27 0.858 MUFA3 26.41 27.35 0.973 PUFA4 4.57 4.37 0.204 UFA5 30.98 31.71 0.851 Short-chain6 7.97 6.54 0.601 Medium-chain7 49.80 50.55 1.817 Long-chain8 42.15 42.89 1.950 * P < 0,05 C = control group CLA = CLA group - supplemented daily with 100.0 g/head of ruminally-protected CLA 1Sums of FA include also minor fatty acids not given in the table (C11:0, C13:0, C17:1, C20:1, C20:3 n6, C20:3 n3, C21:0, C24:1) 2SFA = saturated fatty acids
3UFA = unsaturated fatty acids 4MUFA = monounsaturated fatty acids 5PUFA = polyunsaturated fatty acids 6fatty acids with carbon length from C4 to C12 7fatty acids with carbon length from C14 to C16 8fatty acids with carbon length C18 and more

213
CONCLUSION
Preliminary results of our study indicate that feeding rumen
protected CLA to mid-lactating dairy cows caused reduction in milk fat
yield while milk yield and other milk components were unaltered. Shift in
the fatty acid profile of milk fat was not apparent under these conditions.
Acknowledgment: This work was supported by the Ministry of
Education, Youth and Sports of the Czech Republic, projects No. MSM
2678846201 a MSM 6215712402.
REFERENCES
Bauman, D. E., Griinari, M. 2003. Nutritional regulativ of milk fat
synthesis. Annual Review of Nutrition 23:203–227.
Bernal-Santos, G., Perfield, J. W., Barbano, D. M., Overton, T. R. 2003.
Production responses of dairy cows to dietary supplementation with
conjugated linoleic acid (CLA) during the transition period and early
lactation. Journal of Dairy Science 86:3218–3228.
Cabrita, A. R. J., Bessa, R. J. B., Alves, S. P., Dewhurst, R. J. & Fonseca,
A. J. M. 2007. Effects of dietary protein and starch on intake, milk
production, and milk fatty acid profiles of dairy cows fed corn silage-
based diets. Journal of Dairy Science 90:1429–1439.
Dhiman, T. R., Satter, L. D., Pariza, M. W., Galli, M. P. Albright &
Tolosa, M. X. 2000. Conjugated Linoleic Acid (CLA) Content of milk
from cows offered diets rich in linoleic and linolenic acid. Journal of
Dairy Science 83:1016–1027.
Medeiros, S. R., Oliveira, D. E., Aroeira, J. M., McGuire, M. A., Bauman,
D. E. & Lanna, D. P. D. 2009. Effects of dietary supplementation of
rumen-protected conjugated linoleic acid to grazing cows in early
lactation. Journal of Dairy Science 93:1126–1137.

214
Odens, L., Burgos, R., Innocenti, M., VanBaale, M, Baumgard, L. 2007.
Effects of varying doses of supplemental conjugated linoleic acid on
production and energetic variables during the transition period. Journal of
Dairy Science 90:293–305.
Perfield II, J. W., Bernal-Santos, G., Overton, T. R. & Bauman, D. E.
2002. Effects of dietary supplementation of rumen-protected conjugated
linoleic acid in dairy cows during established lactation. Journal of Dairy
Science 85:2609–2617.
Sigl, T., Schlamberger, G., Kienberger, H., Widemann, S., Meyer, H. &
Kaske, M. 2010. Rumen-protected conjugated linoleic acid
supplementation to dairy cows in late pregnancy and early lactation:
effects on milk composition, milk yield, blood metabolites and gene
expression in liver. Acta Veterinaria Scandinavica 52:1–8.
Sjaunja, L. O., Baevre, L., Junkkarinen, L., Pedersen, J. & Setala, J. 1991.
A Nordic proposal for an energy corrected milk (ECM) formula.
Performance recording of animals: State of the art 1990. EAAP
Publication 50:156–157, 192.
Solomon, R., Chase, L. E., Ben-Ghedalia, D. & Bauman, D. E. 2000. The
effect of nonstructural carbohydrate and addition of full fat extruded
soybeans on the concentration of conjugated linoleic acid in the milk fat
of dairy cows. Journal of Dairy Science 83:1322–1329.

215
CHEMICAL COMPOSITION AND IN VITRO TRUE
DIGESTIBILITY OF HEAT- AND LIGNOSULFONATE-
TREATED RAPESEED CAKE
SŁOTA K. - MICEK P.
Department of Animal Nutrition and Feed Management, University of
Agriculture in Krakow; 30-059 Krakow, al. Mickiewicza 24/28, Poland;
e-mail: [email protected]
ABSTRACT
Chemical composition as well as nitrogen solubility and in vitro
true digestibility (IVTD) of both heat- and lignosulfonate-treated rapeseed
cake (RSC) were determined. It was shown that nitrogen solubility of
RSC treated with Norwegian lignosulfonate was statistically (P<0.05)
lower than RSC treated with other lignosulfonates (Swedish, Russian,
Czech and Spanish). Temperature in the range 90 - 110 ° C for 60 minutes
is a limiting factor for nitrogen solubility of tested feeds. However, the
effect is better when both temperature and LSO3 are used. Thus, it was
concluded that the protection of RSC protein both by LSO3 and heating
may be a useful method to decrease digestibility of protein in the rumen.
MATERIAL AND METHOD
The aim of this study was to determine the usefulness of heating
and lignosulfonates (LSO3) – by-products of paper industry, to decrease
protein of rapeseed cake (RSC) degradability in the rumen. RSC from oil
pressing industry was both heat-treated (90 or 110 oC) and LSO3-treated
(2,5 or 5,0 % of dry matter (DM)) with lignosulfonates of 5 different
origins (Norwegian spruce-calcium, Swedish spruce-sodium, Russian
spruce-sodium, Czech spruce-magnesium, Spanish eucalyptus-calcium).

216
Chemical composition of representative samples of treated RSC was
determined by standard methods [AOAC 2001]. Solubility of nitrogen
was determined by Licitra et al. [1996] and in vitro true digestibility
(IVTD) was determined using filter bags method in DaisyII Incubator
[ANKOM 1998]. The results were subjected to one-way analysis of
variance.
RESULTS AND DISCUSSION
Excessive degree and rate of feed protein degradation in the
rumen is the reason for the continuous research for new ways to protect
this important component [Kamalak et al. 2005]. However the methods of
protection can’t affect rumen metabolism and limit nutrient digestibility in
further parts of the gastrointestinal tract [Mahala and Gomaa 2007].
Protective value of heat is known for years [Mielke and Schingoethe
1981, Faldes et al. 1992] but it is important not to overprotect feeds by
using too high temperature due to the adverse effects of the Maillard
reaction such as limitation of protein digestibility and amino acid
absorption [Finot 2005]. To enhance protection effect of temperature
additionally lignosulfonates were used in this test. Numerous publications
suggest the possible use of lignosulfonates to protect the proteins of
soybean meal or rapeseed meal [Windschitl and Stern 1988, McAllister et
al. 1993, Wright et al. 2005, Borucki Castro et al. 2007, Neves et al.
2009] but there is very few information about protection of RSC nutrients.
Results of the experiment are shown in Table 1. The amount of crude
protein ranged from 340 g • kg-1 DM (Norwegian) to 357 g • kg-1 DM
(Swedish, Czech, Spanish), but the differences were not statistically
significant (P <0.05). The highest content of ADF and ADIN, as well as
the lowest content of nitrogen solubility was observed in RSC treated with
Norwegian lignosulfonate.

217
Table 1. Chemical composition and nitrogen solubility of rapeseed cake.
Specification Origin of lignosulfonates1 Norwegian Swedish Russian Czech Spanish
Crude Protein 340 A 357 A 354 A 357 A 357 A ADF2 241 A 213 A 231 A 231 A 231 A ADIN3 8.2 A 6.7 B 7.1 B 7.0 B 6.9 B
Nitrogen 33.8 A 38.0 B 38.8 B 40.0 B 40.5 B 1 Mean in the row marked with different letters differ statistically (P<0.05) 2 Acid Detergent Fibre 3 Acid Detergent Insoluble Nitrogen
Statistical analysis shows that both heating and LSO3 can
decrease nitrogen solubility and IVTD of rapeseed cake. Moreover, the
degree of protection is strongly correlated with origin of lignosulfonates
and temperature used during heating. Lignosulfonates used in experiment
contain different level of sugars. In Maillard reaction these sugars bind
RSC proteins and form the final products, which decrease nitrogen
solubility and IVTD of treated RSC.
CONCLUSION
In vitro studies show that it is possible to use both heating and
LSO3 to reduce protein of RSC degradation in the rumen. However, this
method requires further studies with experimental animals, especially to
determinate the effect of treatment on intestinal lysine availability.
REFERENCE
1. ANKOM (1998). Procedures for fibre and in vitro analysis. URL:
http:\\www.ankom.com
2. AOAC (2001). Association of Official Analytical Chemists.
Official methods of analysis, 17th edition, Virginia, USA
3. Borucki Castro S.I., Phillip L.E., Lapierre H., Jardon P.W.,
Berthiaume R. (2007). Ruminal degradability and intestinal digestibility

218
of protein and amino acids in treated soybean meal products. J. Dairy Sci.
90, 810-822
4. Faldet M.A., Son Y.S., Satter L.D. (1992). Chemical, In Vitro,
and In Vivo Evaluation of Soybeans Heat-Treated by Various Processing
Methods. J. Dairy Sci., 75, 789-795
5. Finot P.A. (2005). Historical Perspective of the Maillard Reaction
in Food Science. Ann. New York Academy of Sciences, 1043: 1–8
6. Kamalak A., Canbolat Ö., Gürbüz Y., Özay O. (2005). Protected
protein and amino acids in ruminant nutrition. Journal of Science and
Engineering, 8(2), 84-88
7. Licitra G., Hernandez T. M., Van Soest P. J., 1996.
Standardization procedures for nitrogen fractionation of ruminant feeds.
Anim. Feed Sci. Technol., 57, 347–358
8. Mahala A.G., Gomaa A.S. (2007). Effect of heat treatment on
sesame cake protein degradation. Journal of Animal and Veterinary
Sciences, 2, 39-42
9. McAllister T.A., Cheng K.-J., Beauchemin K.A., Bailey D.R.C.,
Pickard M.D., Gilbert R.P. (1993). Use of lignosulfonate to decrease the
rumen degradability of canola meal protein. Canadian Journal of Animal
Science, 73:(1), 211-215
10. Mielke C.D., Schingoethe D.J. (1981). Heat-Treated Soybeans
for Lactating Cows. Journal of Dairy Science 64, 7, 1579-1585
11. Neves C.A., dos Santos W.B.R., Santos G.T.D., da Silva D.C.,
Jobim C.C., Santos F.S., Visentainer J.V., Petit H.V. (2009). Production
performance and milk composition of dairy cows fed extruded canola
seeds treated with or without lignosulfonate. Animal Feed Science and
Technology 154, 83-92
12. Windschitl P.M., Stern M.D. (1988). Evaluation of calcium
lignosulfonate-treated soybean meal as a source of rumen protected
protein for dairy cattle. J. Dairy Sci., 71(12)

219
13. Wright C.F., von Keyserlingk M.A.G., Swift M.L., Fisher L.J.
(2005). Heat- and lignosulfonate-treated canola meal as a source of
ruminal undegradable protein for lactating dairy cows. J. Dairy Sci., 88,
238-243

220

221
FERMENTATION CHARACTERISTICS OF MAIZE SILAGES
WITH CHEMICAL ADDITIVE
ŠEVČÍK, P. – BÍRO, D. – JURÁČEK, M. – ŠIMKO, M. – GÁLIK, B.
– ROLINEC, M.
Department of Animal Nutrition, Faculty of Agrobiology and Food
Resources,
Slovak University of Agriculture in Nitra
ABSTRACT
The aim of this study was to detect the fermentation process of
maize silages with addition of chemical additive. We conserved in
laboratory conditions of whole maize plants in the vegetation stage of the
milk-wax maturity. The whole plants were cut to 20 mm length of cut and
ensiled without additive (variant C) and with chemical additive (variant A:
sodium chloride in dosage 1.5 kg.t-1). The silage matter was packed into
laboratory silos with volume 4 dm3 (n=3), sealed, and stored at 20±2 oC.
After 8 weeks of storage in laboratory conditions, we determined in maize
silages the content of dry matter and parameters of fermentation process
(formic, acetic, lactic, butyric acid, ammonia, alcohols, fermentation
products, acidity of water extract and pH value). The concentration of
ammonia (NH3) and the content of lactic acid, fermentation products and
pH value were not affected by the treatment (P>0.05). We didn`t detect
the occurrence of undesirable butyric acid in all maize silages. The
content of formic acid and alcohols in the silages with chemical additive
was significantly (P<0.05) decreased compared to the silages without
additive - variant C (2.54 vs. 2.00 and 6.98 vs. 4.97 g.kg-1 of dry mater).
Silages with additive – variant A had higher content of acetic acid
(P<0.05) and active acidity than silages without additive – variant C.
222
MATERIAL AND METHODS
We investigated the influence of chemical additive (sodium
chloride) on fermentation characteristics of maize silages. We ensiled in
experimental conditions of maize (Zea Mays L.) from dairy farm in
Oponice (University experimental farm Kolíňany). The maize was
harvested in vegetation stage of the milk-wax maturity. The whole plants
were cut to average 20 mm length of cut and ensiled without (silages
without additive - variant C) and with additive (silages with chemical
additive - variant A). As chemical additive we used sodium chloride in
dosage of 1.5 kg.t-1. Silage matter was packed into laboratory silos with
volume 4 dm3, sealed, and stored at 20±2 oC. Three replicates per variant
were ensiled. We opened the silos after 8 weeks of fermentation and
determined the content of dry matter and indices of fermentation process
in average samples. We used standard analytical methods (Regulation of
the Slovak Ministry of Agriculture no. 2145/2004-100 about sampling of
feeds and about laboratory testing and evaluating of feeds). The content of
dry matter was determined gravimetrically by drying the sample to
constant weight by temperature 103±2 oC (before predrying by t 60°C).
Silage extracts were prepared from 200 g of sample and watered by 2000
ml of distilled water, after 20 hours filtrated. Contents of fermentation
acids (lactic, acetic, formic, butyric) we detected on analyzer EA 100
(VillaLabeco) by electrophoretic method. Content of ammonia (NH3) and
alcohols we determined by microdiffusion method, acidity of water
extract by alkalimetric titration to pH 8.5 and active acidity (pH) by
electrometric method. Fermentation products we calculated according to
Sommer et al. (1994). The results were statistically processed by using
one factorial variance analysis (ANOVA) of SAS. Means were separated
by using the Fischer LSD multiple range test.

223
RESULTS AND DISCUSSION
The addition of sodium chloride as silage additive was studied by
many authors (Shockey and Borger, 1991; Rezende et al., 2011; Bal and
Bal, 2012). Dry matter content of maize silages was very similar (Table
1). This is in accordance with Lád et al. (2003), Loučka (2010) and
Rajčáková and Mlynár (2009) which described the optimal content of dry
mater for maize silage 300-340 g.kg-1, 280-340 g.kg-1 and 310-350 g.kg-1,
respectively. Concentration of formic acid was affected by the treatment
(P<0.05). Content of lactic acid in maize silages was higher than 10 g per
kg of original matter in all variants. We determined nonsignificantly
(P>0.05) lower content of lactic acid in silages with chemical additive
(variant A) compared to silages without additive (variant C). Content of
acetic acid was significantly higher in variant A compared to the variant C
(P<0.05). On the other hand, Doležal et al. (2008); Tyrolová and Výborná
(2011), found decreased of acetic acid content after application of
chemical additive in other types of silages. From point of negative
influence to animal health and quality and nutritive value of silages is
undesirable content of butyric acid. We didn’t find any occurrence of
butyric acid in tested silages. Active acidity (pH) of water extracts was not
affected by the treatment (P>0.05). Silages in our experiment had a lower
value of pH as reported Polák and Jančová (2006) in maize silages
analyzed in years 2001-2006 (n=634). Concentration of ammonia (NH3)
and content of fermentation products were not affected by the treatment
(P>0.05). Content of alcohols was significantly lower in silages with
chemical additive (variant A) compared to silages without additive
(variant C) (P<0.05). Similary to Vršková and Bencová (2011) who
analyzed 30 maize silages with dry matter content 30-35 % detected
average content of alcohols 5.01 g.kg-1 of dry matter.

224
Table 1. Result of fermentation process of maize silages
n=3 silages without silages with chemical additive x S.D. x S.D.
dry mater g.kg- 314.5 4.46 313.4 4.60 formic
g.kg
-1
of
dr
y
mat
ter
2.54* 0.151 2.00* 0.185 lactic 71.11 4.321 67.41 1.022 acetic 14.03* 0.373 25.45* 1.530 NH3 0.946 0.091 0.900 0.030 alcohols 6.98* 0.868 4.17* 0.461 FP 78.00 3.640 71.58 0.648 AWE 1621.33* 43.132 1795.33* 12.503 pH 3.71 0.010 3.72 0.010 FP: fermentation products, AWE: acidity of water extract - mg KOH/100 g of silage, *values with identical superscripts in row are significantly different at P<0.05
CONCLUSION
The objective of the experiment was to evaluate the effect of the
supplementation of chemical additive (sodium chloride) on fermentation
process of whole plant maize silages. The supplementation of chemical
additive in the maize silages inhibited formation of alcohols (P<0.05) and
formic acid, too (P<0.05). In these silages, significantly (P<0.05) higher
content of acetic acid and acidity of water extract were determined in
comparison to silages without additive.
Acknowledgement: This study and experiment were financially
supported by Scientific Grant Agency of the Ministry of Education,
Science, Research and Sport of the Slovak Republic and Slovak Academy
of Sciences (project n. 1/0662/11).
REFERENCE
Bal, E.B.B. – Bal, M.A. 2012. Effects of chemical additives and ensiling
time on whole plant wheat silage microbial profiles inferred by

225
phenotypic and 16S ribosomal DNA analyses. In World Journal of
Microbiology and Biotechnology, vol. 28, no. 2, p. 767–776.
Doležal, P. – Zeman, L. – Skládanka, J. 2008. Effect of supplementation
of chemical preservative on fermentation process of lupine silage. In
Slovak Journal of Animal Science, vol. 41, no. 1, p. 30-38.
Lád, F. – Kadlec, J. – Jančík, F. – Čermák, B. 2003. The influence of
ensilage supplements for choice qualitative parameters of maize ensilages
in working conditions. In Forage conservation. Nitra: RIAP. p. 190-191.
Loučka, R. 2010. Effect of harvesting corn with higher dry matter on
chemical composition and quality of silage. In Forage conservation. Brno:
MU, p. 201-203.
Polák, M. – Jančová, M. 2006. Faktory ovplyvňujúce kvalitu kukuričnej
siláže. In Naše pole, roč. X., č. 9, s. 39-40.
Rajčáková, Ľ. - Mlynár, R. 2009. Zásady využívania potenciálu silážnych
a konzervačných prípravkov pri výrobe kvalitných a hygienicky
nezávadných konzervovaných krmív. Metodická príručka, Nitra: CVŽV,
44 s.
Regulation of the Slovak Ministry of Agriculture no. 2145/2004-100
about sampling of feeds and about laboratory testing and evaluation of
feeds, vol. 36, 342 p.
Rezende, A.V. – Rabelo, C.H.S. – Rabelo, F.H.S. – Nogueira, D.A. –
Nogueira Achar de Faria, D.C. – Avila Barbosa, L. 2011. Fermentation
losses and aerobic stability of sugarcane silages treated with whitewash
and sodium chlorite. In Revista Brasileira de Zootecnia, vol. 40, no. 4, p.
739-746.
SAS Institute INC: SAS User`s Guide: Statistics, 5th ed. SAS Institute,
Inc., Cary, NC, USA 1985.
Shockey, W.L. - D.C. Borger. 1991. Effect of salt on fermentation of
alfalfa. 2. Treatment with sodium chloride, clostridium butyricum, and
lactic acid bacteria. In Journal of Dairy Science, vol. 74, p.160-166.

226
Sommer, A. - Čerešňáková, Z. - Frydrych, Z. 1994. Nutrient requirements
and nutritive value of feeds for cattle. 1st. ed. Nitra: RIAP, 113 p.
Tyrolová, Y. – Výborná, A. 2011. The effects of wilting and biological
and chemical additives on the fermentation process in field pea silage. In
Czech Journal of Animal Science, vol. 56, no. 10, p. 427-432.
Vršková, M. – Bencová, E. 2011. Kvalita kukuričných siláží v SR. In IX.
Kábrtovy dietetické dny. Brno: VFU, s. 148-153.

227
INFLUENCE OF MINERAL FERTILIZATION AND PASTURE
MANAGEMENT ON FORAGE QUALITY
ŠTÝBNAROVÁ, M. – POZDÍŠEK, J.
Department of Feed Production and Animal Nutrition, Research Institute
for Cattle Breeding, Ltd.
ABSTRACT
The effects of different levels of grazing utilization and mineral
fertilization on the grassland quality were studied in the locality of
Rapotín during 2003-2010. The plots with area of 200 m2 were grazed
rotationally by heifers from the suckler cows breeding system with three
different intensities of grazing utilization (four-P4, three-P3 or two–P2
grazing periods per year). Each type of utilization was established in a
treatment with or without application of mineral fertilizers N100P30+K60
(pure nutrients). The forage from extensively utilized pastures (effect of
fertilization was insignificant) was characterised by a low energy value
(NEL = 5.07 MJ.kg-1 DM for nil-fertilization; NEL = 4.95 MJ.kg-1 DM for
NPK treatment). We further found out that the demand for energy
supplements to balance the nutrient ratio in animals´ feeding rations
increased with the intensive grassland management with nitrogen
fertilization (PDIN / PDIE = 1.29). In this study and under experimental
conditions the best suitable nutrient ratio (PDIN / PDIE = 0.95) was found
out in grassland utilization with three grazing periods per year without
fertilization.
MATERIAL AND METHODS
This study was aimed at the evaluation of effects of different
levels of grazing utilization and mineral fertilization of permanent

228
grassland on the fodder quality within the context of nutrition aspects.
Permanent grassland vegetation relating to the alliance Arrhenatherion
has been studied in terms of a long-term small-plot trial. The experiment
was established in 2003 in the locality of Rapotín (altitude 340 m a.s.l.;
annual rainfall 693 mm; mean annual temperature 7.2 °C). The locality
belongs to the geomorphological unit called the Hrubý Jeseník. Before the
experiment setup, the grassland had been used as cattle pasture.
The plots with area of 200 m2 were grazed rotationally by heifers
from the suckler cows breeding system with three different intensities of
grazing utilization (four-P4, three-P3 or two–P2 grazing periods per year).
Each type of utilization was established in a treatment with or without
application of mineral fertilizers N100P30+K60 (pure nutrients).
Phosphorous was applied as superphosphate and potassium as potassium
salt at one rate in the spring. Ammonium salt with limestone was used as a
nitrogen fertilizer, whereas N fertilization strategy was a split-application
with 50 % of N at spring and 50 % of N at summer. After each grazing
period residual forage was mowed and removed from the experimental
plots.
The forage samples were obtained from the plots before the first
grazing period. The content of nutrients (crude protein, ether extract,
crude fibre and ash) in forage was determined by the Weende method.
The Fibertec System 2023 Fibercap (Comp. FOSS) was used to analyse
crude fibre (CF), neutral detergent fibre (NDF) and acid detergent fibre
(ADF) according procedure of Van Soest (1963). The organic matter
digestibility (OMD) was estimated by means of the in vitro Tilley and
Terry method (1968) modified according to Resch (1991). Normative
equations published by Petrikovič et al. (2000) were used for calculation
of energy value (NEL, NEF) and protein value (PDI).
A two-way ANOVA (effects of intensity of utilization,
fertilisation and their interactions) followed by post hoc comparison using

229
Tukey’s HSD test at the 0.05 level of significance was used to evaluate
the data using the software Statistica v. 10.
RESULTS AND DISCUSSION
Data characterizing forage quality of particular treatments are
given in Table 1. In the mean of years the highest value of crude protein
(CP) was found in the intensive treatment with NPK fertilization (190.7
g.kg-1 DM). Butkuvienė and Butkutė (2007) who investigated the
influence of different pasture improvement measures on chemical
composition confirmed an increase of the content of CP in pasture sward
after N fertilization (120 kg.ha-1 N).
We further found that the concentration of crude fibre (CF) in
permanent grasslands significantly decreased with the increasing number
of grazing periods per year (from 302.2 g.kg-1 DM for extensive grassland
utilization to 201.7 g.kg-1 DM for intensive grassland utilization).
Additional mineral fertilization of pasture sward had only little influence
on this qualitative parameter. Our findings correspond with the results of
Gruber et al. (2000) or Klimeš et al. (2007).
NDF is the most accurate characteristic of the total fibre content
and it closely correlates with dry matter intake and rumination activity
(Gruber, 2010). As we found a significant influence of the extensive
grassland utilization on increase of NDF concentration in the forage (up to
609.4 g.kg-1 DM for the fertilized treatment) we can than assume that also
the feed intake by ruminants was lower by this type of grassland
management. It became evident on the high portion of the residual forages
after each grazing period.
Within our study the mean results for organic matter digestibility
(OMD) ranged from 62.4 % to 75.7 %. Important factor influencing the
nutritional value of forage is the growth stage, in which plants are during
the grazing period (leaf/stem ratio of a forage crop) (Jacobs et al., 2011).

230
Within our study the intensity of utilization had large and significant
effects on OMD, with decreasing intensity of utilization OMD decreased.
The influence of fertilization was not significant. Also from the viewpoint
of the energy value of grasslands the factor of intensity of utilization was
within our study more relevant than fertilization. Subsequently, the
highest values of net energy of lactation (6.23 MJ.kg-1 DM) showed the
intensively utilized grassland without fertilization. Extensive grassland
utilization led to a significant decrease of energy concentration (up to
NEL value 4.95 MJ.kg-1 DM).
The evenness of nutrients in diets can be examined in the PDI
system (PDI = protein digestible in the small intestine) by the PDIN /
PDIE ratio (it represents, respectively, nitrogen or energy limiting protein
digestible in the small intestine). It is desirable that this ratio should
approach the value of 1, because animals have minimum requirements for
other supplements. Considering this presumption we can announce that
the demand for energy supplements increased not only under the extensive
grassland utilization but also under the intensive grassland management
with nitrogen fertilization (PDIN / PDIE = 1.29). The best PDIN / PDIE
ratio (0.95) was achieved in our study in an unfertilized treatment utilized
three times per year, however suitable ratio (1.08) was also found for the
treatment utilized in four grazing periods per year without fertilization and
for the treatment utilized in medium intensive way with fertilization.
CONCLUSION
Carefully planned grazing can help increase diet quality, which
decreases the demand for feeding supplements. Our research showed that
the radical deterioration in the forage value (low content of nutrients and
energy) was exhibited by extensively utilized grasslands. The intensively
utilized grassland with nitrogen fertilization showed an unbalanced ratio
of nutrients, which also means the need of supplements to balance the

231
feeding ration of animals. In our trial conditions the grassland utilization
in three grazing periods per year without fertilization appeared to be the
most suitable way from the nutritional aspect. From the viewpoint of the
pasture fertilization farmer has to take into account all economic, floristic
and feeding aspects. Different approaches depending on the site and
climatic conditions and the purpose of forage utilization are fundamental
to appropriate grassland management.
Acknowledgement: The work was supported by the Ministry of
Education, Youth and Sports of the Czech Republic, Project INGO No.
LA08041.
REFERENCE
BUTKUVIENĖ E., BUTKUTĖ R. (2007): The changes of sward botanical and
chemical composition depending on pasture improvement measures.
Grassland Science in Europe, 12, 118-121.
GRUBER L. (2010): NDF for description of the physical structure of the
diet and of ruminal fermentation. In: Proceedings of the 37.
Viehwirtschaftliche Fachtagung, Raumberg-Gumpenstein, pp. 7–22.
GRUBER L., STEINWIDDER A., GUGGENBERGER T., SCHAUER A.,
HÄUSLER J., STEINWEDER R., STEINER B. (2000): Influence of grassland
management on yield, nutritive value, milk production and nutrient
excretion. In: Proceedings from the 27. Viehwirtschaftliche Fachtagung,
Raumberg-Gumpenstein, pp. 41-88.
JACOBS A.A.A., SCHEPER J.A., BENVENUTTI M.A., GORDON J., POPPI
D.P., ELGERSMA A. (2011): Tensile fracture properties of seven tropical
grasses at different phenological stages. Grass and Forage Science, 66,
551-559.
KLIMEŠ F., KOBES M., SUCHÝ, K. (2007): A possibilities of maronization
of production and nonproduction functions of permanent grasslands. In:

232
Pozdíšek J. (ed) Multifunkční obhospodařování a využívání travních
porostů v LFA. VÚCHS, Rapotín, s. 74-79.
PETRIKOVIČ P., SOMMER A., ČEREŠŇÁKOVÁ Z., SVETLANSKÁ M.,
CHRENKOVÁ M., CHRASTINOVÁ L., POLÁČKOVÁ M., BENCOVÁ E.,
DOLEŠOVÁ P. (2000): Výživná hodnota krmív. VÚŽV, Nitra, 320 s.
RESCH R. (1991): In vitro – organic matter digestibility according Tilley
and Terry 1963. In: Proceedings of Meeting of ALVA scientific
experimental essence group, Innsbruck, pp. 22-23.
TILLEY J.M.A., TERRY R.A. (1968): Procedure for in vitro digestion of
herbage samples. The Grassland Research Institute, Harley, Nr.
Maidenhead, Berkshire, 1968.
VAN SOEST P.J. (1963): Use of detergents in the analysis of fibrous feeds.
II. A rapid method for the determinations of fibre and lignin. J. Assoc.
Offic. Anal. Chem., 46, 829-835.
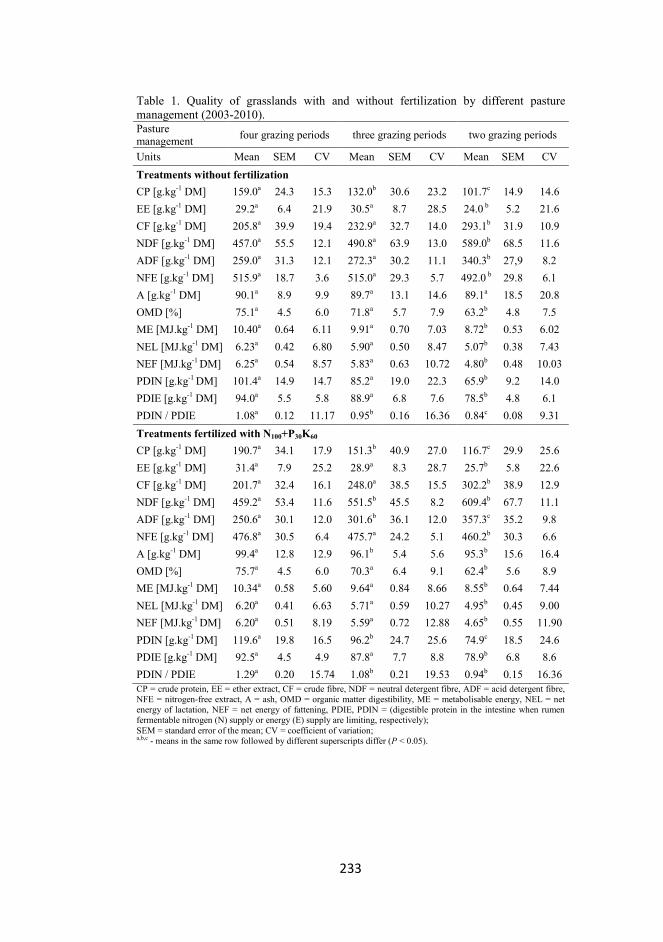
233
Table 1. Quality of grasslands with and without fertilization by different pasture management (2003-2010). Pasture management four grazing periods three grazing periods two grazing periods
Units Mean SEM CV Mean SEM CV Mean SEM CV Treatments without fertilization CP [g.kg-1 DM] 159.0a 24.3 15.3 132.0b 30.6 23.2 101.7c 14.9 14.6 EE [g.kg-1 DM] 29.2a 6.4 21.9 30.5a 8.7 28.5 24.0 b 5.2 21.6 CF [g.kg-1 DM] 205.8a 39.9 19.4 232.9a 32.7 14.0 293.1b 31.9 10.9 NDF [g.kg-1 DM] 457.0a 55.5 12.1 490.8a 63.9 13.0 589.0b 68.5 11.6 ADF [g.kg-1 DM] 259.0a 31.3 12.1 272.3a 30.2 11.1 340.3b 27,9 8.2 NFE [g.kg-1 DM] 515.9a 18.7 3.6 515.0a 29.3 5.7 492.0 b 29.8 6.1 A [g.kg-1 DM] 90.1a 8.9 9.9 89.7a 13.1 14.6 89.1a 18.5 20.8 OMD [%] 75.1a 4.5 6.0 71.8a 5.7 7.9 63.2b 4.8 7.5 ME [MJ.kg-1 DM] 10.40a 0.64 6.11 9.91a 0.70 7.03 8.72b 0.53 6.02 NEL [MJ.kg-1 DM] 6.23a 0.42 6.80 5.90a 0.50 8.47 5.07b 0.38 7.43 NEF [MJ.kg-1 DM] 6.25a 0.54 8.57 5.83a 0.63 10.72 4.80b 0.48 10.03 PDIN [g.kg-1 DM] 101.4a 14.9 14.7 85.2a 19.0 22.3 65.9b 9.2 14.0 PDIE [g.kg-1 DM] 94.0a 5.5 5.8 88.9a 6.8 7.6 78.5b 4.8 6.1 PDIN / PDIE 1.08a 0.12 11.17 0.95b 0.16 16.36 0.84c 0.08 9.31 Treatments fertilized with N100+P30K60 CP [g.kg-1 DM] 190.7a 34.1 17.9 151.3b 40.9 27.0 116.7c 29.9 25.6 EE [g.kg-1 DM] 31.4a 7.9 25.2 28.9a 8.3 28.7 25.7b 5.8 22.6 CF [g.kg-1 DM] 201.7a 32.4 16.1 248.0a 38.5 15.5 302.2b 38.9 12.9 NDF [g.kg-1 DM] 459.2a 53.4 11.6 551.5b 45.5 8.2 609.4b 67.7 11.1 ADF [g.kg-1 DM] 250.6a 30.1 12.0 301.6b 36.1 12.0 357.3c 35.2 9.8 NFE [g.kg-1 DM] 476.8a 30.5 6.4 475.7a 24.2 5.1 460.2b 30.3 6.6 A [g.kg-1 DM] 99.4a 12.8 12.9 96.1b 5.4 5.6 95.3b 15.6 16.4 OMD [%] 75.7a 4.5 6.0 70.3a 6.4 9.1 62.4b 5.6 8.9 ME [MJ.kg-1 DM] 10.34a 0.58 5.60 9.64a 0.84 8.66 8.55b 0.64 7.44 NEL [MJ.kg-1 DM] 6.20a 0.41 6.63 5.71a 0.59 10.27 4.95b 0.45 9.00 NEF [MJ.kg-1 DM] 6.20a 0.51 8.19 5.59a 0.72 12.88 4.65b 0.55 11.90 PDIN [g.kg-1 DM] 119.6a 19.8 16.5 96.2b 24.7 25.6 74.9c 18.5 24.6 PDIE [g.kg-1 DM] 92.5a 4.5 4.9 87.8a 7.7 8.8 78.9b 6.8 8.6 PDIN / PDIE 1.29a 0.20 15.74 1.08b 0.21 19.53 0.94b 0.15 16.36 CP = crude protein, EE = ether extract, CF = crude fibre, NDF = neutral detergent fibre, ADF = acid detergent fibre, NFE = nitrogen-free extract, A = ash, OMD = organic matter digestibility, ME = metabolisable energy, NEL = net energy of lactation, NEF = net energy of fattening, PDIE, PDIN = (digestible protein in the intestine when rumen fermentable nitrogen (N) supply or energy (E) supply are limiting, respectively); SEM = standard error of the mean; CV = coefficient of variation; a,b,c - means in the same row followed by different superscripts differ (P < 0.05).
Names of publication: NutriNET 2012
Publication type: Proceedings of International Animal Nutrition PhD Students
Conference
Authors of publication: Team of authors by content
Editors: Mgr. Ing. Eva Mrkvicová, Ph.D.
Doc. Ing. Martina Lichovníková, Ph.D.
Ing. Marián Foltýn
Reviewers: Prof. Ing. Jiří Zelenka, CSc.
Mgr. Ing. Ludmila Křížová, Ph.D.
Number of pages: 234
Number of copies: 100
Publisher: Mendel University in Brno, Faculty of Agronomy, Zemědělská
1, 613 00 Brno, Czech Republic
Date and location of the meeting: November 21 – 22, 2012. Mendel University in Brno
ISBN: 978-80-7375-667-3