Embed Size (px)
Citation preview

Appl. Sci. 2012, 2, 629-640; doi:10.3390/app2030629
applied sciences ISSN 2076-3417
www.mdpi.com/journal/applsci
Article
Numerical Observation of the Jet Flight Patterns of Linear Shaped Charges
Matthew Johnston and Seokbin Lim *
Energetic Systems Research Group, Department of Mechanical Engineering, New Mexico Tech,
Socorro, NM 87801, USA; E-Mail: [email protected]
* Author to whom correspondence should be addressed; E-Mail: [email protected];
Tel.: +1-575-835-6589.
Received: 1 June 2012; in revised form: 27 June 2012 / Accepted: 2 July 2012 /
Published: 6 July 2012
Abstract: Linear Shaped Charges (LSCs) have been assumed to function in the same
manner as Conical Shaped Charges (CSCs) in the published literature that describes a
metallic jet process for penetration. However, based on the facts that the LSC liner is
composed of flat surfaces instead of the curved cone shaped liner of a CSC and the LSC
detonation propagation is perpendicular to the penetrator projection direction, the approach
to investigate the penetrator formation process of LSCs should be examined from a
different perspective. Because there are fundamental differences between CSCs and LSCs
in the formation of a jet, the cutting performances would be under different regimes. As a
preliminary investigation, in this paper, we report a numerical observation of the LSC
jetting properties using AUTODYN®.
Keywords: linear shaped charges; jet profile; penetration; hydrocode
1. Introduction
The jet formation process of shaped charges, including both linear and conical, has been a major
research area for over a half century and has been aimed at the increase in penetration capability for many
different applications. However, due to a few numbers of applications for military purposes and a
multi-dimensional complex geometry, a comparatively small amount of study has been done in the field
of linear shaped charges.
OPEN ACCESS

Appl. Sci. 2012, 2 630
There have been few publications about the motion of the LSC liner since the initiation of the
Birkhoff theory [1] including the development of a numerical simulation code, LESCA, specifically
designed for LSCs applications which involve a combination of numerical approaches and a series of
analytical approximations [2]. Traditionally, the jet formation process of LSCs has been assumed to be
the same process as that of CSCs based on the Birkhoff theory. The jet is created by a gradual collapse
of the liner caused by the detonation of a high explosive charge. The jet is then elongated due to the
velocity gradient between the tip and base of the jet [3]. However, in case of the LSC, the initiation
point is not along the top of the liner as in the case of a CSC. Due to this, it is anticipated that the
jet formation process of a LSC is somewhat different from that of a CSC. The laterally long high
explosive charge along the length of LSC has to be initiated from one end in common practices,
creating a gradual flat liner collapse in a side direction [4,5]. Because a LSC liner consists of two
flat metallic components instead of a curved liner as in CSCs, different jetting properties during
penetration would be present and a more detailed investigation regarding the jet formation or behavior
is necessary to understand the penetration performance of LSCs.
The main objective in this series of preliminary simulations is to identify both the jetting behavior
during the detonation of a LSC and specific flight formation of the jet before impacting a target.
During the course of the project, a preliminary computational study of LSC jet impacts on a mild
steel target is investigated and the impact formation to the target is identified as well. The impact
configurations are changed by varying the standoff distance, and a series of hydrocode simulations
using AUTODYN® is completed to validate the results.
2. Numerical Modeling I
A series of computer simulations is run to identify a general trend of damage and other related
behaviors on the surface of a mild steel target under the impact of a LSC jet.
By studying the parameters of the linear shaped charge jet impact onto the target surface, including
the penetration depth, several effects can be studied. Firstly, the overall extent of the damage profile
generated from the LSC jet impact after flight of a certain standoff distance can be more effectively
analyzed. The accuracy of the simulation parameters can also be examined allowing a further detailed
investigation later by comparing the simulation results to the actual testing results and the numerical
parameters can be re-adjusted to improve the accuracy of the simulation results. Because of the
identification of the damage profile on the surface of the mild steel target and the flight pattern of the
jetting is more important than the study of jet formation after the liner collapse in this section, the
investigation focuses on the damage profile after the impact and jetting pattern during flight. The
computer simulation software used during this analysis is AUTODYN®.
In order to investigate the jet penetration formation into a mild steel target, a commercially
manufactured 1,200 gr/ft LSC and a mild steel target are modeled and simulated. The 1,200 gr/ft LSC
is created based on the manufacturer specifications for accuracy. The LSC and target are built using
the SPH and Lagrangian solvers [6] respectively totaling 2.7 million cells in a single model.
The LSC and target are set to maintain the optimum standoff distance (OSD) between the LSC base
and the target surface as described by the manufacturer. The material properties of the models can be

Appl. Sci. 2012, 2 631
seen in Table 1. Figure 1 shows the externally drawn 1,200 gr/ft LSC before being imported into
AUTODYN® and the LSC 12 µs after detonation.
Table 1. Material properties of the simulation model template [6].
Material Name–Copper (LSC) Material Name–1018 Steel (mild steel target)
Equation of State Tillotson Equation of State Linear
Reference density 8.90000E+00 (g/cm3) Reference density 7.87000E+00 (g/cm3)
Parameter A 1.39000E+08 (kPa) Bulk Modulus 1.40000E+08 (kPa)
Parameter B 1.10000E+08 (kPa) Reference Temperature 2.93000E+02 (K)
Parameter a 5.00000E−01 (none) Specific Heat 4.86000E+02 (J/kgK)
Parameter b 1.50000E+00 (none) Thermal Conductivity 5.19000E+01 (J/mKs)
Parameter alpha 5.00000E+00 (none) Strength Johnson Cook
Parameter beta 5.00000E+00 (none) Shear Modulus 8.00000E+07 (kPa)
Parameter e0 3.25000E+07 (J/kg) Yield Stress 2.20000E+05 (kPa)
Parameter es 1.38000E+06 (J/kg) Melting Temperature 1.72189E+03 (K)
Parameter esd 6.90000E+06 (J/kg) Ref. Strain Rate (/s) 1.00000E+00 (none)
Reference Temperature 3.00000E+02 (K) Strain Rate Correction 1st Order
Specific Heat 3.83000E+02 (J/kgK) Erosion Geometric Strain
Thermal Conductivity 0.00000E+00 (J/mKs) Erosion Strain 7.50000E−01 (none)
Type of Geometric Strain Instantaneous
Material Name–HMX (explosives)
Equation of State JWL
Reference density 1.89100E+00 (g/cm3)
Parameter A 7.78280E+08 (kPa)
Parameter B 7.07140E+06 (kPa)
Parameter R1 4.20000E+00 (none)
Parameter R2 1.00000E+00 (none)
Parameter W 3.00000E−01 (none)
C-J Detonation velocity 9.11000E+03 (m/s)
C-J Energy/unit volume 1.05000E+07 (kJ/m3)
C-J Pressure 4.20000E+07 (kPa)
Auto-convert to Ideal Gas Yes
Figure 1. 1,200 gr/ft. Linear Shaped Charge (LSC) drawn before being imported into
AUTODYN®, LSC detonation at OSD 12 µs after detonation from left to right.
Appl. Sci. 2012, 2 632
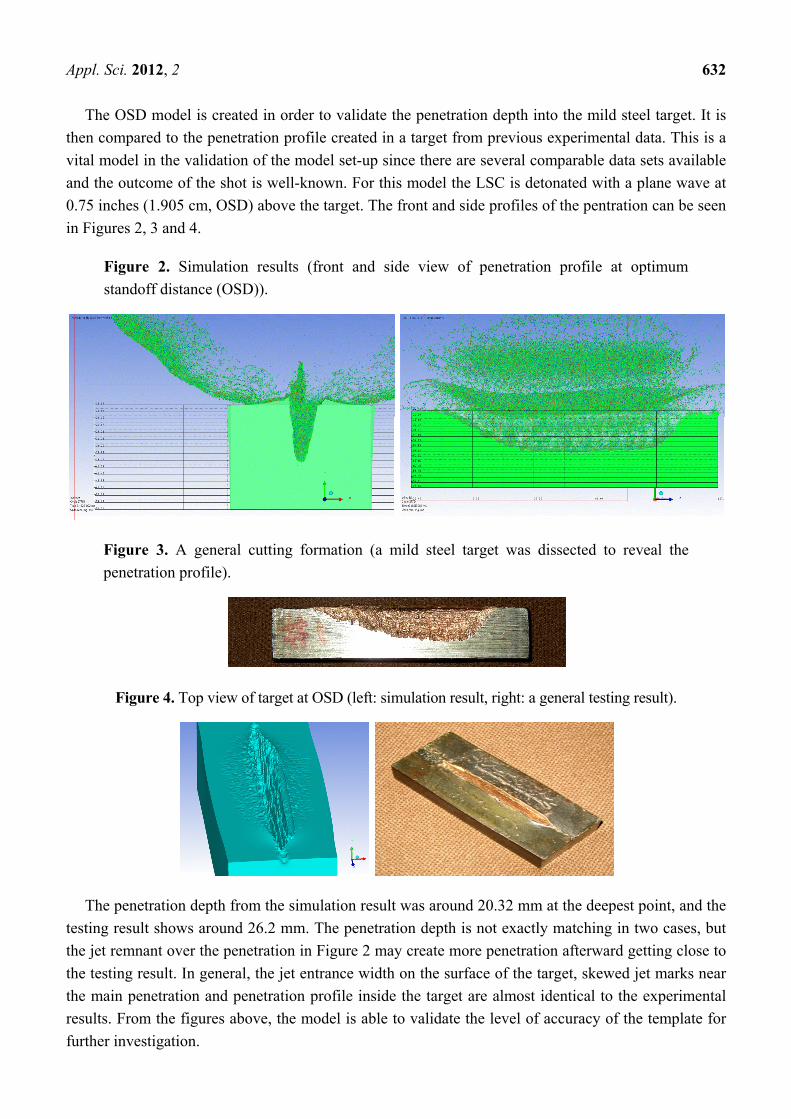
The OSD model is created in order to validate the penetration depth into the mild steel target. It is
then compared to the penetration profile created in a target from previous experimental data. This is a
vital model in the validation of the model set-up since there are several comparable data sets available
and the outcome of the shot is well-known. For this model the LSC is detonated with a plane wave at
0.75 inches (1.905 cm, OSD) above the target. The front and side profiles of the pentration can be seen
in Figures 2, 3 and 4.
Figure 2. Simulation results (front and side view of penetration profile at optimum
standoff distance (OSD)).
Figure 3. A general cutting formation (a mild steel target was dissected to reveal the
penetration profile).
Figure 4. Top view of target at OSD (left: simulation result, right: a general testing result).
The penetration depth from the simulation result was around 20.32 mm at the deepest point, and the
testing result shows around 26.2 mm. The penetration depth is not exactly matching in two cases, but
the jet remnant over the penetration in Figure 2 may create more penetration afterward getting close to
the testing result. In general, the jet entrance width on the surface of the target, skewed jet marks near
the main penetration and penetration profile inside the target are almost identical to the experimental
results. From the figures above, the model is able to validate the level of accuracy of the template for
further investigation.

Appl. Sci. 2012, 2 633
3. Numerical Modeling II
Another important model created is the simulation of a LSC being shot without a target below. The
model ran long enough for the tip of the jet to travel 12 inches (30.48 cm). The main purpose of this
model is to simulate and analyze the jet break-up process over the surface of target when the LSC is
subjected to large standoff distances. Because the large standoff distance in the operation of LSCs
would significantly reduce the focusing of the elongated jet, the study of the jet behavior during the
flight to the target is an important issue providing the essential information in determination of the
effective standoff distance or optimum jet properties. A free shot LSC is simulated using the
previously built template model of the 1,200 gr/ft LSC. Figures 5–7 show the jet after traveling 3, 6,
and 12 inches (7.62, 15.24, 30.48 cm respectively). Two figures at each distance show the front and
isometric views of the jet. The target is placed at the appropriate distance below the base of the LSC as
a reference.
Figure 5. Front and isometric view after jet traveling 3 inches (7.63 cm).
Figure 6. Front and isometric view after jet traveling 6 inches (15.24 cm).

Appl. Sci. 2012, 2 634
Figure 7. Front and isometric view after jet traveling 12 inches (30.48 cm).
Due to the extended model run time, a complete penetration profile is not able to be obtained for
each of the four models. Instead, an analysis method is devised that consists of looking at the change in
penetration into the target every microsecond over a 24 µs period. The zero time is considered to be
when a part of the jet initially makes contact with the target. The penetration profile is then analyzed at
every microsecond afterward for 24 µs to determine the penetration efficiency at the given standoff
distance. Penetration profiles are analyzed for 0.75, 3, 6, and 12 inches (1.905, 7.62, 15.24, 30.48 cm
respectively) standoff distances. The penetration into the target created by the jets formed by the
different standoff distances can be seen in Figure 8. The points are recorded from the deepest point of
penetration into the target viewed from a side penetration profile such as in Figure 2.
Figure 8. Penetration effectiveness at different standoff distances.
This graph illustrates the penetration of the LSC jet into the mild steel target over a period of
24 µs after the initial contact between the jet and the target. As shown, the penetration into the target
decreases significantly as standoff distance increases. This is due to two different reasons. Firstly,
break-up of the jet during the flight shortens the solid length of jet as it travels across the increased
distance. This effect is one of the dominant factors that control the penetration capability in shaped
Appl. Sci. 2012, 2 635
charges. The second reason for such penetration reduction is the jet spreading over a wide area during
flight as shown in Figures 5–7. This effect of the jet spreading is not significant in the application of
CSCs due to the single axis of jet production during the liner collapse. LSCs, however, are under the
linear jet (two dimensional) focusing regime due to the linearly long shape during the liner collapse
creating a less coherent jet. This mechanism acts as a drive of the jet spreading over a wide range at
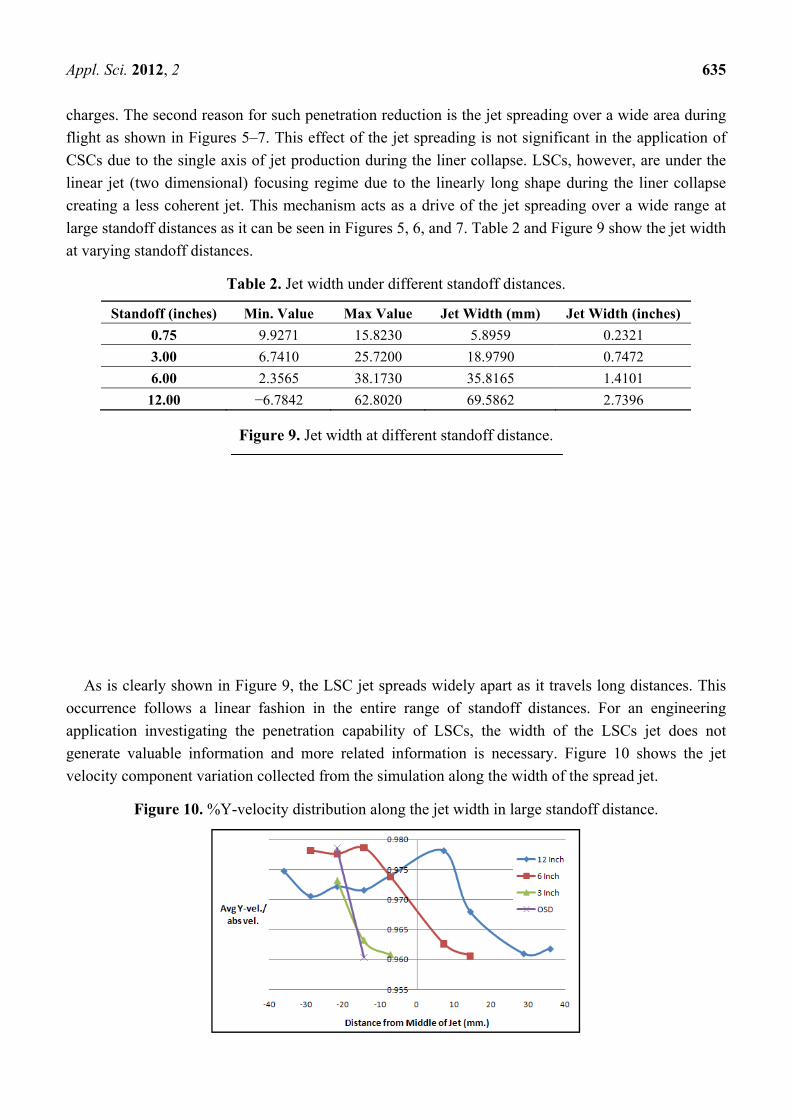
large standoff distances as it can be seen in Figures 5, 6, and 7. Table 2 and Figure 9 show the jet width
at varying standoff distances.
Table 2. Jet width under different standoff distances.
Standoff (inches) Min. Value Max Value Jet Width (mm) Jet Width (inches)
0.75 9.9271 15.8230 5.8959 0.2321
3.00 6.7410 25.7200 18.9790 0.7472
6.00 2.3565 38.1730 35.8165 1.4101
12.00 −6.7842 62.8020 69.5862 2.7396
Figure 9. Jet width at different standoff distance.
As is clearly shown in Figure 9, the LSC jet spreads widely apart as it travels long distances. This
occurrence follows a linear fashion in the entire range of standoff distances. For an engineering
application investigating the penetration capability of LSCs, the width of the LSCs jet does not
generate valuable information and more related information is necessary. Figure 10 shows the jet
velocity component variation collected from the simulation along the width of the spread jet.
Figure 10. %Y-velocity distribution along the jet width in large standoff distance.

Appl. Sci. 2012, 2 636
The x-direction of the jet (cross-sectional) is split into 10 pieces each approximately 7.2 mm in
width as seen in Figure 11. The x-axis in the jet runs from −36 mm to 36 mm in order to compensate
for the large jet width at the 12 inches (30.48 cm) standoff distance. In order for a fair comparison for
each standoff distance, this is kept throughout even though the jet width is much narrower at the
shorter standoff distances. The y-axis shows the bottom 2 inches (50.8 mm) of the jet. This is also
consistent with all of the models except the optimum standoff model. In this case, because the jet has
not moved 2 inches (50.8 mm), the y-axis is set for the bottom 0.75 inches (19.05 mm). Note that the
y-axis is not important for the analysis. It is merely to help illustrate the bottom 2 inches (50.8 cm) of
the jet to put in perspective the concentration of the jet from model to model.
Figure 11. Cross sectional area of the jet split into 10 separate pieces for analysis.
In each section, particles in the x-axis are picked at random. The magnitude of the y-velocity is then
divided by the absolute velocity (Figure 10). By dividing the magnitude of the y-velocity by the
absolute velocity, the fractional component of the absolute velocity that was the y-velocity is found.
Five particles are picked, the percentage of the absolute velocity that is the y-velocity is recorded, and
these numbers are averaged to show an average percentage for each section. The graph shows the
average percentage on the y-axis and the distance from the center of the jet on the x-axis (Figure 10).
Note that the ‘center’ is only really the center of the jet for the 12 inches (30.48 cm) standoff distance.
The axes are kept unchanged for consistency in comparing the models. Due to the fact that in all of the
graphs there is at least one section that has zero particles in it, these data points are left out since it
would skew the graph. This also helps illustrate the jet width as the standoff increases. As the graph
shows, the shorter the standoff distance becomes the more narrow the jet becomes. This is illustrated
with the optimum standoff model only having two useful data points whereas the 12 inches (30.48 cm)
standoff model has 9 useful data points.
Due to the jet spreading during the flight at large standoff distances, the center of the jet offsets
from the true center of the LSC (or jet width). However, the graph is able to illustrate the center of the
jet width by the peak point of each curve (i.e., the center or mid-point of the jet width in 12 inches
(30.48 cm) standoff distance curve is located near +8 mm). The reason for the jet spreading during the
flight in the simulation is not clearly known at this point. However, it is believed that the local
unbalanced cell configurations in between the left and right wing of LSCs in the SPH model generates
a miniscule time mismatch during the liner collapse, which separates the jet. In reality, this happens

Appl. Sci. 2012, 2 637
quite often due to the low level of manufacturing precision and the multi-dimensional axis of the jet
formation as we described earlier.
In general, the entire curve shows a similar trend of the peak y-velocity (vertical jet velocity) ratio
near the center of the jet width and low y-velocity ratio near the edge of the jet width. This means the
downward jet velocity toward the target is larger near the center of the jet width and the other velocity
components are larger near the edge of the jet width. This is a reasonable and expected result and is
one of the main contributing factors to the limited cutting performances at larger standoff distances.
Another investigation is done to understand the cutting performances of LSC jets at different
standoff distances as follows. In this analysis, the penetration profiles are revealed to show the effect at
large standoff distance. Figures 12–14 show the penetration profiles created and a detailed description
follows each figure.
Figure 12. The penetration profile can be seen on the top of the target and in a cross
section of the target at the optimum standoff distance (1.905 cm) after 15 µs (left and right
pictures respectively).
Figure 13. The penetration profile can be seen on the top of the target and in a cross
section of the target at a 3 inches (7.62 cm) standoff distance after 15 µs (top left and top
right pictures respectively). The bottom picture above shows the jet spreading due to the
distance traveled by the jet.

Appl. Sci. 2012, 2 638
Figure 13. Cont.
Figure 14. The penetration profile can be seen on the top of the target and in a cross
section of the target at a 6 inches (15.24 cm) standoff distance after 15 µs (top left and top
right pictures respectively). The bottom picture above shows the jet spreading due to the
distance traveled by the jet.
As seen in Figure 12, the LSC placed at the OSD clearly shows the maximum penetration
capability. There is no significant spreading of the jet over the penetration surface and the target shows
a clean cut.
Figure 13 shows a reduction in penetration depth due to the 3 inches (7.72 cm) travel distance.
A portion of the jet particles are skewed to the right side and a large jet entrance compared to the OSD
models shows a reduction in the penetration depth.

Appl. Sci. 2012, 2 639
There is significant reduction in penetration depth and wide spreading of the jet during impact
shown in Figure 14. There is minimum effective penetration and several large indentations are left
after the jet impact. This results in poor penetration.
There is no penetration at the 12 inches (30.48 cm) standoff distance but numerous small
indentations as seen in Figure 15. The LSC jet spread too much resulting in no effective penetration to
the target.
Figure 15. The penetration profile can be seen on the top of the target and in a cross
section of the target at a 12 inches (30.48 cm) standoff distance after 15 µs (top left and top
right pictures respectively). The bottom picture above shows the jet spreading due to the
distance traveled by the jet.
In general, we are able to understand the penetration capability under different standoff distances
based on the visual investigation of the penetration profile. It is concluded that any effective
penetration only occurs below the 3 inches (7.62 cm) standoff distance.
4. Conclusion and Discussion
This series of numerical models and analysis proved useful in investigating general jet flight
information of LSCs. These models are compared to targets from previous test shots in order to
validate both the model set-up and results. Using the validated models, the relationship between
penetration performance, jet width, jet velocity components and standoff distance are analyzed. The
velocity components of the jet are directly related to the jet width in that the jet particles closer to the

Appl. Sci. 2012, 2 640
center of the jet show a higher percentage of downward velocity toward the target. Near the edges of
the jet, the downward velocity percentage of the absolute velocity decreases causing the jet to
particulate and spread out. The penetration performance is directly related to this phenomenon as is
discussed in the literature. It is concluded that effective penetration becomes minimal above a standoff
distance of 3 inches (7.62 cm). Though some penetration can still be seen at the 6 inches (15.24 cm)
standoff distance, the jet width is too great at that height to effectively cut through a target.
As this is a preliminary study, the results are not intended to provide definitive data but rather to
investigate general trends for the development of future work. A more in-depth study of this jet
formation pattern during flight would generate an advanced understanding of the damage propagation
caused by a shaped charge jet impact.
Acknowledgments
The research reported herein was conducted with research funding from the Office of Naval
Research (ONR). The permission from ONR, Department Head of Expeditionary Maneuver Warfare &
Combating Terrorism, and Thrust Manager of Fires, to publish this paper is gratefully acknowledged.
References
1. Birkhoff, G.; Macdougall, D.P.; Pugh, E.M.; Taylor, G. Explosives with lined cavities. J. Appl. Phys. 1948, 19, 563–582.
2. Robinson, A.C. LESCA—A code for linear shaped charge analysis. Technical Report No. UC-742; OSTI: Albuquerque, NM, USA, 1991.
3. Walters, W.P.; Zukas, J.A. Fundamentals of Shaped Charges; CMC Press: Baltimore, MD, USA, 1989. 4. Lim, S. Steady state equation of motion of a linear shaped charges liner. Int. J. Impact Eng. 2012,
44, 10–16. 5. Lim, S. Steady state analytical equation of motion of linear shaped charges jet based on the
modification of Birkhoff theory. Appl. Sci. 2012, 2, 35–45. 6. Century Dynamics. AUTODYN Theory Manual, Revision 4.3; Century Dynamics Inc.: Concord,
CA, USA, 2005.
© 2012 by the authors; licensee MDPI, Basel, Switzerland. This article is an open access article
distributed under the terms and conditions of the Creative Commons Attribution license
(http://creativecommons.org/licenses/by/3.0/).