Embed Size (px)
Citation preview
Nordic Iron Ore SwedenMaterials
Commissioned Equity Research • 11 January 2019
KEY DATA
SwedenStock country0612616D SSBloomberg
NIO.STReutersSEK 3.66 Share price (close)
Free FloatEUR 0.01/SEK 0.07Market cap. (bn)
www.nordicironore.seWebsite01 Feb 2019Next report date
PERFORMANCE
Oct18 Nov18 Dec18 Jan19
3
4
5
Nordic Iron Ore
Sweden OMX Stockholm All-Share (Rebased)
Source: Thomson Reuters
VALUATION APPROACH
1.0 3.0 5.0 7.0
Valuation SEK 3.2 SEK 6.8
Source: Nordea estimates
ESTIMATE CHANGES
2020E2019E2018EYearn.a.n.a.n.a.Salesn.a.n.a.n.a.EBIT (adj)
Source: Nordea estimates
Preparing for the next chapter
Nordic Iron Ore (NIO) is a junior mining and exploration company striving to produce a high-grade product with an average Fe grade of 69%. We estimate that NIO's Blötberget property will be able to produce ~17 million tonnes of concentrate and generate revenue of SEK 13bn during the life-of-mine.
All necessary concessions and permits in placeNIO has all exploitation concessions and permits needed to set up a producing mine. The key exploitation concession for the Blötberget property was granted in 2011 and runs for 25 years, enabling NIO to move forward with its mining project and to start construction. The only thing still pending is a feasibility study, which we expect to be completed in 2019.
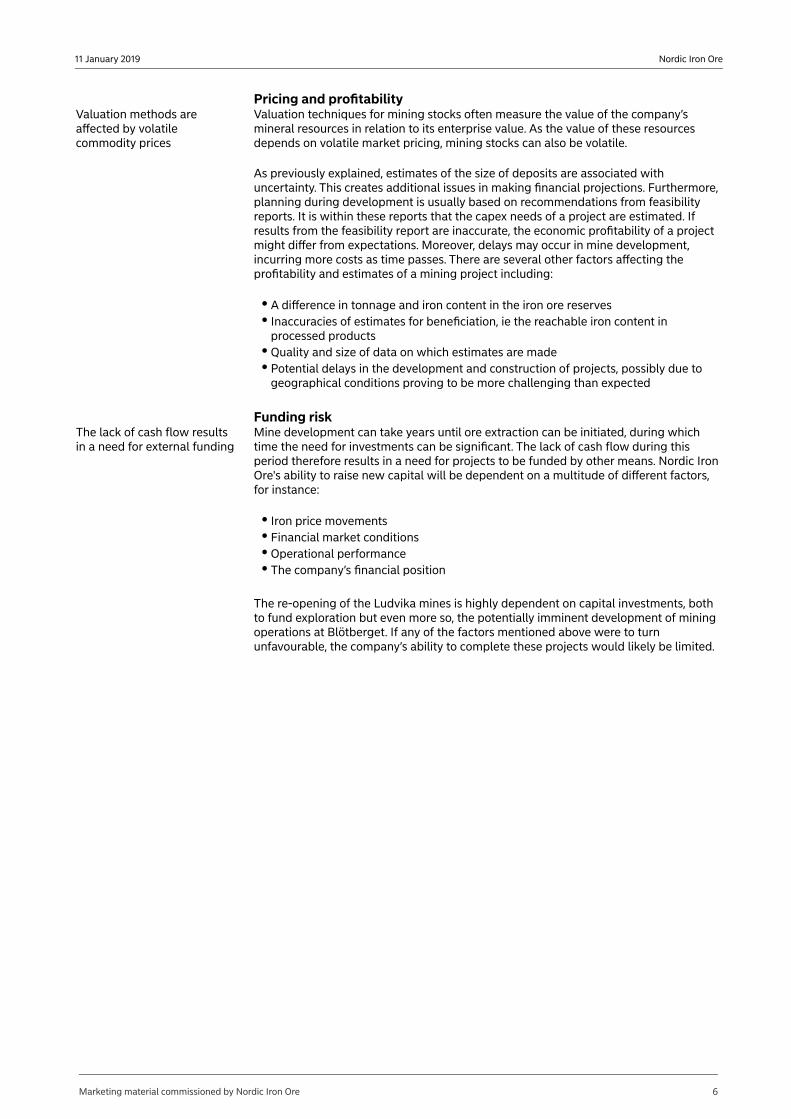
Structural demand for high-grade iron oreNIO is striving to produce a high-grade iron ore concentrate with an average Fe grade of 69%. The premium for high-grade iron ore has existed for several years and has been trending upwards since 2014, partly owing to increased demand for the product, mainly from China, as high-grade iron ore has less of a negative environmental impact.
Close proximity to a deepwater portOne prerequisite for a mine to function efficiently is that proper infrastructure for transportation of the product is secured. In the case of NIO, the Ludvika mines are strategically located in central Sweden with existing infrastructure in relatively close proximity to several ports in Gävle, Oxelösund, Uddevalla and Lysekil. In addition, NIO has signed a letter of intent with the Austrian logistics company Cargo Austria AG (a subsidiary of ÖBB) for future transportation of iron ore products to the deepwater port located in Oxelösund.
Valuation indicates a fair value range of SEK 3.2-6.8We use a sum-of-the-parts valuation combined with a sensitivity analysis to derive an equity value per share of SEK 3.2-6.8 for Nordic Iron Ore. We value the Blötberget property at SEK 0.5bn, applying a DCF-based valuation approach. Adding our valuation for the Håksberg and Väsman properties, we arrive at a total risk-adjusted value of SEK 0.7bn. In addition, we assume that Blötberget will be financed using 75% equity and 25% debt. Including new equity, we derive a fair equity value range of SEK 3.2 to 6.8 per share. Our sensitivity analysis shows that a USD 1 change in the underlying iron ore price affects the equity value by SEK 0.2 per share.
Nordea Markets - AnalystsChristian KopferSenior Analyst, Sector Coordinator
Carl RagnerstamAnalyst
SUMMARY TABLE - KEY FIGURES
2020E2019E2018E2017201620152014SEKm000n.a.n.a.n.a.n.a.Total revenue
-18-15-9-9-8-7-6EBITDA (adj)-18-15-9-9-8-7-11EBIT (adj)
n.m.n.m.n.m.n.a.n.a.n.a.n.a.EBIT (adj) margin-0.05-0.04-0.54n.a.n.a.n.a.n.a.EPS (adj)
-40.7%93.4%n.a.n.a.n.a.n.a.n.a.EPS (adj) growth0.000.000.000.000.000.000.00DPS (ord)n.m.n.m.n.m.n.a.n.a.n.a.n.a.EV/Salesn.m.n.m.n.m.n.a.n.a.n.a.n.a.EV/EBIT (adj)n.m.n.m.n.m.n.a.n.a.n.a.n.a.P/E (adj)1.11.00.7n.a.n.a.n.a.n.a.P/BV
0.0%0.0%0.0%n.a.n.a.n.a.n.a.Dividend yield (ord)-61.0%-38.3%-54.9%n.a.n.a.n.a.n.a.FCF Yield bef acq & disp
158-82535-213-13-20Net debt-8.754.6-3.90.3-1.71.83.2Net debt/EBITDA
-1.5%-3.5%-7.7%-8.4%-7.1%-7.4%-13.8%ROIC after taxSource: Company data and Nordea estimates
Marketing material commissioned by Nordic Iron Ore

Nordic Iron Ore11 January 2019
Contents
Factors to consider when investing in Nordic Iron Ore 3
Risks 5
Valuation 7
Company overview 12
The lifecycle of a mine 19
Executive management 22
Board of directors 23
Shareholders 24
Market outlook 25
Estimates 31
Historical performance 36
Sustainability 40
Peers 43
Reported numbers and forecasts 45
Disclaimer and legal disclosures 48
Marketing material commissioned by Nordic Iron Ore 2

Nordic Iron Ore11 January 2019
Factors to consider when investing in Nordic Iron OreWhile Nordic Iron Ore (NIO) is still a junior mining company which has yet to initiate production of iron ore, several factors make the company interesting. In particular, we find that the geographical location of the Blötberget project and the significant existing infrastructure will limit operating expenses. Moreover, all the necessary permits to initiate production have been secured and operations could be started as early as in 2022. However, as with other junior mining companies, there are several risks to consider, perhaps the most significant of which relates to liquidity.
All mining concessions and permits in placeThere are many permits needed for mining activities regarding prospecting, as well as others such as environmental and building permits, all of which need to be secured before construction and mining/exploration can begin. Each permit has different requirements that need to be fulfilled. At present, NIO has all the necessary permits in place for the initial project in Blötberget and should be able to produce iron ore of verified high quality.
NIO's exploitation concession at Blötberget runs for 25 years
NIO's application for a mining licence for the Blötberget area was granted in 2011. The mining concession runs for 25 years with the possibility of being extended. This means the company has secured a very important part, enabling it to proceed towards initiating mining and production. There is still a final feasibility study in progress, however, which the company expects to be completed in early 2019. We base our forecasts on mining operations being initiated in 2022.
Previously active mine brings infrastructureInfrastructure from previous mining operations in place
All concessions besides those covered by the Väsman field, and parts of Håksberg, are so-called 'brownfields', which means that extraction has previously taken place. This means there is already infrastructure in place, such as drilled shafts underground. While the installations above ground will not be used, the substantial historical documentation and the infrastructure are of importance for the resumption of prospecting at Blötberget. Consequently, lower capital investments will be needed in order to initiate construction of the mines. Moreover, the previously drilled shafts will assist the company in beginning extraction earlier than would otherwise be viable.
Premium-quality concentrate yields a higher priceHigh-grade iron ore reduces cost in steelworks and coal consumption in the steel production process
High-grade iron ore is generally sold at a premium to lower-grade ore, which stems from the fact that high-grade iron ore can help production costs in steelworks production processes, and coal used in steel plants declines due to less fuel being used to melt non-ferrous minerals. Moreover, high-grade iron ore also has environmental advantages over low-grade iron, in terms of reducing carbon dioxide and other emissions. Even though the future price level of iron ore is uncertain, particularly for low-grade iron ore, the factors mentioned above could favour high-grade iron such as the 69% concentrate that NIO plans to produce.
Attractive geographical locationA favourable location is imperative for having cost-effective mining activities, as location determines the cost of transport, and the availability of the necessary infrastructure, such as water, railways, electricity and roads. Moreover, proximity to other general services, for example housing, telecommunications, medical care and schooling, is important for the company and its employees.
Nordic Iron Ore’s mine operations will take place close to the town of Ludvika, which will provide access to these infrastructural resources, essential for the process of mining and transporting iron ore products. As such, we believe this will limit the company's capex needs outside the core mining activities, adding to the future cash flow potential.
Marketing material commissioned by Nordic Iron Ore 3

Nordic Iron Ore11 January 2019
Letter of intent signed with a logistics company
Since the company intends to sell its products internationally, links to rail transportation are essential. Hence, it is positive that Nordic Iron Ore has signed a letter of intent with Rail Cargo for transportation from the beneficiation plant to Oxelösund. Moreover, the proximity of the railways connected to Ludvika will provide it with viable options for different routes, as shown below.
LUDVIKA MINES' INFRASTRUCTURE
Source: Company data and Nordea
Production set to initiate in 2022Blötberget will be able to produce 2.7 Mt of iron ore and 1.3 Mt of concentrate per year, on average, until 2034
We base our estimates on the Blötberget project. We forecast that Blötberget will be able to produce 2.7 million tonnes (Mt) of iron ore and 1.3 Mt of concentrate per year, on average, until 2034, when we expect closure and a natural fade. This implies total revenue for the mines of USD ~1.5bn or ~SEK 14bn (at a USD/SEK rate of 9.0), based on production of 17 Mt of concentrate, at a real price of USD 80 per tonne. We further estimate that NIO's revenue will ramp up during the first two years of the mine until 2024 and peak around 2030. Further, we forecast accumulative free cash flows over the mine's lifetime of approximately SEK 2.9bn. However, we forecast a total capital need of SEK 2bn until first ore, of which we believe NIO should be able to finance SEK 0.5bn (25%) through debt and SEK 1.5bn (75%) through raising equity.
Marketing material commissioned by Nordic Iron Ore 4

Nordic Iron Ore11 January 2019
RisksThe mining industry is characterised by high volatility and operational as well as market-driven risks. Pre-revenue mining stocks such as Nordic Iron Ore offer potential for considerable profitbut are often associated with high risk. Moreover, exploration and prospecting do not guarantee results, while they demand substantial amounts of invested capital. Some of the most important risks are highlighted below.
Price volatility of commoditiesAs iron contracts are decided quarterly, price volatility can have a direct impact on revenue potential
Commodities are known as one of the more volatile asset classes, where prices can differ substantially from day to day and quarter to quarter. As iron contracts are decided quarterly in accordance with spot prices, short-term shifts in iron prices will directly impact the revenue Nordic Iron Ore can generate from potential deposits. There are numerous factors as to why there is volatility in commodity prices, which includes but are not limited to:
The economic cycle and the effect it has on economic activity, predominantly in major industrialised and industrialising countriesIncreasing supply from production, disinvestment and scrapSpeculative positions taken by investorsIncreased or decreased taxes, tariffs and other regulationAvailability of substitute materials
The price of iron ore has fluctuated considerably during the past five-year period. The average volatility during this time amounts to 23% but peaked at 35% due to decreased demand for steel in Asia. As the final product for iron is steel – which is heavily used in construction and building – prices have a strong correlation with economic cycles. During downturns, iron ore pricing could be affected more than other metal commodities.
Exploration risksSuccess in exploration and prospecting is certainly not guaranteed
Exploration and prospecting for natural resources are activities associated with high uncertainty. While costs in this stage can be profound, success is certainly not guaranteed and there is a risk that no economically minable resources, or only small amounts, are identified. As Nordic Iron Ore is a junior mining company, it has not yet started extracting minerals and is still in the process of exploring and prospecting, making it vulnerable to these risks.
While Blötberget and Håksberg are so-called brownfield sites, meaning there has been previous exploration in the area, the Väsman field is unexplored, decreasing the reliability of measured, indicated and inferred mineral assets in comparison, resulting in no guarantee that the underlying assets conform to the estimates provided from exploration. Nordic Iron Ore therefore needs to explore further to provide more accurate estimates.
Risks related to mineral estimatesMine development is partly dependent on accurate estimates
Estimates of mineral reserves are one of the main factors used as the basis for planning mining operations. For instance, feasibility studies are used to assess the need for capital and costs for initiating operations, based on estimates. Therefore, mine development is, to a certain degree, dependent on them being accurate.
As estimates are based on probabilistic analysis of relatively small data samples collected from drill holes, they are subject to ample uncertainty. Subsequently, there is a risk that the measured, indicated or inferred iron ore partly or entirely does not exist, is not economically minable, or is in other ways not as valuable as previously thought. For Nordic Iron Ore, this risk is somewhat mitigated by the fact that mineral extraction has previously taken place at Blötberget and Håksberg, as it proves the historical existence of economically minable iron in the fields.
Marketing material commissioned by Nordic Iron Ore 5
Nordic Iron Ore11 January 2019
Pricing and profitabilityValuation methods are affected by volatile commodity prices
Valuation techniques for mining stocks often measure the value of the company’s mineral resources in relation to its enterprise value. As the value of these resources depends on volatile market pricing, mining stocks can also be volatile.
As previously explained, estimates of the size of deposits are associated with uncertainty. This creates additional issues in making financial projections. Furthermore, planning during development is usually based on recommendations from feasibility reports. It is within these reports that the capex needs of a project are estimated. If results from the feasibility report are inaccurate, the economic profitability of a project might differ from expectations. Moreover, delays may occur in mine development, incurring more costs as time passes. There are several other factors affecting the profitability and estimates of a mining project including:
A difference in tonnage and iron content in the iron ore reservesInaccuracies of estimates for beneficiation, ie the reachable iron content in processed productsQuality and size of data on which estimates are madePotential delays in the development and construction of projects, possibly due to geographical conditions proving to be more challenging than expected
Funding riskThe lack of cash flow results in a need for external funding
Mine development can take years until ore extraction can be initiated, during which time the need for investments can be significant. The lack of cash flow during this period therefore results in a need for projects to be funded by other means. Nordic Iron Ore's ability to raise new capital will be dependent on a multitude of different factors, for instance:
Iron price movementsFinancial market conditionsOperational performanceThe company’s financial position
The re-opening of the Ludvika mines is highly dependent on capital investments, both to fund exploration but even more so, the potentially imminent development of mining operations at Blötberget. If any of the factors mentioned above were to turn unfavourable, the company’s ability to complete these projects would likely be limited.
Marketing material commissioned by Nordic Iron Ore 6

Nordic Iron Ore11 January 2019
ValuationWe use a sum-of-the-parts valuation combined with a sensitivity analysis to derive an equity value per share of SEK 3.2-6.8 for Nordic Iron Ore. We value the Blötberget property at SEK 0.5bn applying a DCF-based valuation approach. Adding our valuation for the Håksberg and Väsman properties, we arrive at a total risk-adjusted value of SEK 0.7bn. In addition, we are assuming that Blötberget will be financed through 75% equity and 25% debt. Including new equity, we derive a fair equity value range of SEK 3.2 to 6.8 per share. Our sensitivity analysis shows that a USD 1 change in the underlying iron ore price impacts the equity value by SEK 0.2 per share.
We estimate NIO's equity value range at SEK 3.2-6.8 per share
Given the phase that NIO is in at the Blötberget property and that a feasibility study into constructing a producing mine is in the final stages, we find a DCF-based valuation approach the most appropriate method for Blötberget.
Based on our earnings outlook in combination with a WACC of 10%, we arrive at a base-case value of SEK 0.5bn for Blötberget, equal to approximately USD 3 per tonne of M&I and Inferred resources. We believe it is fair to apply this resource multiple to the Håksberg and Väsman properties with a risk weight of 50% and arrive at approximately SEK 0.2bn for these assets.
Given our assumption that 75% of the future capital required will be financed through equity and 25% through debt, we arrive at a fair equity value range of SEK 3.2-6.8.
EQUITY FAIR VALUE RANGE PER SHARE, SEK
0.0 2.0 4.0 6.0 8.0
Valuation SEK 3.2 SEK 6.8
Source: Company data and Nordea estimates
Income or cash flow-based methodIncome or cash flow-based valuation approaches are widely used for mineral development properties such as NIO's; properties where a mineral resource has been identified via a pre-feasibility or feasibility study but is not yet financed or under construction. Such projects could typically be on a site where a previous production mine has been operating, as is the case for NIO.
DCF valuation of Blötberget DCF is one of the most common ways to value a business
A common way of valuing a business is by using a discounted cash flow analysis (DCF). The core of the DCF analysis is to discount free cash flows at the weighted cost of capital (WACC) to arrive at their present value. The WACC takes into account the equity and debt investors of a company and is therefore dependent on the capital structure of a company.
Marketing material commissioned by Nordic Iron Ore 7

Nordic Iron Ore11 January 2019
One of the main benefits of a DCF is that it offers a structured way to arrive at the intrinsic value of a business. The DCF can be broken down into three different steps: 1) discount a company's free cash flow at WACC to derive the company's total EV; 2) identify which parts of the total EV relate to debt holders and non-equity claims; and 3) deduct all components that are not related to the equity holders' claim to derive the equity value for the company. Once the total equity value of the company has been calculated, the share price can be computed by dividing the total equity value by the total number of the company's outstanding shares.
OPEX 2022-34, USD PER TONNE
Mining 22.2
Processing 6.5Railway 9.2Port handling 6.5Other 4.7G&A 4.0Total 53.2
Source: Company data and Nordea estimates
Our DCF valuation is based on Blötberget being able to produce roughly 35 million tonnes (Mt) of iron ore and 17 Mt of high-grade concentrate during the life-of-mine, implying an average process weight recovery of 47% during the run-of-mine and yielding total revenue of approximately SEK 13.7bn.
Operating costs mainly relate to mining operations, accounting for 37% of total operating costs. We estimate this to increase by 2% per year during the run-of-mine. We estimate the capex needed to set up the mine at USD 200m in initial capex and around USD 30m in sustaining capex during the mine's lifecycle.
WACC BREAKDOWN
Equity 75%
Debt 25%Tax rate 22%Cost of equtity 8.8%After tax cost of debt 5.5%Small cap premium 2.0%WACC 10.0%
Source: Company data and Nordea estimates
Given a cost of equity of 8.8%, a cost of debt of 5.5%, and a small cap risk premium of 2.0%, we estimate a WACC of 10% based on 75% equity and 25% debt financing.
The accumulated free cash flow (FCF) over the mine's estimated 13 years of operations totals roughly SEK 3bn, to which we apply our calculated WACC and calculate an NPV for Blötberget of SEK 0.5bn. This corresponds to an IRR of just shy of 15% and an EV/resources multiple of approximately USD 3 per tonne of M&I and Inferred resources.
DCF BREAKDOWN FOR BLÖTBERGET
Product prices (USD/t)
62% delivered to China, Qingdao 79.2 WACC 10%Premium per % for 65% vs 62% 5.7 Life-of-mine 13 years
69% delivered to China, Qingdao 110.9Premium per % for 69% vs 62% 4.5
Shipping costs (USD/t) 22.2
Net price FOB Oxelösund 88.7
Mined resources (Mt)Ore 34.7- Process weight recovery (%) 49%Concentrate (69%) 16.8
Accumalive numbers of expected life of mine, SEKmRevenues 13,669Opex -7,880EBITDA 5,788
Capex- Project capex 1,803- Sustaining capex 276
FCF 2,945
NPV 495- USDm 55- EV/Resource (SEK/t) 2.7
IRR (%) 14.6%
Source: Company data and Nordea estimates
Comparable transactions and relative valuationA comparable transactions approach is built on finding the value of a company's business by comparing M&A transactions and benchmarking them against one another. A relative valuation approach is similar to this, calculating specific multiples and benchmarking against peers, ie other businesses that are similar to the company being valued. Some common multiples used for mining companies are: EV/resources (USD/tonne of resources), EV/reserves (USD/tonne of reserves), EV/operating cash flow, EV/EBIT, EV/earnings and EV/NPV.
Marketing material commissioned by Nordic Iron Ore 8

Nordic Iron Ore11 January 2019
Relative valuation is easy to apply and makes it quick to find the equity value
One of the main benefits of this approach is that it can be easily applied, which makes it quick to arrive at the equity value. This is particularly the case for junior mining companies where limited information about resources is available, which can make it difficult to estimate future cash flows. However, there are also several negative aspects to this approach, such as it being difficult to find peers with similar mining projects or peers in the same phase of their mining projects as the company being valued. This might result in a subjective judgment when selecting peers that could result in an unfair value of the business.
Håksberg and Väsman valuation using EV/resourcesWe choose not to use a comparable transactions or relative valuation approach
In NIO's case, we choose not to use a comparable transactions or relative valuation approach as our primary valuation method, because the differences are too big between Håksberg/Väsman and other listed iron ore projects/resources.
We use an EV/resources multiple to value Håksberg and Väsman
Instead of a comparable transactions or relative valuation approach, we apply the calculated EV/resources multiple retrieved for Blötberget and apply it to the Håksberg and Väsman properties. We believe this is a fair valuation approach, as there should be meaningful synergies between Blötberget and Håksberg/Väsman, as a significant part of the Blötberget infrastructure, including the mill, could be used. These factors suggest that Håksberg/Väsman should enjoy a higher resource multiple. However, on the other hand, the capital required for these properties is more uncertain than for Blötberget.
Furthermore, we apply risk weights of 50% to both Håksberg and Väsman given the early stages at which these potential projects are. Finally, we apply discount factors of 0.6, which is driven by WACC of 10% compounded for five years, as we assume these properties potentially could be in production five years after Blötberget.
In all, this gives us a total EV of SEK 0.2bn for Håksberg/Väsman, equal to SEK 0.5 per share if we take into account the financing structure of 75% equity.
VALUATION SUMMARY FOR HÅKSBERG AND VÄSMAN
Contained Fe, M&I&I Discount factor EV Value per shareUSD/t Risk weight Mt SEKm SEK
Håksberg 3.1 50% 10.3 0.6 77 0.2Väsman 3.1 50% 19.7 0.6 147 0.3
Shares outstanding millions 442
EV/resource
Source: Company data and Nordea estimates
Sum-of-the-partsWe use a SOTP approach to value NIO's business
To arrive at the value of NIO's equity, which we use as a basis for our sensitivity analyses, we apply a SOTP approach to the values calculated for the Blötberget, Håksberg and Väsman properties. This results in an adjusted EV for Blötberget, Håksberg and Väsman of SEK 0.5bn, SEK 0.8bn and SEK 0.2bn, respectively.
We estimate that NIO's net cash position in 2019 will amount to approximately SEK 1.5bn, based on our forecast of 75% equity financing. At a share price of around SEK 3.50, that would imply the number of shares should increase to around 442 million by the end of 2019.
SOTP SUMMARY
DCF WACC Price Opex Capex NPV NPV IRR
(%) USD/t USD/t USD USD SEKm (%)Blötberget 10% 110.9 53.2 231 55 495 14.6%
Contained Fe, M&I&I Discount factor EV adj. Value per shareUSD/t Risk weight Mt SEKm SEK
Blötberget 2.7 100% 20.5 - 495 1.1Håksberg 2.7 50% 10.3 0.6 77 0.2Väsman 2.7 50% 19.7 0.6 147 0.3
Net cash 2019E (SEKm, SEK) 1,478 3.3Minorities (SEKm, SEK) 0.0 0.0Total Equity Value (SEKm, SEK/share) 2,197 5.0
Shares outstanding millions end-2019E 442
EV/resource
Source: Company data and Nordea estimates
Marketing material commissioned by Nordic Iron Ore 9

Nordic Iron Ore11 January 2019
We derive our value range for NIO's equity by looking at changes in the price premium for iron ore
Our first sensitivity analysis is based on changes in Blötberget's parameters of capex, opex and net product price of 69% iron ore, which are the key determinants for NIO's EV. The sensitivity analysis shows that the equity value varies materially, depending on the magnitude of the change in the respective parameter.
SHARE PRICE SENSITIVITY FOR BLÖTBERGET NET PRODUCT PRICE, OPEX AND CAPEX, USD PER TONNE, USD AND %
4.967750134 -10.0 -5.0 -1.0 0.0 1.0 5.0 10.0-3.0% 4.6 5.5 6.2 6.4 6.5 7.3 8.2-2.0% 4.1 5.0 5.7 5.9 6.1 6.8 7.7-1.0% 3.7 4.6 5.3 5.5 5.6 6.4 7.30.0% 3.2 4.1 4.8 5.0 5.1 5.9 6.81.0% 2.7 3.6 4.3 4.5 4.6 5.3 6.32.0% 2.2 3.0 3.7 3.9 4.1 4.8 5.73.0% 1.6 2.5 3.2 3.3 3.5 4.2 5.1
Net product price delta FOB Oxelösund (USD/t)
Opex and sustaining capex delta (%)
Source: Company data and Nordea estimates
Our second sensitivity analysis shows the sensitivity to changes in the assumed equity issue price along with changes in the cost of capital.
SHARE PRICE SENSITIVITY FOR BLÖTBERGET WACC AND RIGHTS ISSUE SHARE PRICE, SEK AND %
4.967750 11.5% 11.0% 10.5% 10.0% 9.5% 9.0% 8.5%6.4 7.6 8.0 8.4 8.8 9.2 9.6 10.15.4 6.5 6.8 7.1 7.5 7.8 8.2 8.64.4 5.4 5.6 5.9 6.2 6.5 6.8 7.13.5 4.3 4.5 4.7 5.0 5.2 5.5 5.72.4 3.0 3.2 3.3 3.5 3.6 3.8 4.01.4 1.8 1.9 1.9 2.0 2.1 2.2 2.40.4 0.5 0.5 0.6 0.6 0.6 0.7 0.7
WACC (%)
Rights issue share price (SEK)
Source: Company data and Nordea estimates
We consider our fair value range of SEK 3.2-6.8 to capture a meaningful amount of changes in sensitive parameters.
Peer groupBelow, we summarise information about NIO's peers and the company itself. In total, we use eight peers, all of which are pre-revenue junior miners looking to construct and develop iron ore producing mines. The peer group companies estimate their resources according to either the JORC framework, which is considered a global standard for estimating mineral resources, or National Instrument 43-101 (NI 43-101), a Canadian framework for resource estimation broadly comparable to JORC. In addition, similar to NIO, these peers all aim to produce a high grade of iron ore product.
PEER GROUP
Name Ticker Location Metal Product Framework Revenue 12M (LC)
Oceanic Iron Ore Corp. FEO CN EQUITY Canada Fe Fe 66.5% pellets NI 43-101 0Alderon Iron Ore Corp. IRON CN EQUITY Canada Fe Fe 65.2% concentrate NI 43-101 0Black Iron Inc. BKI CN EQUITY Canada/Ukraine Fe Fe 68% concentrate NI 43-101 0Kogi Iron Ltd. KFE AU EQUITY Australia/Nigeria Fe High grade fines JORC 2012 0Iron Road Ltd. IRD AU EQUITY Australia Fe Fe 67% concentrate JORC 2012 0Zanaga Iron Ore Ltd. ZIOC LN EQUITY Congo Fe Fe 68% pellet feed concentrate JORC 2012 0Flinders Mines Ltd. FND AU EQUITY Australia Fe Fe 58.5% fines JORC 2012 0Beowulf Mining Plc. BEM LN EQUITY Sweden Fe Fe 71% concentrate JORC 2012 0Nordic Iron Ore NIO SS EQUITY Sweden Fe Fe 69% concentrate JORC 2012 0
Source: Bloomberg, Thomson Reuters and Nordea
Most of the peers are domiciled in Canada or Australia
Most of the peers have their mining projects domiciled in either Canada or Australia, which is quite logical considering that, apart from South America, these two countries represent a large portion of the world's iron ore reserves. One peer, Beowulf Mining, has its mining project domiciled in Sweden and two, Kogi Iron and Zanaga Iron Ore, have mining projects in Africa.
Moreover, the market cap and EV of the peers are between USD 2m and USD 131m and USD 3m and USD 190m, respectively, compared with NIO's market cap and EV of USD 9m each. The contained Fe measured and indicated resources of the peers are 33-767 Mt compared with NIO's 48 Mt.
Marketing material commissioned by Nordic Iron Ore 10

Nordic Iron Ore11 January 2019
We compare and benchmark the peers using an EV/resources multiple, which we argue is the best one to use, as it takes into consideration the capital structure of the companies and the resources on which the mines' revenue and cash flow will depend.
Based on this approach, we derive a range for the EV/resources of USD 0.01-0.97 per tonne with an average of USD 0.22 per tonne and a median of USD 0.09 per tonne. We calculate NIO's multiple at USD 0.18 per tonne, implying it is trading at a discount of 18% to the average and a premium of 99% to the median. This also implies that NIO's multiple is trading in the higher percentile of the peer group, which could relate to its favourable geographical location. Looking at peers active in the same region as NIO, Beowulf (operations in northern Sweden) is also trading at a high multiple, an EV/resource of USD 0.97 per tonne. The lowest EV/resources for NIO's three different projects is Blötberget, at USD 0.14 per tonne and the highest is Väsman at USD 0.24 per tonne. The higher value for Blötberget should not come as a surprise, as it is there that NIO has the largest amount of measured and indicated iron ore resources, while Väsman has the least.
We use our calculated EV/resources multiples to benchmark against NIO
Given the geographical and resources spread, as well as the difference between the projects amongst peers and in comparison with NIO, we do not derive an equity value range based on a multiples or comparative transactions approach. Instead, we use it for benchmarking. We can conclude from this that NIO is trading at the upper end of the scale versus peers but lower in relation to those peers active in the same geographical region as NIO.
PEER GROUP'S EV/RESOURCES
0.0
0.2
0.4
0.6
0.8
1.0
1.2
OceanicIron Ore
AlderonIron Ore
Black Iron Kogi Iron Iron Road ZanagaIron Ore
FlindersMines
BeowulfMining
Nordic IronOre
EV/Resources Average Median
Source: Bloomberg, Thomson Reuters and Nordea estimates
PEER GROUP FUNDAMENTALS
Market Market EV EV EV/Resource
Name Currency Cap (LC) Cap (USDm) (LC) (USDm) M&I Inferred M&I Inferred Framework (USD/t)Oceanic Iron Ore Corp. CADm 3 2 4 3 446 72 86% 14% NI 43-101 0.01Alderon Iron Ore Corp. CADm 44 34 65 49 378 154 71% 29% NI 43-101 0.13Black Iron Inc. CADm 9 7 9 7 204 57 78% 22% NI 43-101 0.03Kogi Iron Ltd. AUDm 72 53 62 46 193 49 80% 20% JORC 2012 0.24Iron Road Ltd. AUDm 37 28 39 28 550 166 77% 23% JORC 2012 0.05Zanaga Iron Ore Ltd.* GBPm 31 40 29 37 767 326 70% 30% JORC 2012 0.05Flinders Mines Ltd. AUDm 177 131 258 190 636 168 79% 21% JORC 2012 0.30Beowulf Mining Plc. GBPm 27 35 25 32 33 9 79% 21% JORC 2012 0.97
Average 0.22Median 0.09
Nordic Iron Ore SEKm 80 9 79 9 48 21 70% 30% JORC 2012 0.18EV EV/Resource
Property breakdown (USDm) M&I Inferred (USD/t)Blötberget 3.1 22.4 4.3 0.14Håksberg 1.7 9.2 4.2 0.19Väsman 4.0 16.8 12.6 0.24Total 8.8 48.5 21.1 0.18
*resources adjusted 50% due to ownership structure
Contained Fe, Mt
Contained Fe, Mt Exposure (%)
Source: Bloomberg, Thomson Reuters and Nordea estimates
Marketing material commissioned by Nordic Iron Ore 11

Nordic Iron Ore11 January 2019
Company overviewNordic Iron Ore is an exploration company, founded in 2008 and listed on Nasdaq First North Stockholm in 2018. The company’s main target is to reopen two previously operated mines in the Ludvika municipality and start development of a third target. Currently in its first phase, the company is finishing a feasibility report for Blötberget, with intent to begin construction during 2020. Nordic Iron Ore's strategy is to prospect and develop high-quality iron ore products and to produce niche iron products in the form of concentrates with high iron content, which can subsequently be sold at a premium price.
Nordic Iron Ore AB (NIO) is a Sweden-based mining and prospecting company founded in 2008, listed on Nasdaq First North since October 2018. Its focus is on mine development with the intention to construct and start a producing mine of high-quality iron ore.
NIO's mission is to own iron ore deposits and to produce high-quality products
NIO's mission, on its own or together with partners, is to own iron ore deposits through concessions, develop them into mining operations and produce high-quality products with high iron content. Currently, it owns the rights to four exploitation concessions, all located in close proximity to each other in the Ludvika municipality, central Sweden.
CONCESSIONS AND PERMITS
Name Areal (ha) Minerals Valid from Valid to
Mining concessions
Blötbergsgruvan #1 126,4 Iron, lanthanum, lantanide, apa t 30/08/2011 30/08/2036
Blötbergsgruvan #2 38,7 Iron, lanthanum, scandium, apa t, y rium 14/08/2017 14/08/2042
Södra Väsmanfältet #1 115,4 Iron 20/12/2017 20/12/2042
Håksbergsgruvan #1 136,3 Iron, copper, gold, molybdenum 15/12/2011 15/12/2036
Source: Company data and Nordea
The company aims to reopen mining operations in the Ludvika mines
The company is focusing on reopening mining operations at the Ludvika mines, divided into Blötberget and Håksberg, as well as prospecting and developing Väsmanfältet, located between the two. The deposits at the sites stretch along a ~25 km-long zone of mineralisation, running from the south of Blötberget to the north of the Håksberg field. The former two are brownfields, meaning that mining operations have previously taken place there. Brownfields typically require lower startup costs, as some infrastructure is already available underground as well as above ground.
The company wants to initiate extraction from Blötberget in 2021
There are four main types of iron ore products: lumps, fines and concentrates, and processed products from these can include pellets and sinter in order to feed the iron ore into the furnaces. The company’s operations will mainly focus on yielding high-quality iron products in the form of concentrate, with an average iron content of around 69%. Pellets or sinter can be made from fines, also called concentrates, before adding to the iron-making processes.
The intention is to sell these fines to customers in Europe, China and the Middle East, which will then produce iron pellets, sinter and finished steel products to sell to the end-customer.
NIO: BUSINESS MODEL
Source: Company data and Nordea
Marketing material commissioned by Nordic Iron Ore 12

Nordic Iron Ore11 January 2019
NIO is conducting a feasibility study at Blötberget, which is planned to be finished during H1 2019. The company then aims to initiate mining operations there in 2021, as the first phase of the Ludvika mines.
Company historyThe group has all the necessary permits required to initiate mining activities at Blötberget
NIO is a mining development company founded in 2008, with the aim of operating in the Ludvika mines as well as exploring the Väsman field. The group has acquired all the necessary permits for the initial project in Blötberget, to start production.
Mining and exploration in the Ludvika area has taken place since the 17th century. In more recent times, Gruv AB Vulcanus and Stora Kopparberg Bergslags AB have been involved, among other companies. Similar to the intention of NIO, the majority of operations have been focused on iron production. Production was carried out until the Blötberget mine closed in 1979. Since then, the area has been controlled by several companies through exploration permits, until NIO was formed in 2008. For the first time since mining and exploration started in the area, the mineralised field is controlled by a single stakeholder.
In total, there are 216.2 Mt of measured, indicated and inferred iron ore in the Ludvika mines
After the permits were transferred to NIO, measurements of iron quality were carried out according to the Joint Ore Reserves Committees standards established in 2012 (JORC 2012). An approximately 25 km-long mineral zone of iron-rich deposits has been identified, running from Blötberget, southwest of Ludvika, to the north section of the Håksberg field. At present, the group controls measured and indicated mineral resources of ~128 Mt (with an iron content of between 34.8% and 41.7%) and inferred mineral resources of 61.2 Mt (with an iron content between 33.4% and 36.1%).
COMPANY EVENTS
Year Event
2008 The company was founded
2008 Explora on permits receive from Archelon Mineral AB, IGE Nordic AB and Kopparberg mineral AB
2010 Acquisi on of three more explora on permits for Håksberg
2011 Granted exploita on concessions for Blötberget and Håksberg
2011 Ini a on of Preliminary Economic Assessment
2013 New internal study suggest development in 3 steps, with start in Blötberget
2014 Environmental permit granted for Blötberget and Håksberg.
2014 Two new share issues, raising SEK 58.0m
2014 Pilot tests of metallurgic beneficia on indicated a possibility to create a product with high iron content
2015 New share issue, raising SEK 18.0m
2015 New applica on for exploita on concession for South Väsman Field
2016 Signed le er of intent with Rail Cargo, regarding logis cs between the Ludvika mines and harbour in Oxelösund
2017 New share issue, raising SEK 18.3m
2017 DMT gave final update on recource es mates, increasing previous amounts by around 15%
2017 Approved exploita on concession for Södra Väsman field
2018 Listed on Nasdaq First North
Source: Company data and Nordea
The Ludvika minesNIO's projects in the Ludvika mines consist of Blötberget, Håksberg and Väsmanfältet
The Ludvika mines, consisting of potential mines Blötberget, Håksberg and Väsmanfältet, are located approximately 217 km northwest of Stockholm, in the Ludvika municipality in Dalarna County, central Sweden. The region is known for its rich mining and steelmaking history, with notable former and current production areas including the Grängesberg iron ore mine, Zinkgruvan sulphide mine, Garpenberg sulphide mine and Falun sulphide mine.
Marketing material commissioned by Nordic Iron Ore 13

Nordic Iron Ore11 January 2019
SGU GEOPHYSICAL SURVEY OF THE LUDVIKA MINES
Source: Company data
LOCATION OF THE LUDVIKA MINES
Source: Nordea
NIO’s operations will stretch from the southwest to northwest of the town of Ludvika, which offers general services such as medical care, telecommunications, banking, housing, hotels, vehicle repair and schooling. Moreover, this provides NIO with access to infrastructure such as roads, railroads and power grids, as well as tier-one service providers and contractors. The mines will also be planned close to the beneficiation plant in Skeppsmora.
NIO has signed a letter of intent for transport to Oxelösund harbour
Blötberget does not have its own railway terminal at present, but there are plans to include railway tracks to connect it to its beneficiation plant. There are railway stations in Grängesberg and Ludvika, approximately 9km and 7 km, respectively, from the planned mineral beneficiation plant in Skeppmora. The railway line that passes through Ludvika and runs close to the project offers connections to three port towns, namely Gävle (180 km), Oxelösund (270 km) adjacent to the Baltic Sea, and Lysekil (410 km), on the Swedish west coast. The company has stated that the intended primary route for transportation will be by rail to the port in Oxelösund, as the company has signed a letter of intent with an Austrian transportation company, Rail Cargo, for logistics on this route. Moreover, the company has also signed a letter of intent with Oxelösund Port, which has agreed to receive ore trains for trans-shipment into vessels or for intermediate storage. Only smaller investments are required, for which the port will assume responsibility.
Marketing material commissioned by Nordic Iron Ore 14

Nordic Iron Ore11 January 2019
THE LUDVIKA MINES' REGIONAL NETWORKS
Source: Company data and Nordea
BlötbergetAs a brownfield project, there is infrastructure in the mines that can be utilised in reopening operations
Blötberget is located southwest of Ludvika, where NIO owns two mining concessions, granted in 2011 and 2017, covering 165 hectares of land. The area of the first concession, Blötbergsgruvan 1, consists of five mineralised bodies: Kalvgruvan, Flygruvan, Hugget, Belstamalmen and Sandellmalmen. The second concession, Blötbergsgruvan 2, covers two mineralised areas: Guldkannan and Carlsvard. Geophysical surveys and historical drilling holes at Blötberget indicate that the mineralised zones at the concession areas run to a depth of approximately 850 metres below surface.
There is available data from 20,559 metres of drilling
Iron ore extraction at Blötberget has a long history, dating back to the 17th century. In more recent times, Gruv AB Vulcanus and Stora Kopparberg Bergslags AB have operated at the site, reaching annual production of 300,000 tonnes of iron products. In 1979, mining was suspended due to low iron prices and the subsequent lack of profitability. Mining at Blötberget was abandoned until 2008 when NIO took over exploration permits. At the time of suspension, there were 25 Mt of mineral resources. As a brownfield site, Blötberget has some existing infrastructure such as shafts which the company can utilise to reopen the operations.
In between 1942 and 1977, previous owners systematically drilled around 456 holes, totalling 50,270 metres. NIO drilled 29 deep core holes totalling 14,523 metres in depth from 2012 to 2014, and re-assayed 31 of the historical drilling holes totalling 6,036 metres. The latest calculations show an estimated mineable tonnage of 45.4 million, indicated resources of 9.6 Mt and inferred resources of 11.8 Mt of iron ore. These resources contain ores with average respective iron content (Fe) of 41.7%, 36.2% and 36.1%, consisting of magnetite and hematite.
MINERAL ASSETS IN BLÖTBERGET
Historical re-assayed Since 2011 Mt Fe (%) Mt Fe (%) Mt Fe (%)6,036 14,920 45.4 41.7 9.6 36.2 11.8 36.1
InferredData measured as meters drilled Measured Indicated
Source: Company data and Nordea
Tests of ore samples from Blötbergsgruvan were performed in 2016 to optimise recovery – a process where gangue minerals are removed from the ore to achieve purer products. The tests were conducted on 20 tonnes of iron ore and showed potential to create products with average Fe content of around 69% – considered premium products. The standard iron content in products is around 62%.
Marketing material commissioned by Nordic Iron Ore 15

Nordic Iron Ore11 January 2019
NIO aims to start production in Q2 2021
The company has all the required permissions to initiate construction of the new facilities and mining infrastructure at Blötberget. A feasibility report for the mine is set to be finished in Q2 2019, while NIO aims to commence construction of the mine in 2020. Upon completion, the company expects Blötberget to supply enough iron ore to produce around 1.3 Mt of refined products annually.
Life-of-mine plan for BlötbergetThe company has created a life-of-mine plan (LOMP) for Blötberget, providing a long-term plan for the mine, consisting of four different stages:
Pre-production developmentProduction ramp-up Steady-state productionClosure
During the first stage, pre-production development, preparations are made for enabling the start of ore extraction, including gaining access to the ore bodies, installing ventilation, power and dewatering systems, as well as completion of the hoisting systems. NIO intends to use external contractors to complete the pre-production phase of the mine development.
Any ore extracted during this stage will be crushed underground with secondary crushing and grinding and then stockpiled at the surface. Furthermore, development of the main access ramp from the surface to the 420-metre level is critical, and it is imperative that advancement can be maintained at a high rate in that particular phase.
Key milestones in months 15, 18 and 21
The stage is scheduled to take approximately 27 months, with key milestones in months 15, 18 and 21:
Gaining access to the first ore body at the 180-metre level, Sandell, at 15 months of developmentReaching the historical infrastructure in the 18th monthAccessing the ore body at the 340-metre level, Hugget, expected in month 21
As the mine has been partially developed at the 320-metre level during past production, there is an opportunity to begin early extraction once development has reached this depth.
However, due to uncertainties in surveying the existing infrastructure and gradual access to ore, production is likely to begin at a lower extraction rate. At this point, the mine has reached the second stage. The production ramp-up is the period at which extraction is expected to start but has not reached the estimated yearly capacity of ~3.0 Mt. The stage is estimated to last 18 months, during which extraction is initiated at the first ore body.
Possible production of 3 Mt per year
The full width of the ore is accessible from 380 metres and below, which is the reason why full production cannot be initialised when operations first begin. When the 380-metre level has been reached and ore reserves at that level are fully accessible, production of an estimated 3.0 Mt a year – or 10,000 tonnes daily – can be achieved. At this point, the third and final stage, steady-state production, of the LOMP is initialised.
Development, ie tunnelling activities, is naturally most intensive during the early years. However, during steady-state production there is still a need to develop the mine further to maintain the production rate. An annual development rate of approximately 3,000 metres is needed each year. Steady-state production at Blötberget is estimated by management to last for ten years, from year 3 to year 13, and then production falls during years 14 and 15 due to decreasing volumes of ore available for extraction.
HåksbergHåksberg is located to the north of Väsmanfältet and Ludvika, where NIO owns concessions covering 136.3 hectares of land. Like Blötberget, Håksberg is a brownfield site and was mined until 1979 when it was closed due to a lack of profitability. Before its closure, it had a yearly output of around 250,000 tonnes of iron products.
Marketing material commissioned by Nordic Iron Ore 16

Nordic Iron Ore11 January 2019
No recent drilling, but historical evidence offers promising indications
No recent drilling has been done at Håksberg, and there were no measured iron ore resources as of 2018. However, samples from historical drilling holes that have been analysed have shown indicated deposits of 25.4 Mt and inferred deposits of 11.6 Mt of iron ore, with average Fe content of 36.4% and 36.0%, respectively. Furthermore, the mine had calculated mineral assets of 14.5 Mt of measured and 22 Mt of indicated iron ore deposits before it closed the first time, which suggests a possibility of further findings at deeper levels. These estimates, however, were not made according to the current reorganised mineral resource estimation standards and are not comparable with Blötberget's mineral resource estimation, according to the JORC 2012 code.
MINERAL ASSETS IN HÅKSBERG
Data measured as meters drilled Measured Indicated Inferred
Historicalre-assayed Since 2011 Mt Fe (%) Mt Fe (%) Mt Fe (%)1,320 N/A N/A N/A 25.4 36.4 11.6 36,0
Source: Company data and Nordea
VäsmanfältetNIO received an exploitation concession for Väsmanfältet in December 2017
Väsmanfältet is a 3 km-long mineral field located between Blötberget and Håksberg, beneath the Väsman lake west of the town of Ludvika. The field is covered by the Södra Väsmanfältet 1 exploitation concession awarded in December 2017. In contrast to the other two projects, Väsmanfältet is less well-defined, but its proximity to the other two projects offers it close connections to roads and electricity.
MINERALISED ZONES AT FINNÄSET VÄSMAN
Source: Company data, Thomas Lindholm GeoVista
Exploration of Väsmanfältet is still in its early stages, with results generally based on relatively shallow holes of around 300 metres deep, drilled in 2012, but also historical samples.
Collectively, the historical samples and drilling at Väsman, Finnäset and Lyviksberget have shown amounts of 5.1 Mt measured, 42.9 Mt indicated and 37.8 Mt of inferred iron ore, mainly consisting of magnetite. Estimates from these samples provide average Fe grades of 36.7%, 34.8% and 33.4%, respectively, for the iron ore located in Väsmanfältet.
MINERAL ASSETS IN VÄSMANFÄLTET
Data measured as meters drilled Measured Indicated Inferred
HistoricalRe-assayed Since 2011 Mt Fe (%) Mt Fe (%) Mt Fe (%)
1,430 6,850 5.1 36.7 42.9 34.8 37.8 33,4
Source: Company data and Nordea
Marketing material commissioned by Nordic Iron Ore 17

Nordic Iron Ore11 January 2019
There is evidence suggesting that additional tonnage is probable
Based on conclusions and recommendations in a technical report published in 2013, the results give a promising indication that significant additional tonnage is likely to be discovered with further investigation. The report estimates that further diamond drilling of 9,000-10,000 metres is necessary to investigate the unexplored parts of the area.
Marketing material commissioned by Nordic Iron Ore 18

Nordic Iron Ore11 January 2019
The lifecycle of a mineThe different stages a mining company goes through can be illustrated as a lifecycle, which begins with exploration, moves on to development and exploitation, and ends with closure either after permits expire or the company decides to discontinue operations.
Nordic Iron Ore is in the process of finalising the prospecting and exploration stage for Blötberget
Nordic Iron Ore (NIO) is currently in the early stages of the lifecycle, with Blötberget being in the final months of the prospecting and exploration phase, while Håksberg and Väsmanfältet are still at an earlier part of this stage, verifying the extent of the mineralisation. To elaborate on this further, we offer an overview of the four stages that are generally attributed to a mining company below.
THE LIFECYCLE OF A MINE
Prospec ng
and
Explora onDevelopment Extrac on Closure
Source: University of Arizona Superfund Research Program
Prospecting and explorationProspecting and exploration are the predecessors to what may develop into a full-scale mining project. This consists of the search for mineralisation and identification of mineral zones and their properties through various analysis methods. Depending on the extent of the mineralisation, the mineable and processing properties could be time-consuming and years may pass before a company is able to proceed to the next step.
Prospecting is the search for mineral resources through exploration techniques, including core drilling analysis, surface and airborne magnetic surveys, surface and underground geophysical techniques and satellite photography.
During exploration, analysis is used to find mineral resources
Subsequently, mining exploration is where additional expert analysis is used in order to determine the size and richness of the resources uncovered during the prospecting process. Such analysis of geological confidence and technical and economic evaluation allow experts to label the reserve a 'mineral resource', which enables the company to better estimate the economic value of the reserve and the mining costs. A mineral resource is a concentration of potentially valuable material that occurs naturally in the earth. The testing that is carried out during exploration determines the resource based on the geological confidence with regards to amount and quality. The resource can be categorised as inferred, indicated or measured.
When the amount and quality can be estimated with only a low confidence level, based on limited sampling, it is categorised as an inferred mineral resource. Further sampling may add a reasonable confidence level on the amount, quality, density, shape, and physical characteristics of the mineral, which entails the classification of an indicated mineral resource. If additional sampling and reliable and detailed exploration enable the same characteristics to be accurately estimated with a high level of confidence, it is subsequently classified as a measured mineral resource.
The likelihood of a deposit leading to mining activities depends on which category it falls into. While an inferred mineral source will not be prioritised, a measured resource is more likely to be pursued.
A mineral reserve is the part of a mineral resource that is profitable to mine
As an additional specification of the mineral resource, an ore reserve is the part of the mineral resource that can be economically profitable to mine and is divided into two categories. Following the classification of a deposit as being either an inferred, indicated, or measured mineral resource, it is subsequently labelled a 'probable' or a 'proved' ore reserve. This classification is based on what is known about the mineral resource through sampling, combined with further consideration of additional factors,
Marketing material commissioned by Nordic Iron Ore 19

Nordic Iron Ore11 January 2019
such as mining, metallurgic, economic, environmental, marketing, legal, political, and social factors.
Accordingly, with a combination of some information available about the concentration of the ore, an indicated reserve, and some uncertainty in the modifying factors, the deposit can be labelled a probable ore reserve. Mining operations developed from probable ore deposits have a chance of success but still carry financial risk. In contrast, if the concentration of the ore is defined as a measured mineral resource, combined with limited uncertainty about the modifying factors, it is classified as a proved ore reserve. This is the highest confidence category of the deposit estimates, implying high potential that the reserves can be extracted and sold at a profit.
The last step of the prospecting and exploration stage is a feasibility study
Following the completion of the prospecting and exploration stage, a feasibility study is performed to formally determine whether it is economically worth developing the mineral deposit into a mine. Consequently, the data gathered in this early stage will indicate if there is any potential to mine for valuable minerals, which is imperative for continuing to the development stage.
DevelopmentDevelopment includes addressing mining technology, construction details and environmental management
If the indicated potential during the prospecting and exploration stage is strong, the project may proceed to the development stage, the purpose of which is to enable the deposit to be exploited and mined. At this stage, development of the mine site is put in place to ensure that the mine is productive without later interruption during its lifetime. This includes pre-development planning, budgeting, permit requests and other preparations. Specific areas that may be addressed consist of 1) the mining technology that will be used; 2) the construction of roads, processing facilities, and employee housing; and 3) the implementation of proper environmental management systems, which are required before extraction can begin.
Moreover, plans are adjusted according to which method of mining is deemed appropriate. There are three main mining methods:
Surface miningUnderground mining Solution mining
The two most common methods of mining are surface and underground mining. While their use mainly depends on the type of ore and its location, it also takes into consideration issues of safety, technology, economics, and environmental impacts.
Surface mining removes soil and rock from on top of the mineral deposit. It may begin as soon as the pre-development steps are complete. For example, coal mining is commonly done via varieties of surface mining.
Underground mining is more expensive and complex than surface mining
Underground mining is usually more expensive and complex than surface mining, as it uses shafts and tunnels to access deeply-buried mineral deposits, while the overlying rock is left in place. Therefore, this method requires a lot of additional planning, as the integrity of the mine needs to be considered.
Solution mining is performed by pumping a leaching solution such as an acid into the ground, which then dissolves the solid minerals into liquid. This liquid containing the minerals is then pumped out of the ground and the mineral can then be recovered. Solution mining is a technique commonly used for mining copper, uranium or salt in locations that are too deep for surface or underground mining.
Mineral extractionProspecting, exploration and development continue to take place even after a mine entersthe extraction phase
Given a successful development stage, the company is finally able to move on to the extraction stage, where the actual mining takes place. More exploration and development may occur during this stage, as a result of an increase in reserves prospects. The process for NIO, the company will be to remove the mineral in large quantities, and subsequently break this up into smaller pieces, which are then enriched by a process whereby the minerals to a certain degree are separated from the gangue or side rock. The purpose is to develop fines with high iron content.
Marketing material commissioned by Nordic Iron Ore 20

Nordic Iron Ore11 January 2019
Smelting is the final step in production, where the concentrate is melted and prepared for steel-making processes. This step is not applicable for NIO, as it intends to sell its enriched product for shipment to pelletisers and steel mills.
ClosureEven before the mine is opened, there is a plan for the closure stage
The mining organisation begins planning for closure and reclamation early on; even before a mine is allowed to open, a reclamation plan must be set in place for its closure. The strict regulations are related to land preservation and environmental aspects, as the mining operator is required to describe the processes it will use to attempt to restore or redevelop the land that has been mined. The factors that are considered when planning for closure include: protection of public health and safety, addressing environmental damage, returning the land to its original state or an acceptable new use, and sustaining social and economic benefits brought by the mine.
The cost of closing a mine depends on numerous factors such as age, location, type, and size of mine, amount of waste, geological characteristics, and type of mineral being extracted.
Marketing material commissioned by Nordic Iron Ore 21

Nordic Iron Ore11 January 2019
Executive managementMining requires specialised skills as well as a well-rounded management team, which we believe NIO's executive management offers, given its combined mining experience of close to 100 years and a managing director with extensive experience in finance.
EXECUTIVE MANAGEMENT
Lennart Eliasson Paul Marsden Hans ThorshagPosition Position PositionCFO and managing director Technical and marketing advisor Technical directorOther appointments Other appointments Other appointmentsBoard member of the subsidiary Ludvika Gruvor AB.
- Board member of HT Mineral AB and partner in Mining and Milling in Bergslagen Handelsbolag.
Background Background BackgroundMr Eliasson was born in 1956 and holds an MBA from Uppsala University. He has worked as a chartered accountant at KPMG where he was a partner and worked as a specialist in financial analysis and valuation issues. Following this, he worked for ten years as an adviser, primarily for the acquisition of venture capital and market quotations.
Mr Marsden was born in 1957 and holds a BSc. in Geology from Aston University in Birmingham, UK. He is also a chartered engineer (CEng.) and scientiest (CSci.). He has over 35 years’ experience in the development of iron ore and steel industry projects globally. His expertise is in mineral processing, alternative iron-making processes and global iron ore markets.
Mr Thorshag is a mining engineer with a degree from the Royal Institute of Technologyin Stockholm, Sweden. He was born in 1950 and has more than 37 years’ experience from the mining industry as a project manager, production manager and mining specialist at companies such as LKAB, Boliden, Midroc Gold and Lundin Mining. Also, he is a nominated Qualified Person in accordance with SveMin’s regulatory framework.
No. of shares No. of shares No. of shares
20,000 shares and 49,998 warrants. 17,740 shares. 10,000 shares and 20,000 warrants.
Markus KarlssonPositionProject director
Other appointmentsOwner of Karlsson Mining Consultant.BackgroundMr Karlsson was born in 1973 and studied at the Helsinki School of Engineering. He has more than 25 years' experience in mine development and operations from companies including LKAB, Northland Resources, Arcelor Mittal, Northern Ironand Newcrest Mining Ltd.
No. of shares-
Marketing material commissioned by Nordic Iron Ore 22

Nordic Iron Ore11 January 2019
Board of directorsNIO's board consists of four members from various backgrounds bringing different experience, which we consider a good fit for steering the mining company to achieving its true potential.
BOARD OF DIRECTORS
Tomas Olofsson Jonas Bengtsson Michael Mattsson
Position Position Position
Chairman of the board. Board member. Board member.
Other appointments Other appointments Other appointments
Managing director of Lemont AB, owner, partner and board member of Ludvika Holding AB, Grytänge Invest AB, Matojo AB, Fastighets AB Morgårdshammar, Datorama AB, Abacus Sales AB, A. Rentall AB och Mecapto AB.
Chairman and owner of Jonas Bengtsson Invest AB and board member of Bengtssons Tidnings AB, Origo Capital AB and several property companies.
Chairman of the board in Copperstone Resources AB, board member of Endomines AB and Net Trading Group AB.
Background Background Background
Mr Olofsson was born in 1968 and is an entrepreneur with 20 years of experience from the engineering industry. He has built and developed a number of industrial, staffing and real estate companies.
Mr Bengtsson was born in 1969 and holds an MBA from Stockholm University. He is a partner at BTAB Invest and has 15 years' experience in the financial sector and the development of small and medium-sized industrial and property companies.
Mr Mattsson was born in 1973 and holds an MSc. from the Stockholm School of Economics. He has a background as a professional investor, entrepreneur and corporate finance advisor.
No. of shares No. of shares No. of shares
2,929,398 shares (incl. corporate holdings) and 5,419,913 warrants.
374,361 shares directly and 5,728,166 shares through corporate holdings and 11,815,052 warrants.
746,799 shares directly and indirectly and 1,642,385 warrants.
Gösta Bergman
Position
Board member
Other appointments
Chairman of the board in OptiMobile AB and owner of Advokatfirman Bergman & Partners AB.
Background
Mr Bergman was born in 1950 and holds an LLB from Stockholm University. He has been a business lawyer since 1978 with experience from companies including Ericsson, Unisys, Ovako Steel and as chairman of the board of Grängesberg Iron AB.
No. of shares
-
Source: Company data
Marketing material commissioned by Nordic Iron Ore 23

Nordic Iron Ore11 January 2019
ShareholdersNIO's three largest shareholders as of November 2018 were Bengtssons Tidnings AB, Tomas Olofsson and Copperstone Resources AB. Of these, Bengtssons Tidnings AB is the largest shareholder, owning roughly 29% of the total 20 million NIO shares.
TOP-10 SHAREHOLDERS AS PER NOVEMBER 2018
Shareholder name Number of shares % of total
Bengtssons Tidnings AB 5,728,166 28.8%Tomas Olofsson 2,929,398 14.7%Copperstone Resources AB 1,951,228 9.8%Michael Mattsson 746,799 3.8%Emil Nilsson 558,000 2.8%Gunther & Wikberg 449,343 2.3%Garden Growth Ind AB 435,000 2.2%Nord Fondkommission AB 392,450 2.0%Jonas Bengtsson 374,361 1.9%Väsman Invest 327,005 1.6%Total 19,909,775 100%
Source: Bloomberg
Marketing material commissioned by Nordic Iron Ore 24

Nordic Iron Ore11 January 2019
Market outlookNIO is engaged in the planned production of high-grade iron ore and is hence exposed to developments in the iron ore market. Over the past years, the price of 62% iron ore has traded down. However, premiums for high-grade products have increased materially due to a firm demand development, primarily in China, driven by tougher environmental regulations. We see several factors that should continue to support a strong demand development for high-grade ore, which bodes well for NIO.
NIO's exposure is to the iron ore market is obviously significant, as it is engaged in prospecting and exploring for iron ore and is planning to initiate production at Blötberget.
The dynamics of the iron ore market are complex with several factors impacting prices, among them:
Demand from steel productionIron ore supplyTransportation costsMine operating costsExploration and project pipeline
The iron ore market size is increasingIRON ORE MARKET, Mt
0
500
1,000
1,500
2,000
2,500
2000 2005 2010 2015 2017Supply Demand
Source: Wood Mackenzie and Nordea
Demand for minerals, in general, is impacted by a nation's prosperity and economic development. The World Steel Association claims that this is owing to the increased need for infrastructure investments, among other things, which require mineral inputs such as iron ore in their production processes.
The iron ore market has grown in recent decades and demand for iron ore more than doubled during 2000-17, according to Wood Mackenzie. It claims that this can be explained by the growth of the emerging economies, led by China, since demand for iron ore is closely linked to steel production which in turn is linked to economic growth. However, there has also been a significant increase in the supply of iron ore, and currently the supply of iron ore exceeds the demand for it.
The biggest net importing country of iron ore by far is China, which imported more than 1,000 million tonnes (Mt) during 2017. Another big net importer of iron ore is Japan which imported around 130 Mt in 2017. However, Japan's steel production has been flat to slightly declining in recent years; its production of crude steel in 2012 was 107 Mt versus 105 Mt in 2017. On the supply side, Australia and Brazil stand out as the biggest exporters of iron ore. Australia produced and exported some 842 Mt and 835 Mt of iron ore in 2017, respectively. Western Australia is rich in iron ore resources, with big players such as Rio Tinto, with its Pilbara iron ore mine, as well as BHP Billiton, which has several mines located in the region. The world's largest producer and exporter of iron ore is the Brazilian company Vale, which produced roughly 367 Mt of iron ore in 2017, according to the company's latest annual report.
Marketing material commissioned by Nordic Iron Ore 25

Nordic Iron Ore11 January 2019
TOP TEN IRON ORE EXPORT COUNTRIES 2017, Mt
0 200 400 600 800 1,000
Australia
Brazil
South Africa
South Korea
CIS
Canada
Other Asia
Middle East
Sweden
India
Exports Production
Source: World Steel Association and Nordea
TOP TEN IRON ORE IMPORT COUNTRIES 2017, Mt
0 200 400 600 800 1,000 1,200
China
Japan
Other Asia
CIS
Netherlands
Middle East
France
United Kingdom
Canada
Turkey
Imports Production
Source: World Steel Association and Nordea
EU (28) IRON ORE EXPORT REGIONS 2017, Mt
EU (28) 33.8Africa and Middle East 6.3
Other Europe 1.9NAFTA 1.1CIS 0.1China 0.1Other America 0Japan 0Other Asia 0Oceania 0Total exports 43.3
Source: World Steel Association and Nordea
Sweden is the largest iron ore producer in the EU, producing roughly 27 Mt of iron ore in 2017. Consequently, Sweden is also the largest exporter of iron ore in the EU, exporting some 23 Mt of iron ore in 2017. The biggest export region for the EU producing countries is to other states within the EU, followed by Africa and the Middle East. Our view is that NIO will be exporting most of its products within these regions, as there is good demand and it is convenient from a logistics and trading perspective. Particularly, exports to other EU member states would be advantageous for NIO from a trade perspective, as the trade terms are, of course, better than those to any other regions.
Flight to quality causes high-grade premiums to increase over timeNIO expects to produce iron ore at an average grade of Fe 69%
NIO is striving to be able to produce iron ore products with an average iron content of 69%. High-grade iron ore products (usually with Fe content of 65% or above) are traded at a premium to lower-grade ore. The newly traded 65% Fe index is gaining as the basis for pricing of high-grade iron ore and is hence the one we have chosen to primarily rely on in terms of how high-grade products are priced.
This premium has strengthened in recent years, and 65%-grade iron ore is currently trading at around a USD 6 premium per Fe percentage on top of 62%. If we apply this unit premium to NIO's planned 69% products, the absolute premium would be USD 42 per tonne (USD 6 x (69%-62%) * 100).
During Q3 2018, the prices of low- and high-grade iron ore diverged substantially, and were trading at a spread of more than USD 9 per Fe percentage in September. However, this spread decreased in Q4, primarily due to weaker seasonal Chinese demand, returning to around the two-year average. Overall, 65% and 62% iron ore prices varied between USD 80-100 and USD 60-80 over the course of 2018, as shown in the graph below.
Marketing material commissioned by Nordic Iron Ore 26

Nordic Iron Ore11 January 2019
65% VS 62% PRICE EVOLUTION AND FE PERCENTAGE PREMIUM, USD PER TONNE AND %
0
2
4
6
8
10
20
40
60
80
100
120
Sep 14 Feb 15 Jul 15 Dec 15 May 16 Oct 16 Mar 17 Aug 17 Jan 18 Jun 18 Nov 18
62% iron ore 65% iron ore Fe-% premium (rhs)
Source: Bloomberg and Nordea
AVERAGE 30-DAY VOLATILITY
2018 20%2017 31%2016 35%2015 18%2014 13%2013 7%Total 23%
Source: Bloomberg and Nordea
Looking at the iron ore price trend, it is apparent to us that it has been quite volatile over the past five years. We calculate average 30-day volatility for the period of 9%, which is quite high. The volatility for 65% iron ore peaked during Q1 2016, which relates to the weaker demand for steel coming from primarily Asia. However, price volatility has gone down since 2016 towards more historical levels and averaged 3.5% during 2018. Demand for steel is stabilising again, resulting in a more stable iron ore price, we believe.
Iron ore price volatility peaked during 2016
EVOLUTION OF 65% IRON ORE PRICE AND 30-DAY VOLATILITY, USD PER TONNE AND %
0%
5%
10%
15%
20%
25%
20
40
60
80
100
120
Oct 14 May 15 Dec 15 Jul 16 Feb 17 Sep 17 Apr 18 Nov 18
65% iron ore 30-day volatility (rhs)
Source: Bloomberg and Nordea
Steel consumption going up, per capita consumption going downChina is the world's largest steel producer
Global steel production in general has displayed a CAGR of 1.6% since 2012 and the World Steel Organisation estimates the growth for 2018 and 2019 to be 1.8% and 0.7%, respectively. Moreover, Asia accounts for the lion's share of global steel production, with Japan and India two major producers, after China.
Particularly India has shown strong growth in its steel production recently and our view is that future infrastructure investments in the country, announced by India's Ministry of Steel, will result in this trend continuing. Further, estimates provided by Accenture in collaboration with the OECD imply that global steel consumption will show a CAGR of 1% in the period 2018-2034. The estimated 1% CAGR is not big in itself, which is also
Marketing material commissioned by Nordic Iron Ore 27

Nordic Iron Ore11 January 2019
reflected in steel consumption per capita, which Accenture estimates will decrease during the same period owing to shared services (eg automotive) becoming more popular, reducing the demand for steel. However, the global population is increasing, and is, according to the UN, expected to increase in future decades as well, which will increase overall demand for steel. If that is the case, it will benefit demand for iron ore too.
GLOBAL STEEL PRODUCTION, Mt
1,500
1,550
1,600
1,650
1,700
1,750
2012 2013 2014 2015 2016 2017
Source: World Steel Association and Nordea
GLOBAL STEEL PRODUCTION PER REGION 2017, Mt
0
200
400
600
800
1,000
Source: World Steel Association and Nordea
GLOBAL STEEL CONSUMPTION, Mt
1,600
1,700
1,800
1,900
2,000
Global steel consumption
Source: Accenture Strategy, OECD and Nordea
GLOBAL STEEL CONSUMPTION PER CAPITA, Mt
256
258
260
262
264
2662
018
201
92
020
202
12
022
202
32
024
202
52
026
202
72
027
202
82
029
203
02
030
203
12
032
203
22
033
203
4
Global steel consumption per capita
Source: Accenture Strategy, OECD and Nordea
Environmental demands – an opportunity for high-grade iron oreTOP 10 STEEL PRODUCERS 2017, Mt
Tonnage
China 832Japan 105India 101United States 82Russia 71South Korea 71Germany 43Turkey 38Brazil 34Italy 24
Total world 1,689
Source: www.worldsteel.org and Nordea
Demand for and the price of iron ore are highly dependent on global steel production, which has been shaky in recent years. China is by far the largest producer of steel, turning out some 832 Mt in 2017. However, the Chinese government has shut down several steel manufacturers in recent years due to their inefficiency, contribution to air pollution and direct negative impact on the local environment, while the productivity and utilisation of the remaining steel plants are improving, which requires a higher-quality iron ore feed to the furnaces.
This has primarily impacted the price of lower-grade (62% Fe or below) iron ore, which traded below USD 40 per tonne in 2015 after falling from a price above USD 130 per tonne in 2013. It has been recovering lately, and 2018 was a good year; low-grade ore is now trading at around USD 70 per tonne. Further, the commodity research unit (CRU) does not expect any decline in Chinese demand for iron ore in the years ahead; rather, it expects demand to stabilise.
As can be seen in the graph to the right below, iron ore prices correlate quite well with the development in Chinese steel production, which we believe is related to the fact that China has become increasingly important for global steel production and therefore has a larger impact on the global iron ore price as its production levels fluctuate.
Marketing material commissioned by Nordic Iron Ore 28

Nordic Iron Ore11 January 2019
CHINESE IRON ORE DEMAND AND STEEL PRODUCTION, Mt
0
200
400
600
800
1,000
1,200
2005 2007 2009 2011 2013 2015 2017 2018 2020
Iron ore imports Crude steel production
Source: CRU and Nordea
CHINA STEEL PRODUCTION VS 62% AND 65% IRON ORE PRICES, Mt AND USD/TONNE
30
50
70
90
110
120,000
130,000
140,000
150,000
160,000
Se
p-14
De
c-14
Ma
r-15
Jun-
15
Se
p-15
De
c-15
Ma
r-16
Jun-
16
Se
p-16
De
c-16
Ma
r-17
Jun-
17
Se
p-17
De
c-17
Ma
r-18
Jun-
18
Se
p-18
Steel production (lhs) 62% iron ore 65% iron ore
Source: Bloomberg and Nordea
India ramps up its infrastructure investmentsIndia is expected to ramp up infrastructure investments
India's infrastructure as well as its affordable housing investments might accelerate in the coming years, as the government has announced that it will increase infrastructure spending by 21%, or USD 87bn, during 2018-19. 25% of this increase is earmarked for railways, which will likely increase demand for crude steel and support prices for iron ore. Further, India's Ministry of Steel estimated in the National Steel Policy 2017 that domestic demand for steel would increase at a CAGR of 6.5% up to 2031.
This implies that India's steel production will increase going forward; the World Steel Association estimates it will see a CAGR of 6.5% in the period 2018-31. In addition, in order to improve productivity and reduce imports of expensive coking coal, India will need to increase consumption of higher-grade iron ore. All in all, we believe demand from India for high-grade iron ore products is set to increase meaningfully in the long term.
India's steel production is expected to go above 200 Mt by 2031
INDIA'S STEEL PRODUCTION, Mt
40
90
140
190
240
Source: World Steel Association and Nordea
Rising coking coal prices might favour iron oreHigher coking coal prices have increased demand for high-grade iron ore
Apart from the closure of several steel manufacturers in China, one explanation for the increased demand for high-grade iron ore is that the price of coking coal has increased significantly recently. Coking coal is used to melt iron in the blast furnace, and as its price has increased significantly, manufacturers are now looking more for high-grade iron ore which requires less coal in the smelting process.
Coking coal prices spiked at the beginning of 2017, which was related to supply issues in Australia, one of the largest coking coal suppliers. Since then, the price of the raw material has come down but is still at substantially higher levels than in 2015-16. Looking at the import prices of future contracts for China, we see indications that the market expects prices to increase in the future. Should the prices of coking coal increase, this could have a positive impact on the price for high-grade iron ore, since that would boost demand for it in the blast furnace process, and increase the expected premium NIO could get for its product.
Marketing material commissioned by Nordic Iron Ore 29
Nordic Iron Ore11 January 2019
Coking coal prices have increased since 2017
CHINA COKING COAL IMPORT PRICE, USD PER TONNE
0
50
100
150
200
250
Jan 13 Oct 13 Jul 14 Apr 15 Jan 16 Oct 16 Jul 17 Apr 18 Jan 19 Oct 19
Historical prices Future contract prices
Source: Bloomberg and Nordea
Iron ore pellets becoming more commonIron ore pellet demand has increased due to higher coking coal prices
NIO is planning to produce iron ore that will serve as an input in the pellet production process – pellets are used in blast furnaces in steel manufacturing. Therefore, NIO is exposed to future market prices of iron ore pellets. The increasing price of coking coal has led steel manufacturers to use iron ore pellets in their blast furnace melting process to a larger extent. One of the main benefits of using iron ore pellets instead of crude iron production is that it improves production efficiency and reduces carbon dioxide emissions and hence the negative impact on the environment.
Producing good-quality pellets requires high-quality iron ore, which has resulted in a price increase for pellet contracts. We believe this will increase demand and potentially have a positive impact on the price of high-grade iron ore further, which naturally would benefit NIO.
Iron ore pellet prices have increased sharply since 2016
IRON ORE PELLET SPOT PRICE FE 65%, USD PER TONNE
40
60
80
100
120
140
160
180
200
Nov 13 Sep 14 Jul 15 May 16 Mar 17 Jan 18 Nov 18
Source: Bloomberg and Nordea
Marketing material commissioned by Nordic Iron Ore 30

Nordic Iron Ore11 January 2019
EstimatesWe base our estimates on the Blötberget project. We forecast that Blötberget will be able to produce 2.7 million tonnes of iron ore and 1.3 million tonnes of concentrate per year, on average, until 2034. This implies a lifetime of the mine of 13 years. We forecast accumulative free cash flows over the mine's lifetime of approximately SEK 2.9bn. Finally, we forecast a total capital need of SEK 2bn until first ore, of which we believe NIO should be able to finance SEK 0.5bn (25%) through debt and SEK 1.5bn (75%) through raising equity.
Production estimatesWe estimate average iron ore and concentrate production of 2.7 Mt and 1.3 Mt, respectively
2019 and 2021 are pre-production years and we do not expect any output during this time. During pre-production, we expect capex spending to peak, as the mine and mill are being constructed. During the first year of production, 2022, we estimate the mine will produce ~0.9 million tonnes (Mt) of ore, yielding ~0.4 Mt of concentrate. We expect a fairly rapid ramp-up reaching full production capacity as early as 2024, with average yearly iron ore production of 2.7 Mt and concentrate production of 1.3 Mt. During the entire life of the mine, we expect that NIO will be able to produce some 35 Mt of iron ore and 17 Mt of concentrate, with an average iron ore grade of 69%. Based on estimated measured and indicated resources of roughly 48 Mt, that would imply that 73% will be extracted from the ground. The concentrate is a blend of Hematite and Magnetite, with an overweight of the latter. That would imply that the process weight recovery, ie the output of concentrate in relation to the output of ore, averages 47%.
MINE PRODUCTION, Mt and %
0.0
0.5
1.0
1.5
2.0
2.5
3.0
3.5
2022E 2023E 2024E 2025E 2026E 2027E 2028E 2029E 2030E 2031E 2032E 2033E 2034E
Ore Concentrate 69%
Source: Company data and Nordea estimates
Revenue and iron ore price estimatesWe estimate NIO's revenue to peak by 2030
We estimate that the total revenue for the lifecycle of the mine is USD ~1.5bn or ~SEK 14bn (at USD/SEK of 9.0), based on a production of 17 Mt concentrate, at a real price of USD 80 per tonne. We further estimate that NIO's revenue will ramp up during the first two years of the mine until 2024. We believe that revenue will peak around 2030, alongside production volume. As the mine is approaching its closure in 2034E, revenue will naturally fade.
Marketing material commissioned by Nordic Iron Ore 31

Nordic Iron Ore11 January 2019
REVENUE AND 69% IRON ORE ESTIMATES, SEKm AND USD PER TONNE
0
20
40
60
80
100
120
140
0
200
400
600
800
1,000
1,200
1,400
1,600
2022E 2023E 2024E 2025E 2026E 2027E 2028E 2029E 2030E 2031E 2032E 2033E 2034E
Revenues, SEKm (lhs) 69% iron ore concentrate, USD/t (rhs)
Source: Company data and Nordea estimates
We estimate the price received for NIO's 69% iron ore product by basing it on the standard grade (62%), and applying a unit premium. The premium is based on a combination of average unit premium observed for different concentrate types (Brazilian Fines Index, CFR Qingdao) 65% and 66% versus 62%.
All in all, we are basing our price estimates on real unit premiums of USD 4.0. Given a 62% concentrate price deck of real USD 70 per tonne, we calculate a gross price (pre-transportation costs) of real USD 98 per tonne for a 69% concentrate. Then finally, deducting assumed shipping costs of real USD 20 per tonne, we arrive at a net real price of USD 78 per tonne from 2020E-21E.
IRON ORE PRICE ESTIMATES, USD PER TONNE
2020E 2021E 2022E 2023E 2024E 2025E 2026E 2027E 2028E 2029E 2030E 2031E 2032E 2033E 2034E
62% delivered to China, Qingdao 70.0 70.0 71.4 72.8 74.3 75.8 77.3 78.8 80.4 82.0 83.7 85.3 87.0 88.8 90.6Premium per % for 65% vs 62% 5.0 5.0 5.1 5.2 5.3 5.4 5.5 5.6 5.7 5.9 6.0 6.1 6.2 6.3 6.5
65% delivered to China, Qingdao 85.0 85.0 86.7 88.4 90.2 92.0 93.8 95.7 97.6 99.6 101.6 103.6 105.7 107.8 110.0Premium per % for 66% vs 65% 4.0 4.0 4.1 4.2 4.2 4.3 4.4 4.5 4.6 4.7 4.8 4.9 5.0 5.1 5.2
66% delivered to China, Qingdao 89.0 89.0 90.8 92.6 94.4 96.3 98.3 100.2 102.2 104.3 106.4 108.5 110.7 112.9 115.1Premium per % for 69% vs 66% 3.0 3.0 3.1 3.1 3.2 3.2 3.3 3.4 3.4 3.5 3.6 3.7 3.7 3.8 3.9
69% delivered to China, Qingdao 98.0 98.0 100.0 102.0 104.0 106.1 108.2 110.4 112.6 114.8 117.1 119.5 121.9 124.3 126.8Premium per % for 69% vs 62% 4.0 4.0 4.1 4.2 4.2 4.3 4.4 4.5 4.6 4.7 4.8 4.9 5.0 5.1 5.2
Source: Bloomberg and Nordea Estimates
Opex structureOpex expected to increase as production ramps up
We estimate NIO's total opex over the mine's lifecycle at SEK 7.9bn; we base our estimates on opex relating to mining, processing, railway, port handling, G&A and other. The largest opex is related to mining with total expenditure during the mine's lifetime of SEK 3.3bn accounting for some 42% of the total. The mining costs are comprised mainly of production drives including rock support, long-hole drilling and blasting. The second-largest expenditure is related to railway transportation, with a total cost of SEK 1.4bn during the period. We estimate the transportation cost mainly in conjunction with the shipment from Ludvika to the deep water port at Oxelösund.
As NIO's production increases, economies of scale will be achieved, which should drive down opex per tonne. We estimate that the cost per tonne of iron ore concentrate will decline from USD 100 per tonne in 2022 to USD 45 per tonne in 2024, a decrease of more than 50%, owing to increases in mine production. As the mine approaches the end of its lifecycle, we estimate that the cost per unit will increase again, to reach a level of USD 66 per tonne by 2033.
Of the total operating costs, we forecast around 7% to be fixed (or some SEK 40-45m annually), eg overhead/central costs, while the remainder (ie more than 90%) should be at least semi-variable, hence volume dependent.
Marketing material commissioned by Nordic Iron Ore 32

Nordic Iron Ore11 January 2019
OPEX STRUCTURE ESTIMATES, SEKm AND USD PER TONNE
342
542
610635 650 643 660
686714 707 721 724
246
20
30
40
50
60
70
80
90
100
110
0
100
200
300
400
500
600
700
800
2022E 2023E 2024E 2025E 2026E 2027E 2028E 2029E 2030E 2031E 2032E 2033E 2034E
Mining Processing Railway Port handling
Other G&A USD/t conc (rhs) USD/t ore (rhs)
Source: Company data and Nordea estimates
EBIT and EBITDA outlookDuring the first production year, we estimate that NIO's EBIT and EBITDA will be negative, as well as the final year of the mine's lifecycle, which is natural due to certain proportions of fixed costs. We forecast EBITDA to increase from approximately SEK 320m in 2023 and reach roughly SEK 670m in 2030 as the mine reaches its peak production.
With regards to depreciation charges, we estimate that the mine's total capex (mentioned further below) will be depreciated accordingly with the pace of production volumes.
Hence, we forecast EBIT to increase from SEK ~180m in 2023 to around SEK 470m in 2030. During 2028E-29E, we see earnings being temporarily lower due to the mining sequence whereby we forecast temporarily lower concentrate volumes.
EBIT AND EBITDA ESTIMATES, SEKm
-200
-100
0
100
200
300
400
500
600
700
800
2022E 2023E 2024E 2025E 2026E 2027E 2028E 2029E 2030E 2031E 2032E 2033E 2034E
EBITDA EBIT
Source: Company data and Nordea estimates
Project and sustaining capexWe estimate te project capex at USD 200m and sustaining capex at USD ~30m
We estimate that the total capex needs for the mine are roughly USD 230m, of which we estimate USD 200m will be used during the initial two years of the project, the so-called 'pre-production' years, and USD ~30m will be used during the rest of the mine's lifetime. The sustaining capex we estimate will be fairly evenly spread out throughout the mine's lifetime.
We estimate that the largest portion of the project capex relates to process plant costs, USD 68m, followed by mining costs. The process plant costs relate to main and ancillary equipment, where the cost for main equipment amounts to roughly USD 25m and ancillary USD 3m. The mining costs primarily relate to the development of the mine, such as dewatering and ventilation. We expect much of the sustaining capex to
Marketing material commissioned by Nordic Iron Ore 33

Nordic Iron Ore11 January 2019
come from maintenance of the mine, with estimated capex of USD 18m. For 2019, we estimate that NIO will need to raise an additional USD 10m to finance its capex need.
PROJECT AND SUSTAINING CAPEX BREAKDOWN, USDm
Project capex Sustaining capex
Mining 55 18
Surface handling 13 0
Rail Terminal 13 0
Site civils 14 0
Surface buildings 14 0
Surface Electrical Power 6 0
TMF & pipeline 8 6
Process plant 68 1
Environmental & land acquisition 6 3
Mine Closure 0 3
Shipping & logistics in Sweden 4 0
Total 200 31
Source: Company data and Nordea estimates
CAPEX OUTLOOK, SEKm
5
10
15
20
25
30
0
200
400
600
800
1,000
Project capex (lhs) Sustaining capex (rhs)
Source: Company data and Nordea estimates
Free cash flowDuring 2020-22, we estimate FCF to be negative, as that is the most capex-intensive period. We forecast accumulative negative FCF of USD 210m (SEK -1.9bn) during 2020E-22E, as we expect the first production to commence in 2022.
We expect FCF to be positive from 2023, when we expect the mine to reach 1.2 Mt of concentrate volumes. We then expect FCF to stay positive throughout the mine's lifetime. Over the mine's life, including the construction period, we estimate the total FCF for Blötberget at approximately USD 0.3bn or SEK 2.9bn.
Marketing material commissioned by Nordic Iron Ore 34

Nordic Iron Ore11 January 2019
ESTIMATED FCF, SEKm AND USD PER TONNE
-60
-40
-20
0
20
40
60
-1,200
-1,000
-800
-600
-400
-200
0
200
400
600
800
2020
E
2021
E
2022
E
2023
E
2024
E
2025
E
2026
E
2027
E
2028
E
2029
E
2030
E
2031
E
2032
E
2033
E
2034
E
FCF, SEKm Per tonne concentrate 69%, USD/t (rhs)
Source: Company data and Nordea estimates
Financing structureWe expected NIO to finance its project capex with 75% equity and 25% debt
We believe it is reasonable, for a company of NIO's size and with the Blötberget project's characteristics, that most of the capital needed should be financed through equity. Still, we believe it is reasonable that some of the capex required could be raised through debt. With 25% of the total capital need financed through debt, this implies some SEK 500m in debt, or 1.5x 2023E EBITDA, which we believe is reasonable.
Therefore, the remainder, or some SEK 1.5bn, should be financed through raising equity, preferably during the course of 2019.
FINANCING STRUCTURE 2019E, %
Equity financing75%
Debt financing25%
Source: Company data and Nordea estimates
Marketing material commissioned by Nordic Iron Ore 35

Nordic Iron Ore11 January 2019
Historical performanceNIO has managed to raise more than SEK 200m of equity capital in the past seven years, demonstrating its capacity to raise funding. Moreover, the company has been in a net cash position since 2017, with a stable capex burn rate since 2011, which we deem necessary for the company to be properly prepared to start up a producing mine.
FundingRIGHTS ISSUES, SEKm
Year Issue amount
2011 212012 632013 02014 592015 152016 02017 179M2018 32Total 207
Source: Company data and Nordea
In the past, NIO has primarily funded its operations through equity financing. Over the past seven years, it has raised equity capital amounting to some SEK 207m. The biggest equity injections came in 2012 and 2013, when it managed to raise SEK 63m and SEK 59m, respectively. Note that NIO was a private company until Q3 2018, so the equity capital raised before this came from private investors and government agencies. For example, Swedish state-owned private equity fund Inlandsinnovation invested in the company in 2014. In conjunction with NIO's listing on First North in Q3 2018, it raised roughly SEK 32m in equity capital. It intends to use the additional capital to finalise the feasibility study at Blötberget. In 2012, the company experienced a setback when its intended listing on First North failed, because the stock's liquidity could not be fully secured. The company still managed to secure its capital needs for that year via private investors though.
NIO estimates it needs USD 250m in additional capital for the producing mine
To start work around the producing mine, NIO has estimated it needs a USD 200m capital for the initial two pre-production years of the mine, and an additional USD 50m as sustained capital for the producing 15 years of the mine. Although NIO's debt financing has previously been quite small in relation to its equity financing, it says it is looking for both equity and debt capital to finance its future capital needs. Given NIO's ability to raise equity capital before, we believe it should be able to again raise the capital needed.
NIO: FUNDING HISTORY, SEKm
0
10
20
30
40
50
60
70
80
2011 2012 2013 2014 2015 2016 2017 9M2018
Equity financing Debt financing
Source: Company data and Nordea
NIO's capex need should increaseNIO's capex peaked in 2014 NIO's capex has decreased since 2014, but we expect it to increase in the coming years
as the construction of the producing mine ramps up. Capex peaked in 2014, mainly due to a deep core drilling campaign at Blötberget that included more than 7,100 metres of drilling. In 2012, capex was also at high levels owing to deep core drilling campaigns, including 14,260 metres of drilling primarily at Blötberget and Väsmanfältet. We interpret these high capex levels as having been necessary and consider them positive in having now put NIO in a good position to take the next step in its Ludvika mines project.
Marketing material commissioned by Nordic Iron Ore 36

Nordic Iron Ore11 January 2019
HISTORICAL AND CURRENT CAPEX, SEKm
0
5
10
15
20
25
30
35
2011 2012 2013 2014 2015 2016 2017 9M2018
Capex
Source: Company data and Nordea
Current net cash of SEK 21mNIO had a cash position of SEK 21.2m as of Q3 2018
NIO's ability to raise capital has ensured that it has always had good liquidity. The company's cash position improved significantly during 2018, from SEK 2.4m at the beginning of the year to SEK 21.2m by the end of Q3. This can primarily be explained by the rights issue that took place in Q3. The company's net working capital (NWC) was at a low in 2017 of SEK -18.4m, which was related to a short-term loan of SEK 15.8m to one of its debtors that was to mature in November 2018 but was instead netted towards the shares and a convertible.
NIO's quick ratio has been improving since 2016
Moreover, NIO's liquidity has improved during 2018, with a quick ratio of 3.7 in Q3. The quick ratio peaked during 2015, reaching levels above 4 because the company amortised its short-term debt and repaid some of its account payables, as reflected in its cash flow statement reporting cash flow for 2015 of SEK -7m, down from SEK 13.7m in 2014. Moreover, the quick ratio reached a low during 2017, owing to the aforementioned loan of SEK 15.8m; it was due to mature in November 2018 and was thus treated as short-term debt for the company.
CURRENT/NON-CURRENT ASSETS VS QUICK RATIO, SEKm
36
81 82121 123 115 125
153
-1
0
1
2
3
4
5
0
50
100
150
200
250
300
350
Non-current assets Current assets Quick ratio (rhs)
Source: Company data and Nordea
NWC VS CASH AND EQUIVALENTS, SEKm
-25-20-15-10-505
10152025
NWC Cash and Equivalents
Source: Company data and Nordea
NIO has reported a net cash position since 2017
Since 2017, NIO has been in a net cash position and for the past seven years has only reported net debt twice: in 2013 and 2016. NIO's current and historical net cash position further demonstrates its ability to raise capital as the need arises. As of Q3 2018, NIO's net cash position was SEK -13.9m, which is the lowest since 2012, when the net cash position was SEK -18.9m.
The company's debt-to-equity was high in 2013, explained by increased borrowing
NIO's average debt-to-equity ratio since 2011 has been 0.21; at its highest, it reached 0.38 for the full-year 2013 and at its lowest 0.14 for 2012. The peak in 2013 was because the company increased its long-term debt by roughly SEK 10.2m and its short-term debt by roughly the same amount, SEK 10m. The long-term debt was a loan granted from a private equity fund and the short-term debt related to convertible debt, set to mature in 2014. Since 2014, NIO's leverage has been stable with a debt-to-equity ratio between 0.10-0.23. In Q3 2018, debt-to-equity went as low as 0.10.
Marketing material commissioned by Nordic Iron Ore 37

Nordic Iron Ore11 January 2019
NIO: NET DEBT, SEKm
-25
-20
-15
-10
-5
0
5
10
15
20
Net debt
Source: Company data and Nordea
NIO: DEBT-TO-EQUITY RATIO
0.0
0.1
0.2
0.3
0.4
0.5
0.6
Debt-to-equity
Source: Company data and Nordea
CostsThe biggest expense for NIO relates to prospecting
The biggest cost for junior miners usually relates to prospecting, and NIO is no exception. At year-end 2017, NIO reported prospecting expenses (under other operating expenses) of 90% of total operating costs, or SEK 6.9m. Staff-related costs (reported under salaries, wages and employee benefits) have gradually been decreasing since 2012, from SEK 5.1m to SEK 0.8m as of year-end 2017. NIO's operating costs reached a high during 2012, when total operating costs amounted to some SEK 19.2m. The high costs stemmed from the aforementioned deep core drilling campaign at Blötberget and Väsmanfältet.
NIO: COST DEVELOPMENT, SEKm
3.2 14 8.7 7.7 6.9 6.7 6.9 5.4
0.8
5.1
4.8 5.8 4.20.6 0.8
1.3
0
5
10
15
20
25
Other operating expenses Salaries, wages and employee benefits
Source: Company data and Nordea
NIO: OPERATING COST STRUCTURE AS OF 2017, %
Other operating expenses
90%
Salaries, wages and employee benefits
10%
Source: Company data and Nordea
NIO has improved its balance sheetNIO has low leverage, with total shareholder equity of SEK 139m as of Q3 2018
NIO's balance sheet is categorised by low leverage, with a large equity portion. As of the end of Q3 2018, total shareholder equity amounted to SEK 139m, up from SEK 106m at the end of 2017. Moreover, liabilities have been decreasing since 2013, going from SEK 26m to SEK 13m as of the end of Q3 2018.
The debt structure has gone from short- to long-term since 2011
The company's debt structure evidently changed from 2011 to Q3 2018. The current debt structure has more than 50% long-term debt compared with 80% in 2016. Notably, the short-term debt peak of SEK 19m in 2017 was related to a loan to one of the company's largest debtors, later restructured in Q3 2018. We believe the structure of NIO's balance sheet will be similar in the future to today's and that it will increase in size as the company raises more capital, primarily through the equity capital markets.
Marketing material commissioned by Nordic Iron Ore 38

Nordic Iron Ore11 January 2019
NIO: DEBT STRUCTURE, SEKm
1012
1314
76
10
16
11
33 19
6
0
5
10
15
20
25
30
Long-term debt Short-term debt
Source: Company data and Nordea
NIO: BALANCE SHEET STRUCTURE, SEKm
6
10
26
22
16
17
19
13
30
71
55
99
107
98
106
139
0 50 100 150 200
2011
2012
2013
2014
2015
2016
2017
9M2018
Liabilities Equity
Source: Company data and Nordea
Marketing material commissioned by Nordic Iron Ore 39

Nordic Iron Ore11 January 2019
SustainabilityThe high-grade iron ore that NIO is planning to extract should enable steel manufacturers worldwide to operate in a more environmentally-friendly way. Furthermore, NIO aims to minimise its impact on the environment, local residents and society at large, and to contribute to sustainable development. The company plans to certify its operations according to the international ISO 14001 standard in the future.
SustainabilityMining has a direct and tangible impact on the environment, which can have long-term effects
Mining is a long-term business which entails long-term commitments to the local communities and environment in which the operations take place. Simultaneously, as a result of mining activities, there are direct impacts on the environment, which are accompanied by certain risks. As such, any policies put in place to ensure sustainable mining activities should mitigate the negative impact of these activities to some extent and thus are worthwhile considering prior to an investment in a mining company, we argue. While Nordic Iron Ore does not currently have a producing mine in place, we argue that the overall environmental and social impacts of iron ore mining should be addressed from the outset, as should the company's formal strategy for minimising its negative impacts in the future.
Environmental and social impacts over the lifecycle of a mineEach phase of the lifecycle of a mine, as previously explained, has varying impacts on the natural environment. Therefore, we argue that it is imperative that mining companies assess the environmental impacts of each phase and devote efforts and resources accordingly.
Environmental and social impacts of mining should be considered throughout the lifecycle of a mine
A.T. Kearney breaks down the impacts from mining activities into environmental and social impacts, with three categories in each area. The categories of environmental impacts are water, sea and land, while the categories of the social impacts are social-economic, health and safety and quality of life. A summary of the categories and their subcategories is shown below.
ENVIRONMENTAL AND SOCIAL IMPACTS FROM MINING ACTIVITIES
Source: A.T. Kearney Analysis
The earlier sustainability initiatives are put into place, the better
During the first stages of the lifecycle, the direct impacts on the environment may not be as apparent as in the subsequent stages; nonetheless, these early stages lay the groundwork for establishing responsible operations down the road. The earlier sustainability initiatives are put into place, the more likely they are to be successfully integrated into the development of a project.
Communication and collaboration with local communities are important for successful initiatives
To increase the chances of successful initiatives, the company should establish and continuously maintain collaboration and communication with local governments and communities; this helps to ensure the proposed mine delivers sustainable value to various stakeholders.
Marketing material commissioned by Nordic Iron Ore 40

Nordic Iron Ore11 January 2019
During the exploration phase, however, there is intense activity, which requires more sustainability efforts than any other phase across the lifecycle. While there may be significant job creation, sustainable practices should be carefully maintained to minimise strain on local communities, particularly with respect to pollution and safety.
IMPACT OF ACTIVITIES THROUGHOUT THE LIFECYCLE OF A MINE
Source: A.T. Kearney Analysis
A responsible mining company is characterised by investing in the community
The need for sustainable practices does not cease after a mine is closed. As such, a responsible mining company is characterised as continuing to invest in community development, infrastructure and socio-economic programmes in order to generate benefits for the community long after mining activities end. Apart from reclamation efforts, a mining company may also continue to play a role in fuelling local economic growth, which could be done by building infrastructure or schools.
INFLUENCE AND IMPACT BY MINING PHASE
Source: A.T. Kearney Analysis
Iron ore mining affects air, water and landAir emissions are primarily a result of exhaust gases from diesel-powered vehicles and other equipment needed to sustain mining operations
Iron ore mining in all its phases – from excavation to beneficiation (improving the value of the ore) to transportation – presents environmental risks and results in direct impacts on the environment. These are related to emissions to air and water, as well as soil contamination. Pollutants and residue related to mining are significant and often contain metals; as such, mining activities can significantly interfere with nature. Moreover, emissions into air are primarily a result of exhaust gases from diesel-powered vehicles and other equipment needed to sustain the mining operations. Water pollution can be in the form of residual chemicals from wet treatment, as well as leakage from mining tunnels, which may contain residues of explosives, soot and waste oil. Contamination of soil may be in the form of waste oil and dust, which could contain metals. Simultaneously, mining activities consume large amounts of energy during these processes.
Marketing material commissioned by Nordic Iron Ore 41

Nordic Iron Ore11 January 2019
Environmental impacts are mainly related to sulphide oxidation
The long-term environmental impacts of mining operations from iron ore exploitation are mainly related to sulphide oxidation in the residual sand derived from the mineral processing, as well as from the unwanted gangue materials. The sulphide oxidation can give rise to acidic and metallic leachate. As a consequence, the company is subject to environmental laws and prohibitions, as well as the associated risks in the event of contamination in the area of operation.
Turning iron ore into steel involves high carbon dioxide emissions; this has prompted reforms in China
Steel is the final product of iron ore, and production results in heavy emissions of carbon dioxide. However, with increasingly efficient input of raw materials, steel plants can become more efficient and increase productivity, thereby resulting in reduced emissions. In China, the world's largest steel consumer, this trend is visible. China has applied a more coercive environmental policy: as of 2017, Chinese authorities recalled one-third of all iron ore mining licences, in line with the government's stricter environmental policy. A number of small and inefficient steel plants in the country, with an estimated capacity of around 100 Mt, had to shut down. This has increased the demand for high-quality iron ore, and this is an opportunity that NIO aims to use to its advantage. These new reforms are expected to lead to a shift in focus in the steel industry – instead of reducing environmental impacts by reducing production, environmental impacts can be reduced through efficiency upgrades and environmental adjustments by using high-quality iron ore. Moreover, the steel industry has long been working to streamline steel production; it reduced emissions by 60% between 1960 and 2014. Further improvement areas can still be explored, including modernisation, digitisation and automation of production.
Internal policies and Swedish regulationNordic Iron Ore has all of the required environmental permits for Blötberget and Håksberg
Nordic Iron Ore operates under Swedish and EU law; all applicable permissions are in place for Blötberget and Håksberg, including environmental permits. The company seeks to use up-to-date technology to secure effective production, while minimising the environmental impacts.
In order to carry out permanent mining operations, permits are required under Swedish environmental regulations, which impose requirements for air and water discharges, noise and waste management and hazardous substances. An application for a permit is accompanied by a comprehensive environmental impact assessment, for the purpose of identifying and describing the direct and indirect damage that the planned activity can cause to humans, animals, plants, land, air, water, climate, landscape and cultural environments. Nordic Iron Ore was granted one such permit in 2014, which enables the company to operate the Blötberget and Håksberg mines and operate the facilities needed for the mining activities. The licence is conditional upon the operations being commenced within ten years of issuance. Moreover, this was accompanied by a ruling that requires a restoration fund, with the first major payment of approximately SEK 15m as soon as the permit is activated by the commencement of construction work.
The company aims to minimise its impact on the environment, as stated in its code of conduct
Nordic Iron Ore aims to minimise its impacts on the environment, local residents and society at large and to contribute to sustainable development. Accordingly, issues related to the environment and sustainability are central to the planning of the business. The company aims to certify its operations according to ISO 14001, which is an international standard that specifies requirements for an effective environmental management system. Furthermore, the company seeks to use Dalarna county's environmental objectives as guiding principles. Additionally, the company has established a sustainability policy, a personnel policy, an environmental policy and a code of conduct. The code of conduct specifically aims to:
Minimise the impact on the physical environment in the business areaMinimise emissions to air and waterCreate a secure work environment
Other than this, the company does not disclose a more elaborate strategy to achieve sustainable operations. We argue that this is an area in which the company could improve, as it would allow for a fairer assessment of its sustainability efforts as the project develops.
Marketing material commissioned by Nordic Iron Ore 42

Nordic Iron Ore11 January 2019
PeersThe peer group we deem appropriate for NIO is presented below. All peers are in similar pre-revenue phases to NIO: developing iron ore projects and coming close to starting up their mining projects.
Oceanic Iron Ore Corp
Source: oceanicironore.com
Oceanic Iron Ore Corp is focused on the development of the Ungava Bay iron properties. These properties cover three project areas, namely Hopes Advance, Morgan Lake and Roberts Lake, which are located along the northern extension of the Labrador Trough in the Nunavik Region of northern Quebec. The company is currently focusing on continuing its development of the Hopes Advance project by means of a feasibility study and environmental assessment, as well as securing a strategic partner. The company has conducted an NI 43-101 compliant pre-feasibility study showing promising results, with estimated proven and probable reserves of 1,359 Mt with an iron grade of 32%.
Alderon Iron Ore Corp
Source: alderonironore.com
Alderon Iron Ore Corp is a development-stage company conducting iron ore evaluation activities related entirely to its Canadian properties located in western Labrador in the province of Newfoundland and Labrador. These properties are collectively referred to as the Kamistiatusset, or 'Kami', property. The company has recently carried out a resource estimation compliant with NI 43-101 and the estimated measured and indicated resources amount to some 380 Mt.
Black Iron Inc.
Source: blackiron.com
Black Iron is a Canadian iron ore exploration and development company advancing its 100% owned Shymanivske Project located in Krivyi Rih, Ukraine, to production. Matt Simpson joined Black Iron as CEO in 2010 and has led the company from a grassroots story to a development one, overseeing the company's advancement of the Shymanivske Project to almost shovel ready. The project is located 330 km southeast of Kiev, Ukraine, and is close to two other iron ore mines owned by ArcelorMittal and Metainvest/Evraz Steel. The measured and indicated resources amount to roughly 200 Mt and have been estimated according to NI 43-101.
Iron Road Ltd
Source: ironroadlimited.com.au
Iron Road Limited is an Australian mineral resources company with advanced iron ore projects in South Australia. The company's flagship Central Eyre Iron Project (CEIP) and smaller scale Gawler Iron Project have iron ore deposits located in the Gawler Craton region. The company expects CEIP to produce iron concentrate amounting to 20 Mt per year, with total measured and indicated resources of approximately 550 Mt estimated according to JORC 2012 and 2004. To secure infrastructure to the mine, Iron Road is in need of a strategic partner for financing. The Gawler project has potential production of one to two Mt per year, according to the company. Infrastructure for the project is almost secured, with railroad and port access.
Flinders Mines Ltd
Source: flindersmines.com
Flinders Mines Limited is an Australian Stock Exchange listed (ASX: FMS) emerging iron ore mining company located in Perth, Western Australia, focused on the development of its Pilbara Iron Ore Project (PIOP). It was first listed as Flinders Diamonds Limited (ASX code: FDL) on 20 February 2002. The company changed the name of the holding company to Flinders Mines Limited, effective on 5 May, 2008. The PIOP is located in the Pilbara region of Western Australia, approximately 60 km northwest of the town of Tom Price. The mineral resources of the PIOP have been estimated in accordance with the JORC 2012 code and amount to 1,042 Mt with an iron grade of 55.6%.
Kogi Iron Ltd
Source: kogiiron.com
Kogi Iron Limited is focused on the exploration and development of its Agbaja Plateau Iron Ore Project located in Kogi State, Republic of Nigeria, West Africa. The company's wholly owned subsidiary in Nigeria, KCM Mining Limited, has secured a community development agreement and mining licences have been granted for the mining of iron ore and its conversion into cast steel for steel making.
Marketing material commissioned by Nordic Iron Ore 43

Nordic Iron Ore11 January 2019
Beowulf Mining Plc
Source: beowulfmining.com
Beowulf Mining Plc ('Beowulf') is a Nordic focused, multi-commodity, exploration and development company with assets in Sweden and Finland. Most of the company's projects are in early-stage exploration, but in Kallak, Sweden, it has a project with considerable resource and technical work completed to date. The company currently has an application for an exploitation concession for Kallak North located in the north of Sweden. The company claims a high grade of magnetite concentrate can be produced with an iron grade of 71% with low levels of deleterious elements. The company also has graphite exploration prospects in Finland.
Zanaga Iron Ore Ltd
Source: zanagairon.com
Zanaga Iron Ore Company Limited (ZIOC) is an iron ore exploration and development company, incorporated in the British Virgin Islands. The company was listed on AIM in November 2010 and trades under the symbol 'ZIOC'. The company's flagship asset is its 50% less one share interest in the Zanaga Iron Ore Project located in the Republic of Congo. Glencore Plc holds the other 50% plus one share interest and has effective management control of the Zanaga project. The Zanaga project has some 760 Mt of measured and indicated resources according to JORC 2012.
Marketing material commissioned by Nordic Iron Ore 44

Nordic Iron Ore11 January 2019
Reported numbers and forecastsINCOME STATEMENT
2020E2019E2018E20172016201520142013201220112010SEKm000n.a.n.a.n.a.n.a.n.a.n.a.n.a.n.a.Net revenue
n.a.n.a.n.a.n.a.n.a.n.a.n.a.n.a.n.a.n.a.n.a.Revenue growthn.a.n.a.n.a.n.a.n.a.n.a.n.a.n.a.n.a.n.a.n.a.of which organicn.a.n.a.n.a.n.a.n.a.n.a.n.a.n.a.n.a.n.a.n.a.of which FX-18-15-9-9-8-7-6-18-13-190EBITDA
00000000000Depreciation and impairments PPE-18-15-9-9-8-7-6-18-13-190EBITA
000000-50000Amortisation and impairments-18-15-9-9-8-7-11-19-14-19n.a.EBIT
00000000000of which associates00000000000Associates excluded from EBIT0-1-1-1-1-2-4-2-300Net financials00000000000Changes in value, net
-18-16-10-10-9-9-15-21-16-190Pre-tax profit-40000000000Reported taxes
-22-16-10-10-9-9-15-21-16-190Net profit from continued operations00000000000Discontinued operations00000000000Minority interests
-22-16-10-10-9-9-15-21-16-190Net profit to equity-0.05-0.04-0.54n.a.n.a.n.a.n.a.n.a.-2.07n.a.n.a.EPS0.000.000.000.000.000.000.000.000.000.000.00DPS0.000.000.000.000.000.000.000.000.000.000.00of which ordinary0.000.000.000.000.000.000.000.000.000.000.00of which extraordinary
Profit margin in percentn.m.n.m.n.m.n.a.n.a.n.a.n.a.n.a.n.a.n.a.n.a.EBITDAn.m.n.m.n.m.n.a.n.a.n.a.n.a.n.a.n.a.n.a.n.a.EBITAn.m.n.m.n.m.n.a.n.a.n.a.n.a.n.a.n.a.n.a.n.a.EBIT
Adjusted earnings-18-15-9-9-8-7-6-18-13-190EBITDA (adj)-18-15-9-9-8-7-6-18-13-190EBITA (adj)-18-15-9-9-8-7-11-19-14-190EBIT (adj)
-0.05-0.04-0.54n.a.n.a.n.a.n.a.n.a.-2.07n.a.n.a.EPS (adj)
Adjusted profit margins in percentn.m.n.m.n.m.n.a.n.a.n.a.n.a.n.a.n.a.n.a.n.a.EBITDA (adj)n.m.n.m.n.m.n.a.n.a.n.a.n.a.n.a.n.a.n.a.n.a.EBITA (adj)n.m.n.m.n.m.n.a.n.a.n.a.n.a.n.a.n.a.n.a.n.a.EBIT (adj)
Performance metricsCAGR last 5 years
n.a.n.a.n.a.n.a.n.a.n.a.n.a.n.a.n.a.n.a.n.a.Net revenuen.m.n.m.n.m.n.m.n.m.n.m.n.m.n.m.n.m.n.m.n.m.EBITDAn.m.n.m.n.m.n.m.n.m.n.a.n.a.n.a.n.a.n.a.n.a.EBITn.a.n.a.n.a.n.a.n.a.n.a.n.a.n.a.n.a.n.a.n.a.EPSn.m.n.m.n.m.n.m.n.m.n.m.n.m.n.m.n.m.n.m.n.m.DPS
Average last 5 yearsn.a.n.a.n.a.n.a.n.a.n.a.n.a.n.a.n.a.n.a.n.a.Average EBIT marginn.a.n.a.n.a.n.a.n.a.n.a.n.a.n.a.n.a.n.a.n.a.Average EBITDA margin
VALUATION RATIOS - ADJUSTED EARNINGS
2020E2019E2018E20172016201520142013201220112010SEKmn.m.n.m.n.m.n.a.n.a.n.a.n.a.n.a.n.a.n.a.n.a.P/E (adj)n.m.n.m.n.m.n.a.n.a.n.a.n.a.n.a.n.a.n.a.n.a.EV/EBITDA (adj)n.m.n.m.n.m.n.a.n.a.n.a.n.a.n.a.n.a.n.a.n.a.EV/EBITA (adj)n.m.n.m.n.m.n.a.n.a.n.a.n.a.n.a.n.a.n.a.n.a.EV/EBIT (adj)
VALUATION RATIOS - REPORTED EARNINGS
2020E2019E2018E20172016201520142013201220112010SEKmn.m.n.m.n.m.n.a.n.a.n.a.n.a.n.a.n.a.n.a.n.a.P/En.m.n.m.n.m.n.a.n.a.n.a.n.a.n.a.n.a.n.a.n.a.EV/Salesn.m.n.m.n.m.n.a.n.a.n.a.n.a.n.a.n.a.n.a.n.a.EV/EBITDAn.m.n.m.n.m.n.a.n.a.n.a.n.a.n.a.n.a.n.a.n.a.EV/EBITAn.m.n.m.n.m.n.a.n.a.n.a.n.a.n.a.n.a.n.a.n.a.EV/EBIT
0.0%0.0%0.0%n.a.n.a.n.a.n.a.n.a.n.a.n.a.n.a.Dividend yield (ord.)-61.0%-38.3%-54.9%n.a.n.a.n.a.n.a.n.a.n.a.n.a.n.a.FCF yield
0.0%0.0%0.0%n.a.n.a.n.a.n.a.n.a.0.0%n.a.n.a.Payout ratio
Source: Company data and Nordea estimates
Marketing material commissioned by Nordic Iron Ore 45

Nordic Iron Ore11 January 2019
BALANCE SHEET
2020E2019E2018E20172016201520142013201220112010SEKm122122122122113109997460340Intangible assets
00000000000of which R&D122122122122113109997460340of which other intangibles
00000000000of which goodwill1,571610900000000Tangible assets
00000000000Shares associates00000000000Interest bearing assets00000000000Deferred tax assets00000000000Other non-IB non-current assets00000000000Other non-current assets
1,693732131122114110997460340Total non-current assets00000000000Inventory00001131210Accounts receivable00000000000Other current assets
3421,325-3521132061910Cash and bank3421,325-3532132272120Total current assetsn.a.n.a.n.a.n.a.n.a.n.a.00000Assets held for sale
2,0352,058961251151231218281360Total assets
1,5351,5589610698107995571300Shareholders equity00000000000Of which preferred stocks00000000000Of which equity part of hybrid debt00000000000Minority interest
1,5351,5589610698107995571300Total Equity00000000000Deferred tax0000140010000Long term interest bearing debt00000000000Pension provisions00000000000Other long-term provisions00000000000Other long-term liabilities
500500000000000Convertible debt00000000000Shareholder debt00000000000Hybrid debt
5005000014131210000Total non-current liabilities00000000000Short-term provisions00019331121060Accounts payable00000003000Other current liabilities000000011000Short term interest bearing debt000193311161060Total current liabilities00000000000Liabilities for assets held for sale
2,0352,058961251151231218281360Total liabilities and equity
Balance sheet and debt metrics158-82535-213-13-2015-19-10Net debt
000-18-2-2-8-4-8-50Working capital1,693732131104112107907052290Invested capital2,0352,058961061131201106571300Capital employed-1.4%-1.9%-9.9%-10.1%-9.0%-8.9%-19.6%-33.0%-32.0%n.m.n.m.ROE-1.5%-3.5%-7.7%-8.4%-7.1%-7.4%-13.8%-30.3%-33.3%n.m.n.m.ROIC-0.9%-0.7%-9.4%-8.5%-6.9%-6.1%-10.1%-28.4%-19.1%-64.0%n.a.ROCE
-8.754.6-3.90.3-1.71.83.2-0.81.40.0n.m.Net debt/EBITDAn.m.n.m.n.m.n.m.n.m.n.m.n.m.n.m.n.m.n.m.n.a.Interest coverage
75.4%75.7%100.0%84.9%85.2%87.0%81.6%67.6%87.3%83.6%n.m.Equity ratio10.3%-53.0%36.4%-2.3%13.7%-11.9%-19.9%27.2%-26.8%-2.7%n.m.Net gearing
Source: Company data and Nordea estimates
Marketing material commissioned by Nordic Iron Ore 46

Nordic Iron Ore11 January 2019
CASH FLOW STATEMENT
2020E2019E2018E20172016201520142013201220112010SEKm-18-15-9-9-8-7-6-18-13-190EBITDA (adj) for associates-40000000000Paid taxes0-1-1-1-1-2-4-2-300Net financials00000000000Change in provisions0000-131110000Change in other LT non-IB00000000000Cash flow to/from associates00000000000Dividends paid to minorities000113-5-226-6120Other adj to reconcile to cash flow
-22-16-10-9-9-13-21-15-22-70Funds from operations (FFO)00-1820-17-4330Change in NWC
-22-16-28-7-9-14-14-19-18-40Cash flow from operations (CFO)-961-601-9-9-4-11-30-14-26-170Capital expenditure-983-617-37-16-13-25-44-33-44-210Free cash flow before A&D
00000000000Proceeds from sale of assets00000000000Acquisitions
-983-617-37-16-13-25-44-33-44-210Free cash flow
00000000000Dividends paid01,477000000000Equity issues / buybacks00017118572063210Net change in debt00000000000Other financing adjustments00000000010Other non-cash adjustments
-9831,360-371-12-714-131810Change in cash
Cash flow metricsn.m.n.m.n.m.n.m.n.m.n.m.n.m.n.m.n.m.n.m.n.m.Capex/D&An.m.n.m.n.m.n.a.n.a.n.a.n.a.n.a.n.a.n.a.n.a.Capex/Sales
Key information443n.a.n.a.n.a.n.a.n.a.n.a.n.a.n.a.Share price year end (/current)
1,6131,61368n.a.n.a.n.a.n.a.n.a.n.a.n.a.n.a.Market cap.1,771787103n.a.n.a.n.a.n.a.n.a.n.a.n.a.n.a.Enterprise value440.6440.618.60.00.00.00.00.00.00.00.0Diluted no. of shares, year-end (m)
Source: Company data and Nordea estimates
Marketing material commissioned by Nordic Iron Ore 47

Nordic Iron Ore11 January 2019
Disclaimer and legal disclosuresOrigin of the reportThis publication or report originates from: Nordea Bank Abp, including its branches Nordea Danmark, Filial af Nordea Bank Abp, Finland, Nordea Bank Abp, filial i Norge and Nordea Bank Abp, filial i Sverige (together "Nordea") acting through their unit Nordea Markets.
Nordea Bank Abp is supervised by the European Central Bank and the Finnish Financial Supervisory Authority and the branches are supervised by the European Central Bank and the Finnish Financial Supervisory Authority and the Financial Supervisory Authorities in their respective countries.
Content of reportThis report has been prepared solely by Nordea Markets.
Opinions or suggestions from Nordea Markets credit and equity research may deviate from one another or from opinions presented by other departments in Nordea. This may typically be the result of differing time horizons, methodologies, contexts or other factors.
The information provided herein is not intended to constitute and does not constitute investment advice nor is the information intended as an offer or solicitation for the purchase or sale of any financial instrument. The information contained herein has no regard to the specific investment objectives, the financial situation or particular needs of any particular recipient. Relevant and specific professional advice should always be obtained before making any investment or credit decision
Opinions or ratings are based on one or more methods of valuation, for instance cash flow analysis, use of multiples, behavioural technical analyses of underlying market movements in combination with considerations of the market situation and the time horizon. Key assumptions of forecasts or ratings in research cited or reproduced appear in the research material from the named sources. The date of publication appears from the research material cited or reproduced. Opinions and estimates may be updated in subsequent versions of the report, provided that the relevant company/issuer is treated anew in such later versions of the report.
Validity of the reportAll opinions and estimates in this report are, regardless of source, given in good faith, and may only be valid as of the stated date of this report and are subject to changewithout notice.
No individual investment or tax adviceThe report is intended only to provide general and preliminary information to investors and shall not be construed as the basis for any investment decision. This report has been prepared by Nordea Markets as general information for private use of investors to whom the report has been distributed, but it is not intended as a personal recommendation of particular financial instruments or strategies and thus it does not provide individually tailored investment advice, and does not take into account the individual investor's particular financial situation, existing holdings or liabilities, investment knowledge and experience, investment objective and horizon or risk profile and preferences. The investor must particularly ensure the suitability of an investment as regards his/her financial and fiscal situation and investment objectives. The investor bears the risk of losses in connection with an investment.
Before acting on any information in this report, it is recommendable to consult (without being limited to) one's financial, legal, tax, accounting, or regulatory advisor in any relevant jurisdiction.
The information contained in this report does not constitute advice on the tax consequences of making any particular investment decision. Each investor shall make his/her own appraisal of the tax and other financial merits of his/her investment.
SourcesThis report may be based on or contain information, such as opinions, estimates and valuations which emanate from: Nordea Markets' analysts or representatives, publicly available information, information from other units of Nordea, or other named sources.
To the extent this publication or report is based on or contain information emanating from other sources ("Other Sources") than Nordea Markets ("External Information"), Nordea Markets has deemed the Other Sources to be reliable but neither Nordea, others associated or affiliated with Nordea nor any other person, do guarantee the accuracy, adequacy or completeness of the External Information.
Limitation of liabilityNordea or other associated and affiliated companies assume no liability as regards to any investment, divestment or retention decision taken by the investor on the basis of this report. In no event will Nordea or other associated and affiliated companies be liable for direct, indirect or incidental, special or consequential damages (regardless ofwhether being considered as foreseeable or not) resulting from the information in this report.
Risk informationThe risk of investing in certain financial instruments, including those mentioned in this report , is generally high, as their market value is exposed to a lot of different factors such as the operational and financial conditions of the relevant company, growth prospects, change in interest rates, the economic and political environment, foreign exchange rates, shifts in market sentiments etc. Where an investment or security is denominated in a different currency to the investor's currency of reference, changes in rates of exchange may have an adverse effect on the value, price or income of or from that investment to the investor. Past performance is not a guide to future performance. Estimates of future performance are based on assumptions that may not be realized. When investing in individual shares, the investor may lose all or part of the investments.
Conflicts of interestReaders of this document should note that Nordea Markets has received remuneration from the company mentioned in this document for the production of the report. The remuneration is not dependent on the content of the report.
Nordea, affiliates or staff in Nordea, may perform services for, solicit business from, hold long or short positions in, or otherwise be interested in the investments (including derivatives) of any company mentioned in the report.
To limit possible conflicts of interest and counter the abuse of inside knowledge, the analysts of Nordea Markets are subject to internal rules on sound ethical conduct, the management of inside information, handling of unpublished research material, contact with other units of Nordea and personal account dealing. The internal rules have been prepared in accordance with applicable legislation and relevant industry standards. The object of the internal rules is for example to ensure that no analyst will abuse or cause others to abuse confidential information. It is the policy of Nordea Markets that no link exists between revenues from capital markets activities and individual analyst remuneration. Nordea and the branches are members of national stockbrokers' associations in each of the countries in which Nordea has head offices. Internal rules have been developed in accordance with recommendations issued by the stockbrokers associations. This material has been prepared following the Nordea Conflict of Interest Policy, which may be viewed at www.nordea.com/mifid.
Distribution restrictionsThe securities referred to in this report may not be eligible for sale in some jurisdictions. This report is not intended for, and must not be distributed to private customers in the UK or the US. This research report is intended only for, and may be distributed only to, accredited investors, expert investors or institutional investors in Singapore who maycontact Nordea Bank, Singapore Branch of 138 Market Street, #09-01 CapitaGreen, Singapore 048946.
This report may be distributed by Nordea Bank Luxembourg S.A., 562 rue de Neudorf, L-2015 Luxembourg which is subject to the supervision of the Commission de Surveillance du Secteur Financier.
This publication or report may be distributed by Nordea Bank Abp Singapore Branch, which is subject to the supervision of the European Central Bank, the Finnish Financial Supervisory Authority and the Monetary Authority of Singapore.
This publication or report may be distributed in the UK to institutional investors by Nordea Bank Abp London Branch of 6th Floor, 5 Aldermanbury Square, London, EC2V 7AZ, which is under supervision of the European Central Bank, Finanssivalvonta (Financial Supervisory Authority) in Finland and subject to limited regulation by the Financial Conduct Authority and Prudential Regulation Authority in the United Kingdom. Details about the extent of our regulation by the Financial Conduct Authority and Prudential Regulation Authority are available from us on request.
This report may not be mechanically duplicated, photocopied or otherwise reproduced, in full or in part, under applicable copyright laws.
Marketing material commissioned by Nordic Iron Ore 48

Nordic Iron Ore11 January 2019
Analyst ShareholdingNordea Markets analysts do not hold shares in the companies that they cover.No holdings or other affiliations by analysts or associates.
Market-making obligations and other significant financial interestNordea Markets has no market-making obligations in Nordic Iron Ore.
Fair value sensitivityWe calculate our fair values by weighting DCF, DDM, SOTP, asset-based and other standard valuation methods. When applicable, we set a 12-month target price by applying an appropriate premium/discount and/or other relevant adjustment to our fair value to reflect the share price potential we see within the coming 12 months. Our fair values are sensitive to changes in valuation assumptions, of which growth, margins, tax rates, working capital ratios, investment-to-sales ratios and cost of capital are typically the most sensitive. It should be noted that our fair values would change by a disproportionate factor if changes are made to any or all valuation assumptions, owing to the non-linear nature of the standard valuation models applied (mentioned above). As a consequence of the standard valuation models we apply, changes of 1-2 percentage points in any single valuation assumption can change the derived fair value by as much as 30% or more. Dividend payouts are included in the target price. All research is produced on an ad hoc basis and will be updated when the circumstances require it.
Investment banking transactionsIn view of Nordea’s position in its markets readers should assume that the bank may currently or may in the coming three months and beyond be providing or seeking to provide confidential investment banking services to the company/companies
Marketing MaterialThis research report should be considered marketing material, as it has been commissioned and paid for by the subject company, and has not been prepared in accordance with the regulations designed to promote the independence of investment research and it is not subject to any legal prohibition on dealing ahead of the dissemination of the report. However, Nordea Markets analysts are according to internal policies not allowed to hold shares in the companies/sectors that they cover.
Where applicable, recommendation changes are available at: https://research.nordea.com/compliance#equity-changes.
Issuer Review
This report has been reviewed, for the purpose of verification of fact or sequence of facts, by the Issuer of the relevant financial instruments mentioned in the report prior to publication. No Nordea recommendations or target prices have, however, been disclosed to the issuer. The review has led to changes of facts in the report.
Completion Date
11 Jan 2019, 09:14 CET
Nordea Bank Abp Nordea Bank Abp, filial i Sverige Nordea Danmark, Filial af Nordea Nordea Bank Abp, filial i NorgeBank Abp, Finland
Nordea Markets Division,Research
Nordea Markets Division,Research
Nordea Markets Division,Research
Nordea Markets Division,Research
Visiting address:Aleksis Kiven katu 7, Helsinki
Visiting address:Smålandsgatan 17
Visiting address:Grønjordsvej 10
Visiting address:Essendropsgate 7
FI-00020 Nordea SE-105 71 Stockholm DK-2300 Copenhagen S N-0107 OsloFinland Sweden Denmark Norway
Tel: +358 9 1651 Tel: +46 8 614 7000 Tel: +45 3333 3333 Tel: +47 2248 5000Fax: +358 9 165 59710 Fax: +46 8 534 911 60 Fax: +45 3333 1520 Fax: +47 2256 8650
Reg.no. 2858394-9Satamaradankatu 5Helsinki
Marketing material commissioned by Nordic Iron Ore 49