Embed Size (px)
Citation preview

Vol. 17: 267-278,1999 AQUATIC MICROBIAL ECOLOGY
Aquat Microb Ecol I Published June 18
Nitrification rates in the NW Mediterranean Sea
Micheline ~ianchi',*, Christine Fosset1, Pascal Conan2
' ~abora to i re de Microbiologie Marine, CNRSIINSU UPR 223, Universite de la Mediterranke, Campus de Luminy, Case 907, F-13288 Marseille Cedex 9, France
*COM-LOB, Campus de Luminy, Case 901. F-13288 Marseille Cedex 9, France
ABSTRACT: During spring, ammonium oxidation and nitrite oxidation rates were measured in the NW basin of the Mediterranean Sea, from mesotrophic sites (Ligunan Sea and Gulf of Lions) to oligotrophc sites (Balearic Islands). Nitrification rates (average values for 37 measurements) ranged from 72 to 144 nmol of N oxidised 1-' d-', except in the RhBne River plume area where the rates increased to 264-504 nmol l-' d-' because of the riverine inputs of nitrogen. Maximal rates were located around the peak of nitrite within the nitracline at about 40 to 60 m and just above the phosphacline. At 1 station, relatively high values of nitrification (50 to 130 nmol 1-' d-l) were also measured deep in the water col- umn (240 m). Day-to-day variations were measured demonstrating the response within a few hours to hydrological stress (wind-induced mixing of the water column) and showing the role of hydrological characteristics on the distribution of nitnfication rates. Because of the homogenous temperature (13'C) in the Mediterranean Sea, the spatial (geographical and vertical) fluctuations of nitnfying rates were linked to the presence of substrate due to mineralisation processes and/or Rhbne River inputs. We esti- mate the contribution of nitrate produced by nitrification to the N demand of phytoplankton to range from 16% at mesotrophic to 61 % at oligotrophic stations
KEY WORDS: Mediterranean Sea . Nitrification . Spatial variability . Short-term fluctuation. N budget
INTRODUCTION
The Mediterranean Sea is well known for its moder- ate oligotrophy (Berland et al. 1980, Jacques 1989). Atlantic surface water entering through the Strait of Gibraltar is nutrient-depleted, so nutrient loads de- pend on atmospheric and land inputs (Coste et al. 1988, Cruzado & Velasquez 1990, Bethoux et al. 1992). The Adriatic Sea and the NW basin (Gulf of Lions) are less oligotrophic due to the nutrient inputs of the PO and Rhbne rivers. In the Gulf of Lions during the sum- mer, areas not under direct influence of the Rh6ne but subjected to the NW Mediterranean Current can ex- hibit very low nutrient concentrations in the surface water. In this area, there is a strong nitracline between 50 and 100 m (Cruzado & Velasquez 1990) and a phos- phacline 0 to 40 m deeper (Berland et al. 1988, Conan 1996).
Over the past decade, research in the Mediterranean Sea has focused on biological processes determining nutrient budgets and fluxes in the photic layer (Minas
et al. 1988). Study of one of the major biological pro- cesses of the nitrogen cycle, nitrification, has been neglected in the euphotic layer (Bianchi et al. 1994a,b, Gentilhomme & Raimbault 1994), although in models the nitrate produced by nitrification sensu lato (in the deep layer) is taken into account via physical processes like diffusion and/or mixing. Most nitrification occurs at the bottom of the photic zone in the nitracline, lead- ing to a rapid cycling of nitrogen to nitrate (Ward et al. 1989, Bianchi et al. 199413). This regenerated nitrate is rapidly consumed by primary production (Gentil- homme 1992). The contribution of citrificati~n to nitrate uptake by primary producers constitutes a bias in nitrate-based measurement of new production as defined by Dugdale & Goering (1967) that could increase with the increasing oligotrophy of the ecosys- tem.
In this paper, we attempt to assess the importance of nitrification in the NW Mediterranean. The spatial (vertical and horizontal) distribution of nitrification activities were estimated during spring (April, May and June 1995) in several areas from the Ligurian Sea and the Gulf of Lions to the Balearic Islands. Such
0 Inter-Research 1999

268 Aquat Microb Ecol l?: 267-278, 1999
extended geographical distribution was chosen to examine the relationship between the trophic status and nitrification rates. Short-term variations of nitrifi- cation rates were measured at 50 m depth at an oligo- trophic station in the Ligurian Sea to study the impact of changes in the water column structure after wind mixing. Nitrification rates were compared to the input of nitrate in the photic layer by a vertical diffusive pro- cess in order to estimate the contribution of nitrification to the overall flux of nitrate.
MATERIALS AND METHODS
Overview of study. In the NW basin of the Mediter- ranean Sea, primary production displays a high geo- graphical variability. The nutrient inputs from the RhBne River outflow play a major role in this geo- graphical patchiness. For this reason, we sampled at 8 stations widely distributed in the NW basin (Fig. 1) to study the spatial distribution of nitrification. The sta- tions were: Stn 1 in Ligurian Sea; Stns M1, M3, B2 and B5 in the Gulf of Lions; Stns S2 and S5 in the Balearic Island area; and Stn Rh6ne in the Rh6ne River plume (Fig. 1). All cruises were performed during spring (April, May and June 1995). Table 1 gives details of the
BALEARIC ISLANDS
sampling: cruises, dates, locations and depths. Briefly, the geographical distribution of nitrification rates was assessed through 3 cruises: 'Picnic cruise' for Stn 1, and 'Euromarge cruise' for Stns M1, M3, B2, B5, S2, S5. Both cruises were organised within the Mediterranean Targeted Project (E.C. MAST I1 Projects). During these cruises, the sampling depths were determined by con- sidering the fluorescence profiles provided in real time by CTD casts. The third cruise, 'Rh6ne cruise', was devoted to the measurement of nitrification in the Rh6ne River plume. For this station, all samples were taken below the plume at 10 m.
Short-term variations of nitrifying activity were mea- sured during the Dynaproc cruise (Dyfamed French programme) in May at Stn 1 (Fig. 1). This cruise was designed to study the impact of short-term vertical processes induced by wind stress (Andersen et al. 1990). Samples were taken twice a day during 2 peri- ods of measurements, during which time mixing of the water column was expected due to wind stress. The sampling depth was 50 m, below the peak of in situ fluorescence located at 30 m depth.
Physical and chemical measurements. Temperature and in situ fluorescence were measured using a CTD probe (Seabird SBE 911+). For the Rh6ne plume sam- ples, the temperature was measured using a YSI probe
(Yellow Springs Instruments Co., Ohio, USA).
Fig. 1. Location of sampling stations. Stn 1 (Ligurian Sea: Picnic cruise and Dynaproc cruise). Stns M1, M3. B2 and B5 (Gulf of Lions: Euro- marge cruise), Stns S2 and S5 (Balearic Islands: Euromarge cruise),
Stn Rhone: Rh8ne plume area
Nitrite, nitrate and phosphate measure- ments. Subsamples of 10 m1 were taken in polyethylene scintillation vials and were frozen immediately. On land, samples were rapidly thawed and analysed for nitrate (NO3-, standard error 0.1 PM) + nitrite (NOz-, stan- dard error 0.02 PM) and phosphate (PO,, stan- dard error 0.02 PM) according to classical methods (respectively Wood et al. 1967, Mur- phy & Riley 1962) on an automated Technicon analyser (Treguer & Le Corre 1975).
The diffusion of nitrate was calculated according to the formula F= K, X dN/dz, where dN/dz is the nutrient gradient and K, is the tur- bulent diffusion coefficient (Denman & Gar- gett 1983). K, was calculated from 0.25 X E X
(1/N2), where N2 = (g/po) X (dp/dz) and E is the dissipation of the turbulent energy, N is the stratification coefficient, g is the gravitational acceleration, po is the density, and dp/dz is the density gradient. We used an E of 10-a m2 s-3 (Dillon & Caldwell 1980), which results in a K,, close to the value of 3 X I O - ~ m2 S-' used in the Mediterranean by Minas & Codispoti (1993).
Chlorophyll measurements. The total chlo- rophyll was analysed after filtration of 250 m1 subsamples onto Whatman 25 mm diameter GF/F filters, according to the fluorometric
Bianchi et al.. Nitrification in the Mediterranean 269
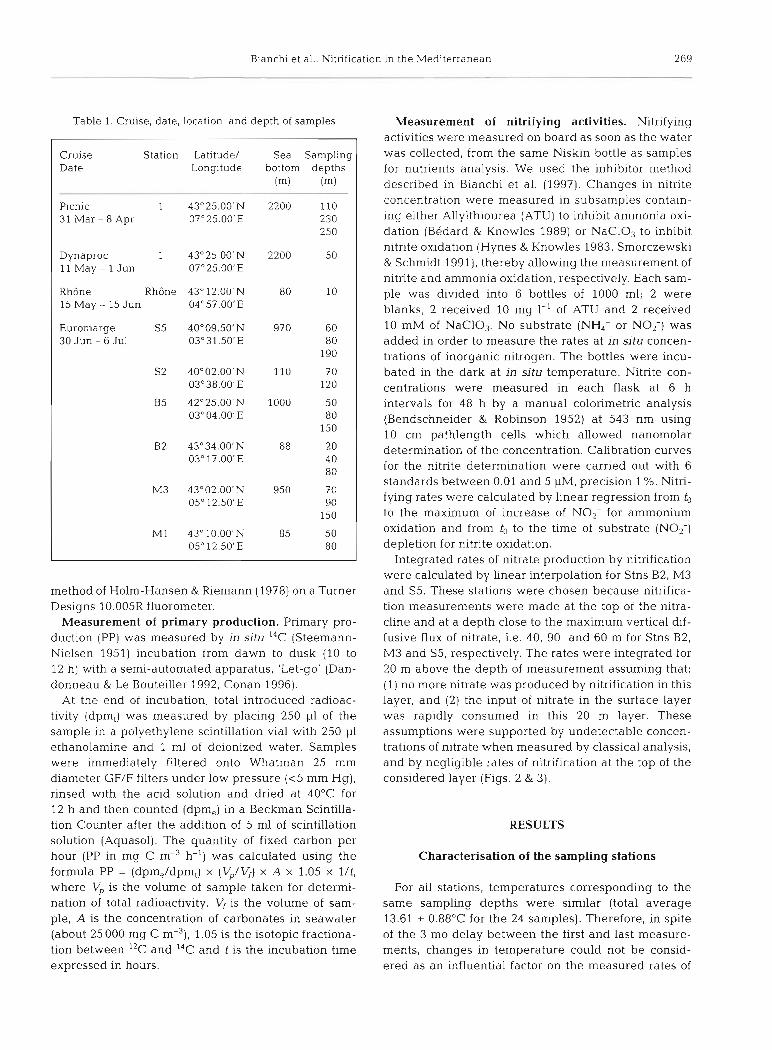
Table 1. Cruise, date, location, and depth of samples
Cruise Station Latitude/ Sea Sampling Date Longitude bottom depths
(m) (m)
Picnic 1 43'25.00'N 2200 110 31 Mar - 8 Apr 07"25.00'E 230
250
Dynaproc 1 43'25.00'N 2200 50 11 May - 1 Jun 07"25.001E
RhBne Rh6ne 43" 12.00'N 80 10 15 May - 15 Jun 04"5?.00'E
Euromarge S5 4Oo09.50'N 970 60 30 Jun - 6 Jul 03°31.50'E 80
190
S2 4Oo02.00'N 110 70 03°38.00'E 120
B5 42"25.00'N 1000 50 03"04.00'E 80
150
B2 43'34.00'N 88 20 03" 17.00'E 40
80
M3 43"02.00'N 950 70 05" 12.50'E 90
150
M1 43"lO.OO'N 85 50 0.5" 12.50'E 80
method of Holm-Hansen & Riemann (1978) on a Turner Designs 10.005R fluorometer.
Measurement of primary production. Primary pro- duction (PP) was measured by in situ 14C (Steemann- Nielsen 1951) incubation from dawn to dusk (10 to 12 h) with a semi-automated apparatus, 'Let-go' (Dan- donneau & Le Bouteiller 1992, Conan 1996).
At the end of incubation, total introduced radioac- tivity (dpm,) was measured by placing 250 p1 of the sample in a polyethylene scintillation vial with 250 1-11 ethanolamine and 1 m1 of deionized water. Samples were immediately filtered onto Whatman 25 mm diameter GF/F filters under low pressure (<5 mm Hg), rinsed with the acid solution and dried at 40°C for 12 h and then counted (dpm,) in a Beckman Scintilla- tion Counter after the addition of 5 m1 of scintillation solution (Aquasol). The quantity of fixed carbon per hour (PP in mg C m-3 h-') was calculated using the formula PP = (dpm,/dpm,) X (VJV,) X A X 1.05 X l/t, where V' is the volume of sample taken for determi- nation of total radioactivity, Vf is the volume of sam- ple, A is the concentration of carbonates in seawater (about 25000 mg C m-,), 1.05 is the isotopic fractiona- tion between 12C and 14C and t is the incubation time expressed in hours.
Measurement of nitrifying activities. Nitrifying activities were measured on board as soon as the water was collected, from the same Niskin bottle as samples for nutrients analysis. We used the inhibitor method described in Bianchi et al. (1997). Changes in nitrite concentration were measured in subsamples contain- ing either Allylthiourea (ATU) to inhibit ammonia oxi- dation (Bedard & Knowles 1989) or NaC103 to inhibit nitrite oxidation (Hynes & Knowles 1983, Smorczewski & Schmidt 1991), thereby allowing the measurement of nitrite and ammonia oxidation, respectively. Each sam- ple was divided into 6 bottles of 1000 ml; 2 were blanks, 2 received 10 mg 1-' of ATU and 2 received 10 mM of NaClO,. No substrate (NH4+ or NO2-) was added in order to measure the rates at in situ concen- trations of inorganic nitrogen. The bottles were incu- bated in the dark at in situ temperature. Nitrite con- centrations were measured in each flask at 6 h intervals for 48 h by a manual colorimetric analysis (Bendschneider & Robinson 1952) at 543 nm using 10 cm pathlength cells which allowed nanomolar determination of the concentration. Calibration curves for the nitrite determination were carried out with 6 standards between 0.01 and 5 pM, precision l %. Nitn- fying rates were calculated by linear regression from to to the maximum of increase of NO2- for ammonium oxidation and from to to the time of substrate (NO2-) depletion for nitrite oxidation.
Integrated rates of nitrate production by nitrification were calculated by linear interpolation for Stns B2, M3 and S5. These stations were chosen because nitrifica- tion measurements were made at the top of the nitra- cline and at a depth close to the maximum vertical dif- fusive flux of nitrate, i.e. 40, 90 and 60 m for Stns B2, M3 and S5, respectively. The rates were integrated for 20 m above the depth of measurement assuming that: (1) no more nitrate was produced by nitrification in this layer, and (2) the input of nitrate in the surface layer was rapidly consumed in this 20 m layer. These assumptions were supported by undetectable concen- trations of nitrate when measured by classical analysis, and by negligible rates of nitrification at the top of the considered layer (Figs. 2 & 3).
RESULTS
Characterisation of the sampling stations
For all stations, temperatures corresponding to the same sampling depths were similar (total average 13.61 + 0.88"C for the 24 samples). Therefore, in spite of the 3 mo delay between the first and last measure- ments, changes in temperature could not be consid- ered as an influential factor on the measured rates of

270 Aquat Microb Ecol17: 267-238, 1999
nM N oxidized d-l 0 50 100 150 200 250 300
J Station S2 0
- \
I -
I I I Station S5
'. - / - 100 -
E
I / / ' I
Station M3 I
250 I 0.0 0.1 0.2 0.3 0.4 0.5 0.6
Fluorescence RFU
--t Nitrite concentration - - Fluorescence
NH4+ oxidallon rate
0 NOz- oxidation
nitrifying activity. Also, the relative in situ fluorescence values were in the same range. For the 24 samples, the average value of fluorescence was 0.49 pg 1-I + 0.21 of chlorophyll, close to the mean value of 0.42 pg 1-' (SD = 0.32, n = 565) obtained according to the fluorometric method (Holm-Hansen & Riemann 1978) during 3 yr of measurements offshore from the city of Marseilles (Conan 1996).
The depth of the peak of fluorescence in- creased with time, from 10 to 30 m at Stn 1 in April and May to 50 to 80 m at Stns M1, M3, B2, B5, S2, S5 at the end of June. The deepening of the peak of chlorophyll corre- sponded to the depletion of nutrients in the upper layer. Corresponding to the spring situation, primary production was rela- tively high for the NW Mediterranean, even at the oligotrophic site of the Balearic Islands, the pelagic Stn S5, with a produc- tion of 187 mg C m-' d-'. The most produc- tive station was Stn 1 in April, with about 1700 mg C m-2 d-l, corresponding to values measured during a bloom period (Conan et al. 1998). Simultaneously, the depth of the nitracline was around 10 to 20 m in April and May, then deepened to 60 to 70 m in June, as usually observed in this area of the Mediterranean Sea.
Distribution of nitrifying activities
Taking into account a complete set of data including biogeochemical as well as hydrological data (and not only primary production values), 2 groups of stations were identified in this NW Mediterranean area (Conan et al. 1999). One group of stations was oligotrophic and included Stns S5, S2 and M3, while Stns B2, B5 and M1 belonged to a rnesotrophic group. Stn 1 was not considered for this analysis.
Fig. 2. Vertical distribution of in situ fluores- cence, nitrite concentration and nitrifying activi- ties in oligotrophic statlons (Euromarge cruise). Nitnfication rates and nitrite concentrations were measured from the same water samples. Error bars are i 1 SE calculated between time zero of 6 nitrite measurements, as in Dore & Karl (1996). This was the error of the nitrite measure. Un- detectable: rate below detection. RFU: relative
fluorescence units

Bianchi et al.: Nitrification in the Mediterranean 27 1
The vertical distributions of nitrifying rates are shown in Figs. 2 & 3. The highest rates of ammonium oxidation were mea- sured in samples close to the peak of nitrite (identified a postenon of the sampling). With increasing depth, the rates decreased when no nitrite was detected (Stn S5 at 190 m; Fig. 2 ) . When sampling was carried out above the peak of nitrite (Stn B2 at 20 m and Stn M3 at 70 m) the rates of nitrifying activities were below the detection level. High rates were also measured at the beginning of the nitracline and just above the phosphacline when there was a gap between the nitracline and the phospha- cline (Fig. 4 , Stn S5). On the other hand, for the samples taken below the nitracline and phosphacline (200 m for Stn S5 and 150 m for Stn B5), no nitrification could be detected with the methodology used.
At Stns S2 and B2 (bottom depth at 110 and 88 m respectively) nitrite oxidation activities increased with depth (Figs. 2 & 3). In shallow stations, the contribution of the bottom nepheloid layer and/or exchanges with the proximate sediment could provide favourable conditions for nitrifying activi- ties. Organic matter produced in the photic layer can quickly reach the sediment, where it is mineralised and provides substrates for nitrifiers as shown by the increase in nitrite concentration (Figs. 2 & 3).
In the Ligurian Sea (Stn l), we sampled at 230 and 250 m depths in addition to the depth of 110 m located near the primary nitrite maximum. These depths corre- sponded to an unexpected deep peak of flu- orescence and to concentrations of nitrite fluctuating between 0.159 and 0.335 pM (Fig. 5). Moreover, these deep peaks coin- cided with high nitrifying activities (Fig. 5).
The geographical distribution of the mean values of nitrification rates in the NW basin of the Mediterranean shows that, except for the Rh8ne River area, these rates ranged from 72
Fig. 3. Vertical distribution of in situ fluores- cence, nitrite concentration and nitrifying activi- ties in mesotrophic stations (Euromarge cruise). Nitrification rates and nitrite concentrations were measured from the same water samples. Error bars are i1 SE calculated between time zero of 6 nitrite measurements, as in Dore & Karl (1996). This was the error of the nitrite measure. Un-
detectable: rate below detection
nM N oxidized d-l
0 50 100 150 200 250 300 1 I
Station B2
, J
c \ I
/ /
/ /
Station B5
r* r - - - - ,
--
l Station M1
250 ' 4
0.0 0.1 0.2 0.3 0.4 0.5 0.6
Fluorescence RFU
--t Nitrite concentra~ion
- - - Fluorescence
N b + oxidation rate
0 N* oxidation

272 Aquat Microb Ecol 17: 267-278, 1999
nM N oxidized d-1 0 50 100 150 200 250 300 I I I I I I
Station B5 \
- Nitrate concentration
- - - - Phosphate concentration
NH4+ oxidation rare
0 N q - oxidation rare
Fig. 4. Example of vertical distribution of nitnfying rates, nitrate and phosphate concentrations (Euromarge cruise). The nitrification rates, nitrite and phosphate concentrations were measured from the same water samples. Error bars are *l SE calculated between time zero of 6 nitrite measurements, as in Dore & Karl (1996). This was the error of the nitrite
EPREII~P 1TnCJ~tertable: rate below detection
to 144 nmol N oxidised 1-' d-'. In the vicinity of the Rh6ne fiver, the rates increased to 264 and 504 nmol N oxidised 1-' d-' because of the direct influence of the riverine in- puts of inorganic nitrogen (Feliatra & Bianchi 1993). These measurements were carried out about 6 km from the mouth of the river, but the extent of the RhBne River influence on nitrification rates of the Gulf of Lions is still not defined. The highest rates of both ammonium and nitrite oxidation at each station were located between 40
and 70 m for the coastal stations (Rhbne, Stns M1, B2 and S2) and 60 and 90 to 100 m for the pelagic stations (Stns 1, M3, B5 and S5) (Figs. 2 to 5).
Short-term fluctuations of nitrifying activities
The short-term fluctuations of nitrifying activi- ties were measured at Stn 1 during the Dynaproc cruise in May. The method used to measure the nitrifying activities included dark incubation in order to: (1) minimise phytoplankton activity on nutrient concentration, and (2) allow similar con- ditions of measurement when water samples were collected during the day or during the night.
During the first period, wind stress which occurred on 13 May (wind speed 16 m S-') in- duced mixing in the upper layer, resulting in an increase in nitrate and a decrease in nitrite con- centrations (Fig. 6: first period). Ammonium oxi- dising activity decreased after the wind stress.
Station I
FM N02- 0.00 0.10 0.20 0.30 0.40
nM N oxidized d-l
0 50 100 150 200
280 I
I I I l I l 1 0.0 0.1 0.2 0.3 0.4 0.5 0.6 0.7
Fluorescence RFU
~l~~~~~~~~~~ a Ammonium oxidation rate
++- Nitrite concentration 0 Niuite oxidation rate
Fig. 5. Vertical distribution of in sjtu fluorescence, nitrite concentration and nitnfying activities at Stn 1 in the Lig- urian Sea (Picnic cruise). Nitrification rates and nitrite concentrat~ons were measured from the same water samples. Error bars are r l SE calculated between tirne- zero of 6 nitrite measurements, as in Dore & Karl (1996).
Thls was the error of the nitrite measure

Bianchi et al.. Nitrification in the Mediterranean 273 -- --p
Firs1 period Second period
---G- No,-
I ?
7.0 ,:Q, : .
, ,
- 6.8 6 0 . Z
,....o e- S.... - . B ..... +." ' 6.6 S
V." '
; 11/09 11/21 12/09 14/13 15/01 15/13 16/01 27/09 27/21 28/09 28/21 30113 31/01 480':
S NH4* oxidation -,R-- NI-L.oxidauon iy 420- O - NO2- oxidation - 0 - NO; oxidation : l
% 360; l - , . 2 . . < . , 3
2 3 3001 # , S l 8 >
8 , Ba - a ,
.- 3 ::m
l 120-1 ; i ;
m: 6 . , l . .
1 . , c7 p !
U ' 11/09 11/21 12/09 14/13 15/01 15/13 16/01 27/09 27/21 28/09 28/21 30113 31/01 31/13 01/01
Time (Day / Hour) T i e (Day / Hour)
Fig. 6. Short-term fluctuations of the nitrite, nitrate concentrations and ammonium and nitrite oxidation rates at Stn 1 in the Lig- urian Sea (Dynaproc cruise). Nitrification rates, nitrite and nitrate concentrations were measured from the same water samples. Error bars are + l SE calculated between time zero of 6 nitrite measurements, as in Dore & Karl (1996). This was the error of the
nitrite measure
Rates of ammonium oxidation did not fluctuate signifi- Table 2 . Average values of ammonium oxidation and nitrite
cantly within each sub-period (before and after wind oxidation rates measured during daylight and during the stress) and the rates of nitrite oxidation were highly niqht at Stn 1. Rates are expressed in nmol of N [ammonium variable (Fig. 6: first period). fo; ammonium oxidation and nitrite for nitrite oxidation)
During the second period, there was no wind (speed oxidized 1-' d-'
<6 m S-'). The nitrate concentrations were higher than during the first period and showed clear fluctuations, while the nitrite concentrations remained at the same values as in the first period (Fig. 6: second period). The rates of ammonium oxidation fluctuated strongly com- pared to the first period; this point will be discussed later. These anlmonium oxidation rates were lower dur- ing the night than those of the first period. As shown in Table 2, for all samples collected during the 2 periods, the average values for nitrite oxidation rates were slightly higher and their fluctuations were less signifi- cant than ammonium oxidation ones (n = 15; p 1 0.05).
Activity Time No. of Mean * SD samples
Ammonium Day 8 218.4 + 156 oxidation Night 7 96.0 r 62.4
Nitrite Day 8 153.6 r 79.2 oxidation Night 7 201.6 r 115.2
Ammonium Total 15 160.8 * 134.4 oxidation
Nitrite Total 15 177.6 * 96 oxidation

274 Aquat Microb Ecol 17: 267-278, 1999
DISCUSSION
In the area of the Mediterranean Sea in which we investigated, the highest nitrification rates occurred around 50 In. Generally, most nitrification occurs near the bottom of the photic zone (Ward et al. 1989). We found the maximum rate of ammonium oxidation at depths near the peak of nitrite, as reported for the Alb- oran Sea (Bianchi et al. 1994b), in the Algerian current of SW Mediterranean (Gentilhomme & Raimbault 1994) and in the Pacific and Austral oceans (Olson 1981a, b, Ward 1987). Although our data are sparse, we found the highest rates of nitrification around the nitra- cline and the phosphacline (Fig. 4). One characteristic of the vertical nutrient profiles during summer in the Mediterranean Sea is a displacement between the nitr- acline and the phosphacIine, which is located 10 to 40 m deeper (Berland et al. 1988, Conan 1996). This anomaly has also been described in the Pacific Ocean by Bienfang & Szyper (1981) and in the Atlantic Ocean (Pujo-Pay & Raimbault 1994). There is currently no sat- isfactory explanation for such a discrepancy. An in- creasing uptake of phosphate from the surface to the bottom of the photic layer was noted by Herbland (1984) and Herbland & Voituriez (1977) in tropical waters.
Unfortunately, phosphate requirements of nitrifying bacteria in natural environments is poorly docu- mented. For pure cultures of Nitrosomonas and Nitro- bacter, the optimum phosphate concentrations ranged from 10 to 100 mM (Van Droogenbroeck & Laudelout 1967). Such concentrations are far from the natural seawater ones. Phosphorus limitation in a nitrification process has been recently described by Nordeidet et al. (1994) in biofilm reactors. If the phosphate require- ments of nitrifiers are not negligible, as suggested by their needs in pure culture, we could expect that these bacteria may contribute to the deepening of the phos- phacline compared to the nitracline.
The present results show that when samples were taken above the depth of the peak of nitrite (Stn M3, Fig. 2; Stn B2, Fig. 3) the nitrification rates were below a detectable level. Two possible explanations can be evoked for this lack of nitrification in the superficial !;ycr: (1) ar: ir:hih:ticfi d ~ e linht anrl/nr to corn- -->--- - - pounds photochemically produced (Horrigan et al. 1981, Olson 1981b, Vanzella et al.. 1989), and (2) a lack of ammonium providing energy source for nitrifiers (Olson 1981a, Ward 1985). At Stn 1 (50 m), short-term variations of nitrifying rates were found (Fig. 6). Although the incubations m7ere done in the dark for all samples, fluctuations of nitrifying activities were seen between day and night samples. The average values of ammonium oxidation rates during the day were signif- icantly greater (p 1 0.01), about twice the rates mea-
sured during the night (Table 2). Nitrite oxidation rates were slightly, but significantly, higher (p 5 0.01) during the night (Table 2). It seems that the 'direct' light effect may not be the major factor implicated in these fluctu- ations as, at this depth of 50 m, in the Mediterranean Sea, the light intensity was about 0.8 to 1 % of the sur- face light, corresponding to about 3 to 7 W m-' during the Dynaproc cruise (J. Raunet pers. comm.). Such light intensity is low compared to the value of 50 W m-' cited by Vanzella et al. (1989) as inhibiting ammonium oxidation.
On the other hand, biological processes, with a diur- nal cycle, may have played an important role. For example, Van Wambeke et al. (unpubl.) found that bacterial heterotrophic production followed a day- night cycle before the wind stress (11 to 12 May) dur- ing the first period and during all of the second period (27 to 28 May and 30 May to 1 June), but not after the wind stress (14 to 16 May) of the first period. The pro- duction of heterotrophic bacteria, which are responsi- ble for mineralisation processes, dropped drastically after this wind-induced mixing. Concomitantly, be- tween 14 and 16 May, ammonium oxidation rates decreased and the fluctuations of nitrifying activities were the lowest. Possibly, the contribution of het- erotrophs to the production and the consumption of ammonium decreased. The rapid response of nitrifica- tion rates to water mixing suggests a combination of factors, including a shortage of the energetic substrate, i.e. ammonium (Olson 1981a, Ward 1985). In fact, it seems that when the physical processes (wind-induced mixing in our case) were able to overcome the biologi- cal processes they induced a levelling (at least appar- ent) of bacterial processes. Furthermore, depending on the depth of sampling, nitrification rates fluctuated from undetectable to more than 150 nmol N oxidised 1-' d-' in 20 m (Stn M3, Fig. 2; Stn B2, Fig. 3). This vari- ability points out the necessity to multiply, as much as possible, the samples done for one station and, simul- taneously, to take into account the hydrological and biological context of the sampling.
In the NW basin, oxidation rates ranged from 72 to 144 nmol 1-' d-' at a depth corresponding to the top of the nitracline. Higher rates were reported in previous s t i ~ r f i e s for specific areas like the RhBne River plume (4 to 6 times) by Bianchi et al. (1994b) and in the Algerian basin (10 to 90 times) by Gentilhomme & Raimbault (1994). In both cases, increased concentrations of nutri- ents were noted, due to riverine inputs in the first case and to vertical advection from the frontal area of the Algerian current in the latter case. At depths greater than 50 m in the Mediterranean Sea, the temperature of the water column down to the bottom is close to 13°C all year round. This typical feature induces a dis- tribution of the nitrification depending mostly on the

Bianchi et a1 : Nitnficatlon In the Mediterranean
availability of substrate. This could be an explanation for the similar rates measured at diverse pelagic sam- pling stations during the same season. However, hydrological dynamics can play an important role in the instantaneous rates of nitrification; vertical and/or lateral advection of waters (Conan & Millot 1995) con- taining more nutrients or fresh organic matter (Pujo- Pay et al. 1995, Conan 1996) are associated with higher rates.
In most of the cases, at pelagic stations where the sea bottom was deeper than 1000 m (Stns S5, B5 and M3), both nitrifying activities dropped to below detectable limits when samples were taken below the peak of nitrite. Few measurements of nitrification rates have been performed deeper than 100 to 150 m in the water column. Detectable rates of ammonium oxidation were measured between 500 and 1000 m in the tropical North Pacific by Ward & Zafiriou (1988). In the same oceanic area, Ward (1987), Ward et al. (1989) and Lip- schultz et al. (1990) demonstrated that ammonium oxi- dation decreased sharply from the depth of the pri- mary nitrite maximum to a low and fairly constant rate, while nitrite oxidation rates still demonstrated detect- able values and fluctuations deep in the water column.
Deep measurements were carried out at Stn 1 (Lig- urian Sea). Rates ranging between 50 to 150 nmol 1-' d-' coincided with a small peak of fluorescence around 250 m depth. Such a slight but clear increase of fluo- rescence suggested the presence of phytoplanktonic cells. The phytoplankton could have come from the surface layer associated with either a particulate flux or water advection. In the same samples as those used for nitrification measurements, bacterial numbers and heterotrophic activities also peaked (Iriberri et al. 1995, Turley 1995), strengthening the hypothesis that organic matter mineralisation at this depth provided detrital NH,' for nitrification. In all other cases, both nitrifying activities dropped to below a detectable limit in the water column.
Nitrification rates were measured during bloom and transition from bloom to oligotrophy regimes included in the 6 trophic regimes described throughout an annual cycle for the Mediterranean Sea by Levy et al. (1998). The appearance of the oligotrophic regime was demonstrated by the increasing depth of the chloro- phyll maximum from 10 to 30 m (April) to 50 to 80 m (end of June), indicating that the surface layer was being depleted of nutrients (Conan 1996). The depth at which the concentration of NO3- was 21 p M increased from 15-25 m (Ligurian Stn 1, April) to more than 70 m (Balearic site, end of June). The possible contribution of nitrification processes to the in situ concentrations of nitrite and nitrate was estimated. Nitrite produced daily by ammonium oxidation accounted for 30 to 100% of the nitrite concentration around the nitrite
maximum layer. This contribution is higher than the contribution of l 0 to 60 % noted by Ward (1987) in olig- otrophic waters of the Pacific Ocean. Nitrate produced daily by nitrite oxidation corresponded to 7-20% of the nitrate concentration at the beginning of the nitra- cline, a contribution lower than the 33 "/;, measured by Ward (1987). Due to the complexity of interactions between assimilatory and oxidation processes of inor- ganic nitrogen, particularly in the layer of low light intensity, it is difficult to give typical values for fluxes corresponding to each process.
In the classical distinction between regenerated and new production, the origin of nitrate in the euphotic zone is really essential. The nitrate injected in the sur- face layer leads to new production, but 'surface in situ recycled nitrate' (i.e. produced by nitrification in the euphotic layer) leads to regenerated production. So, if nitrification is not considered, new production is dras- tically overestimated from 20 to loo%, as shown by Raimbault et al. (1998) in the equatorial Pacific. In this case, the nitrification has a huge effect on the calcula- tion of the 'f factor', which corresponds to the ratio of new and total production generally estimated using l iN methods. In order to estimate the contribution of nitrate produced by nitrification to the N demand of primary producers, an integrated production of nitrate was calculated for Stns B2, M3 and S5 (Table 3). For
Table 3. Contnbution of the flux produced by nitnficatlon to the diffusive flux In the nitracllne at Stns B2, M3 and S5 of the
Euromarge cruise. K,,: turbulent dlffusion coefficient
Station: B 2 M3 Depth (m)". 20-40 70-90 40-60 I
K, ( 1 0 - ~ m' S-') 3.0 5.3 No3- diffusion 0.443 0.363 0.119 (mmol m-2 d- ')
Nitrification (rnn~ol m-' d-'lb
Primary production (for 5-40 m) (for 5-90 m ) (for 5-60 m) (mg C m-' d.') 406 377 187 1 Corresponding N demand (mmol m d : )C
Contribution of NO; diffusion to the N demand (%)
Contribution of nitriflcatlon to the N demand (%)
"Depths of integration for NO3- dlffusion and integrated nitrification calculations
"0; produced by nitrification for the corresponding layer 'Calculated using I4C estimation and C/N = 6.6

276 Aquat Microb Ecol 17: 267-278, 1999
nitrifying activities, we were not able to carry out the measurements every 10 m, as was done for the deter- mination of nitrogen compounds, and the sampling depths for measurements of nitrification were decided by considering the bottom of the peak of fluorescence determined in real time by CTD casts. Therefore, only for Stns B2, M3 and S5, all parameters (primary pro- duction, N demand and nitrate diffusion) were avail- able at the same depth as nitrification rates. Primary production increased from Stn S5 (187 mg C m-' d-l), to Stn M3 (377 mg C m-' d-') through to Stn B2 (406 mg C m-2 d-l), revealing a trophic gradient (Table 3). The vertical flux of nitrate estimated at the base of the photic layer followed the same pattern (0.119, 0.363 and 0.443 nmol m-' d-l, for Stns S5, M3 and B2 respec- tively), so too did the contribution of the diffusive pro- cess, increasing from 5 (Stn S5) to 9% (Stn B2). Such calculations do not take into account the input by advection (Conan et al. 1999) and 'pulses' (Klein &
Coste 1984). Conversely, nitrate production by nitrifi- cation increased from Stns B2 to M3 and S5 (Table 3). As a consequence, the calculated contribution of nitri- fication to the N demand in the surface layer was 16% at Stn B2, but reached 61 % at the most oligotrophic station, Stn S5 (Table 3).
The highest contribution of nitrification to the N demand (61 %) was measured in the most oligotrophic station, although this value was lower than those pub- lished by Dore & Karl (1996), who estimated a contri- bution of the nitrification to the gross nitrate + nitrite assimilation rate from 47 to 142 % for the oligotrophic Stn ALOHA, a North Pacific deep water site. In addi- tion, in the Pacific Ocean, Raimbault et al. (1998) showed an overestimation of 20 to 100% of the new production when nitrification was not taken into account. In less oligotrophic areas, such as Stn M3, the contribution of nitrate regenerated by nitrification was 27%. This value is close to fluxes of regenerated nitrate from nitrification (23 % of the nitrogen assimi- lated at the chlorophyll maximum) established by Gen- tilhomme (1992) in the Algerian Basin, which shows high concentrations of chlorophyll. At the eastern boundary of the Alboran Sea (eastern area of the Gibraltar Strait), a possible contribution of about 40 % of the zitrlte pr~dncer t h11 nitrifiratinn was calculated in the surface Atlantic water for which the nitrite con- centrations were high (>0.20 pM) and the nitracline was around 60 m (Bianchi et al. 1994b).
In the NW Mediterranean basin, the distribution of nitrifying activity displays a patchiness similar to that of trophic richness. In the Rh6ne River plume area, due to inputs of ammonium by the river waters, the rates of nitrification were the highest of the zone. Previously, Bianchi et al. (1994a) estimated that 15% of the allochthonous NH4+ was nitrified in the plume area,
contributing to the nitrate enrichment of the surround- ing marine waters. In pelagic areas, far from the influ- ence of the RhBne River, the flux of nitrate originating from nitrification showed an increasing contribution to nitrate uptake by primary producers as the oligotrophy increased, from 25 to 30% in mesotrophic areas like the Gulf of Lions in the north and the Algerian current or the Alboran Sea in the south to more than 60% in the very oligotrophic site of the Balearic Islands.
Acknowledgements. The 2 cruises Picnic (EMPS project cruise, cruise leader M.B., RV 'Tethys 11') and Euromarge (cruise leader X. Durrieu de Madron, RV 'Le Suroit') were organised within the Mediterranean Targeted Project. The Dynaproc cruise (cruise leader V. Andersen, RV 'Le Suroit') was performed within the French programme DYFAMED. We are grateful to M. Picheral, L. Steeman, G. Gorsky, V. Martin and X. Durrieu de Madron, who carried out CTD measure- ments. We are pleased to thank Dr Carol Phillips for helpful comments and correction of the English language. We also express our thanks io the rlnolilynlous review-ers, as we:: as to Dr John Dolan, for their comments and corrections. This research has been undertaken in the framework of the Mediterranean Targeted Project (MTP) - EMPS project. We acknowledge the support from the European Commission's Marine Science and Technology (MAST) Programme under contract MAS2-CT94-0090.
LITERATURE CITED
Andersen V, Baker M, Nival P (1990) Vertical flux of matter from the upper layer of the sea. Abstracts of JGOFSAGBP meeting on modehng the physics, biology and chemistry of the upper ocean, and its interaction with the atmos- phere, 12-13 March 1990. Book of Abstracts, London
Bedard C, Knowles R (1989) Physiology, biochemistry, and specific inhibitors of CH,, NHdt, and CO oxidation by methanotrophs and nitrifiers. Microbiol Rev 53:68-84
Bendschneider K. Robinson RJ (1952) A new spectrophoto- metric method for the determination of nitrite in seawater. J Mar Res 11:87-96
Berland BR, Bonin DJ, Maestnni SY (1980) Azote ou phos- phore? Considerations sur le paradoxe nutritionnel de la Mer Mediterranee. Oceanol Acta 3:135-142
Berland BR, Benzhitsky AG, Burlakova ZP, Georgieva LV, Izmestiev AMA, Kholodov W, Maestnni SY (1988) Condi- tions hydrologiques estivales en Medlterranee, repartition du phytoplancton et de la matiere organique. In: Minas HJ, Nival P (eds) Oceanographie pelagique rnediter- raneenne. Oceanol Acta 1, No. Spec 9:163-179
Bethoux JP, Morin P, Madec C, Gentili B (1992) Phosphorus and nitroaen behaviour In the Mediterranean Sea. Deep- Sea Res 39:1641-1654
Bianchi M, Bonin P, Feliatra (1994a) Bacterial nitrification and denitnfication rates in the Rhbne River plume (northwest- ern Mediterranean Sea). Mar Ecol Prog Ser 103:197-202
Bianchi M, Morin P, Le Corre P (1994b) Nitnfication rates, nitrite and nitrate distribution in the Alrneria-Oran frontal systems (eastern Alboran Sea). J Mar Syst 5:327-342
Bianchl M, Feliatra, Treguer P, Vincendeau MA, Morvan J (1997) Nitnflcation rates, ammonium and nitrate dlstribu- tion in upper layers of the water column and in sediments of the Indian sector of the Southern Ocean. Deep-Sea Res 44 1017-1032
Bianchi et al.: Nitrification ~n the Mediterranean 277
Bienfang PK, Szyper JP (1981) Phytoplankton dynamics in the subtropical Pac~fic Ocean off Hawaii. Deep-Sea Res 28A (9):981-1000
Conan P (1996) Vanabilite et bilan de la production prirnaire en zone cdtiPre (Mediterranee Nord occidentale, entree du golfe du Lion) en relation avec les systemes biologique, chirnique et hydrodynamique (Courant Nord Mediter- raneen). These de 1'Universitb de la Mediterranee. Aiu- Marseille I1
Conan P, Millot C (1995) Variability of the Northern Current in the Western Mediterranean Sea from February to June 1992. Oceanol Acta 18:193-205
Conan P, Pujo-Pay M, Raimbault P, Leveau M (1998) Variabil- ite hydrologique et biologique au sein du Courant Nord Mediterraneen a l'entree du golfe du Lion. I. Bilan annuel des transports en azote et productivitk potentielle. Oceanol Acta 21:751-765
Conan P, Turley C, Stutt E, Pujo-Pay M, Van Wambeke F (1999) Relationship between phytoplankton efficiency and the proportion of bacterial production to primary produc- tion in the Mediterranean Sea. Aquat Microb Ecol 17: 131-144
Coste B, Le Corre P, Minas HJ (1988) Re-evaluation of the nutrient exchanges in the Straits of Gibraltar. Deep-Sea Res 35:767-775
Cruzado A, Velasquez ZR (1990) Nutrients and phytoplank- ton in the Gulf of Lions, northwestern Mediterranean. Cont Shelf Res 10:931-942
Dandonneau Y, Le Bouteiller A (1992) A simple and rapid device for measuring planktonic primary production by in situ sampling, and 14C injection and incubation. Deep-Sea Res 39:795-803
Denman KL, Gargett AE (1983) Time and space scales of ver- tical mixing and advection of phytoplankton in the upper ocean. Limnol Oceanogr 28:801-815
Dillon TM, Caldwell DR (1980) The batchaloo spectrum and dissipation in the upper ocean spectrum. J Geophys Res 87:9601-9613
Dore JE, Karl DM (1996) Nitrification in the euphotic zone as a source for nitrite, nitrate, and nitrous oxide at Station ALOHA. Limnol Oceanogr 41:1619-1628
Dugdale RC, Goering JJ (1967) Uptake of new and regener- ated forms of nitrogen in primary productivity Limnol Oceanogr 12:196-206
Fellatra, Bianchi M (1993) Rates of nitrification and carbon uptake in the RhBne river plume (Northwestern Mediter- ranean Sea). Microb Ecol26:21-28
Gentilhomme V (1992) Quantification des flux d'absorption et de regeneration de l'azote mineral (nitrate, nitrite, ammo- nium) et organique (urke) dans la couche euphotique des oceans oligotrophes. These de 1'Universite Aix-Marseille I1
Gentilhomme V, Raimbault P (1994) Absorption et regenera- !ion de l'azote dans la zone frontale du courant Algerieil (Mediterranee Occidentale): reevaluation de la produc- tion nouvelle. Oceanol Acta 17:555-562
Herbland A (1984) Phosphate uptake in the euphotic layer of the Equatorial Atlantic Ocean. Methodological observa- tions and ecological significance. Oceanogr Trop 19:25-40
Herbland A, Voituriez B (1977) Production primaire, nitrate et nitrite dans 1'Atlantique tropical. I-Distnbution du nitrate et production primaire. Cah ORSTOM Ser Oceanogr 15:47-55
Holm-Hansen 0, Riemann B (1978) Chlorophyll a deterrnina- tion: improvements in methodology. Oikos 30:438-447
Horrigan SG, Carlucci AF, Williams PM (1981) Light inhibition of nitrification in sea surface films. J Mar Res 39:151-166
Hynes RK, Knowles R (1983) Inhibition of chemoautotrophic nitrification by sodium chlorate and sodium chlorite. a reexamination. Appl Environ Microbiol45:1178-1182
Iriberri J , Unanue M. Ayo B (1995) Heterotrophic activity and glucose uptake and mineralization. In: Bianchi M (ed) Mediterranean Targeted Project, European Microbiology of Particulate Systems (MTP-EklPS) project first annual report, Partner no. 4. EC Contract MAS2-CT94-0090, Mar- seille
Jacques G (1989) L'oligotrophie du milieu pelagique de Medi- terranee Occidentale: 'un paradigme qui s'estompe?'. Bull Soc Zoo1 Fr 114:18-30
Klein P, Coste B (1984) Effects of wind stress variability on nutrient transport into the mixed layer. Deep-Sea Res 31. 21-27
Levy M, MCmery L, Andre JM (1998) Simulation of primary production and export f l u e s in the NW Mediterranean Sea. J Mar Res 56:197-238
Lipschultz F, Wofsy SC, Ward BB, Codispoti LA, Friedrich G, Elkins JW (1990) Bacterial transformations of inorganic nitrogen in the oxygen-deficient waters of the Eastern Tropical South Pacific Ocean. Deep-Sea Res 37: 1513-1541
Minas HJ, Co&spoti LA (1993) Estimation of primary produc- tion by observation of changes in the mesoscale nitrate field. ICES Mar Sci Symp 197:215-235
Minas HJ, Minas M, Coste B, Gostan J, Nival P, Bonin D (1988) Production de base et de recyclage; une revue de la problematique en Mediterranee Nord-Occidentale. Oceanol Acta 9:155-162
Murphy J , Riley JP (1962) A modified single solution method for determination of phosphate in natural waters. Anal Chirn Acta 27:31-36
Nordeidet B, Rusten B, Odegaard H (1994) Phosphorus requirements for tertiary nitrification in a biofilm. Water Sci Technol29:77-82
Olson RJ (1981a) I5N tracer studies of the primary nitrite max- imum. J Mar Res 39:203-226
Olson RJ (1981b) Differential photoinhibition of nitrifying bacteria: a possible mechanism for the formation of the primary nitrite maximum. J Mar Res 39:227-228
Pujo-Pay M, Raimbault P (1994) Etude de la relation nitrate / phosphate dans la recherche du facteur nutritionnel limi- tant des eaux de 1'Atlantique tropical. J Rech Oceanogr 19:150-156
Pujo-Pay M, Conan P, Raimbault P (1995) Particulate and dis- solved organic nitrogen and phosphorus in the northwest- ern Mediterranean Sea (Eros 2000-Discovery cruise 1993). In: Martin JM, Barth H (eds) Water pollution research reports, 'EROS 2000', Vol32. European Commission. Lux- embourg, p 79-86
Rairnbault P, Slawyk G, Boudjellal B. Coatanoan C, Conan P, Coste B, Garcia N, Moutin T. Pujo-Pay M (1998) Carbon d ~ l d nitrogen uptake and export in the equatorial Pacific a t 150°W: evidence of an efficient regenerated production cycle. J Geophys Res 104:3341-3356
Smorczewski WT. Schrnidt EL (19911 Numbers. activities. and . ,
diversity of autotrophic ammonia-oxidizing bacteria in freshwater, eutroahic lake sediment. Can J Microbiol 37: 828-833
Steemann-Nielsen E (1951) Measurement of the production of the organic matter in the sea by mean of carbon 14. Nature 167:684-685
Turley C (1995) Bacterial biomass and production. In: Bianchi M (ed) Mediterranean Targeted Project, European Micro- biology of Particulate Systems (MTP-EMPS) project first annual report, Partner no. 5. EC Contract MAS2-CT94-

278 Aquat Microb Ecol 17: 267-278, 1999
0090, Marseille Treguer P. Le Corre P (1975) Manuel d'analyse des elements
nutntifs dans l'eau de mer (utilisation de l'autoanalyseur I1 Technicon). Universlte Bretagne Occidentale, Brest
Van Droogenbroeck R , Laudelout H (1967) Phosphate requirements of the nitrifying bacteria. Antonie Leeuwen- hoek 33:287-296
Vanzella A, Guerrero MA, Jones RD (1989) Effect of CO and light on ammonium and nitrite oxidation by chemolitho- trophic bacteria. Mar Ecol Prog Ser 57~69-76
Ward BB (1985) Light and substrate concentration relation- ships with ammonium assimilation and oxidation rates.
Editorial responsibility: John Dolan, Villefranche-sur-Mer, France
Mar Chem 16:301-316 Ward BB (1987) Nitrogen transformations in the Southern
Cal~fornia Bight. Deep-Sea Res 34:785-805 Ward BB, Zafiriou OC (1988) Nitrification and nitric oxide in
the oxygen minimum of the eastern trop~cal North Pacific. Deep-Sea Res 35:1127-1142
Ward BB, Kilpatrick KA, Renger EH, Eppley RW (1989) Bio- logical nitrogen cycling in the nitracline. Limnol Oceanogr 34.496-513
Wood EPK, Armstrong FAJ, Richards FA (1967) Determlna- tion of nitrate in seawater by cadmium copper reduction to nitrlte. J Mar Biol Assoc UK 47:23-31
Submitted: February 24, 1998; Accepted: October 29, 1998 Proofs received from author(s): May 31, 1999