Embed Size (px)
Citation preview
2012
International Summer Water Resources Research School
Dept. of Water Resources Engineering, Lund University
Nitrification of saline sewage water in biofilter packed with oyster shells
By Kajsa Nilsson 2012-07-10
Instructor: Professor Xiaojing Xiong Assistants: Jie Xu and Xi Chen
2
Abstract
Fresh water shortages in the world create new challenges to save water and one of them
could be to use seawater as toilet-flushing. This in its turn causes a new, saline, condition
when treating sewage water. In this project the performance of nitrifying bacteria in
addition of oyster shells as packing biofilter has been investigated at different influent
seawater ratios using the sequencing batch reactor (SBR) method. The results showed that
with an influent ammonia concentration of 50mg/L the removal efficiency of ammonia in
seawater ratios from 0 to 100% all were above 99% during 24 hours. It was also found that
for sea water ratios from 40 to 70% the ammonia removal efficiency was above 95% after
only 5 hours residence time. This indicates that nitrifying bacteria could adapt to and
tolerate a relatively high salinity.
Key words: nitrification, saline sewage treatment, oyster shell packing biofilter, seawater ratio
Nitrification of saline sewage water in biofilter packed with oyster shells
3
Table of Contents Abstract ................................................................................................................................................... 2
Introduction ............................................................................................................................................. 4
Aim ...................................................................................................................................................... 4
Background .......................................................................................................................................... 4
Nitrification ...................................................................................................................................... 5
The nitrifying bacteria ..................................................................................................................... 5
The operation method .................................................................................................................... 6
The biofilm carriers.......................................................................................................................... 6
Limitations ........................................................................................................................................... 6
Methodology ........................................................................................................................................... 7
Nutrition .............................................................................................................................................. 8
Changing water.................................................................................................................................... 9
Testing NH4+-N .................................................................................................................................... 9
UV spectrometer ........................................................................................................................... 10
Results ................................................................................................................................................... 10
Discussion and analysis ......................................................................................................................... 12
Conclusions ............................................................................................................................................ 13
Acknowledgments ................................................................................................................................. 13
References ............................................................................................................................................. 14
Appendix ................................................................................................................................................ 15
Nitrification of saline sewage water in biofilter packed with oyster shells
4
Introduction Sewage water does normally go to a treatment plant where it is treated in several steps in order to
obtain a certain quality. In the treatment steps chemical or biological methods can be used. One of
these steps in the treatment plant works to reduce the amount of ammonia coming with the sewage
water from toilet-flushing. 1 Current biological treatment methods in the sewage treatment plant are
the activated sludge method and the biofilter method. If the ammonia is not reduced it can, once in
the nature, cause unbalance in the ecosystem or even eutrophication. Another difficulty in the world
is the water shortages in many parts of the world that has become an urgent task to solve. Instead of
using fresh water to flush toilets, a solution could be to use seawater. This creates a new challenge in
the treatment plant since the bacteria used in the biological method for reducing ammonia might be
inhibited by the higher salinity of the sewage water.
This project is focusing on the biofilter method where nitrifying bacteria is used to reduce the
ammonia concentration in the sewage water by degrading ammonium to nitrate. The biofilter is used
since it is believed to be an effective method treating saline sewage water.
This is a project where the nitrification degree of the two nitrifying bacteria nitrosomonas and
nitrobacter, with the usage of oyster shells as biofilm carriers, has been evaluated in vessels working
in a sequencing batch reactor mode and filled with different concentrations of sea water. The
ammonia influent concentration has been 50mg/L. The usage of oyster shells as biofilm carriers
provides a naturally high pH in the water by dissolving CaCO3 from the shells.
Aim The aim of this project is to discover the nitrification degree of the two bacteria nitrosomonas and
nitrobacter in the existence of sea water in order to get some information of how to treat saline
sewage water. Oyster shells are used as biofilm carriers and vessels are used with different
concentrations of seawater.
Background The consumption of food by humans is leading to an excess of various nutrients in the body that has
to be removed by urine. The urine is produced by the kidneys. Among other things, the kidneys
produce urea, a waste product that is produced in the body to eliminate the toxic ammonia
produced in the liver out of excessive amino acids which consists of mainly nitrogen. 2 Two ammonia
molecules and one carbon dioxide molecule forms the urea molecule.3 When flushing the toilet the
urea comes with the water to the water treatment plant. In water the urea dissolves into ammonium
and if it is not removed in the treatment plant it will be let out into the nature. Once in the nature
the ammonia will work as fertilizer and can favor specific organisms, causing an unbalance in the
nature and maybe even cause eutrophication.4 That is where this project comes in.
When using seawater as toilet-flushing water in countries with fresh water shortages the treatment
plant has to be designed in order to be able to reduce the ammonium concentration in water with
1 Avgifta Avloppet
2 National Space Biomedical Research Institute
3 Curtis J. Overdahl et al
4 Eco-Impact, Bioremediation and Mould Experts
Nitrification of saline sewage water in biofilter packed with oyster shells
5
higher salinity. Since the nitrifying bacteria are very sensitive to its environment it will need special
conditions in order to grow and thus degrade ammonia. The optimal conditions for such a treatment
plant are evaluated in this project. The presence of oyster shells provides a large surface area for the
bacteria to attach to and they do also dissolve CaCO3 with increases the alkalinity and no other buffer
needs to be added.
Toilet-flushing with seawater has already been incorporated in some parts of China. The coastal cities
Qingdao, Dalian and Hong Kong are already using this method to save fresh water.5 A large scale sea
water treatment plant was built in the city of Thangshan in 2010 but they are using a desalination
method and the water is cleaned in an ultra filtration system.6
Nitrification
The nitrification process is a part of the nitrogen cycle that is one of the major biogeochemical cycles
on earth. Nitrogen is an important nutrient for organisms since it has an essential part of e.g. DNA
and proteins. In the nitrogen cycle the atmospheric nitrogen gas, N2, is fixated by nitrogen-fixating
bacteria, working in a symbiotic relationship with host plants, and provides the plants with the
fixated nitrogen in form of ammonium, NH4+. The ammonium is then incorporated into the plants as
organic nitrogen, org-N. When organisms higher up in the food chain eats the plant they will thus get
their essential nitrogen from the nitrogen initially coming from the atmosphere. When the organism
dies the process called the nitrogen mineralization occurs, where the org-N is converted back to
inorganic nitrogen. Bacteria and fungi decompose the dead organism and consume the org-N and
convert it into NH4+. This way the nitrogen is once again accessible for plants to take up or for further
transformation into nitrate, NO3-, through the process called nitrification.7
The nitrification process is a two-step process where the NH4+ is converted into NO3
- by nitrifying
bacteria such as nitrosomonas and nitrobacter. Firstly the nitrosomonas convert the NH4+ into nitrite,
NO2- , and then the nitrobacter finishes the conversion by converting the NO2
- into nitrate, NO3-.
These specific bacteria gains energy by converting the compounds and only perform in the presence
of oxygen. The two steps occur simultaneously and therefore the amount of NO2- is usually very low.8
The nitrifying bacteria cannot utilize organic material and demands inorganic salts dissolved in the
water in order to grow and they also need a carbon source.9
Denitrification is the final main process of the nitrogen cycle where oxidized forms of nitrogen, such
as NO3- and NO2
-, are converted into the gaseous forms of nitrogen, N2 and N2O, and thus the cycle is
closed. The process is carried out by denitrifying bacteria who demands both a carbon source and an
anaerobic condition.10
The nitrifying bacteria
The nitrifying bacteria are favoring specific conditions in their environment and factors affecting their
nitrification ability are the pH, salinity, temperature, alkalinity and oxygen concentration. If for
5 China Daily
6 Flow Control
7 Visionlearning
8 The Water Planet Company
9 Biocon Labs Inc.
10 Visionlearning
Nitrification of saline sewage water in biofilter packed with oyster shells
6
example the pH is too low or the temperature is too high, the rate of nitrification decreases. In order
to optimize the nitrification rate in a treatment plant, the parameters mentioned above has to be
controlled in combination with the residence time of the sewage water.11 The bacteria needs specific
ions dissolved in the water to be able to grow and that is solved by adding nutrition to the water.
The operation method
In this project an operation method called the sequencing batch reactor (SBR) has been used. That
means that the treated water has been changed continuously and that a time cycle has been
simulated for the bacterial growth.
The biofilm carriers
In this project oyster shells are used as biofilm carriers. The oyster shells are a large waste product
from the fishing industry and can be of excellent use in this matter. The oyster shells dissolve CaCO3
in water and thus maintain a pH above 7 which is favorable for the nitrifying bacteria. Most studies
on biological ammonia treatment have been carried out at pH above 7 and usually NaOH or Na2CO3 is
added to provide this pH. When used in an aeration biofilter the oyster shells provides a more stable
nitrification procedure than when traditional plastic material is used and tests has been done were
biofilter packed with oyster shells has presented higher ammonia removal efficiency than the
traditionally used plastic carriers where NaOH is added.12
Limitations Due to the time limit of four weeks in this project, the focus of this report has been on the tests of
the nitrosomonas ammonium degradation, thus the conversion of NH4+ into NO2
-. Although, the
whole project has been covering the conversion of NO2- into NO3
- as well that methodology will not
be covered in this report but some of these results are included to give a larger view of the test
results. The final elimination of nitrogen in a water treatment plant is usually done with
denitrification, and that is an interesting aspect that is not covered in this project.
11
The Water Planet Company 12
XIONG, X. et al
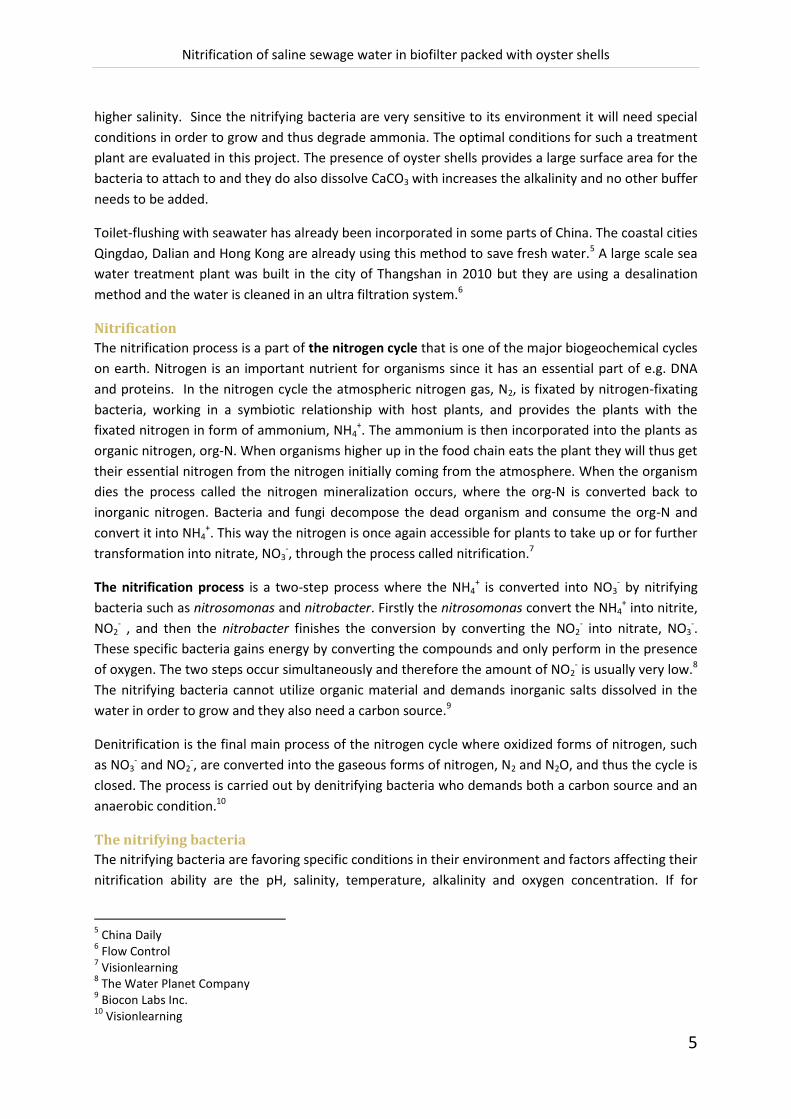
Figure 1 The bacteria attached to the oyster shell
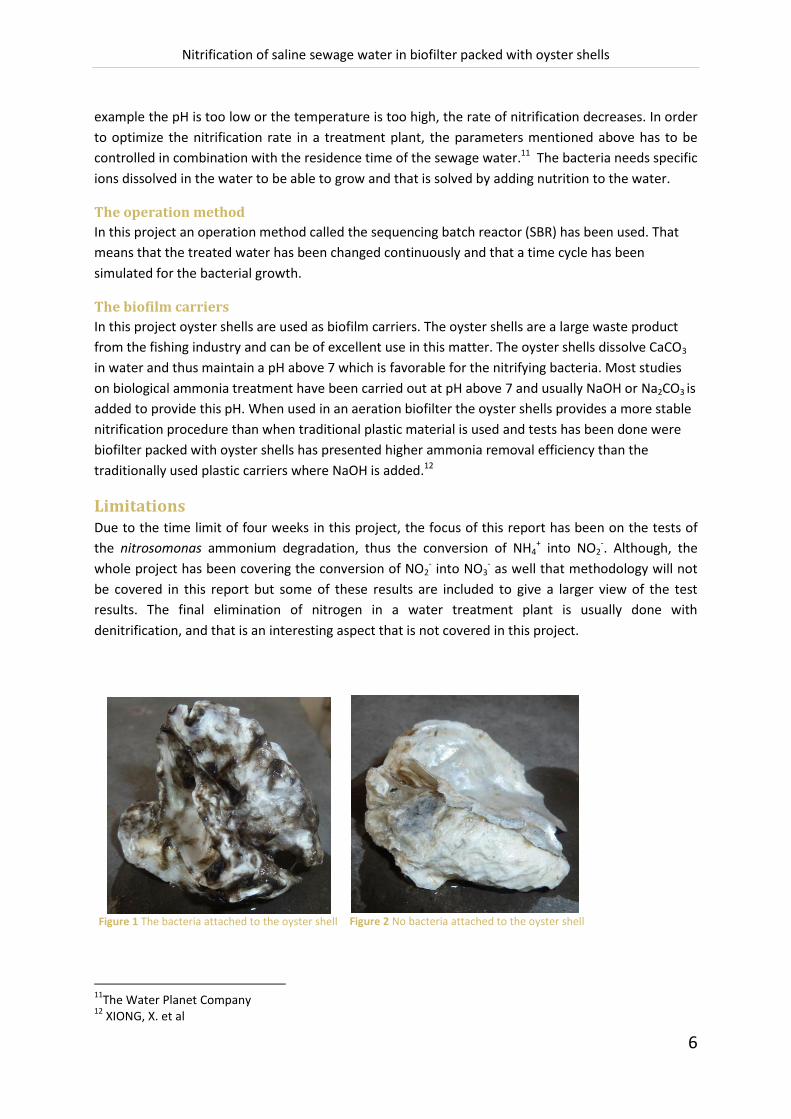
Figure 2 No bacteria attached to the oyster shell
Nitrification of saline sewage water in biofilter packed with oyster shells
7
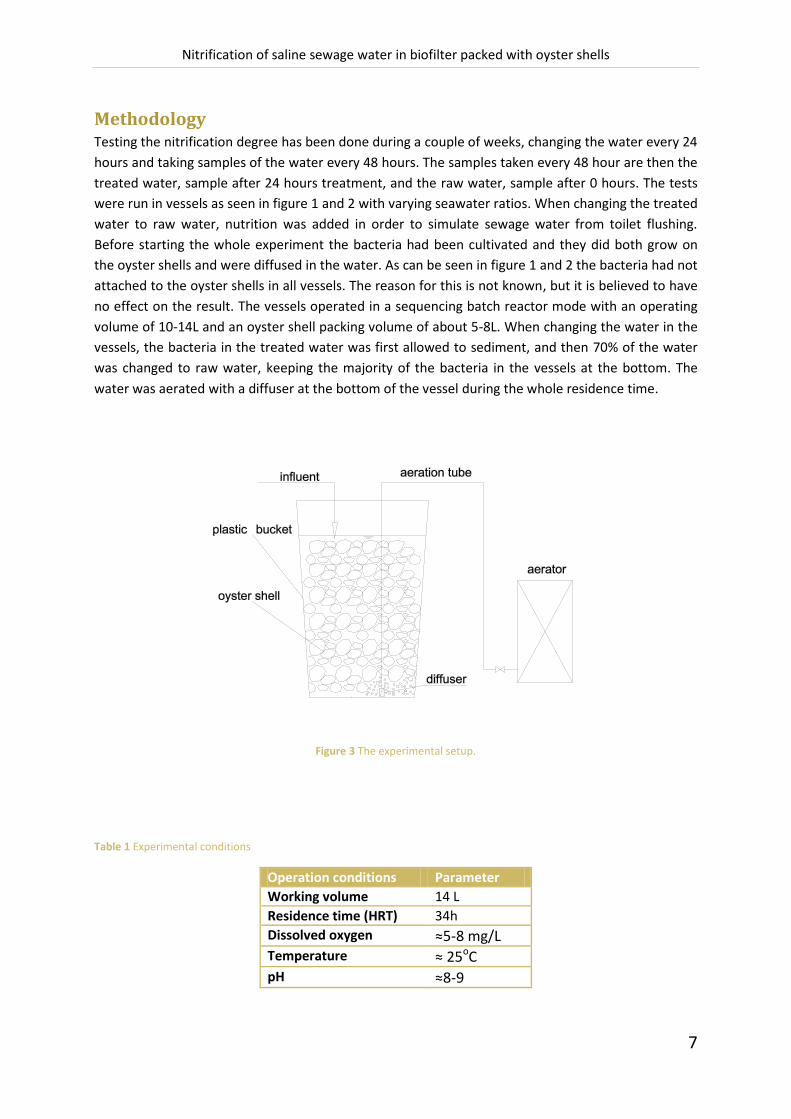
Methodology Testing the nitrification degree has been done during a couple of weeks, changing the water every 24
hours and taking samples of the water every 48 hours. The samples taken every 48 hour are then the
treated water, sample after 24 hours treatment, and the raw water, sample after 0 hours. The tests
were run in vessels as seen in figure 1 and 2 with varying seawater ratios. When changing the treated
water to raw water, nutrition was added in order to simulate sewage water from toilet flushing.
Before starting the whole experiment the bacteria had been cultivated and they did both grow on
the oyster shells and were diffused in the water. As can be seen in figure 1 and 2 the bacteria had not
attached to the oyster shells in all vessels. The reason for this is not known, but it is believed to have
no effect on the result. The vessels operated in a sequencing batch reactor mode with an operating
volume of 10-14L and an oyster shell packing volume of about 5-8L. When changing the water in the
vessels, the bacteria in the treated water was first allowed to sediment, and then 70% of the water
was changed to raw water, keeping the majority of the bacteria in the vessels at the bottom. The
water was aerated with a diffuser at the bottom of the vessel during the whole residence time.
Figure 3 The experimental setup.
Table 1 Experimental conditions
Operation conditions Parameter
Working volume 14 L
Residence time (HRT) 34h
Dissolved oxygen ≈5-8 mg/L
Temperature ≈ 25oC pH ≈8-9
Nitrification of saline sewage water in biofilter packed with oyster shells
8
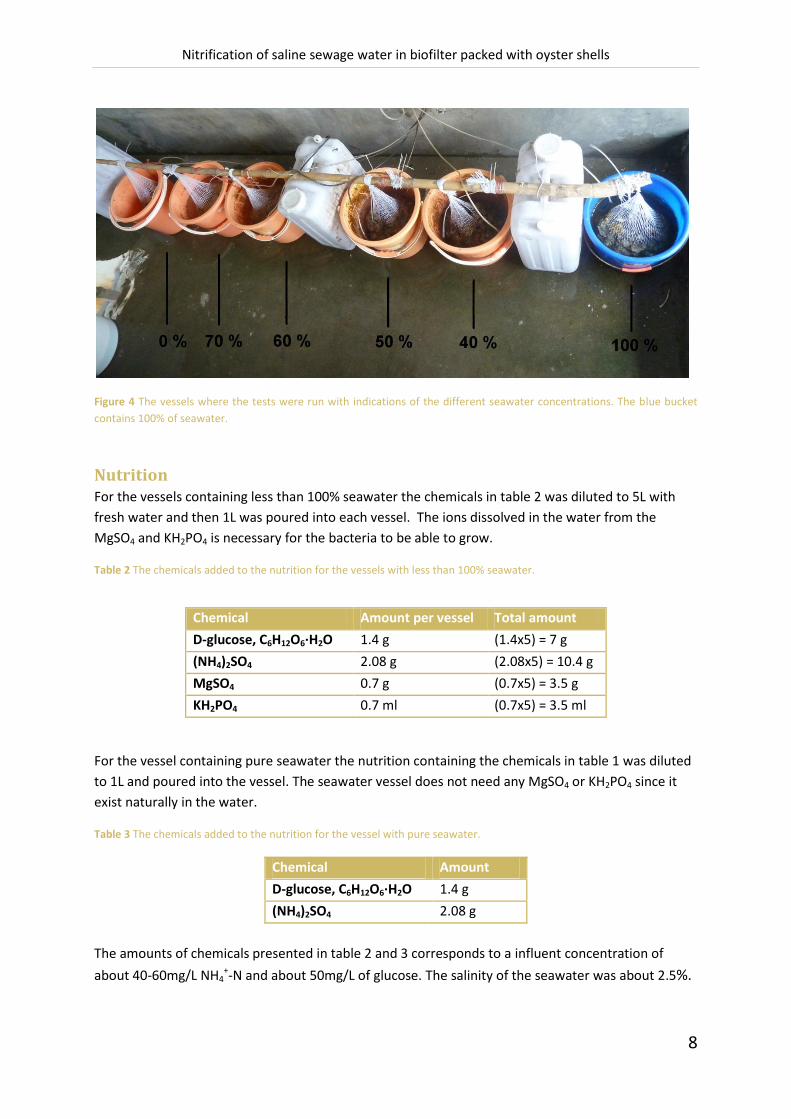
Figure 4 The vessels where the tests were run with indications of the different seawater concentrations. The blue bucket
contains 100% of seawater.
Nutrition
For the vessels containing less than 100% seawater the chemicals in table 2 was diluted to 5L with
fresh water and then 1L was poured into each vessel. The ions dissolved in the water from the
MgSO4 and KH2PO4 is necessary for the bacteria to be able to grow.
Table 2 The chemicals added to the nutrition for the vessels with less than 100% seawater.
Chemical Amount per vessel Total amount
D-glucose, C6H12O6∙H2O 1.4 g (1.4x5) = 7 g
(NH4)2SO4 2.08 g (2.08x5) = 10.4 g
MgSO4 0.7 g (0.7x5) = 3.5 g
KH2PO4 0.7 ml (0.7x5) = 3.5 ml
For the vessel containing pure seawater the nutrition containing the chemicals in table 1 was diluted
to 1L and poured into the vessel. The seawater vessel does not need any MgSO4 or KH2PO4 since it
exist naturally in the water.
Table 3 The chemicals added to the nutrition for the vessel with pure seawater.
Chemical Amount
D-glucose, C6H12O6∙H2O 1.4 g
(NH4)2SO4 2.08 g
The amounts of chemicals presented in table 2 and 3 corresponds to a influent concentration of
about 40-60mg/L NH4+-N and about 50mg/L of glucose. The salinity of the seawater was about 2.5%.
Nitrification of saline sewage water in biofilter packed with oyster shells
9
Changing water Firstly the aeration machine was turned off. Then the net with the oyster shells was lifted out of the
vessel and the bacteria were let to sediment. The 24th hour samples were taken from each vessel.
70% of the treated water was poured out. 1 liter of nutrition was put in each vessel, and then 0, 4, 5,
6, 7 or 10 liters of sea water was put in them in order to get 0, 40, 50, 60, 70 and 100% seawater in
the vessels. Then the vessels were filled up with fresh water and the shells put back and the aeration
turned on again. Then the 0th hour samples were taken from each vessel. This way to save 30% of the
treated water creates a residence time of 34 hours.
There was also a test made where sample were taken more often during 24 hours, actually at 7
different times during this period. This has been the base of a study of how the bacteria perform
during one sequence of 24 hours.
Testing NH4+-N The 24th hour and 0th hour samples were then tested in the lab to obtain the nitrification degree of
the bacteria. In the 0th hour sample the ammonium concentration should be corresponding to the
ammonium concentration in the nutrition and the 24th hour sample is then used to see how much
has been degraded. The absorbance of the water samples was measured and the data were
compared to a standard curve, getting a number of the concentration decrease of ammonium.
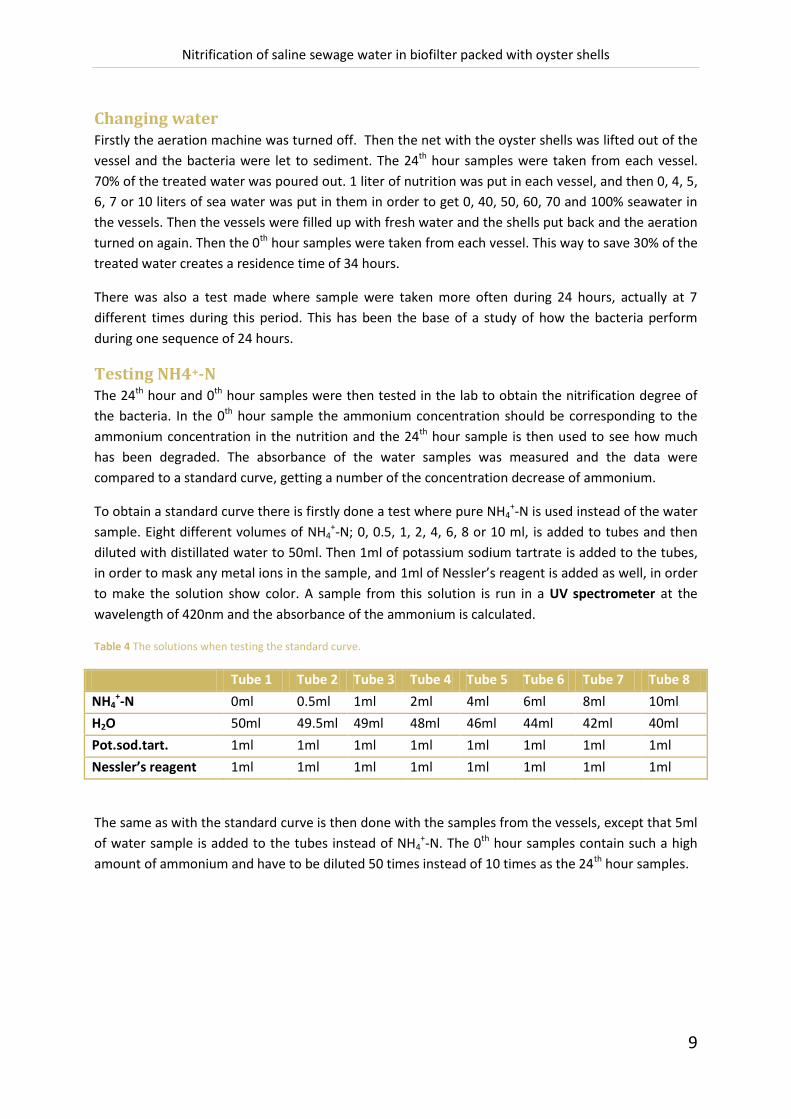
To obtain a standard curve there is firstly done a test where pure NH4+-N is used instead of the water
sample. Eight different volumes of NH4+-N; 0, 0.5, 1, 2, 4, 6, 8 or 10 ml, is added to tubes and then
diluted with distillated water to 50ml. Then 1ml of potassium sodium tartrate is added to the tubes,
in order to mask any metal ions in the sample, and 1ml of Nessler’s reagent is added as well, in order
to make the solution show color. A sample from this solution is run in a UV spectrometer at the
wavelength of 420nm and the absorbance of the ammonium is calculated.
Table 4 The solutions when testing the standard curve.
Tube 1 Tube 2 Tube 3 Tube 4 Tube 5 Tube 6 Tube 7 Tube 8
NH4+-N 0ml 0.5ml 1ml 2ml 4ml 6ml 8ml 10ml
H2O 50ml 49.5ml 49ml 48ml 46ml 44ml 42ml 40ml
Pot.sod.tart. 1ml 1ml 1ml 1ml 1ml 1ml 1ml 1ml
Nessler’s reagent 1ml 1ml 1ml 1ml 1ml 1ml 1ml 1ml
The same as with the standard curve is then done with the samples from the vessels, except that 5ml
of water sample is added to the tubes instead of NH4+-N. The 0th hour samples contain such a high
amount of ammonium and have to be diluted 50 times instead of 10 times as the 24th hour samples.
Nitrification of saline sewage water in biofilter packed with oyster shells
10
Figure 5 The standard curve of ammonium as in table 4.
UV spectrometer
When running a UV spectrometer test on the water samples the spectrometer sends out a UV light
which, with its high energy content, can excite the electrons in the ammonium molecule and thus the
electrons absorb the light in a certain spectrum and the spectrometer registers how much of the
lights are missing and can thus give a number of the absorbance of the ammonium. Then you get a
value of how much of the molecule that exists in the sample.13
(1)
The absorbance is calculated using formula (1), where I0 is the light intensity going in to the liquid and
I is the light intensity going out of the liquid.
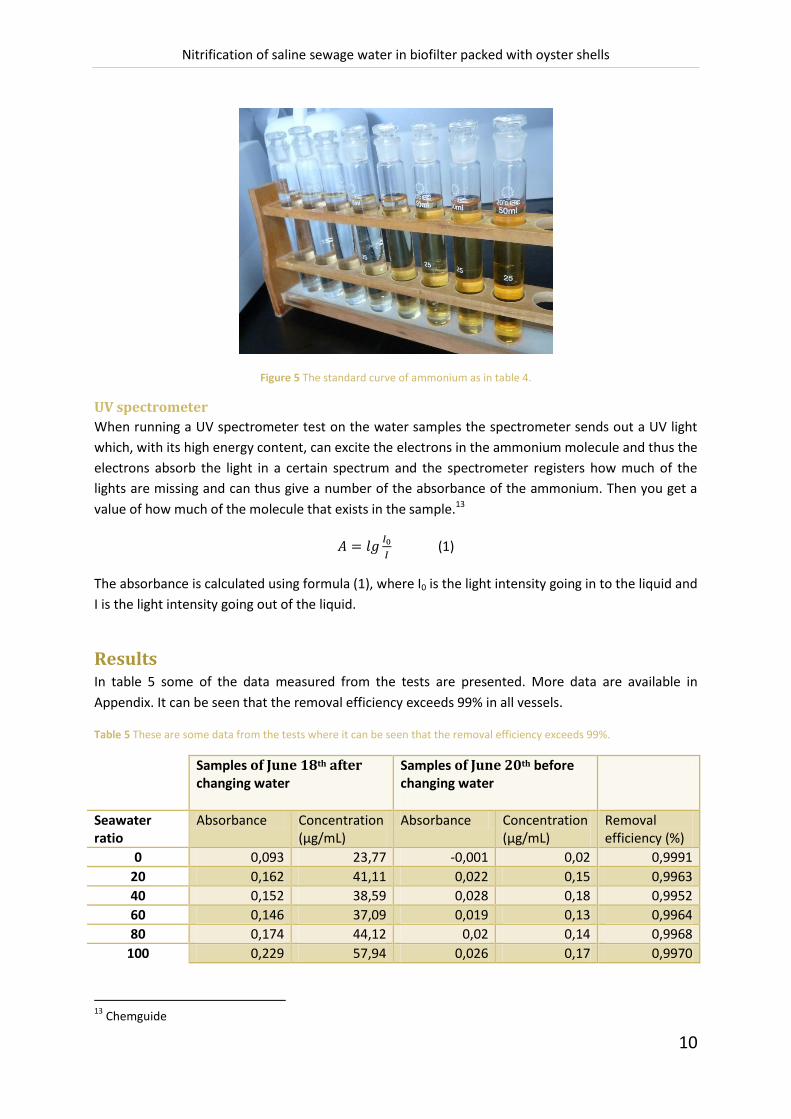
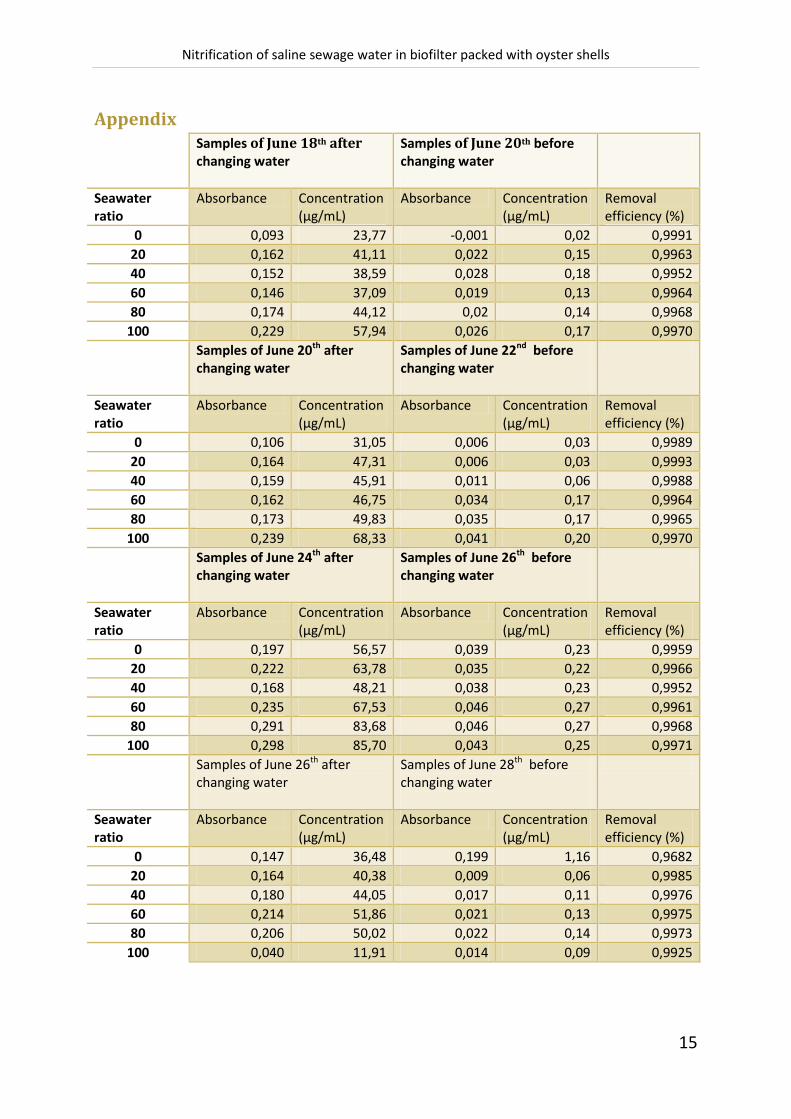
Results In table 5 some of the data measured from the tests are presented. More data are available in
Appendix. It can be seen that the removal efficiency exceeds 99% in all vessels.
Table 5 These are some data from the tests where it can be seen that the removal efficiency exceeds 99%.
Samples of June 18th after changing water
Samples of June 20th before changing water
Seawater ratio
Absorbance Concentration (μg/mL)
Absorbance Concentration (μg/mL)
Removal efficiency (%)
0 0,093 23,77 -0,001 0,02 0,9991 20 0,162 41,11 0,022 0,15 0,9963 40 0,152 38,59 0,028 0,18 0,9952 60 0,146 37,09 0,019 0,13 0,9964 80 0,174 44,12 0,02 0,14 0,9968
100 0,229 57,94 0,026 0,17 0,9970
13
Chemguide
Nitrification of saline sewage water in biofilter packed with oyster shells
11
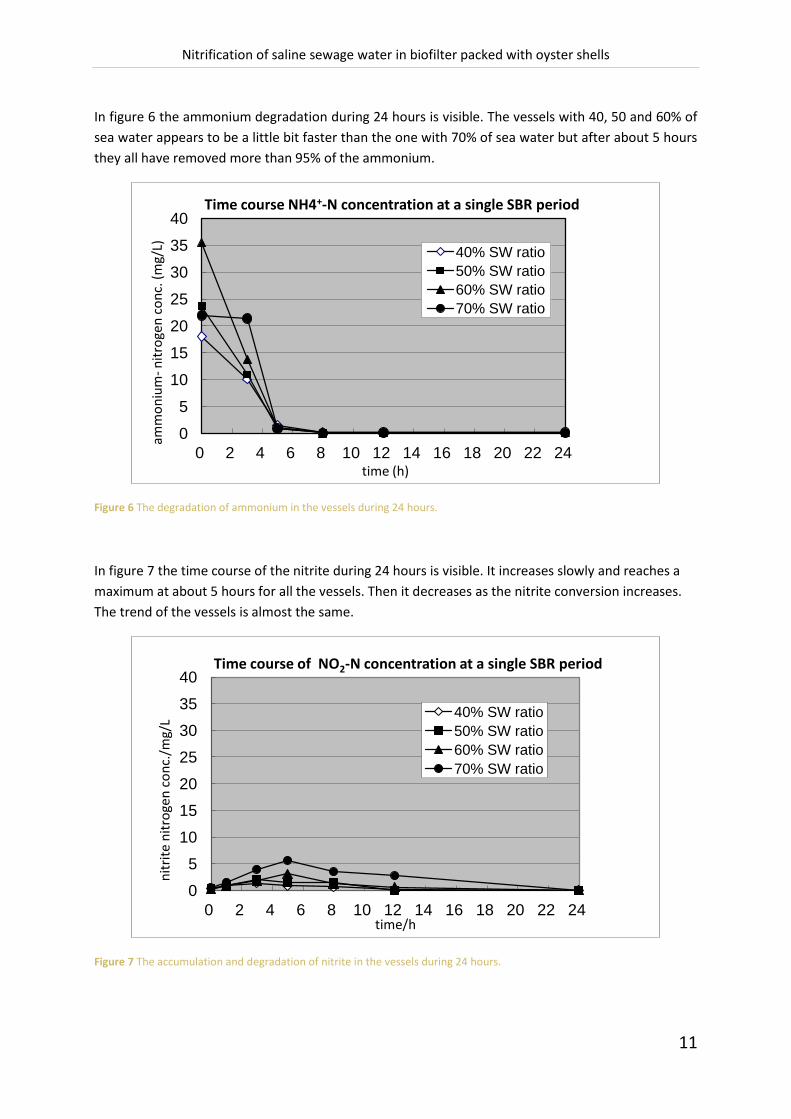
In figure 6 the ammonium degradation during 24 hours is visible. The vessels with 40, 50 and 60% of
sea water appears to be a little bit faster than the one with 70% of sea water but after about 5 hours
they all have removed more than 95% of the ammonium.
Figure 6 The degradation of ammonium in the vessels during 24 hours.
In figure 7 the time course of the nitrite during 24 hours is visible. It increases slowly and reaches a
maximum at about 5 hours for all the vessels. Then it decreases as the nitrite conversion increases.
The trend of the vessels is almost the same.
Figure 7 The accumulation and degradation of nitrite in the vessels during 24 hours.
0
5
10
15
20
25
30
35
40
0 2 4 6 8 10 12 14 16 18 20 22 24
amm
on
ium
- nit
roge
n c
on
c. (
mg/
L)
time (h)
Time course NH4+-N concentration at a single SBR period
40% SW ratio
50% SW ratio
60% SW ratio
70% SW ratio
0
5
10
15
20
25
30
35
40
0 2 4 6 8 10 12 14 16 18 20 22 24
nit
rite
nit
roge
n c
on
c./m
g/L
time/h
Time course of NO2-N concentration at a single SBR period
40% SW ratio
50% SW ratio
60% SW ratio
70% SW ratio
Nitrification of saline sewage water in biofilter packed with oyster shells
12
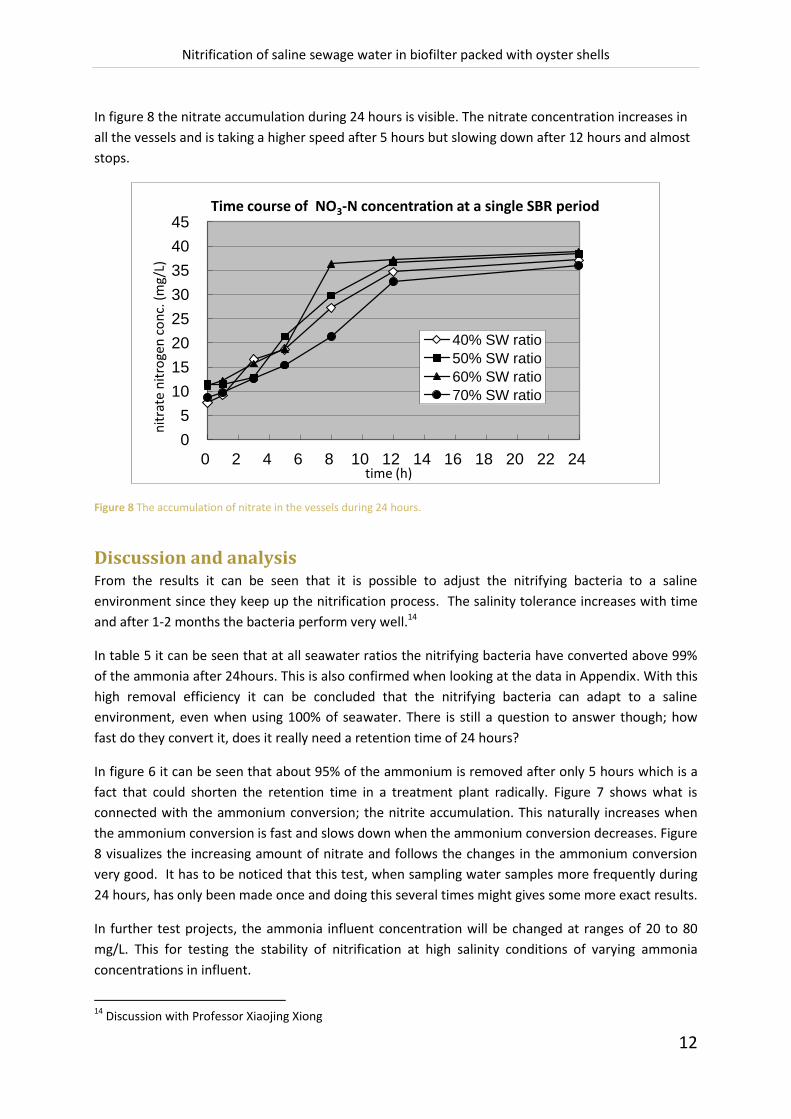
In figure 8 the nitrate accumulation during 24 hours is visible. The nitrate concentration increases in
all the vessels and is taking a higher speed after 5 hours but slowing down after 12 hours and almost
stops.
Figure 8 The accumulation of nitrate in the vessels during 24 hours.
Discussion and analysis From the results it can be seen that it is possible to adjust the nitrifying bacteria to a saline
environment since they keep up the nitrification process. The salinity tolerance increases with time
and after 1-2 months the bacteria perform very well.14
In table 5 it can be seen that at all seawater ratios the nitrifying bacteria have converted above 99%
of the ammonia after 24hours. This is also confirmed when looking at the data in Appendix. With this
high removal efficiency it can be concluded that the nitrifying bacteria can adapt to a saline
environment, even when using 100% of seawater. There is still a question to answer though; how
fast do they convert it, does it really need a retention time of 24 hours?
In figure 6 it can be seen that about 95% of the ammonium is removed after only 5 hours which is a
fact that could shorten the retention time in a treatment plant radically. Figure 7 shows what is
connected with the ammonium conversion; the nitrite accumulation. This naturally increases when
the ammonium conversion is fast and slows down when the ammonium conversion decreases. Figure
8 visualizes the increasing amount of nitrate and follows the changes in the ammonium conversion
very good. It has to be noticed that this test, when sampling water samples more frequently during
24 hours, has only been made once and doing this several times might gives some more exact results.
In further test projects, the ammonia influent concentration will be changed at ranges of 20 to 80
mg/L. This for testing the stability of nitrification at high salinity conditions of varying ammonia
concentrations in influent.
14
Discussion with Professor Xiaojing Xiong
0
5
10
15
20
25
30
35
40
45
0 2 4 6 8 10 12 14 16 18 20 22 24
nit
rate
nit
roge
n c
on
c. (
mg/
L)
time (h)
Time course of NO3-N concentration at a single SBR period
40% SW ratio
50% SW ratio
60% SW ratio
70% SW ratio
Nitrification of saline sewage water in biofilter packed with oyster shells
13
Conclusions In this project a complete nitrification of simulated saline sewage water has been accomplished with
the use of a sequencing batch reactor method with biofilter packed with oyster shells at influent
seawater ratio ranging from 40% to 100%. This suggests that nitrifying bacteria shows high tolerance
to relatively high salinity.
Although the results of the project has been satisfying, the fact that other results could come out of
it, if more tests were done and if more variants of conditions were tested, cannot be excluded.
Acknowledgments I would like to thank Professor Xiaojing Xiong for letting me be on his project and for his helpful
thoughts. Thanks to Jie Xu and Chen Xi for all their help with the experimental work and translations.
A special thanks to Jie Xu for putting a lot of time on helping me with material for this report. I would
also like to thank the sponsors Tyréns and Xylem for the financial support making this experience a
possibility.

Nitrification of saline sewage water in biofilter packed with oyster shells
14
References
Avgifta Avloppet, Så funkar ett reningverk, link received 2012-06-28 http://www.avgiftaavloppet.nu/faktaomreningsverk.4.2918eb29123a281ddcf8000154.html
Biocon Labs, Inc., Nitrifying Bacteria Facts, link received 2012-07-02 http://www.bioconlabs.com/nitribactfacts.html
Chemguide, UV Visible Absorption Spectra, link received 2012-07-02 http://www.chemguide.co.uk/analysis/uvvisible/theory.html
Chen Xiaorong, China Daily, 2009-09-10, page 39, link received 2012-06-30 http://www.chinadaily.com.cn/china/2009summerdavos/2009-09/10/content_8675129.html
Curtis J. Overdahl, George W. Rehm and Harvey L. Meredith, Fertilizer Urea, 1991, link
received 2012-07-02
http://www.extension.umn.edu/distribution/cropsystems/dc0636.html
Eco-Impact, Bioremediation and Mould Experts, Ammonia in Nature, link received 2012-06-28 http://www.bioremediate.com/ammonia1.html
Flow Control, China’s Largest Sea water Treatment Plant, link received 2012-07-10
http://www.flowcontrolnetwork.com/applications/water-and-wastewater/article/chinas-
largest-sea-water-treatment-plant
National Space Biomedical Research Institute, The Formation of Urine, link received 2012-06-30 http://www.nsbri.org/humanphysspace/focus4/ep-urine.html
Professor Xiaojing Xiong
The Water Planet Company, Nitrification & Denitrification, link received 2012-06-28 http://www.thewaterplanetcompany.com/docs/WPC_Nitrification%20&%20Denitrification%20.pdf
Visionlearning, The Nitrogen Cycle, link received 2012-06-30 http://www.visionlearning.com/library/module_viewer.php?mid=98
XIONG Xiaojing,YE Zhilong, Comparison of Nitrification Behavior Between Shell and Plastics
Ball Carrier in Aerated Biofilter, Journal of Xiamen University(Natural Science),2005-04
Nitrification of saline sewage water in biofilter packed with oyster shells
15
Appendix Samples of June 18th after
changing water
Samples of June 20th before changing water
Seawater ratio
Absorbance Concentration (μg/mL)
Absorbance Concentration (μg/mL)
Removal efficiency (%)
0 0,093 23,77 -0,001 0,02 0,9991 20 0,162 41,11 0,022 0,15 0,9963 40 0,152 38,59 0,028 0,18 0,9952 60 0,146 37,09 0,019 0,13 0,9964 80 0,174 44,12 0,02 0,14 0,9968
100 0,229 57,94 0,026 0,17 0,9970 Samples of June 20th after
changing water
Samples of June 22nd before changing water
Seawater ratio
Absorbance Concentration (μg/mL)
Absorbance Concentration (μg/mL)
Removal efficiency (%)
0 0,106 31,05 0,006 0,03 0,9989 20 0,164 47,31 0,006 0,03 0,9993 40 0,159 45,91 0,011 0,06 0,9988 60 0,162 46,75 0,034 0,17 0,9964 80 0,173 49,83 0,035 0,17 0,9965
100 0,239 68,33 0,041 0,20 0,9970 Samples of June 24th after
changing water
Samples of June 26th before changing water
Seawater ratio
Absorbance Concentration (μg/mL)
Absorbance Concentration (μg/mL)
Removal efficiency (%)
0 0,197 56,57 0,039 0,23 0,9959 20 0,222 63,78 0,035 0,22 0,9966 40 0,168 48,21 0,038 0,23 0,9952 60 0,235 67,53 0,046 0,27 0,9961 80 0,291 83,68 0,046 0,27 0,9968
100 0,298 85,70 0,043 0,25 0,9971 Samples of June 26th after
changing water
Samples of June 28th before changing water
Seawater ratio
Absorbance Concentration (μg/mL)
Absorbance Concentration (μg/mL)
Removal efficiency (%)
0 0,147 36,48 0,199 1,16 0,9682 20 0,164 40,38 0,009 0,06 0,9985 40 0,180 44,05 0,017 0,11 0,9976 60 0,214 51,86 0,021 0,13 0,9975 80 0,206 50,02 0,022 0,14 0,9973
100 0,040 11,91 0,014 0,09 0,9925