Embed Size (px)
Citation preview
Faculty of Natural Resources and
Agricultural Sciences
Assay of nitrification potentials in
sewage sludge – Development and evaluation of method, and nitrification
potentials in sewage sludge before and after application to
soil
Caroline Jöngren
Department of Microbiology
Master´s thesis • 30 hec • Second cycle, A2E
Master of Agriculture, Crop and Soill Science
Examensarbete/Sveriges lantbruksuniversitet,
Institutionen för mikrobiologi, 2016:1 • ISSN 1101-8151
Uppsala 2016

Assay of nitrification potentials in sewage sludge
- Development and evaluation of method, and nitrification potentials
in sewage sludge before and after application to soil
Caroline Jöngren
Supervisor: Mikael Pell, University of Agricultural Sciences,
Department of Microbiology
Examiner: Anna Schnürer, University of Agricultural Sciences,
Department of Microbiology
Credits: 30 hec
Level: Second cycle, A2E
Course title: Independent Project in Biology - Master's thesis
Course code: EX0565
Programme/education: Master of Agriculture, Crop and Soil Science
Place of publication: Uppsala
Year of publication: 2016
Cover picture: Caroline Jöngren
Title of series: Examensarbete/Sveriges lantbruksuniversitet, Institutionen för mikrobiologi
no: 2016:1
ISSN: 1101-8151
Online publication: http://stud.epsilon.slu.se
Keywords: Sewage sludge, nitrification potentials, PAO, sanitations treatment, storage
treatments, nitrous oxide, Nitobacteriacea, Nitrosomona
Sveriges lantbruksuniversitet
Swedish University of Agricultural Sciences
Faculty of Natural Resources and Agricultural Sciences
Uppsala BioCenter
Department of Microbiology

Abstract
Sewage sludge (SS) contains valuable plant nutrients applicable to soil as fertilizer.
Application to arable land is though controversial as SS can contain contains such as human
pathogens, heavy metals and xenobiotics. Post-treatment processes of SS such as long term
storage which can reduce pathogenic bacteria before application to soil implicate a risk of
nitrogen (N) losses via emissions of the greenhouse gas nitrous oxide (N2O) and leaching of
nitrate (NO3-). Nitrification is the microbial process that contributes to the turnover of these
nitrogen compounds, however measurement of nitrification in long-term stored SS has never
been done before. The hypothesis of nitrification activity in stored SS was the underlying
reason for the questions: Is there any measurable nitrification activity in stored SS and how
does it affect N2O emissions? How does different sanitation-treatments affect the nitrification
in stored SS? Hence, the objective of this study was to develop an assay for assessment of
potential ammonium oxidation rate (PAO) in SS, i.e. the turnover rate of ammonium
oxidizing bacteria (AOB) constituting the first step in nitrification assayed in an optimal
environment. Another objective was to measure the PAO in fresh and stored SS with different
sanitation-treatments, and in soil after SS application. Also, by literature study evaluating the
PAO in stored SS and its contribution to N2O emissions.
Fresh dewatered and stored SS from the wastewater treatment plant Kungsängsverket
in Uppsala was used in the development of the new PAO assay. The development was based
upon the existing PAO method developed for soil. In the PAO assay a slurry (a sample with
liquid substrate) is incubated during standardized conditions from which samples are taken
over a time period. The sample is analyzed for nitrite content by spectrophotometric detection,
which requires samples to be extracted and centrifuged. The rate of increasing NO2- content
over time is defined as PAO. The assay development involved four steps: (1)
Spectrophotometric scanning of SS extracts, (2) nitrite recovery analysis (3) refinement of
extraction and centrifugation, and (4) optimization of sample size for a reliable PAO. The
modified PAO assay compared to that used for soil resulted in reduced sample size and
centrifugation of extracts amount. This resulted in a sample size with sufficient nitrification
activity and minimized coloration of the extract. Accumulation of NO2- over time was
analyzed using Flow Injection Analysis and demonstrated a stable and linear process. This
demonstrated a stable PAO assay and nitrification activity in stored SS.
The new PAO assay was used analyzing SS from a pilot study with four different
sanitation treatments in combination of storage for one year with and without cover. The
result showed that long term stored thermophilically digested SS (TC) had significantly
higher PAO activity than the other treatments using mesophilically digested SS, probably a
result of increased access of oxygen (O2) due to a more porous texture of the thermophilically
digested SS. Mesophillically digested SS treated with ammonia (MAC) showed a low PAO
activity as a high concentration of ammonia indicated inhibition of nitrification. The PAO
rates of TC and MAC follow the results of N2O emissions from the same treatments in a
previous study and indicate that inhibition of nitrification lowers the amount of substrate
available for processes driving N2O emissions. SS application to soil did not change the
intrinsic PAO of the soil, however some inhibitory effect was indicated with strongest effect
displayed by MAC.
This study shows the PAO can be measured in SS and the developed method enables
e.g. analysis of sanitation treatment effects in SS. However, further development is needed to
ensure a reliable assay as the PAO activity indicated to decrease with increased sample
amount, probably an inhibitor effect of increasing levels of contaminants.

Sammanfattning
Spridning av avloppsslam på jordbruksmark kan återföra värdefulla växtnäringsämnen till
odlingssystemet. Det anses dock kontroversiellt då slammet kan innehålla föroreningar såsom
sjukdomsalstrande bakterier, tungmetaller och organiska föreningar. För att minska innehållet
av sjukdomsalstrande bakterier kan slammet hygieniseras genom bl.a. långtidslagring. Under
lagringstiden riskerar man dock att förlora kväve (N) genom emissioner av lustgas (N2O), en
potent växthusgas, och läckage av nitrat (NO3-) till grundvattnet. Nitrifikation är en
mikrobiell process som påverkar förekomsten av dessa kväveföreningar, men mätningar av
nitrifikation i lagrat avloppsslam har inte gjorts tidigare. Frågeställningarna som låg till grund
för denna studie formulerades som: Kan nitrifikationsaktivitet påvisas i lagrat avloppsslam
och i så fall kan den förklara observerade emissioner av N2O? Hur påverkas nitrifikationen av
olika hygieniseringsmetoder? Målet var att utveckla en metod för att bestämma den
potentiella ammonium-oxidationshastigheten (PAO) i avloppsslam, d.v.s. hastigheten av det
första oxidationssteget i nitrifikationsprocessen under optimala förhållanden. Ytterligare mål
var att bestämma PAO i färskt och lagrat avloppsslam med olika hygieniseringsmetoder
liksom i jord efter tillsats av slam. Vidare utvärderades med hjälp av litteraturen huruvida
PAO skulle kunna vara en bidragande orsak till avgång av N2O från lagrat slam.
Under utvecklingen av PAO metoden användes avvattnat färskt och lagrat
avloppsslam från Kungsängsverket i Uppsala. Metodutvecklingen baserades på en etablerad
metod för bestämning av PAO i jord. Vid mätning av PAO inkuberas en slurry (ett prov plus
vätskesubstrat) under standardiserade förhållanden varefter prover av nitrit tas ut för analys
under en tidsperiod. För att möjliggöra spektrofotometrisk bestämning av nitrit extraheras och
centrifugeras proverna innan analys. Hastigheten av ackumulerad nitrit definieras som PAO.
Metodutvecklingen utfördes i följande fyra steg: (1) Spektrofotomerisk karaktärisering av
vattenextrakt från slam, (2) analys av känd mängd nitrit som satts till slamextrakt, (3)
förfining av extraktions- och centrifugeringsförfarandet och (4) test av optimal provmängd för
säker bestämning av PAO. PAO-metoden för slam jämfört med den för jord modifierades
genom att minska provmängden i testet. Även mängden extrakt som provtogs minskades för
att tillåta en högre centrifugeringshastighet. Dessa modifieringar innebar att bakgrundsfärgen
på slamextraktet kunde reduceras och en tillräcklig nitrifikationsaktivitet bibehölls för
tillförlitlig bestämning. Ackumulation av nitrit analyseras med Flow Injection Analysis och
nitritackumulationen över tid visade en stabil rätlinjig process. Resultatet påvisade att den nya
PAO metoden för slam fungerade och att nitrifikationsaktivitet förekommer i lagrat
avloppsslam.
Den nya PAO metoden användes för att analysera slam från en pilotstudie där slam
behandlats med fyra olika hygieniseringsmetoder och sedan lagrats under ett år med och utan
täckning. Resultatet visade att termofilt rötat slam (TC) hade signifikant högre PAO än
mesofilt rötat slam. TC hade en mer porös struktur än det mesofilt rötade slammet som
troligen möjliggjorde ökad syresättning och ledde till ökad PAO. Mesofilt rötat slam
behandlat med ammoniak (MAC) visade låga PAO värden vilket tyder på att den höga halten
av ammoniak inhiberade nitrifikationen. PAO värdena från TC och MAC gick i linje med
N2O mätingar från samma behandlingar i en tidigare studie, d.v.s. inhibering av nitrifiktionen
tyder på minskad mängd substrat för N2O-bildande processer vilket leder till låga N2O
missioner. Inblandning av hygieniserat slam i jord förändrade inte jordens PAO värde
signifikant.
Slutsatsen från studien är att det är möjligt att mäta PAO i avlopsslam och att den
nyutvecklade PAO metoden möjliggör analys av effekter av t.ex. olika hygieniseringsmetoder
för slam. Dock krävs ytterligare utveckling för att säkerställa metodens tillförlitlighet då PAO
värden tenderade att minska med ökade provmängder, troligen en inverkan av ökande
koncentrationer av föroreningar i slammet.


Abbreviations
AOB - Ammonium oxidizing bacteria
FMS - Fresh dewatered mesophillically digested sewage sludge
M - Mesophilically digested sewage sludge stored without cover
MC - Mesophilically digested sewage sludge stored with cover
MAC - Mesophilically digested sewage sludge treated with ammonia (by
incorporation of 1.5% urea) stored with cover
PAO - Potential ammonium oxidation
TC - Thermophilically digested sewage sludge stored with cover
SMS - Stored dewatered mesophillically digested sewage sludge
SS - Sewage sludge
WWTP - Wastewater treatment plant

Table of content ABBREVIATIONS ....................................................................................................................................... 4
1. Introduction ........................................................................................................... 9 1.1. AIM .............................................................................................................................................. 10
2. Background ......................................................................................................... 11 2.1. SEWAGES SLUDGE - PRODUCTION AND APPLICATION TO SOIL .................................................................. 11
2.1.1. Wastewater treatment ....................................................................................................... 11 2.1.2. After-treatment .................................................................................................................. 12 2.1.3. Land application of sewage sludge ..................................................................................... 13
2.2. NITRIFICATION................................................................................................................................ 14 2.3. METHODS FOR DETERMINATION OF NITRIFICATION ACTIVITY IN SOIL ........................................................ 16 2.4. METHODS FOR DETERMINATION OF NITRIFICATION ACTIVITY IN WWTP ................................................... 18
3. Material and methods ......................................................................................... 19 3.1. SEWAGE SLUDGE............................................................................................................................. 20 3.2. SOILS ............................................................................................................................................ 21 3.3. ANALYSIS OF NITRITE ....................................................................................................................... 21 3.4. STEP 1: SPECTROPHOTOMETRIC SCAN OF SEWAGE SLUDGE .................................................................... 22 3.5. STEP 2: NITRITE RECOVERY ANALYSIS.................................................................................................. 22 3.6. STEP 3: EFFECTS OF EXTRACTION AND CENTRIFUGATION REFINEMENTS ON NITRITE RECOVERY ..................... 23 3.7. STEP 4: AOB ACTIVITY TESTS OF SEWAGE SLUDGE AND OPTIMIZATION OF SAMPLE SIZE ............................... 24 3.8. STEP 5: APPLICATION OF PAO ASSAY ON SEWAGE SLUDGE .................................................................... 24 3.9. STEP 6: PAO ASSAY OF SOIL WITH APPLIED SEWAGE SLUDGE .................................................................. 24 3.10. DATA TREATMENT AND STATISTICAL ANALYSIS ................................................................................... 24
4. Results ................................................................................................................. 25 4.1. PAO ASSAY DEVELOPMENT (STEP 1 - 4) ............................................................................................. 25
4.1.1. Step 1 .................................................................................................................................. 25 4.1.2. Step 2 .................................................................................................................................. 26 4.1.3. Step 3 .................................................................................................................................. 28 4.1.4. Step 4 .................................................................................................................................. 29
4.2. PAO RATES IN FRESH AND STORED SS (STEP 5) .................................................................................... 31 4.2.1. Mixed samples .................................................................................................................... 31 4.2.2. Top and bottom layer ......................................................................................................... 32 4.2.3. Absorbance ......................................................................................................................... 33 4.2.4. Repeated PAO assay ........................................................................................................... 34
4.3. PAO ASSAY OF SEWAGE SLUDGE APPLIED TO SOIL (STEP 6) .................................................................... 36
5. Discussion .......................................................................................................... 37 5.1. PAO ASSAY DEVELOPMENT (STEP 1 - 4) ............................................................................................. 37
5.1.1. The new PAO assay and protocol ....................................................................................... 38 5.2. PAO ACTIVITY OF PROCESSED SEWAGE SLUDGE (STEP 5) ....................................................................... 39
5.2.1. Start (mixed samples) ......................................................................................................... 39 5.2.2. End (mixed samples) ........................................................................................................... 40 5.2.3. Top and bottom layer ......................................................................................................... 41
5.3. PAO ASSAY OF SS APPLIED TO SOIL (STEP 6) ....................................................................................... 41 5.4. IMPLICATIONS OF PAO IN SS AND SS AMENDED SOIL ............................................................................ 42 5.5. FURTHER IMPROVEMENT OF THE PAO ASSAY ...................................................................................... 42
6. Conclusion .......................................................................................................... 43
7. Acknowledgement .............................................................................................. 44
8. References .......................................................................................................... 45

Appendix 1 – Sewage sludge used in the development work ............................ 51
Appendix 2 – Sewage sludge from storage trial .................................................. 53
Appendix 3 – Soils used in the development work ............................................. 54
Appendix 4 – Populärvetenskaplig sammanfattning ........................................... 55
9
1. Introduction High-yield crop production on arable land requires high input of nitrogen (N) and phosphorus
(P). After harvest, the nutrient rich crops are refined into various food products consumed in
urban areas. The residual plant nutrients are conveyed via excreta into the sewer pipes ending
up in the sludge of the wastewater treatment plant (WWTP). In this linear route of plant
nutrient use, the soil has to be replenished with nutrients to maintain its fertility. This is most
often done by adding mineral fertilizers. As the concentrated plant nutrients in the wastewater
and sewage sludge risk to leak into the environment, this frequently cause eutrophication of
lakes and water courses. Hence, it is obvious that the linear way of handling plant nutrients
and wastewater is not sustainable. Ideally, plant nutrients should be recycled back to the
arable land from the sewage systems.
WWTP are designed to reduce the content of organic material, P and N in effluent to prevent
spreading to sensitive environments, thus the focus is not to produce an end product for reuse
as fertilizer. The solid end product from WWTP, so called sewage sludge (SS), can contain
digested organic material, P and N, as well as other macro and micronutrients, but also
contaminants such as human pathogens, heavy metals and xenobiotics (Odlare et al., 2014;
Börjesson et al., 2014). Application of SS on arable land is beneficial to the soil system as it
can improve its structure (Kätterer et al., 2014) and supply plant nutrients (Odlare et al.,
2014). Nevertheless, low content of heavy metals in the SS has to be ensured before it can be
used as fertilizer. In addition, treatment practices to minimize spreading of human pathogens
are needed.
Treatment practices to lower the content of pathogens in SS have been suggested by the
Swedish Environmental Protection Agency (SEPA), including thermophilic anaerobic
digestion, incorporation of urea for ammonia treatment and storage for at least one year
(Naturvårdsverket, 2002; Naturvårdsverket, 2013). However, long-term storage (Flodman,
2002; Jönsson et al., 2014) as well as application of SS to arable soils (Thangarajan et al.,
2013; Jönsson et al., 2014; Rodhe and Pell, 2005) may result in emission of nitrous oxide
(N2O) and methane (CH4). N2O is a potent greenhouse gas (GHG) with high global warming
potential and long residence time in the atmosphere (IPCC 2013). Around 13% of the GHG-
emissions in Sweden year 2012 originated from the agriculture sector, including sewages
sludge used as fertilizer, of which N2O represented 63% (Naturvårdsverket, 2014). These
findings emphasize the need for better knowledge of the microbial processes and regulating
factors behind N2O production in long-term stored SS and in soil fertilized with SS.
Emission of N2O is a result of the microbial processes nitrification and denitrification.
Nitrification is the aerobic process in which specialized lithotrophic bacteria oxidize
ammonium (NH4+) first to nitrite (NO2
-) and then further to nitrate (NO3
-) (formula 1)
(Wunderlin et al., 2012). Denitrification is conducted by a range of organotrophic bacteria
under anaerobic conditions where NO3- is reduced in several steps to the end product
dinitrogen gas (N2) (formula 2) (Firestone and Davidson, 1989). Shifts in aerobic and
anaerobic conditions in soils has shown to stimulate production of N2O, an intermediate
product of both processes (Clemens et al., 1997). Factors affecting the amount of N2O emitted
from a soil or water ecosystem are the availability of mineral N, easy accessible carbon,
oxygen, water, temperature and pH (Thangarajan et al., 2013). Nitrifying and denitrifying
bacteria are indigenous inhabitants (Firestone and Davidson, 1989) of soils and crucial players
10
in biological wastewater treatment processes (Wunderlin et al., 2012), hence most likely
inhabitants of SS as well.
In a study by Jönsson et al, (2014) N2O and CH4 emissions were investigated in a pilot-scale
storage of thermophilic and mesophilic digested and dewatered SS, with and without cover
and addition of urea. The different treatments produced NO3- and emitted N2O. This lead to
the hypothesis that nitrification could be the underlying mechanism for the N2O emissions. To
our knowledge nitrification activity has previously not been investigated in stored SS. The
main reason for this could be the lack of methods for analyzing this property in SS.
One way of estimating the capacity of a soil to nitrify is to analyze the potential ammonium
oxidation (PAO) rate. PAO is defined as the capacity of nitrifying enzymes in an optimal
environment to oxidize NH4+ to NO2
-, which can be assayed in an aerated soil slurry with
excess of NH4+ buffered to pH 7.2 (Belser and Mays, 1980). Ammonium oxidizers are highly
specialized bacteria sensitive to environmental changes, also making the PAO assay a
valuable tool in analyzing the soil functioning and to test toxicity of chemical substance added
to the soil (Pell et al., 1998; Pell and Torstensson, 2003). In addition, PAO capacity of a soil
indicates risks for N2O emission. Thus, developing a PAO assay for SS would provide a tool
for studying how the ammonia oxidizing capacity in stored SS is affected by digestion at
different temperatures prior to storage as well as by urea treatment and covering during
storage. Finding a combination of treatment methods lowering the nitrification activity during
storage would contribute to minimize risks of N2O emissions and NO3- leaching from SS
handling.
1.1. Aim The overall aim of this work was to develop a PAO method for assaying nitrification activity
in fresh and stored sewage sludge. Specific aims were to (1) develop and optimize a PAO-
assay for sewage sludge (2) run the new PAO-assay on fresh sewage sludge and sludge stored
using different treatment methods, (3) measure PAO activity in soil applied with sewage
sludge, and (4) discuss whether nitrification in sewage sludge could contribute to N2O
emission.
The objective was to provide a reliable tool for measuring nitrification activity in SS. Also,
from a previous study, evaluate if nitrification activity is affected by different sanitation-
treatments in stored SS and if the nitrification contributes to the measured N2O emissions.
The study aims to address these following research questions:
Is there any nitrification activity in fresh and stored sewage sludge?
If any nitrification, is it measurable?
Does different sanitation-treatments of stored sewage sludge affect the nitrification?
Does nitrification contribute to N2O emissions from stored sewage sludge?
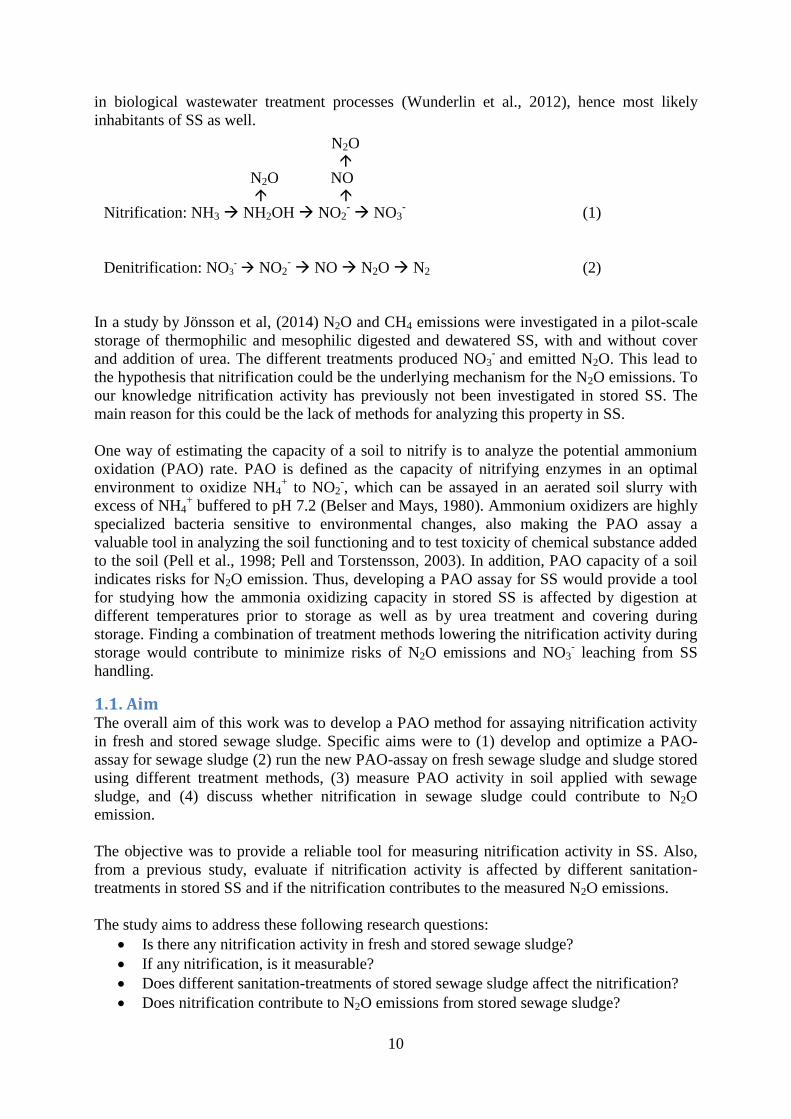
N2O
N2O NO
Nitrification: NH3 NH2OH NO2- NO3
- (1)
Denitrification: NO3- NO2
- NO N2O N2 (2)
11
2. Background The importance of recycling plant nutrient stands clear in maintaining sustainable food
production, however, several factors throughout the wastewater treatment chain obstruct a
fully acceptable SS fertilizer product for agriculture use. The following background section
aims to provide understanding of the complexity of the processes behind a final SS fertilizer
product. First, an overview of the wastewater treatment process is given. Then, the
nitrification process in both SS and soil is reviewed with focus on its potential to be source of
N2O emissions. Finally, a review of different techniques for assessment of nitrification rates
in both soil and the WWTP is given.
2.1. Sewages sludge - production and application to soil
2.1.1. Wastewater treatment Municipal wastewater treatment plants (WWTP) receive sewage water from households and
industries, and are primarily designed to rid the water from dissolved organic carbon, P and N
enabling discharge of the water to the environment without disturbing the recipient
ecosystem. In order to obtain clean wastewater various physical, biological and chemical
techniques are applied.
In the first step of the WWTP, called primary or mechanical treatment, the wastewater is
conveyed through a grid to separate unwanted material such as paper and cloths. In addition,
heavy particles are removed by sedimentation. Chemicals can also be added in this step to
facilitate separation of the particles.
In the second step, after the pretreatment the wastewater is lead to a basin for biological
treatment. Here microorganisms are stimulated to mineralize and reduce dissolved organic
carbon and by combined nitrifying and denitrifying activities reduce the nitrogen (Bitton,
2005). The microbial activities are parts of the natural energy and carbon metabolism of the
microorganisms where the most efficient biological process is created by mixing the water to
allow close contact between suspended material, nutrients and microorganisms. As nitrifying
and denitrifying bacteria prefer aerobic and anoxic conditions, respectively, alternating zones
of air blown into the basin from beneath and non-aerated zones are created in the so called
activated sludge process (Pell and Wörman, 2008).
In the final step chemicals, typically salts of Al, Ca, Fe or Mg are added to precipitate
orthophosphate ions (PO43-
). The stable precipitates are allowed to sediment and therefore
become part of the sewages sludge. Removal of P can also be achieved biological, by the so
called Bio-P process, in which conditions favorable to poly-P accumulating bacteria are
created. One benefit with the Bio-P process is that it produces less sludge than chemical
precipitation as the bacterial uptake of phosphorus increases the density of the SS.
Chemically precipitation increases the hydrophilic character of SS as which restrain an
effective dewatering process (Bitton, 2005; Pell and Wörman, 2008).
Throughout the wastewater treatment process, from the sewer pipes to the final sludge storage
and application to arable land, N2O and CH4 two potent GHG are emitted. N2O and CH4 have
global warning potentials 265 and 84 times higher than carbon dioxide in a 100 year period
(IPCC 2013). In 2012, N2O emissions in Sweden corresponded to 6.3 million tonnes CO2-
equivivalents which was mainly emitted from the agricultural sector including soil
management and fertilization with organic substrate, such as sewage sludge
(Naturvårdsverket, 2014). From storage of SS, emission rates of GHG in the range of 2-17 kg

12
CO2-equivivalents per person and year was reported from three different studies (Akerman et
al., 2010; Flodman, 2002; UKWIR, 2013). Furthermore, from a study of pilot-scale storage
the emissions of N2O were 0-44 kg CO2-equivalents per square meter (Jönsson et al., 2014).
Heavy metals, organic pollutants (xenobiotics), medical residues and human pathogens are
unwanted substances frequently disposed into toilets and sinks of which some will end up in
the sewage sludge. This contamination poses a problem as the value of the recycled plant
nutrients is constrained. The concentration of most heavy metals in SS has decreased and will
probably continue to decrease in the long perspective (Naturvårdsverket, 2013). As opposed
to this trend copper is increasing due to its release from the numerous water pipes made of
copper. Also more than 250 organic chemical compounds have been detected in Swedish SS
and a few of them in concentrations over mg/kg dry weight (Naturvårdsverket, 2013).
Among the chemicals detected are medical residues and some antibiotics that may affect the
biological treatment processes in the WWTP (Heberer, 2002). Bacteria such as E. coli and
Salmonella are present in SS, the former occurring naturally in the human guts, however, both
bacteria may be pathogenic and, hence, SS should not be used as fertilizer in agriculture in
ways that risks contaminating food.
2.1.2. After-treatment The settled SS produced in the WWTP is treated further to obtain a stable product with less
water, improved texture and reduced content of pathogens. This process includes thickening,
where polyelectrolytes are added to allow the soild fraction of the sludge to separate from the
water, followed by dewatering by centrifugation or belt pressing. Further stabilization and
sanitation can be done by anaerobic digestion before adding additional polyelectrolytes and
dewatering to achieve a SS dry weight of 25-30% before final storage. The treated and stable
SS can be used as e.g. filling material in road embankments, soil improvers and fertilizer or be
deposited in landfills if highly contaminated (UppsalaVatten, 2013; Bitton, 2005). To be
approved for use on arable land the SS has to be sanitized and fulfill issued limit values of
contaminants (Naturvårdsverket, 2013; SvensktVatten, 2015).
Thermophilic (50-60°C) digestion reduces levels of pathogenic bacteria such as Salmonella
and certain E.coli, while mesophilic digestion (20-40°C) has a rather low sanitation effect
(Vinnerås, 2013). The digestion process most likely have a negative effect on nitrifying
bacteria as the most common genera of Nitrosomonas and Nitrobacter are sensitive to heat
(Jiang and Bakken, 1999) and anaerobic conditions. The digestion process, which is regulated
by the specific retention time of the feedstock and temperature, is an approved sanitation
treatment method. Normally the digestion has to be combined with long term storage of the
produced digestate with a minimum of six months to fulfill hygienic limit value of SS for
agricultural use (Naturvårdsverket, 2013; SvensktVatten, 2015). The sanitation effect can be
further improved by ammonia (NH3) treatment which can be achieved by adding urea.
Treatment of the SS with urea in high concentrations will result in release of NH3 which will
reduce the numbers of pathogenic bacteria and possibly also nitrifying bacteria (Anthonisen et
al., 1976; Vinnerås, 2013). Though, long term storage of SS fulfills the sanitation
requirements and could lead to increased emissions of the GHG (N2O, CH4, CO2) and thus
further aggravate the GHG burden from the agriculture sector, either during storage itself or
during land-spreading when used as organic fertilizer (Jönsson et al., 2014). Hence, a good
after-treatment includes a lot of thinking in order to design a safe system without
environmental side effects.
13
2.1.3. Land application of sewage sludge Around 200 000 tonnes dry weight per year of SS is produced in Sweden but only 25% is
spread on arable land even though that 84% is approved for arable land application
(Naturvårdsverket, 2013). If all SS produced were used as fertilizer this would recycle around
6 000 tonnes P and 8 000 tonnes N back to the Swedish arable land, which would equal
around 3 kg P and 4 kg N per ha (KSLA, 2012). The total consumption of mineral fertilizer in
Sweden was year 2013/2014 around 12 000 tonnes P and 180 000 tonnes N (Jordbruksverket
2015).
The amount of P and N available to the plants of the total content in SS is thought to be
restricted by chemically precipitated P (Krogstad et al., 2005; Linderholm, 1997) and N
bound in organic material (Rigby et al., 2009). However, field- and lab experiments have
demonstrated increased P values in soils after several years of SS application, and partly
increased water-soluble phosphorus especially from SS with biological precipitated P using
Bio-P process (Andersson, 2012; Otabbong, 1997). Heterotrophic microorganisms deriving
energy and carbon by degrading organic material to produce new biomass. This result in N
bound in organic material being mineralized (NH4+) but will be immobilized when the
population of microorganisms continue to grow. However, as the fraction of easily degraded
carbon in the organic material of SS is low after anaerobic digestion, which increase the
biological stability of SS, the mineralization of organic N can be restricted. (Stinner et al.,
2008). The result of the microbial immobilization of N will be, in short term, less N available
to the plants, thus restricting the value of SS as short-term N fertilizer (Jezierska-Tys and
Frac, 2008). Most N bound in the organic material of SS will be gradually mineralized and
released over several years depending on soil moisture, pH, temperature, soil type and
microbial immobilization (Rigby et al., 2009; Borjesson et al., 2014). Urea treated SS can,
however, increase the amount of plant-available N (Vinnerås, 2013).
Application of SS per hectare is regulated according to Swedish Environmental Protection
Agency (SEPA) regulation (SNFS1994:2MS:72), which consider the soil and SS content of P,
N and heavy metals. The structure of the SS allows spreading by a dry-manure spreader and
after application it has to be incorporated by tillage into the soil within a certain time frame,
based on the same regulation as that for other organic fertilizers as issued by the Swedish
Board of Agriculture (SJVFS2004:62). Sewages sludge certified by REVAQ ensures a certain
quality making it more suitable for agricultural use. The REVAQ certificate is owned by The
Swedish Water and Wastewater Association and is accepted by farmers’ federations and food
processing industries such as The Federation of Swedish Farmers (LRF), The Swedish Food
Federation (Livsmedelsföretagen) etc. The REVAQ system requires analysis and tracking of
60 metals and Salmonella in the SS and that application on arable land follows existing rules
and regulations regarding allowed rates of metals and P (SvensktVatten, 2015).
Sewage sludge should probably be principally regarded as a P fertilizer product but as it
contains well digested carbon, it will also improve the structure of compact and poorly
structured mineral soils. Application of SS will increase the carbon content in the topsoil,
improve water infiltration and decrease the soil bulk density which leads to improved plant
growth and yield, and increases the microbial biomass and activity (Kätterer et al., 2014;
Jezierska-Tys and Frac, 2008; Thangarajan et al., 2013). However, disadvantages with arable
spreading of SS involve risk of contaminants being accumulated in the soil and further on
taken up by plants and transferred to food products. The concerns of the public regarding
health risks and environmental long-term effects have made many food-processing companies
and mills restricted in accepting crops grown on land with SS applied (Lantmännen, 2015).
14
In a long-term field trial at two locations with application of SS since 1981 the SS content of
heavy metals have decrease over the years (Andersson, 2012). However, the content of
copper, zinc and mercury in the soil has increased whereas the content of cadmium increased
significantly at one location, but not at the other. This emphasizes the importance of
considering the soil background concentrations of cadmium when compare results. In the
field-trial there was no significant accumulation of the heavy metals in harvested crop
compared to control with no SS application (Andersson, 2012). Accumulation of selected
xenobiotics were detected in sugar-beets from the same field trial, although this was seen only
in treatments with SS applied at rates three times higher than limited application rates
(Hörsing et al., 2014). Increased levels of mainly copper and zinc in soil were also shown in
long-term field trial study by Börjesson et al. (2014), the plant uptake of heavy metals was
however low.
2.2. Nitrification Nitrogen is essential for all living cells as it constitutes part of DNA and proteins. In plants, N
also has an important role in the photosynthesis as it constitutes structural elements in the
porphyrin group of the chlorophyll. In soil, N is bound mainly in organic material and
therefore must be mineralized and transformed by microorganisms before taken up by the
plants or other organisms.
Mineralized NH4+
and NO3-, are the forms mainly taken up by the plants, which implicate the
important role of soil microorganisms in making organic N available to the roots. However,
the ratio between carbon and N in soil determines the amount plant available N. Generally, a
C/N ratio in soil or organic fertilizer less than 20 will stimulate mineralization and if higher
than 20 immobilization will dominate. If the organic material is rich in N and exceeds the
microbial need it will be mineralized and left available to other organisms (Robertson and
Groffman, 2007).
Surplus of mineral N in soil may lead to that NH4+ is first oxidized to nitrite (NO2
-) by
ammonia-oxidizing bacteria (AOB) and then to nitrate (NO3-) by nitrite-oxidizing bacteria
(NOB) (Robertson and Groffman, 2007). The nitrification is mainly conducted by bacteria
within the family Nitobacteriaceae which are principally autotrophic and chemiolitotrophic,
meaning that they derive their carbon from CO2 and energy from the oxidation of N (Tolli and
King, 2005). Nitrifying bacteria are mainly obligate aerobes, as oxygen is used as terminal
electron acceptor in their respiration. In respiration, protons builds up charge over membranes
in the cell which drives the so-called electron transport phosphorylation of ADP to energy
rich ATP. A large quantity of NH4+ has to be oxidized by the AOB to obtain energy for
deriving the reducing power needed to fix CO2 into organic carbon by the Calvin cycle. In the
oxidation process protons are released (formulas 3 and 4) to the environment causing
lowering of pH. The oxidation of NO2- to NO3
- by NOB yields less energy than the NH4
+
oxidation, which implies slower growth (McGill, 2007). In addition, ammonia-oxidizing
archaea (AOA) has also been discovered and found to be abundant in agricultural soils
(Leininger et al., 2006; Kelly et al., 2011). Also heterotrophic fungi has been reported to
substantially contribute to nitrification in forest soils (Stams et al., 1990).
The first step of ammonia oxidation is catalyzed by the membrane bound enzyme ammonia
mono-oxygenase and produces hydroxylamine (NH2OH) (formula 3). The hydroxylamine is
then further oxidized in a second step by the enzyme hydroxylamine oxido-reductase to NO2-
(formula 4) (Bolan et al., 2004). This first step is mainly conducted by the AOB genera
15
Nitrosomonas which is common inhabitant of soils, sediments and water environments
(Prosser, 1989; Koops and Pommerening-Röser, 2001; Kowalchuk and Stephen, 2001) and
also the most pronounced genera of AOB in WWTP (Ahn, 2006). Other genera of AOB are
Nitrosococcus, Nitrosopira, Nitrosovibrio, and Nitrosolobus (Ahn, 2006).
NH4+ + O2 + 2H
+ + 2e
- NH2OH + H2O (3)
NH2OH + H2O NO2- + 5H
++ 4e
- (4)
In the nitrite oxidation by NOB, NO2- is oxidized to NO3
- by the enzyme nitrite
oxidoreductase (formula 5) (Bolan et al., 2004). This step is mainly conducted by the genera
Nitrobacter, but also by other genera Nitrospira, Nitrospina, Nitrococcus and Nitrocystis
(Ahn, 2006) may be common.
NO2- + H2O NO3
- + 2e
- + 2H
+ (5)
During ammonium oxidation production of nitric oxide (NO) and N2O is possible and these
pathways are complex involving e.g. multiple enzymes with redundant function and
overlapping pathways (Stein, 2011). Production of N2O occurs when oxygen is limiting (Poth
and Focht, 1985) or in presence of high concentrations of NO2 -
(Firestone and Davidson,
1989; Stein, 2011). The resulting NO2- may be used as electron acceptor instead of oxygen
leading to nitrite reduction, which show the ability for nitrifying bacteria to denitrify, so
called nitrifier denitrificaiton (formula 6) (Wrage et al., 2001).
NH3 NH2OH NO2- N2O N2 (6)
Nitrous oxide (N2O) can also be produced trough hydroxylamine oxidation (formula 7) (Stein,
2011) by heterotrophic nitrification bacteria, however these are less significant for N2O
emissions than autotrophic nitrification.
NH3 NH2OH NO N2O (7)
It should also be noted that N2O can also be a significant end product in denitrification, where
NO3- normally is stepwise reduced to NO2
-, NO, N2O and finally N2 (formula 2). As
denitrification bacteria are heterotrophs, a complete reduction of nitrate requires sufficient
amount of a simple carbon source as well as anaerobic environment (Firestone and Davidson,
1989).
The most important factor regulating nitrification is the supply of NH4+. The availability of
NH3, the actual substrate for AOB, is depending not only on the concentration of NH4+ but
also on the ammonia-ammonium ion equilibrium which is pH dependent (pKa = 9.25)
implying that environments with high pH are favorable to these bacteria. Other factor
regulating the process is the production rate of ammonium via mineralization, which will
increase if N rich substrates like proteins is available. Nitrifying bacteria have to compete for
the N with other microorganisms and plants assimilating N, and by ammonia volatilization
(Norton and Stark, 2011). Nitrifying bacteria are weak competitors for nitrogen and will have
access to NH4+ only if the supply in soil exceeds the plant uptake and the demand of
heterotrophs. It is known that an increase of NH4+ in soil accelerates nitrification if no other
factor is limiting, however this can differ between soils (Stark and Firestone, 1996). Some
ammonia-oxidizing bacteria, Nitrosomonas and Nitrosopira are sensitive to high
16
concentration of ammonia (Norton and Stark, 2011), which has also been shown by
Anthonisen et al. (1976) and Smith et al. (1997). Generally nitrifying bacteria are sensitive to
environmental changes such as high temperatures (Jiang and Bakken, 1999) and high
concentrations of heavy metals (Subrahmanyam et al., 2014; You et al., 2009). Nitrite, the
product of ammonium oxidation, does also have a general toxic effect to microorganisms
(Anthonisen et al., 1976). High concentration of both NH4+ and NO2
- has therefore to be
considered during experimental design of measuring nitrification rates, e.g. by reducing the
sample amount.
Nitrifiers are obligate aerobic bacteria, which, in submerged soils where oxygen is limiting,
leads to decreased nitrification (Norton and Stark, 2011). Hence, nitrifying bacteria are less
active in anaerobic environments but can live in the root zones of submerged plants to which
oxygen is supplied via diffusive or convective mechanisms through the plant or in submerged
soils where oxygen can be trapped in micro aggregates (Robertson and Groffman, 2007). It
has also been shown that ammonia oxidizers via nitrifier-denitrification can use nitrite as
electron acceptor when oxygen is limiting (Poth and Focht, 1985).
The optimum pH for nitrification is in the range of 7.5 - 8 (Prosser, 1989). Shammas (1986)
discussed that both Nitrosomonas and Nitrobacter can still be active at pH around 6, however
with lowered nitrification efficiency. Autotrophic nitrification activity have been determined
in soils with as low pH as 3 (De Boer and Kowalchuk, 2001) and up to pH 10 (Sorokin et al.,
2001; Sorokin, 1998). Dry condition will decrease the activity of ammonium oxidation mainly
due to dehydration effect on the microbial metabolic activity and cell physiology as well as
restricted substrate availability (Stark and Firestone, 1995). The optimal temperature for
nitrification is around 25-30°C (Koops et al., 1991). It has been shown that nitrification
bacteria can adapt to different temperature and moisture regimes (Mahendrappa et al., 1966)
and be active at soil temperatures as low as 2-10°C (Avrahami and Conrad, 2005; Avrahami
et al., 2003).
Different natural or anthropogenic chemicals can inhibit nitrification. Applying specific
inhibitors in e.g. agriculture allows means to retard losses of N and emissions of NO3- and
N2O from nitrification and denitrification. Calcium carbide is one product that can be
incorporated in soil which when reacting with water produces acetylene (C2H2). C2H2 inhibits
nitrification as well as the last step in denitrification, i.e. the reduction of N2O to N2
(Robertson and Groffman, 2007). Another product, with the same function as calcium carbide
is the active substance nitrapyrin (2-chloro-6-(trichloromethyl)pyridine) (Goring, 1962).
2.3. Methods for determination of nitrification activity in soil Measuring the nitrification rate, i.e. consumption of NH4
+ or production of NO3
- in soil or
activated sludge can be used to identify potential sources of N2O emissions. Analyzing N2O
itself can also be done to indicate bacterial activity but will not give answer to the actual
underlying mechanism of production as N2O may be formed by both nitrifying and
denitrifying bacteria.
Disturbance of the soil ecosystem could be caused by presence of toxic substances or
restricted access to factors needed by the microbes. The activity of the nitrification bacteria
have been used in test systems for evaluating toxic effects of chemicals (Pell et al., 1998; Pell
and Torstensson, 2003; Jezierska-Tys and Frac, 2008). Due to the importance of nitrification,
regulating N availability to roots and causing environmental pollution, several methods for
measuring its activity have been developed. The nitrification rate without addition of extra
17
mineral N estimates the natural changes in the in situ NH4+ or NO3
- pool over time, while the
potential nitrification, i.e. activity of all nitrifying enzymes present in the system can be
measured at saturated substrate conditions by adding surplus of NH4+. Nitrification rate can be
measured in the field as well as in the laboratory depending on experimental objectives
(Norton and Stark, 2011).
Changes in NO3- pool size over time due to nitrification can be measured using
15N isotope
trace or dilution techniques. In the tracer technique the N in NH4+ is labeled with
15N and
added to the system, and from the following decrease in source pool of 15
NH4+ and increase in
product pool of 15
NO3- the nitrification rate can be calculated. The tracer technique has its
weaknesses in that, (1) adding NH4+ can increase the accessible substrate and increase the
actual nitrification rate, thus overestimating the rate, (2) other non-labeled N sources of
mineralized NH4+ can be included in the nitrification substrate which underestimates
nitrification rate, and (3) immobilization of NO3- by cells will underestimate the flow of
15N
into the product pool (Norton and Stark, 2011).
In the isotope dilution technique 15
N-labled NO3- is added to the product pool and throughout
the nitrification the product pool will be diluted by the non-labeled 14
NO3-
. The rate of
dilution of the 15
N can be measured and used to calculate the gross nitrification rate.
Difficulty with the dilution technique is that it implies uniform distribution of the isotopes,
which is more or less impossible to achieve due to the heterogeneity of the soil matrix.
Another problem is that it seems like that the nitrifying enzymes display isotopic preference,
i.e. the enzymes prefer 14
N before 15
N which will underestimate the nitrification rate. The
method is also based on the assumption that nitrification and NO3- consumption is constant
through the incubation period (Norton and Stark, 2011) .
Nitrification inhibitors like C2H2 and nitrapyrin can also be used to measure the nitrification
rate by blocking the nitrification. The nitrification rate can be estimated using two soil
samples, one with and one without added inhibitor. From the change in NO3- concentration,
measured before and after the incubation in inhibited and non-inhibited soil samples, the
nitrification rate can be calculated. As the two samples are compared this method is based on
the assumption that the inhibitor blocks the nitrification completely and that the NO3-
consumption are the same in both soil samples (Norton and Stark, 2011).
Potential ammonium-oxidation rate (PAO) is defined as the rate of the nitrifying enzyme
activity in a sample under non limited substrate conditions (NH4+) in an aerobic environment
with favorable temperature and pH to the bacteria. PAO can be used to estimate the nitrifying
capacity of a soil and has been used as indicator of soil quality. The PAO assay is a rapid
method with incubation times of 6 h, which prevents AOB to display growth in number. The
method has been used in e.g. dose-response tests to assess toxicity of pesticides in soil (Pell et
al., 1998; Pell and Torstensson, 2003) and to study resources of ammonium in soil (Bollmann,
2006). The PAO assay is based on a method by Belser and Mays (1980), that after some
modification has become ISO standard (ISO, 2012). In the assay, 25 g soil sample is blended
into a substrate consisting of ammonium sulphate (0.04 mM), potassium phosphate buffer (0.2
M) at pH 7.2 to form a slurry. The nitrite oxidation, i.e. the second step of nitrification is
inhibited by adding sodium chlorate (15 mM) which results in NO2- accumulation during the
assay. Samples from the soil slurry are taken after 2 h and then every hour during a total
incubation period of 6 h. The samples are added to potassium chloride (4 M) to stop the
ammonium oxidation. The sample is then filtered and the filtrate at the different times is
18
analyzed calorimetrically for NO2-. The rate of ammonium oxidation in the assay can
theoretically be described by the following formula (formula 8):
PPAO = P0 + KPAOt (8)
where PPAO is the concentration of NO2- at time t, P0 is the concentration of NO2
- at start and
K (or PAO) is a rate constant. Thus, PAO can be determined by linear regression of obtained
data in the assay (Pell and Torstensson, 2003). The workflow of the PAO assay is described in
a picture (Fig. 2) in Material and Methods.
2.4. Methods for determination of nitrification activity in WWTP Nitrification is a crucial step in wastewater treatment as it is prerequisite for N removal by
denitrification. A common strategy to estimate nitrification activity in the activated sludge
process of a WWTP is to monitor the decrease of substrate (NH4+) or increase in end-product
(NO3-). Though this is a straight forward and simple method it does not give accurate
information on nitrification activity as several other biological N transformation processes
may take place simultaneously. Another method suggested is based on measurement of
oxygen utilization rates after stepwise addition of first the AOB inhibitor NaClO3 and then the
NOB inhibitor allylthiourea (ATU) (SurmaczGorska et al., 1996). This method allows
simultaneous assessment of ammonium oxidation and nitrite oxidation, i.e. both steps of
nitrification.
To our knowledge there is no method available for determining nitrification activity in fresh
or stored SS. The PAO assay, or similar, have been used for measuring nitrification potential
in agricultural soils (Laanbroek and Gerards, 1991; Stoyan et al., 2000), paddy soils (Bodelier
et al., 2000) and sediments (Bodelier et al., 1996), and could fulfill the needs for
determination of nitrification activity in SS. In addition of being simple it makes sense
monitoring the first step of nitrification as it is this step that may emit N2O. However, as PAO
has been developed for measurements in soil the method probably has to be adapted to SS to
ensure a reliable result. One crucial problem could be the high content of colored and
colloidal organic substances in SS that may interfere with the wavelength used in the
spectrophotometric detection of NO2- (Moorcroft et al., 2001; Davis et al., 1999). Another
problem could be that added chemicals (salts) to the wastewater treatment process for P
precipitation and the addition of polymeric electrolytes in the post treatment of the sludge
may affect the affinity of the chemicals in the assay. This could result in stronger binding of
the chemicals used in the PAO assay or the produced end-product NO2-, which could cause
biases in both the process rate and the following colorimetric analysis. Yet another factor that
must be considered is the amount of sample needed to yield optimal rates of activity, which
most likely differs to that of soil. Hence, it is obvious that before applying any existing
method for measuring nitrification activity in treated and stored SS the method must undergo
a thorough optimization to be proved reliable.
19
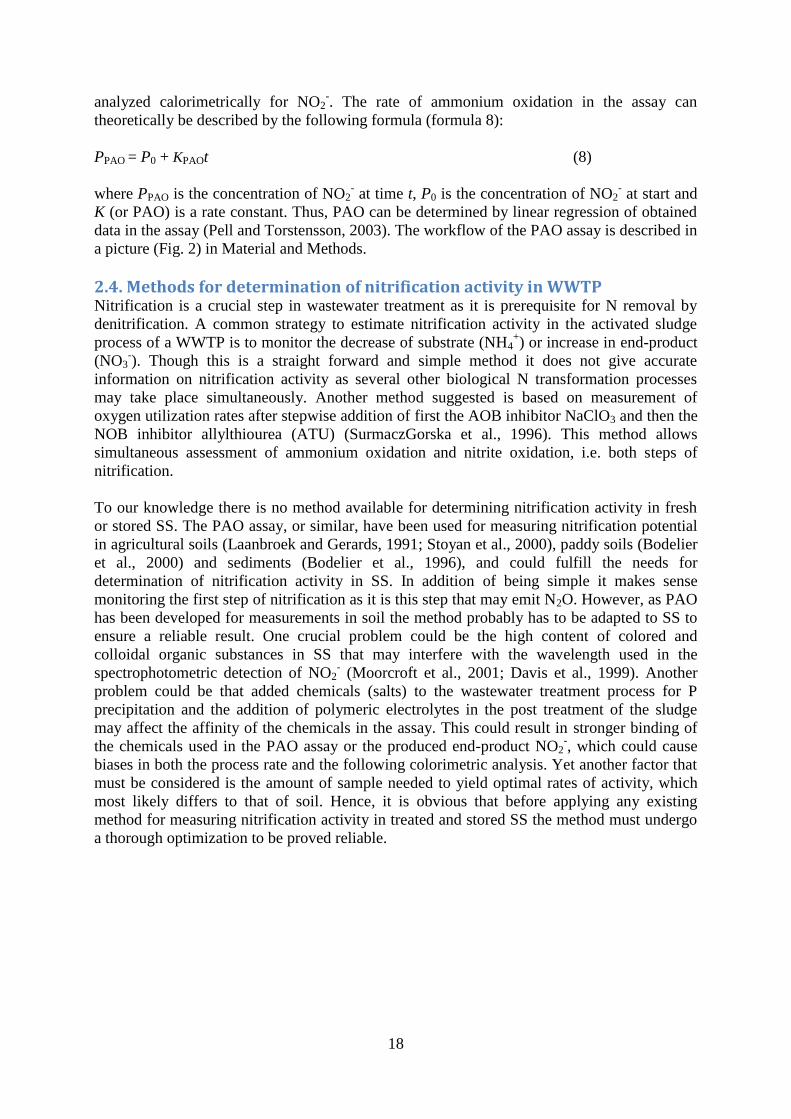
3. Material and methods The workflow of the development of a new method for assaying PAO of processed SS was
organized in 4 steps (Fig. 1). The development was based on some critical sections (1, 5, 6
and 7; Fig. 2) of the PAO assay workflow in able to receive qualitative results. After each
development step, decisions were made leading to the design of a new experiment, performed
in the following step. In Step 1 the absorbance spectrum was scanned using different amounts
of SS to determine the optimal sample size not interfering (color and opacity) with the
wavelength used for spectrophotometrical analysis of NO2- (Section 1 and 6, Fig. 2). Step 2
comprised NO2- recovery analysis of known amounts of NO2
- added to extracts of different
amounts of SS to see if the analysis protocol as that used for soil could be applied (Section 1,
5 and 6, Fig. 2), and in Step 3 further NO2- recovery analysis were done to evaluate if
different centrifugation- and extraction methods could lower disturbances and interference of
SS coloration and particles (Section 4 - 6, Fig. 2). In Step 4, PAO assay of different amounts
of SS were performed to evaluate if SS possess any AOB activity, and if so to determine what
sample amount yields highest specific rate (Section 1 and 7, Fig. 2). Results from the Step 1 -
4 were evaluated and compiled into a new recommended PAO protocol for SS. In Step 5 the
new protocol was used to assess the PAO activity of fresh and stored sewage sludge and Step
6 included PAO assay of soil applied with SS (Fig. 1).
Figure 1. Four-step strategy (Step 1 - 4, blue box) for development of a potential ammonium
oxidation (PAO) assay for sewage sludge (SS), and application of the new developed PAO
assay for assessing PAO in different sewage sludge (Step 5, red box) and in soil applied with
sewage sludge (Step 6, red box).
Step 1 •Spectrophotometric scan of sewage sludge
Step 2 •Nitrite recovery analysis
Step 3
•Effects of extraction and centrifugation refinements on nitrite recovery
Step 4
•AOB activity test fo sewage sludge and optimization of sample size
Step 5 •Application of PAO assay on sewage sludge
Step 6 •PAO assay of soil with applied sewage sludge

20
Figure 2. Schematic picture over the workflow of the PAO assay in 7 sections (after
ISO15685:2012): 1) Sample amount of soil or sewage sludge (SS), 2) Incubation of samples
and buffer substrate in +25C for 12h, 3) Blending substrate and sample to from a slurry,
place on a shaking board for 6 h in +25C, 4) Collecting five slurry samples over the 6 h
period, first sample after 2 h, following four samples every hour, 5) Centrifugation alone, or
centrifugation and filtrating of slurry samples to receive extracts with reduced amount
particles, 6) NO2-
detection in extracts by spectrophotometric analysis using Flow Injection
Analysis (FIA), 7) The rate of increasing NO2- content over time is defined as PAO (ng NO2
--
N g-1
dw h-1
).
3.1. Sewage sludge The PAO assay development Step 1 - 4 used fresh dewatered mesophilically digested sludge
(FMS) from the Kungsängen WWTP, Uppsala (Appendix 1, Table 1), and 7 month stored
mesophilically digested sludge (SMS) from Kungsängen WWTP stored at Hovgarden land-
fill site, Uppsala (Appendix 1, Table 2). In the WWTP phosphorus removal was achieved by
application of FeCl3 (PIX-111; Kemira Kemi AB, Helsingborg, Sweden), and the
polyelectrolytes Zetag 7557 (BASF, Ludwigshafen, Germany) and Superfloc C-498 (Kemira
Kemi AB) were used as flocculation agents in dewatering of the SS. The FMS was collected
directly from the dewatering centrifuge running at the WWTP and the SMS were collected
from the surface layer of a non-covered sludge pile. The SS was collected in March 7, 2014
and samples for development Step 1-3 (Fig. 1) were stored at +2°C for 2 - 4 weeks, while
samples for Step 4 were frozen in -20°C for 4 weeks.
In Step 5 and 6 the SS used, originated from a pilot study applying four different storage
methods (Jönsson et al., 2014). The SS were dewatered mesophilically digested sludge
(37.5°C) from Kungsängen WWTP and dewatered thermophilically digested sludge (53°C)
from Sunne WWTP. The P removal at Sunne where achived by AlCl3 (Ekoflock 90, Akzo
Nobel, Amsterdam, Netherlands) and Polymer Sedifloc 1060C (3F Chimica Americas/US
Polymers Inc., Aberdeen, US) for dewatering. Representative and thoroughly mixed samples
for assay of PAO in the present study were collected from all treatments of the pilot storage
study before (start) and after (end) the storage period of 375 days, 15 September 2011 - 7
1. 2. 3.
4.
5.
6. 7.

21
September 2012. The temperature during storage followed the outdoor temperature (Jönsson
et al., 2014). Samples from top and bottom layer after the storage period were also assayed.
Samples of un-stored SS (start) and stored SS (end) were frozen in -20°C for 2 years and 8
months and 1 year and 8 months respectively (Stenberg et al. 1998a).
The purpose of the pilot experiment of Jönsson et al. (2014) was to evaluate the different
storage methods regarding emission of greenhouse gases (GHG) during one year. Briefly, the
experiment was set up in a randomized complete block design with four treatments and three
blocks run for 357 days. The storage tanks consisted of cylindrical high-density polyethylene,
2 m x 1.63 m (hight x diam.) and the cover consisted of plastic tarpaulin and were attached in
a way to prevent precipitation from entering the stored sludge. Each tank was filled up to
approximately 1.3 m with sludge. The results showed that storage of SS will contribute to the
emission of GHG and that the amounts emitted depend on the design of storage. For more
details on chemical characteristics on SS and results see Appendix 2, Table 3, and (Jönsson et
al., 2014).
The SS from the pilot study applying four different storage methods are described bellow.
1) Mesophilically digested sewage sludge stored without cover, i.e. no cover (M)
2) Mesophilically digested sewage sludge stored with cover (MC)
3) Mesophilically digested sewage sludge treated with ammonia (by incorporation of
1.5% urea by weight) stored with cover (MAC)
4) Thermophilically digested sewage sludge stored with cover (TC)
3.2. Soils Soil was used as control in all steps of the method development (Step 1 - 6). For this purpose,
the 0 - 20 cm top layer of two arable soils were collected.
Clay soil (Soil I) was collected from a field trial at Brunnby experimental farm, Västerås in
central Sweden (59° 37’N, 16° 33’E). The soil was slightly dried and then sieved through a 5-
mm screen. The soil was then portioned into polyethylene bags and stored at -20°C until use.
The soil was previously characterized to have PAO of 4.8 ng NO2-N g-1
dw min-1
, which was
considered to be of median activity among Swedish soils (Stenberg et al., 1998b). This soil
was used as control in experimental Steps 1 - 5, for further details on the soil see Appendix 3.
Clay soil (Soil II) was collected from a field trial north of Uppsala (59° 53’N, 17°32’E). The
soil was transported to the laboratory on the day of sampling where it was portioned into
polyethylene bags and frozen at -20°C until use. When use the soil was thawed and sieved
through a 2 mm screen prior the experiment. The soil is the same soil as that used in a field
experiment reported by Jönsson et al. (2014). The soil was used in experimental step 6, for
further details on the soil see Appendix 3.
3.3. Analysis of nitrite Flow Injection Analysis (FIA) is an automatized photometer method conveniently used for
analysis of large number of samples (Karlberg, 1989). The NO2- in SS and soil samples in
Step 2 - 6 were analyzed by spectrophotometric detection using FIAstar 5000 (Foss - Techator
AB, Höganäs, Sweden) provided with a 5027 Sampler and the method cassette NO2-/ NO3
-
according to application note ASN 5200. In this application NO2- concentrations in the range
0.01 - 1 mg NO2--N l
-1 could be analyzed using a 40 µl sample loop and carrier solution of 2
M KCl with the pump speed of 40 rpm. The instrument was continuously re-calibrated every
22
11th
sample using the standard of 0.1 mg NO2--N l
-1. Carrier solution, extraction solution (4 M
KCl), nitrite reagents I (10 g sulfanilamid and 52 ml 37% HCl in 1 l deionized water), and
nitrite reagens II (0.5 g N-(1)-naphthylethylenediamine dihydrochloride in 0.5 l deionized
water) as well as stock-solution of standard NO2--N were all suction filtered through a 0.8 µm
Millipore filter (Merck Millipore, Darmstadt, Germany) using a deaeration-equipment before
use in order to reduce the content of particles and air bubbles. Carrier solution 2 M KCl was
diluted to 4.76% using deionized water to obtain concentration equal to the diluted samples in
Step 2 and 3. The NO2- in the samples was measured at 540 nm using a FIAStar 5000
instrument equipped with a digital dual-wavelength detector for cancelling measuring errors.
3.4. Step 1: Spectrophotometric scan of sewage sludge SS and Soil I were spread to cover the bottom of an aluminum form and thoroughly mixed.
Samples were taken diagonally from the bottom of the form, in two strikes, to get
representative samples. Three different sample amounts, 6.5, 12.5 and 25 g of fresh SS, stored
SS and Soil I with three replicates of each weight, respectively, were weighted into 250 ml
Duran flasks containing 100 ml deionized water. The flasks were shaken for 1.5 hours at 175
rpm in a room with constant temperature of +25°C after which the rpm was lowered to 80
rpm to allow sampling. From the SS and Soil I slurries of 2 ml sample from each flask were
collected and added to 10 ml Falcon test tubes prefilled with 2 ml of 4 M KCl. The tubes were
mixed and centrifuged at 4100 rpm using a swing-out rotor (Jouan CR322, France) for 10 min
after which the supernatant was filtered through a Munktell No. 4 filter paper (Munktell Filter
AB, Falun, Sweden) into a 10 ml test tube. The filtrates were then transferred to cuvettes and
absorbance spectra (200-950 nm) scanned using a Lightwave II spectrophotometer (Biochrom
Ltd, Cambridge, UK) with 2 M KCl as reference. A sample of NO2- mixed with nitrite
reagents I and II producing a pink color was scanned to determine the wavelength peak of the
NO2- color complex. In the evaluation and comparison of absorbance between SS and Soil I
the full spectrum was used, with focus on 540 nm, i.e. the wavelength used by FIA in the
NO2- analysis (Moorcroft et al., 2001).
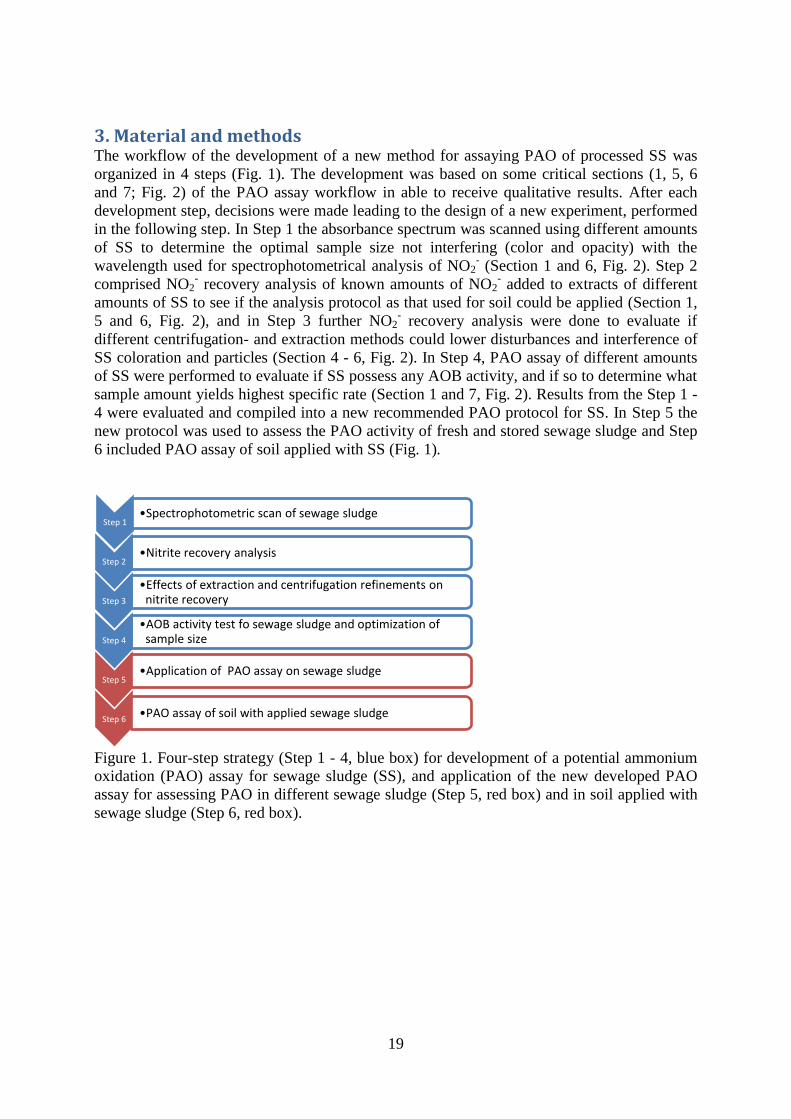
3.5. Step 2: Nitrite recovery analysis SS and Soil I were sampled and incubated using the same technique as in Step 1, above. After
incubation, samples of 3 ml from slurry flasks were dispensed into 10 ml Falcon test tubes
prefilled with 3 ml 4 M KCl, resulting in a total volume of 6 ml which was mixed (Fig. 3).
The tubes were then centrifuged and filtered as described in Step 1, above. From each tube
filtrates of 2 ml were collected and added to each of two FIA test tubes. To one of the tubes
0.1 ml of 10 mg NO2-N l-1
NO2-N stock solution, equal to 1000 ng, was added and to the
other 0.1 ml of deionized water acting as control. All extracts were analyzed for NO2- by
FIAstar 5000. By subtracting the amount NO2- in control (without NO2-N addition) from that
measured NO2- the recovery was calculated and expressed as difference in amounts (∆ NO2 –
N) and as difference in calculated amounts in relation to added amount (Recovery %).
Figure 3. Experimental design in Step 2 for NO2
- recovery analysis of sewages sludge.
Juan centrigugation + filter paper
2 ml extr. solution + 0.1 ml 10 mg NO2
-
-1 -
3 ml slurry (SS +dH2O)
+ 3 ml KCL (4M)
2 ml extr. solution + 0.1 ml dH2O
SS-slurry
23
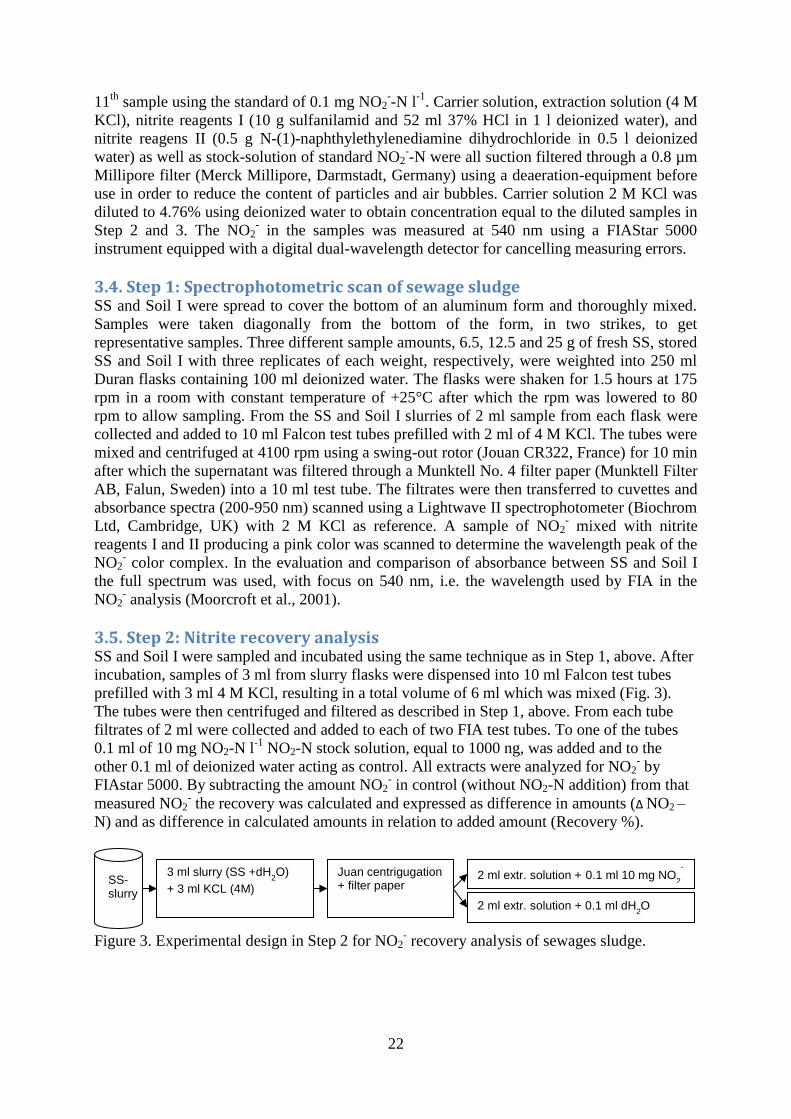
3.6. Step 3: Effects of extraction and centrifugation refinements on nitrite recovery Five replicates each of 25 g stored SS and Soil I was sampled using the same technique as in
Step 1, above, and weighted into 250 ml Duran flasks. To each flask 100 ml of deionized
water were added and then placed on a shaking table at 175 rpm for 1.5 h in a room with
constant temperature of +25°C. At sampling the shaker rate was lowered to 80 rpm and 2 ml
slurry extracted. The following three (A-C) experimental treatments were applied (Fig. 4):
Treatment A. The 2-ml slurry samples were added to 2 ml 4 M KCl in 10 ml Falcon
test tubes. The tubes were shaken and centrifuged at 4100 rpm for 10 min in a
centrifuge with swing-out rotor (Jouan CR322) after which the supernatant was filtered
through Munktell No. 4 filter paper. Two samples of each 1.5 ml were transferred to 10
ml FIA test tubes. To one tube 0.075 ml stock solution of 10 mg NO2-N l-1
was
transferred, equal to 750 ng NO2-N, and to the other tube 0.075 ml deionized water was
added.
Treatment B. The 2-ml slurry samples were added to 2 ml 4 M KCl in 10 ml Falcon
test tubes. The samples were shaken after which 2 x 2 ml were dispended into
Eppendorf test tubes and centrifuged at 15000 rpm for 10 min in Eppendorf centrifuge
(Microcentrifuge 5424 R, Eppendorf AG, Hamburg, Germany). From the supernatant
two samples of each 1.5 ml were transferred to 10 ml FIA test tubes. To one tube 0.075
ml stock solution of 10 mg NO2-N l-1
, equal to 750 ng NO2-N, and to the other tube
0.075 ml deionized water was added.
Treatment C. The 2-ml slurry samples were centrifuged in Eppendorf centrifuge
(Microcentrifuge 5424 R) at 15 000 rpm for 10 min. One ml of the supernatant was
transferred to each of two test tubes, after which 1 ml 4 M KCl was added to each tube.
To one tube 0.1 ml stock solution of 10 mg NO2-N l-1
, equal with 1000ng NO2-N was
added and to the other tube 0.1 ml deionized water was added.
All samples from the three treatments were analysed for NO2- by FIAstar 5000. NO2
-N values
of Soil I being below detection limit was adjusted to 0 mg NO2-N l-1
. Recovery was calculated
as in Step 2, above.
Figure 4. Schematic figure over the three experimental treatments (A - C) in Step 3.
SS-slurry
2 ml slurry + 2 ml KCl (4M)
2 ml slurry + 2 ml KCl (4M)
2 ml slurry
Jouan centrifuge + filter paper
1.5 ml + 0.075 ml 10 mg NO2
--N l
-1 NO2
-
1.5 ml + 0.075 ml dH2O
1.5 ml + 0.075 ml 10 mg NO2
--N l
-1 NO2
-
Eppendorf centrifuge
1.5 ml + 0.075 ml dH2O
Eppendorf centrifuge
1 ml + 1 ml KCl (4M) + 0.1 ml 10 mg NO2
--N l
-1 NO2
-
1 ml + 1 ml KCl (4M) + 0.1 ml dH2O
A
B
C
24
3.7. Step 4: AOB activity tests of sewage sludge and optimization of sample size Sewage sludge and soil were sampled using same technique as in Step 1, above. Three
replicates each of 6.25, 12.5 and 25 g thawed (frozen at -20°) stored SS, 25 g refrigerated
(stored at +2°C) stored SS and 25g thawed Soil I (frozen at -20°), were weighted into 250 ml
Duran flasks. To each flask 100 ml PAO substrate tempered to +25°C was added. The
substrate contained potassium phosphate buffer (100 mM, pH 7.24), ammonium sulphate (0.4
mM) and sodium chlorate (15 mM). Slurry samples of 2 ml were taken after 2 h and then at
every hour to receive a total of 5 samples. The slurry samples were added to 10 ml Falcon test
tubes prefilled with 2 ml 4 M KCl. After shaking the tubes, 2 + 2 ml were dispensed into 2
separate Eppendorf test tubes which were centrifuged at 15000 rpm for 10 min in Eppendorf
centrifuge (Microcentrifuge 5424 R). The supernatant were transferred to 10 ml FIA test tubes
and analysed for NO2- by FIAstar 5000 and the ammonium oxidation rates PAO (ng NO2
- g
dw-1
h-1
) were calculated as mean values from linear regression of NO2- formation over time
from each flask.
3.8. Step 5: Application of PAO assay on sewage sludge Three replicate each of 12.5 g thawed and room tempered samples of mixed (start and end)
and top and bottom (end) SS from the different treatments of the pilot storage study (M, MC,
TC and MAC) and 25 g thawed Soil I were weighted into 250 ml Duran flasks. At start of the
assay 100 ml PAO substrate tempered to +25°C was added. The flasks were placed on a
shaking table at 175 rpm in a room with constant temperature of +25°C and slurry samples of
2 ml were taken after 2 h and then at every hour to receive a total of 5 samples. The 2-ml
slurry samples were added to 2 ml 4 M KCl in 10 ml Falcon test tubes. The samples 2 + 2 ml
were shaken, dispended into 2 separate Eppendorf test tubes and centrifuged at 15 000 rpm in
10 min in Eppendorf centrifuge (Microcentrifuge 5424 R). From the supernatant samples
were transferred to 10 ml FIA test tubes using an automate pipette. NO2- was analyzed with
FIAstar 5000 and the ammonium oxidation rates PAO (ng NO2 -N g
-1 dw h
-1) were calculated
as mean values from linear regression of NO2- formation over time from the triplicate.
The samples were after the assay added to cuvettes and absorbance spectra 200-950 nm of
each sample were scanned using a Lightwave II spectrophotometer (Biochrom Ltd,
Cambridge, UK) with 2 M KCl as reference. PAO assay of five extra replicates from mixed
(end) SS from storage treatment MC of the pilot study was additionally performed to
determine repeatability and consistence of the PAO assay.
3.9. Step 6: PAO assay of soil with applied sewage sludge Portions of 25 g thawed and sieved Soil II were weighted into 250 ml Duran flasks. Then,
three replicates each of thawed and mixed (end) SS from each of the pilot study storage
treatments MC (0.556 g), M (0.591 g), TC (0.434 g) and MAC (0.482 g) were added to the
flasks and mixed with the soil corresponding to 13 700 kg fresh weight ha-1
. Three flasks with
soil but without sludge application were used as control. All flasks were then pre-incubated at
+25°C for 12 h prior to assay of PAO. At start of the assay 100 ml PAO substrate was added
and PAO assayed as described in Step 4 and ISO15685:2012. NO2- was analyzed with FIAstar
5000 and the ammonium-oxidation rates (PAO; ng NO2 -N g
-1 dw h
-1) was calculated as mean
values of the triplicates from linear regression of NO2- formation over time from each flask.
3.10. Data treatment and statistical analysis The data were statistically analysed in Excel using the add-in software XLSTAT (ver.
2015.1.03.15485, AddinSoft). One-way ANOVA followed by the Tukey (HSD) multiple
25
comparison test was used for repeated tests of paired differences between treatments and
weights regarding absorbance, nitrite content, NO2- recovery and PAO. Student t-test was
used in comparing absorbance, NO2- recovery and PAO-rates in the method development
steps. Differences between the treatment were deemed statistically significant at p<0.05.
4. Results 4.1. PAO assay development (Step 1 - 4)
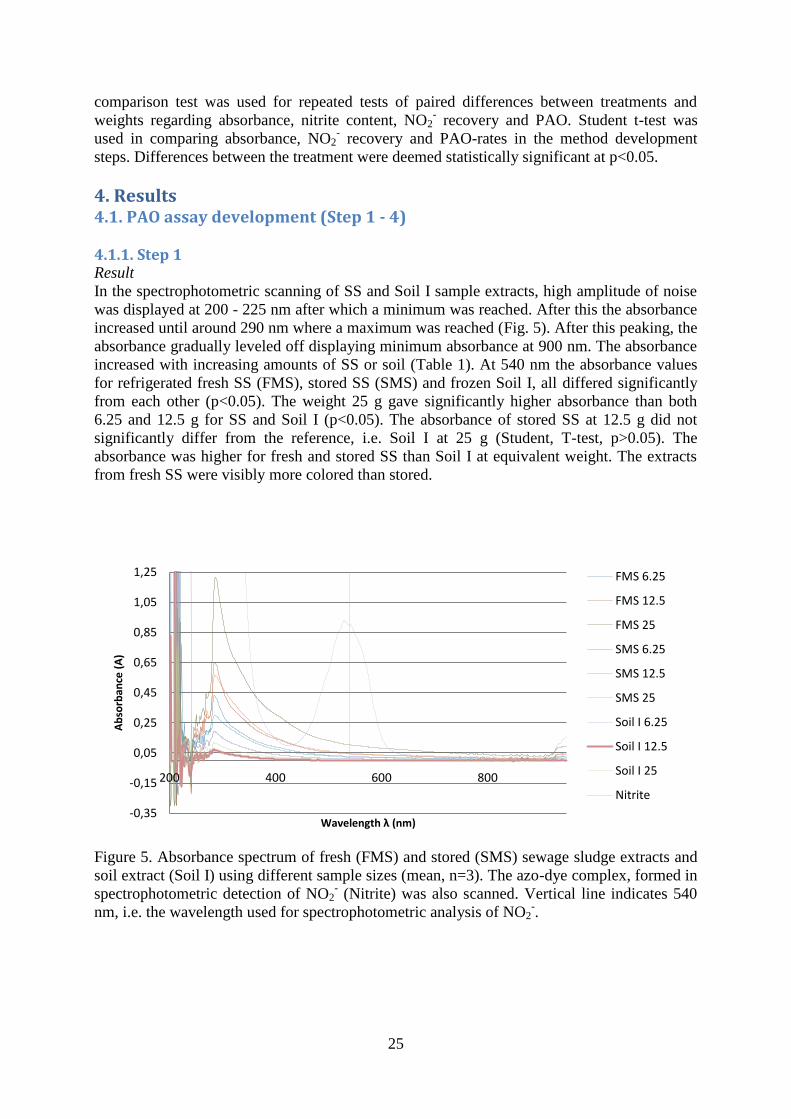
4.1.1. Step 1 Result
In the spectrophotometric scanning of SS and Soil I sample extracts, high amplitude of noise
was displayed at 200 - 225 nm after which a minimum was reached. After this the absorbance
increased until around 290 nm where a maximum was reached (Fig. 5). After this peaking, the
absorbance gradually leveled off displaying minimum absorbance at 900 nm. The absorbance
increased with increasing amounts of SS or soil (Table 1). At 540 nm the absorbance values
for refrigerated fresh SS (FMS), stored SS (SMS) and frozen Soil I, all differed significantly
from each other (p<0.05). The weight 25 g gave significantly higher absorbance than both
6.25 and 12.5 g for SS and Soil I (p<0.05). The absorbance of stored SS at 12.5 g did not
significantly differ from the reference, i.e. Soil I at 25 g (Student, T-test, p>0.05). The
absorbance was higher for fresh and stored SS than Soil I at equivalent weight. The extracts
from fresh SS were visibly more colored than stored.
Figure 5. Absorbance spectrum of fresh (FMS) and stored (SMS) sewage sludge extracts and
soil extract (Soil I) using different sample sizes (mean, n=3). The azo-dye complex, formed in
spectrophotometric detection of NO2- (Nitrite) was also scanned. Vertical line indicates 540
nm, i.e. the wavelength used for spectrophotometric analysis of NO2-.
-0,35
-0,15
0,05
0,25
0,45
0,65
0,85
1,05
1,25
200 400 600 800
Ab
sorb
ance
(A
)
Wavelength λ (nm)
FMS 6.25
FMS 12.5
FMS 25
SMS 6.25
SMS 12.5
SMS 25
Soil I 6.25
Soil I 12.5
Soil I 25
Nitrite
26
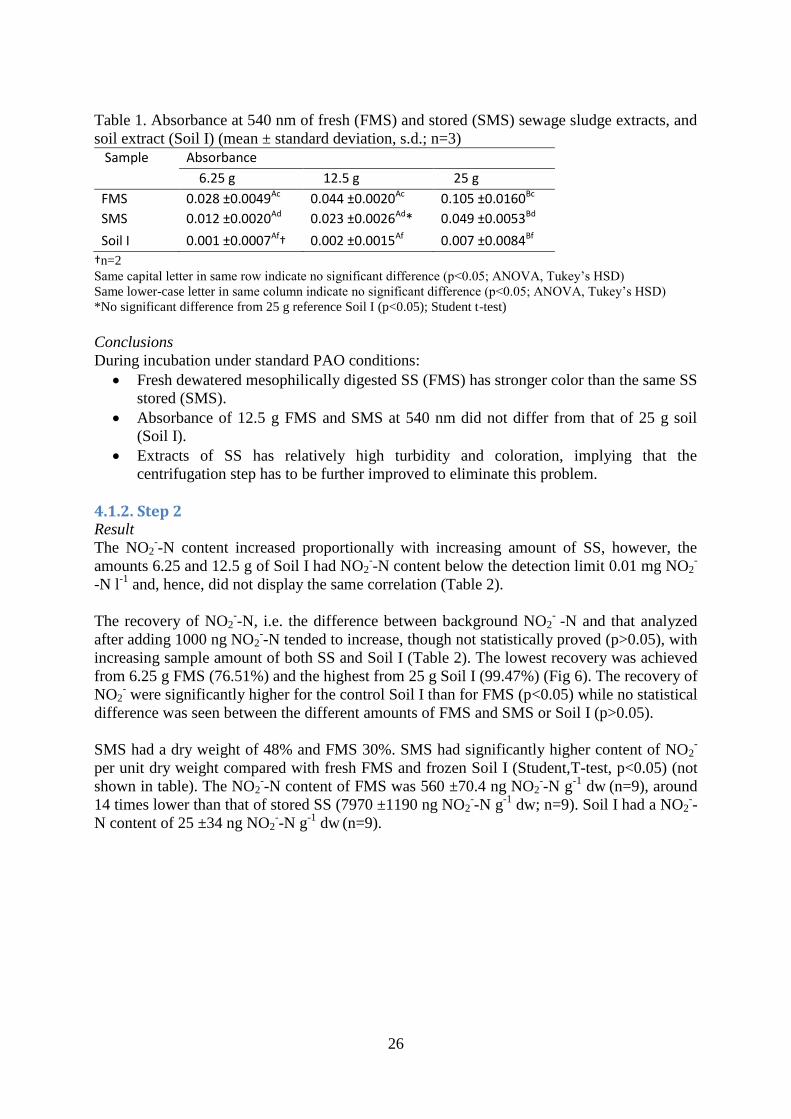
Table 1. Absorbance at 540 nm of fresh (FMS) and stored (SMS) sewage sludge extracts, and
soil extract (Soil I) (mean ± standard deviation, s.d.; n=3)
Sample Absorbance
6.25 g 12.5 g 25 g
FMS 0.028 ±0.0049Ac 0.044 ±0.0020Ac 0.105 ±0.0160Bc SMS 0.012 ±0.0020Ad 0.023 ±0.0026Ad* 0.049 ±0.0053Bd
Soil I 0.001 ±0.0007Af† 0.002 ±0.0015Af 0.007 ±0.0084Bf
†n=2
Same capital letter in same row indicate no significant difference (p<0.05; ANOVA, Tukey’s HSD)
Same lower-case letter in same column indicate no significant difference (p<0.05; ANOVA, Tukey’s HSD)
*No significant difference from 25 g reference Soil I (p<0.05); Student t-test)
Conclusions
During incubation under standard PAO conditions:
Fresh dewatered mesophilically digested SS (FMS) has stronger color than the same SS
stored (SMS).
Absorbance of 12.5 g FMS and SMS at 540 nm did not differ from that of 25 g soil
(Soil I).
Extracts of SS has relatively high turbidity and coloration, implying that the
centrifugation step has to be further improved to eliminate this problem.
4.1.2. Step 2 Result
The NO2--N content increased proportionally with increasing amount of SS, however, the
amounts 6.25 and 12.5 g of Soil I had NO2--N content below the detection limit 0.01 mg NO2
-
-N l-1
and, hence, did not display the same correlation (Table 2).
The recovery of NO2--N, i.e. the difference between background NO2
- -N and that analyzed
after adding 1000 ng NO2--N tended to increase, though not statistically proved (p>0.05), with
increasing sample amount of both SS and Soil I (Table 2). The lowest recovery was achieved
from 6.25 g FMS (76.51%) and the highest from 25 g Soil I (99.47%) (Fig 6). The recovery of
NO2- were significantly higher for the control Soil I than for FMS (p<0.05) while no statistical
difference was seen between the different amounts of FMS and SMS or Soil I (p>0.05).
SMS had a dry weight of 48% and FMS 30%. SMS had significantly higher content of NO2-
per unit dry weight compared with fresh FMS and frozen Soil I (Student,T-test, p<0.05) (not
shown in table). The NO2--N content of FMS was 560 ±70.4 ng NO2
--N g
-1 dw
(n=9), around
14 times lower than that of stored SS (7970 ±1190 ng NO2--N g
-1 dw; n=9). Soil I had a NO2
--
N content of 25 ±34 ng NO2--N g
-1 dw
(n=9).
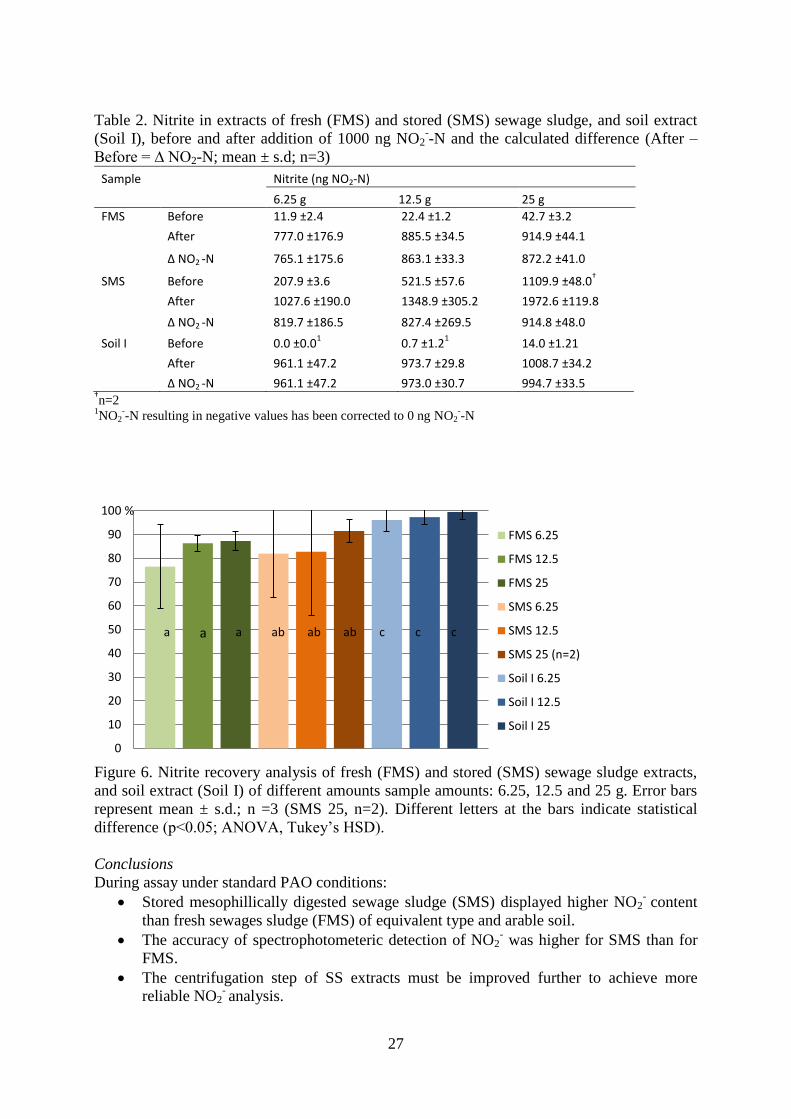
27
Table 2. Nitrite in extracts of fresh (FMS) and stored (SMS) sewage sludge, and soil extract
(Soil I), before and after addition of 1000 ng NO2--N and the calculated difference (After –
Before = ∆ NO2-N; mean ± s.d; n=3)
Sample
Nitrite (ng NO2-N)
6.25 g 12.5 g 25 g
FMS Before 11.9 ±2.4
22.4 ±1.2 42.7 ±3.2
After 777.0 ±176.9 885.5 ±34.5 914.9 ±44.1
∆ NO2 -N 765.1 ±175.6 863.1 ±33.3 872.2 ±41.0
SMS Before 207.9 ±3.6 521.5 ±57.6 1109.9 ±48.0†
After 1027.6 ±190.0 1348.9 ±305.2 1972.6 ±119.8
∆ NO2 -N 819.7 ±186.5 827.4 ±269.5 914.8 ±48.0
Soil I Before 0.0 ±0.01 0.7 ±1.2
1 14.0 ±1.21
After 961.1 ±47.2 973.7 ±29.8 1008.7 ±34.2
∆ NO2 -N 961.1 ±47.2 973.0 ±30.7 994.7 ±33.5
†n=2
1NO2
--N resulting in negative values has been corrected to 0 ng NO2
--N
Figure 6. Nitrite recovery analysis of fresh (FMS) and stored (SMS) sewage sludge extracts,
and soil extract (Soil I) of different amounts sample amounts: 6.25, 12.5 and 25 g. Error bars
represent mean ± s.d.; n =3 (SMS 25, n=2). Different letters at the bars indicate statistical
difference (p<0.05; ANOVA, Tukey’s HSD).
Conclusions
During assay under standard PAO conditions:
Stored mesophillically digested sewage sludge (SMS) displayed higher NO2- content
than fresh sewages sludge (FMS) of equivalent type and arable soil.
The accuracy of spectrophotometeric detection of NO2- was higher for SMS than for
FMS.
The centrifugation step of SS extracts must be improved further to achieve more
reliable NO2- analysis.
0
10
20
30
40
50
60
70
80
90
100
FMS 6.25
FMS 12.5
FMS 25
SMS 6.25
SMS 12.5
SMS 25 (n=2)
Soil I 6.25
Soil I 12.5
Soil I 25
%
a a ab ab ab c c c a
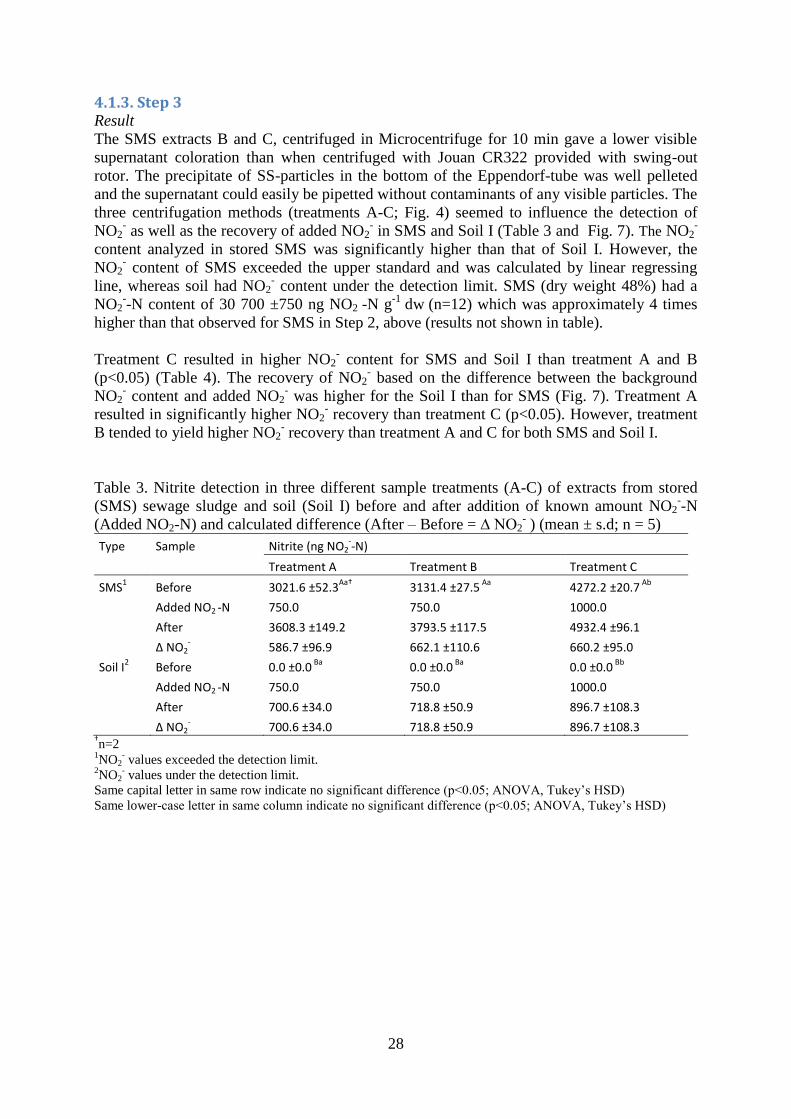
28
4.1.3. Step 3 Result
The SMS extracts B and C, centrifuged in Microcentrifuge for 10 min gave a lower visible
supernatant coloration than when centrifuged with Jouan CR322 provided with swing-out
rotor. The precipitate of SS-particles in the bottom of the Eppendorf-tube was well pelleted
and the supernatant could easily be pipetted without contaminants of any visible particles. The
three centrifugation methods (treatments A-C; Fig. 4) seemed to influence the detection of
NO2- as well as the recovery of added NO2
- in SMS and Soil I (Table 3 and Fig. 7). The NO2
-
content analyzed in stored SMS was significantly higher than that of Soil I. However, the
NO2- content of SMS exceeded the upper standard and was calculated by linear regressing
line, whereas soil had NO2- content under the detection limit. SMS (dry weight 48%) had a
NO2--N content of 30 700 ±750 ng NO2 -N g
-1 dw
(n=12) which was approximately 4 times
higher than that observed for SMS in Step 2, above (results not shown in table).
Treatment C resulted in higher NO2- content for SMS and Soil I than treatment A and B
(p<0.05) (Table 4). The recovery of NO2- based on the difference between the background
NO2- content and added NO2
- was higher for the Soil I than for SMS (Fig. 7). Treatment A
resulted in significantly higher NO2- recovery than treatment C (p<0.05). However, treatment
B tended to yield higher NO2- recovery than treatment A and C for both SMS and Soil I.
Table 3. Nitrite detection in three different sample treatments (A-C) of extracts from stored
(SMS) sewage sludge and soil (Soil I) before and after addition of known amount NO2--N
(Added NO2-N) and calculated difference (After – Before = ∆ NO2- ) (mean ± s.d; n = 5)
Type Sample Nitrite (ng NO2--N)
Treatment A Treatment B Treatment C
SMS1 Before 3021.6 ±52.3
Aa† 3131.4 ±27.5
Aa 4272.2 ±20.7
Ab
Added NO2 -N 750.0 750.0 1000.0
After 3608.3 ±149.2 3793.5 ±117.5 4932.4 ±96.1
∆ NO2- 586.7 ±96.9 662.1 ±110.6 660.2 ±95.0
Soil I2 Before 0.0 ±0.0
Ba 0.0 ±0.0
Ba 0.0 ±0.0
Bb
Added NO2 -N 750.0 750.0 1000.0
After 700.6 ±34.0 718.8 ±50.9 896.7 ±108.3
∆ NO2- 700.6 ±34.0 718.8 ±50.9 896.7 ±108.3
†n=2
1NO2
- values exceeded the detection limit.
2NO2
- values under the detection limit.
Same capital letter in same row indicate no significant difference (p<0.05; ANOVA, Tukey’s HSD)
Same lower-case letter in same column indicate no significant difference (p<0.05; ANOVA, Tukey’s HSD)

29
Figure 7. Nitrite recovery analysis of stored (SMS) sewage sludge extracts and soil extract
(Soil I) using three centrifugation methods (A, B and C). Bars represent mean ± s.d.; n = 5
(SMS A, n=2). Different letters at the bars indicate statistical difference (p<0.05; ANOVA,
Tukey’s HSD).
Conclusions
During incubation under standard PAO conditions:
The recovery of added known amounts of NO2- two extracts was lower in stored
mesophillically digested sewages sludge (SMS) than in soil (Soil I) in all three
treatment methods tested.
Treating the SS extract by centrifugation in micro centrifuge at 15 000 rpm for 10 min
(Treatment B) indicated the most reliable NO2- recovery for SS.
4.1.4. Step 4 Result
In SMS stored frozen at -20°C until analysis the NO2- accumulated linearly over time in the
PAO assay in all three sample amounts tested, 6.25, 12.5 and 25 g (r2
>0.9) (Table 4, Fig. 8).
After 2 h incubation, i.e. at the first slurry sampling in the PAO assay, the NO2- concentration
in the reference (25 g Soil I) was 577.1 ±21.6 ng NO2--N g
-1 dw, which was significantly
(p<0.05) lower than those of 6.25, 12.5 and 25 g SMS (10 040 ±1 839, 6 720 ±1 328 and 8
403 ±2 770 ng NO2--N g
-1 dw), respectively (cf. Fig. 6). The PAO rate of SMS, irrespective of
sample amount, was significantly higher than that of 25 g reference soil (Soil I; p<0.05). The
PAO rate of 6.25 g SMS was 1.7 and 2 times higher than those in 12.5 and 25 g, respectively
(p<0.05) (Fig. 9). SMS, refrigerated at +2°C during four weeks, did not show any NO2-
accumulation over time (results not shown).
0
10
20
30
40
50
60
70
80
90
100
SMS A SMS B SMS C Soil I A Soil I B Soil l C
ab b a ab b a
%

30
1: y = 1146x + 9798 r² = 0.989
2: y = 1342x + 7072 r² = 0.955
3: y = 1174x + 5828 r² = 0.982
0
2000
4000
6000
8000
10000
12000
14000
16000
18000
0 5 10
NO
2 -N (
ng
g-1 d
w)
Time (h)
SMS 6.25 g
1 2 3
1: y = 577x + 5154 r² = 0.957
2: y = 466x + 6478 r² = 0.933
3: y = 790x + 9745 r² = 0.915
0
2000
4000
6000
8000
10000
12000
14000
16000
18000
0 5 10
NO
2 -N (
ng
g-1 d
w)
Time (h)
SMS 25 g
1 2 3
1: y = 755x + 6667 r² = 0.994
2: y = 737x + 5241 r² = 0.996
3: y = 667x + 4102 r² = 0.990
02000400060008000
1000012000140001600018000
0 5 10
NO
2 -N
(n
g g-1
dw
)
Time (h)
SMS 12.5 g
1 2 3
1: y = 236x + 168 r² = 0.991
2: y = 249x + 64 r² = 0.997
3: y = 241x + 104 r² = 0.996
02000400060008000
1000012000140001600018000
0 5 10
NO
2 -N (
ng
g-1 d
w)
Time (h)
Soil I 25 g
1 2 3
Table 4. Potential ammonium oxidation (PAO) rates at three different sample amounts of
stored sewage sludge (SMS) and soil (Soil I) in the assay (mean ± s.d; n=3) Sample Dry weight
(%) PAO-rate (ng NO2 -N g
-1 dw h
-1)
6.25 g 12.5 g 25 g
SMS 45.8 1220.6 ±105.8Aa
719.8 ±46.2Ab
610.9 ±164.3Ab
Soil I 77.2 - - 241.9 ±6.3Bb
- No value for Soil I
Same capital letter in same row indicates no significant difference (p<0.05; ANOVA, Tukey’s HSD)
Same lower-case letter in same column indicates no significant difference (p<0.05; ANOVA, Tukey’s HSD)
Figure 8. Accumulation of NO2- over time in PAO assay of three different sample amounts
(6.25, 12.5 and 25 g) of stored sewage sludge (SMS) and 25 g soil (Soil I). Equations
represents linear regression equations (y = kx + m) of three replicates (1-3) where the slope
(k) is the PAO rate in ng NO2 -N g-1
dw h-1
.
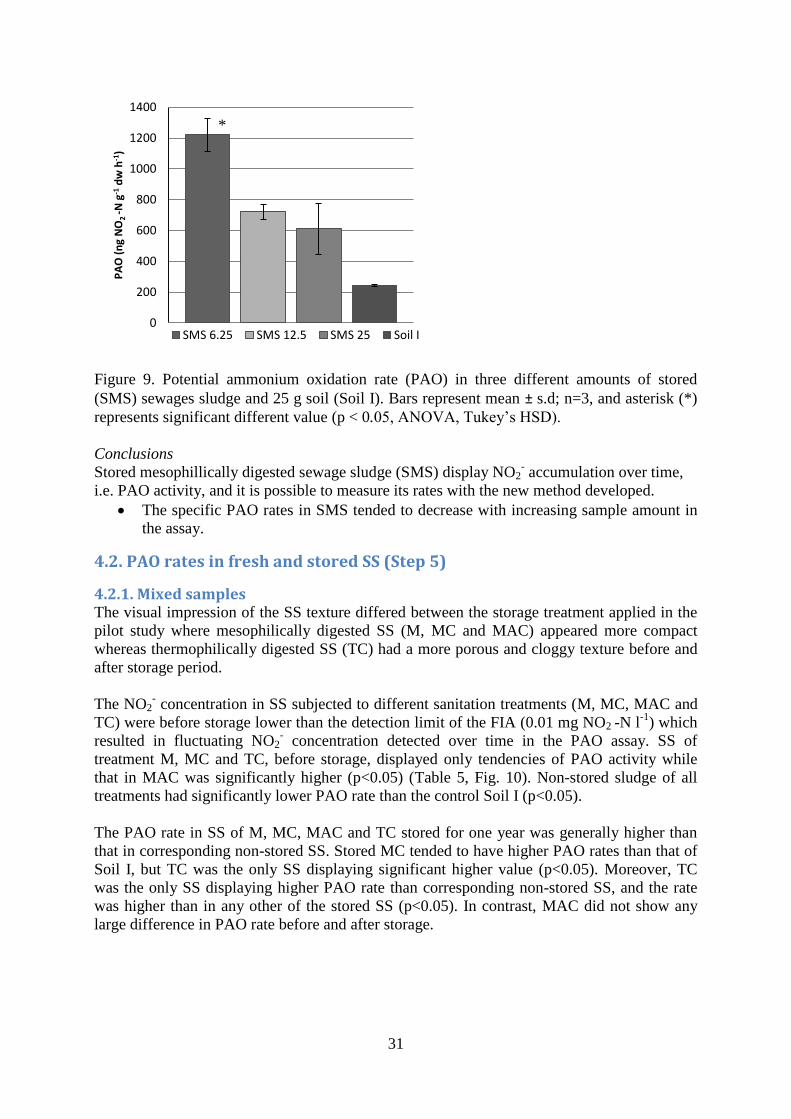
31
Figure 9. Potential ammonium oxidation rate (PAO) in three different amounts of stored
(SMS) sewages sludge and 25 g soil (Soil I). Bars represent mean ± s.d; n=3, and asterisk (*)
represents significant different value (p < 0.05, ANOVA, Tukey’s HSD).
Conclusions
Stored mesophillically digested sewage sludge (SMS) display NO2- accumulation over time,
i.e. PAO activity, and it is possible to measure its rates with the new method developed.
The specific PAO rates in SMS tended to decrease with increasing sample amount in
the assay.
4.2. PAO rates in fresh and stored SS (Step 5)
4.2.1. Mixed samples The visual impression of the SS texture differed between the storage treatment applied in the
pilot study where mesophilically digested SS (M, MC and MAC) appeared more compact
whereas thermophilically digested SS (TC) had a more porous and cloggy texture before and
after storage period.
The NO2- concentration in SS subjected to different sanitation treatments (M, MC, MAC and
TC) were before storage lower than the detection limit of the FIA (0.01 mg NO2 -N l
-1) which
resulted in fluctuating NO2- concentration detected over time in the PAO assay. SS of
treatment M, MC and TC, before storage, displayed only tendencies of PAO activity while
that in MAC was significantly higher (p<0.05) (Table 5, Fig. 10). Non-stored sludge of all
treatments had significantly lower PAO rate than the control Soil I (p<0.05).
The PAO rate in SS of M, MC, MAC and TC stored for one year was generally higher than
that in corresponding non-stored SS. Stored MC tended to have higher PAO rates than that of
Soil I, but TC was the only SS displaying significant higher value (p<0.05). Moreover, TC
was the only SS displaying higher PAO rate than corresponding non-stored SS, and the rate
was higher than in any other of the stored SS (p<0.05). In contrast, MAC did not show any
large difference in PAO rate before and after storage.
0
200
400
600
800
1000
1200
1400P
AO
(n
g N
O2
-N g
-1 d
w h
-1)
SMS 6.25 SMS 12.5 SMS 25 Soil I
*

32
Table 5. Potential ammonium oxidation (PAO) rate of different types of sewage sludge
subjected to different sanitation treatments before and after storage for one year, and soil as
reference (mean ± s.d; n=3)
Treatment Sampling point Dry weight (%)
PAO rate (ng NO2
-N g
-1 dw h
-1) r
2-value
M Start 28.8 28.4 ±97.7 0.426 ±0.281
End 20.1 119.1 ±88.3 0.768 ±0.165 MC Start 28.8 28.5 ±97.7 0.426 ±0.281
End 22.0 351.5 ±31.7 0.986 ±0.009
MAC Start 27.6 127.6 ±21.6 0.966 ±0.035 End 25.4 142.2 ±32.2 0.946 ±0.011 TC Start 27.7 15.3 ±6.3 0.302 ±0.188
End 28.2 2420.2 ±1657.4 0.975 ±0.026
Soil I - 76.3 251.4 ±3.4 0.999 ±0.001 M; Mesophilically digested sewage sludge stored without a cover, i.e. no cover
MC; Mesophilically digested sewage sludge stored with a cover
MAC; Ammonia treated mesophilically digested sewage sludge (addition of 1.5% urea by weight) stored with a
cover
TC; Thermophilically digested sewage sludge stored with a cover
-Not relevant.
Figure 10. Potential ammonium oxidation (PAO) rate, before and after storage for one year of,
of sewage sludge subjected to different sanitation treatments. Bars represent mean ± s.d; n=3.
Different letters above bars indicate statistical difference (p<0.05, ANOVA, Tukey’s HSD).
For treatment abbreviations see Table 7. Note the difference in scaling of y axes of start (left)
and end (right) panel.
4.2.2. Top and bottom layer The PAO rate in all SS subjected to the different sanitation treatments after one year of
storage was generally higher in the top-layer of the storage cylinders compared with the
bottom-layer. The PAO rate ranged between 141 and 2390 ng NO2--N g
-1 dw h
-1 in the top-
layer and 48.0 and 244 ng NO2--N g
-1 dw h
-1 in the bottom-layer (Table 6). The differences in
PAO rates between the top and bottom for MAC were small, whereas large differences were
observed in treatment M, MC and TC. Significant differences in PAO rates between top and
bottom were shown for stored MC and TC (p<0.05), whereas differences were not significant
for M and MAC.
0
50
100
150
200
250
300
PA
O (
ng
NO
2/g
dw
h-1
)
PAO-rate at Start
M MC MAC TC Soil I
c c
b
c
a
0
1000
2000
3000
4000
PA
O (
ng
NO
2/g
dw
h-1
)
PAO-rate at End
M MC MAC TC Soil I
a
b b b b
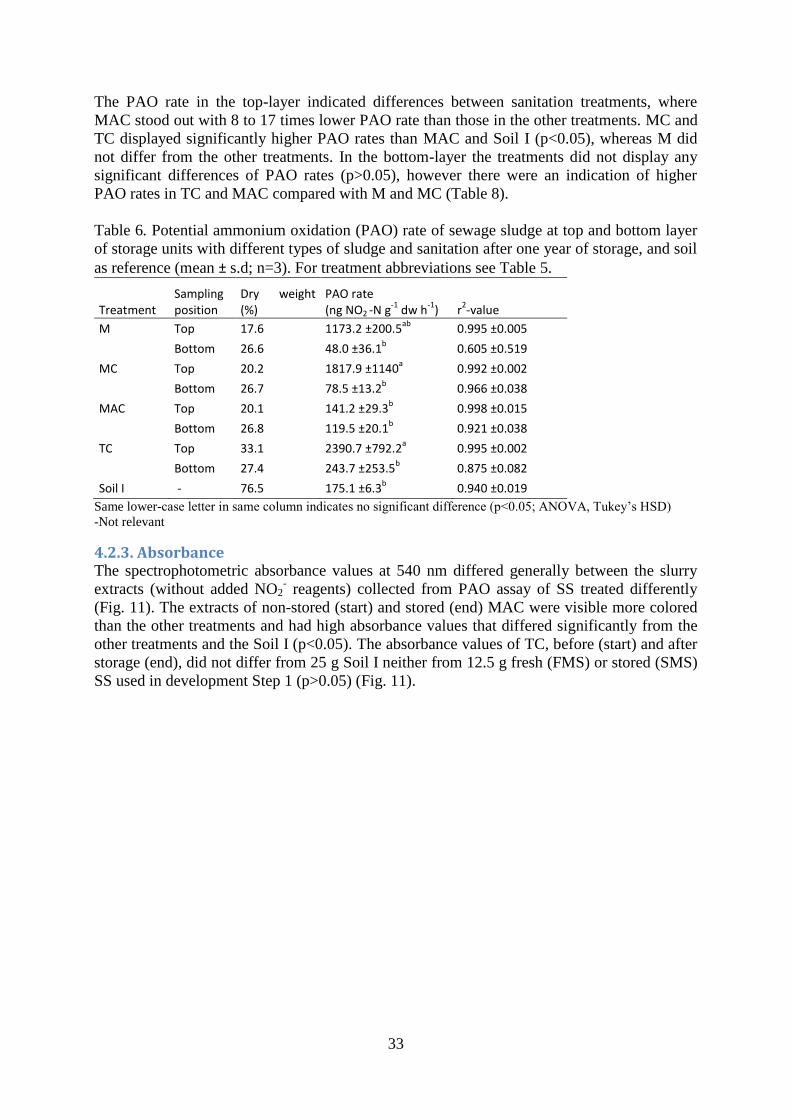
33
The PAO rate in the top-layer indicated differences between sanitation treatments, where
MAC stood out with 8 to 17 times lower PAO rate than those in the other treatments. MC and
TC displayed significantly higher PAO rates than MAC and Soil I (p<0.05), whereas M did
not differ from the other treatments. In the bottom-layer the treatments did not display any
significant differences of PAO rates (p>0.05), however there were an indication of higher
PAO rates in TC and MAC compared with M and MC (Table 8).
Table 6. Potential ammonium oxidation (PAO) rate of sewage sludge at top and bottom layer
of storage units with different types of sludge and sanitation after one year of storage, and soil
as reference (mean ± s.d; n=3). For treatment abbreviations see Table 5.
Treatment Sampling position
Dry weight (%)
PAO rate (ng NO2
-N g
-1 dw h
-1) r
2-value
M Top 17.6 1173.2 ±200.5ab
0.995 ±0.005
Bottom 26.6 48.0 ±36.1
b 0.605 ±0.519
MC Top 20.2 1817.9 ±1140a 0.992 ±0.002
Bottom 26.7 78.5 ±13.2
b 0.966 ±0.038
MAC Top 20.1 141.2 ±29.3b 0.998 ±0.015
Bottom 26.8 119.5 ±20.1b 0.921 ±0.038
TC Top 33.1 2390.7 ±792.2a 0.995 ±0.002
Bottom 27.4 243.7 ±253.5b 0.875 ±0.082
Soil I - 76.5 175.1 ±6.3b 0.940 ±0.019
Same lower-case letter in same column indicates no significant difference (p<0.05; ANOVA, Tukey’s HSD)
-Not relevant
4.2.3. Absorbance The spectrophotometric absorbance values at 540 nm differed generally between the slurry
extracts (without added NO2- reagents) collected from PAO assay of SS treated differently
(Fig. 11). The extracts of non-stored (start) and stored (end) MAC were visible more colored
than the other treatments and had high absorbance values that differed significantly from the
other treatments and the Soil I (p<0.05). The absorbance values of TC, before (start) and after
storage (end), did not differ from 25 g Soil I neither from 12.5 g fresh (FMS) or stored (SMS)
SS used in development Step 1 (p>0.05) (Fig. 11).

34
Figure 11. The absorbance of PAO extracts at 540 nm for sewage sludge (M, MC, MAC and
TC) at start (S) and end (E) of pilot storage period (blue bars) and for fresh (FMS) and stored
(SMS) sewage sludge (red bars). Extracts from PAO of soils used in in development Step 1
(Soil I) and Step 5 (Soil PAO) are displayed as references (black bars). Bars represent mean ± s.d; n=3. Different letters above bars indicate statistical differences (p<0.05) ANOVA,
Tukey’s HSD. For treatment abbreviations M, MC, MAC and TC see Table 5.
4.2.4. Repeated PAO assay The repeated PAO assays of stored mesophillic SS (MC) and Soil I resulted in PAO rates of
254 ±76 (n=5) and 214 ±4 (n=3), ng NO2- -N g
-1 dw h
-1 respectively, which were somewhat
lower values than those previously reported in Step 5 (352 ±32 (n=3) and 251 ±3 (n=3) ng
NO2--N g
-1 dw h
-1, respectively (Table 5, Fig. 12). However, the values from the two different
times of analysis did not significantly differ (p>0.05).
Overall some temporal variation seemed to occur, as indicated by the repeated measurements
of Soil I in the different development steps. PAO rates of Soil I 242 ±6.3 (Step 4), 251 ±3
(Step 5), 235 ±16.5 (Step 5) ng NO2 -N g
-1 dw h
-1, respectively were not significantly different
(Student T-test, p>0.05) . However, PAO rate 214 ±4 (Step 5) were significant different from
242 ±6.3 (Step 4) and 251 ±3 (Step 5) (Student T-test, p<0.05).
-0,050
0,000
0,050
0,100
0,150
0,200
0,250
SM SMC SMAC STC EM EMC EMAC ETC FMS SMS Soil I SoilPAO
Ab
sorb
ance
at
54
0 n
m
fg
a
b
cd
bc
def
de
efg defg
g fg
de
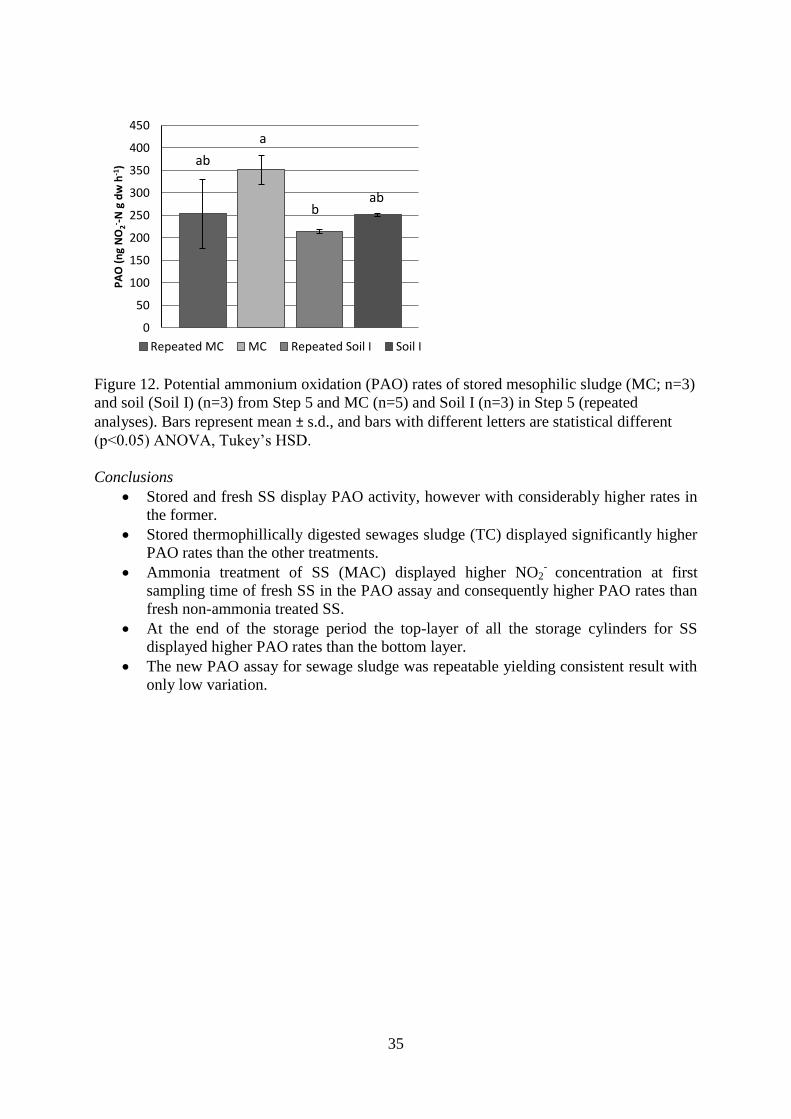
35
Figure 12. Potential ammonium oxidation (PAO) rates of stored mesophilic sludge (MC; n=3)
and soil (Soil I) (n=3) from Step 5 and MC (n=5) and Soil I (n=3) in Step 5 (repeated
analyses). Bars represent mean ± s.d., and bars with different letters are statistical different
(p<0.05) ANOVA, Tukey’s HSD.
Conclusions
Stored and fresh SS display PAO activity, however with considerably higher rates in
the former.
Stored thermophillically digested sewages sludge (TC) displayed significantly higher
PAO rates than the other treatments.
Ammonia treatment of SS (MAC) displayed higher NO2-
concentration at first
sampling time of fresh SS in the PAO assay and consequently higher PAO rates than
fresh non-ammonia treated SS.
At the end of the storage period the top-layer of all the storage cylinders for SS
displayed higher PAO rates than the bottom layer.
The new PAO assay for sewage sludge was repeatable yielding consistent result with
only low variation.
0
50
100
150
200
250
300
350
400
450P
AO
(n
g N
O2- -
N g
dw
h-1
)
Repeated MC MC Repeated Soil I Soil I
a
ab
b ab
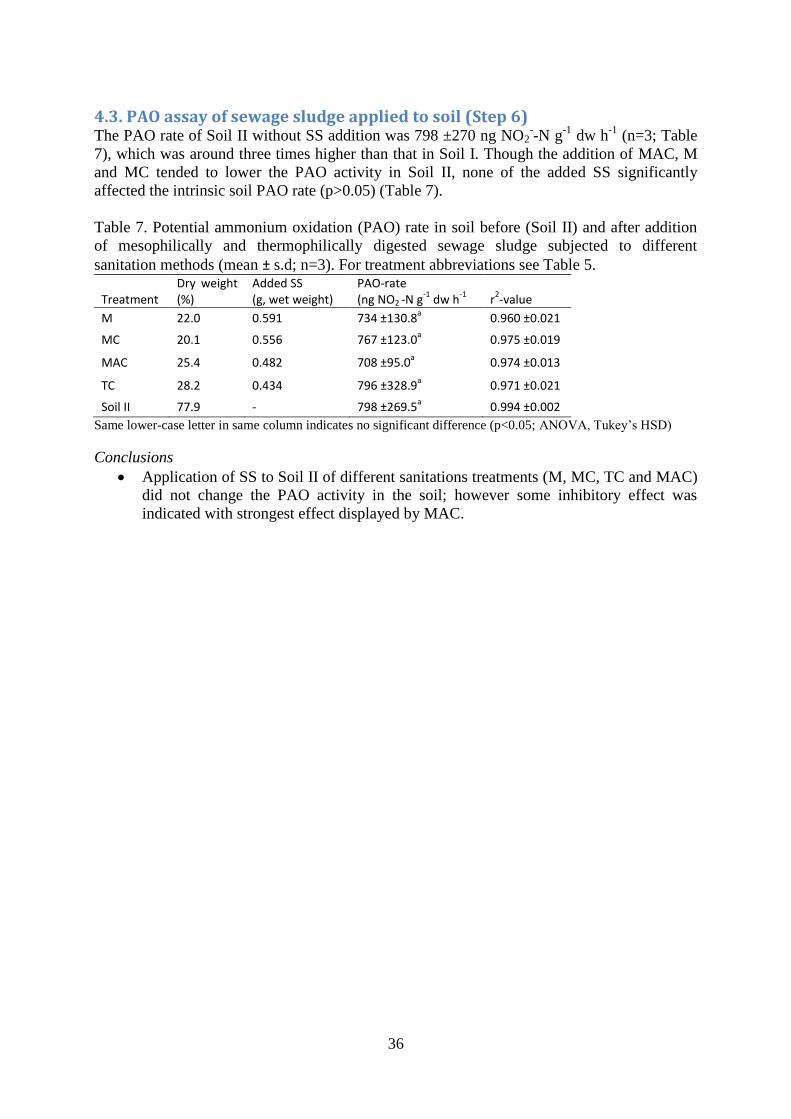
36
4.3. PAO assay of sewage sludge applied to soil (Step 6) The PAO rate of Soil II without SS addition was 798 ±270 ng NO2
--N g
-1 dw h
-1 (n=3; Table
7), which was around three times higher than that in Soil I. Though the addition of MAC, M
and MC tended to lower the PAO activity in Soil II, none of the added SS significantly
affected the intrinsic soil PAO rate (p>0.05) (Table 7).
Table 7. Potential ammonium oxidation (PAO) rate in soil before (Soil II) and after addition
of mesophilically and thermophilically digested sewage sludge subjected to different
sanitation methods (mean ± s.d; n=3). For treatment abbreviations see Table 5.
Treatment Dry weight (%)
Added SS (g, wet weight)
PAO-rate (ng NO2
-N g
-1 dw h
-1 r
2-value
M 22.0 0.591 734 ±130.8a 0.960 ±0.021
MC 20.1 0.556 767 ±123.0a 0.975 ±0.019
MAC 25.4 0.482 708 ±95.0a 0.974 ±0.013
TC 28.2 0.434 796 ±328.9a 0.971 ±0.021
Soil II 77.9 - 798 ±269.5a 0.994 ±0.002
Same lower-case letter in same column indicates no significant difference (p<0.05; ANOVA, Tukey’s HSD)
Conclusions
Application of SS to Soil II of different sanitations treatments (M, MC, TC and MAC)
did not change the PAO activity in the soil; however some inhibitory effect was
indicated with strongest effect displayed by MAC.
37
5. Discussion 5.1. PAO assay development (Step 1 - 4) The basic assumption of the PAO assay is that it estimates the total amount of ammonia
oxidizing enzymes in a system. This is achieved by creating optimal environment for the
enzymes in the assay vessel and then determine the rate of NO2- formation. Optimization
means creating the environment yielding the highest specific enzyme activity at a given
temperature. Thus in the optimization process the individual test parameters, evaluated one at
a time, yielding the highest and most accurate result should be chosen and included in the
PAO protocol. In developing the PAO assay for SS, treatment of the slurry samples collected
in the time series of the PAO assay is critical. This emphasizes the importance of choosing the
correct amount of SS for the assay as well as the best extraction and centrifugation methods of
the slurry samples collected during the assay, i.e. choosing methods yielding the clearest
sample extract for reliable spectrophotometric analysis of NO2- by FIA.
To be able to detect NO2- accurately in SS extracts by spectrophotometric methods such as
FIA the first step in the development of the PAO assay (development Step 1, PAO assay
section 1 and 6 in Fig. 2) involved trying to reduce interference of color and particles.
Background absorbance of SS extract similar to that of 25 g control Soil I was desirable as
this previously has been shown to produce extracts clear enough (ISO, 2012). The
spectrometric scan of SS extracts in development Step 1 showed low absorbance in the
critical wavelength for the FIA NO2- analysis using 12.5 g stored SS. The absorbance did not
significantly differ from that of 25 g control Soil I (p>0.05). Thus, 12.5 g SS should not
interfere with the spectrophotometric analysis of NO2, though some coloration and particles of
the SS extracts were still visible.
Determination of NO2-, using spectrophotometric methods after adding Griess reagent in an
acidic environment, is based on the diazotization reaction yielding a pink color that can be
measured colorimetrically at 540 nm (Moorcroft et al., 2001; Ahmed et al., 1996; Ivanov,
2004; Karlberg, 1989). Colored samples with absorbance spectrum within the photometric
range 500-600 nm could therefore disturb the detection of NO2- (Karlberg, 1989). Hence, high
coloration of fresh SS could cause problems of the spectrophotometer analysis. Absorbance of
the SS extracts before addition of Griess reagent was approximately 20 times higher than
extracts of soil at corresponding sample amount (Step 1, Table 1). Furthermore, the NO2-
content in fresh SS was 14 times lower than that in stored SS (Step 2). High background of
NO2-
in stored SS, resulting in a stronger coloration of the Griess reagent, could possibly
override the absorbance from intrinsic SS coloration, while measurements of the low NO2-
content in fresh sludge could be problematic in the PAO assay.
For reliable determinations of NO2- concentrations in SS, further improvement of the
extraction method was required (PAO assay, section 1, 5 and 6, Fig. 2). This was done in a
NO2- recovery test. Following the soil protocol for PAO the recovery of added NO2
- to fresh
and stored SS extracts in Step 2 was 77 - 91% for all sample weights tested while it was
considerably higher for soil (96 - 99%) (Table 2). The NO2- recovery efficiency surprisingly
increased with increasing SS and soil amount which could possibly be explained by a higher
sensitivity of the FIA with increasing total NO2- concentrations. The difference in NO2
-
recovery between SS and soil indicated that either coloration or particles, or other substances
in the SS extract disturbed the spectrophotometric detection of NO2-. The SS contained metals
that might have interfered with Griess reaction. Ivanov (2004) and Karlberg and Pacey (1989)
reported increasing disturbance of metals in the order Hg < Ag < Bi < Pb < Fe < V < Cu of
which Fe concentration is the highest in the SS used in this study (Appendix 1, Table 1 and 2)

38
(Ivanov, 2004; Karlberg and Pacey, 1989). It is also possible that other SS components such
as cationic polyelectrolytes could have bound NO2-. Thus, the absolute NO2
- concentration in
SS might not be detectable by spectrophotometric analysis using Griess reagents (Ivanov,
2004; Davidson et al., 2008), but comparing amount of accumulated NO2- after different
storage treatments using the same sludge type and amount would be possible.
As reduction of coloration and particles of SS are more easily accomplished than trying to
elude interfering substances, 25 g of stored SS was chosen in Step 3 for further refinement by
various centrifugation and extraction methods in an attempt to increase the NO2- recovery
(PAO assay, section 4 - 6, Fig. 2). Only stored SS was tested as future analysis would mainly
cover stored SS and the amount of 25 g was thought to give better detection of NO2- despite
some coloration and presence of particles could be expected in these extracts. The refinement
of centrifugation and extraction of SS resulted in centrifugation of 2 ml extract followed by
analysis of 1.5 ml supernatant (treatment B in Step 3) giving the highest NO2- recovery for
both SS and soil. However, obtaining NO2- recover rates of SS lower than 100% and also
lower recovery than that of soil in Step 2 indicated that the sample processing was still
restrained by coloration and possible interfering substances. In spite of this, treatment B was
chosen as the best method it the subsequent PAO assay of SS. Treatment C (Step 3) resulted
in a low NO2- recovery but higher NO2
- content for both SS and soil compared with treatment
A and B which indicated a delayed ammonium oxidation inhibiting effect of KCl when
stopping the reaction in the sampling procedure. The activity in treatment A and B proceeded
possibly during the centrifuge process prior to the KCl addition which was made 10-20 min
after sampling. This emphasizes the importance of adding KCl immediately after sample
extraction from the PAO assay. Treatment A in Step 3, following the soil protocol for PAO,
ISO15685:2012 (ISO, 2012) and identical to that used in Step 2, showed no difference
(Student t-test, p>0.05) in NO2-
recovery of 25 g stored SS when comparing the two steps
(Step 2 and 3). However, soil did differ (Student t-test, p<0.05) with 99% NO2- recovered in
Step 2 as compared to 93% in Step 3 (Fig. 6 and 7), the latter possibly being explained by
measurement biases.
In evaluating the AOB activity of SS while optimizing sample size in Step 4 (PAO assay,
section 1 and 7, Fig. 2), PAO activity in stored SS could be demonstrated, where sample
amount of 6.25 g showed the highest rate followed by 12.5 and then 25 g. The decreasing
PAO with increasing sample amount of SS could possibly be due to increasing concentrations
of contaminants inhibiting the PAO activity. The AOB are sensitive to environmental changes
and is a feature that has been exploited in PAO assays for testing toxicity of pollutants in soils
(Pell et al., 1998; Pell and Torstensson, 2003). To avoid risks for disturbance of the AOB
amounts of SS in the PAO assay should probably be kept low, meaning 6.25 g. However,
small sample amounts also means difficulties in assaying the activity if rates are low such as
that in fresh, not stored SS
5.1.1. The new PAO assay and protocol The decision of choosing 12.5 g SS in the final assay of PAO was based on the results of a
more stable PAO assay with high r2-value in the linear regression as well as lower variation
between the replicates compared with the other SS amounts (Fig. 8). This resulted in stable
accumulation of NO2- over time yielding solid PAO estimates. It could be argued that using
the 6.25 g SS in the PAO assay showing the highest specific PAO rate of the three SS
amounts tested in experiment Step 4 would fulfil the aim of choosing the amount yielding the
optimal PAO rate. However, as both fresh and stored SS should be assayed in the final
experiment (Step 5), and as previous experiment (Step 2) indicated very low NO2-
39
concentrations in fresh SS (FMS 6.25 g) there is an obvious risk of getting NO2- in
concentrations under the FIA detection limit of 0.01 mg NO2 -N l
-1. The higher amount of
12.5 g would therefore most likely increase the ability of assaying PAO in both fresh and
stored SS. Choosing 12.5 g there is a risk of achieving PAO rates being somewhat lower than
the actual PAO rates in vivo. It could be speculated that the lower rates using larger sample
amounts could be due to possible inhibiting contaminants in the SS. To overcome this further
development of the PAO for SS is needed. Nevertheless, if the small error in rate
determination is systematic the method would still provide a valuable tool in comparing
different methods of storing sludge for sanitization purpose like that in Step 5.
From the above work in developing of a new PAO assay for SS the following protocol is
suggested. Triplicates of 12.5 g SS is weighted into separate 250 ml Duran flasks. To each
flask 100 ml PAO substrate (100 mM K2HPO4/ KH2PO4 buffer at pH 7.24, 0.4 mM
NH4)2SO4 and 15 mM NaClO3) tempered to +25°C is added. Flasks are then placed on a
shaking table at 175 rpm in a room with constant temperature of +25°C. After slowing down
the shaking speed to 85 rpm a slurry sample of 2 ml is taken after 2 h after which the shaking
speed is reset to 175 rpm. After this new samples are taken every hour following the same
procedure to receive a total of 5 samples. The 2-ml slurry samples are added to 10 ml Falcon
test tubes prefilled with 2 ml 4 M KCl to stop the reaction. The samples are mixed thoroughly
using a vortex mixer and dispensed to 2 x 2 ml Eppendorf test tubes and centrifuged at 15 000
rpm in 10 min using a micro centrifuge. The supernatant are transferred to 10 ml FIA test
tubes using an automate pipette. All extracts are analyzed for NO2- by e.g. FIA (FIA, Tecator,
Höganäs, Sweden; application note ASN 5200). The potential ammonium oxidation rate is
calculated by linear regression of NO2- formation over time and PAO is the mean value of the
rates achieved in the three flasks expressed in ng NO2--N g dw
-1 h
-1.
5.2. PAO activity of processed sewage sludge (Step 5) The results from development Step 4 gave clear indications of PAO activity in SS. Moreover,
the activity was higher in SS that had been stored for seven months in open piles compared to
that of fresh SS. Development of PAO activity in SS during storage was also evident from the
observed increasing NO2- concentration of SS kept refrigerated at +2°C for 20 days in Step 3.
This led to concentrations exceeded the FIA upper detection limit of 1 mg NO2 -N l
-1. The
same SS analyzed 10 days earlier (in Step 2) showed 4 times lower NO2- concentration, well
in the range of FIA detection, which indicated active ammonium oxidation bacteria (AOB)
even at low temperatures. The SS showed no PAO activity four weeks later which indicated
that supporting factors like NH4+ or O2 had been depleted. The NO2
- concentration of
refrigerated SS increased over time between experimental Step 2 and 3, but then leveled off
displaying the same concentration eight days later in Step 4. AOB activity in temperatures of
2°C has previously been demonstrated by (Avrahami and Conrad, 2005; Avrahami et al.,
2003).
5.2.1. Start (mixed samples) The AOB activity in the pilot storage study was low in fresh (non-stored) mesophilically
digested (M, MC, and MAC) and thermophilically (TC) digested SS. As the AOB are
sensitive to environmental changes their activity ought to be low in fresh dewatered SS newly
originating from post-treatment in an anaerobic digester, especially when digested at
theromophilic temperatures (Jiang and Bakken, 1999). Also ammonia (NH3) treatment by
adding urea should have an inhibiting effect on the microbial population (Anthonisen et al.,
1976). The slightly higher PAO rate of NH3 treated fresh SS could however be explained by
increased aeration as SS were spread out on the ground for incorporation of urea by hand
40
prior to setting up the pilot-study. Degradation of urea to NH3 and then further to NH4+ was
possible as treated SS was uncovered and aerated for some time before covered which could
have decreased the direct sanitation effect of NH3. The NH3 treatment is effective as long as
the NH3 concentration is contained by covering the treated material (Vinnerås, 2013). The
NO2- concentration in the non-stored M, MC and TC was lower than the detection limit of the
FIA meaning that low activity causing accumulation of NO2- during the PAO incubation could
not be detected in the present study. PAO activity of non-stored SS was lower than that of
Soil I, indicating that the microbial activity was lowered by anaerobic digestion. However, the
the non-stored SS was kept frozen just over 2 years which might have affected the microbial
characteristics when unfrozen. Even though the microbial characteristics in soil should not
fluctuate over time when kept frozen at -20°C (Stenberg et al., 1998a), this has not been tested
on SS.
5.2.2. End (mixed samples) The AOB activity in stored SS was for each treatment generally higher than corresponding
non-stored. Storage most likely increased the NH4+ content in the sludge due to N
mineralization and also access of O2, both being essential factors for AOB activity (Robertson
and Groffman, 2007; Tolli and King, 2005). Increased NH4+-N levels after storage were seen
in M, MC and MAC treated sludge (Appendix 2, Table 1), whereas decreased levels were
found in TC. The decreased levels of NH4+ and also accumulated NO2
- and NO3
- after storage
support the result of high PAO activity in TC compared with the other treatments (Table 5).
Increasing contents of organic N of TC indicated microbial growth and immobilization of N.
However, the total N had decreased after storage which indicated gaseous N losses with
possible emissions of N2O through nitrification, nitrifying-denitrification or denitrification
activity, with N2O production being favored by limited oxygen supply (Poth and Focht, 1985)
and presence of high concentrations of NO2- (Firestone and Davidson, 1989; Stein, 2011). The
NH4+-N content was at start the same for the mesophilically and thermophilically digested SS,
and hence, the difference in PAO activity at the end of the storage period could be an effect of
the observed differences in SS texture. The porous and aggregated texture of the
thermophilically digested SS (TC) probably increased the O2 availability for AOB, initiating
higher PAO activity, whereas the structure of mesophillically digested SS (M, MC and MAC)
were more compact. Difference in O2 availability inside and outside SS aggregates in the TC
sludge is also possible which could explain the high variation in PAO activity among the TC
replicates.
The AOB activity seemed not to be affected by the thermophilic temperatures in the digestors
producing the sludge used in the TC treatment, which has been suggested by (Jiang and
Bakken, 1999). Nyberg et al.(2006) showed that anaerobic digestes generated in thermophilic
temperatures inhibited ammonium oxidizing bacteria more than digestates from mesophilic
temperatures and argued that organic pollutants degrade more efficient in low temperatures
(Leven and Schnurer, 2005). However, these suggested inhibitory effects seams not have
affected the AOB activity in TC. The observations of PAO activity in the TC sludge are
supported by Kowalchuk et al. (1999) who demonstrated presence AOB in thermophilic
environment and Jarvis et al. (2009) who demonstrated both presence and activity of AOB in
thermophilic composts.
The ammonia (NH3) treatment (MAC) showed a long-term decline in AOB growth as this SS
displayed 40% lower PAO activity than the same sludge stored without NH3 (MC). The low
N2O emissions observed from MAC treatment in the long-term storage trial (Jönsson et al.,
2014) strengthen the findings of inhibited nitrification and possible also denitrification,
41
probably caused by NH3 formation from added urea. At the end of the storage period the
NH4+- N content of the MAC treated sludge had increased the from 7 to 9 kg ton
-1 wet weight
SS (Appendix 2, Table 1). In addition, the low C/N ratio (<5) of the MAC treated sludge
reflects the value of ammonia treated SS as N-fertilizer product in agricultural as suggested by
Vinnerås (2013).
At the end of the storage period there were no significant differences in PAO activity between
MC and M, even though the former tended to be somewhat higher. The dry weight of MC was
higher than that of M (Table 5) which should have positively affected the O2 availability for
AOB leading to higher PAO activity. However, the aerated top-layer of M most likely favored
AOB activity during storage. The total N in the M treatment was lower than that of MC
reflecting the volatization of N as N2, N2O and NH3 (Appendix 2, Table 1).
5.2.3. Top and bottom layer The importance of O2 availability for ammonium oxidation of stored SS was seen from the
results of top and bottom layer samples. The PAO activity was generally higher in the top-
layer than in the bottom layer, the latter being O2 restricted. However, such a difference in
PAO activity between top and bottom layer was not seen in the MAC treated sludge. The
MAC sludge might be more homogeneous in O2 as the SS were mixed and aerated when urea
was incorporated.
5.3. PAO assay of SS applied to soil (Step 6) Application of SS to Soil II did not change the PAO activity in the soil. However, some
inhibitory effect was indicated with strongest effect displayed by MAC. The NH3 inhibiting
effect by urea on PAO activity (Table 5) could have affected also the soil AOB as the SS
application probably resulted in NH4+ concentrations higher than that in the PAO substrate.
SS from all storage treatments displayed lower PAO activity than the soil itself. Inhibition of
PAO by contaminants in the SS such as heavy metals, organic pollutants etc. cannot be
excluded. Inhibition of AOB activity has been seen in other studies where similar organic
products such as biogas residues and pig-slurry were applied to soil (Abubaker et al., 2015;
Levén et al., 2006). The impact of SS on the PAO activity in soil in the present study was
probably limited as only small amounts of SS, 2% of the assayed soil amount, were added.
Nevertheless, the initial NO2- concentration of each treatment added to soil were higher than
that in the soil itself, which indicate that the SS application should have affected the soil N
content.
The PAO rate of Soil II without SS addition was 798 ±270 ng NO2--N g
-1 dw h
-1 (n=3) which
could be considered moderate to high activity for a Swedish arable soil (Stenberg et al.,
1998b), and around three times as high as than that in Soil I. High intrinsic PAO indicates the
ability of a soil to mineralize and convert N. The control Soil I showed slightly lower PAO
rate in the present experiments (240 ng NO2--N g
-1 dw h
-1, n=4) than reported previously for
the same soil (288 ng NO2- -N g
-1 dw
h
-1) (Abubaker et al., 2015). The microbial
characteristics should not fluctuate over time when soil is frozen at -20°C (Stenberg et al.,
1998a), meaning the PAO rates from the same soil should not differ. However, in the present
study the assay was different using centrifugation of 2 ml extracts followed by analysis of 1.5
ml supernatant compared to the PAO protocol for soil. In addition, even though the soil was
collected in the same field spatial variation in AOB activity are likely to have influenced the
results.
42
The SS of MC, M and MAC were nearly water saturated whereas TC were dry and
aggregated, which implied difficulties in getting equal samples. The soil had higher moisture
when sieved which probably resulted in aggregate patterns differing to those when sieving a
dried soil which may have introduced variation among the samples. The NO2- detection by
FIA were interfered, possibly by contaminated NO2- standard solutions which was indicated
by an approximately 13% higher reference standard curve than those when assaying PAO in
Steps 4 and 5. However, this error did not affect the possibility to compare the treatments
within the same batch of assays. In addition, to be able to compare with previous PAO-assays
data were adjusted by lowering with 13% (mg NO2--N l
-1).
5.4. Implications of PAO in SS and SS amended soil The results show that nitrification occurs in SS and that AOB activity is high especially in
treatments where NH4+ and O2 resources are good and not disturbed by inhibiting compounds.
The PAO activity decreased when O2 seemed to become limited and when urea was added
such as in the MAC treatment (Table 5), whereas the opposite were seen in TC treatment.
A lower PAO activity in the SS decreases the transformation of NH4+ to leachabel NO2
- and
NO3- which retains the NH4
+ pool and increases its SS value as N-fertilizer. In addition,
supplementing SS with urea increased its content of NH4+ which should further enriche the
fertilizer value the SS. Application of SS to soil in the present study showed a small tendency
of inhibiting the ammonium oxidation (Table 7). This suggests that the N2O emissions may
decrease as less NO2- and
NO3
- indicates not only low AOB activity but also will retard the
activity of denitrifying bacteria in the soil matrix. As ammonia-oxidizing bacteia are senistive
to disturbance PAO has been used in evaluating toxic effects of chemicals (Pell et al., 1998;
Pell and Torstensson, 2003; Jezierska-Tys and Frac, 2008). Thus a low observed PAO activity
could possibly be a result of AOB inhibition by chemical contaminants. Such an effect was
indicated in development Step 4 (Fig. 9) where increasing amount of SS resulted in decreased
PAO-rate, which if true should contradicts the value of SS spread on arable land.
Today, SS that are not approved for soil application are mainly stored uncovered at landfills
in Sweden, which means that SS are exposed to shifting weather conditions similar to that in
the top-layer of the M treatment. Uncovered storage implicate higher availability of O2 and
increased exchange of volatilized N (NH3, N2O, N2) with the atmosphere. In addition,
infiltration of precipitated water will transport mineralized N (NH4+) and NO3
- to the bottom-
layer sustaining nitrification and denitrification. Emissions of N2O were two times higher
from M than MC (Jönsson et al, 2014) as both nitrification and denitrification are supported in
environment of fluctuating O2 (Clemens et al., 1997). The emissions of N2O from storage of
SS have been reported in several studies (Jönsson et al. 2014; Flodman, 2002), and the
measured PAO activity in SS shown in the present study indicates that nitrification is one
likely candidate of the observed emissions.
5.5. Further improvement of the PAO assay A major challenge in developing a PAO protocol for SS was to achieve a sample preparation
method yielding true NO2- concentrations in the FIA analysis. This was due to problems in
getting pure extracts. Despite efforts to centrifuge and filtrate the extracts some interference at
the used wavelength of 540 nm still seemed to remain. This problem seemed to be more
severe for the MAC treated sludge. For better accuracy in the spectrometric detection of NO2-,
discoloration chemicals could be used in the sample preparation. Furthermore, presence of
inhibitory chemicals like heavy metals and other contaminants interfering with the
diazotization reactions forming the nitrite color complex to be analyzed in the

43
spectrophotometer can not be excluded which might have lowered the efficiency of the
analysis. Also, the microbial characteristics in SS might fluctuate over time when kept frozen
at -20°C. These analyses on SS has not been done before as done for soil (Stenberg et al.,
1998a), and has to be considered in further development of the PAO assay.
Variation among the SS replicates was seen for all storage treatments, whereas soil replicates
displayed only low variation. This was however expected as the variation within SS replicates
reflects the spatial variation between three true replicates (containers) while the soil originated
from samples taken from a small spot. Lowering the variation of the SS could be
accomplished by increasing the numbers of replicates from each container. Such a procedure
would however be time consuming. The low variation among soil samples could also be
explained by soil being slightly dried, sieved and frozen before withdrawing samples, whereas
SS samples were frozen fresh and only mixed thoroughly before extracting samples for the
various steps of the PAO development. The different texture of the SS in the different
treatments also made it difficult to take accurate samples. The TC treated sludge was more
aggregated and the M treated sludge had higher water content than the other SS. The variation
in fresh weight was though compensated for, as the dry weight of each sample was recorded
and used in the calculations of the PAO rate.
Further improvement of the PAO assay could possibly be a tool among others to classify SS
by microbial activity and evaluate the contaminants effect in different batches of SS.
Moreover, the assay can also be used as a tool, as in this study, to evaluate different storage
methods of SS regarding nitrification contribution to N2O emissions and leakage of NO2-
/NO3-.
6. Conclusion This study show that ammonia oxidation occurs in fresh and stored digested and dewatered
sewage sludge (SS). The new developed PAO assay enables determination of sanitation
treatment effects in SS of which ammonia treatment seemed to have better reducing effect on
nitrification and possibly denitrification, than thermophilic temperature.
More specific:
During the development of the PAO assay, SS extracts where centrifuged in a micro
centrifuge at 15 000 rpm for 10 min (Treatment B) which resulted in the most reliable
NO2- recovery for SS and was incorporated in the new PAO assay for SS.
The specific PAO rates decreased with increasing sample amount in the assay, which
indicated content of AOB inhibiting substances in the SS. Therefore, using the new
PAO assay there is a risk of achieving PAO rates being somewhat lower than the
actual PAO rates in vivo.
The assay proved to be repeatable and yielded consistent result with only low
variation.
Termophillically treated SS (TC) had a porous structure which supplied O2 and kept
the ammonia-oxidizing bacteria (AOB) active during the one-year storage despite
coverage and digestion in thermophile temperatures.
Ammonia treated SS (MAC) inhibited the AOB displaying a long-term effect as the
PAO rate were kept low and at a constant level throughout the storage period of one
year.

44
Application of SS to soil did not change the PAO activity in soil, however some
inhibitory effects was indicated with strongest effect displayed by MAC.
Inhibition of the AOB activity leads to reduction of nitrate, also it is important to
control factors supporting nitrification during storage of SS to reduce substrate
availability for further transformation to N2O.
To overcome the observed biases in the new assay further development of the PAO for SS is
needed. However, the observed deviation in rates was low and systematic which should still
provide a valuable tool in assessing PAO rates and comparing different treatment methods for
storing SS for sanitization purpose.
7. Acknowledgement I am grateful to my supervisor Mickael Pell at the Department of Microbiology of Swedish
University of Agricultural Sciences that have been supportive and encouraging during the
development work of the assay and for critical reading of the essay.
Agnes Widén for providing sewages sludge samples to my study and information about the
pilot study of different storage treatments.
Elisabet Börjesson, Maria Hellman, Harald Cederlund and Johnny Ascue Contreras for
assistance in the laboratory and introduction to the detection method FIA.
Eric Cato at the wastewater treatment plant, Kungsängsverket in Uppsala for providing
samples of sewages sludge for the development of the PAO assay.
Kersti Linderholm for support, critical reading of the essay and being encouraging.
Tina Putz and Lea Wittorf, Anton Pallin, Simon Isaksson and Tong Liu for great
companionship, support and making me look forward to come the office and laboratory every
day.
Last but not least I thank my family and all friends for believing in me and always being
supportive and encouraging.
45
8. References Abubaker, J., Risberg, K., Jönsson, E., Dahlin, A. S., Cederlund, H. & Pell, M. 2015. Short-
term effects of biogas digestates and pig slurry application on soil microbial activity.
Applied and Environmental Soil Science, 2015, 15.
Ahmed, M. J., Stalikas, C. D., TzouwaraKarayanni, S. M. & Karayannis, M. I. 1996.
Simultaneous spectrophotometric determination of nitrite nitrate by flow-injection
analysis. Talanta, 43, 1009-1018.
Ahn, Y. H. 2006. Sustainable nitrogen elimination biotechnologies: A review. Process
Biochemistry, 41, 1709-1721.
Akerman, A., Massague, A., Mehier, S., Senante, E., Escaler, I., Martel, J. L. & Audic, J. M.
2010. Methodology for the assessment of the greenhouse gas impact of wastewater
sludge treatment. Journal of Water and Climate Change, 1, 227-233.
Andersson, P.-G. 2012. Slamspridning på åkermark. Fältförsök med kommunalt avloppslam
från Malmö och Lund under åren 1981 - 2011. Hushållningssällskapet Malmöhus.
Anthonisen, A. C., Loehr, R. C., Prakasam, T. B. S. & Srinath, E. G. 1976. Inhibition of
nitrification by ammonia and nitrous-acid. Journal Water Pollution Control
Federation, 48, 835-852.
Avrahami, S. & Conrad, R. 2005. Cold-temperate climate: a factor for selection of ammonia
oxidizers in upland soil? Canadian Journal of Microbiology, 51, 709-714.
Avrahami, S., Liesack, W. & Conrad, R. 2003. Effects of temperature and fertilizer on
activity and community structure of soil ammonia oxidizers. Environmental
Microbiology, 5, 691-705.
Belser, L. W. & Mays, E. L. 1980. Specific- inhibition of nitrite oxidation by chlorate and its
use in assessing nitrification in soils and sediments. Applied and Environmental
Microbiology, 39, 505-510.
Bitton, G. 2005. Wastewater microbiology, Hoboken, N.J., Hoboken, N.J. : Wiley-Liss, John
Wiley & Sons.
Bodelier, P., Hahn, A. P., Arth, I. R. & Frenzel, P. 2000. Effects of ammonium- based
fertilisation on microbial processes involved in methane emission from soils planted
with rice. Biogeochemistry, 51, 225-257.
Bodelier, P., Libochant, J., Blom, C. & Laanbroek, H. 1996. Dynamics of nitrification and
denitrification in root- oxygenated sediments and adaptation of ammonia- oxidizing
bacteria to low- oxygen or anoxic habitats. Applied And Environmental Microbiology,
62, 4100-4107.
Bolan, N. S., Saggar, S., Luo, J. F., Bhandral, R. & Singh, J. 2004. Gaseous emissions of
nitrogen from grazed pastures: Processes, measurements and modelling,
environmental implications, and mitigation. Advances in Agronomy, Vol 84, 84, 37-
120.
Bollmann, A. 2006. Nitrification in soil. In: Bloem, J., Hopkins, D. W. & Benedetti, A. (eds.)
Microbiological methods for assessing soil quality. Wallingford: Wallingford: CABI.
Borjesson, G., Kirchmann, H. & Katterer, T. 2014. Four Swedish long-term field experiments
with sewage sludge reveal a limited effect on soil microbes and on metal uptake by
crops. Journal of Soils and Sediments, 14, 164-177.
Clemens, J., Vandre, R., Kaupenjohann, M. & Goldbach, H. 1997. Ammonia and nitrous
oxide emissions after landspreading of slurry as influenced by application technique
and dry matter reduction .2. Short term nitrous oxide emissions. Zeitschrift Fur
Pflanzenernahrung Und Bodenkunde, 160, 491-496.
46
Davidson, E. A., Dail, D. B. & Chorover, J. 2008. Iron interference in the quantification of
nitrate in soil extracts and its effect on hypothesized abiotic immobilization of nitrate.
Biogeochemistry, 90, 65-73.
Davis, J., McKeegan, K. J., Vaughan, D. H. & Cardosi, M. F. 1999. Evaluation of phenolic
assays for the detection of nitrite. Talanta, 50, 103-112.
De Boer, W. & Kowalchuk, G. A. 2001. Nitrification in acid soils: micro-organisms and
mechanisms. Soil Biology and Biochemistry, 33, 853-866.
Firestone, M. K. & Davidson, E. A. 1989. Microbiological basis of NO and N2O production
and consumption in soil. Exchange of Trace Gases between Terrestrial Ecosystems
and the Atmosphere, 47, 7-21.
Flodman, M. 2002. Emissioner av metan, lustgas och ammoniak vid lagring av avvattnat
rötslam. Meddelande 2002:4. Uppsala: Institutionen för lantbruksteknik. SLU –
Sveriges Lantbruksuniversitet.Goring, A.I,C, 1962. Control of nitrification by 2-
chloro-6-(trichloro-methyl) pyridine. Soil science, 93, 211-218.
Heberer, T. 2002. Occurrence, fate, and removal of pharmaceutical residues in the aquatic
environment: a review of recent research data. Toxicology Letters, 131, 5-17.
Hörsing, M., Eriksson, E., Gissén, C., Jansen, J. L. C. & Ledin, A. 2014. Organic pollutants in
beet and haulm cultivated on farmland fertilized with sludge from municipal
wastewater treatment plants. Bromma: Svenskt Vatten.
IPCC, 2013. Climate Change 2013: The physical science basis. Contribution of working
group I to the fifth assessment report of the intergovernmental panel on climate
change. [Stocker, T. F., D. Qin, G.-K. Plattner, M. Tignor, S. K. Allen, J. Boschung,
A. Nauels, Y. Xia, V. Bex and P. M. Midgley (eds.)]. Cambridge University Press,
Cambridge, United Kingdom and New York, NY, USA, 1535 pp
ISO 15685, 2012. Soil quality - Determination of potential nitrification and inhibition of
nitrification - Rapid test by ammonium oxidation. Switzerland patent application.
Ivanov, V. M. 2004. The 125th anniversary of the Griess reagent. Journal of Analytical
Chemistry, 59, 1002-1005.
Jarecki, M. K., Parkin, T. B., Chan, A. S. K., Kaspar, T. C., Moorman, T. B., Singer, J. W.,
Kerr, B. J., Hatfield, J. L. & Jones, R. 2009. Cover crop effects on nitrous oxide
emission from a manure- treated Mollisol. Agriculture, Ecosystems and Environment,
134, 29-35.
Jarvis, A., Sundberg, S., Milenkovski, S., Pell, M., Smårs, S., Lindgren, P.-E. & Hallin, S.
2009. Activity and composition of ammonia oxidizing bacterial communities and
emission dynamics of NH3 and N2O in a compost reactor treating organic household
waste. Journal of Applied Microbiology, 106, 1502-1511.
Jezierska-Tys, S. & Frac, M. 2008. Effect of sewage sludge on selected microbiological and
biochemical indices of soil fertility in view of domestic and world wide studies: a
review. Acta Agrophysica, 12, 393-407.
Jiang, Q. Q. & Bakken, L. R. 1999. Comparison of Nitrosospira strains isolated from
terrestrial environments. Fems Microbiology Ecology, 30, 171-186.
Jordbruksverket 2015. Försäljning av mineralgödsel 2013/2014, Statistikrapport 2015:02.
[Online] Available from:
http://www.jordbruksverket.se/omjordbruksverket/statistik/statistikomr/ovrigstatistik.4
.67e843d911ff9f551db80004881.html. [Accessed: October 30, 2015].
Jönsson, H., Junestedt, C., Willén, A., Yang, J., Tjus, K., Baresel, C., Rodhe, L., Trela, J.,
Pell, M. & Andersson, S. 2014. Reduce greenhouse gas emissions from wastewater
treatment and sewage sludge. Bromma: Svenskt Vatten AB.
Karlberg, B. & Pacey G.E. 1989. Flow injection analysis. Amsterdam: Elsevier.
47
Kelly, JJ., Policht, K., Gancharova, T. & Hundal, LS. 2011. Distinct responses in ammonia-
oxidizing archaea and bacteria after addition of biosolids to an agricultural soil.
Applied and environmental microbiology, 77 (18), 6551-6558.
Koops, H.-P. & Pommerening-Röser, A. 2001. Distribution and ecophysiology of the
nitrifying bacteria emphasizing cultured species.
Koops, H. P., Bottcher, B., Moller, U. C., Pommereningroser, A. & Stehr, G. 1991.
Classification of 8 new species of ammonia-oxidazing bacteria - Nitrosomonas-
communis sp-nov, Nitrosomonas-ureae sp-nov, Nitrosomonas-aestuarii sp-nov,
Nitrosomonas-marina sp-nov, Nitrosomonas-nitrosa sp-nov, Nitosomonas-eutropha
sp-nov, Nitrosomonas-oligotropha sp-nov and nitrosomonas-halophila sp-nov. Journal
of General Microbiology, 137, 1689-1699.
Kowalchuk, G. A., Naoumenko, Z., Derikx, P., Felske, A., Stephen, J. & Arkhipchenko, I.
1999. Molecular analysis of ammonia-oxidizing baceria of the β subdivision of the
class Proteobacteri in compost and composted materials. Applied and Environmental
Microbiology, 66 (2), 396-403.
Kowalchuk, G. A. & Stephen, J. R. 2001. Ammonia-oxidizing bacteria: A model for
molecular microbial ecology. Annual Review of Microbiology, 55, 485-529.
Krav, 2015. KRAVs regler 2015. [Online] Available from: http://www.krav.se/regel/kravs-
regler-2015. [Accessed: 2nd
September 2012].
Krogstad, T., Sogn, T. A., Asdal, A. & Saebo, A. 2005. Influence of chemically and
biologically stabilized sewage sludge on plant-available phosphorous in soil.
Ecological Engineering, 25, 51-60.
KSLA 2012. Agronomiska perspektiv på slam som gödselmede- Slam som produktionsresurs
i svenskt jord- och skogsbruk. Stockholm: Kungl. skogs- och Lantbruksakademin.
Kätterer, T., Börjesson, G. & Kirchmann, H. 2014. Changes in organic carbon in topsoil and
subsoil and microbial community composition caused by repeated additions of organic
amendments and N fertilisation in a long-term field experiment in Sweden.
Agriculture, Ecosystems & Environment, 189, 110-118.
Laanbroek, H. J. & Gerards, S. 1991. Effects of organic manure on nitrification in arable
soils. Biology and Fertility of Soils, 12, 147-153.
Lantmännen, 2015. Slam och restproduktspolicy 2015. [Online] Available from:
http://www.lantmannenlantbruk.se/sv/Affarsvillkor/Inkopsvillkor-/Slam--och-
restproduktspolicy-2015/. [Accessed: 2nd
September 2, 2015].
Leininger, S., Urich, T., Schloter, M., Schwark, L., Qi, J., Nicol, G. W., Prosser, J. I.,
Schuster, S. C. & Schleper, C. 2006. Archaea predominate among ammonia-oxidizing
prokaryotes in soils. 442, 806-809.
Leven, L. & Schnurer, A. 2005. Effects of temperature on biological degradation of phenols,
benzoates and phthalates under methanogenic conditions. Int. Biodeterior. Biodegrad.,
55, 153-160.
Levén, L., Nyberg, K., Korkea-aho, L. & Schnürer, A. 2006. Phenols in anaerobic digestion
processes and inhibition of ammonia oxidising bacteria ( AOB) in soil. Science of the
Total Environment, 364, 229-238.
Linderholm, K. 1997. Fosforns växttillgänglighet i olika typer av slam, handelsgödsel samt
aska. Stockholm: VA-FORSK, VAV AB.
Mahendrappa, M. K., Smith, R. L. & Christiansen, A. T. 1966. Nitrifying organisms affected
by climatic region in western United States. Proceedings. Soil Science Society of
America, 30, 60-62.
McGill, W. B. 2007. The physiology and biochemistry of soil organisms. In: Paul, E. A. (ed.)
Soil microbiology, ecology and biochemistry. Amsterdam; Boston: Academic Press.
48
Moorcroft, M. J., Davis, J. & Compton, R. G. 2001. Detection and determination of nitrate
and nitrite: A review. Talanta, 54, 785-803.
Naturvårdsverket 2002. Aktionsplan för återföring av fosfor ur avlopp. Rapport 5214.
Stockholm: Naturvårdsverket.
Naturvårdsverket 2013. Hållbar återköring av fosfor. Rapport 6580. Stockholm:
Naturvårdsverket.
Naturvårdsverket 2014. National Inventory Report, Greenhouse Gas Emission Inventories
1990-2012. Stockholm: Naturvårdsverket.
Norton, J. M. & Stark, J. M. 2011. Regulation and measurement of nitrification in terrestrial
systems. In: Klotz, M. G. (ed.) Methods in Ensymology, 486,.343-368. Burlington
Academic Press.
Nyberg, K., Schnürer, A., Sundh, I., Jarvis, Å. & Hallin, S. 2006. Ammonia- oxidizing
communities in agricultural soil incubated with organic waste residues. Biology and
Fertility of Soils, 42, 315-323.
Otabbong, E. 1997. Agronomic value and behaviour of sewage sludge P in incubation and pot
experiments. Uppsala: Sveriges lantbruksuniversitet.
Parkin, T. B., Kaspar, T. C. & Singer, J. W. 2006. Cover crop effects on the fate of N
following soil application of swine manure. Plant and Soil, 289, 141-152.
Pell, M., Stenberg, B. & Torstensson, L. 1998. Potential denitrification and nitrification tests
for evaluation of pesticide effects in soil. Ambio, 27, 24-28.
Pell, M. & Torstensson, L. 2003. Toxicity testing in soil, use of microbial and enzymatic tests.
Encyclopedia of Agrochemicals. John Wiley & Sons, Inc.
Pell, M. & Wörman, A. 2008. Biological Wastewater Treatment Systems, Encyclopedia of
Ecology. Elsevier B.V. Amsterdam. 1, 426-441.
Poth, M. & Focht, D. D. 1985. N-15 kinetic-analysis of N2O production by Nitrosomonas-
europaea - an examination of nitrifier denitrification. Applied and Environmental
Microbiology, 49, 1134-1141.
Prosser, I. 1989. Autotrophic nitrification in bacteria. Adv. Microb. Physiol, 20, 125-192.
Rigby, H., Perez-Viana, F., Cass, J., Rogers, M. & Smith, S. R. 2009. The influence of soil
and biosolids type, and microbial immobilisation on nitrogen availability in biosolids-
amended agricultural soils - implications for fertiliser recommendations. Soil Use and
Management, 25, 395-408.
Rigby, H. & Smith, S. R. 2013. Nitrogen availability and indirect measurements of
greenhouse gas emissions from aerobic and anaerobic biowaste digestates applied to
agricultural soils. Waste Management, 33, 2641-2652.
Robertson, G. P. & Groffman, P. M. 2007. Nitrogen transformations. In: Paul, E. A. (ed.) Soil
microbiology, ecology, and biochemistry. Amsterdam; Boston: Academic Press.
Rodhe, L. & Pell, M. 2005. Täckt ytmyllning av flytgödsel i vall – teknikutveckling,
ammoniakavgång, växthusgaser och avkastning, JTI-rapport Lantbruk & Industri nr
337. Uppsala: JTI – Institutet för jordbruks- och miljöteknik.
Shammas, N. K. 1986. Interactions of Temperature, pH, and Biomass on the Nitrification
Process. Journal (Water Pollution Control Federation), 58, 52-59.
Sigill Kvalitetssystem AB, 2015. Policy: Kretslopp av restprodukter från samhälet. [Online]
Available from: http://sigill.se/IP-standard/om-IP-standarden/syfte--
trovardighet/policy/kretslopp-av-restprodukter-fran-samhallet/. [Accessed: 2nd
Septeber 2015].
SJVFS 2004:62 2004. Föreskrifter om ändring i Statens jordbruksverks föreskrifter och
allmänna råd (SJVFS 2004:62) om miljöhänsyn i jordbruket vad avser växtnäring;.
Jönköping: Statens jordbruksverk.
49
Smith, R. V., Burns, L. C., Doyle, R. M., Lennox, S. D., Kelso, B. H. L., Foy, R. H. &
Stevens, R. J. 1997. Free ammonia inhibition of nitrification in river sediments leading
to nitrite accumulation. Journal of Environmental Quality, 26, 1049-1055.
SNFS1994:2MS:72 1994. Kungörelse med föreskrifter om skydd för miljön, särskilt marken,
när avloppsslam används i jordbruket;. Stockholm: Naturvårdsverket.
Sorokin, D., Tourova, T., Schmid, M. C., Wagner, M., Koops, H. P., Kuenen, J. G. & Jetten,
M. 2001. Isolation and properties of obligately chemolithoautotrophic and extremely
alkali-tolerant ammonia-oxidizing bacteria from Mongolian soda lakes. Archives of
Microbiology, 176, 170-177.
Sorokin, D. Y. 1998. On the possibility of nitrification in extremely alkaline soda biotopes.
Microbiology, 67, 335-339.
Stams, A. J. M., Flameling, E. M. & Marnette, E. C. L. 1990. The importance of autotrophic
versus heterotrophic oxidation of atmospheric ammonum in forest ecosystems with
acid soil. Fems Microbiology Ecology, 74, 337-344.
Stark, J. M. & Firestone, M. K. 1995. Mechanims for soil-moisture effects on activity of
nitrifying bacteria. Applied and Environmental Microbiology, 61, 218-221.
Stark, J. M. & Firestone, M. K. 1996. Kinetic characteristics of ammonium-oxidizer
communities in a California oak woodland-annual grassland. Soil Biology &
Biochemistry, 28, 1307-1317.
Stein, L. Y. 2011. Surveying N2O-producing pathways in bacteria. Methods in Enzymology:
Research on Nitrification and Related Processes, 486 (A), 131-152.
Stenberg, B., Johansson, M., Pell, M., Sjodahl-Svensson, K., Stenstrom, J. & Torstensson, L.
1998a. Microbial biomass and activities in soil as affected by frozen and cold storage.
Soil Biology & Biochemistry, 30, 393-402.
Stenberg, B., Pell, M. & Torstensson, L. 1998b. Integrated evaluation of variation in
biological, chemical and physical soil properties. Ambio, 27, 9-15.
Stinner, W., Möller, K. & Leithold, G. 2008. Effect of biogas digestion of clover/grass-leys,
cover crops and crop residues on nitrogen cycle and crop yield in organic stockless
farming system. European Journal of Agronomy, 29, 125-134.
Stoyan, H., De-Polli, H., Böhm, S., Robertson, G. P. & Paul, E. A. 2000. Spatial
heterogeneity of soil respiration and related properties at the plant. Plant and Soil,
222, 203–214.
Subrahmanyam, G., Hu, H. W., Zheng, Y. M., Archana, G., He, J. Z. & Liu, Y. R. 2014.
Response of ammonia oxidizing microbes to the stresses of arsenic and copper in two
acidic alfisols. Applied Soil Ecology, 77, 59-67.
SurmaczGorska, J., Gernaey, K., Demuynck, C., Vanrolleghem, P. & Verstraete, W. 1996.
Nitrification monitoring in activated sludge by oxygen uptake rate (OUR)
measurements. Water Research, 30, 1228-1236.
SvensktVatten 2015. Revaq- Regler för certifieringssystemet. Stockholm: Svenskt vatten.
Thangarajan, R., Bolan, N. S., Tian, G., Naidu, R. & Kunhikrishnan, A. 2013. Role of organic
amendment application on greenhouse gas emission from soil. Science of the Total
Environment, 465, 72-96.
Tolli, J. & King, G. M. 2005. Diversity and structure of bacterial chemolithotrophic
communities in pine forest and agroecosystem soils. Applied and Environmental
Microbiology, 71, 8411-8418.
UKWIR 2013. Workbook for estimating operational GHG emissions, Version 7. UK Water
Industry Research.
UppsalaVatten 2013. Miljörapport, Kungsängsverket. Uppsala: Uppsala Vatten och Avfall
AB.
50
Vinnerås, B. 2013. Hygieniseringsteknik för säker återföring av fosfor i kretsloppet. Uppsala:
Institutionen för Energi och Teknik, SLU.
Wrage, N., Velthof, G. L., van Beusichem, M. L. & Oenema, O. 2001. Role of nitrifier
denitrification in the production of nitrous oxide. Soil Biology & Biochemistry, 33,
1723-1732.
Wunderlin, P., Mohn, J., Joss, A., Emmenegger, L. & Siegrist, H. 2012. Mechanisms of N2O
production in biological wastewater treatment under nitrifying and denitrifying
conditions. Water Research, 46, 1027-1037.
You, S.-J., Tsai, Y.-P. & Huang, R.-Y. 2009. Effect of heavy metals on nitrification
performance in different activated sludge processes. Journal of Hazardous Materials,
165, 987-994.

51
Appendix 1 – Sewage sludge used in the development work Characteristics of fresh and stored SS used in the developing Steps 1- 4.
Table 1. Chemical characteristics of fresh dewatered mesophilically digested sewage sludge
(FMS) from Kungsängen WWTP, Uppsala (January 2014).
Parameter Result Unit
pH 7.4 Dry weight 27.9 % Al 8.44 g kg-1 DW Ca 27.7 g kg-1 DW Fe 91.7 g kg-1 DW K 1.47 g kg-1 DW
Mg 2.16 g kg-1 DW
Mn 0.166 g kg-1 DW N 49.7 g kg-1 DW P 29.4 g kg-1 DW Ag 1.66 mg kg-1 DW As 2.56 mg kg-1 DW Au 0.248 mg kg-1 DW B 22.8 mg kg-1 DW Bi 3.95 mg kg-1 DW Cd 0.499 mg kg-1 DW Co 2.89 mg kg-1 DW Cr 17.6 mg kg-1 DW Cu 279 mg kg-1 DW
Hg 0.636 mg kg-1 DW Mo 7.39 mg kg-1 DW Ni 12.7 mg kg-1 DW Pb 10.2 mg kg-1 DW Se 1.51 mg kg-1 DW Sn 13.5 mg kg-1 DW U 59.5 mg kg-1 DW V 23.7 mg kg-1 DW W 2.63 mg kg-1 DW Zn 283 mg kg-1 DW
DW; dry weight
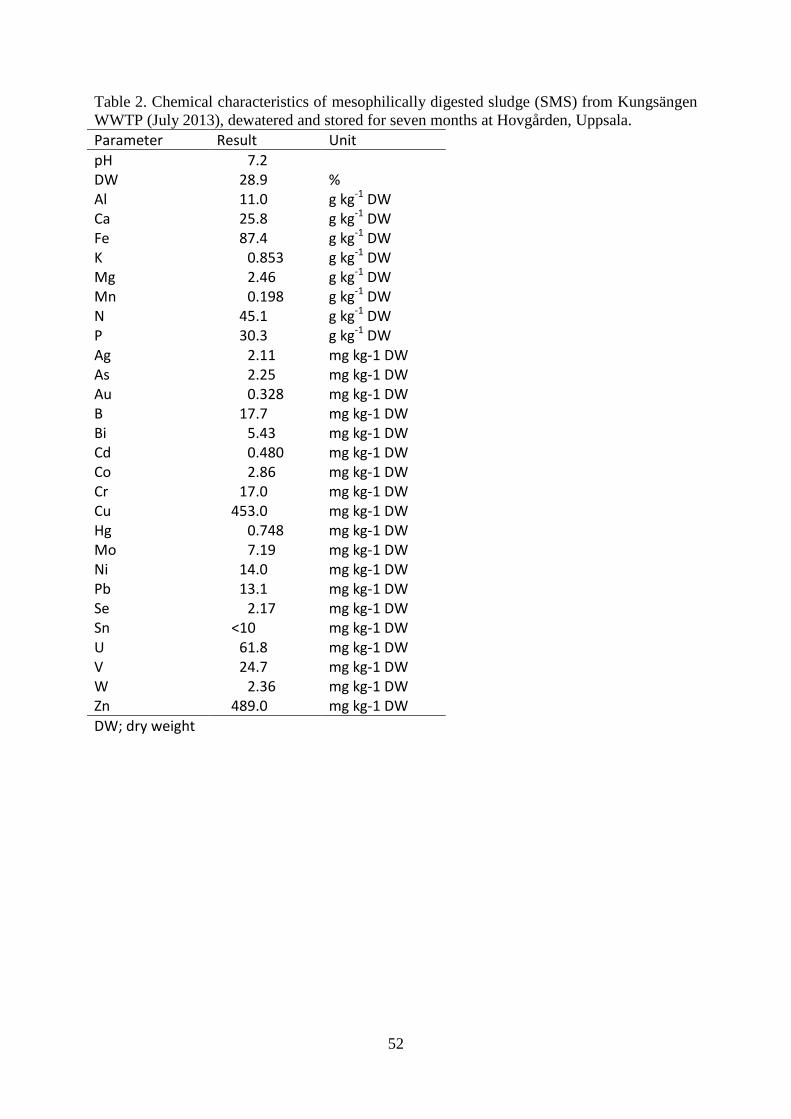
52
Table 2. Chemical characteristics of mesophilically digested sludge (SMS) from Kungsängen
WWTP (July 2013), dewatered and stored for seven months at Hovgården, Uppsala.
Parameter Result Unit
pH 7.2 DW 28.9 % Al 11.0 g kg-1 DW Ca 25.8 g kg-1 DW Fe 87.4 g kg-1 DW K 0.853 g kg-1 DW Mg 2.46 g kg-1 DW Mn 0.198 g kg-1 DW N 45.1 g kg-1 DW P 30.3 g kg-1 DW Ag 2.11 mg kg-1 DW As 2.25 mg kg-1 DW Au 0.328 mg kg-1 DW B 17.7 mg kg-1 DW Bi 5.43 mg kg-1 DW Cd 0.480 mg kg-1 DW Co 2.86 mg kg-1 DW Cr 17.0 mg kg-1 DW Cu 453.0 mg kg-1 DW Hg 0.748 mg kg-1 DW Mo 7.19 mg kg-1 DW Ni 14.0 mg kg-1 DW Pb 13.1 mg kg-1 DW Se 2.17 mg kg-1 DW Sn <10 mg kg-1 DW U 61.8 mg kg-1 DW V 24.7 mg kg-1 DW W 2.36 mg kg-1 DW Zn 489.0 mg kg-1 DW
DW; dry weight
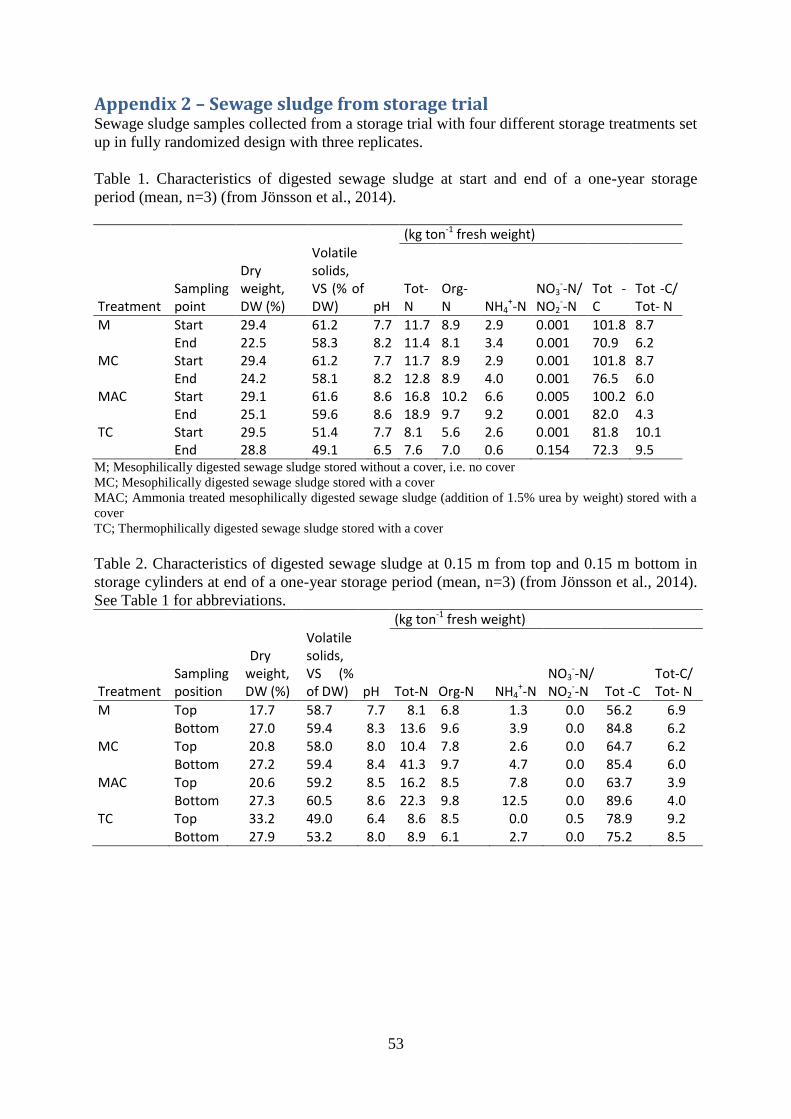
53
Appendix 2 – Sewage sludge from storage trial Sewage sludge samples collected from a storage trial with four different storage treatments set
up in fully randomized design with three replicates.
Table 1. Characteristics of digested sewage sludge at start and end of a one-year storage
period (mean, n=3) (from Jönsson et al., 2014).
(kg ton-1 fresh weight)
Treatment Sampling point
Dry weight, DW (%)
Volatile solids, VS (% of DW) pH
Tot-N
Org-N NH4
+-N NO3
--N/ NO2
--N Tot -C
Tot -C/ Tot- N
M Start 29.4 61.2 7.7 11.7 8.9 2.9 0.001 101.8 8.7
End 22.5 58.3 8.2 11.4 8.1 3.4 0.001 70.9 6.2
MC Start 29.4 61.2 7.7 11.7 8.9 2.9 0.001 101.8 8.7
End 24.2 58.1 8.2 12.8 8.9 4.0 0.001 76.5 6.0
MAC Start 29.1 61.6 8.6 16.8 10.2 6.6 0.005 100.2 6.0
End 25.1 59.6 8.6 18.9 9.7 9.2 0.001 82.0 4.3
TC Start 29.5 51.4 7.7 8.1 5.6 2.6 0.001 81.8 10.1 End 28.8 49.1 6.5 7.6 7.0 0.6 0.154 72.3 9.5
M; Mesophilically digested sewage sludge stored without a cover, i.e. no cover
MC; Mesophilically digested sewage sludge stored with a cover
MAC; Ammonia treated mesophilically digested sewage sludge (addition of 1.5% urea by weight) stored with a
cover
TC; Thermophilically digested sewage sludge stored with a cover
Table 2. Characteristics of digested sewage sludge at 0.15 m from top and 0.15 m bottom in
storage cylinders at end of a one-year storage period (mean, n=3) (from Jönsson et al., 2014).
See Table 1 for abbreviations.
(kg ton-1 fresh weight)
Treatment Sampling position
Dry weight, DW (%)
Volatile solids, VS (% of DW) pH Tot-N Org-N NH4
+-N NO3
--N/ NO2
--N Tot -C Tot-C/ Tot- N
M Top 17.7 58.7 7.7 8.1 6.8 1.3 0.0 56.2 6.9
Bottom 27.0 59.4 8.3 13.6 9.6 3.9 0.0 84.8 6.2
MC Top 20.8 58.0 8.0 10.4 7.8 2.6 0.0 64.7 6.2
Bottom 27.2 59.4 8.4 41.3 9.7 4.7 0.0 85.4 6.0
MAC Top 20.6 59.2 8.5 16.2 8.5 7.8 0.0 63.7 3.9
Bottom 27.3 60.5 8.6 22.3 9.8 12.5 0.0 89.6 4.0
TC Top 33.2 49.0 6.4 8.6 8.5 0.0 0.5 78.9 9.2 Bottom 27.9 53.2 8.0 8.9 6.1 2.7 0.0 75.2 8.5

54
Appendix 3 – Soils used in the development work Soil used as reference in developing Steps 1 – 4, PAO assays of SS from storage trial and
PAO assay of SS applied to soil.
Table 1. Chemical, physical and microbial characteristics of Soil I used in development Steps
1 - 5 (from (Abubaker et al., 2015).
Characteristics Chemical
pH 5.6 Tot-C (%) 1.3 Tot-N (%) 0.1 Tot-P (g kg-1 DW) 0.7 Tot-S (g kg-1 DW) 0.2 P-AL (mg 100 g-1 DW) 4.8 K-AL (mg 100 g-1 DW) 18.5
Physical Sand (%) 14-20
Silt (%) 36-44 Clay (%) 37-49 WHC (g H2O g-1 soil DW) 0.511 Moisture content (% of WHC) 34
Microbial PAO (ng NO2-N/g-1 DW min-1) 4.8
PDA (ng N2O-N/ g-1 DW min-1) 7.8 Basal respiraiton (µg CO2 g
-1 dw h) 0.782
DW; dry weight
Table 2. Parameters of Soil II used in PAO assay with SS application (from (Jönsson et al.,
2014).
Characteristics Chemical
pH 6.9 Dry weight (%) 83.5 Tot.-C (%) 19.7 Tot.-N (%) 2.4 NH4
+-N (mg kg-1 DW) 6.0 NO2
--N+NO3--N (mg kg-1 DW) 4.8
Tot.-P (g kg-1 DW) 6.2 Tot.-S (g kg-1 DW) 0.21 K (g kg-1 DW) 0.78
DW; dry weight
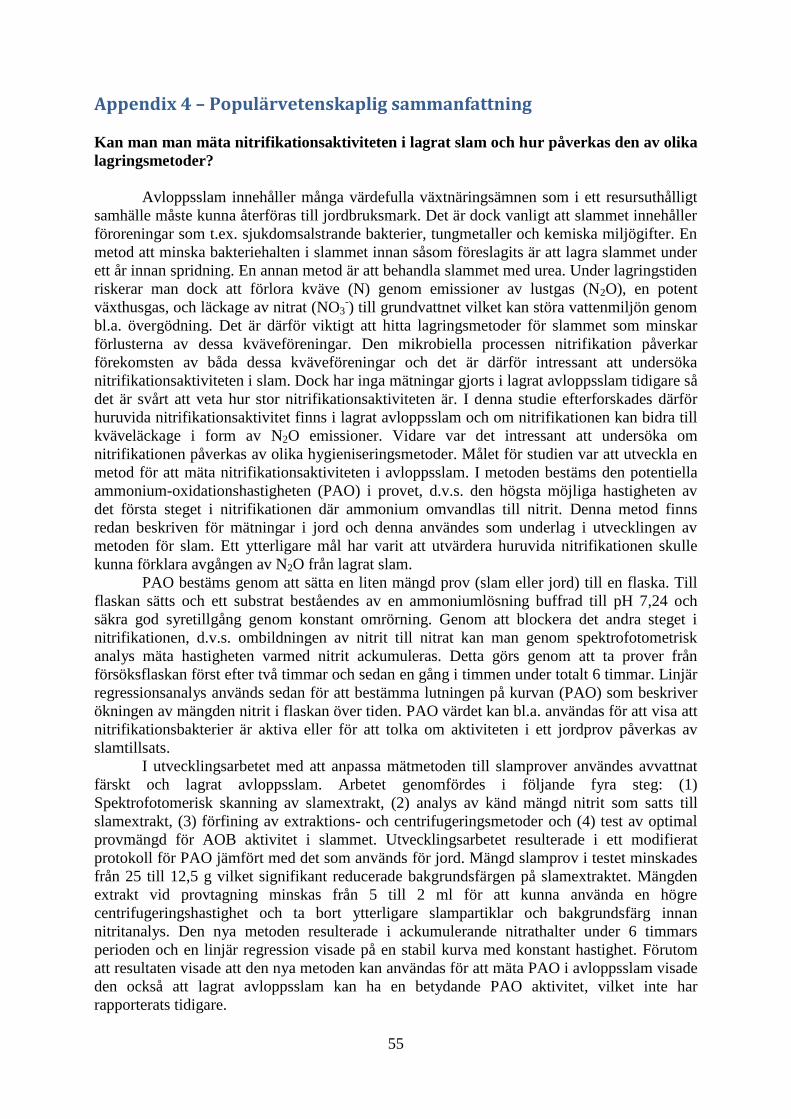
55
Appendix 4 – Populärvetenskaplig sammanfattning
Kan man man mäta nitrifikationsaktiviteten i lagrat slam och hur påverkas den av olika
lagringsmetoder?
Avloppsslam innehåller många värdefulla växtnäringsämnen som i ett resursuthålligt
samhälle måste kunna återföras till jordbruksmark. Det är dock vanligt att slammet innehåller
föroreningar som t.ex. sjukdomsalstrande bakterier, tungmetaller och kemiska miljögifter. En
metod att minska bakteriehalten i slammet innan såsom föreslagits är att lagra slammet under
ett år innan spridning. En annan metod är att behandla slammet med urea. Under lagringstiden
riskerar man dock att förlora kväve (N) genom emissioner av lustgas (N2O), en potent
växthusgas, och läckage av nitrat (NO3-) till grundvattnet vilket kan störa vattenmiljön genom
bl.a. övergödning. Det är därför viktigt att hitta lagringsmetoder för slammet som minskar
förlusterna av dessa kväveföreningar. Den mikrobiella processen nitrifikation påverkar
förekomsten av båda dessa kväveföreningar och det är därför intressant att undersöka
nitrifikationsaktiviteten i slam. Dock har inga mätningar gjorts i lagrat avloppsslam tidigare så
det är svårt att veta hur stor nitrifikationsaktiviteten är. I denna studie efterforskades därför
huruvida nitrifikationsaktivitet finns i lagrat avloppsslam och om nitrifikationen kan bidra till
kväveläckage i form av N2O emissioner. Vidare var det intressant att undersöka om
nitrifikationen påverkas av olika hygieniseringsmetoder. Målet för studien var att utveckla en
metod för att mäta nitrifikationsaktiviteten i avloppsslam. I metoden bestäms den potentiella
ammonium-oxidationshastigheten (PAO) i provet, d.v.s. den högsta möjliga hastigheten av
det första steget i nitrifikationen där ammonium omvandlas till nitrit. Denna metod finns
redan beskriven för mätningar i jord och denna användes som underlag i utvecklingen av
metoden för slam. Ett ytterligare mål har varit att utvärdera huruvida nitrifikationen skulle
kunna förklara avgången av N2O från lagrat slam.
PAO bestäms genom att sätta en liten mängd prov (slam eller jord) till en flaska. Till
flaskan sätts och ett substrat beståendes av en ammoniumlösning buffrad till pH 7,24 och
säkra god syretillgång genom konstant omrörning. Genom att blockera det andra steget i
nitrifikationen, d.v.s. ombildningen av nitrit till nitrat kan man genom spektrofotometrisk
analys mäta hastigheten varmed nitrit ackumuleras. Detta görs genom att ta prover från
försöksflaskan först efter två timmar och sedan en gång i timmen under totalt 6 timmar. Linjär
regressionsanalys används sedan för att bestämma lutningen på kurvan (PAO) som beskriver
ökningen av mängden nitrit i flaskan över tiden. PAO värdet kan bl.a. användas för att visa att
nitrifikationsbakterier är aktiva eller för att tolka om aktiviteten i ett jordprov påverkas av
slamtillsats.
I utvecklingsarbetet med att anpassa mätmetoden till slamprover användes avvattnat
färskt och lagrat avloppsslam. Arbetet genomfördes i följande fyra steg: (1)
Spektrofotomerisk skanning av slamextrakt, (2) analys av känd mängd nitrit som satts till
slamextrakt, (3) förfining av extraktions- och centrifugeringsmetoder och (4) test av optimal
provmängd för AOB aktivitet i slammet. Utvecklingsarbetet resulterade i ett modifierat
protokoll för PAO jämfört med det som används för jord. Mängd slamprov i testet minskades
från 25 till 12,5 g vilket signifikant reducerade bakgrundsfärgen på slamextraktet. Mängden
extrakt vid provtagning minskas från 5 till 2 ml för att kunna använda en högre
centrifugeringshastighet och ta bort ytterligare slampartiklar och bakgrundsfärg innan
nitritanalys. Den nya metoden resulterade i ackumulerande nitrathalter under 6 timmars
perioden och en linjär regression visade på en stabil kurva med konstant hastighet. Förutom
att resultaten visade att den nya metoden kan användas för att mäta PAO i avloppsslam visade
den också att lagrat avloppsslam kan ha en betydande PAO aktivitet, vilket inte har
rapporterats tidigare.
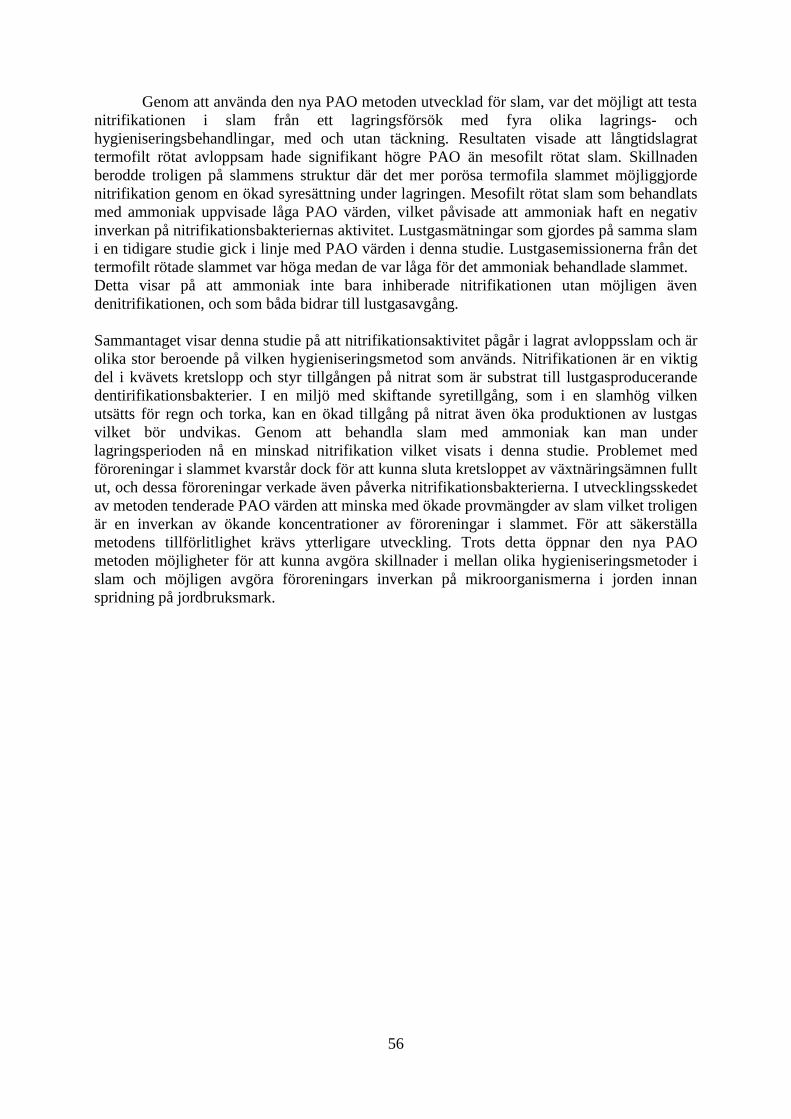
56
Genom att använda den nya PAO metoden utvecklad för slam, var det möjligt att testa
nitrifikationen i slam från ett lagringsförsök med fyra olika lagrings- och
hygieniseringsbehandlingar, med och utan täckning. Resultaten visade att långtidslagrat
termofilt rötat avloppsam hade signifikant högre PAO än mesofilt rötat slam. Skillnaden
berodde troligen på slammens struktur där det mer porösa termofila slammet möjliggjorde
nitrifikation genom en ökad syresättning under lagringen. Mesofilt rötat slam som behandlats
med ammoniak uppvisade låga PAO värden, vilket påvisade att ammoniak haft en negativ
inverkan på nitrifikationsbakteriernas aktivitet. Lustgasmätningar som gjordes på samma slam
i en tidigare studie gick i linje med PAO värden i denna studie. Lustgasemissionerna från det
termofilt rötade slammet var höga medan de var låga för det ammoniak behandlade slammet.
Detta visar på att ammoniak inte bara inhiberade nitrifikationen utan möjligen även
denitrifikationen, och som båda bidrar till lustgasavgång.
Sammantaget visar denna studie på att nitrifikationsaktivitet pågår i lagrat avloppsslam och är
olika stor beroende på vilken hygieniseringsmetod som används. Nitrifikationen är en viktig
del i kvävets kretslopp och styr tillgången på nitrat som är substrat till lustgasproducerande
dentirifikationsbakterier. I en miljö med skiftande syretillgång, som i en slamhög vilken
utsätts för regn och torka, kan en ökad tillgång på nitrat även öka produktionen av lustgas
vilket bör undvikas. Genom att behandla slam med ammoniak kan man under
lagringsperioden nå en minskad nitrifikation vilket visats i denna studie. Problemet med
föroreningar i slammet kvarstår dock för att kunna sluta kretsloppet av växtnäringsämnen fullt
ut, och dessa föroreningar verkade även påverka nitrifikationsbakterierna. I utvecklingsskedet
av metoden tenderade PAO värden att minska med ökade provmängder av slam vilket troligen
är en inverkan av ökande koncentrationer av föroreningar i slammet. För att säkerställa
metodens tillförlitlighet krävs ytterligare utveckling. Trots detta öppnar den nya PAO
metoden möjligheter för att kunna avgöra skillnader i mellan olika hygieniseringsmetoder i
slam och möjligen avgöra föroreningars inverkan på mikroorganismerna i jorden innan
spridning på jordbruksmark.