Embed Size (px)
Citation preview

ASSESSING THE POTENTIAL FOR NITRIFICATION INHIBITION AT WASTEWATER TREATMENT FACILITIES AS A RESULT OF ZINC ORTHO-PHOSPHATE ADDITION TO POTABLE WATER DISTRIBUTION SYSTEMS
John T. Fox, Christopher J. Brandriff, and Charles B. Bott*
Virginia Military Institute Department of Civil and Environmental Engineering
Lexington, Virginia 24450 ABSTRACT Portions of the greater metropolitan District of Columbia area have water distribution system corrosion problems. This has resulted in elevated levels of heavy metals, in particular lead from some plumbing and service connections. One alternative being considered for corrosion control is the addition of either phosphoric acid (ortho-phosphate) or zinc ortho-phosphate based products at the water treatment plant to inhibit corrosion of plumbing and service connections that contain lead (Cadmus, 2004). A potential consequence of the addition of zinc ortho-phosphate (ZnOP) to the water supply is the impact of Zn on the operation of the wastewater treatment plants that receive and treat sanitary wastewater from treated water supplies. The objective of this study was to evaluate the impact of ZnOP, and specifically Zn2+, on the nitrification process at the Arlington County, Virginia Water Pollution Control Plant (WPCP). Inhibition was investigated using continuous respirometry and nitrate generation rate measurements at the Zn concentration increment expected in the influent wastewater (0.3-0.5 mg/L) as a result of corrosion inhibitor use, although much higher levels of Zn were also evaluated. Short-term batch experiments up to 5 days in length were conducted with fresh mixed liquor samples in an attempt to make 0.5 mg/L Zn as inhibitory as possible, providing conditions that would be expected to sensitize the biomass to Zn stress. Results suggest no significant inhibition at 0.5 mg/L Zn, slight inhibition at 1.0 mg/L Zn after roughly 5-10 hours of exposure, and significant inhibition at 10 mg/L Zn. KEYWORDS Nitrification, inhibition, zinc, respirometry, nitrate generation rate, high F:M method INTRODUCTION Lead levels within the DC metropolitan area, have recently exceeded the EPA’s maximum contaminant level. Elevated levels of heavy metals have been directly associated with water distribution system corrosion. Both ortho-phosphate and zinc ortho-phosphate based products have been evaluated as corrosion control additives. The benefits of corrosion control in the water supply distribution system are generally understood (reduction in the potential for lead corrosion) and will provide a significant public health benefit. One consequence of the addition of zinc ortho-phosphate (ZnOP) to the water supply is the potential impacts on the operation of
6593
WEFTEC®.06
Copyright 2006 Water Environment Foundation. All Rights Reserved©

the wastewater treatment plants that receive and treat sanitary wastewater from treated water supplies. The objective of this project was to evaluate the impact of zinc ortho-phosphate and specifically Zn on the inhibition of nitrification and biological nutrient removal at the Arlington, Virginia Water Pollution Control Plant (WPCP). Zinc can have a toxic affect on the biomass responsible for biological treatment of wastewater. In particular, the bacteria responsible for the biological nitrogen removal (BNR) via nitrification and denitrification are particularly sensitive to metals at low concentrations (part per million range). The presence of zinc at low concentrations is known to inhibit BNR and cause upset and interference, typically as a result of nitrification inhibition. The nitrification process involves the biological oxidation of ammonia-N to nitrite-N and subsequently to nitrate-N by two genera of aerobic autotrophic bacteria. This process is accomplished in the aeration basin of the biological wastewater treatment process (e.g. activated sludge) simultaneously with the removal of biodegradable organic compounds (i.e. biochemical or chemical oxygen demand BOD/COD) by heterotrophic bacteria. Nitrifying bacteria have relatively slow specific growth rates in the activated sludge process and are especially sensitive to toxic compounds including both heavy metals and xenobiotic organic chemicals (Barth et al., 1965; Blum and Speece, 1991; Juliastuti et al., 2003a) – much more so than the aerobic heterotrophic bacteria responsible for BOD removal or the heterotrophic/facultative bacteria responsible for denitrification and BOD removal under anoxic conditions (anoxic conversion of nitrate-N to nitrogen gas). Thus, the nitrification process is generally the “weakest link” in terms of chemical inhibition and nitrogen removal, and the point of concern for this project. Since the product of nitrification (nitrate) is the substrate for denitrification, inhibition of nitrifying bacteria affects both nitrification and denitrification, thus limiting the ability for a wastewater treatment facility to meet its ammonia-N and total nitrogen (TN) permit limits. The VPDES discharge limits for the Arlington WPCP for ammonia-N and the Virginia Water Quality Improvement Fund effluent treatment objective for TN are shown in Table 1. Table 1. Current Effluent Nitrogen and Phosphorus Limits for the Arlington WPCP
Constituent Units Monthly Average
Weekly Maximum
Annual Average
Total Phosphorus (TP) mg/L 0.18 0.27 Ammonia-N (Apr-Oct) mg/L 1.0 2.7 Ammonia-N (Nov-Mar) mg/L 3.5 4.2 Total Nitrogen (TN) a mg/L 8.0 a. Annual average treatment objective specified by the Virginia Water Quality Improvement Fund grant. Previous laboratory and pilot plant studies on the impacts of zinc on nitrification have been documented, and are summarized in Tables 2 and 3 below. The results suggest that the threshold of inhibition to nitrification varies from about 0.1 – 50 mg/L total influent zinc. There is considerable discrepancy in this data however, and there is an indication that the impact of zinc on BNR, and specifically nitrification, is site-specific. The primary objective of this project is to determine whether the maximum expected increase in influent total zinc to the Arlington WPCP based on the anticipated zinc ortho-phosphate dosing scheme, will have an effect on nitrification process performance.
6594
WEFTEC®.06
Copyright 2006 Water Environment Foundation. All Rights Reserved©
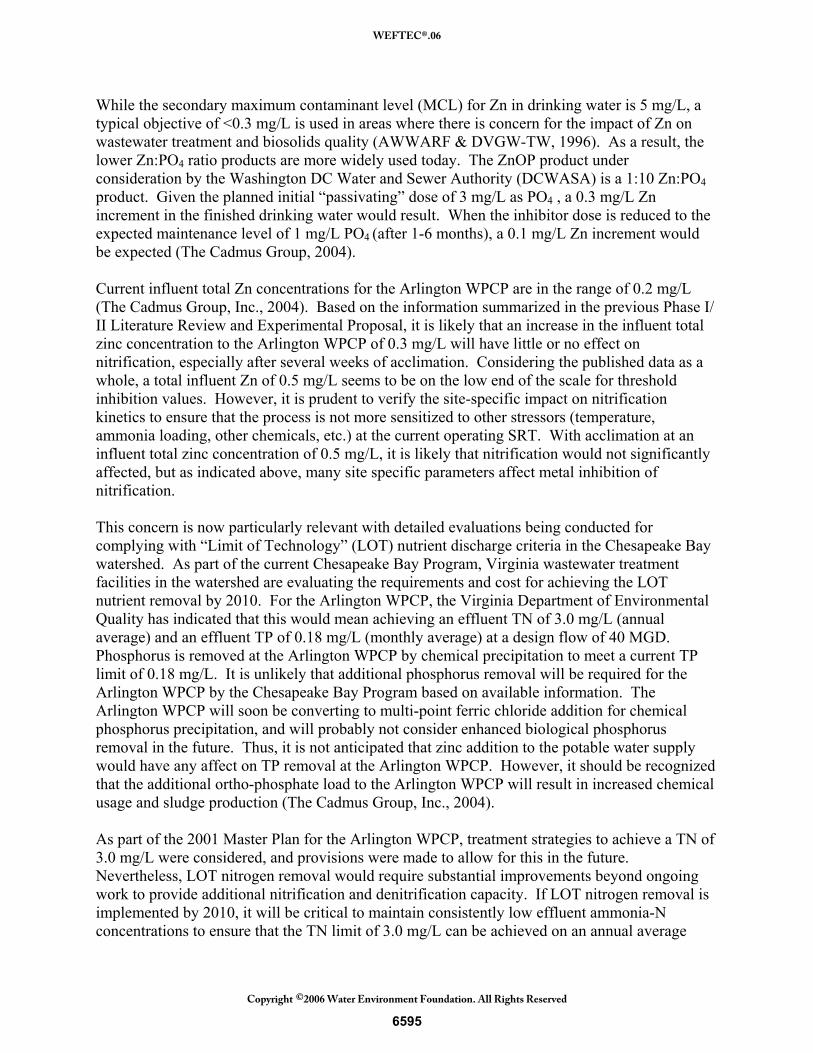
While the secondary maximum contaminant level (MCL) for Zn in drinking water is 5 mg/L, a typical objective of <0.3 mg/L is used in areas where there is concern for the impact of Zn on wastewater treatment and biosolids quality (AWWARF & DVGW-TW, 1996). As a result, the lower Zn:PO4 ratio products are more widely used today. The ZnOP product under consideration by the Washington DC Water and Sewer Authority (DCWASA) is a 1:10 Zn:PO4 product. Given the planned initial “passivating” dose of 3 mg/L as PO4 , a 0.3 mg/L Zn increment in the finished drinking water would result. When the inhibitor dose is reduced to the expected maintenance level of 1 mg/L PO4 (after 1-6 months), a 0.1 mg/L Zn increment would be expected (The Cadmus Group, 2004). Current influent total Zn concentrations for the Arlington WPCP are in the range of 0.2 mg/L (The Cadmus Group, Inc., 2004). Based on the information summarized in the previous Phase I/ II Literature Review and Experimental Proposal, it is likely that an increase in the influent total zinc concentration to the Arlington WPCP of 0.3 mg/L will have little or no effect on nitrification, especially after several weeks of acclimation. Considering the published data as a whole, a total influent Zn of 0.5 mg/L seems to be on the low end of the scale for threshold inhibition values. However, it is prudent to verify the site-specific impact on nitrification kinetics to ensure that the process is not more sensitized to other stressors (temperature, ammonia loading, other chemicals, etc.) at the current operating SRT. With acclimation at an influent total zinc concentration of 0.5 mg/L, it is likely that nitrification would not significantly affected, but as indicated above, many site specific parameters affect metal inhibition of nitrification. This concern is now particularly relevant with detailed evaluations being conducted for complying with “Limit of Technology” (LOT) nutrient discharge criteria in the Chesapeake Bay watershed. As part of the current Chesapeake Bay Program, Virginia wastewater treatment facilities in the watershed are evaluating the requirements and cost for achieving the LOT nutrient removal by 2010. For the Arlington WPCP, the Virginia Department of Environmental Quality has indicated that this would mean achieving an effluent TN of 3.0 mg/L (annual average) and an effluent TP of 0.18 mg/L (monthly average) at a design flow of 40 MGD. Phosphorus is removed at the Arlington WPCP by chemical precipitation to meet a current TP limit of 0.18 mg/L. It is unlikely that additional phosphorus removal will be required for the Arlington WPCP by the Chesapeake Bay Program based on available information. The Arlington WPCP will soon be converting to multi-point ferric chloride addition for chemical phosphorus precipitation, and will probably not consider enhanced biological phosphorus removal in the future. Thus, it is not anticipated that zinc addition to the potable water supply would have any affect on TP removal at the Arlington WPCP. However, it should be recognized that the additional ortho-phosphate load to the Arlington WPCP will result in increased chemical usage and sludge production (The Cadmus Group, Inc., 2004). As part of the 2001 Master Plan for the Arlington WPCP, treatment strategies to achieve a TN of 3.0 mg/L were considered, and provisions were made to allow for this in the future. Nevertheless, LOT nitrogen removal would require substantial improvements beyond ongoing work to provide additional nitrification and denitrification capacity. If LOT nitrogen removal is implemented by 2010, it will be critical to maintain consistently low effluent ammonia-N concentrations to ensure that the TN limit of 3.0 mg/L can be achieved on an annual average
6595
WEFTEC®.06
Copyright 2006 Water Environment Foundation. All Rights Reserved©

basis. While it is unclear what level of influent total zinc to the plant might affect nitrification, it would be absolutely critical to ensure that there is no significant impact on the nitrification process if LOT nutrient removal is required. The results of this project could be used to determine whether the zinc concentrations from the proposed zinc-phosphate corrosion control system will exert a toxic impact on BNR at the Arlington WPCP. This assessment could be used by the larger technical review committee evaluating alternatives for corrosion control in water supply in the greater metropolitan D.C. area. Technical Literature Review Use of Solutions Containing Zinc ortho-Phosphate for Corrosion Control. Phosphate-based corrosion inhibitors are the most common type used by drinking water utilities in the United States today. In a recent survey of utilities that add an inhibitor as part of their corrosion control practice, approximately 30% used a zinc ortho-phosphate (ZnOP) product (McNeil and Edwards, 2002). For the utilities surveyed, the phosphate inhibitor doses ranged from 0.2 to 3.0 mg/L as PO4, with most falling between 0.7 and 2.0 mg/L as PO4. This is also the recommended dose range for ZnOP products (AWWARF, 1996). As there are several vendors and many proprietary products on the market, there is no standard ZnOP formulation. ZnOP products are typically produced by dissolving zinc and phosphate salts (e.g. ZnSO4 and NaH2PO4) in hydrochloric or sulfuric acid solutions. Some suppliers attempt to reduce the sulfate and chloride in their products by utilizing Phosphoric acid. Polyphosphate salts (such as sodium hexametaphosphate, Na5P3O10) are also used in some products to create zinc poly-phosphate or zinc ortho/polyphosphate blends. There is no standard Zn:PO4 mass ratio used in the ZnOP products on the market, making it impossible to determine the average or typical Zn contribution to drinking water, as it depends on the specific product. Carus Chemical Company, for example, markets five different products to the drinking water industry with Zn:PO4 mass ratios ranging from 1:1 to 1:10 (Carus Chemical Company, 2004). While the secondary MCL for Zn in drinking water is 5 mg/L, a typical objective of <0.3 mg/L is used in areas where there is concern for the impact of Zn on wastewater treatment and biosolids quality (AWWARF & DVGW-TW, 1996). As a result, the lower Zn:PO4 ratio products are more widely used today. At DC-WASA, for example, the ZnOP product under consideration for use is a 1:10 Zn:PO4 product. Given the planned initial “passivating” dose of 3 mg/L as PO4 , a 0.3 mg/L Zn increment in the finished drinking water would result. When the inhibitor dose is reduced to the expected maintenance level of 1 mg/L PO4 (after 1-6 months), a 0.1 mg/L Zn increment would be expected (The Cadmus Group, 2004). Zinc Fate and Transport in Wastewater Collection and Treatment Systems. To be conservative, it should be assumed that all of the zinc added to the water supply ends up in the raw wastewater. Thus, it is appropriate to assume that the maximum expected increase in the total zinc concentration of the influent raw wastewater to the Arlington WPCP is 0.3 mg/L.
6596
WEFTEC®.06
Copyright 2006 Water Environment Foundation. All Rights Reserved©
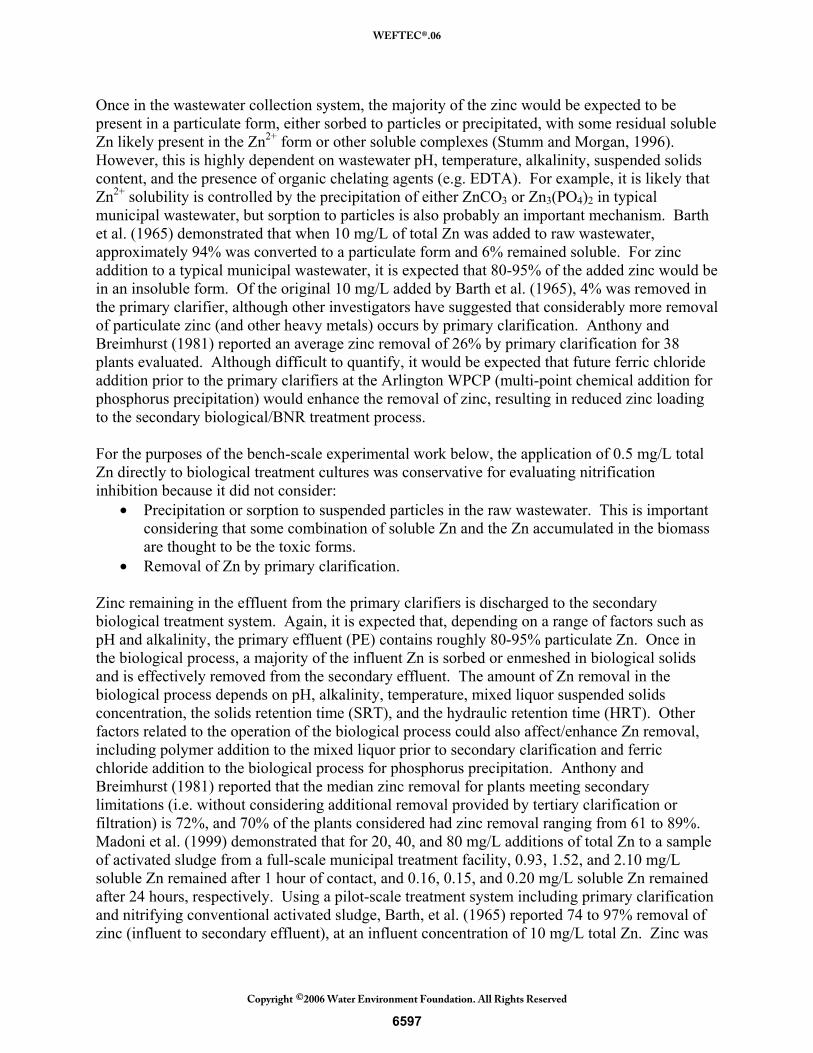
Once in the wastewater collection system, the majority of the zinc would be expected to be present in a particulate form, either sorbed to particles or precipitated, with some residual soluble Zn likely present in the Zn2+ form or other soluble complexes (Stumm and Morgan, 1996). However, this is highly dependent on wastewater pH, temperature, alkalinity, suspended solids content, and the presence of organic chelating agents (e.g. EDTA). For example, it is likely that Zn2+ solubility is controlled by the precipitation of either ZnCO3 or Zn3(PO4)2 in typical municipal wastewater, but sorption to particles is also probably an important mechanism. Barth et al. (1965) demonstrated that when 10 mg/L of total Zn was added to raw wastewater, approximately 94% was converted to a particulate form and 6% remained soluble. For zinc addition to a typical municipal wastewater, it is expected that 80-95% of the added zinc would be in an insoluble form. Of the original 10 mg/L added by Barth et al. (1965), 4% was removed in the primary clarifier, although other investigators have suggested that considerably more removal of particulate zinc (and other heavy metals) occurs by primary clarification. Anthony and Breimhurst (1981) reported an average zinc removal of 26% by primary clarification for 38 plants evaluated. Although difficult to quantify, it would be expected that future ferric chloride addition prior to the primary clarifiers at the Arlington WPCP (multi-point chemical addition for phosphorus precipitation) would enhance the removal of zinc, resulting in reduced zinc loading to the secondary biological/BNR treatment process. For the purposes of the bench-scale experimental work below, the application of 0.5 mg/L total Zn directly to biological treatment cultures was conservative for evaluating nitrification inhibition because it did not consider:
• Precipitation or sorption to suspended particles in the raw wastewater. This is important considering that some combination of soluble Zn and the Zn accumulated in the biomass are thought to be the toxic forms.
• Removal of Zn by primary clarification. Zinc remaining in the effluent from the primary clarifiers is discharged to the secondary biological treatment system. Again, it is expected that, depending on a range of factors such as pH and alkalinity, the primary effluent (PE) contains roughly 80-95% particulate Zn. Once in the biological process, a majority of the influent Zn is sorbed or enmeshed in biological solids and is effectively removed from the secondary effluent. The amount of Zn removal in the biological process depends on pH, alkalinity, temperature, mixed liquor suspended solids concentration, the solids retention time (SRT), and the hydraulic retention time (HRT). Other factors related to the operation of the biological process could also affect/enhance Zn removal, including polymer addition to the mixed liquor prior to secondary clarification and ferric chloride addition to the biological process for phosphorus precipitation. Anthony and Breimhurst (1981) reported that the median zinc removal for plants meeting secondary limitations (i.e. without considering additional removal provided by tertiary clarification or filtration) is 72%, and 70% of the plants considered had zinc removal ranging from 61 to 89%. Madoni et al. (1999) demonstrated that for 20, 40, and 80 mg/L additions of total Zn to a sample of activated sludge from a full-scale municipal treatment facility, 0.93, 1.52, and 2.10 mg/L soluble Zn remained after 1 hour of contact, and 0.16, 0.15, and 0.20 mg/L soluble Zn remained after 24 hours, respectively. Using a pilot-scale treatment system including primary clarification and nitrifying conventional activated sludge, Barth, et al. (1965) reported 74 to 97% removal of zinc (influent to secondary effluent), at an influent concentration of 10 mg/L total Zn. Zinc was
6597
WEFTEC®.06
Copyright 2006 Water Environment Foundation. All Rights Reserved©

added to the influent of a bench-scale Modified Ludzack-Ettinger (MLE) process treating a high-ammonia leachate at total concentrations ranging from 12 to 130 mg/L and operating at an HRT of 7.2 hours and a SRT of 10 days (Manoharan, 1992). At the point when the influent total Zn was 30 mg/L, the soluble zinc concentration in the aeration basin was 1.8 mg/L, the total zinc concentration in the aeration basins was 118 mg/L, and the biomass contained 71,700 mg Zn/kg dry solids (Manoharan, 1992) – and the system was acclimated to the zinc loading and fully nitrifying (see Table 2). The zinc removed in the biological process is actually accumulated in the biomass (mixed liquor) and removed from the system by sludge wasting. Since sludge wasting is controlled by the design SRT, the accumulation of Zn in the mixed liquor (on a mg Zn/kg dry solids basis) would be expected to increase as the SRT increases. By mass balance calculations, it is possible to estimate the Zn content of the mixed liquor versus the concentration of Zn in the secondary effluent. The Nitrification Processes. Aerobic nitrification involves the biological oxidation of ammonia (NH4-N) to nitrate (NO3-N) in a two step process by two genera of autotrophic bacteria, ammonia oxidizing bacteria (AOB) and nitrite oxidizing bacteria (NOB). In the first step, AOB oxidize NH4-N to hydroxylamine using an enzyme called ammonia monooxygenase and subsequently oxidize the hydroxylamine to nitrite (NO2-N) using hydroxylamine oxidoreductase. NOB oxidize the nitrite to nitrate using the enzyme nitrite oxidoreductase. Both genera of bacteria grow under fully autotrophic conditions whereby reduced nitrogen (ammonia or nitrite) serves as the electron donor for energy production, molecular oxygen serves as the electron acceptor and inorganic carbon (HCO3
-) serves as the carbon source for growth. Ammonia Oxidizing Bacteria – NH3 + 202 NO2
- + H+ + H20 (1) Nitrite Oxidizing Bacteria – 2NO2
- + O2 2NO3- (2)
Nitrifying bacteria have specific growth rates that are much slower than heterotrophic bacteria in activated sludge processes. Nitrifying bacteria are also very sensitive to factors such as pH, alkalinity, temperature, and chemical inhibitors. Generally, the minimum allowable SRT for operation of a nitrifying activated sludge process is controlled by nitrification kinetics per the commonly used design equations presented below:
aSRTμ=
min
1
(3)
aoN
aa b
DOKDO
NKN
+⎟⎟⎠
⎞⎜⎜⎝
⎛+⎟⎟
⎠
⎞⎜⎜⎝
⎛+
= max,μμ
(4) where µa is the nitrifier specific growth rate, µmax,a is the nitrifier maximum specific growth rate, N is the target effluent ammonia-N concentration, KN is the nitrifier Monod half-saturation
6598
WEFTEC®.06
Copyright 2006 Water Environment Foundation. All Rights Reserved©

coefficient for ammonia, DO is the aeration basin dissolved oxygen concentration, Ko is the nitrifier Monod half-saturation coefficient for oxygen, and ba is the autotrophic decay rate. The actual SRT used for process design is typically determined by multiplying the minimum SRT for nitrification by a safety factor ranging from 1.5 to a value as high as 5.0 (extended aeration). It is commonly found that chemical inhibitors tend to reduce the nitrifier maximum specific growth rate, µmax,a, but can also potentially increase the nitrifier half-saturation coefficient for ammonia, KN. With the input of chemical inhibitor, the SRTmin would increase, possibly approaching the design SRT. If a system is operating at a given design SRT, this suggests that the presence of a chemical inhibitor may not affect process performance (effluent ammonia-N concentration) but could make the system much more susceptible to a nitrification problems as a result of wastewater temperature fluctuations or peak ammonia loading events. As a result, it is critical to evaluate the effect of chemical inhibitors on nitrification kinetic parameters or on direct surrogates of those parameters (e.g. nitrate generation rate) (Kelly et al., 2004; Daigger and Sadick, 1998; Hockenbury and Grady, 1977). As an example scenario, consider a nitrifying activated sludge process operating under winter conditions at a SRT of 15 days and a SRTmin of 10 days (minimum SRT for stable and complete nitrification). With the input of a chemical inhibitor, the SRTmin is increased to 13 days, but effluent quality does not change and so goes unnoticed by plant operators. If a subsequent period of excessively cold weather or a high ammonia loading occurs, a failure of the nitrification process would be expected and would be evident as a deterioration in effluent quality. It is now well-accepted that an evaluation of the effect of a chemical inhibitor on nitrification kinetics is a more sensitive measure of the potential impact on a full-scale nitrification process than an investigation based only on system performance or effluent quality. At wastewater temperatures below 30-35°C (86-95 °F), NOB have slightly higher growth rates than AOB, suggesting that unless, selective inhibition of NOB occurs, complete nitrification should be achieved (Hellinga et al., 1998; Wyffels et al., 2003). Although there are some selective inhibitors of NOB, it is commonly found that AOB are usually more sensitive to chemical inhibitors than NOB, and this has been shown to be the case for zinc (Hu et al., 2004). Kinetic Methods for Assessing Nitrification Inhibition. There are three independent methods that have been used to evaluate nitrification kinetics, and specifically the effect of chemical toxins on nitrification:
1. Respirometry: Respirometry involves the measurement of oxygen uptake rate (OUR) for a biological treatment culture. A sample of mixed liquor is removed from a full-, pilot-, or bench-scale system, placed in a sealed vessel, possibly amended with substrate or nitrification inhibitor, and the rate of oxygen consumption is monitored over time. To evaluate nitrification kinetics, a sample of mixed liquor is added to a temperature-controlled respirometer vessel with and without (control) a chemical stressor. The mixed liquor is supplemented with PE, ammonia-spiked PE, ammonia, or nitrite. Generally, it is desirable to initiate the experiment with relatively high levels of ammonia to allow for a longer experimental run and to ensure that the maximum nitrification rate is maintained. If this is the case, careful control of pH must be maintained to ensure the pH does not
6599
WEFTEC®.06
Copyright 2006 Water Environment Foundation. All Rights Reserved©

drop below about 6.8-7.0 (alkalinity is typically added in the form of sodium carbonate). If organic substrate is added (e.g. PE), these experiments can be run with and without nitrification inhibitor to distinguish between heterotrophic and autotrophic oxygen uptake. Since endogenous heterotrophic oxygen uptake can occur without organic substrate addition, experiments are often run with and without nitrification inhibitor even when ammonia is the only substrate added to the mixed liquor. It is possible to calculate nitrification kinetic parameters based on specific oxygen uptake rate (SOUR) profiles (note that the term “specific” indicates that the OUR has been normalized to the biomass concentration). The use of respirometry by previous researchers to evaluate zinc inhibition of nitrification is summarized in Table 3. Further information concerning commercial instruments available, respirometer operation, and specific details related to the evaluation of nitrification inhibition are available in the following references: Young and Cowan, 2004; Spanjers et al., 1998; Love and Bott, 2000.
2. Ammonia Uptake Rate – Nitrate/Nitrite Generation Rate: In order to evaluate the
nitrification process fully independent of heterotrophic activity, kinetic rates directly related to the consumption or production of reactants and products of the nitrification process itself can be measured, specifically nitrate/nitrite generation rate (NGR) or ammonia uptake rate (AUR). The specific nitrification rate (SNR) can be obtained by normalizing to biomass concentration, and this data can be used to determine the autotrophic kinetic parameters described above. For these experiments, a sample of mixed liquor is added to small temperature controlled reactor vessels (typically less than 1.0-3.0 L). The vessel is mixed and aerated, and the chemical toxin of interest added to the stressed reactor. After the consumption of all residual organic substrate associated with the mixed liquor sample itself, ammonia or nitrite is spiked into the reactor, and again care must be taken to ensure that pH and alkalinity remain within acceptable limits – preferable pH 7 to 8 at all times. The nitrate, nitrite, and ammonia concentrations are monitored over time using typical analytical methods (APHA, 1998). It is critical to rapidly separate the mixed liquor from the soluble supernatant as quickly as possible after removing a sample from the reaction vessel. Typically, samples are removed from the reaction vessels at predetermined time intervals and rapidly centrifuged. The supernatant is poured off and immediately filtered through a 0.45 µm membrane filter. The filtrate can then be preserved for subsequent analysis. As discussed in Table 3, these techniques have also been used to evaluate zinc inhibition of nitrification. More detailed procedures can be found in the following references: Kelly et al., 2004; Madoni et al.,1999; Kelly and Love, 2004; Daigger and Sadick, 1997; Panswad and Polprucksa, 1998. In addition, several relatively new experimental protocols that are derivations of these nitrate generation/ammonia uptake rate measurement procedures have been developed and reported by Melcer et al. (2003) that allow for direct calculation of µmax,a and ba (See Chapters 16 and 17 of the Melcer et al. (2003) report).
3. Alkalinity Titration: Titration bioassay systems monitor the rate of alkalinity
consumption by ammonia-spiked or wastewater-spiked mixed liquor. Since the nitrification process consumes a significant amount of alkalinity, the rate of alkalinity consumption is proportional to the nitrification rate, and these measurements have been found to be relatively sensitive indicators of inhibition. The system works by measuring
6600
WEFTEC®.06
Copyright 2006 Water Environment Foundation. All Rights Reserved©

the amount of base (e.g. NaOH) needed to maintain constant pH in the reaction vessel. Similarly, titration bioassay systems can be used to monitor denitrification rates by tracking the amount of acid required to maintain constant pH. This technology was reviewed in detail by Love and Bott (2000).
Impact of Zinc on Nitrification. It is widely recognized that many heavy metals are inhibitory to the nitrification process including zinc. The effect of zinc on nitrification and the activated sludge process in general has been well-studied, with initial work dating to the 1960s. However, much of the data is contradictory and difficult to interpret in terms of inhibition levels. In many cases, it is difficult to determine where the zinc concentration was measured (influent or aeration basin), how the zinc was added (continuously or single dose), and whether the reported zinc loading is based on total or soluble zinc measurements. Furthermore, zinc inhibition is highly dependent on site-specific conditions, such as pH, alkalinity, temperature, (solids residence time) SRT, (hydraulic residence time) HRT, MLSS concentration, floc particle size distribution (new data - Henriques et al., In review), previous acclimation to zinc or other similar metals (e.g. Cd or Ni), BOD/TKN ratio and the presence of organic chelating agents, making it difficult to compare literature data to the Arlington WPCP. In most cases, the USEPA Local Limit Development Guidance document (2004 and previous) has been the source of threshold inhibition concentration values for chemical toxins typically found in municipal wastewater. This document includes threshold inhibition concentrations for both nitrification and the activated sludge process (suggesting BOD and TSS removal performance). Very often, this is the only information available to Pretreatment Program Coordinators when considering the input of potentially inhibitory chemicals and is readily accepted by regulators. While the guidance document does encourage the development/measurement of site-specific inhibition values, no recommendations or procedures for accomplishing this are provided. For zinc, the document reports a range of threshold inhibition values from 0.08 to 0.5 mg/L and 0.3 to 10 mg/L for nitrification and activated sludge, respectively (USEPA, 2004). The range presented for zinc inhibition of nitrification is considered by many practitioners in this area to be quite low, and other references tend to confirm this speculation. The guidance document does provide references for the reported nitrification inhibition values, and these were explored as shown in Table 2. It seems that the data used to generate the 0.08 to 0.5 mg/L range were taken from a limited number of experiments that were not necessarily designed to answer the specific question being considered. Furthermore, it was not possible to determine exactly how this range (0.08-0.5 mg/L) was extracted from the data referenced, and whether or not it represents total or soluble Zn loading. This range does not consider any of the more recent work reported in Table 3. Current influent total Zn concentrations for the Arlington WPCP are in the range of 0.2 mg/L (The Cadmus Group, Inc., 2004). Based on the information summarized in Table 3, it is likely that an increase in the influent total zinc concentration to the Arlington WPCP of 0.3 mg/L will have little or no effect on nitrification, especially after several weeks of acclimation. Considering the published data as a whole, a total influent Zn of 0.5 mg/L seems to be on the low end of the scale for the threshold inhibition values. However, it is prudent to verify the site-specific impact on nitrification kinetics to ensure that the process is not more sensitized to other stressors (temperature, ammonia loading, other chemicals, etc.) at the current operating SRT.
6601
WEFTEC®.06
Copyright 2006 Water Environment Foundation. All Rights Reserved©

With acclimation at an influent total zinc concentration of 0.5 mg/L, it is likely that nitrification would be not significantly affected, but as indicated above, many site specific parameters affect metal inhibition of nitrification. Accumulation of Zn in process biomass based on the system SRT and partitioning of influent zinc to the biomass is an important factor that must also be considered (Hu et al., 2004).
6602
WEFTEC®.06
Copyright 2006 Water Environment Foundation. All Rights Reserved©

Table 2. Summary of published information concerning the inhibition of nitrification by zinc (references cited in the USEPA (2004) Local Limits Development Guidance).a
Reference Zinc Concentration Inhibition Effect Comments USEPA, 2004 – Local Limits Development Guidance Not an independent investigation.
0.08 – 0.5 mg/L Zn (soluble or total?)
Nitrification inhibition threshold level. It is also unclear whether this represents total or soluble zinc concentrations.
USEPA cited Anthony and Breimhurst, 1981 and Russell et al., 1983.
Eysenbach et al., 1994 – WEF MOP Pretreatment of Industrial Wastes Not an independent investigation.
0.08 – 0.5 mg/L Zn (soluble or total?)
Nitrification inhibition threshold level. It is also unclear whether this represents total or soluble zinc concentrations.
Inhibition values cite EPA Pretreatment documents.
Anthony and Breimhurst, 1981 Not an independent investigation.
0.08 – 0.5 mg/L Zn (author states that this range “probably” represents soluble Zn concentration in the aeration basin)
Author presents as threshold of inhibitory effects on nitrification. Probably based on soluble Zn concentration measured in pilot studies where nitrification was impacted.
A selection of references is provided for all of the heavy metals considered. Most of those that considered Zn are included in this table.
Barth et al., 1965; Barth, et al.; 1963; McDermott, et al., 1962
Combined metal addition -- 2.5 mg/L influent total Zn + 2.0 mg/L total Ni + 0.4 mg/L Cu + 4.3 mg/L total cyanide added to the influent of a nitrifying pilot-scale activated sludge system. No nitrification data provided for Zn alone or Zn without cyanide.
Nitrification inhibition was noted by an increase and a decrease in effluent ammonia and nitrate, respectively compared to a control pilot-scale system. An increase in aeration basin DO was also noted in the metal-stressed system suggesting nitrification inhibition. Over 3-6 months of operation, there was no evidence of acclimation of nitrifiers to heavy metal loading (or added cyanide).
Cyanide is now widely recognized as a potent inhibitor of nitrification. Daigger and Sadick (1997) determined that 0.1-0.2 mg/L cyanide reduced the nitrifier maximum specific growth rate by approximately 50%. This almost certainly affected the noted nitrification inhibition response.
Russell et al., 1983
1.5 mg/L total Zn reported as the threshold inhibitory concentration. The authors also reported an activated sludge threshold inhibition value of 0.03 mg/L Zn (maybe soluble Zn, but not specifically addressed). Cited 1976 EPA pretreatment guidelines.
Author presents as threshold of inhibitory effects on nitrification. The very low value reported for activated sludge inhibition versus nitrification brings this work into question.
For the zinc inhibition value, the authors referenced: Taylor, R.L. (1965) “Soluble Zinc Concentration Inhibitory to Anaerobic Digestion,” Master’s Thesis, Purdue University. Not available for review.
a. The references included in Table 2 were either cited directly by the USEPA Local Limits Development Guidance (2004) document or represent primary publications leading to that reference.
6603
WEFTEC®.06
Copyright 2006 Water Environment Foundation. All Rights Reserved©

Table 3. Summary of other published information concerning inhibition of nitrification by zinc.a Reference Zinc Concentration Inhibition Effect Comments
Kelly et al., 2004a 2.5 mg/L total Zn added in a single shock load at the beginning of bench-scale SBR feed cycle.
Possible slight reduction in nitrate generation rate. No significant effect on reactor performance or effluent quality.
Zn was added to a control SBR to illustrate the effect of a zinc-cyanide complex on nitrification.
Hu et al., 2004 10 to 65 mg/L total Zn added to a nitrifying enrichment culture from a bench-scale activated sludge system treating a high-ammonia wastewater with no carbonaceous COD. Short-term inhibition was monitored by SOUR measurement following ammonia or nitrite injection. The short-term inhibition measurements were compared to measurements conducted after several days of exposure time.
Respirometry-based measurements indicate approximate IC20 ad IC50 values of 20 and 50 mg/L total added Zn, respectively with approximately 60 minutes of metal contact time for unacclimated biomass. Nitrite oxidation was not significantly affected up to 65 mg/L total Zn added. For a 24 hour shock load of about 50 mg/L total Zn to the activated sludge reactors, respirometric measurements indicated significant inhibition after 1-2 days of contact, but subsequent rapid recovery.
Authors demonstrated that short-term respirometric (15-60 min) experiments underestimate the inhibition potential of heavy metals – 24 hour contact periods allow for more significant inhibition of nitrifying enrichment cultures – perhaps due to slow internalization of the metal.
Hu et al., 2003 0.65 to 3.3 mg/L soluble Zn measured in a nitrifying enrichment culture from a bench-scale activated sludge system treating a high-ammonia wastewater with no carbonaceous COD. Short-term inhibition was monitored by SOUR measurement following ammonia injection. Also 65 mg/L total Zn added to determine the effect of exposure time on nitrification inhibition.
Approximately 7, 20, 30, 45, and 57% inhibition of nitrification at measured soluble Zn concentrations of 0.65, 1.3, 1.5, 2.0, 3.0, mg/L respectively, with 15 minutes of metal exposure prior to SOUR measurement. At a total added Zn concentration of 65 mg/L, 65% inhibition was observed 15 minutes after Zn addition, increasing to ~90% inhibition at a point 4 hours after metal addition, and reaching 100% inhibition after 24 hours.
Unacclimated enrichment culture was used. Biomass was grown on NH4-N only in a CMAS system. Study also demonstrated that sorption of metal to biomass and internalized metal concentration correlated well with inhibition levels.
Juliastuti et al., 2003a and Juliastuti et al., 2003b
Using short-term respirometry, 12% reduction in net maximum specific autotrophic growth rate at 0.08 mg/L Zn and complete inhibition at 1.2 mg/L Zn. Using nitrate/nitrite generation rate measurements, nitrification was inhibited by 97% at 1.2 mg/L Zn and 37% at 0.3 mg/L Zn (IC20 = 0.16 mg/L Zn and IC50 = 0.35 mg/L Zn)
These results are not consistent with other published data – much lower inhibitory concentrations. Actual nitrifying mixed liquor from a municipal treatment plant in Belgium was used for these experiments. Zinc was added as zinc sulfate in a relatively large volume of distilled water.
Short-term tests by both respirometry and nitrate/nitrite generation rate measurements – no significant acclimation period. The text in these papers are not clear in terms of whether the reported Zn concentration is based on total added or measurements of soluble Zn in the mixed liquor.
Dalzell et al., 2002 IC50 = 10 mg/L Zn using actual activated sludge samples and based on short-term reduction in nitrite + nitrate generation rate
IC50 values only reported for a selection of potential inhibitors using actual activated sludge and monitoring the production of nitrate + nitrite over a 2 hour period compared to a control.
Short-term test - no acclimation period.
6604
WEFTEC®.06
Copyright 2006 Water Environment Foundation. All Rights Reserved©

Reference Zinc Concentration Inhibition Effect Comments Sharma et al., 2001 MLE pilot plant operated to
simulate full-scale plant and fed actual primary effluent spiked with variable levels of zinc up to 60 mg/L total Zn. Influent zinc concentration was increased over roughly 30 days in several experimental repetitions until nitrification inhibition was observed. Nitrification performance and stability/ inhibition were monitored in terms of effluent ammonia concentrations. SRT ~ 15 days.
The authors concluded that threshold influent inhibitory total and soluble Zn concentrations were 30 and 7.6 mg/L, respectively. On inspection of the data, it seems that some degree of nitrification inhibition occurred at influent soluble Zn levels in the range of 0.8 to 2.0 mg/L, although total Zn levels were still in the range of 30 to 40 mg/L.
The objective of this project was to evaluate site specific nitrification inhibition values for revision of local limits for several heavy metals. This protocol allowed for some degree of nitrifier acclimation to Zn. No control pilot system was operated for comparison, although several experimental repetitions were performed.
Madoni et al., 1999 0, 20, 40, and 80 mg/L total Zn added to activated sludge samples. Ammonia uptake rate and heterotrophic endogenous SOUR were measured.
After 1 hour and 24 hours of contact with 20 mg/L zinc, AUR reduced from 4.17 to 2.10 and from 3.07 to 2.37 mg N/g VSS/hr, respectively. At 1 hour and 24 hours, the measured soluble Zn concentration was 0.93 and 0.16 mg/L, respectively.
Distribution of total versus soluble zinc provided after 1 hour and 24 hours of contract. Short-term test – no acclimation period.
Grunditz, et al., 1998
0.003 to 1.0 mg/L Zn measured in a range of industrial wastewater samples analyzed for pure culture AOB and NOB inhibition.
Zn inhibition was not specifically evaluated. The concentration of a range of heavy metals was correlated to % inhibition, and it was concluded that Zn may have inhibited AOB and NOB over this concentration range.
Short-term test - no acclimation period.
Hayes et al., 1998 IC50 = 33.9 and 10.0 mg/L Zn using immobilized nitrifiers in an aerobic reactor (Amtox™ system) and an unspecified “flask test” (no details provided on the flask test), respectively.
IC50 values only reported for a selection of potential inhibitors including Zn. Amtox™ uses a culture of immobilized nitrifying bacteria in a small aerobic reactor with online pH and ammonia measurement by probes.
Short-term test – no acclimation period.
Panswad and Polprucksa, 1998
0, 10, 25, 35, and 50 mg/L total Zn - continuous feed concentration to bench-scale MLE process.
Continuous Zn addition had no significant impact on measured SNR or SDNR at 10 mg/L Zn addition compared to control. SNR and SNDR decreased significantly in the range of 25 to 50 mg/L Zn compared to control. No significant impact on endogenous SOURs at all Zn concentrations tested.
A stock solution of ZnSO4 was added separately from the synthetic feed to prevent precipitation prior to addition to anoxic zone of MLE process – probably maximized inhibition potential. Although speculative, MLE process configuration suggests maximum potential for denitrification inhibition but some protection for nitrification.
6605
WEFTEC®.06
Copyright 2006 Water Environment Foundation. All Rights Reserved©

Reference Zinc Concentration Inhibition Effect Comments Manoharan et al., 1992
Continuous long term loading of a bench-scale MLE system at 12 to 130 mg/L total Zn (with control) treating a high ammonia leachate (~188 mg/L NH4-N). Shock loading the control MLE system with 30 mg/L total Zn. Short-term batch ammonia uptake measurements using control mixed liquor with the addition of 20 to 32 mg/L total Zn. Total SRT = 10 days, anoxic HRT = 2.4 hours, aerobic HRT = 4.8 hours. Batch testing and measurement of ammonia uptake rates on samples taken from the MLE system provided further evidence that phosphorus limitations affected Zn inhibition of nitrification. These authors bring into question all previous investigations considering the impact of Zn on nitrification, and recommend that soluble phosphorus measurements be performed when evaluating nitrification inhibition due to heavy metals.
With continuous loading of Zn to the MLE system in the range of 12 to 70 mg/L, nitrification inhibition was shown to be caused by phosphorus limitation (precipitation of zinc ortho-phosphate) – nitrification inhibition was not due to continuous Zn addition, but rather to phosphorus limitations. With adequate phosphorus in the influent leachate, complete nitrification was achieved at an influent concentration ranging from 30 to 75 mg/L total Zn – at which time the soluble Zn concentration in the aeration basin was 1.8-6.4 mg/L, the total Zn was 118-334 mg/L, and the biomass contained 71,700-134,000 mg Zn/kg dry solids. With adequate phosphorus in the influent, nitrification inhibition eventually occurred when the influent total Zn concentration was increased to 130 mg/L – soluble Zn in the aeration basin = 7-11 mg/L and biomass content = 191,000 mg/kg.
Long-term acclimation to increasing Zn levels allow for complete nitrification at high influent Zn concentrations. With acclimation, nitrification was possible in an MLE system at up to 75 mg/L total Zn in the feed. Nitrification was stable under a 24 hour 30 mg/L Zn shock load, but was significantly inhibited following a subsequent 48 hour 30 mg/L Zn shock event. Unamended leachate (control) contained approximately 0.2 mg/L total Zn.
Benmoussa et al., 1986
10, 20, 50, 100 mg/L total Zn added to actual activated sludge samples. Evaluated decrease in ammonia uptake rate compared to control.
Less than 25% inhibition at all concentrations tested. Some inconsistencies in data and conclusions noted.
Article is in French, and inhibition data is presented based on Zn concentration normalized to MLVSS.
Neufeld and Greenfield, 1981
0.5 mg/L Zn is toxic for ammonia oxidizing bacteria (pure cultures used but it is not clear whether this is soluble or total Zn)
No information available concerning inhibition experiment performed or basis for conclusions.
Reference was not available for review. Cited from Madoni et al., 1999 and Benmoussa et al., 1986.
Beckmann et al., 1972
3 mg/L Zn = 100% inhibition of nitrification. Mechanism of inhibition and test details unknown.
No details available. This paper was cited in Benmoussa et al., 1986, but there was no citation for this reference. Unable to find Beckmann et al., 1972 in available electronic databases.
a. The information in the references included in Table 3 was not included in the USEPA Local Limits Development Guidance (2004) document. Experimental Objectives The primary objective of this project was to determine whether the maximum expected increase in influent total zinc to the Arlington WPCP based on the anticipated zinc ortho-phosphate
6606
WEFTEC®.06
Copyright 2006 Water Environment Foundation. All Rights Reserved©

dosing scheme, will have an effect on nitrification process performance. A secondary objective of this work was to compare several kinetic methods for evaluating nitrification inhibition. • Oxygen Uptake Rate: Continuous respirometry was conducted for periods as long as 5 days
using fresh mixed liquor and ammonia- or nitrite-spiked secondary effluent (SE) with and without a specific inhibitor of ammonia oxidizing bacteria, allylthiourea (ATU).
• Nitrate Generation Rate (NGR): Direct measurements of nitrate generation rate were
conducted over periods as long as 2 days in 4 parallel mixed and aerated bench-scale reactors at MLSS concentrations typical of the full-scale process. Substrate was added in the form of either ammonia or nitrite, and pH and alkalinity were controlled. The concentrations of ammonia (total ammonia nitrogen – NH4-N), NO3-N and NO2-N were monitored over time.
Based on information available in the technical literature concerning the impact of zinc on nitrifying bacteria, we hypothesized that the increment of 0.5 mg/L total zinc would have no significant impact on nitrification at the Arlington WPCP. As such, experiments were designed to in an attempt to make 0.5-1.0 mg/L Zn as inhibitory as possible to nitrifying bacteria: • Zinc added from completely soluble Zn2+ stock solution - not premixed in raw wastewater • Potential removal in primary clarifier neglected • Fresh mixed liquor diluted into secondary effluent (which contains ~ 0.5 mg/L PO4-P --
pretty low) • High mass ratio of Zn/MLSS in a given experiment (compared to actual operating MLSS of
2000-3000 mg/L). • Contact for >24 hours up to 5-7 days • No known prior acclimation of nitrifying bacteria to zinc If inhibition is observed under these “worst-case” conditions, it would then be possible to adjust experimental protocol to consider the factors that would tend to decrease the inhibitory effects of 0.5 mg/L total Zn added to the water supply. The following experiments were the focus of this investigation: • Respirometry - 0.5 to 50 mg/L Zn + target MLSS of ~1000 mg/L • Nitrate/Nitrite Generation Rate (NOx-N) Measurements – “Snapshot” Experiments
0.5 to 50 mg/L Zn + target MLSS of ~1000 mg/L METHODOLOGY Respirometry A bench-top Challenge AER-200 (Springdale, AR) continuous respirometer was operated with 4 parallel 500 mL reaction vessels at constant temperature. Mixed liquor and secondary effluent were added to each reaction vessel to roughly simulate the MLSS of the full-scale process. The respirometer system was configured and operated per the manufacturer’s instructions. Data acquisition by the respirometer was initiated, and stock solutions of various chemicals were added either initially or after some reaction period had elapsed. Data acquisition was continued for 1-72 hours depending on the data produced and the goal of that specific experiment. Testing was conducted by adding excess NH4-N to the reaction vessels ± zinc and ± nitrification
6607
WEFTEC®.06
Copyright 2006 Water Environment Foundation. All Rights Reserved©

inhibitor (ATU). For these experiments, four NH4-N-spiked reaction vessels were run in parallel: zinc only, nitrification inhibitor only, zinc + nitrification inhibitor, and no zinc/no nitrification inhibitor. In some cases, two zinc concentrations were investigated and the zinc + nitrification inhibitor vessel was not run. To assess the impact of zinc on NOB rather than AOB, NO2-N was also spiked to the mixed liquor rather than NH4-N. For these experiments, it was critical to maintain careful control of pH in the target range of 7.0-7.8. In most scenarios, the dilution water could be simply supplemented with a phosphate-based buffer to control pH. However, since high levels of phosphate would be expected to precipitate the added Zn, it was not possible to use phosphate-based buffers for pH control, because the phosphate would likely alleviate the inhibition potential of Zn on nitrification. Alkalinity in the form of sodium bicarbonate or sodium carbonate was supplemented as needed to ensure that the pH remained between 7 and 8 throughout the test period. Sufficient NH4-N/NO2-N was also be added (and supplemented during the experiment) to ensure that the measured nitrification rate was not limited by NH4-N/NO2-N. However, to avoid free NH4-N inhibition of nitrification (typically NO2-N oxidation), the reactor NH4-N concentration added should did not exceed roughly 50 mg/L NH4-N. This was determined by tracking the total oxygen consumed in each test vessel and/or measuring the residual NH4-N remaining in the reaction vessel at the end of an experiment. MLSS, MLVSS, NH4-N, NO3-N, and NO2-N concentrations were measured at the end of formal experimental runs, but not for preliminary experiments unless needed as information for optimizing SOUR measurements. Total and soluble zinc were also measured for formal experimental runs, and 0.45 µm membrane filters were used to be consistent with typical sampling protocol.
Nitrification kinetic parameters were calculated based on the specific oxygen uptake rate (SOUR). The SOUR, which is represented in units of mg O2/g MLVSS/hour, was used to determine the effect of zinc on the maximum SNR. The following general calculation procedure were performed:
1. Respirometer data was evaluated to determine average SOURs for each of the four reaction vessels. This was generated by taking the slope of the linear portion of the cumulative O2 plot versus time.
2. The ATU-stressed SOUR was subtracted from the control SOUR (NH4-N only) to determine the SOUR due to nitrification. The same procedure was used to determine the SOUR due to nitrification and impacted by Zn.
3. The SOUR due to nitrification was divided by the common factor 4.25 g O2 used per g NH4-N nitrified to NO3-N. As long as the NH4-N concentration in the respirometer vessel remained above approximately 10-20 mg/L (well above the KN value), this provided an estimate of the maximum SNR in units of mg NH4-N oxidized per mg MLVSS per hour – which is related to the maximum specific autotrophic growth rate, μmax,a, through the autotrophic active fraction (which can be assumed constant). The impact of Zn on the maximum SNR can be assessed in this manner.
For experiments where the NH4-N concentration was permitted to decline to levels less than the 15-20 mg/L range, a general indication of the effect of Zn on KN was evaluated by comparing the
6608
WEFTEC®.06
Copyright 2006 Water Environment Foundation. All Rights Reserved©

SOUR curves due to nitrification (mathematical interpretation was not performed). The SOUR curve due to uninhibited nitrification would be expected to look like a straight line, then curving to zero-slope as the NH4-N concentration approaches KN and below. Nitrate Generation Measurements These experiments were conducted in four aerated and mixed 4 L reactor vessels operated in parallel in a constant temperature room. Aeration was provided by aquarium-style air pumps and a small diffuser stone, and mixing was provided with a paddle driven by an electric motor at 100 RPM. Over the course of each experiment, NH4-N, NO3-N, and NO2-N were measured to calculate the NGR. To each reactor vessel, RAS + tap water/secondary effluent were added to simulate the full-scale process or to achieve an appropriate NGR for measurement over a target exposure period (2-72 hours). Testing was conducted by adding excess ammonia-N to the reaction vessels ± zinc and ± nitrification inhibitor (ATU). Nitrification inhibitor was used as a positive control for nitrification inhibition. For these experiments, a control, zinc-stressed reactors at two different concentrations, and an ATU-stressed reactor at 20 mg/L were operated. Alkalinity in the form of sodium bicarbonate was added as needed to ensure that the pH remained between 7.2 and 7.8 throughout the test period (established during initial experiments). Sufficient ammonia was added and intermittently supplemented during the experiment, to ensure that the measured nitrification rate was not limited by ammonia. However, to avoid ammonia inhibition of NOB, the reactor ammonia-N concentration added did not exceed roughly 50 mg/L NH4-N (as determined in preliminary experiments). It was also confirmed via use of a DO probe/monitoring system that the reactor vessel DO was consistently maintained above 3-4 mg/L. The MLSS and MLVSS concentrations were measured at the end of formal experimental runs, but not for preliminary experiments. Total and soluble zinc was measured for formal experimental runs, and a 0.45 µm filter was used to be consistent with the sampling protocol described below.
6609
WEFTEC®.06
Copyright 2006 Water Environment Foundation. All Rights Reserved©

SUMMARY OF RESULTS AND DISCUSSION Respirometry In the early stages of this experimental work, zinc concentrations significantly higher than the proposed 0.5 mg/L increment were used to validate the experimental method used. Thus, higher doses of zinc were used as a control and measured the ability of the respirometry method to detect nitrification inhibition. In each of the experiments conducted at the Arlington WPCP, it was assumed that the vessel dosed with only 50 mg/L NH4-N represented uninhibited nitrification. From NGR experiments, it was confirmed that the vessel dosed with 50 mg/L NH4-N + 20 mg/L ATU exhibited no significant nitrification even over a contact period up to 5 days, and that the only oxygen uptake in this vessel was due to endogenous decay associated with heterotrophic organisms. It is important to recognize that the difference in the measured SOUR between the vessel dosed with only 50 mg/L NH4-N and the vessel dosed with 50 mg/L NH4-N + 20 mg/L ATU represents the oxygen consumed by nitrification. Results are summarized in Table 4, and a representative experiment at 0.5 mg/L Zn is shown in Figure 1. Table 4. Summary of Significant Respirometry Experiments
Respirometry experiments Experimental conditions Degree of inhibition
Zn (mg/L)
NH4-N (mg/L)
NO2-N (mg/L)
Target MLSS (mg/L)
Alk (mg/L
as CaCO3)
Make-up
water (SE or
tap)
Impact of Zn on
cumulative O2 uptake (vs. ctrl)
SNR (control)a
SNR (Zn)a
0.5 (1) 50 -- 1000 150 SE None 4.80 4.91 0.5 (2) 50 -- 1000 150 SE None 4.70 4.65 0.5 (3) 50 -- 1000 150 SE None 4.08 4.11
0.5 -- 50 1000 150 SE None -- -- 1 50 -- 1000 150 SE None 4.08 4.20 10 50 -- 1000 150 TAP Slight 2.24 2.02 10 50 -- 1000 150 SE Slight 2.71 2.18 50 50 -- 1000 150 SE Severe -- --
a. SNR units are mg NH4-N/g MLVSS-hr.
6610
WEFTEC®.06
Copyright 2006 Water Environment Foundation. All Rights Reserved©

0
200
400
600
800
1000
1200
0 20 40 60 80 100 120 140 160
Elapsed Time (hours)
Cum
mul
ativ
e O
2 Upt
ake
(mg/
L)
0.5 mg/L Zn
Control
0.5 mg/L Zn + 20 mg/L ATU
Control + 20 mg/L ATU
Control SNR = 4.79 mg NH4-N/g MLVSS/hour0.5 mg/L Zn SNR = 4.91 mg NH4-N/g MLVSS/hour
Figure 1. Respirometry data showing cumulative oxygen uptake versus time for a representative experiment using 0.5 mg/L Zn. Also shown are the representative specific nitrification rate (SNR) values calculated from this data. For this experiment, ammonia-N was maintain between 20-50 mg/L through addition of (NH4)2SO4 every 10-12 hours until the end of the experiment when the ammonia-N was allowed to deplete, and alkalinity was adjusted accordingly based on pH measurements. Nitrate Generation Rate Experiments A representative NGR experiment was conducted to evaluate the effects of Zn at a concentration of 0.5 mg/L and 1.0 mg/L simultaneously (Table 5). The experiment was run for a period of just over 48 hours. Table 5. Reactor Operating Conditions A B C D
NH4-N 50 mg/L 50 mg/L 50 mg/L 50 mg/L
NaHCO3 as
needed as
needed as needed as needed ATU n/a 20 mg/L n/a n/a
ZnSO4 n/a n/a 0.5 mg/L as
Zn 1.0 mg/L as
Zn
6611
WEFTEC®.06
Copyright 2006 Water Environment Foundation. All Rights Reserved©

-50
0
50
100
150
200
250
0 10 20 30 40 50 60
A
B
C
D
neg control - Best Fit
0.5 mg/L Zn - Best Fit
1.0 mg/L Zn - Best Fit
pos control - Best Fit
Figure 2. Plot of NOx-N concentration (mg/L) versus Time (hours) with linear regression shown for entire experiment.
6612
WEFTEC®.06
Copyright 2006 Water Environment Foundation. All Rights Reserved©

0
20
40
60
80
100
120
0 5 10 15 20 25 30Time (hours)
NO
x-N
(mg/
L)
A
B
C
D
0.5 mg/L Zn - Best Fit
neg control - Best Fit
1.0 mg/L Zn - Best Fit
pos control - Best Fit
Figure 3. Plot of NOx-N concentration (mg/L) versus Time (hours) with linear regression shown of first 24 hours.
6613
WEFTEC®.06
Copyright 2006 Water Environment Foundation. All Rights Reserved©
0
50
100
150
200
250
30 32 34 36 38 40 42 44 46 48 50
Time (hours)
NO
x-N
con
c. (m
g/L)
A
B
C
D
neg control - Best
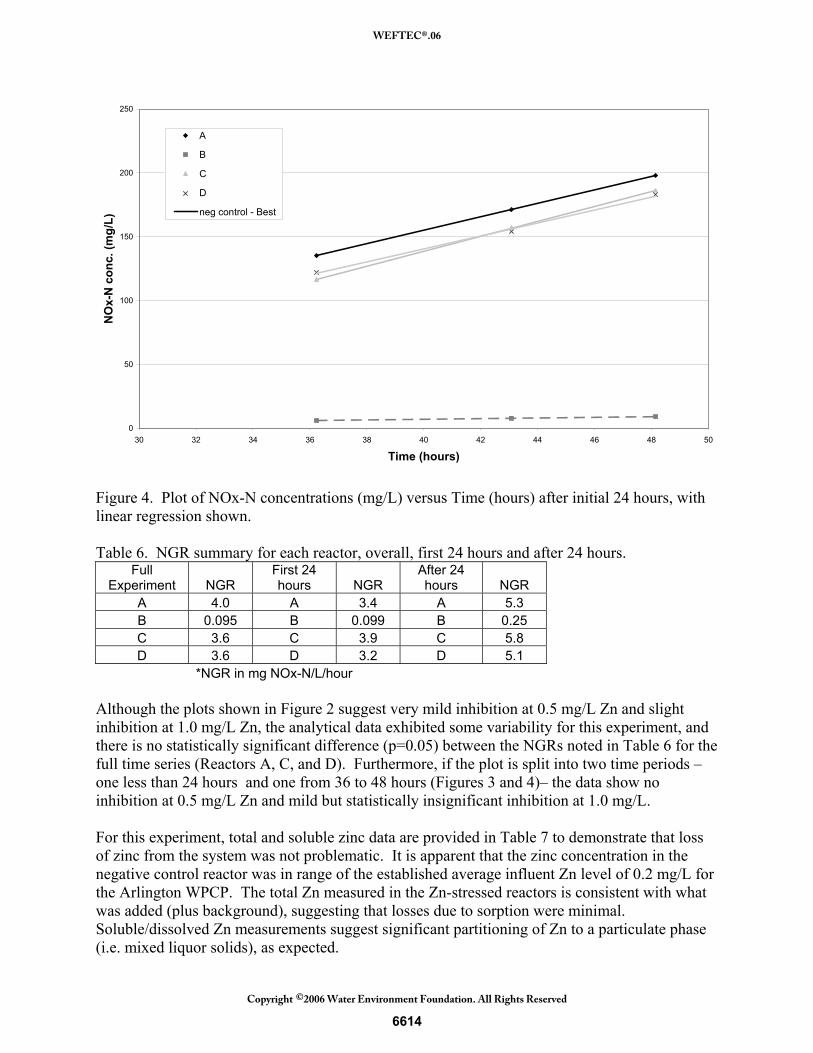
Figure 4. Plot of NOx-N concentrations (mg/L) versus Time (hours) after initial 24 hours, with linear regression shown. Table 6. NGR summary for each reactor, overall, first 24 hours and after 24 hours.
Full Experiment NGR
First 24 hours NGR
After 24 hours NGR
A 4.0 A 3.4 A 5.3 B 0.095 B 0.099 B 0.25 C 3.6 C 3.9 C 5.8 D 3.6 D 3.2 D 5.1
*NGR in mg NOx-N/L/hour Although the plots shown in Figure 2 suggest very mild inhibition at 0.5 mg/L Zn and slight inhibition at 1.0 mg/L Zn, the analytical data exhibited some variability for this experiment, and there is no statistically significant difference (p=0.05) between the NGRs noted in Table 6 for the full time series (Reactors A, C, and D). Furthermore, if the plot is split into two time periods – one less than 24 hours and one from 36 to 48 hours (Figures 3 and 4)– the data show no inhibition at 0.5 mg/L Zn and mild but statistically insignificant inhibition at 1.0 mg/L. For this experiment, total and soluble zinc data are provided in Table 7 to demonstrate that loss of zinc from the system was not problematic. It is apparent that the zinc concentration in the negative control reactor was in range of the established average influent Zn level of 0.2 mg/L for the Arlington WPCP. The total Zn measured in the Zn-stressed reactors is consistent with what was added (plus background), suggesting that losses due to sorption were minimal. Soluble/dissolved Zn measurements suggest significant partitioning of Zn to a particulate phase (i.e. mixed liquor solids), as expected.
6614
WEFTEC®.06
Copyright 2006 Water Environment Foundation. All Rights Reserved©

Table 7. Total and Soluble Zinc concentrations for NGR experiment
Reactor Total Zinc (mg/L) Soluble Zinc (mg/L) A - Neg. Control (no Zinc
added) 0.230 0.190
C - 0.5 mg/L Zinc 0.750 0.200 D - 1.0 mg/L Zinc 1.100 0.210
A similar NGR experiment was conducted with 0.5 and 10 mg/L Zn added. The target MLSS concentration was 1000 mg/L however, after lab analysis the MLSS concentration was determined to be 565 mg/L in the reactors. Secondary effluent diluent was aerated for several hours to remove excess carbon dioxide. After aeration, sulfuric acid and sodium bicarbonate were added to adjust the pH to 7.6, while maintaining the necessary alkalinity. Ammonia-N was added as needed to maintain reactor concentrations above 15-20 mg/L and below 50 mg/L. Table 8. Reactor Operation A B C D
NH4-N 50 mg/L 50 mg/L 50 mg/L 50 mg/L NaHCO3 as
CaCO3 as
needed as
needed As needed as needed ATU n/a 20 mg/L n/a n/a
ZnSO4 n/a n/a 0.5 mg/L as Zn 10 mg/L as
Zn
6615
WEFTEC®.06
Copyright 2006 Water Environment Foundation. All Rights Reserved©

0
20
40
60
80
100
120
140
0 5 10 15 20 25 30 35 40 45 50
Time (hours)
NO
3-N
Con
c. (m
g/L)
ABCDA - neg. control - Best FitB - pos. control - Best FitC - 0.5 mg/L Zn - Best FitD - 10 mg/L Zn - Best Fit
Figure 5. Nitrate concentration (mg/L) plotted versus Time (hours) with the line of Best Fit from linear regression shown. Table 9. Specific nitrate generation rates NGR Reactor mg NO3-N/ g MLVSS hr
A 5.7 B 0.10 C 5.6 D 2.6
As shown in Table 9, the specific NGR for the control reactor and 0.5 mg/L Zn-stressed reactor was 5.7 and 5.6 mg NO3-N/g MLVSS/hr, respectively. While a zinc dose of 10 mg/L reduced the NGR by more than 50%, there seems to be no significant inhibition of nitrification at an MLSS concentration of 565 mg/L and a Zn concentration of 0.5 mg/L. Since no inhibition was detected at a conservatively low MLSS, nitrification inhibition in the full-scale plant would be unlikely. A summary of NGR experiments is provided in Table 10. Table 10. NGR Experiment Summary
NGR Experiments Experimental Conditions Degree of inhibition
6616
WEFTEC®.06
Copyright 2006 Water Environment Foundation. All Rights Reserved©

Zn (mg/L)
NH4-N (mg/L)
NO2-N (mg/L)
Target MLSS (mg/L)
Alk (mg/L as CaCO3)
Make-up
water (SE or
tap)
Impact of Zn on
NGR (vs. control)
NGR (control)a
NGR (Zn)a
0.5 50 -- 1000 50 Tap none 2.3 2.1 0.5 50 -- 1000 as needed SE none 5.7 5.6 0.5 50 -- 1000 as needed SE none NA NA 1.0 50 -- 1000 as needed SE mild NA NA 10 50 -- 1000 50 Tap mild 2.3 1.7 10 50 -- 1000 as needed SE significant 5.7 2.6 50 50 -- 1000 50 Tap severe 3.9 0.8
a. NGR units are mg NO3-N/g MLVSS-hr. CONCLUSIONS Summary of results: • As expected, 20 mg/L ATU fully and consistently inhibited ammonia oxidation in
respirometry and nitrate generation rate measurements. Full inhibition was observed for periods up to 5 days after initial ATU addition.
• 50 mg/L Zn induced rapid and near-complete inhibition by respirometry and short-term NGR experiments. This response was repeated during several independent experiments.
• 10 mg/L Zn induced mild to significant inhibition by both respirometry and NGR measurements at ~1000 mg/L MLSS, although the degree of inhibition and the contact time required to observed inhibition were somewhat variable and inconsistent.
• There was no significant inhibition observed at 1.0 mg/L Zn assessed by respirometry at ~1000 mg/L MLSS and over a contact period of 3 days.
• Very slight inhibition, though not statistically significant, was observed at 1.0 mg/L Zn assessed by short-term NGR measurements at ~1000 mg/L MLSS and over a contact period of 2 days.
• Several respirometry experiments conducted as long as 4 to 5 days with a target mixed liquor of 1000 mg/L showed no significant inhibition at 0.5 mg/L Zn.
• NGR experiments conducted as long as 2 days with a target mixed liquor of 1000 mg/L showed no significant inhibition at 0.5 mg/L Zn.
• Under ammonia-N limiting conditions, respirometry experiments showed no effect of 0.5 mg/L Zn on the autotrophic half saturation coefficient for ammonia.
• Experiments were conducted to determine the effect of zinc on nitrite oxidizing bacteria only (nitrite rather than ammonia addition). A single respirometry experiment suggested no inhibition at 0.5 mg/L Zn and only slight inhibition at 10 mg/L. A short-term nitrate generation rate experiment indicated no inhibition at 0.5 mg/L and moderate inhibition at 50 mg/L. As expected for zinc inhibition of nitrification, ammonia oxidizing bacteria are much more sensitive to Zn than nitrite oxidizing bacteria.
6617
WEFTEC®.06
Copyright 2006 Water Environment Foundation. All Rights Reserved©

ACKNOWLEDGEMENTS This research was funded by the U.S. Environmental Protection Agency through a contact with The Cadmus Group, Inc and a grant to VMI Research Laboratories, Inc.. The project was also sponsored by the Arlington County, VA Water Pollution Control Plant. The authors would like to thank all of the personnel at the Arlington WPCP for their assistance with this project and specifically Dennis Wisler and Bernie Raiford. Supplementary funding was provided by the VMI Summer Undergraduate Research Institute and the VMI Department of Civil and Environmental Engineering. REFERENCES American Water Works Association Research Foundation (AWWARF) & DVGW-
Technologiezentrum Wasser. (1996) Internal Corrosion of Water Distribution Systems, 2nd Edition. American Water Works Association, Denver, CO.
APHA, AWWA, WEF (1998) Standard Methods for the Examination of Water and Wastewater, APHA, Washington, D.C.
Anthonisen, A. C.; Loehr, R. C.; Prakasam, T. B. S.; Srinath, E. G. (1976) Inhibition of nitrification by ammonia and nitrous acid. Journal of Water Pollution Control Federation, 48 (5), 835-852.
Anthony, R. M. and L. H. Briemburst. 1981. Determining maximum influent concentrations of priority pollutants for treatment plants. Journal of Water Pollution Control Federation, 53 (10), 1457-1468.
Barth, E.F.; Ettinger, M.B.; Salotto, B.V.; McDermott, G.N. (1965) Summary Report on the Effects of Heavy Metal on the Biological Treatment Processes. Journal of the Water Pollution Control Federation, 37 (1), 86-96
Barth, E.F.; Salotto, B.V.; McDermott, G.N.; English, J.N.; Ettinger, M.B. (1963) Effects of a Mixture of Heavy Metals on Sewage Treatment Processes. Proceedings of the 18th Purdue Industrial Waste Conference, 616-635.
Battistoni, P.; Fava, G.; Ruello, M.L. (1993) Heavy Metal Shock Load in Activated Sludge: Uptake and Toxic Effects, Water Research 27, 821-827.
Benes, O.; Spangers, H.; Holba, M. (2002) Respirometry techniques and activated sludge models. Water Science and Technology, 46 (4-5), 1-6.
Benmoussa, H.; Martin, G.; Richard, Y.; Leprince, A. (1986) Etude de l’inhibition de la nitrification par les cations de metaux lourds (Inhibition of Nitrification by Heavy Metal Cations.) Water Research, 20 (11), 1333-1339.
Blum, D. J. W.; Speece, R. E. (1991) A database of chemical toxicity to environmental bacteria and its use in interspecies comparisons and correlations. Research Journal of the Water Pollution Control Federation, 63 (3), 198-207.
The Cadmus Group, Inc. (2004) Investigation of potential environmental impacts due to the use of phosphate-based corrosion inhibitors in the District of Columbia, reported to USEPA Region III, July 22, 2004.
Cardinaletti, M.; Zitelli, A.; Ghirardini, A.V.; Avezzu, F. (1990) Population dynamics of the microfauna in an activated sludge plant treating domestic and industrial effluents. Inquinamento, 32, 239-248.
6618
WEFTEC®.06
Copyright 2006 Water Environment Foundation. All Rights Reserved©

Carus Chemical Company. (2005) Carus UPZ™ Zinc-Orthophosphates Product Data Sheet. Accessed at http://www.caruschem.com/phosphate_zink.htm?sec=phosphate_zink, January 4, 2005.
Coello Oviedo, M.D., D. Sales Márquez, J. M. Quiroga Alonso. 2002. Toxic effects of metals on microbial activity in the activated sludge process. Chemistry and Biochemistry Engineering Quality, 16 (3) 139–144.
Daigger, G. T.; Sadick, T. E. (1998) Evaluation of methods to detect and control nitrification inhibition with specific application to incinerator flue-gas scrubber water. Water Environment Resources, 70 (7), 1248-1257.
Dalzell, D.J.B.; Alte, S.; Aspichueta, E.; De la Sota, A.; Etxebarria, J.; Gutierrez, M.; Hoffmann, C.C.; Sales, D.; Obst, U.; Christofi, N.A. (2002) Comparison of five rapid direct toxicity assessment methods to determine toxicity of pollutants to activated sludge. Chemosphere, 47 (5), 535-545.
Eysenbach, E. et al. (1994) Pretreatment of Industrial Wastes – Manual of Practice FD-3. Water Environment Federation, Alexandia, Virginia.
Ferree, M. A.; Shannon, R. D. (2001) Evaluation of a second derivative UV/visible spectroscopy technique for nitrate and total nitrogen analysis of wastewater samples. Water Resources, 35(1), 327-332.
Gernaey, K.; Verschuere, L.; Luyten, L.; Verstraete, W. (1997) Fast and sensitive acute toxicity detection with an enrichment nitrifying culture. Water Environment Resources, 69 (6), 1163-1169.
Grunditz, C.; Dalhammar, G. (2001) Development of nitrification inhibition assays using pure cultures of nitrosomonas and nitrobacter. Water Research, 35 (2), 433-440.
Grunditz, C.; Gumaelius, L.; Dalhammar, G. (1998) Comparison of inhibition assays using nitrogen removing bacteria: application to industrial wastewater. Water Research, 32 (
(10), 2995-3000. Hayes, E.; Upton, J.; Batts, R.; Pickin, S. (1998) On-line nitrification inhibition monitoring using
immobilized bacteria. Water Science and Technology, 37 (12) 193-196. Hellinga, C.; Schellen, A.A.J.C.; Mulder, J.W.; van Loosdrecht, M.C.M; Heijnen, J.J. (1998) The
SHARON Process: An Innovative Method for Nitrogen Removal From Ammonium-Rich Wastewater. Water Science and Technology, 379 (9), 135-142.
Henriques, I.D.S.; Holbrook, R.D.; Kelly II, R.T.; Love, N.G. (In Review) The Impact of Floc Size on Respiration Inhibition – A Comparitive Investigation. Water Research.
Hockenbury, M. R.; Daigger, G. T.; Grady Jr., C. P. L. (1977) Factors affecting nitrification. American Society of Civil Engineers, Journal of the Environmental Engineering Division. 103 (1) 9-19.
Hockenbury, M. R.; Grady Jr., C. P. L. (1977) Inhibition of nitrification - effects of selected organic compounds. Journal Water Pollution Control Federation. 49 (5), 768-777.
Hooper, A. B.; Terry, K. R. (1973) Specific inhibitors of ammonia oxidation in Nitrosomonas. Journal of Bacteriology, 115 (2), 480-5.
Hooper, A. B.; Vannelli, T.; Bergmann, D. J.; Arciero, D. M. (1997) Enzymology of the oxidation of ammonia to nitrite by bacteria. Antonie Van Leeuwenhoek, 71 (1-2), 59-67.
Hu, Z.; Chandran, K.; Grasso, D.; Smets, B.F. (2004) Comparison of nitrification inhibition by metals in batch and continuous flow reactors. Water Research, 38 (18) 3949-3959.
6619
WEFTEC®.06
Copyright 2006 Water Environment Foundation. All Rights Reserved©
Hu, Z. Q.; Chandran, K.; Grasso, D.; Smets, B. F. (2003) Impact of metal sorption and internalization on nitrification inhibition. Environmental Science and Technology, 37 (4), 728-734.
Juliastuti, S.R.; Baeyens, J.; Creemers, C.; Bixio, D.; Lodewyckx, E., (2003a) The inhibitory effects of heavy metals and organic compounds on the net maximum specific growth rate of the autotrophic biomass in activated sludge. Journal of Hazardous Materials, 100 (1-3), 271-283.
Juliastuti, S.R.; Baeyens, J.; Creemers, C. (2003b) Inhibition of nitrification by heavy metals and organic compounds: the ISO 9509 test. Environmental Engineering Science, 20 (2) 79-90.
Kelly II, R.T.; Henriques, I.D.S.; Love, N.G. (2004a) Chemical inhibition of nitrification in activated sludge. Biotechnology and Bioengineering. 85 (6), 683-694.
Kelly II, R.T.; Love, N.G. (2004b) A Critical Comparison of Methods Used to Determine Nitrification Inhibition, Proceedings of the 2004 Water Environment Federation Technical Conference and Exposition.
Lee, Y.-W.; Ong, S.-K.; Sato, C. (1997) Effects of heavy metals on nitrifying bacteria. Water Science and Technology, 36 (12), 69-74.
Love, N. G.; Smith, R. J.; Gilmore, K. R.; Randall, C. W. (1999) Oxime inhibition of nitrification during treatment of an ammonia-containing industrial wastewater. Water Environment Research, 71 (4), 418-426.
Love, N.G.; Bott, C.B. (2000) WERF Project 99-WWF-2 Report - A Review and Needs Survey of Upset Early Warning Devices. Water Environment Research Foundation, Alexandria, Virginia.
Madoni, P.; Davoli, D.; Guglielmi, L. (1999) Response of sOUR and AUR to heavy metal contamination in activated sludge. Water Research, 33 (10) 2459-2464.
Madoni, P.; Davoli, D.; Gorbi, G.; Vescovi, L. (1996) Toxic effect of heavy metals on the activated sludge protozoan community. Water Research, 30 (1) 135-141.
Manoharan, R.; Harper, S.C.; Mavinic, D. S.; Randall, C.W.; Wang, G.; Marickovich, D. C. (1992) Inferred metal toxicity during the biotreatment of high ammonia landfill leachate. Water Environment Research, 64 (7), 858-865.
McDermott, G.N.; Barth, E.F; Salotto, V.; Ettinger, M.B. (1962) Zinc in Relation to Activated Sludge and Anaerobic Digestion Processes. Proceedings of the 17th Purdue Industrial Waste Conference, 461-475.
McNeill, L.; Edwards, M. (2002) Phosphate inhibitor use at US utilities. Journal of The American Water Works Association, 94 (7).
Melcer, H.; Dold, P.L.; Jones, R.M.; Bye, C.M.; Takacs, I.; Stensel, H.D.; Wilson, A.W.; Sun, P.; Bury, S. (2003) Methods for Wastewater Characterization in Activated Sludge Modeling. Report 99-WWF-3, Water Environment Research Foundation, Alexandria, Virginia.
Neufeld, R.D.; Greenfield, J.H.; Rieder, B. (1986) Temperature, cyanide and phenolic nitrification inhibition. Water Resources, 20 (5), 633-642.
Neufeld, R.D.; Greenfield, J.H. (1981) Technical Progress Report to AISI. Project No. 78-395 (not available for review).
Neufeld, R.D. (1976) Heavy metals-induced deflocculation of activated sludge. Journal of the Water Pollution Control Federation, 48 (8), 1940-1947.
6620
WEFTEC®.06
Copyright 2006 Water Environment Foundation. All Rights Reserved©

Neufeld, R.D.; Hermann, E.R. (1975) Heavy Metal Removal by Acclimated Activated Sludge. Journal of the Water Pollution Control Federation, 47, 762-770.
Nowak, O.; Schweighofer, P.; Svardal, K. (1994) Nitrification inhibition - a method for the estimation of actual maximum autotrophic growth-rates in activated sludge systems. Water Science and Technology, 30 (6), 9-19.
Nowak, O.; Svardal, K. (1993) Observations on the kinetics of nitrification under inhibiting conditions caused by industrial wastewater compounds. Water Science and Technology, 28 (2), 115-123.
Panswad, T.; Polprucksa, P. (1998) Specific oxygen uptake, nitrification and denitrification rates of a zinc-added anoxic/oxic activated sludge process. Water Science and Technology, 38 (1), 133-139.
Perterson, B.; Gernaey, K.; Vanrolleghem, P.A. (2001) Anoxic activated sludge monitoring with combined nitrate and titrimetric measurements. Water Science and Technology, 45 (4-5), 181-190.
Rusk, J.; Hamon, R. E.; Stevens, D. P.; McLaughlin, M. J. (2004) Adaptation of soil biological nitrification to heavy metals. Environmental Science and Technology, 38 (11) 3092-3097.
Russell, L. L.; C. B. Cain; D.I. Jenkins. (1983) Impacts of priority pollutants on publicly owned treated works processes: a literature review. Proceedings of the 1983 Purdue Industrial Waste Conference, 871-883.
Sharma A.; Sneide, M.; Waters, J.; Schurman, J. (2001) Impact of heavy metals inhibition study on Chesterfield County, Virginia’s pretreatment program. Proceedings of the 2001 Water Environment Federation Technical Conference and Exposition - WEFTEC 2001, Atlanta, Georgia, October 13-17, 2001.
Sinkjaer, O.; Bogebjerg, P.; Gruttner, H.; Harremoes, P.; Jensen, K.F.; Winther-Nielsen, M. (1996) External and internal sources which inhibit the nitrification process in wastewater treatment plants. Water Science and Technology, 33 (6) 57-66.
Smolders, E.; Brans, K.; Coppens, F.; Merckx, R. (2001) Potential nitrification rate as a tool for screening toxicity in metal-contaminated soils. Environmental Toxicology and Chemistry, 20 (11), 2469-2474.
Smolders, E.; McGrath, S. P.; Lombi, E.; Karman, C.C.; Bernhard, R.; Cools, D.; Van den Brande, K.; Van Os, B.; Walrave, N. (2003) Comparison of toxicity of zinc for soil microbial processes between laboratory-contamined and polluted field soils. Environmental Toxicology and Chemistry, 22 (11), 2592-2598.
Spanjers, H.; Vanrolleghem, P.A.; Olsson, G.; Dold, P.L. (1998) Respirometry in the Control of the Activated Sludge Process: Principles. Scientific and Technical Report No 7 of the Internatinal Water Association (formerly IAWQ), London, England.
Stumm, W.; Morgan, J.J. (1996) Aquatic Chemistry: Chemical Equilibria and Rates in Natural Waters. John Wiley & Sons, Inc., New York.
Thomas, O.; Theraulaz, F.; Agnel, C.; Suryani, S. (1996) Advanced UV examination of wastewater. Environmental Technology, 17 (3), 251-261.
U.S. Environmental Protection Agency (USEPA). (1986) Working document: interferences of publicly owned treatment works (document not available for review).
U.S. Environmental Protection Agency (USEPA). (2004) Local Limits Development Guidance. EPA 833-R-04-002.
Wood, L. B.; Hurley, B. J. E.; Matthews, P. J. (1981) Some observations on the biochemistry and inhibition of nitrification. Water Resources, 15, 543-551.
6621
WEFTEC®.06
Copyright 2006 Water Environment Foundation. All Rights Reserved©

Wyffels, S.; Boeckx, P.; Pynaert, K.; Verstraete, W.; Cleemput, O.V. (2003) Sustained Nitrite Accumulation in a Membrane-Assisted Bioreactor (MBR) for the Treatment of Ammonium-Rich Wastewater. Journal of Chemical Technology and Biotechnology, 78, 412-419.
Young, J.C.; Cowan, R.M. (2004) Respirometry for Environmental Science and Engineering. SJ Enterprises, Springdale, Arkansas.
6622
WEFTEC®.06
Copyright 2006 Water Environment Foundation. All Rights Reserved©