Embed Size (px)
Citation preview

July, 2008 IEEE P802.15-08-0421-00-0006
IEEE P802.15Wireless Personal Area Networks
Project IEEE P802.15 Working Group for Wireless Personal Area Networks(WPANs)
Title Narrowband Channel Characterization for Body Area Networks
DateSubmitted
Tuesday 8th July, 2008
Source
Dino Miniutti, Leif Hanlen, DavidSmith, Andrew Zhang, DanielLewis, David Rodda, Ben Gilbert
NICTA
7 London Circuit, Canberra ACT2600, Australia
Voice: +61-2-6267-6256
Fax: +61-2-6267-6220
Email: [email protected]
Re: 15-08-0033-02-0006-draft-of-channel-model-for-body-area-network
Abstract This document presents the results of narrowband on-body wireless channelmeasurements around the 900 and 2400 MHz ISM bands. The focus is oncharacterizing the effects of movement on the BAN channel.
Purpose This document is intended to aid in the formation of a channel model forthe IEEE 802.15.6 BAN standard.
Notice This document has been prepared to assist the IEEE P802.15. It is offeredas a basis for discussion and is not binding on the contributing individual(s)or organization(s). The material in this document is subject to change inform and content after further study. The contributor(s) reserve(s) the rightto add, amend or withdraw material contained herein.
Release The contributor acknowledges and accepts that this contribution becomesthe property of IEEE and may be made publicly available by P802.15.
Submission Page 1 Miniutti et. al., NICTA
July, 2008 IEEE P802.15-08-0421-00-0006
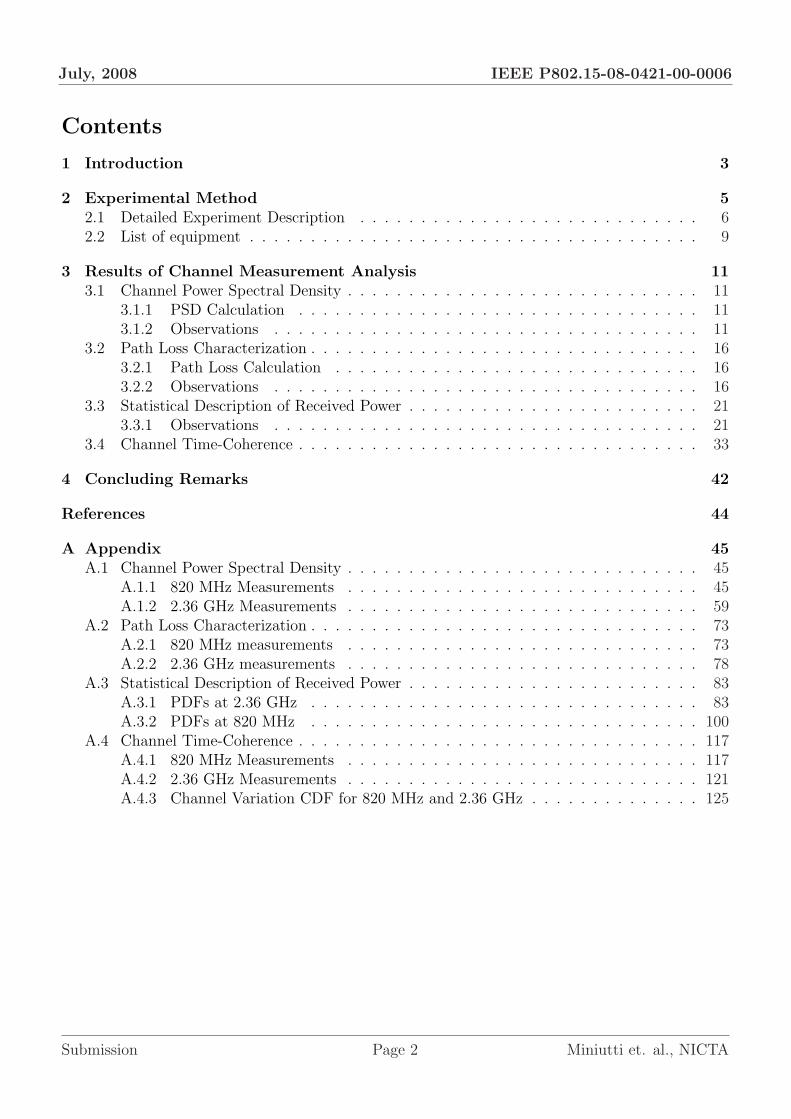
Contents
1 Introduction 3
2 Experimental Method 52.1 Detailed Experiment Description . . . . . . . . . . . . . . . . . . . . . . . . . . . . 62.2 List of equipment . . . . . . . . . . . . . . . . . . . . . . . . . . . . . . . . . . . . . 9
3 Results of Channel Measurement Analysis 113.1 Channel Power Spectral Density . . . . . . . . . . . . . . . . . . . . . . . . . . . . . 11
3.1.1 PSD Calculation . . . . . . . . . . . . . . . . . . . . . . . . . . . . . . . . . 113.1.2 Observations . . . . . . . . . . . . . . . . . . . . . . . . . . . . . . . . . . . 11
3.2 Path Loss Characterization . . . . . . . . . . . . . . . . . . . . . . . . . . . . . . . . 163.2.1 Path Loss Calculation . . . . . . . . . . . . . . . . . . . . . . . . . . . . . . 163.2.2 Observations . . . . . . . . . . . . . . . . . . . . . . . . . . . . . . . . . . . 16
3.3 Statistical Description of Received Power . . . . . . . . . . . . . . . . . . . . . . . . 213.3.1 Observations . . . . . . . . . . . . . . . . . . . . . . . . . . . . . . . . . . . 21
3.4 Channel Time-Coherence . . . . . . . . . . . . . . . . . . . . . . . . . . . . . . . . . 33
4 Concluding Remarks 42
References 44
A Appendix 45A.1 Channel Power Spectral Density . . . . . . . . . . . . . . . . . . . . . . . . . . . . . 45
A.1.1 820 MHz Measurements . . . . . . . . . . . . . . . . . . . . . . . . . . . . . 45A.1.2 2.36 GHz Measurements . . . . . . . . . . . . . . . . . . . . . . . . . . . . . 59
A.2 Path Loss Characterization . . . . . . . . . . . . . . . . . . . . . . . . . . . . . . . . 73A.2.1 820 MHz measurements . . . . . . . . . . . . . . . . . . . . . . . . . . . . . 73A.2.2 2.36 GHz measurements . . . . . . . . . . . . . . . . . . . . . . . . . . . . . 78
A.3 Statistical Description of Received Power . . . . . . . . . . . . . . . . . . . . . . . . 83A.3.1 PDFs at 2.36 GHz . . . . . . . . . . . . . . . . . . . . . . . . . . . . . . . . 83A.3.2 PDFs at 820 MHz . . . . . . . . . . . . . . . . . . . . . . . . . . . . . . . . 100
A.4 Channel Time-Coherence . . . . . . . . . . . . . . . . . . . . . . . . . . . . . . . . . 117A.4.1 820 MHz Measurements . . . . . . . . . . . . . . . . . . . . . . . . . . . . . 117A.4.2 2.36 GHz Measurements . . . . . . . . . . . . . . . . . . . . . . . . . . . . . 121A.4.3 Channel Variation CDF for 820 MHz and 2.36 GHz . . . . . . . . . . . . . . 125
Submission Page 2 Miniutti et. al., NICTA
July, 2008 IEEE P802.15-08-0421-00-0006
1 Introduction
With computers, sensors and devices getting smaller, there now exist many electronic devices thatcan be worn on, or attached to, the human body. These wearable devices have a wide-rangingnumber of uses; including defense, medical and sporting applications. As the number of devicesthat people wear increases, the potential for an interconnected network of these devices (that isgreater than the sum of its parts) becomes more likely. There are many challenges involved withbuilding such a network, but one that is particularly useful is the elimination of wires to improvecomfort and mobility of the human user. It is thus important to understand the on-body wirelesschannel as such understanding can maximize capacity and minimize power consumption of thesebody area networks.
The purpose of this paper is to promote such understanding by presenting the results of anumber of on-body channel studies that can be used to aid in the design of body area networksystems and channel models. It is hoped that this paper will provide assistance in the design of achannel model for The Institute of Electrical and Electronic Engineers (IEEE) 802.15.6 Body AreaNetwork (BAN) standard [1]. In particular, the authors wish to use it to stress the dramatic effectthat movement of the human body has on on-body wireless networks.
The investigation presented here involve the measurement of on-body narrowband wireless chan-nels centered in regions around the 900 and 2400 MHz Industrial Scientific and Medical (ISM) bands.All measurements were performed on a human test subject in an indoor office environment withwearable antennas placed at different points on his body.
The study of this type of on-body wireless system (in an indoor environment) is challengingas there are many possible propagation paths between the antennas, including the often identifieddiffracted path around the human body, e.g. [2]. Each of these paths can experience fading due tothe movement of the human body, as well as from multipath around the body and the surroundingenvironment. Of these effects, as described here, the fading effects due to movement are identifiedto be the most significant. This is partly due to the fact that movement affects the couplingof the transmitting and receiving antennas by affecting their relative geometry (alignment anddisplacement), but also because movement can significantly change the environment between theantennas by introducing obstacles between them.
A further challenge is that the body changes the near and far-field electromagnetic radiationcharacteristics of the body-worn antennas [3–7]. This coupled with the variable geometry andplacement of the antennas makes it very difficult to separate the effects of the propagation pathfrom the response of the antennas. To separate these effects would require the characterizationof the radiation fields close to the antenna1, through and in close proximity to the body, which isoutside the intended scope of this work. Rather in this study, more practically, the antennas areconsidered to be a part of the channel as they are used in a standard indoor environment.
There have been other similar studies that have measured on-body narrowband wireless channels[8, 9]2 but they differ in a number of important ways. The innovation in this study is the analysisof the effects of continuous movement of the human body on the wireless channel, as an importantaddition to prior studies of human standing still or having a change in stance. Thus in this dynamiccharacterization of movement, measurements were taken while the test subject was walking andrunning on the spot, for a variety of transmit and receive antenna positions on the subject’s
1Commonly done with an anechoic chamber2Also, more generally studies on measurement, simulation, modeling and characterization of on-body wideband
or narrowband wireless channels [2, 10–13]
Submission Page 3 Miniutti et. al., NICTA
July, 2008 IEEE P802.15-08-0421-00-0006
body. Additional measurements were made with the subject standing still to serve as a reference.For each type of movement, post-measurement analysis was done to characterize the movement-induced variability in link gain, or path loss. The distribution of the normalized received powerfound by path loss measurements was statistically described using a probability density comparedto a number of common statistical distributions to find the best match for all scenarios. Furtheranalysis was also performed to estimate the coherence time, and hence characterize stability in adynamic environment, of the on-body channel.
A more detailed description of the experimental method follows in the next section. Section 3describes the analytical results found from measurements taken, including: - description of thechannel’s power spectral density; a characterization of path loss in all measurement positions; astatistical description of received power ; and channel coherence time analysis. The final sectionprovides some concluding remarks. There is an appendix (after references) which gives a compre-hensive catalog of analytical results described in Section 3.
Submission Page 4 Miniutti et. al., NICTA

July, 2008 IEEE P802.15-08-0421-00-0006
2 Experimental Method
Wireless on-body channel measurements were made using two commercial wearable antennasstrapped with VELCRO R© tape to the body of a 181.5 cm / 78 kg male test subject in an of-fice environment.
Channel measurements were performed by transmitting test signals centered in regions aroundthe 900 and 2400 MHz ISM bands. The test signals were separately transmitted over one antennawhile the subject was asked to perform three different actions: 1) standing still; 2) walking on thespot; and 3) running on the spot. The signal received at the other antenna was down-converted,sampled for approximately 10 seconds, and saved to disk. Analysis of the measurements was laterdone offline.
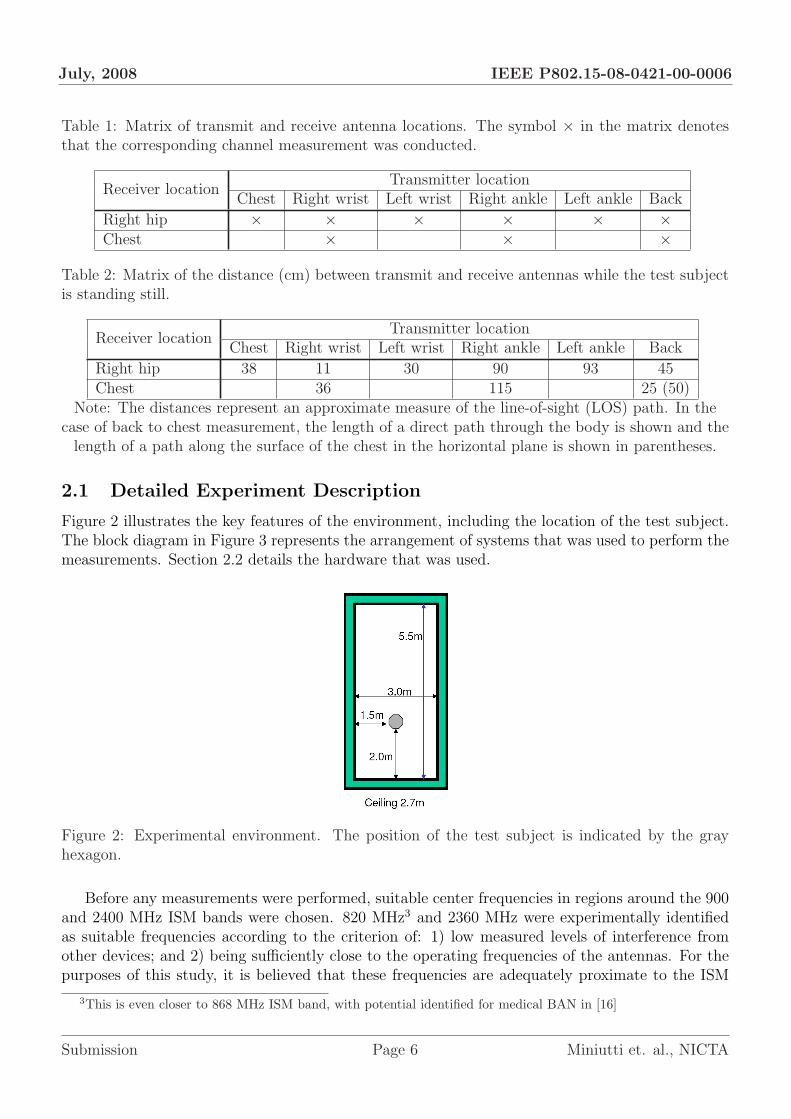
For each set of the three movement scenarios, the transmitting and receiving antennas werestrapped to different locations on the test subject’s body. Figure 1 illustrates the possible locationsof the antennas on the test subject. Table 1 lists the combinations of transmit and receive antennalocations used, with separate channel measurements made for each combination. Table 2 lists theapproximate antenna separations (in cm) for each element in Table 1. For reasons of symmetry,the left wrist and left ankle to chest measurements were not recorded.
Note that the purpose of these measurements is to support the synthesis of a channel model forthe the IEEE 802.15.6 BAN standard [1]. As such, appropriate choices were made when choosing thebit rate, modulation scheme and pulse shaping filters. The combination used provided a relativelyflat (1 dB attenuation in the sidelobes) signal spectrum over a 10 MHz bandwidth. A wirelesssystem with 1 bit/s/Hz modulation efficiency could provide the 10 Mbps required by the 802.15.6technical requirements document [15] within this bandwidth. More efficient systems could use lessbandwidth, but the largest bandwidth was chosen to maximise frequency coverage and channelresolution in the time domain. The relatively flat spectrum also facilitated in the power spectralanalysis performed in Section 3.1.
Figure 1: Possible antenna locations on test subject.
Submission Page 5 Miniutti et. al., NICTA
July, 2008 IEEE P802.15-08-0421-00-0006
Table 1: Matrix of transmit and receive antenna locations. The symbol × in the matrix denotesthat the corresponding channel measurement was conducted.
Receiver locationTransmitter location
Chest Right wrist Left wrist Right ankle Left ankle Back
Right hip × × × × × ×Chest × × ×
Table 2: Matrix of the distance (cm) between transmit and receive antennas while the test subjectis standing still.
Receiver locationTransmitter location
Chest Right wrist Left wrist Right ankle Left ankle Back
Right hip 38 11 30 90 93 45Chest 36 115 25 (50)
Note: The distances represent an approximate measure of the line-of-sight (LOS) path. In thecase of back to chest measurement, the length of a direct path through the body is shown and the
length of a path along the surface of the chest in the horizontal plane is shown in parentheses.
2.1 Detailed Experiment Description
Figure 2 illustrates the key features of the environment, including the location of the test subject.The block diagram in Figure 3 represents the arrangement of systems that was used to perform themeasurements. Section 2.2 details the hardware that was used.
Figure 2: Experimental environment. The position of the test subject is indicated by the grayhexagon.
Before any measurements were performed, suitable center frequencies in regions around the 900and 2400 MHz ISM bands were chosen. 820 MHz3 and 2360 MHz were experimentally identifiedas suitable frequencies according to the criterion of: 1) low measured levels of interference fromother devices; and 2) being sufficiently close to the operating frequencies of the antennas. For thepurposes of this study, it is believed that these frequencies are adequately proximate to the ISM
3This is even closer to 868 MHz ISM band, with potential identified for medical BAN in [16]
Submission Page 6 Miniutti et. al., NICTA

July, 2008 IEEE P802.15-08-0421-00-0006
Figure 3: Block diagram of experimental setup.
bands of interest to characterize the behavior of radio signals within those bands.The transmitter was configured to continuously transmit a 63 bit pseudo-noise (PN) binary
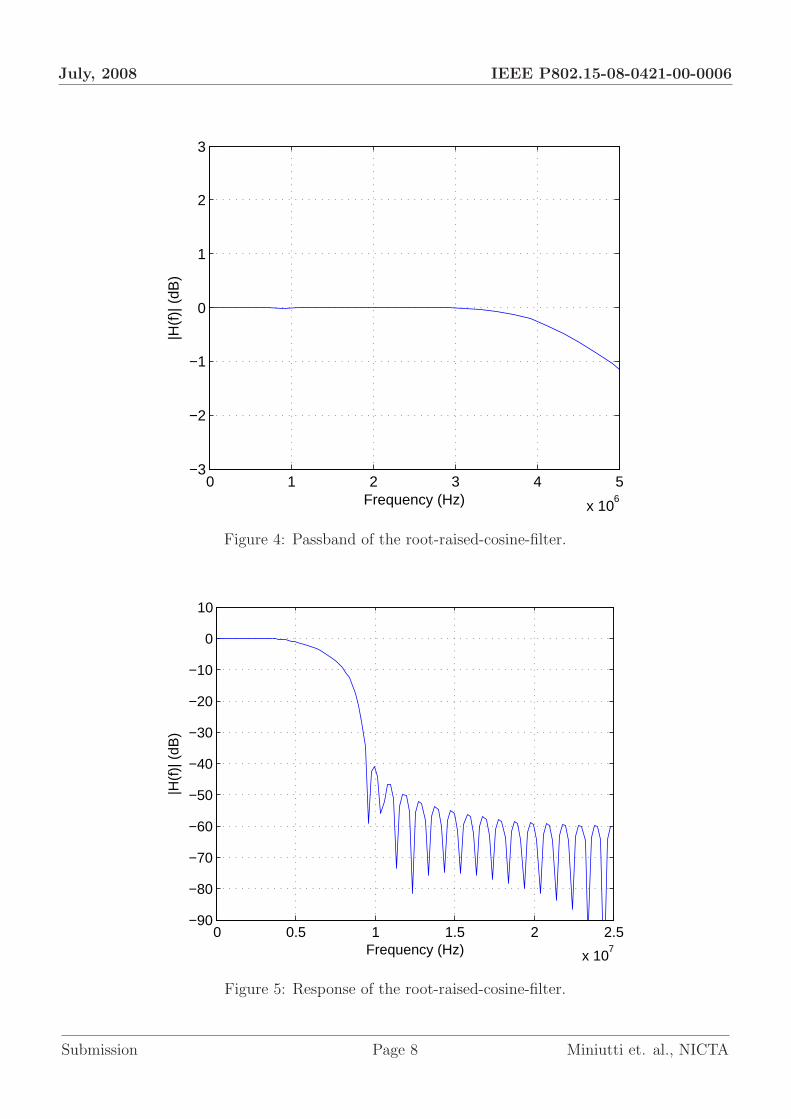
phase shift keyed (BPSK) sequence at a bitrate of 12.5 Mbps. This sequence was filtered by aroot-raised-cosine filter with a roll-off factor of 0.5, resulting in a 10 MHz 1 dB passband and anegligible amount of ripple. An identical filter was used in the receiver. Figure 4 and Figure 5 showthe magnitude of the filter’s frequency response. The sequence was then upsampled, by a factor ofeight, to 100 MHz, to match the sampling rate of the vector signal generator. The power at theoutput of the vector signal generator was set to -10 dBm.
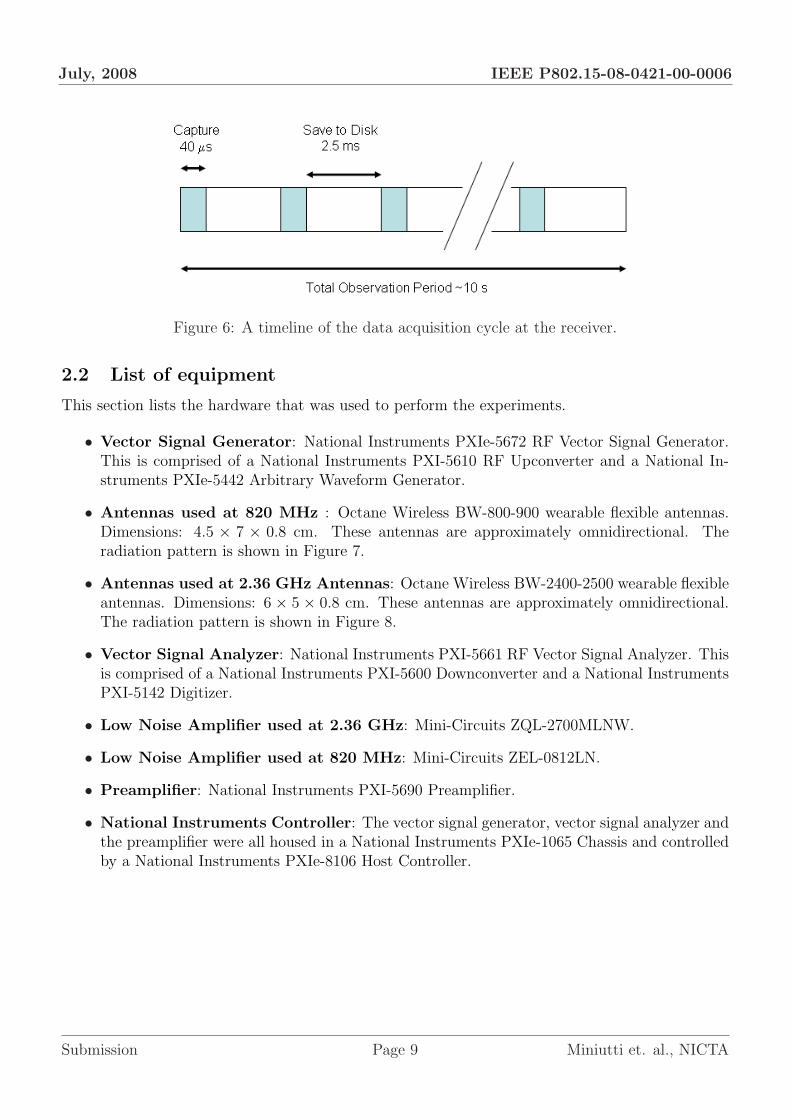
The receiver sampled the received signal at 50 MHz and was set to capture eight cycles of thetransmitted PN sequence. The duration of a capture is approximately 40 µs. Due to limitationsin the receiver hardware, each capture of the eight PN sequences was separated by 2.5 ms, duringwhich time the captured data was saved to disk. The total observation period, including the 2.5 msgaps, was 10 seconds. A timeline of the data acquisition cycle at the receiver is shown in Figure 6.
The gain of the amplifiers and cables were measured before the measurements were performed.During analysis the gain of the channel was obtained by removing the gain of the amplifiers andcables.
Submission Page 7 Miniutti et. al., NICTA
July, 2008 IEEE P802.15-08-0421-00-0006
0 1 2 3 4 5
x 106
−3
−2
−1
0
1
2
3
Frequency (Hz)
|H(f
)| (
dB)
Figure 4: Passband of the root-raised-cosine-filter.
0 0.5 1 1.5 2 2.5
x 107
−90
−80
−70
−60
−50
−40
−30
−20
−10
0
10
Frequency (Hz)
|H(f
)| (
dB)
Figure 5: Response of the root-raised-cosine-filter.
Submission Page 8 Miniutti et. al., NICTA
July, 2008 IEEE P802.15-08-0421-00-0006
Figure 6: A timeline of the data acquisition cycle at the receiver.
2.2 List of equipment
This section lists the hardware that was used to perform the experiments.
• Vector Signal Generator: National Instruments PXIe-5672 RF Vector Signal Generator.This is comprised of a National Instruments PXI-5610 RF Upconverter and a National In-struments PXIe-5442 Arbitrary Waveform Generator.
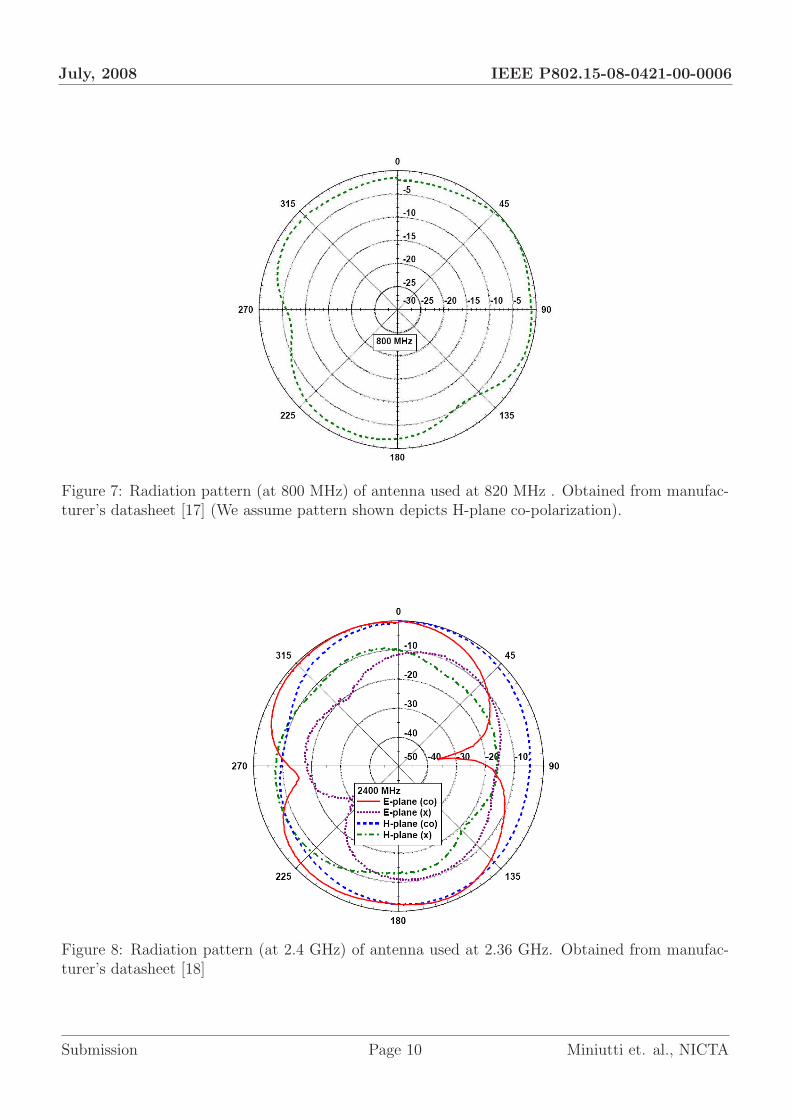
• Antennas used at 820 MHz : Octane Wireless BW-800-900 wearable flexible antennas.Dimensions: 4.5 × 7 × 0.8 cm. These antennas are approximately omnidirectional. Theradiation pattern is shown in Figure 7.
• Antennas used at 2.36 GHz Antennas: Octane Wireless BW-2400-2500 wearable flexibleantennas. Dimensions: 6 × 5 × 0.8 cm. These antennas are approximately omnidirectional.The radiation pattern is shown in Figure 8.
• Vector Signal Analyzer: National Instruments PXI-5661 RF Vector Signal Analyzer. Thisis comprised of a National Instruments PXI-5600 Downconverter and a National InstrumentsPXI-5142 Digitizer.
• Low Noise Amplifier used at 2.36 GHz: Mini-Circuits ZQL-2700MLNW.
• Low Noise Amplifier used at 820 MHz: Mini-Circuits ZEL-0812LN.
• Preamplifier: National Instruments PXI-5690 Preamplifier.
• National Instruments Controller: The vector signal generator, vector signal analyzer andthe preamplifier were all housed in a National Instruments PXIe-1065 Chassis and controlledby a National Instruments PXIe-8106 Host Controller.
Submission Page 9 Miniutti et. al., NICTA
July, 2008 IEEE P802.15-08-0421-00-0006
Figure 7: Radiation pattern (at 800 MHz) of antenna used at 820 MHz . Obtained from manufac-turer’s datasheet [17] (We assume pattern shown depicts H-plane co-polarization).
Figure 8: Radiation pattern (at 2.4 GHz) of antenna used at 2.36 GHz. Obtained from manufac-turer’s datasheet [18]
Submission Page 10 Miniutti et. al., NICTA
July, 2008 IEEE P802.15-08-0421-00-0006
3 Results of Channel Measurement Analysis
This section presents the results of analysis performed on the channel measurements detailed in theprevious section. A number of representative measurements and results which highlight importantfeatures are presented and discussed here. A comprehensive catalog of the results has been placedin the Appendix at the end of this document for the convenience of those who do not want to printout the large number of figures contained therein.
3.1 Channel Power Spectral Density
This section presents a qualitative discussion of the channel response through the examination of thechannel’s power spectral density (PSD). This analysis was performed with the intent of providingthe reader with a high-level understanding of the on-body wireless channel through illustration,rather than analysis. In particular, it observes the relationship between channel fading and theactivity performed by the test subject through power spectral density surface plots of the channelgain with respect to frequency and time.
3.1.1 PSD Calculation
The following technique was used to produce surface plots of the channel gain:The samples within a single 40 µs capture were separated into eight vectors v1, v2, . . . , v8, each
representing the duration of a single PN sequence. These vectors were then averaged to reduce theeffects of noise in subsequent operations. The average received PN sequence vector v was calculatedby
v[n] =1
8
8∑i=1
vi[n]. (1)
Given the relatively short duration of a single capture, it is assumed that the channel is staticduring the period of each capture. Therefore, performing an averaging operation over the eightsets of PN sequences would not destroy information.
The power spectral density for each capture was obtained by correlating v for each capturewith a replica of the transmitted PN sequence and then applying a fast Fourier transform. Theresultant PSD represents the power spectral density of a system that includes the channel andtwo root-raised-cosine filters. The root-raised-cosine filters have a relatively flat passband within5 MHz of DC, with a 1 dB roll-off near the edge (see Section 2.1). Hence, their effect on the powerspectral density is small within ±5 MHz of the carrier frequency, allowing us to disregard theireffect (for this section’s qualitative analysis) within that region and consider the PSD to be that ofthe channel alone.
3.1.2 Observations
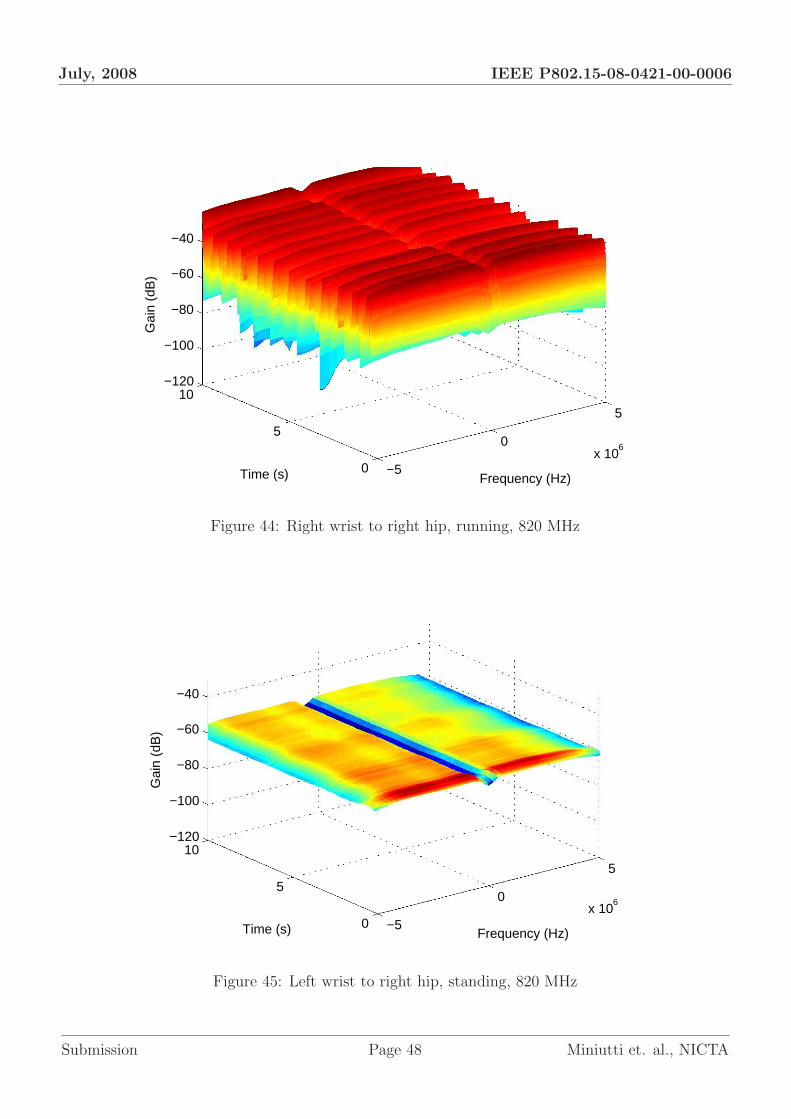
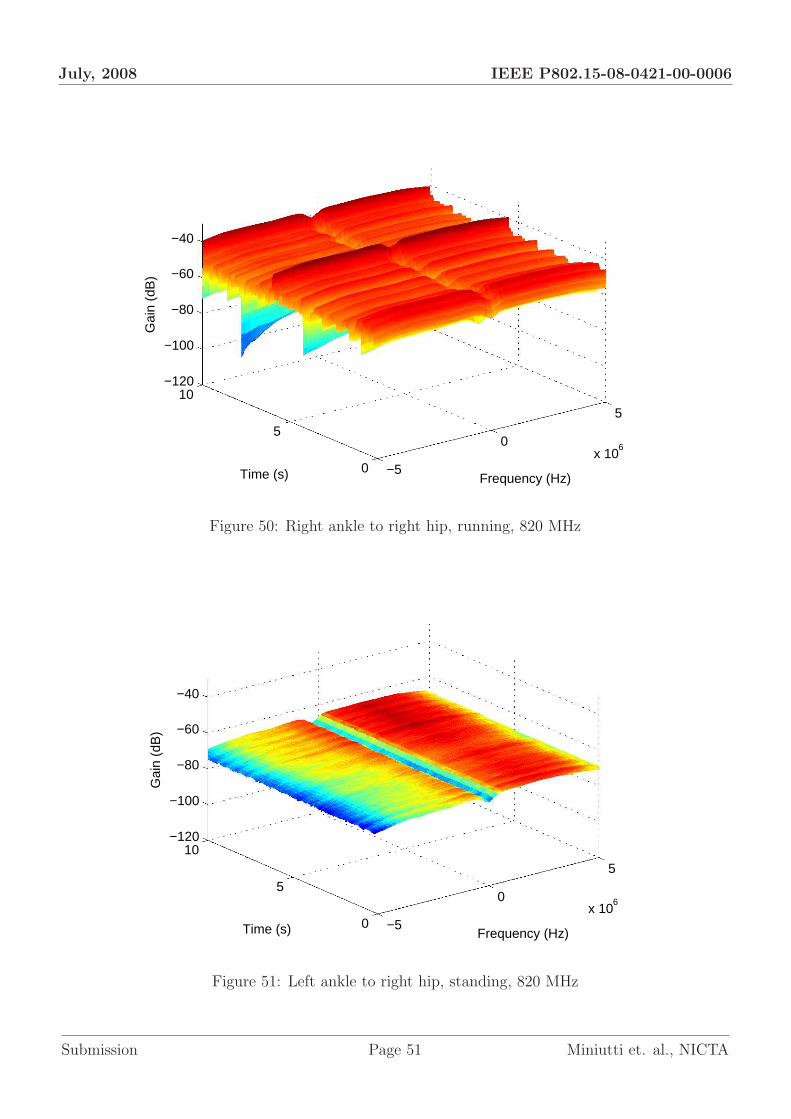
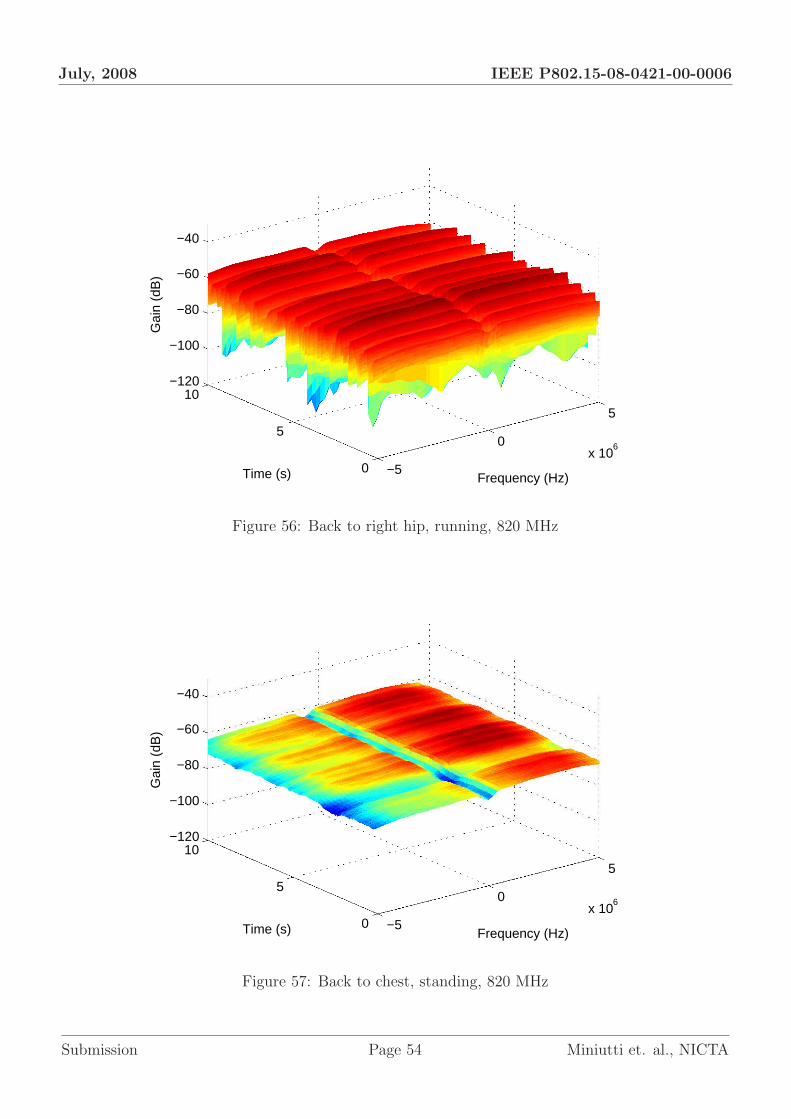
Power spectral density plots for all of the channel measurements can be found in Section A.1. Thissection provides observations on a number of the more interesting results.
• The dominant factor affecting fading in the channel appears to be the movement of the testsubject. This is to be expected as movement causes the separation and orientation of theantennas to change. It can also significantly alter the environment between the antennasby introducing obstacles between them. These fading scenarios are expected to result in
Submission Page 11 Miniutti et. al., NICTA
July, 2008 IEEE P802.15-08-0421-00-0006
frequency non-selective fading (or flat fading), which the PSD plots clearly show as thedominant type of fade. In most measurements frequency-selective fading can not be resolvedfrom the flat-fading.
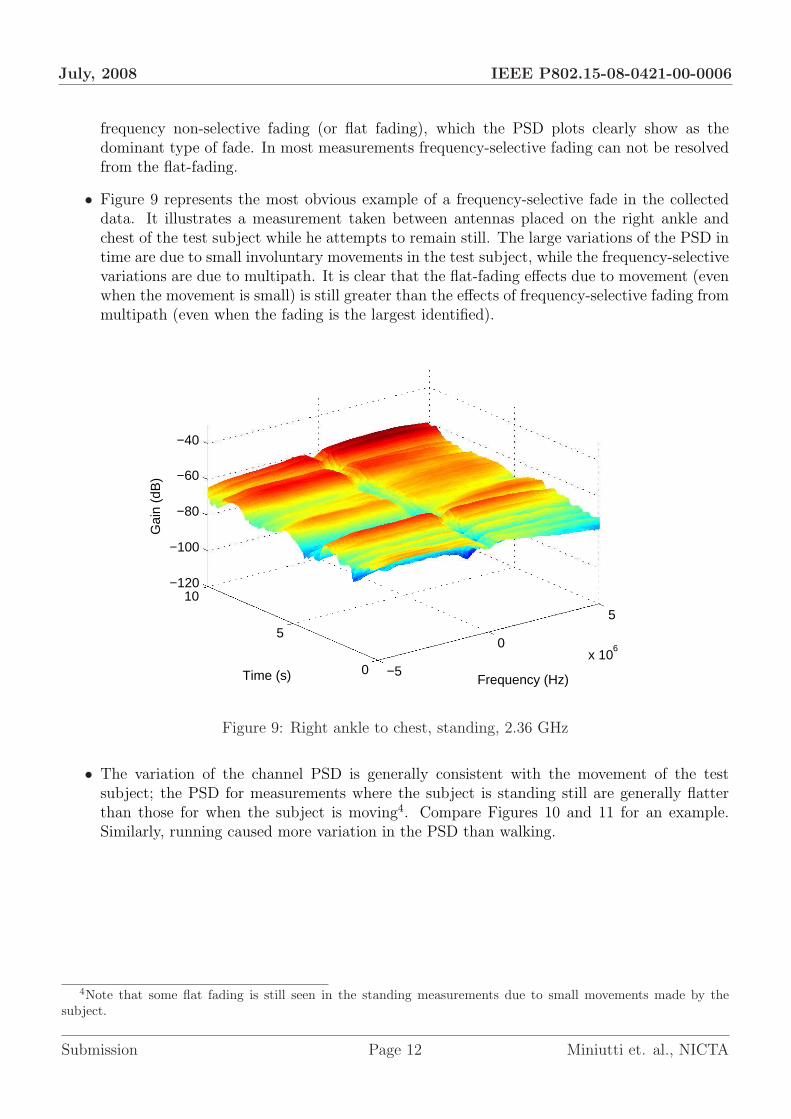
• Figure 9 represents the most obvious example of a frequency-selective fade in the collecteddata. It illustrates a measurement taken between antennas placed on the right ankle andchest of the test subject while he attempts to remain still. The large variations of the PSD intime are due to small involuntary movements in the test subject, while the frequency-selectivevariations are due to multipath. It is clear that the flat-fading effects due to movement (evenwhen the movement is small) is still greater than the effects of frequency-selective fading frommultipath (even when the fading is the largest identified).
−5
0
5
x 106
0
5
10−120
−100
−80
−60
−40
Gai
n (d
B)
Frequency (Hz)Time (s)
Figure 9: Right ankle to chest, standing, 2.36 GHz
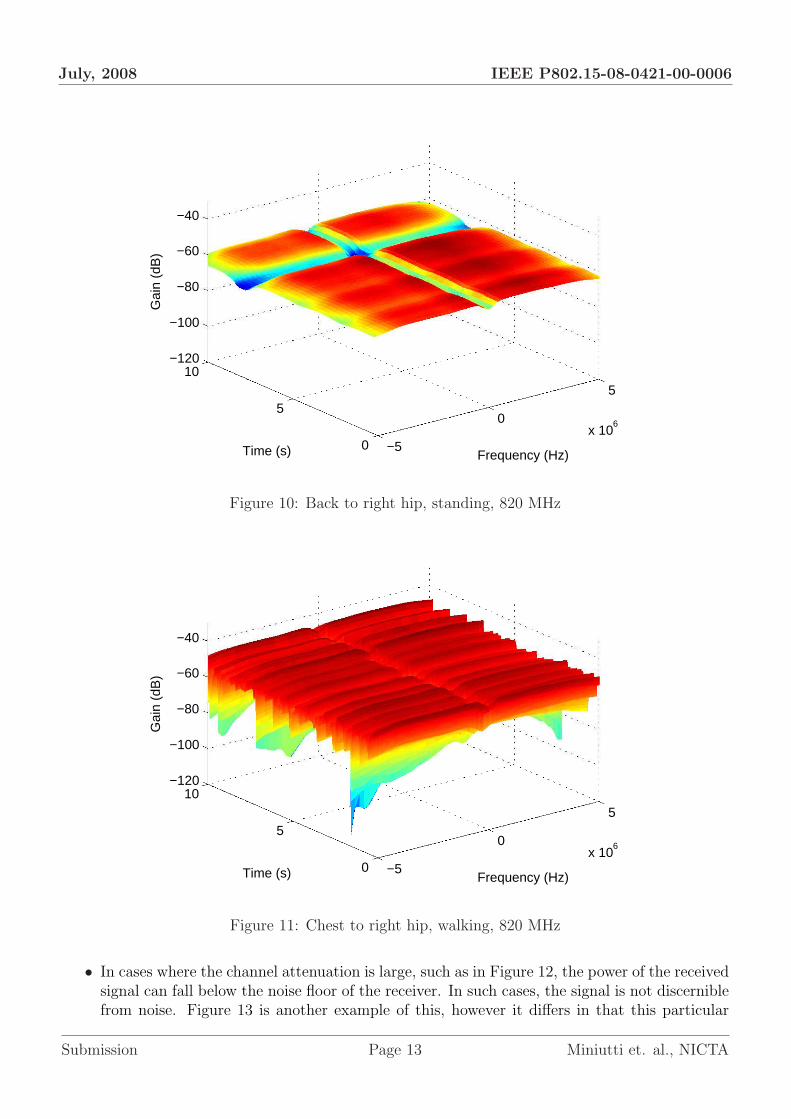
• The variation of the channel PSD is generally consistent with the movement of the testsubject; the PSD for measurements where the subject is standing still are generally flatterthan those for when the subject is moving4. Compare Figures 10 and 11 for an example.Similarly, running caused more variation in the PSD than walking.
4Note that some flat fading is still seen in the standing measurements due to small movements made by thesubject.
Submission Page 12 Miniutti et. al., NICTA
July, 2008 IEEE P802.15-08-0421-00-0006
−5
0
5
x 106
0
5
10−120
−100
−80
−60
−40
Gai
n (d
B)
Frequency (Hz)Time (s)
Figure 10: Back to right hip, standing, 820 MHz
−5
0
5
x 106
0
5
10−120
−100
−80
−60
−40
Gai
n (d
B)
Frequency (Hz)Time (s)
Figure 11: Chest to right hip, walking, 820 MHz
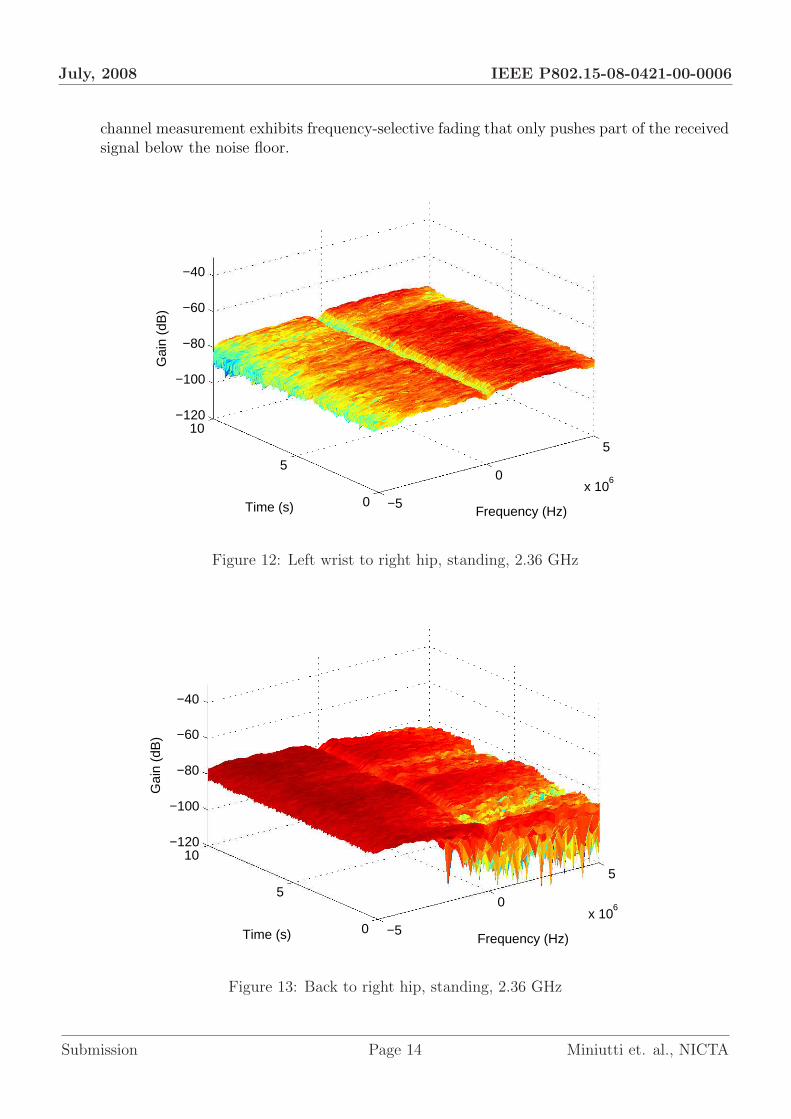
• In cases where the channel attenuation is large, such as in Figure 12, the power of the receivedsignal can fall below the noise floor of the receiver. In such cases, the signal is not discerniblefrom noise. Figure 13 is another example of this, however it differs in that this particular
Submission Page 13 Miniutti et. al., NICTA
July, 2008 IEEE P802.15-08-0421-00-0006
channel measurement exhibits frequency-selective fading that only pushes part of the receivedsignal below the noise floor.
−5
0
5
x 106
0
5
10−120
−100
−80
−60
−40
Gai
n (d
B)
Frequency (Hz)Time (s)
Figure 12: Left wrist to right hip, standing, 2.36 GHz
−5
0
5
x 106
0
5
10−120
−100
−80
−60
−40
Gai
n (d
B)
Frequency (Hz)Time (s)
Figure 13: Back to right hip, standing, 2.36 GHz
Submission Page 14 Miniutti et. al., NICTA

July, 2008 IEEE P802.15-08-0421-00-0006
• A distinct null can be observed at the carrier frequency in all of the PSD plots. This is anartifact of the PN sequence used. The transmitted PN sequence has a relatively small DCvalue compared to the rest of its spectrum and the correlation retains that null at DC.
• There is no observable difference between the shape of the plots at 820 MHz and 2.36 GHz.
• It is clear that the generally flat fading for the moving human body is neither static or quasi-static. However considering the time span of PSD analysis the fading channel, even withmovement, is slow, flat fading (as opposed to fast fading).
Submission Page 15 Miniutti et. al., NICTA
July, 2008 IEEE P802.15-08-0421-00-0006
3.2 Path Loss Characterization
This section presents results for channel path loss performance analysis found by measuring thereceived signal power for each respective combination of transmit and receive antenna position andtest subject action.
3.2.1 Path Loss Calculation
Each channel measurement is of approximately 10 s in duration and consists of multiple 40 µsblocks that are separated in time by 2.5 ms. The RMS power of the received baseband signal (i.e.,after down-conversion and sampling, no pulse-shaping) was calculated for each 40 µs block. Pathloss is then calculated as the difference between transmitted power and received power. As thereceived signal amplitude is measured after the amplifiers, these effects must be removed from thepath loss. The channel path loss PL(t) at a given time t is given by
PL(t) = Ptx − Prx(t) + Gamplifiers − Lcable, (2)
where Ptx is transmitted power, Prx(t) is the RMS received power at time t, Gamplifiers is amplifiergain, and Lcable is cable loss. The amplifier gains and cable losses were measured at 820 MHz and2.36 GHz, with the appropriate result removed from the path loss.
Note that, due to finite receiver sensitivity, the path loss must be less than 78 dB at 820 MHzand 76 dB at 2.36 GHz to distinguish the transmitted signal from noise. The noise floor of thereceiver is calculated by taking a measurement with the transmitting antenna replaced by a 50 Ωload. The measurement then taken at the receiver represented thermal noise and cross-talk betweentransmitter and receiver which, for the purpose of this study, are consolidated into a single noisefigure. The maximum observable path loss then follows from (2).
3.2.2 Observations
The average path loss for each action and antenna placement is shown in Table 3a for 820 MHzand Table 3b for 2.36 GHz. The peak-to-trough path loss variation for each action and antennaplacement is shown in Table 4a for 820 MHz and Table 4b for 2.36 GHz. The variation is calculatedas the difference between maximum and minimum (peak-to-trough) path loss for each measurement.
Sections A.2.1 and A.2.2 illustrate path loss over time, with figures for each antenna placementand action at 820 MHz and 2.36 GHz. The measured noise floor is shown as a horizontal dashedblack line. From these results, the following is observed:
• Path loss around the human body is greater than it would be with a similar antenna separationin free space, even when a line of sight path exists.
• Path loss is generally greater at 2.36 GHz than at 820 MHz.
• The variation in path loss is consistent with the movement of the test subject; as the levelof movement increases (standing < walking < running), so does the level of variation. Forexample, the maximum path loss variation observed in the 2.36 GHz measurements for astanding subject was 7.1 dB, while it was 46.8 dB with a running subject. The relative pathloss variation between the types of movement is generally consistent in both frequency bands.
Submission Page 16 Miniutti et. al., NICTA

July, 2008 IEEE P802.15-08-0421-00-0006
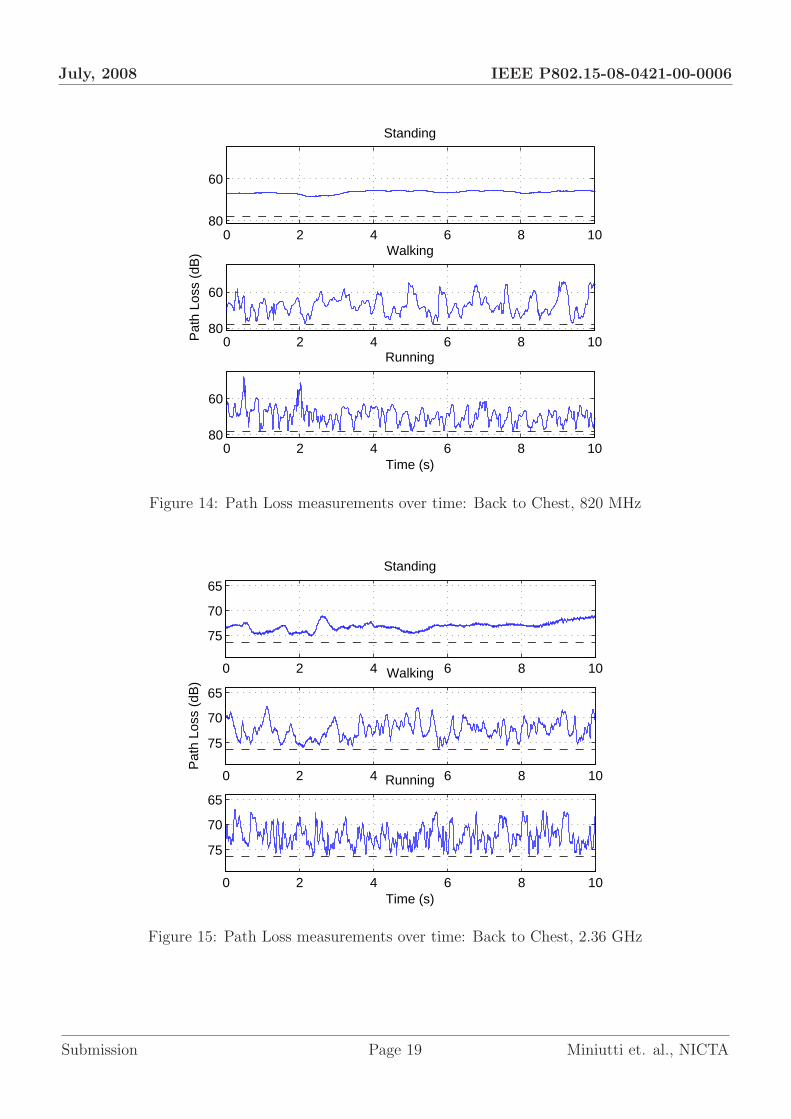
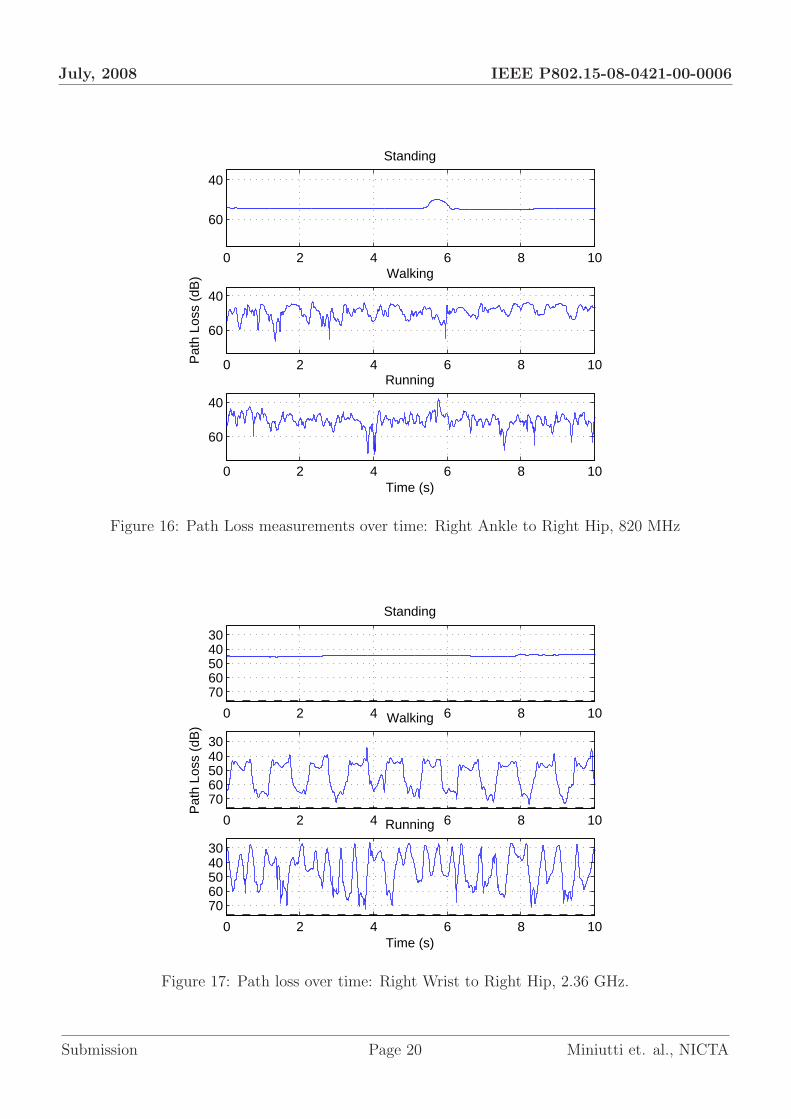
• The relationship between path loss variation and the level of movement holds even when thetransmit and receive antenna are stationary with respect to each other. See the back to chestmeasurements in Figures 14 and 15 for an example.
• Even when the test subject tries to stand still, there can still be large variations in thepath loss caused by small involuntary movements of the body. This is particularly evidentin Figure 15, where path loss varies throughout the entire measurement, and in Figure 16,which shows an involuntary movement at 5.5 s.
• This observed variation in path loss is particularly large when transmitter or receiver aremoved such that the line of sight path is obstructed. For example, the right wrist to righthip measurement in Figure 17.
• The path loss variation is repetitive and consistent with the speed of movement of the testsubject. This is particularly evident in situations where the line of sight path is obstructedby the movement, such as in Figure 17.
Submission Page 17 Miniutti et. al., NICTA

July, 2008 IEEE P802.15-08-0421-00-0006
Table 3: Average path loss (dB)
(a) 820 MHz
Action
Receiver at Right Hip; Receiver at chest;Transmitter at: Transmitter at:
Chest Right Left Right Left Back Back Right RightWrist Wrist Ankle Ankle Wrist Ankle
Standing 57.4 50.2 59.8 54.3 68.7 61.8 66.3 54.5 54.3Walking 52.9 38.4 63.6 48.1 55.5 57.1 63.8 51.3 56.9Running 44.1 37.2 60.2 48.9 54.2 62.3 66.3 49.4 54.1
(b) 2.36 GHz
Action
Receiver at Right Hip; Receiver at chest;Transmitter at: Transmitter at:
Chest Right Left Right Left Back Back Right RightWrist Wrist Ankle Ankle Wrist Ankle
Standing 65.3 44.5 74.7 60.9 70.7 75.3 73.0 70.5 66.3Walking 59.1 47.3 59.8 53.9 58.5 67.4 72.0 64.9 62.4Running 55.9 36.3 52.5 55.0 59.0 68.5 71.7 57.4 63.3
Table 4: Peak-to-trough path loss variation (dB)
(a) 820 MHz
Action
Receiver at Right Hip; Receiver at chest;Transmitter at: Transmitter at:
Chest Right Left Right Left Back Back Right RightWrist Wrist Ankle Ankle Wrist Ankle
Standing 1.6 0.7 2.2 5.1 1.8 5.1 3.0 2.2 0.7Walking 30.0 35.1 24.4 24.4 26.5 13.5 23.7 34.0 17.2Running 38.0 45.6 28.0 32.8 27.9 23.8 30.9 27.8 32.5
(b) 2.36 GHz
Action
Receiver at Right Hip; Receiver at chest;Transmitter at: Transmitter at:
Chest Right Left Right Left Back Back Right RightWrist Wrist Ankle Ankle Wrist Ankle
Standing 3.3 2.0 1.8 2.4 7.1 1.4 4.2 1.3 11.3Walking 20.0 39.6 24.5 22.5 21.1 14.1 8.6 21.2 20.4Running 30.3 46.8 33.7 28.4 24.1 16.3 9.3 29.4 19.5
Submission Page 18 Miniutti et. al., NICTA
July, 2008 IEEE P802.15-08-0421-00-0006
0 2 4 6 8 10
60
80
Standing
0 2 4 6 8 10
60
80
Walking
Pat
h Lo
ss (
dB)
0 2 4 6 8 10
60
80
Running
Time (s)
Figure 14: Path Loss measurements over time: Back to Chest, 820 MHz
0 2 4 6 8 10
65
70
75
Standing
0 2 4 6 8 10
65
70
75
Walking
Pat
h Lo
ss (
dB)
0 2 4 6 8 10
65
70
75
Running
Time (s)
Figure 15: Path Loss measurements over time: Back to Chest, 2.36 GHz
Submission Page 19 Miniutti et. al., NICTA
July, 2008 IEEE P802.15-08-0421-00-0006
0 2 4 6 8 10
40
60
Standing
0 2 4 6 8 10
40
60
Walking
Pat
h Lo
ss (
dB)
0 2 4 6 8 10
40
60
Running
Time (s)
Figure 16: Path Loss measurements over time: Right Ankle to Right Hip, 820 MHz
0 2 4 6 8 10
3040506070
Standing
0 2 4 6 8 10
3040506070
Walking
Pat
h Lo
ss (
dB)
0 2 4 6 8 10
3040506070
Running
Time (s)
Figure 17: Path loss over time: Right Wrist to Right Hip, 2.36 GHz.
Submission Page 20 Miniutti et. al., NICTA

July, 2008 IEEE P802.15-08-0421-00-0006
3.3 Statistical Description of Received Power
This section presents a statistical analysis of the received signal power around the subject’s body,used to describe path loss in the previous section 3.2. Three statistical distributions were fit toeach set of a data for any given scenario, the Gamma distribution, the Lognormal distribution andthe Normal distribution5.
The measured received power across one set of measurements for a given scenario was normalizedaccording to the maximum received power for that set of measures. Thus, due to normalization,distributions are fitted to data that can only take values between 0 and 1, and we effectively ignorethose parts of fitted distribution that takes on values outside this range.
The probability density functions of these distributions are defined as follows:
• Gamma probability density function (PDF)
y = f(x|a, b) =1
baΓ(a)xa−1e
xb (3)
where Γ(·) is the Gamma function.
• Normal PDF
y = f(x|µ, σ) =1
σ√
2πe−(x−µ)2
2σ2 (4)
• Lognormal PDF
y = f(x|µ, σ) =1
xσ√
2πe−(ln(x)−µ)2
2σ2 (5)
where ln(·) represents the natural logarithm.
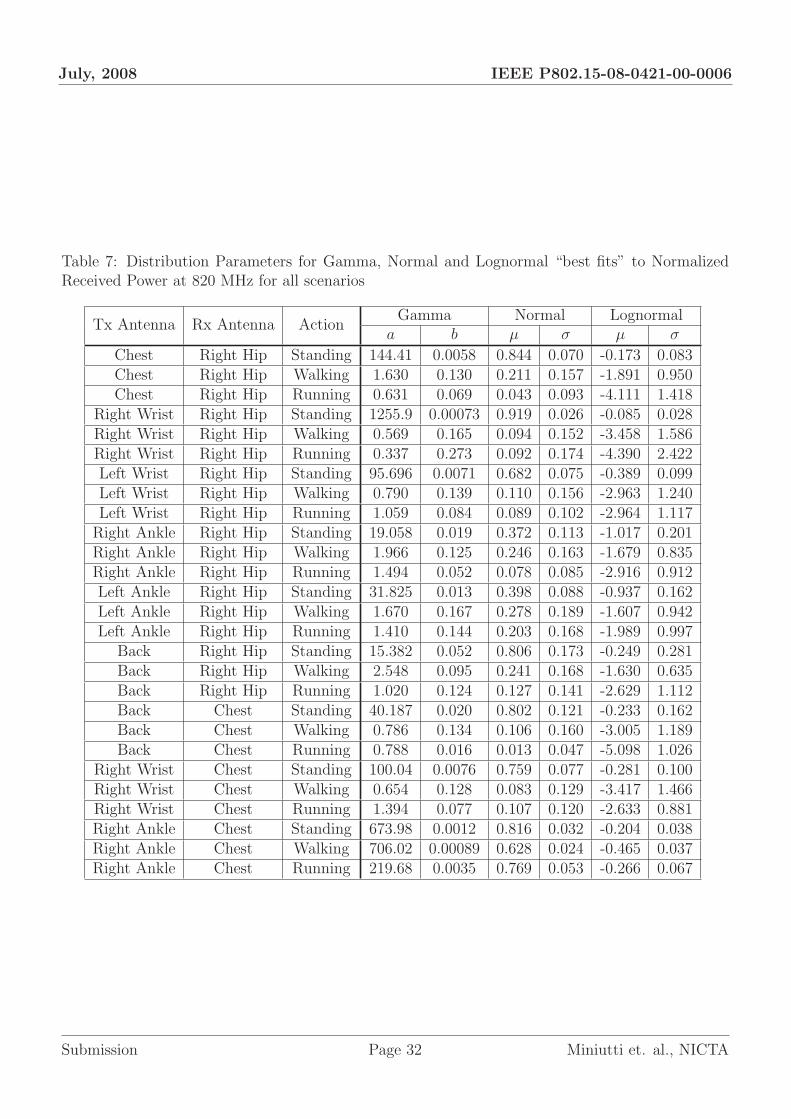
Thus, for each scenario we match a best fit from the three distributions and choose the best ofthese “best fits” as the distribution that best matches the measured data set for normalized receivepower. These best distributions, for each scenario at the two operating frequencies of 820 MHz and2.36 GHz, are listed in Table 5.
3.3.1 Observations
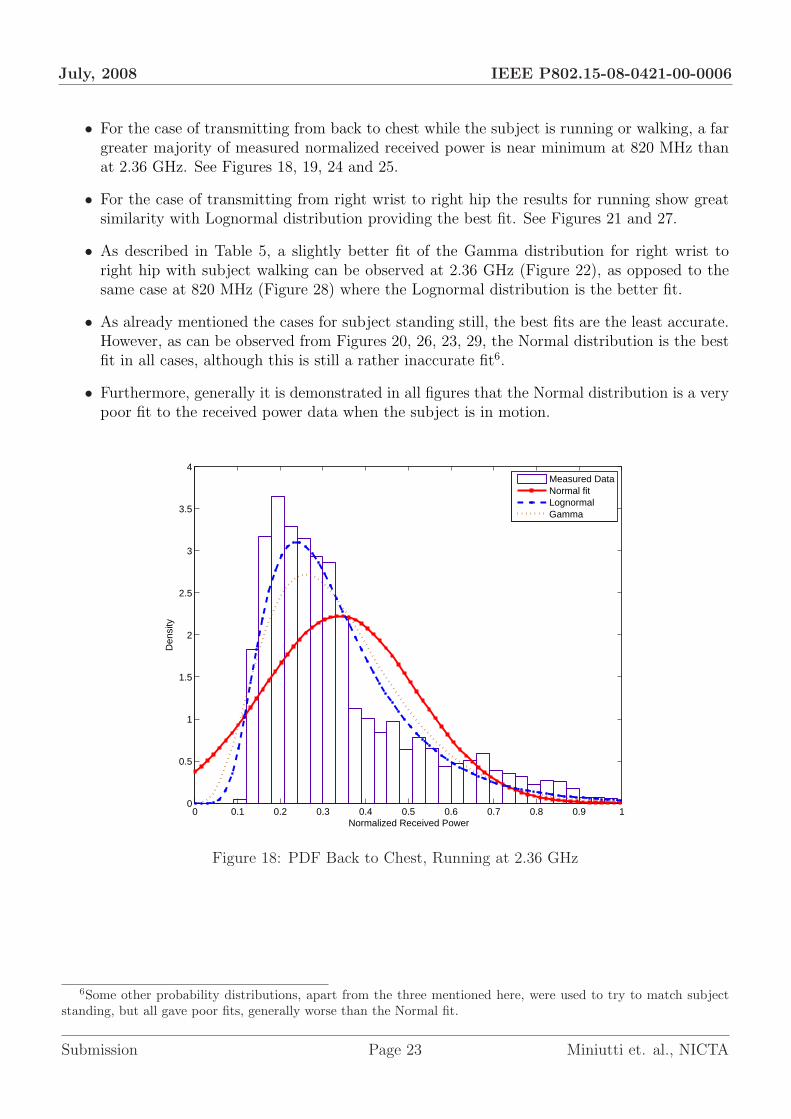
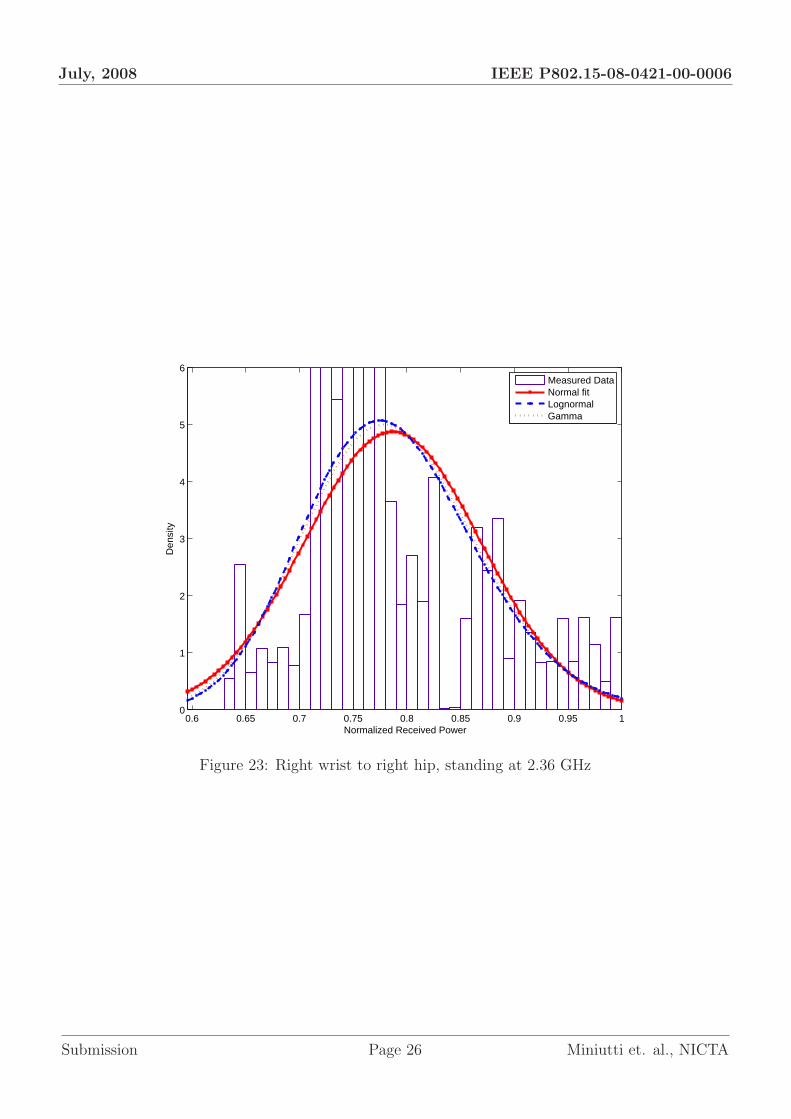
It is clear from Table 5 that there is no distribution that is consistently the best match for allscenarios. However, for cases when the subject is in motion, there is only one case, that of trans-mitting from chest to hip when the best matching distribution is Normal; the majority are eitherGamma or Lognormal. However when standing, the best matching distribution is most often theNormal distribution.
We note that for the distribution fits compiled in Table 5, the best fits are least accurate in thecases where the subject is standing still. This is illustrated in the following figures (once again figuresfor all scenarios are placed in the appendix). The first six PDFs relate to measurements at 2.36 GHz,the remaining six PDFs are for the same scenarios as the first six PDFs but for measurements at820 MHz. In each figure, the three PDFs for the “best-fits” of the three distributions are overlayedover the empirical PDF. The bin size for the histogram used to describe the PDF from the measureddata is chosen according to the “Freedman-Diaconis” rule (see appendix) [19].
Inspection of the following figures (and also those in the appendix) illustrate the choice of bestmatching distributions given in Table 5, they also show the following:
5These three distributions, amongst various others tested, are both common distributions, and consistently thebest fitting to the variety of those tested.
Submission Page 21 Miniutti et. al., NICTA

July, 2008 IEEE P802.15-08-0421-00-0006
Table 5: Scenarios and the distribution that gives the best of the “best fits” to those scenarios at820 MHz and 2.36 GHz
Tx Antenna Rx Antenna ActionDistribution
820 MHz 2.36 GHz
Chest Right Hip Standing Normal NormalChest Right Hip Walking Normal NormalChest Right Hip Running Gamma Lognormal
Right Wrist Right Hip Standing Normal NormalRight Wrist Right Hip Walking Lognormal GammaRight Wrist Right Hip Running Lognormal LognormalLeft Wrist Right Hip Standing Normal NormalLeft Wrist Right Hip Walking Lognormal LognormalLeft Wrist Right Hip Running Lognormal Gamma
Right Ankle Right Hip Standing Lognormal NormalRight Ankle Right Hip Walking Gamma GammaRight Ankle Right Hip Running Gamma GammaLeft Ankle Right Hip Standing Lognormal NormalLeft Ankle Right Hip Walking Gamma GammaLeft Ankle Right Hip Running Gamma Gamma
Back Right Hip Standing Normal NormalBack Right Hip Walking Lognormal LognormalBack Right Hip Running Lognormal LognormalBack Chest Standing Normal NormalBack Chest Walking Lognormal LognormalBack Chest Running Gamma Lognormal
Right Wrist Chest Standing Normal NormalRight Wrist Chest Walking Lognormal LognormalRight Wrist Chest Running Lognormal GammaRight Ankle Chest Standing Lognormal LognormalRight Ankle Chest Walking Lognormal LognormalRight ankle Chest Running Lognormal Lognormal
Submission Page 22 Miniutti et. al., NICTA
July, 2008 IEEE P802.15-08-0421-00-0006
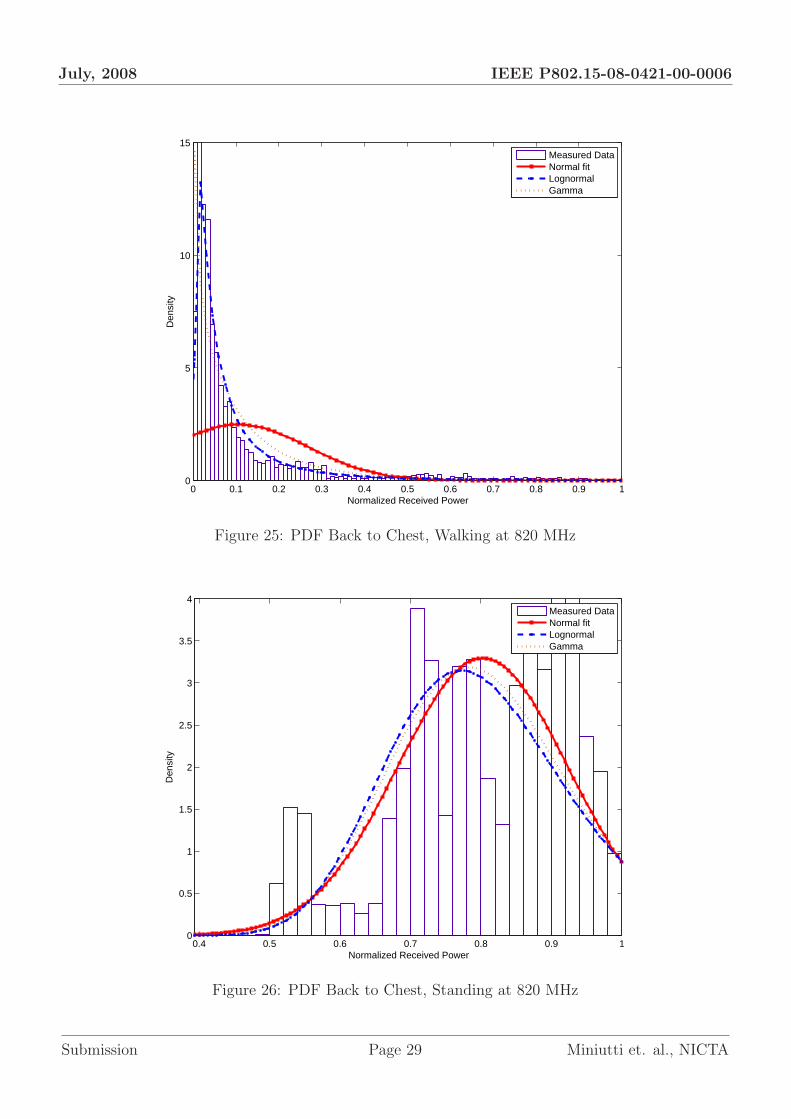
• For the case of transmitting from back to chest while the subject is running or walking, a fargreater majority of measured normalized received power is near minimum at 820 MHz thanat 2.36 GHz. See Figures 18, 19, 24 and 25.
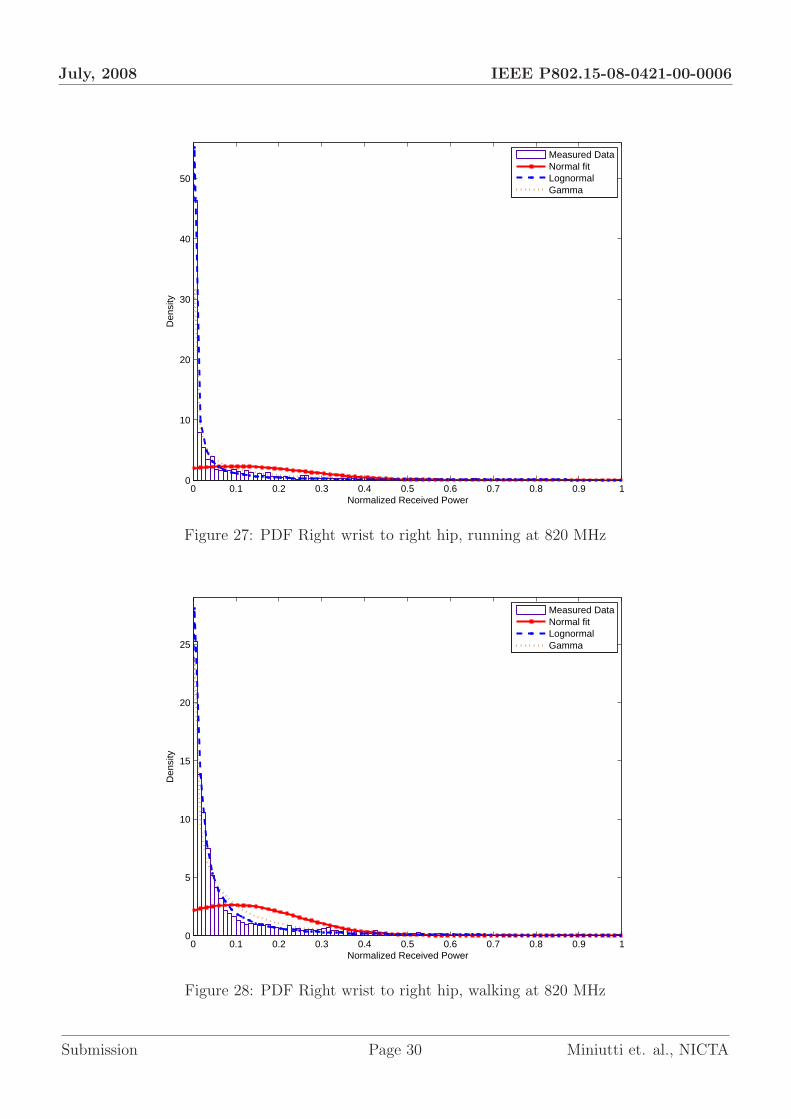
• For the case of transmitting from right wrist to right hip the results for running show greatsimilarity with Lognormal distribution providing the best fit. See Figures 21 and 27.
• As described in Table 5, a slightly better fit of the Gamma distribution for right wrist toright hip with subject walking can be observed at 2.36 GHz (Figure 22), as opposed to thesame case at 820 MHz (Figure 28) where the Lognormal distribution is the better fit.
• As already mentioned the cases for subject standing still, the best fits are the least accurate.However, as can be observed from Figures 20, 26, 23, 29, the Normal distribution is the bestfit in all cases, although this is still a rather inaccurate fit6.
• Furthermore, generally it is demonstrated in all figures that the Normal distribution is a verypoor fit to the received power data when the subject is in motion.
0 0.1 0.2 0.3 0.4 0.5 0.6 0.7 0.8 0.9 10
0.5
1
1.5
2
2.5
3
3.5
4
Normalized Received Power
Den
sity
Measured DataNormal fitLognormalGamma
Figure 18: PDF Back to Chest, Running at 2.36 GHz
6Some other probability distributions, apart from the three mentioned here, were used to try to match subjectstanding, but all gave poor fits, generally worse than the Normal fit.
Submission Page 23 Miniutti et. al., NICTA

July, 2008 IEEE P802.15-08-0421-00-0006
0.1 0.2 0.3 0.4 0.5 0.6 0.7 0.8 0.9 10
0.5
1
1.5
2
2.5
3
3.5
4
Normalized Received Power
Den
sity
Measured DataNormal fitLognormalGamma
Figure 19: PDF Back to Chest, Walking at 2.36 GHz
0.3 0.4 0.5 0.6 0.7 0.8 0.9 10
0.5
1
1.5
2
2.5
3
3.5
4
Normalized Received Power
Den
sity
Measured DataNormal fitLognormalGamma
Figure 20: PDF Back to Chest, Standing at 2.36 GHz
Submission Page 24 Miniutti et. al., NICTA

July, 2008 IEEE P802.15-08-0421-00-0006
0 0.1 0.2 0.3 0.4 0.5 0.6 0.7 0.8 0.9 10
10
20
30
40
50
Normalized Received Power
Den
sity
Measured DataNormal fitLognormalGamma
Figure 21: PDF Right wrist to right hip, running at 2.36 GHz
0 0.1 0.2 0.3 0.4 0.5 0.6 0.7 0.8 0.9 10
10
20
30
40
50
60
Normalized Received Power
Den
sity
Measured DataNormal fitLognormalGamma
Figure 22: PDF Right wrist to right hip, walking at 2.36 GHz
Submission Page 25 Miniutti et. al., NICTA
July, 2008 IEEE P802.15-08-0421-00-0006
0.6 0.65 0.7 0.75 0.8 0.85 0.9 0.95 10
1
2
3
4
5
6
Normalized Received Power
Den
sity
Measured DataNormal fitLognormalGamma
Figure 23: Right wrist to right hip, standing at 2.36 GHz
Submission Page 26 Miniutti et. al., NICTA

July, 2008 IEEE P802.15-08-0421-00-0006
0 0.1 0.2 0.3 0.4 0.5 0.6 0.7 0.8 0.9 10
10
20
30
40
50
60
70
80
90
100
Normalized Received Power
Den
sity
Measured DataNormal fitLognormalGamma
Figure 24: PDF Back to Chest, Running at 820 MHz
In Tables 6 and 7, we present best fit parameters for all scenarios with respect to the threechosen probability distributions, a and b for the Gamma distribution, and µ and σ for both theLognormal and the Normal distributions. The variation in parameters for a given distributionfor the same scenarios in comparison between Tables 6 and 7 is not consistent and is scenariodependent. Thus we can observe that there is no general rule (based on normalized receive power)about differences in best fitting distribution parameters between 820 MHz and 2.36 GHz.
Submission Page 27 Miniutti et. al., NICTA

July, 2008 IEEE P802.15-08-0421-00-0006
Table 6: Distribution Parameters for Gamma, Normal and Lognormal “best fits” to NormalizedReceived Power at 2.36 GHz for all scenarios
Tx Antenna Rx Antenna ActionGamma Normal Lognormal
a b µ σ µ σ
Chest Right Hip Standing 29.338 0.023 0.680 0.128 -0.403 0.184Chest Right Hip Walking 1.844 0.156 0.287 0.197 -1.544 0.850Chest Right Hip Running 0.837 0.053 0.044 0.095 -3.817 1.116
Right Wrist Right Hip Standing 96.517 0.0082 0.787 0.082 -0.245 0.101Right Wrist Right Hip Walking 0.430 0.112 0.048 0.078 -4.549 2.195Right Wrist Right Hip Running 0.308 0.309 0.095 0.178 -4.584 2.617Left Wrist Right Hip Standing 218.895 0.0038 0.834 0.055 -0.184 0.068Left Wrist Right Hip Walking 0.563 0.279 0.157 0.215 -2.962 1.597Left Wrist Right Hip Running 0.432 0.212 0.091 0.127 -3.898 2.148
Right Ankle Right Hip Standing 50.618 0.015 0.737 0.104 -0.316 0.141Right Ankle Right Hip Running 1.123 0.125 0.140 0.141 -2.473 1.111Right Ankle Right Hip Walking 2.154 0.136 0.294 0.191 -1.475 0.783Left Ankle Right Hip Standing 11.860 0.032 0.380 0.117 -1.011 0.287Left Ankle Right Hip Walking 1.678 0.167 0.281 0.212 -1.596 0.886Left Ankle Right Hip Running 1.326 0.152 0.202 0.178 -2.021 0.992
Back Right Hip Standing 257.26 0.0033 0.852 0.053 -0.163 0.063Back Right Hip Walking 2.258 0.100 0.226 0.164 -1.727 0.689Back Right Hip Running 1.751 0.085 0.149 0.131 -2.213 0.778Back Chest Standing 24.367 0.025 0.620 0.128 -0.498 0.202Back Chest Walking 5.933 0.063 0.372 0.162 -1.077 0.412Back Chest Running 4.274 0.079 0.338 0.179 -1.206 0.482
Right Wrist Chest Standing 272.434 0.0032 0.869 0.053 -0.143 0.061Right Wrist Chest Walking 0.832 0.131 0.109 0.147 -2.925 1.198Right Wrist Chest Running 0.519 0.177 0.092 0.146 -3.606 1.721Right Ankle Chest Standing 3.903 0.081 0.315 0.180 -1.289 0.503Right Ankle Chest Walking 1.245 0.155 0.193 0.181 -2.095 1.023Right Ankle Chest Running 1.706 0.090 0.153 0.135 -2.199 0.817
Submission Page 28 Miniutti et. al., NICTA
July, 2008 IEEE P802.15-08-0421-00-0006
0 0.1 0.2 0.3 0.4 0.5 0.6 0.7 0.8 0.9 10
5
10
15
Normalized Received Power
Den
sity
Measured DataNormal fitLognormalGamma
Figure 25: PDF Back to Chest, Walking at 820 MHz
0.4 0.5 0.6 0.7 0.8 0.9 10
0.5
1
1.5
2
2.5
3
3.5
4
Normalized Received Power
Den
sity
Measured DataNormal fitLognormalGamma
Figure 26: PDF Back to Chest, Standing at 820 MHz
Submission Page 29 Miniutti et. al., NICTA
July, 2008 IEEE P802.15-08-0421-00-0006
0 0.1 0.2 0.3 0.4 0.5 0.6 0.7 0.8 0.9 10
10
20
30
40
50
Normalized Received Power
Den
sity
Measured DataNormal fitLognormalGamma
Figure 27: PDF Right wrist to right hip, running at 820 MHz
0 0.1 0.2 0.3 0.4 0.5 0.6 0.7 0.8 0.9 10
5
10
15
20
25
Normalized Received Power
Den
sity
Measured DataNormal fitLognormalGamma
Figure 28: PDF Right wrist to right hip, walking at 820 MHz
Submission Page 30 Miniutti et. al., NICTA

July, 2008 IEEE P802.15-08-0421-00-0006
0.84 0.86 0.88 0.9 0.92 0.94 0.96 0.98 10
2
4
6
8
10
12
14
16
Normalized Received Power
Den
sity
Measured DataNormal fitLognormalGamma
Figure 29: Right wrist to right hip, standing at 820 MHz
Submission Page 31 Miniutti et. al., NICTA
July, 2008 IEEE P802.15-08-0421-00-0006
Table 7: Distribution Parameters for Gamma, Normal and Lognormal “best fits” to NormalizedReceived Power at 820 MHz for all scenarios
Tx Antenna Rx Antenna ActionGamma Normal Lognormal
a b µ σ µ σ
Chest Right Hip Standing 144.41 0.0058 0.844 0.070 -0.173 0.083Chest Right Hip Walking 1.630 0.130 0.211 0.157 -1.891 0.950Chest Right Hip Running 0.631 0.069 0.043 0.093 -4.111 1.418
Right Wrist Right Hip Standing 1255.9 0.00073 0.919 0.026 -0.085 0.028Right Wrist Right Hip Walking 0.569 0.165 0.094 0.152 -3.458 1.586Right Wrist Right Hip Running 0.337 0.273 0.092 0.174 -4.390 2.422Left Wrist Right Hip Standing 95.696 0.0071 0.682 0.075 -0.389 0.099Left Wrist Right Hip Walking 0.790 0.139 0.110 0.156 -2.963 1.240Left Wrist Right Hip Running 1.059 0.084 0.089 0.102 -2.964 1.117
Right Ankle Right Hip Standing 19.058 0.019 0.372 0.113 -1.017 0.201Right Ankle Right Hip Walking 1.966 0.125 0.246 0.163 -1.679 0.835Right Ankle Right Hip Running 1.494 0.052 0.078 0.085 -2.916 0.912Left Ankle Right Hip Standing 31.825 0.013 0.398 0.088 -0.937 0.162Left Ankle Right Hip Walking 1.670 0.167 0.278 0.189 -1.607 0.942Left Ankle Right Hip Running 1.410 0.144 0.203 0.168 -1.989 0.997
Back Right Hip Standing 15.382 0.052 0.806 0.173 -0.249 0.281Back Right Hip Walking 2.548 0.095 0.241 0.168 -1.630 0.635Back Right Hip Running 1.020 0.124 0.127 0.141 -2.629 1.112Back Chest Standing 40.187 0.020 0.802 0.121 -0.233 0.162Back Chest Walking 0.786 0.134 0.106 0.160 -3.005 1.189Back Chest Running 0.788 0.016 0.013 0.047 -5.098 1.026
Right Wrist Chest Standing 100.04 0.0076 0.759 0.077 -0.281 0.100Right Wrist Chest Walking 0.654 0.128 0.083 0.129 -3.417 1.466Right Wrist Chest Running 1.394 0.077 0.107 0.120 -2.633 0.881Right Ankle Chest Standing 673.98 0.0012 0.816 0.032 -0.204 0.038Right Ankle Chest Walking 706.02 0.00089 0.628 0.024 -0.465 0.037Right Ankle Chest Running 219.68 0.0035 0.769 0.053 -0.266 0.067
Submission Page 32 Miniutti et. al., NICTA
July, 2008 IEEE P802.15-08-0421-00-0006
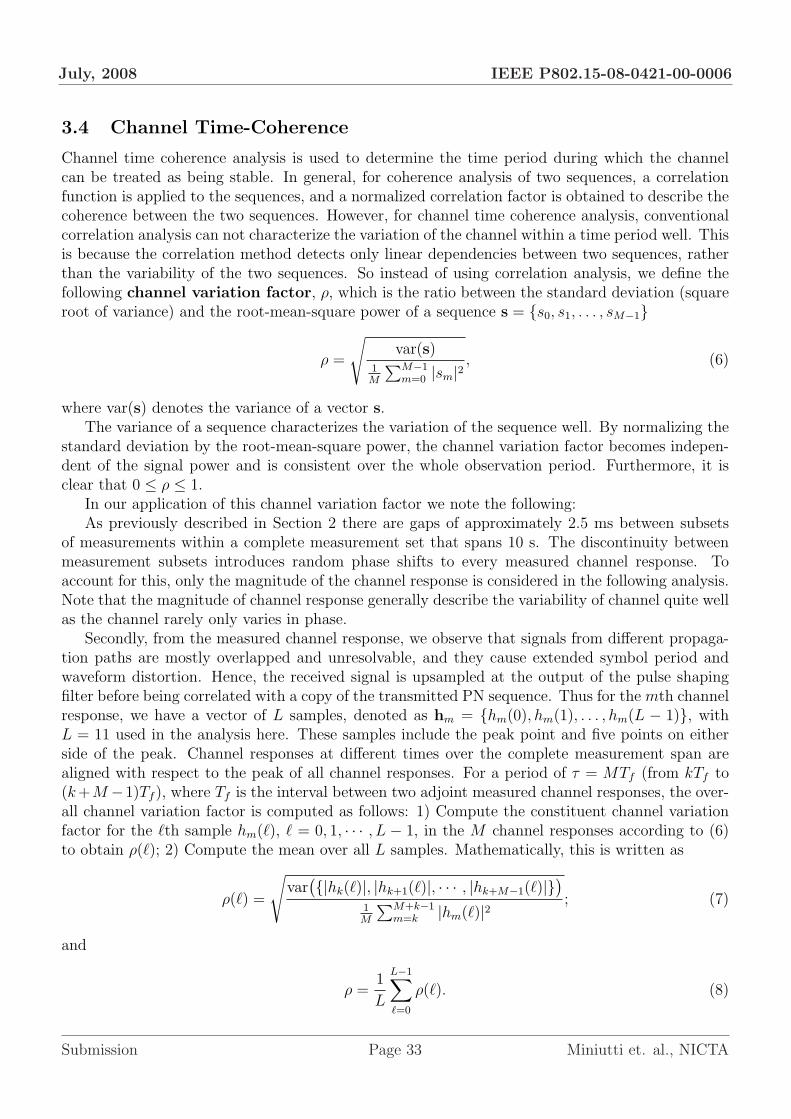
3.4 Channel Time-Coherence
Channel time coherence analysis is used to determine the time period during which the channelcan be treated as being stable. In general, for coherence analysis of two sequences, a correlationfunction is applied to the sequences, and a normalized correlation factor is obtained to describe thecoherence between the two sequences. However, for channel time coherence analysis, conventionalcorrelation analysis can not characterize the variation of the channel within a time period well. Thisis because the correlation method detects only linear dependencies between two sequences, ratherthan the variability of the two sequences. So instead of using correlation analysis, we define thefollowing channel variation factor, ρ, which is the ratio between the standard deviation (squareroot of variance) and the root-mean-square power of a sequence s = s0, s1, . . . , sM−1
ρ =
√var(s)
1M
∑M−1m=0 |sm|2
, (6)
where var(s) denotes the variance of a vector s.The variance of a sequence characterizes the variation of the sequence well. By normalizing the
standard deviation by the root-mean-square power, the channel variation factor becomes indepen-dent of the signal power and is consistent over the whole observation period. Furthermore, it isclear that 0 ≤ ρ ≤ 1.
In our application of this channel variation factor we note the following:As previously described in Section 2 there are gaps of approximately 2.5 ms between subsets
of measurements within a complete measurement set that spans 10 s. The discontinuity betweenmeasurement subsets introduces random phase shifts to every measured channel response. Toaccount for this, only the magnitude of the channel response is considered in the following analysis.Note that the magnitude of channel response generally describe the variability of channel quite wellas the channel rarely only varies in phase.
Secondly, from the measured channel response, we observe that signals from different propaga-tion paths are mostly overlapped and unresolvable, and they cause extended symbol period andwaveform distortion. Hence, the received signal is upsampled at the output of the pulse shapingfilter before being correlated with a copy of the transmitted PN sequence. Thus for the mth channelresponse, we have a vector of L samples, denoted as hm = hm(0), hm(1), . . . , hm(L − 1), withL = 11 used in the analysis here. These samples include the peak point and five points on eitherside of the peak. Channel responses at different times over the complete measurement span arealigned with respect to the peak of all channel responses. For a period of τ = MTf (from kTf to(k+M −1)Tf ), where Tf is the interval between two adjoint measured channel responses, the over-all channel variation factor is computed as follows: 1) Compute the constituent channel variationfactor for the `th sample hm(`), ` = 0, 1, · · · , L − 1, in the M channel responses according to (6)to obtain ρ(`); 2) Compute the mean over all L samples. Mathematically, this is written as
ρ(`) =
√var
(|hk(`)|, |hk+1(`)|, · · · , |hk+M−1(`)|)
1M
∑M+k−1m=k |hm(`)|2 ; (7)
and
ρ =1
L
L−1∑
`=0
ρ(`). (8)
Submission Page 33 Miniutti et. al., NICTA
July, 2008 IEEE P802.15-08-0421-00-0006
1
2
3
4
−6
−4
−2
0
2
Capture Number
hk(l)
hk+1
(l)
hk+2
(l+1) hk+3
(l+1)h
k(l+1)
hk+1
(l+1)
hk+2
(l) hk+3
(l)
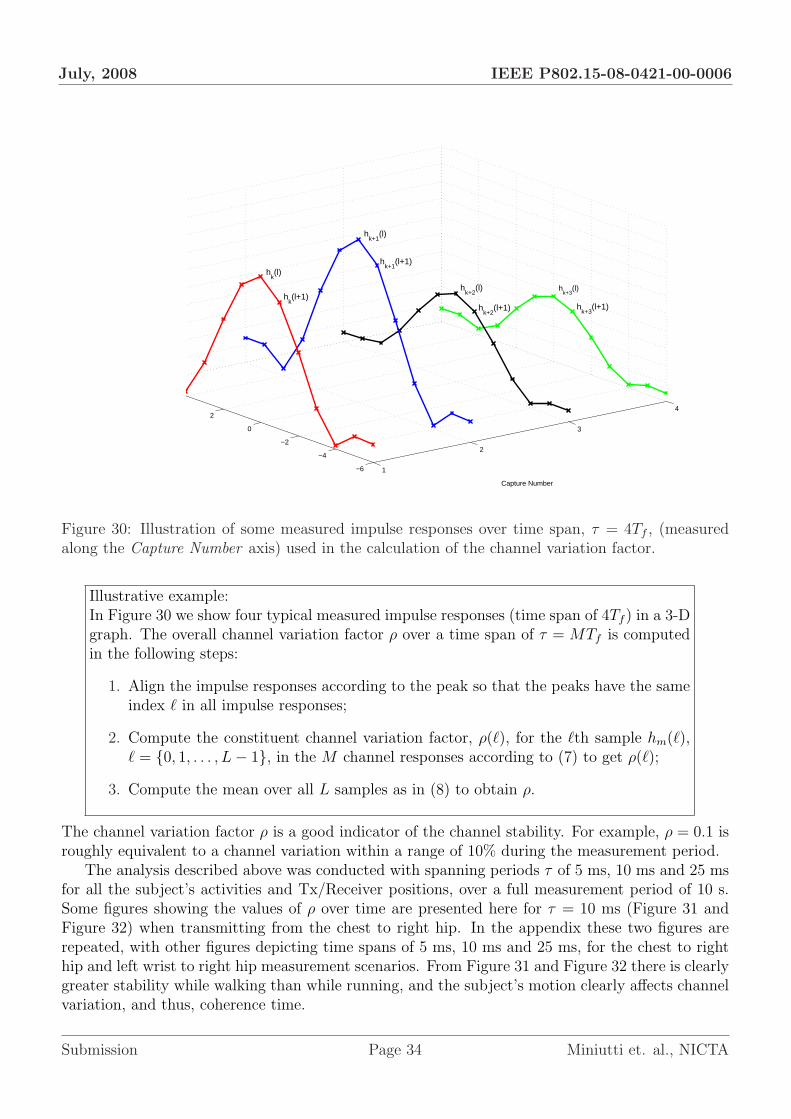
Figure 30: Illustration of some measured impulse responses over time span, τ = 4Tf , (measuredalong the Capture Number axis) used in the calculation of the channel variation factor.
Illustrative example:In Figure 30 we show four typical measured impulse responses (time span of 4Tf ) in a 3-Dgraph. The overall channel variation factor ρ over a time span of τ = MTf is computedin the following steps:
1. Align the impulse responses according to the peak so that the peaks have the sameindex ` in all impulse responses;
2. Compute the constituent channel variation factor, ρ(`), for the `th sample hm(`),` = 0, 1, . . . , L− 1, in the M channel responses according to (7) to get ρ(`);
3. Compute the mean over all L samples as in (8) to obtain ρ.
The channel variation factor ρ is a good indicator of the channel stability. For example, ρ = 0.1 isroughly equivalent to a channel variation within a range of 10% during the measurement period.
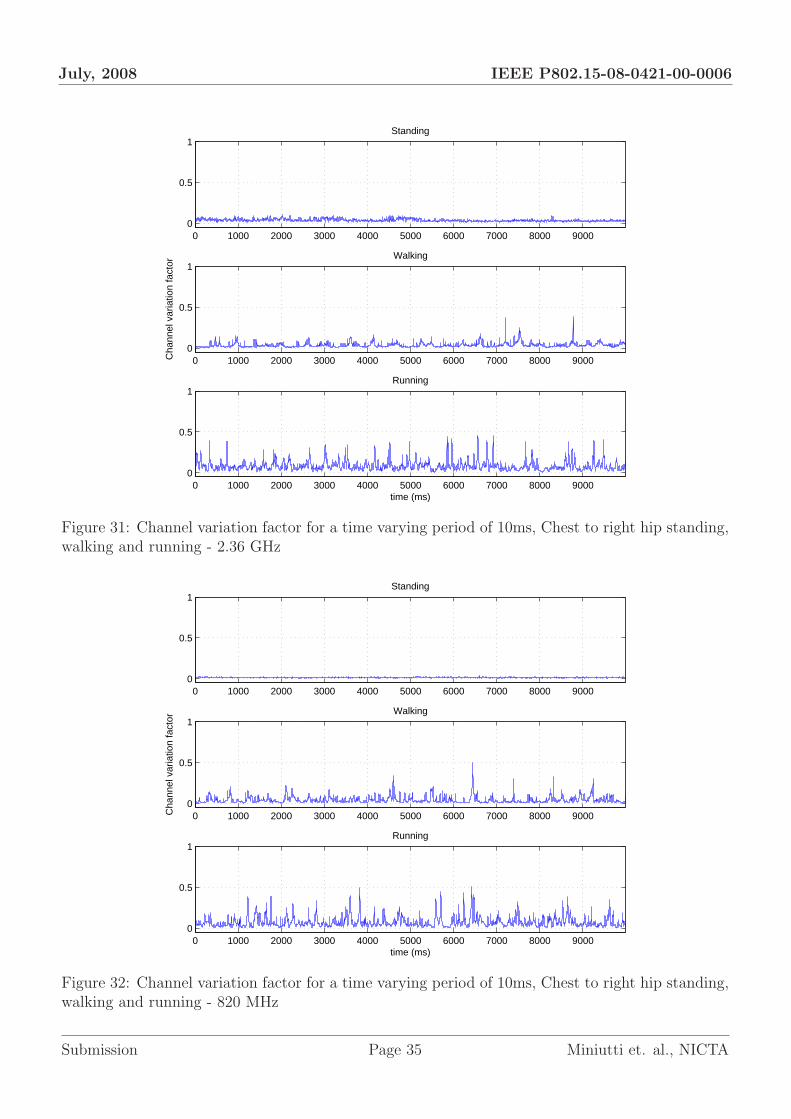
The analysis described above was conducted with spanning periods τ of 5 ms, 10 ms and 25 msfor all the subject’s activities and Tx/Receiver positions, over a full measurement period of 10 s.Some figures showing the values of ρ over time are presented here for τ = 10 ms (Figure 31 andFigure 32) when transmitting from the chest to right hip. In the appendix these two figures arerepeated, with other figures depicting time spans of 5 ms, 10 ms and 25 ms, for the chest to righthip and left wrist to right hip measurement scenarios. From Figure 31 and Figure 32 there is clearlygreater stability while walking than while running, and the subject’s motion clearly affects channelvariation, and thus, coherence time.
Submission Page 34 Miniutti et. al., NICTA
July, 2008 IEEE P802.15-08-0421-00-0006
0 1000 2000 3000 4000 5000 6000 7000 8000 90000
0.5
1Standing
0 1000 2000 3000 4000 5000 6000 7000 8000 90000
0.5
1
Cha
nnel
var
iatio
n fa
ctor
Walking
0 1000 2000 3000 4000 5000 6000 7000 8000 90000
0.5
1
time (ms)
Running
Figure 31: Channel variation factor for a time varying period of 10ms, Chest to right hip standing,walking and running - 2.36 GHz
0 1000 2000 3000 4000 5000 6000 7000 8000 90000
0.5
1Standing
0 1000 2000 3000 4000 5000 6000 7000 8000 90000
0.5
1
Cha
nnel
var
iatio
n fa
ctor
Walking
0 1000 2000 3000 4000 5000 6000 7000 8000 90000
0.5
1
time (ms)
Running
Figure 32: Channel variation factor for a time varying period of 10ms, Chest to right hip standing,walking and running - 820 MHz
Submission Page 35 Miniutti et. al., NICTA

July, 2008 IEEE P802.15-08-0421-00-0006
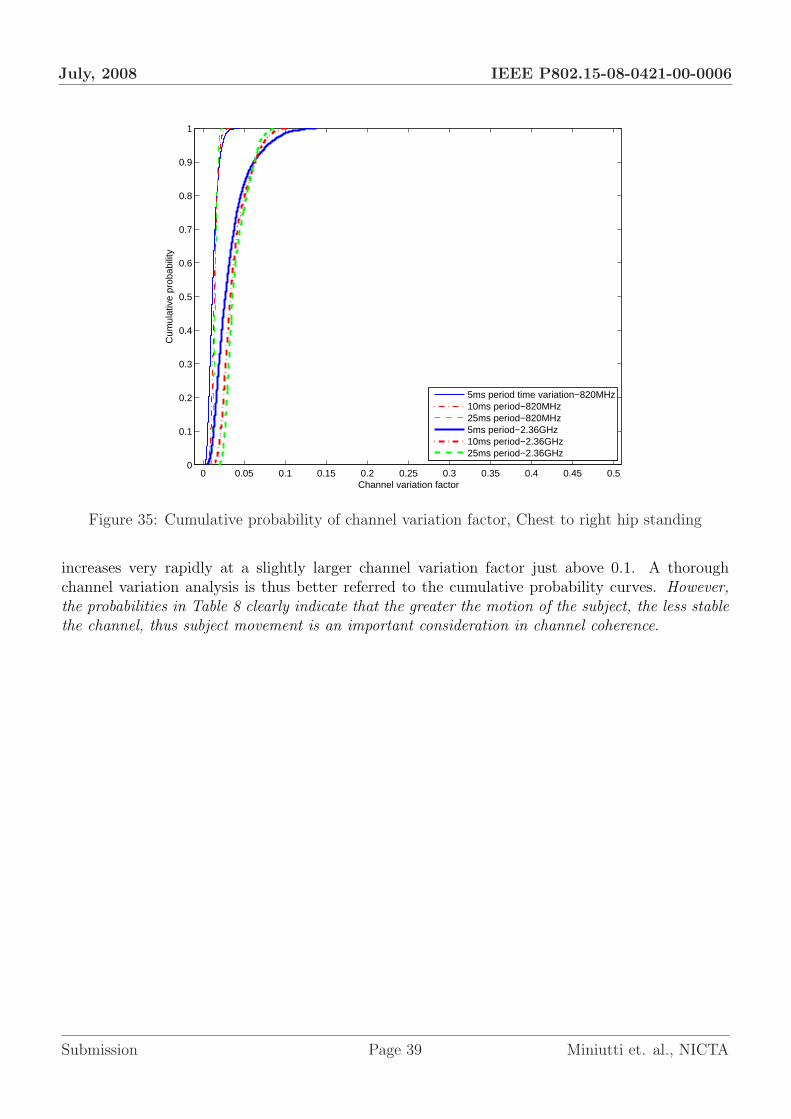
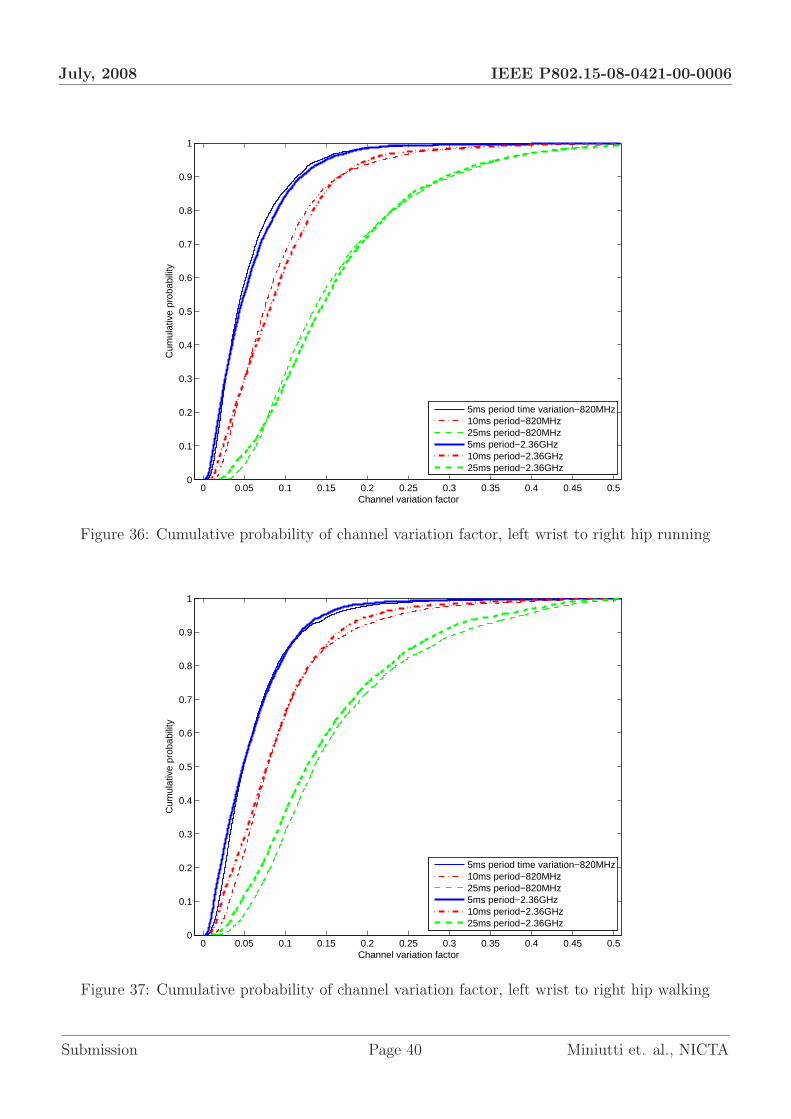
To better characterize the channel stability, statistical analysis over the channel variation factorswas performed on all measurements. We computed empirical cumulative distribution functions(CDFs) from the measured data for the factors for all scenarios, some of the results are shownin the following figures, Figures 33, 34, 35, 36, 37, 38. In these figures we depict scenarios fortransmitting from chest to right hip and transmitting from left wrist to right hip. Note in thissection we combine in one figure CDF results for 820 MHz and 2.36 GHz. Figures for all scenariosare shown in the appendix.
0 0.05 0.1 0.15 0.2 0.25 0.3 0.35 0.4 0.45 0.50
0.1
0.2
0.3
0.4
0.5
0.6
0.7
0.8
0.9
1
Channel variation factor
Cum
ulat
ive
prob
abili
ty
5ms period time variation−820MHz10ms period−820MHz25ms period−820MHz5ms period−2.36GHz10ms period−2.36GHz25ms period−2.36GHz
Figure 33: Cumulative probability of channel variation factor, Chest to right hip running
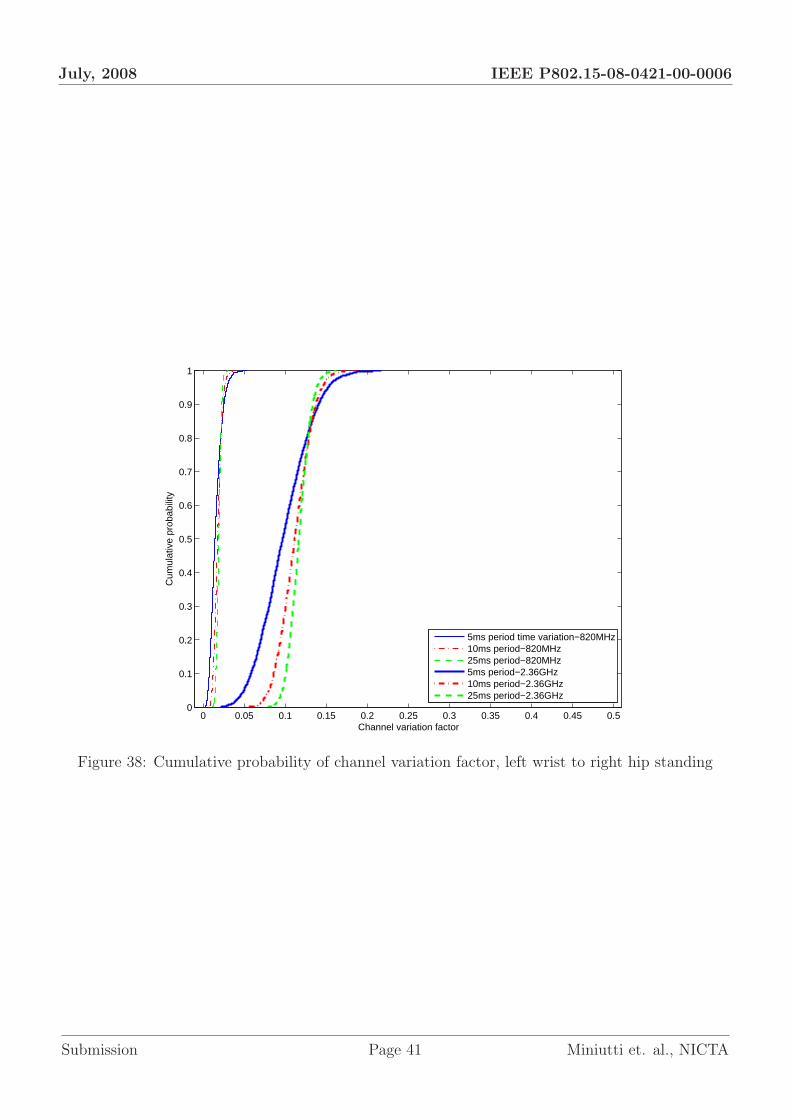
Note in these figures the sharper rise in cumulative probability for channel variation factorscloser to zero is evident while the subject is standing, Figures 35 and 38. The slowest increase incumulative probability with an increase in correlation factor is observed for the case of running,Figures 33 and 36. Figures showing cumulative probability curves for 820 MHz to the right ofthose for 2.36 GHz (i.e. suggesting less stability) as shown from the two subject walking scenariosin Figures 34 and 37 are less common, i.e. it is more often common across all scenarios for the2.36 GHz curves to be to the right of those for 820 MHz, suggesting less stability as shown forrespective scenarios in Figures 33 and 38 which are running and standing cases. Thus from allfigures depicting CDFs, represented here and in the appendix, we make the following importantobservations:
• In all figures depicting CDFs it is indicated that the slower the rise in cumulative probability iswith respect to increase in channel variation for the larger the time-varying period, indicatingless stability, over τ = 25 ms than τ = 10 ms, and less stability over τ = 10 ms than τ = 5 ms.This is the expected result.
• We note that the variation in stability for different τ is greater with increasing movement ofthe subject.
Submission Page 36 Miniutti et. al., NICTA

July, 2008 IEEE P802.15-08-0421-00-0006
0 0.05 0.1 0.15 0.2 0.25 0.3 0.35 0.4 0.45 0.50
0.1
0.2
0.3
0.4
0.5
0.6
0.7
0.8
0.9
1
Channel variation factor
Cum
ulat
ive
prob
abili
ty
5ms period time variation−820MHz10ms period−820MHz25ms period−820MHz5ms period−2.36GHz10ms period−2.36GHz25ms period−2.36GHz
Figure 34: Cumulative probability of channel variation factor, Chest to right hip walking
• Channels are generally stable within a 5− 10 ms period, often with a probability larger than90% with ρ < 0.15;
• The channel is very stable for most scenarios when the test subject is standing at both820 MHz and 2.36 GHz.
• There is greater variability in channel coherence for running than for walking, as is expected.Thus time-varying results are consistent with the physical movement of subject.
• There is greater coherence stability (with larger probability for a small variation factor) at820 MHz than 2.36 GHz. This is a general trend illustrated for the majority of scenarios by acomparison of curves within the same figures depicting cumulative probability (see appendix)for the same scenario at 820 MHz and 2.36 GHz.
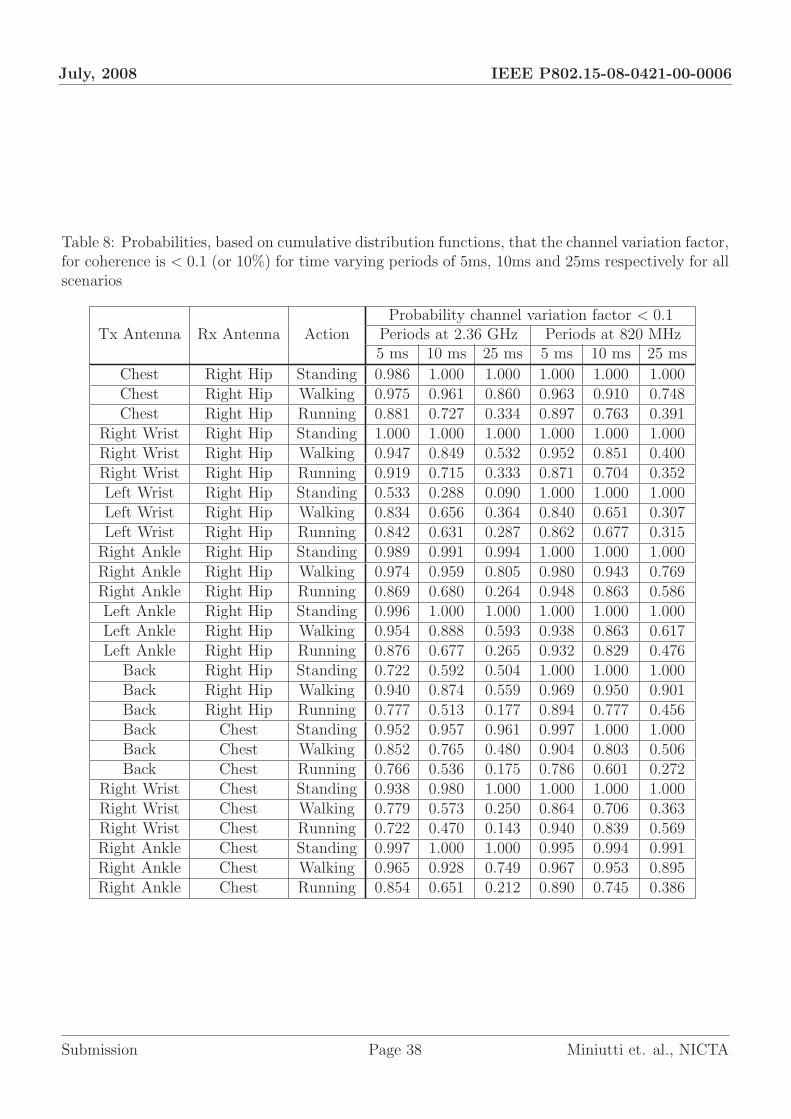
Based on these empirical CDFs as a way of describing the stability of the channel, we computethe probability, for a given scenario and time period, that the variation factor is less than 0.1, or10%. These probabilities for all scenarios are given in Table 8.
From Table 8 it is clear that in most cases, as the time span of interest increases, the channelis less likely to remain stable within that time span (shown by a decrease in probability in mostcases). It also demonstrates increased channel variation, i.e. decreased coherence, with an increasein movement of the subject (with probabilities decreasing). We also note that the generally greaterprobabilities at 820 MHz than 2.36 GHz, for the same measurement positions, demonstrate a greaterstability at the lower frequency, which can be attributed to the longer wavelength. Finally, we notethat some small probabilities, for example, the one for left wrist to right hip, should not lead tothe conclusion of low stability of the channel by itself. It is because the cumulative probability
Submission Page 37 Miniutti et. al., NICTA
July, 2008 IEEE P802.15-08-0421-00-0006
Table 8: Probabilities, based on cumulative distribution functions, that the channel variation factor,for coherence is < 0.1 (or 10%) for time varying periods of 5ms, 10ms and 25ms respectively for allscenarios
Tx Antenna Rx Antenna ActionProbability channel variation factor < 0.1
Periods at 2.36 GHz Periods at 820 MHz5 ms 10 ms 25 ms 5 ms 10 ms 25 ms
Chest Right Hip Standing 0.986 1.000 1.000 1.000 1.000 1.000Chest Right Hip Walking 0.975 0.961 0.860 0.963 0.910 0.748Chest Right Hip Running 0.881 0.727 0.334 0.897 0.763 0.391
Right Wrist Right Hip Standing 1.000 1.000 1.000 1.000 1.000 1.000Right Wrist Right Hip Walking 0.947 0.849 0.532 0.952 0.851 0.400Right Wrist Right Hip Running 0.919 0.715 0.333 0.871 0.704 0.352Left Wrist Right Hip Standing 0.533 0.288 0.090 1.000 1.000 1.000Left Wrist Right Hip Walking 0.834 0.656 0.364 0.840 0.651 0.307Left Wrist Right Hip Running 0.842 0.631 0.287 0.862 0.677 0.315
Right Ankle Right Hip Standing 0.989 0.991 0.994 1.000 1.000 1.000Right Ankle Right Hip Walking 0.974 0.959 0.805 0.980 0.943 0.769Right Ankle Right Hip Running 0.869 0.680 0.264 0.948 0.863 0.586Left Ankle Right Hip Standing 0.996 1.000 1.000 1.000 1.000 1.000Left Ankle Right Hip Walking 0.954 0.888 0.593 0.938 0.863 0.617Left Ankle Right Hip Running 0.876 0.677 0.265 0.932 0.829 0.476
Back Right Hip Standing 0.722 0.592 0.504 1.000 1.000 1.000Back Right Hip Walking 0.940 0.874 0.559 0.969 0.950 0.901Back Right Hip Running 0.777 0.513 0.177 0.894 0.777 0.456Back Chest Standing 0.952 0.957 0.961 0.997 1.000 1.000Back Chest Walking 0.852 0.765 0.480 0.904 0.803 0.506Back Chest Running 0.766 0.536 0.175 0.786 0.601 0.272
Right Wrist Chest Standing 0.938 0.980 1.000 1.000 1.000 1.000Right Wrist Chest Walking 0.779 0.573 0.250 0.864 0.706 0.363Right Wrist Chest Running 0.722 0.470 0.143 0.940 0.839 0.569Right Ankle Chest Standing 0.997 1.000 1.000 0.995 0.994 0.991Right Ankle Chest Walking 0.965 0.928 0.749 0.967 0.953 0.895Right Ankle Chest Running 0.854 0.651 0.212 0.890 0.745 0.386
Submission Page 38 Miniutti et. al., NICTA
July, 2008 IEEE P802.15-08-0421-00-0006
0 0.05 0.1 0.15 0.2 0.25 0.3 0.35 0.4 0.45 0.50
0.1
0.2
0.3
0.4
0.5
0.6
0.7
0.8
0.9
1
Channel variation factor
Cum
ulat
ive
prob
abili
ty
5ms period time variation−820MHz10ms period−820MHz25ms period−820MHz5ms period−2.36GHz10ms period−2.36GHz25ms period−2.36GHz
Figure 35: Cumulative probability of channel variation factor, Chest to right hip standing
increases very rapidly at a slightly larger channel variation factor just above 0.1. A thoroughchannel variation analysis is thus better referred to the cumulative probability curves. However,the probabilities in Table 8 clearly indicate that the greater the motion of the subject, the less stablethe channel, thus subject movement is an important consideration in channel coherence.
Submission Page 39 Miniutti et. al., NICTA
July, 2008 IEEE P802.15-08-0421-00-0006
0 0.05 0.1 0.15 0.2 0.25 0.3 0.35 0.4 0.45 0.50
0.1
0.2
0.3
0.4
0.5
0.6
0.7
0.8
0.9
1
Channel variation factor
Cum
ulat
ive
prob
abili
ty
5ms period time variation−820MHz10ms period−820MHz25ms period−820MHz5ms period−2.36GHz10ms period−2.36GHz25ms period−2.36GHz
Figure 36: Cumulative probability of channel variation factor, left wrist to right hip running
0 0.05 0.1 0.15 0.2 0.25 0.3 0.35 0.4 0.45 0.50
0.1
0.2
0.3
0.4
0.5
0.6
0.7
0.8
0.9
1
Channel variation factor
Cum
ulat
ive
prob
abili
ty
5ms period time variation−820MHz10ms period−820MHz25ms period−820MHz5ms period−2.36GHz10ms period−2.36GHz25ms period−2.36GHz
Figure 37: Cumulative probability of channel variation factor, left wrist to right hip walking
Submission Page 40 Miniutti et. al., NICTA
July, 2008 IEEE P802.15-08-0421-00-0006
0 0.05 0.1 0.15 0.2 0.25 0.3 0.35 0.4 0.45 0.50
0.1
0.2
0.3
0.4
0.5
0.6
0.7
0.8
0.9
1
Channel variation factor
Cum
ulat
ive
prob
abili
ty
5ms period time variation−820MHz10ms period−820MHz25ms period−820MHz5ms period−2.36GHz10ms period−2.36GHz25ms period−2.36GHz
Figure 38: Cumulative probability of channel variation factor, left wrist to right hip standing
Submission Page 41 Miniutti et. al., NICTA
July, 2008 IEEE P802.15-08-0421-00-0006
4 Concluding Remarks
Of the fading scenarios likely for an on-body wireless network in an indoor environment, we haveshown that movement of the human body is the dominant fading effect. Even in the largestidentified case of frequency-selective fading, the fading due to movement of a subject that wasostensibly standing still was still the dominant effect. Moreover, the fading effects due to movementwere consistent with the level of movement from the test subject; with more movement generatinga larger variation in the fading. In summary, the predominant fading effect in the body area channelmeasurements made is slow and flat fading, although in some cases frequency-selective effects wereobserved.
It is clear that path loss around the human body is far greater than it would be with a similarantenna separation in free space, even when a direct line of sight path exists. There is greater pathloss at 2.36 GHz than at 820 MHz, but the difference is not as significant as might be expected.The more significant variation in path loss at these two frequencies is when there is no line-of-sightpath during the measurement period.
Typically either the Lognormal or the Gamma distributions are the best match to data sets ofnormalized received power for body area communications while the subject is in motion, for anytransmitter and receiver location. However, when the subject is stationary, there is no probabilitydistribution that fits the data set well, but in most cases the Normal distribution is the best fit(even if not a good fit).
Generally, from time varying coherence analysis, it can be observed that the channel is generallyquite stable, and more so at 820 MHz than 2.36 GHz. However, as previously mentioned, the motionof the subject has considerable impact on the stability of the channel, particularly as the periodof interest increases. The generally greater stability at lower frequency has been attributed tothe longer wavelength. From coherence analysis it could be concluded that carrier frequency andsubject movement need to be carefully considered in body area wireless system design.
Submission Page 42 Miniutti et. al., NICTA
July, 2008 IEEE P802.15-08-0421-00-0006
References
[1] K. Yazdandoost and K. Sayrafian, “Channel Model for Body Area Network (BAN),” 15-08-0033-02-0006-draft-of-channel-model-for-body-area-network.
[2] T. Zasowski, G. Meyer, F. Althaus, and A. Wittneben, “Propagation effects in uwb bodyarea networks,” in Ultra-Wideband, 2005. ICU 2005. 2005 IEEE International Conference on,September 2005, pp. 16–21.
[3] H.-R. Chuang and W.-T. Chen, “Computer simulation of the human-body effects on a circular-loop-wire antenna for radio-pager communications at 152, 280, and 400 mhz,” Vehicular Tech-nology, IEEE Transactions on, vol. 46, no. 3, pp. 544–559, Aug 1997.
[4] S. Obayashi and J. Zander, “A body-shadowing model for indoor radio communication en-vironments,” Antennas and Propagation, IEEE Transactions on, vol. 46, no. 6, pp. 920–927,Jun 1998.
[5] W.-T. Chen and H.-R. Chuang, “Numerical computation of human interaction with arbitrarilyoriented superquadric loop antennas in personal communications,” Antennas and Propagation,IEEE Transactions on, vol. 46, no. 6, pp. 821–828, June 1998.
[6] P.-S. Hall and Y. Hao, Antennas and Propagation for Body Centric Wireless Networks. ArtechHouse, 2006.
[7] Y. Rahmat-Samii, K. W. Kim, M. Jensen, K. Fujimoto, and O. Edvardsson, “Antennas andhumans in personal communications,” in Mobile Antenna Systems Handbook, K. Fujimoto andJ. James, Eds. Artech House, 2001, ch. 7.
[8] P. Hall, Y. Hao, Y. Nechayev, A. Alomalny, C. Constantinou, C. Parini, M. Kamarudin,T. Salim, D. Hee, R. Dubrovka, A. Owadally, W. Song, A. Serra, P. Nepa, M. Gallo, andM. Bozzetti, “Antennas and propagation for on-body communication systems,” Antennas andPropagation Magazine, IEEE, vol. 49, no. 3, pp. 41–58, June 2007.
[9] G. Roqueta, A. Fort, C. Craeye, and C. Oestges, “Analytical propagation models for bodyarea networks,” in Antennas and Propagation for Body-Centric Wireless Communications,2007 IET Seminar on, April 2007, pp. 90–96.
[10] D. Neirynck., C. Williams, A. Nix, and M. Beach, “Wideband channel characterisation for bodyand personal area networks,” in 2nd International Workshop on Wearable and ImplantableBody Sensor Networks, April 2004.
[11] K. Yazdandoost, H. Sawada, S.-T. Choi, J. Takada, and R. Kohno, “Channel Char-acterization for BAN Communications,” 15-07-0641-00-0ban-channel-characterization-ban-communications.
[12] D. Neirynck, “Channel measurements and PHY development for wearable devices,” 15-07-0547-00-0ban-channel-measurements-and-phy-development-wearable-devices.
[13] G. Dolmans, “Applications, Channels, and Radio Architectures,” 15-08-0163-00-0006-applications-channels-architectures.
Submission Page 43 Miniutti et. al., NICTA

July, 2008 IEEE P802.15-08-0421-00-0006
[14] D. Miniutti, L. Hanlen, D. Smith, A. Zhang, D. Lewis, D. Rodda, and B. Gilbert, “Dynamicnarrowband channel measurements around 2.4 GHz for body area networks,” 15-08-0354-01-0006-dynamic-narrowband-channel-measurements-around-2-4-ghz-for-body-area-networks.
[15] B. Zhen, M. Patel, S. Lee, and E. Won, “Body Area Network (BAN) Technical Requirements,”15-08-0037-01-0006-ieee-802-15-6-technical-requirements-document-v-4-0.
[16] W. Scanlon, G. Conway, and S. Cotton, “Antennas, propagation considerations for robustwireless communications in medical body area networks,” in Antennas and Propagation forBody-Centric Wireless Communications, 2007 IET Seminar on, April 2007, p. 37.
[17] 800 MHz Voice Communications Wearable Antenna, Octane Wireless, Glen Burnie, USA.
[18] WLAN Wearable Antenna; PRR Wearable Antenna, Octane Wireless, Glen Burnie, USA.
[19] D. Freedman and P. Diaconis, “On the histogram as a density estimator:L2 theory,” ProbabilityTheory and Related Fields, vol. 57, no. 4, pp. 453–476, December 1981.
Submission Page 44 Miniutti et. al., NICTA
July, 2008 IEEE P802.15-08-0421-00-0006
A Appendix
This appendix catalogs the entire set of results obtained from the measurements that were per-formed. It is located at the end of the document to accommodate those who wish to print thissection separately, or not at all.
The following sections have a one-to-one correspondence to their respective counterparts inSection 3. See Section 3 for an explanation of the figures presented here.
A.1 Channel Power Spectral Density
A.1.1 820 MHz Measurements
−5
0
5
x 106
0
5
10−120
−100
−80
−60
−40
Gai
n (d
B)
Frequency (Hz)Time (s)
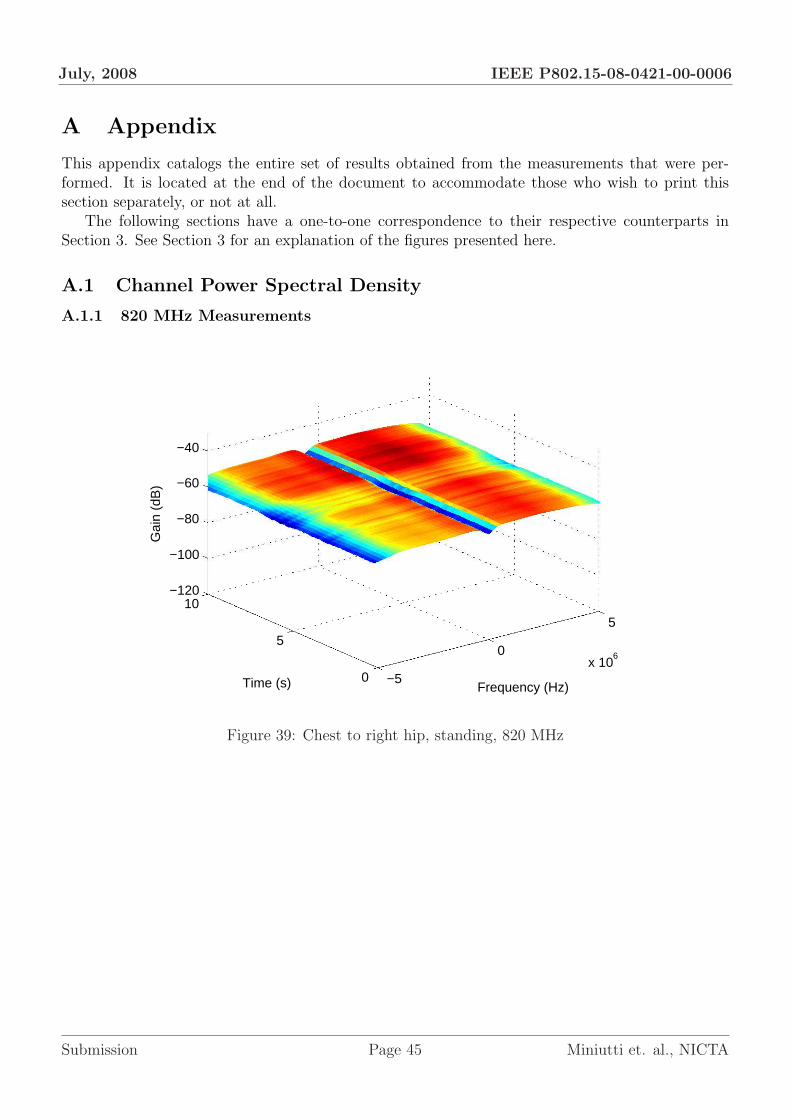
Figure 39: Chest to right hip, standing, 820 MHz
Submission Page 45 Miniutti et. al., NICTA

July, 2008 IEEE P802.15-08-0421-00-0006
−5
0
5
x 106
0
5
10−120
−100
−80
−60
−40
Gai
n (d
B)
Frequency (Hz)Time (s)
Figure 40: Chest to right hip, walking, 820 MHz
−5
0
5
x 106
0
5
10−120
−100
−80
−60
−40
Gai
n (d
B)
Frequency (Hz)Time (s)
Figure 41: Chest to right hip, running, 820 MHz
Submission Page 46 Miniutti et. al., NICTA
July, 2008 IEEE P802.15-08-0421-00-0006
−5
0
5
x 106
0
5
10−120
−100
−80
−60
−40
Gai
n (d
B)
Frequency (Hz)Time (s)
Figure 42: Right wrist to right hip, standing, 820 MHz
−5
0
5
x 106
0
5
10−120
−100
−80
−60
−40
Gai
n (d
B)
Frequency (Hz)Time (s)
Figure 43: Right wrist to right hip, walking, 820 MHz
Submission Page 47 Miniutti et. al., NICTA
July, 2008 IEEE P802.15-08-0421-00-0006
−5
0
5
x 106
0
5
10−120
−100
−80
−60
−40
Gai
n (d
B)
Frequency (Hz)Time (s)
Figure 44: Right wrist to right hip, running, 820 MHz
−5
0
5
x 106
0
5
10−120
−100
−80
−60
−40
Gai
n (d
B)
Frequency (Hz)Time (s)
Figure 45: Left wrist to right hip, standing, 820 MHz
Submission Page 48 Miniutti et. al., NICTA

July, 2008 IEEE P802.15-08-0421-00-0006
−5
0
5
x 106
0
5
10−120
−100
−80
−60
−40
Gai
n (d
B)
Frequency (Hz)Time (s)
Figure 46: Left wrist to right hip, walking, 820 MHz
−5
0
5
x 106
0
5
10−120
−100
−80
−60
−40
Gai
n (d
B)
Frequency (Hz)Time (s)
Figure 47: Left wrist to right hip, running, 820 MHz
Submission Page 49 Miniutti et. al., NICTA

July, 2008 IEEE P802.15-08-0421-00-0006
−5
0
5
x 106
0
5
10−120
−100
−80
−60
−40
Gai
n (d
B)
Frequency (Hz)Time (s)
Figure 48: Right ankle to right hip, standing, 820 MHz
−5
0
5
x 106
0
5
10−120
−100
−80
−60
−40
Gai
n (d
B)
Frequency (Hz)Time (s)
Figure 49: Right ankle to right hip, walking, 820 MHz
Submission Page 50 Miniutti et. al., NICTA
July, 2008 IEEE P802.15-08-0421-00-0006
−5
0
5
x 106
0
5
10−120
−100
−80
−60
−40
Gai
n (d
B)
Frequency (Hz)Time (s)
Figure 50: Right ankle to right hip, running, 820 MHz
−5
0
5
x 106
0
5
10−120
−100
−80
−60
−40
Gai
n (d
B)
Frequency (Hz)Time (s)
Figure 51: Left ankle to right hip, standing, 820 MHz
Submission Page 51 Miniutti et. al., NICTA

July, 2008 IEEE P802.15-08-0421-00-0006
−5
0
5
x 106
0
5
10−120
−100
−80
−60
−40
Gai
n (d
B)
Frequency (Hz)Time (s)
Figure 52: Left ankle to right hip, walking, 820 MHz
−5
0
5
x 106
0
5
10−120
−100
−80
−60
−40
Gai
n (d
B)
Frequency (Hz)Time (s)
Figure 53: Left ankle to right hip, running, 820 MHz
Submission Page 52 Miniutti et. al., NICTA

July, 2008 IEEE P802.15-08-0421-00-0006
−5
0
5
x 106
0
5
10−120
−100
−80
−60
−40
Gai
n (d
B)
Frequency (Hz)Time (s)
Figure 54: Back to right hip, standing, 820 MHz
−5
0
5
x 106
0
5
10−120
−100
−80
−60
−40
Gai
n (d
B)
Frequency (Hz)Time (s)
Figure 55: Back to right hip, walking, 820 MHz
Submission Page 53 Miniutti et. al., NICTA
July, 2008 IEEE P802.15-08-0421-00-0006
−5
0
5
x 106
0
5
10−120
−100
−80
−60
−40
Gai
n (d
B)
Frequency (Hz)Time (s)
Figure 56: Back to right hip, running, 820 MHz
−5
0
5
x 106
0
5
10−120
−100
−80
−60
−40
Gai
n (d
B)
Frequency (Hz)Time (s)
Figure 57: Back to chest, standing, 820 MHz
Submission Page 54 Miniutti et. al., NICTA

July, 2008 IEEE P802.15-08-0421-00-0006
−5
0
5
x 106
0
5
10−120
−100
−80
−60
−40
Gai
n (d
B)
Frequency (Hz)Time (s)
Figure 58: Back to chest, walking, 820 MHz
−5
0
5
x 106
0
5
10−120
−100
−80
−60
−40
Gai
n (d
B)
Frequency (Hz)Time (s)
Figure 59: Back to chest, running, 820 MHz
Submission Page 55 Miniutti et. al., NICTA

July, 2008 IEEE P802.15-08-0421-00-0006
−5
0
5
x 106
0
5
10−120
−100
−80
−60
−40
Gai
n (d
B)
Frequency (Hz)Time (s)
Figure 60: Right wrist to chest, standing, 820 MHz
−5
0
5
x 106
0
5
10−120
−100
−80
−60
−40
Gai
n (d
B)
Frequency (Hz)Time (s)
Figure 61: Right wrist to chest, walking, 820 MHz
Submission Page 56 Miniutti et. al., NICTA
July, 2008 IEEE P802.15-08-0421-00-0006
−5
0
5
x 106
0
5
10−120
−100
−80
−60
−40
Gai
n (d
B)
Frequency (Hz)Time (s)
Figure 62: Right wrist to chest, running, 820 MHz
−5
0
5
x 106
0
5
10−120
−100
−80
−60
−40
Gai
n (d
B)
Frequency (Hz)Time (s)
Figure 63: Right ankle to chest, standing, 820 MHz
Submission Page 57 Miniutti et. al., NICTA

July, 2008 IEEE P802.15-08-0421-00-0006
−5
0
5
x 106
0
5
10−120
−100
−80
−60
−40
Gai
n (d
B)
Frequency (Hz)Time (s)
Figure 64: Right ankle to chest, walking, 820 MHz
−5
0
5
x 106
0
5
10−120
−100
−80
−60
−40
Gai
n (d
B)
Frequency (Hz)Time (s)
Figure 65: Right ankle to chest, running, 820 MHz
Submission Page 58 Miniutti et. al., NICTA

July, 2008 IEEE P802.15-08-0421-00-0006
A.1.2 2.36 GHz Measurements
−5
0
5
x 106
0
5
10−120
−100
−80
−60
−40
Gai
n (d
B)
Frequency (Hz)Time (s)
Figure 66: Chest to right hip, standing, 2.36 GHz
Submission Page 59 Miniutti et. al., NICTA

July, 2008 IEEE P802.15-08-0421-00-0006
−5
0
5
x 106
0
5
10−120
−100
−80
−60
−40
Gai
n (d
B)
Frequency (Hz)Time (s)
Figure 67: Chest to right hip, walking, 2.36 GHz
−5
0
5
x 106
0
5
10−120
−100
−80
−60
−40
Gai
n (d
B)
Frequency (Hz)Time (s)
Figure 68: Chest to right hip, running, 2.36 GHz
Submission Page 60 Miniutti et. al., NICTA
July, 2008 IEEE P802.15-08-0421-00-0006
−5
0
5
x 106
0
5
10−120
−100
−80
−60
−40
Gai
n (d
B)
Frequency (Hz)Time (s)
Figure 69: Right wrist to right hip, standing, 2.36 GHz
−5
0
5
x 106
0
5
10−120
−100
−80
−60
−40
Gai
n (d
B)
Frequency (Hz)Time (s)
Figure 70: Right wrist to right hip, walking, 2.36 GHz
Submission Page 61 Miniutti et. al., NICTA
July, 2008 IEEE P802.15-08-0421-00-0006
−5
0
5
x 106
0
5
10−120
−100
−80
−60
−40
Gai
n (d
B)
Frequency (Hz)Time (s)
Figure 71: Right wrist to right hip, running, 2.36 GHz
−5
0
5
x 106
0
5
10−120
−100
−80
−60
−40
Gai
n (d
B)
Frequency (Hz)Time (s)
Figure 72: Left wrist to right hip, standing, 2.36 GHz
Submission Page 62 Miniutti et. al., NICTA
July, 2008 IEEE P802.15-08-0421-00-0006
−5
0
5
x 106
0
5
10−120
−100
−80
−60
−40
Gai
n (d
B)
Frequency (Hz)Time (s)
Figure 73: Left wrist to right hip, walking, 2.36 GHz
−5
0
5
x 106
0
5
10−120
−100
−80
−60
−40
Gai
n (d
B)
Frequency (Hz)Time (s)
Figure 74: Left wrist to right hip, running, 2.36 GHz
Submission Page 63 Miniutti et. al., NICTA

July, 2008 IEEE P802.15-08-0421-00-0006
−5
0
5
x 106
0
5
10−120
−100
−80
−60
−40
Gai
n (d
B)
Frequency (Hz)Time (s)
Figure 75: Right ankle to right hip, standing, 2.36 GHz
−5
0
5
x 106
0
5
10−120
−100
−80
−60
−40
Gai
n (d
B)
Frequency (Hz)Time (s)
Figure 76: Right ankle to right hip, walking, 2.36 GHz
Submission Page 64 Miniutti et. al., NICTA
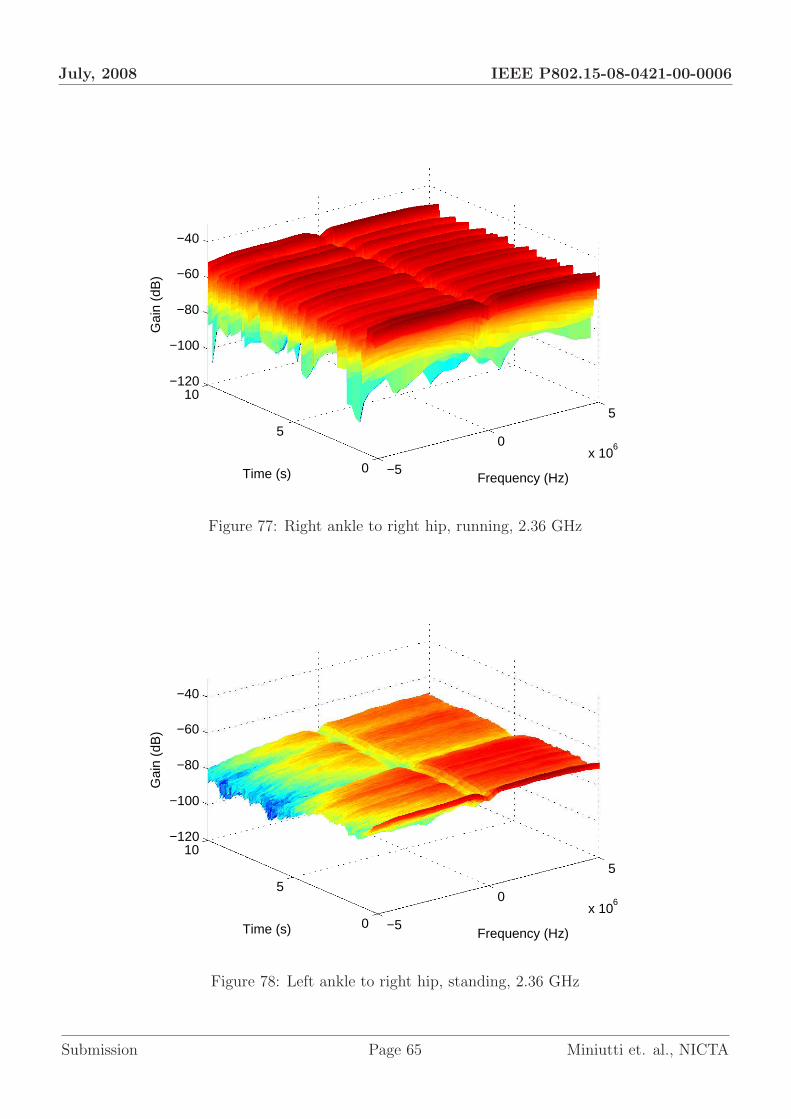
July, 2008 IEEE P802.15-08-0421-00-0006
−5
0
5
x 106
0
5
10−120
−100
−80
−60
−40
Gai
n (d
B)
Frequency (Hz)Time (s)
Figure 77: Right ankle to right hip, running, 2.36 GHz
−5
0
5
x 106
0
5
10−120
−100
−80
−60
−40
Gai
n (d
B)
Frequency (Hz)Time (s)
Figure 78: Left ankle to right hip, standing, 2.36 GHz
Submission Page 65 Miniutti et. al., NICTA
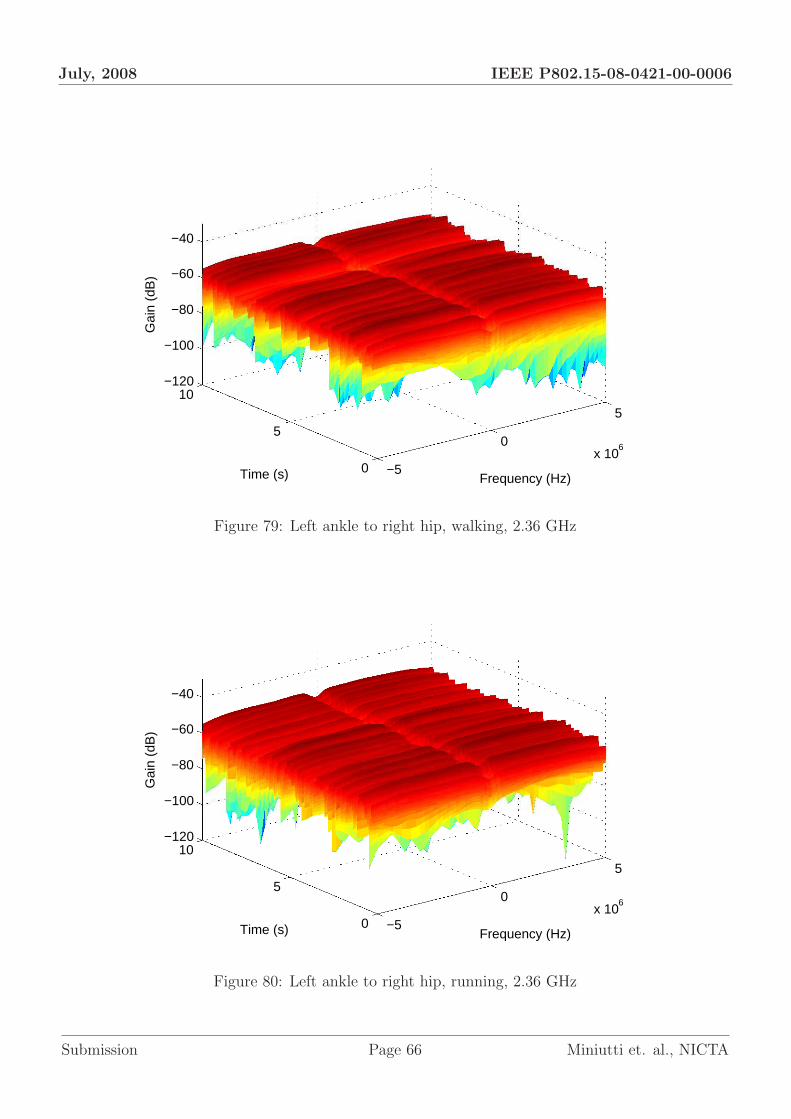
July, 2008 IEEE P802.15-08-0421-00-0006
−5
0
5
x 106
0
5
10−120
−100
−80
−60
−40
Gai
n (d
B)
Frequency (Hz)Time (s)
Figure 79: Left ankle to right hip, walking, 2.36 GHz
−5
0
5
x 106
0
5
10−120
−100
−80
−60
−40
Gai
n (d
B)
Frequency (Hz)Time (s)
Figure 80: Left ankle to right hip, running, 2.36 GHz
Submission Page 66 Miniutti et. al., NICTA
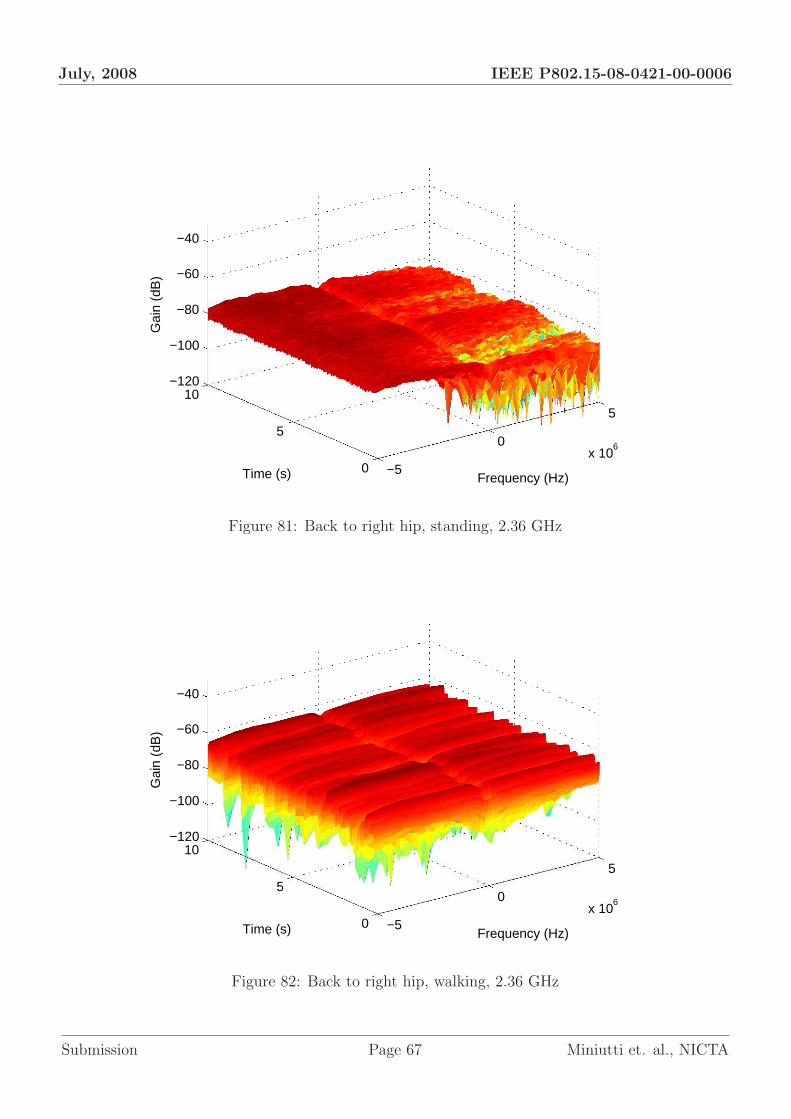
July, 2008 IEEE P802.15-08-0421-00-0006
−5
0
5
x 106
0
5
10−120
−100
−80
−60
−40
Gai
n (d
B)
Frequency (Hz)Time (s)
Figure 81: Back to right hip, standing, 2.36 GHz
−5
0
5
x 106
0
5
10−120
−100
−80
−60
−40
Gai
n (d
B)
Frequency (Hz)Time (s)
Figure 82: Back to right hip, walking, 2.36 GHz
Submission Page 67 Miniutti et. al., NICTA

July, 2008 IEEE P802.15-08-0421-00-0006
−5
0
5
x 106
0
5
10−120
−100
−80
−60
−40
Gai
n (d
B)
Frequency (Hz)Time (s)
Figure 83: Back to right hip, running, 2.36 GHz
−5
0
5
x 106
0
5
10−120
−100
−80
−60
−40
Gai
n (d
B)
Frequency (Hz)Time (s)
Figure 84: Back to chest, standing, 2.36 GHz
Submission Page 68 Miniutti et. al., NICTA

July, 2008 IEEE P802.15-08-0421-00-0006
−5
0
5
x 106
0
5
10−120
−100
−80
−60
−40
Gai
n (d
B)
Frequency (Hz)Time (s)
Figure 85: Back to chest, walking, 2.36 GHz
−5
0
5
x 106
0
5
10−120
−100
−80
−60
−40
Gai
n (d
B)
Frequency (Hz)Time (s)
Figure 86: Back to chest, running, 2.36 GHz
Submission Page 69 Miniutti et. al., NICTA

July, 2008 IEEE P802.15-08-0421-00-0006
−5
0
5
x 106
0
5
10−120
−100
−80
−60
−40
Gai
n (d
B)
Frequency (Hz)Time (s)
Figure 87: Right wrist to chest, standing, 2.36 GHz
−5
0
5
x 106
0
5
10−120
−100
−80
−60
−40
Gai
n (d
B)
Frequency (Hz)Time (s)
Figure 88: Right wrist to chest, walking, 2.36 GHz
Submission Page 70 Miniutti et. al., NICTA

July, 2008 IEEE P802.15-08-0421-00-0006
−5
0
5
x 106
0
5
10−120
−100
−80
−60
−40
Gai
n (d
B)
Frequency (Hz)Time (s)
Figure 89: Right wrist to chest, running, 2.36 GHz
−5
0
5
x 106
0
5
10−120
−100
−80
−60
−40
Gai
n (d
B)
Frequency (Hz)Time (s)
Figure 90: Right ankle to chest, standing, 2.36 GHz
Submission Page 71 Miniutti et. al., NICTA

July, 2008 IEEE P802.15-08-0421-00-0006
−5
0
5
x 106
0
5
10−120
−100
−80
−60
−40
Gai
n (d
B)
Frequency (Hz)Time (s)
Figure 91: Right ankle to chest, walking, 2.36 GHz
−5
0
5
x 106
0
5
10−120
−100
−80
−60
−40
Gai
n (d
B)
Frequency (Hz)Time (s)
Figure 92: Right ankle to chest, running, 2.36 GHz
Submission Page 72 Miniutti et. al., NICTA
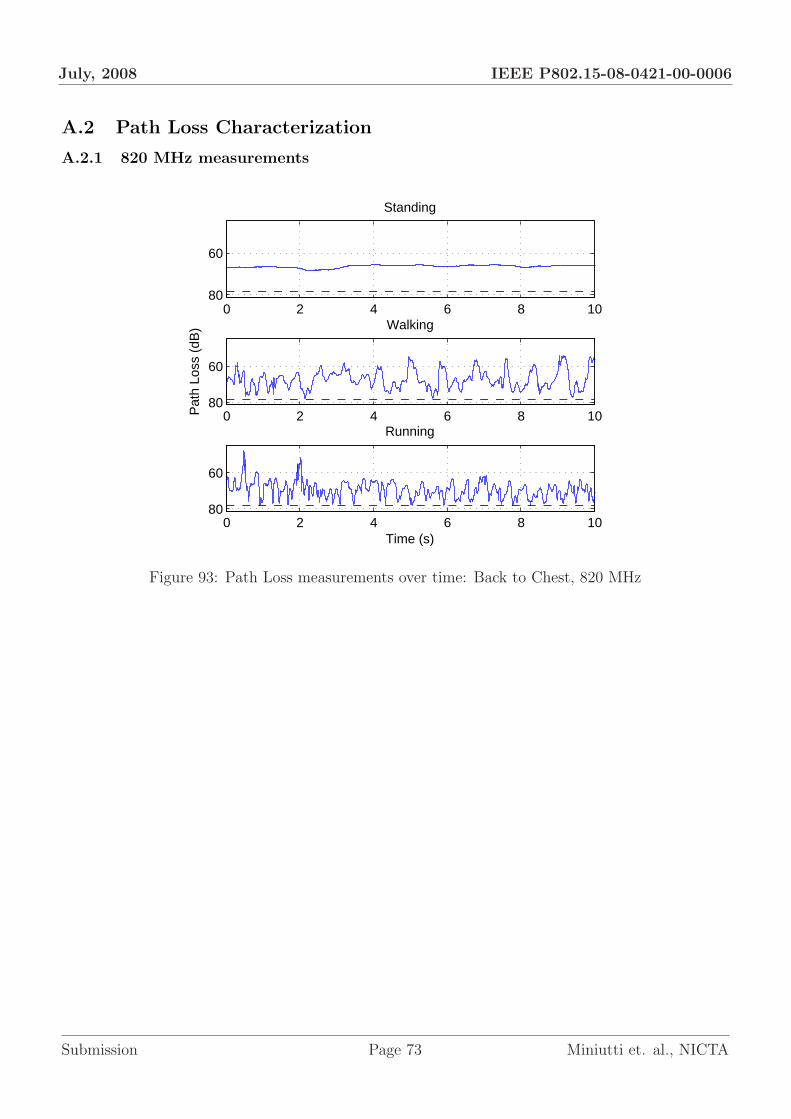
July, 2008 IEEE P802.15-08-0421-00-0006
A.2 Path Loss Characterization
A.2.1 820 MHz measurements
0 2 4 6 8 10
60
80
Standing
0 2 4 6 8 10
60
80
Walking
Pat
h Lo
ss (
dB)
0 2 4 6 8 10
60
80
Running
Time (s)
Figure 93: Path Loss measurements over time: Back to Chest, 820 MHz
Submission Page 73 Miniutti et. al., NICTA
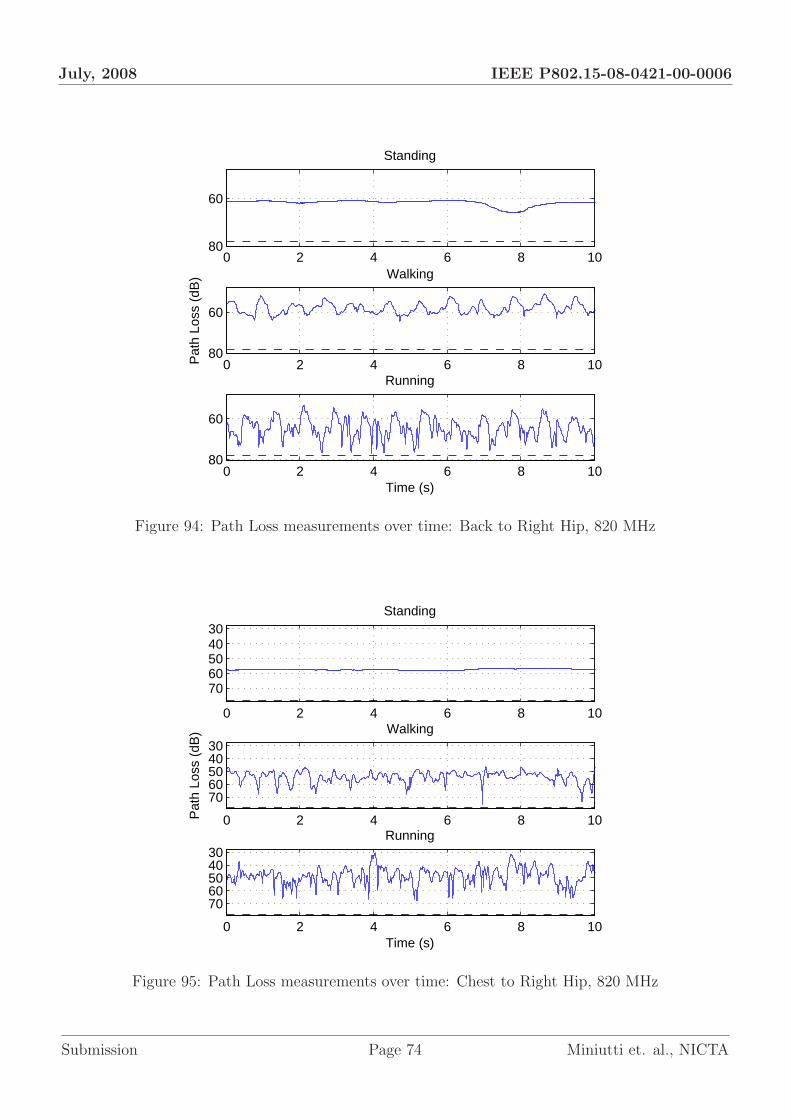
July, 2008 IEEE P802.15-08-0421-00-0006
0 2 4 6 8 10
60
80
Standing
0 2 4 6 8 10
60
80
Walking
Pat
h Lo
ss (
dB)
0 2 4 6 8 10
60
80
Running
Time (s)
Figure 94: Path Loss measurements over time: Back to Right Hip, 820 MHz
0 2 4 6 8 10
3040506070
Standing
0 2 4 6 8 10
3040506070
Walking
Pat
h Lo
ss (
dB)
0 2 4 6 8 10
3040506070
Running
Time (s)
Figure 95: Path Loss measurements over time: Chest to Right Hip, 820 MHz
Submission Page 74 Miniutti et. al., NICTA

July, 2008 IEEE P802.15-08-0421-00-0006
0 2 4 6 8 10
50
60
70
Standing
0 2 4 6 8 10
506070
Walking
Pat
h Lo
ss (
dB)
0 2 4 6 8 10
506070
Running
Time (s)
Figure 96: Path Loss measurements over time: Left Ankle to Right Hip, 820 MHz
0 2 4 6 8 10
60
80
Standing
0 2 4 6 8 10
60
80
Walking
Pat
h Lo
ss (
dB)
0 2 4 6 8 10
60
80
Running
Time (s)
Figure 97: Path Loss measurements over time: Left Wrist to Right Hip, 820 MHz
Submission Page 75 Miniutti et. al., NICTA
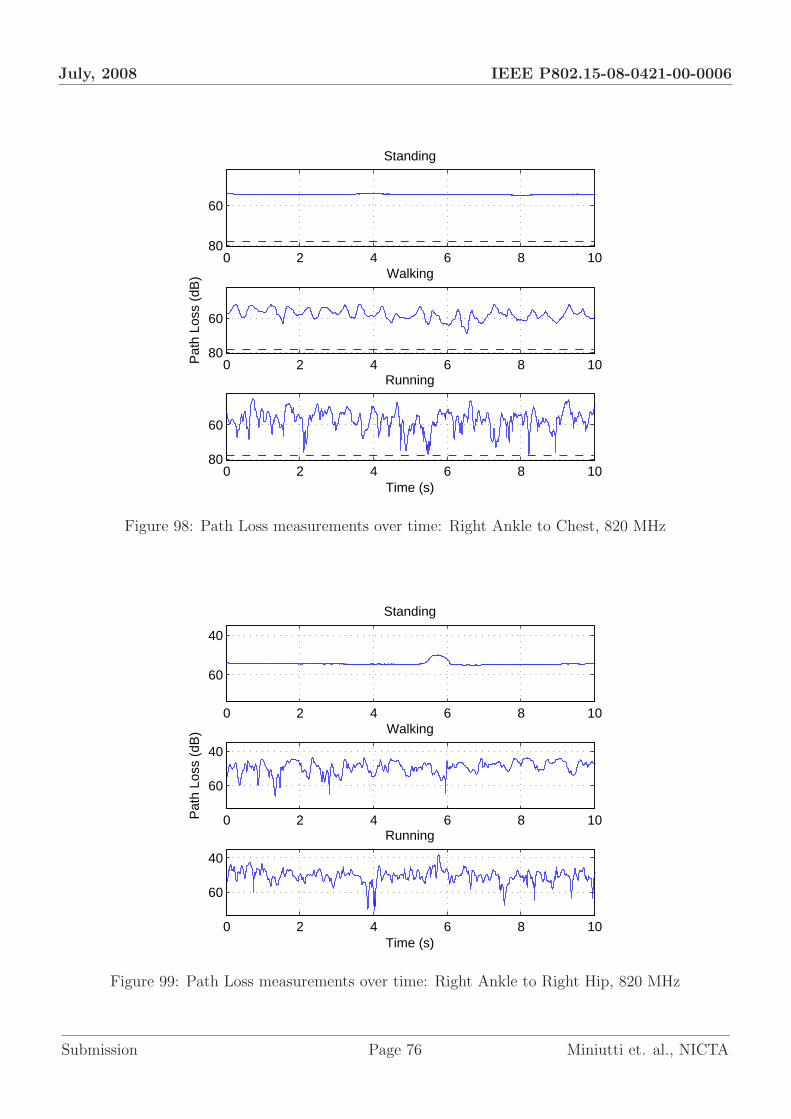
July, 2008 IEEE P802.15-08-0421-00-0006
0 2 4 6 8 10
60
80
Standing
0 2 4 6 8 10
60
80
Walking
Pat
h Lo
ss (
dB)
0 2 4 6 8 10
60
80
Running
Time (s)
Figure 98: Path Loss measurements over time: Right Ankle to Chest, 820 MHz
0 2 4 6 8 10
40
60
Standing
0 2 4 6 8 10
40
60
Walking
Pat
h Lo
ss (
dB)
0 2 4 6 8 10
40
60
Running
Time (s)
Figure 99: Path Loss measurements over time: Right Ankle to Right Hip, 820 MHz
Submission Page 76 Miniutti et. al., NICTA

July, 2008 IEEE P802.15-08-0421-00-0006
0 2 4 6 8 10
40
60
Standing
0 2 4 6 8 10
40
60
Walking
Pat
h Lo
ss (
dB)
0 2 4 6 8 10
40
60
Running
Time (s)
Figure 100: Path Loss measurements over time: Right Wrist to Chest, 820 MHz
0 2 4 6 8 10
3040506070
Standing
0 2 4 6 8 10
3040506070
Walking
Pat
h Lo
ss (
dB)
0 2 4 6 8 10
3040506070
Running
Time (s)
Figure 101: Path Loss measurements over time: Right Wrist to Right Hip, 820 MHz
Submission Page 77 Miniutti et. al., NICTA
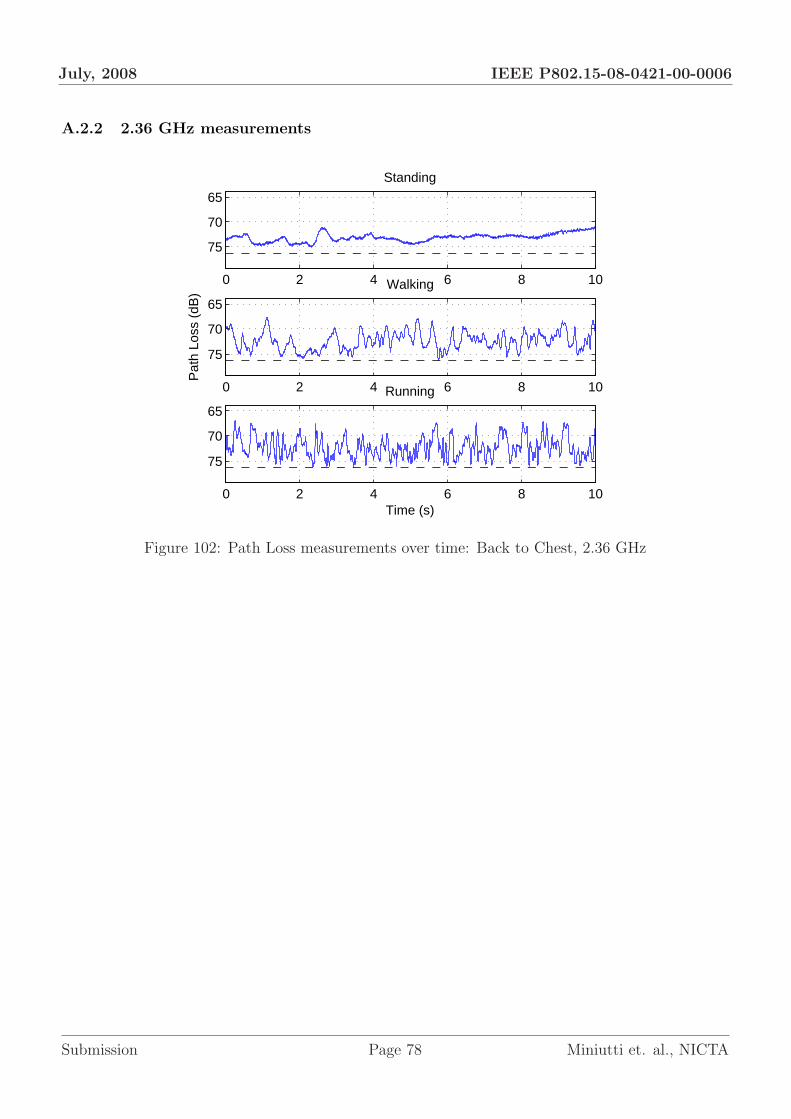
July, 2008 IEEE P802.15-08-0421-00-0006
A.2.2 2.36 GHz measurements
0 2 4 6 8 10
65
70
75
Standing
0 2 4 6 8 10
65
70
75
Walking
Pat
h Lo
ss (
dB)
0 2 4 6 8 10
65
70
75
Running
Time (s)
Figure 102: Path Loss measurements over time: Back to Chest, 2.36 GHz
Submission Page 78 Miniutti et. al., NICTA
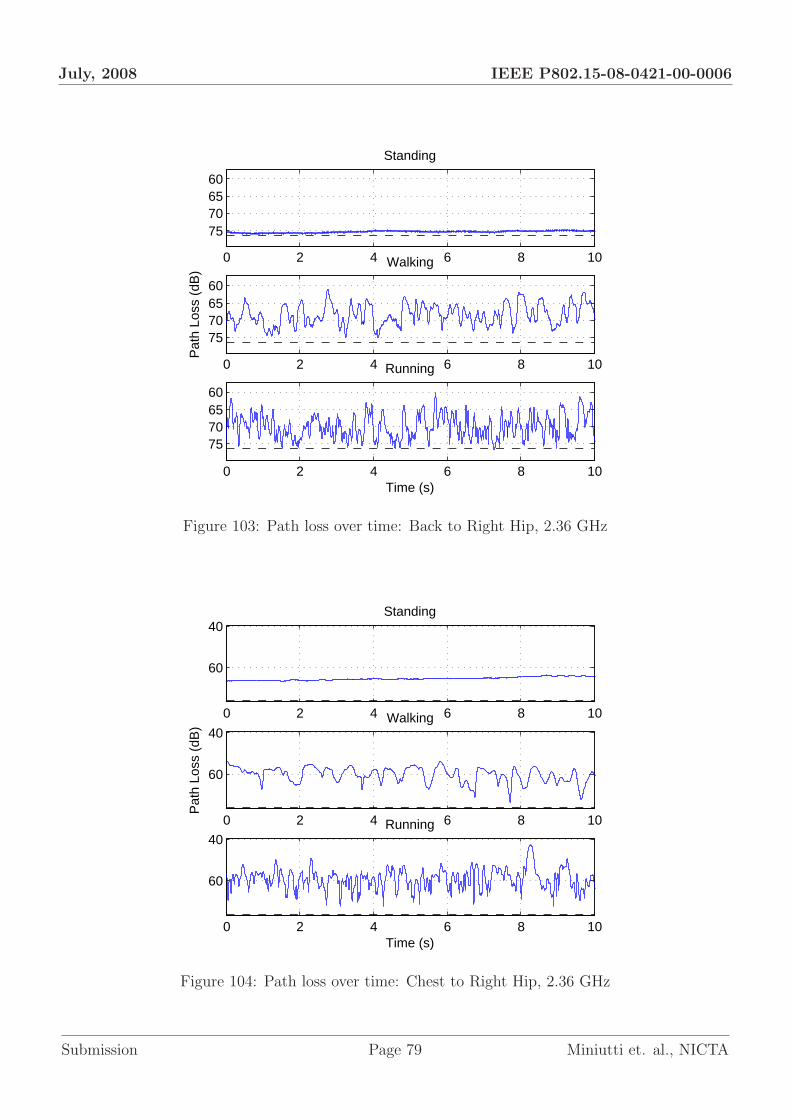
July, 2008 IEEE P802.15-08-0421-00-0006
0 2 4 6 8 10
60657075
Standing
0 2 4 6 8 10
60657075
Walking
Pat
h Lo
ss (
dB)
0 2 4 6 8 10
60657075
Running
Time (s)
Figure 103: Path loss over time: Back to Right Hip, 2.36 GHz
0 2 4 6 8 10
40
60
Standing
0 2 4 6 8 10
40
60
Walking
Pat
h Lo
ss (
dB)
0 2 4 6 8 10
40
60
Running
Time (s)
Figure 104: Path loss over time: Chest to Right Hip, 2.36 GHz
Submission Page 79 Miniutti et. al., NICTA
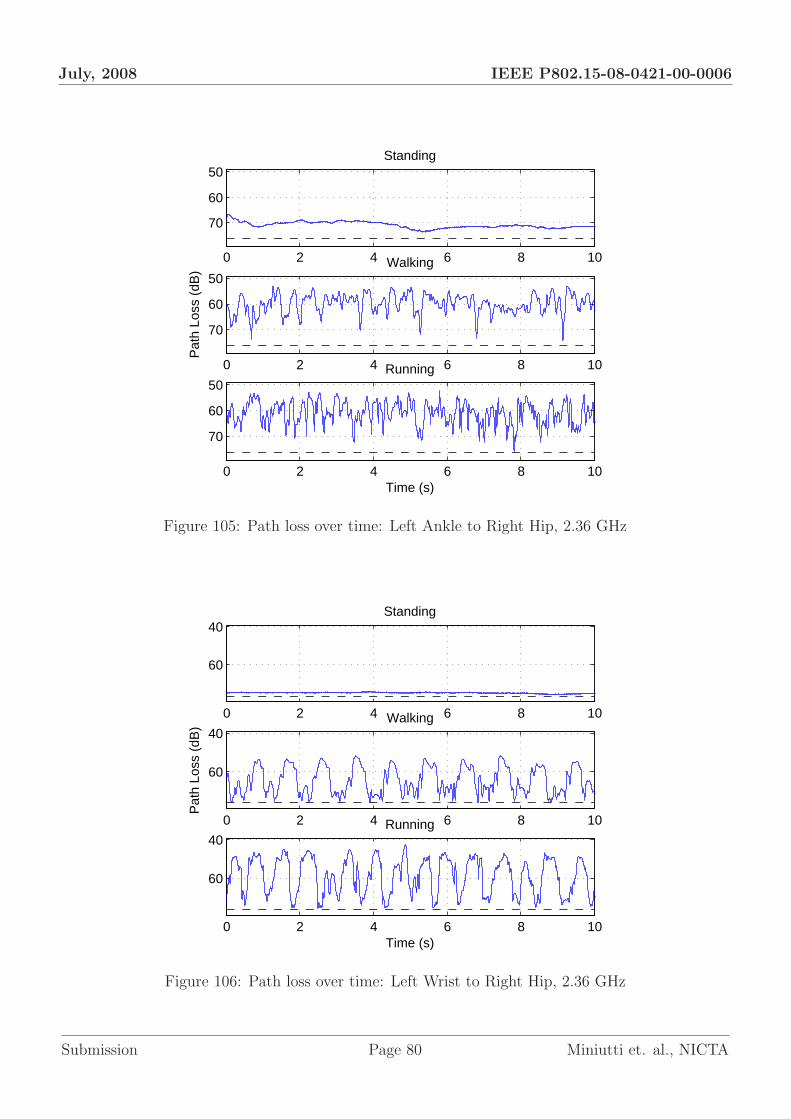
July, 2008 IEEE P802.15-08-0421-00-0006
0 2 4 6 8 10
50
60
70
Standing
0 2 4 6 8 10
50
60
70
Walking
Pat
h Lo
ss (
dB)
0 2 4 6 8 10
50
60
70
Running
Time (s)
Figure 105: Path loss over time: Left Ankle to Right Hip, 2.36 GHz
0 2 4 6 8 10
40
60
Standing
0 2 4 6 8 10
40
60
Walking
Pat
h Lo
ss (
dB)
0 2 4 6 8 10
40
60
Running
Time (s)
Figure 106: Path loss over time: Left Wrist to Right Hip, 2.36 GHz
Submission Page 80 Miniutti et. al., NICTA

July, 2008 IEEE P802.15-08-0421-00-0006
0 2 4 6 8 10
5560657075
Standing
0 2 4 6 8 10
5560657075
Walking
Pat
h Lo
ss (
dB)
0 2 4 6 8 10
5560657075
Running
Time (s)
Figure 107: Path loss over time: Right Ankle to Chest, 2.36 GHz
0 2 4 6 8 10
50
60
70
Standing
0 2 4 6 8 10
50
60
70
Walking
Pat
h Lo
ss (
dB)
0 2 4 6 8 10
50
60
70
Running
Time (s)
Figure 108: Path loss over time: Right Ankle to Right Hip, 2.36 GHz
Submission Page 81 Miniutti et. al., NICTA
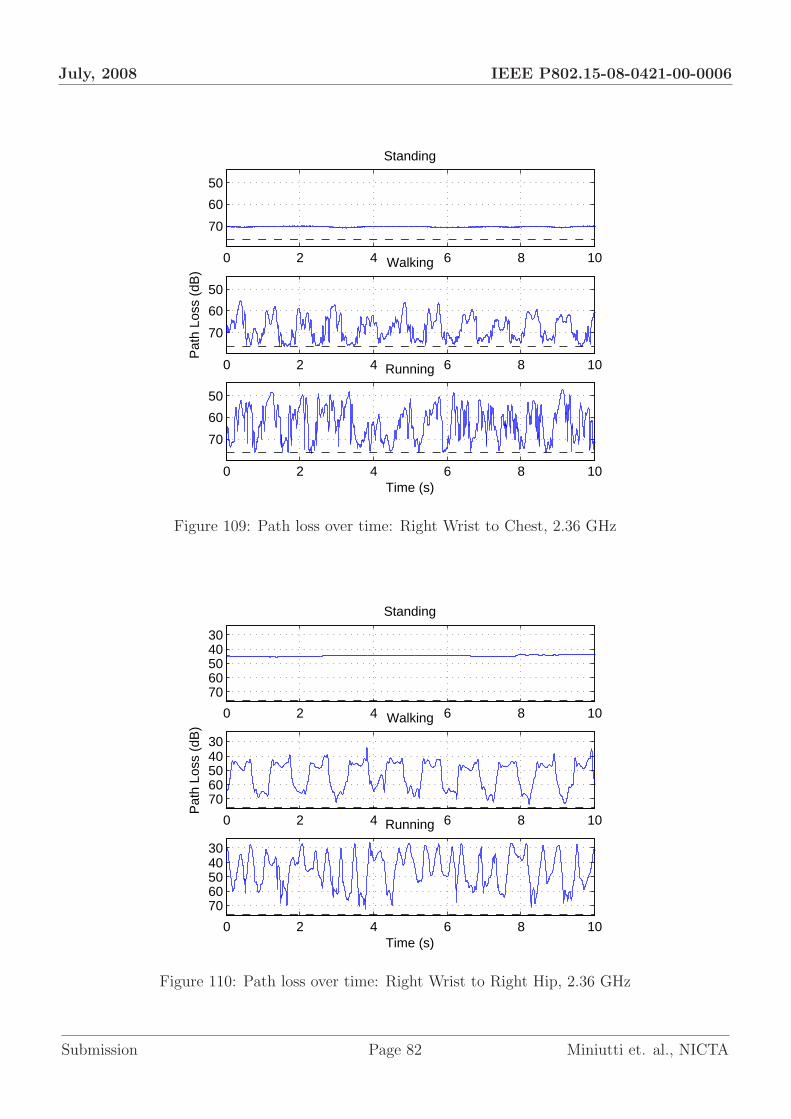
July, 2008 IEEE P802.15-08-0421-00-0006
0 2 4 6 8 10
50
60
70
Standing
0 2 4 6 8 10
50
60
70
Walking
Pat
h Lo
ss (
dB)
0 2 4 6 8 10
50
60
70
Running
Time (s)
Figure 109: Path loss over time: Right Wrist to Chest, 2.36 GHz
0 2 4 6 8 10
3040506070
Standing
0 2 4 6 8 10
3040506070
Walking
Pat
h Lo
ss (
dB)
0 2 4 6 8 10
3040506070
Running
Time (s)
Figure 110: Path loss over time: Right Wrist to Right Hip, 2.36 GHz
Submission Page 82 Miniutti et. al., NICTA

July, 2008 IEEE P802.15-08-0421-00-0006
A.3 Statistical Description of Received Power
The “Freedman-Diaconis” rule used to select the bin size, Bs, for the histogram that describes theempirical PDF from the measured data is defined as
Bs = 2Ir(x)n−1/3 (9)
where Ir is the inter-quartile range of the data sample x (in this case measured normalized receivedpower) and n is the sample size of x.
A.3.1 PDFs at 2.36 GHz
0 0.1 0.2 0.3 0.4 0.5 0.6 0.7 0.8 0.9 10
5
10
15
20
25
Normalized Received Power
Den
sity
Measured DataNormal fitLognormalGamma
Figure 111: PDF Chest to right hip, running at 2.36 GHz
Submission Page 83 Miniutti et. al., NICTA

July, 2008 IEEE P802.15-08-0421-00-0006
0 0.1 0.2 0.3 0.4 0.5 0.6 0.7 0.8 0.9 10
0.5
1
1.5
2
2.5
3
3.5
4
Normalized Received Power
Den
sity
Measured DataNormal fitLognormalGamma
Figure 112: PDF Chest to right hip, walking at 2.36 GHz
0.4 0.5 0.6 0.7 0.8 0.9 10
0.5
1
1.5
2
2.5
3
3.5
4
Normalized Received Power
Den
sity
Measured DataNormal fitLognormalGamma
Figure 113: PDF Chest to right hip, standing at 2.36 GHz
Submission Page 84 Miniutti et. al., NICTA

July, 2008 IEEE P802.15-08-0421-00-0006
0 0.1 0.2 0.3 0.4 0.5 0.6 0.7 0.8 0.9 10
1
2
3
4
5
6
7
Normalized Received Power
Den
sity
Measured DataNormal fitLognormalGamma
Figure 114: PDF Right ankle to chest, running at 2.36 GHz
Submission Page 85 Miniutti et. al., NICTA

July, 2008 IEEE P802.15-08-0421-00-0006
0 0.1 0.2 0.3 0.4 0.5 0.6 0.7 0.8 0.9 10
1
2
3
4
5
6
Normalized Received Power
Den
sity
Measured DataNormal fitLognormalGamma
Figure 115: PDF Right ankle to chest, walking at 2.36 GHz
0 0.1 0.2 0.3 0.4 0.5 0.6 0.7 0.8 0.9 10
0.5
1
1.5
2
2.5
3
3.5
4
Normalized Received Power
Den
sity
Measured DataNormal fitLognormalGamma
Figure 116: Right ankle to chest, standing at 2.36 GHz
Submission Page 86 Miniutti et. al., NICTA

July, 2008 IEEE P802.15-08-0421-00-0006
0 0.1 0.2 0.3 0.4 0.5 0.6 0.7 0.8 0.9 10
5
10
15
20
25
30
35
Normalized Received Power
Den
sity
Measured DataNormal fitLognormalGamma
Figure 117: PDF Right wrist to chest, running at 2.36 GHz
Submission Page 87 Miniutti et. al., NICTA
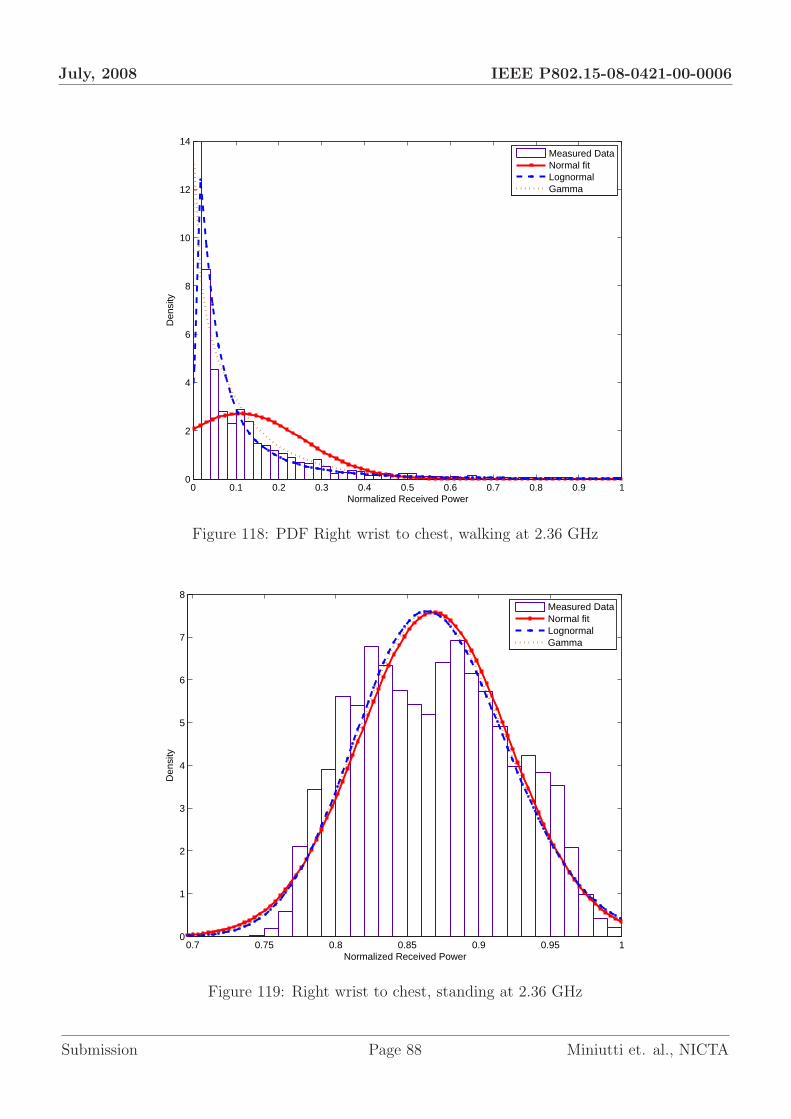
July, 2008 IEEE P802.15-08-0421-00-0006
0 0.1 0.2 0.3 0.4 0.5 0.6 0.7 0.8 0.9 10
2
4
6
8
10
12
14
Normalized Received Power
Den
sity
Measured DataNormal fitLognormalGamma
Figure 118: PDF Right wrist to chest, walking at 2.36 GHz
0.7 0.75 0.8 0.85 0.9 0.95 10
1
2
3
4
5
6
7
8
Normalized Received Power
Den
sity
Measured DataNormal fitLognormalGamma
Figure 119: Right wrist to chest, standing at 2.36 GHz
Submission Page 88 Miniutti et. al., NICTA
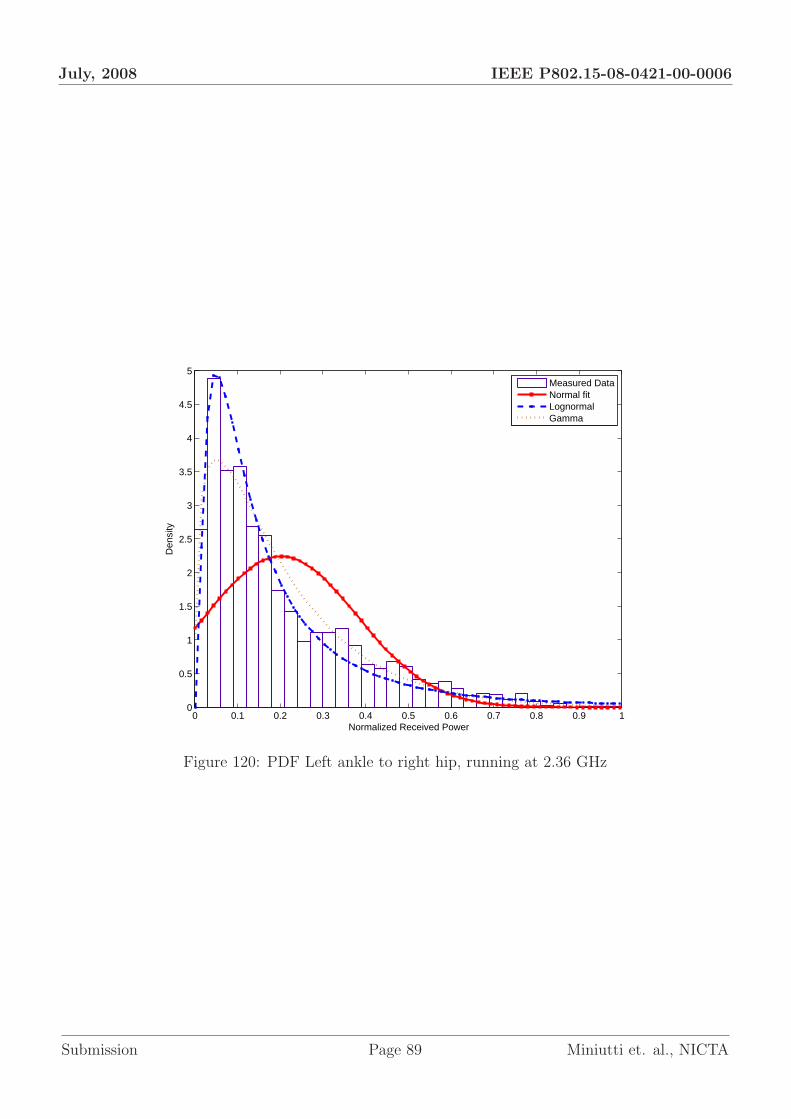
July, 2008 IEEE P802.15-08-0421-00-0006
0 0.1 0.2 0.3 0.4 0.5 0.6 0.7 0.8 0.9 10
0.5
1
1.5
2
2.5
3
3.5
4
4.5
5
Normalized Received Power
Den
sity
Measured DataNormal fitLognormalGamma
Figure 120: PDF Left ankle to right hip, running at 2.36 GHz
Submission Page 89 Miniutti et. al., NICTA
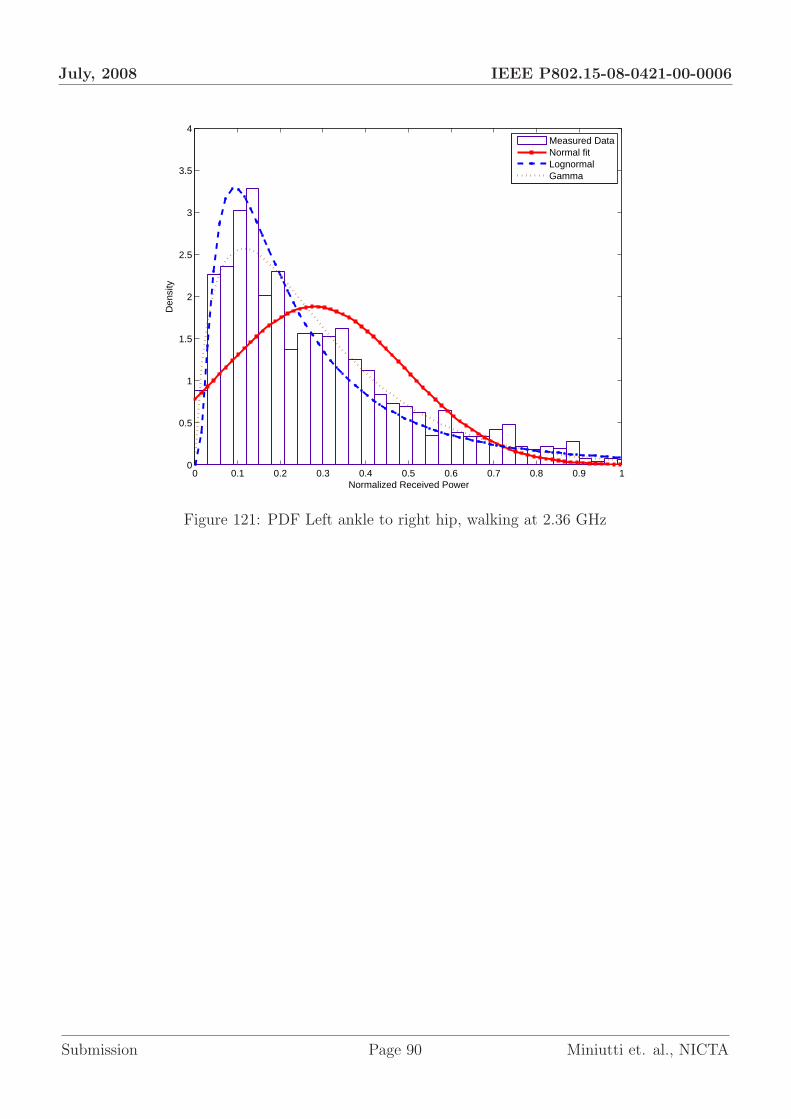
July, 2008 IEEE P802.15-08-0421-00-0006
0 0.1 0.2 0.3 0.4 0.5 0.6 0.7 0.8 0.9 10
0.5
1
1.5
2
2.5
3
3.5
4
Normalized Received Power
Den
sity
Measured DataNormal fitLognormalGamma
Figure 121: PDF Left ankle to right hip, walking at 2.36 GHz
Submission Page 90 Miniutti et. al., NICTA

July, 2008 IEEE P802.15-08-0421-00-0006
0.1 0.2 0.3 0.4 0.5 0.6 0.7 0.8 0.9 10
0.5
1
1.5
2
2.5
3
3.5
4
Normalized Received Power
Den
sity
Measured DataNormal fitLognormalGamma
Figure 122: PDF Left ankle to right hip, standing at 2.36 GHz
0 0.1 0.2 0.3 0.4 0.5 0.6 0.7 0.8 0.9 10
1
2
3
4
5
6
7
8
Normalized Received Power
Den
sity
Measured DataNormal fitLognormalGamma
Figure 123: PDF Right ankle to right hip, running at 2.36 GHz
Submission Page 91 Miniutti et. al., NICTA
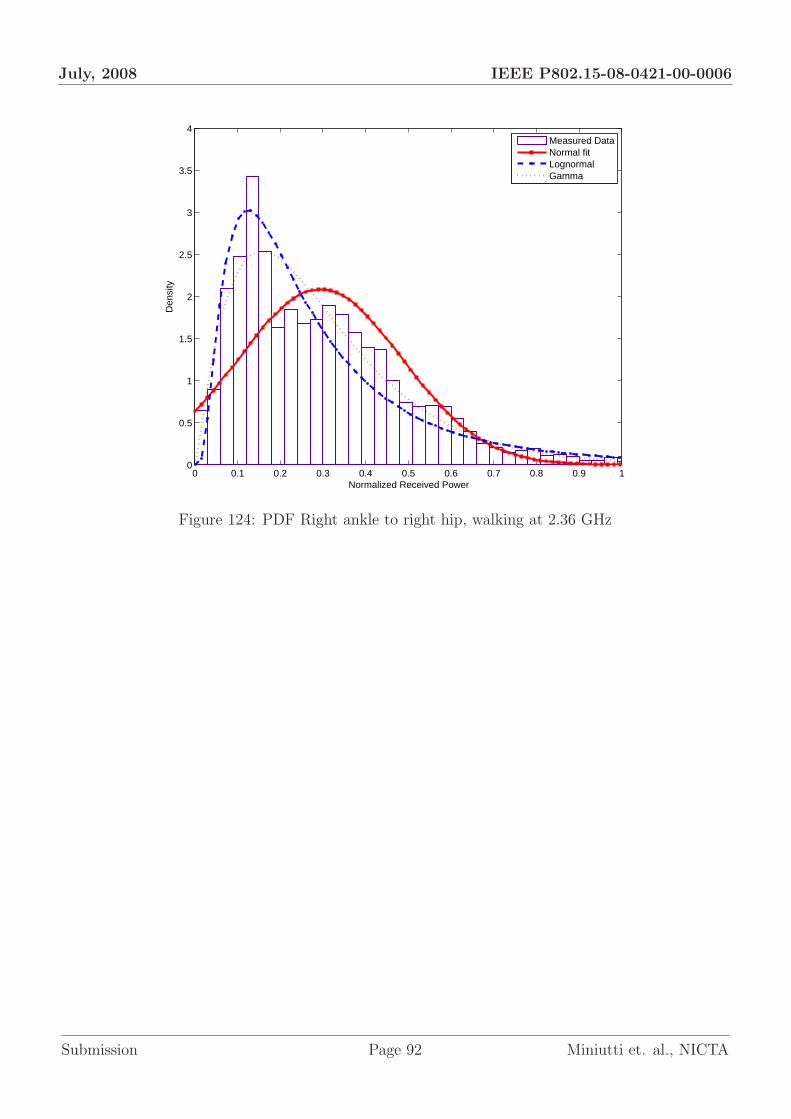
July, 2008 IEEE P802.15-08-0421-00-0006
0 0.1 0.2 0.3 0.4 0.5 0.6 0.7 0.8 0.9 10
0.5
1
1.5
2
2.5
3
3.5
4
Normalized Received Power
Den
sity
Measured DataNormal fitLognormalGamma
Figure 124: PDF Right ankle to right hip, walking at 2.36 GHz
Submission Page 92 Miniutti et. al., NICTA

July, 2008 IEEE P802.15-08-0421-00-0006
0.55 0.6 0.65 0.7 0.75 0.8 0.85 0.9 0.95 10
0.5
1
1.5
2
2.5
3
3.5
4
Normalized Received Power
Den
sity
Measured DataNormal fitLognormalGamma
Figure 125: PDF Right ankle to right hip, standing at 2.36 GHz
0 0.1 0.2 0.3 0.4 0.5 0.6 0.7 0.8 0.9 10
5
10
15
20
25
30
35
40
45
Normalized Received Power
Den
sity
Measured DataNormal fitLognormalGamma
Figure 126: PDF Left wrist to right hip, running at 2.36 GHz
Submission Page 93 Miniutti et. al., NICTA
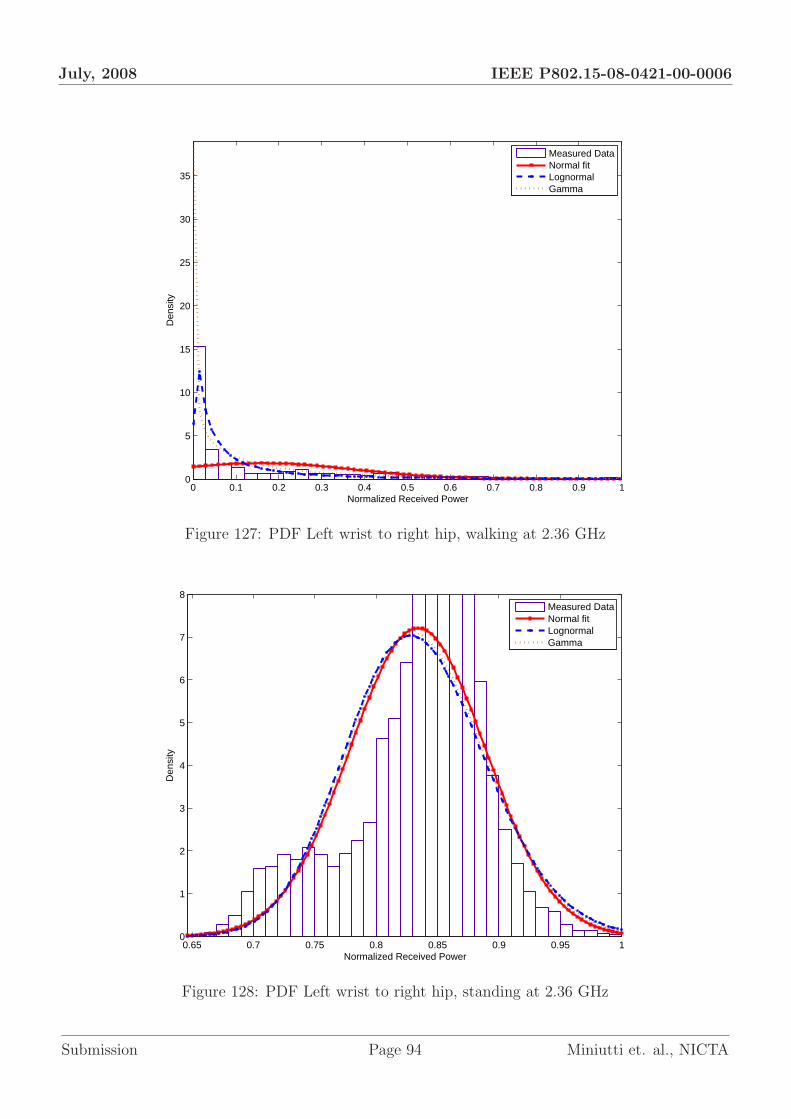
July, 2008 IEEE P802.15-08-0421-00-0006
0 0.1 0.2 0.3 0.4 0.5 0.6 0.7 0.8 0.9 10
5
10
15
20
25
30
35
Normalized Received Power
Den
sity
Measured DataNormal fitLognormalGamma
Figure 127: PDF Left wrist to right hip, walking at 2.36 GHz
0.65 0.7 0.75 0.8 0.85 0.9 0.95 10
1
2
3
4
5
6
7
8
Normalized Received Power
Den
sity
Measured DataNormal fitLognormalGamma
Figure 128: PDF Left wrist to right hip, standing at 2.36 GHz
Submission Page 94 Miniutti et. al., NICTA
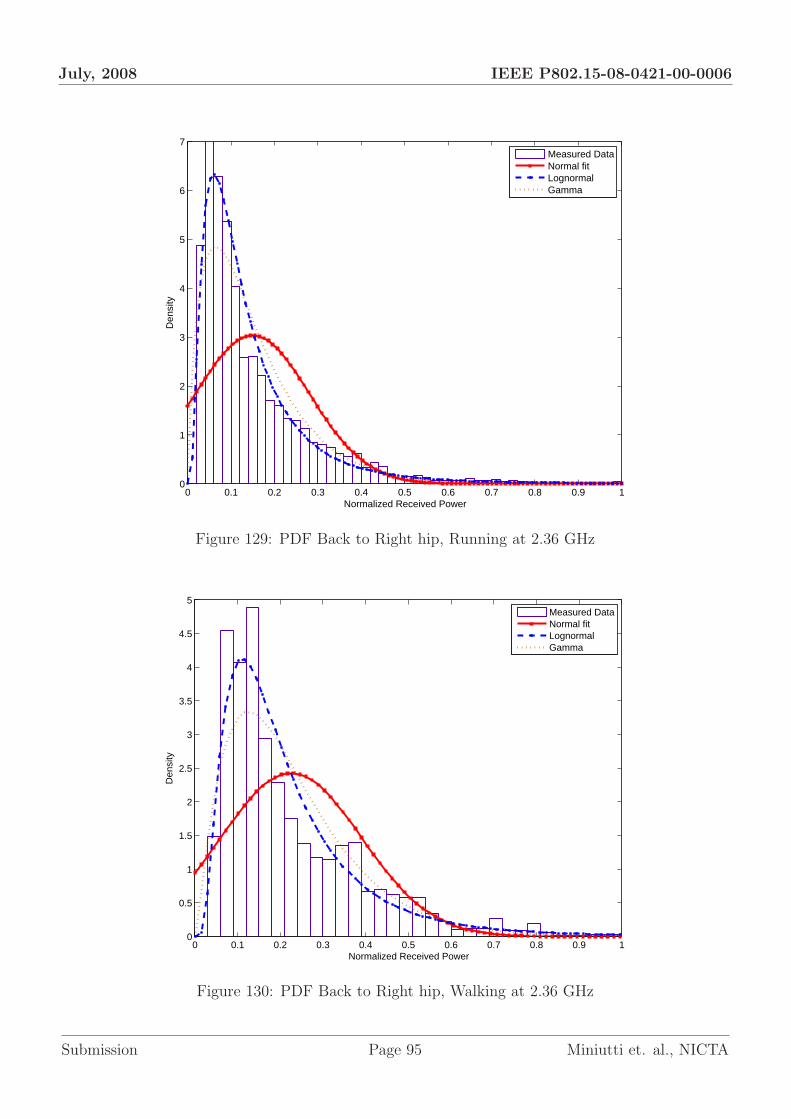
July, 2008 IEEE P802.15-08-0421-00-0006
0 0.1 0.2 0.3 0.4 0.5 0.6 0.7 0.8 0.9 10
1
2
3
4
5
6
7
Normalized Received Power
Den
sity
Measured DataNormal fitLognormalGamma
Figure 129: PDF Back to Right hip, Running at 2.36 GHz
0 0.1 0.2 0.3 0.4 0.5 0.6 0.7 0.8 0.9 10
0.5
1
1.5
2
2.5
3
3.5
4
4.5
5
Normalized Received Power
Den
sity
Measured DataNormal fitLognormalGamma
Figure 130: PDF Back to Right hip, Walking at 2.36 GHz
Submission Page 95 Miniutti et. al., NICTA
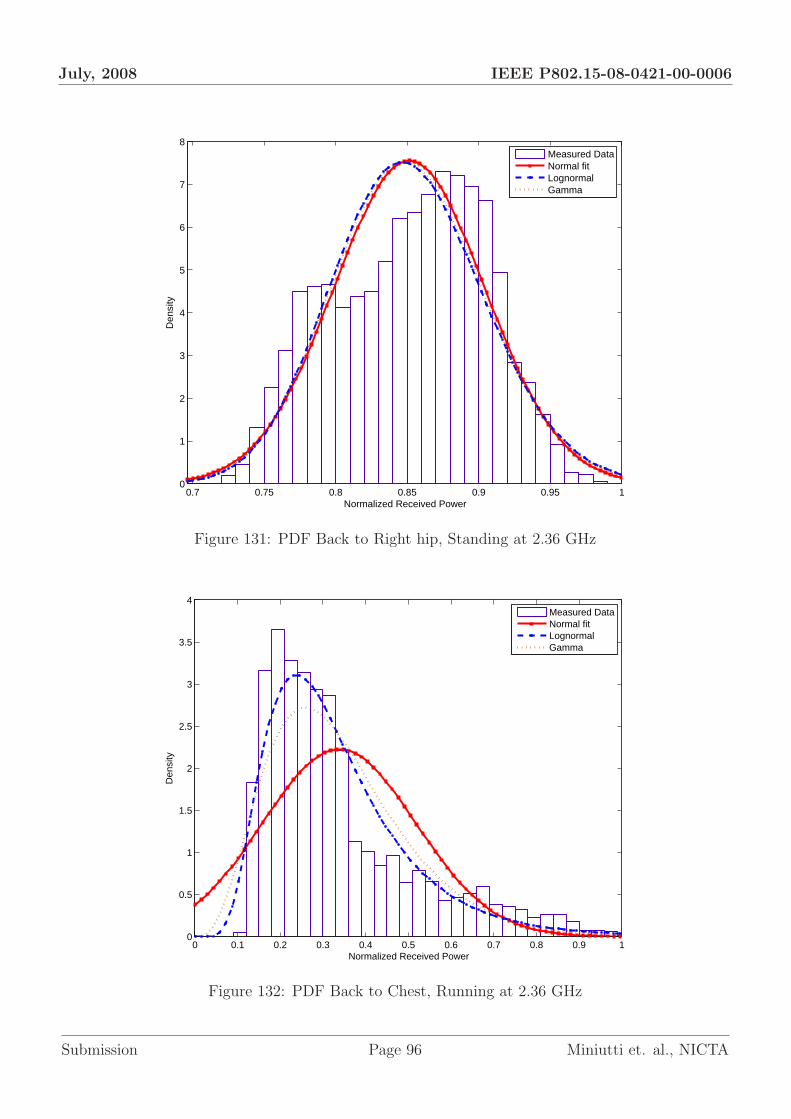
July, 2008 IEEE P802.15-08-0421-00-0006
0.7 0.75 0.8 0.85 0.9 0.95 10
1
2
3
4
5
6
7
8
Normalized Received Power
Den
sity
Measured DataNormal fitLognormalGamma
Figure 131: PDF Back to Right hip, Standing at 2.36 GHz
0 0.1 0.2 0.3 0.4 0.5 0.6 0.7 0.8 0.9 10
0.5
1
1.5
2
2.5
3
3.5
4
Normalized Received Power
Den
sity
Measured DataNormal fitLognormalGamma
Figure 132: PDF Back to Chest, Running at 2.36 GHz
Submission Page 96 Miniutti et. al., NICTA
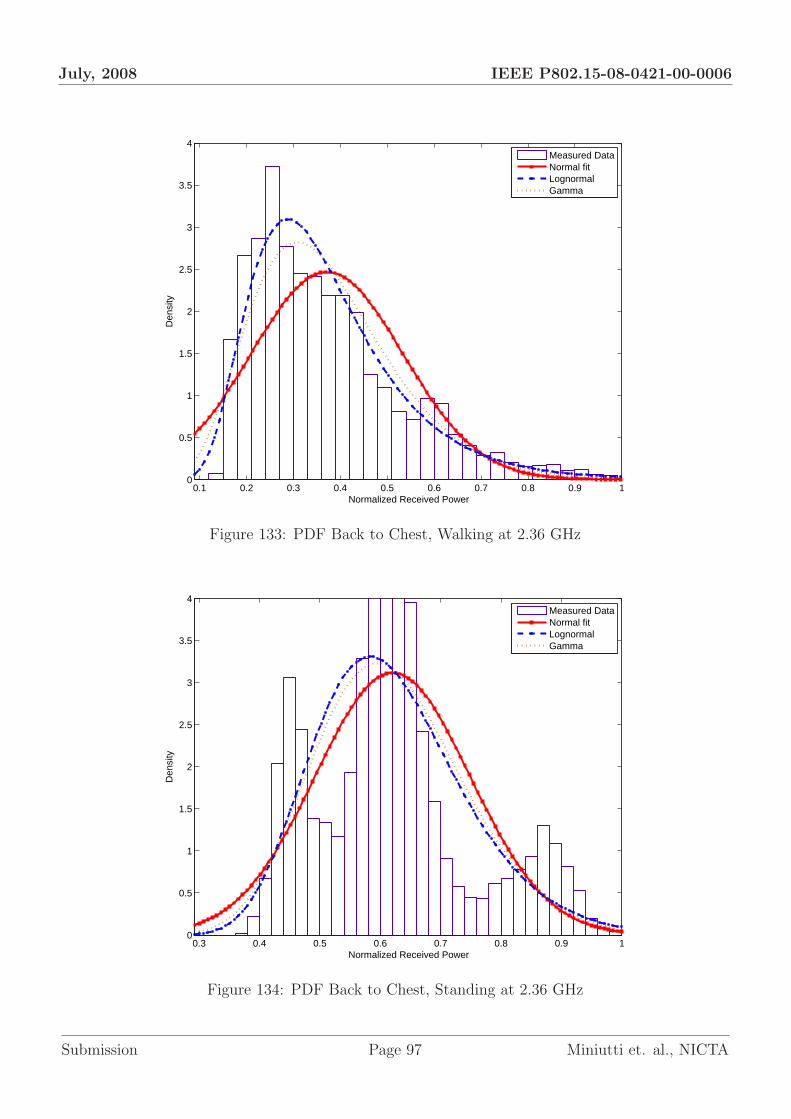
July, 2008 IEEE P802.15-08-0421-00-0006
0.1 0.2 0.3 0.4 0.5 0.6 0.7 0.8 0.9 10
0.5
1
1.5
2
2.5
3
3.5
4
Normalized Received Power
Den
sity
Measured DataNormal fitLognormalGamma
Figure 133: PDF Back to Chest, Walking at 2.36 GHz
0.3 0.4 0.5 0.6 0.7 0.8 0.9 10
0.5
1
1.5
2
2.5
3
3.5
4
Normalized Received Power
Den
sity
Measured DataNormal fitLognormalGamma
Figure 134: PDF Back to Chest, Standing at 2.36 GHz
Submission Page 97 Miniutti et. al., NICTA
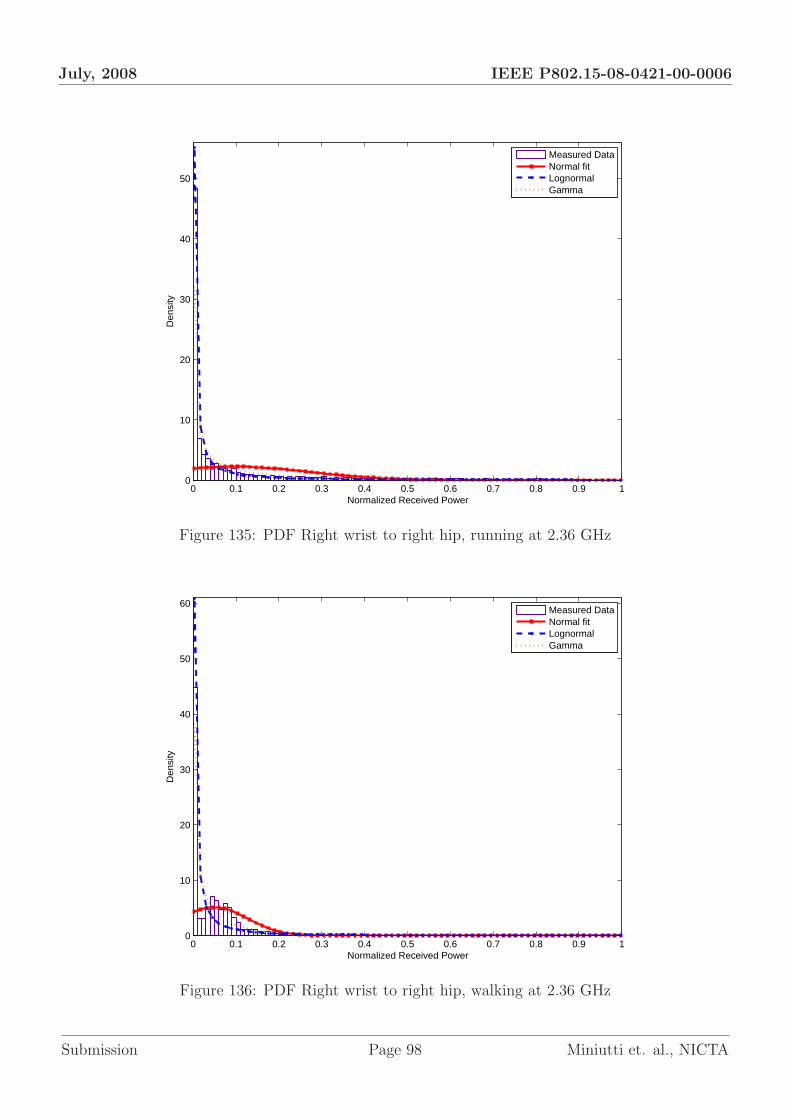
July, 2008 IEEE P802.15-08-0421-00-0006
0 0.1 0.2 0.3 0.4 0.5 0.6 0.7 0.8 0.9 10
10
20
30
40
50
Normalized Received Power
Den
sity
Measured DataNormal fitLognormalGamma
Figure 135: PDF Right wrist to right hip, running at 2.36 GHz
0 0.1 0.2 0.3 0.4 0.5 0.6 0.7 0.8 0.9 10
10
20
30
40
50
60
Normalized Received Power
Den
sity
Measured DataNormal fitLognormalGamma
Figure 136: PDF Right wrist to right hip, walking at 2.36 GHz
Submission Page 98 Miniutti et. al., NICTA
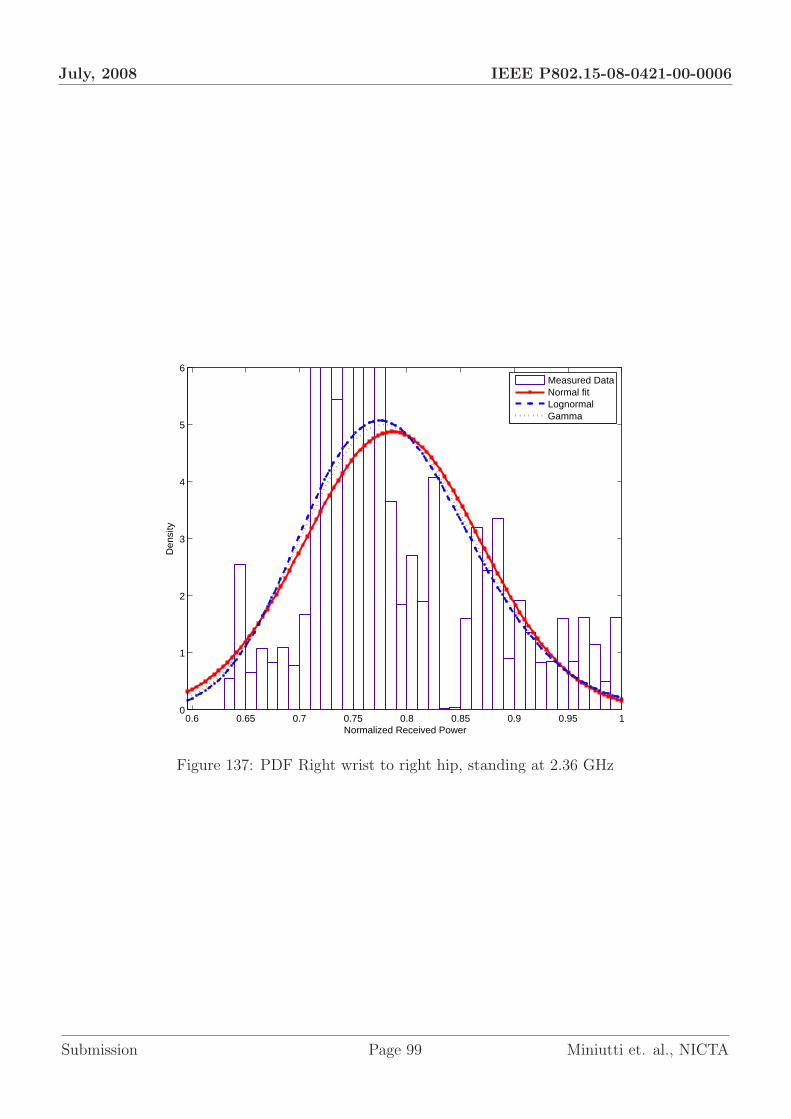
July, 2008 IEEE P802.15-08-0421-00-0006
0.6 0.65 0.7 0.75 0.8 0.85 0.9 0.95 10
1
2
3
4
5
6
Normalized Received Power
Den
sity
Measured DataNormal fitLognormalGamma
Figure 137: PDF Right wrist to right hip, standing at 2.36 GHz
Submission Page 99 Miniutti et. al., NICTA

July, 2008 IEEE P802.15-08-0421-00-0006
A.3.2 PDFs at 820 MHz
0 0.1 0.2 0.3 0.4 0.5 0.6 0.7 0.8 0.9 10
5
10
15
20
25
30
35
40
45
Normalized Received Power
Den
sity
Measured DataNormal fitLognormalGamma
Figure 138: PDF Chest to right hip, running at 820 MHz
Submission Page 100 Miniutti et. al., NICTA
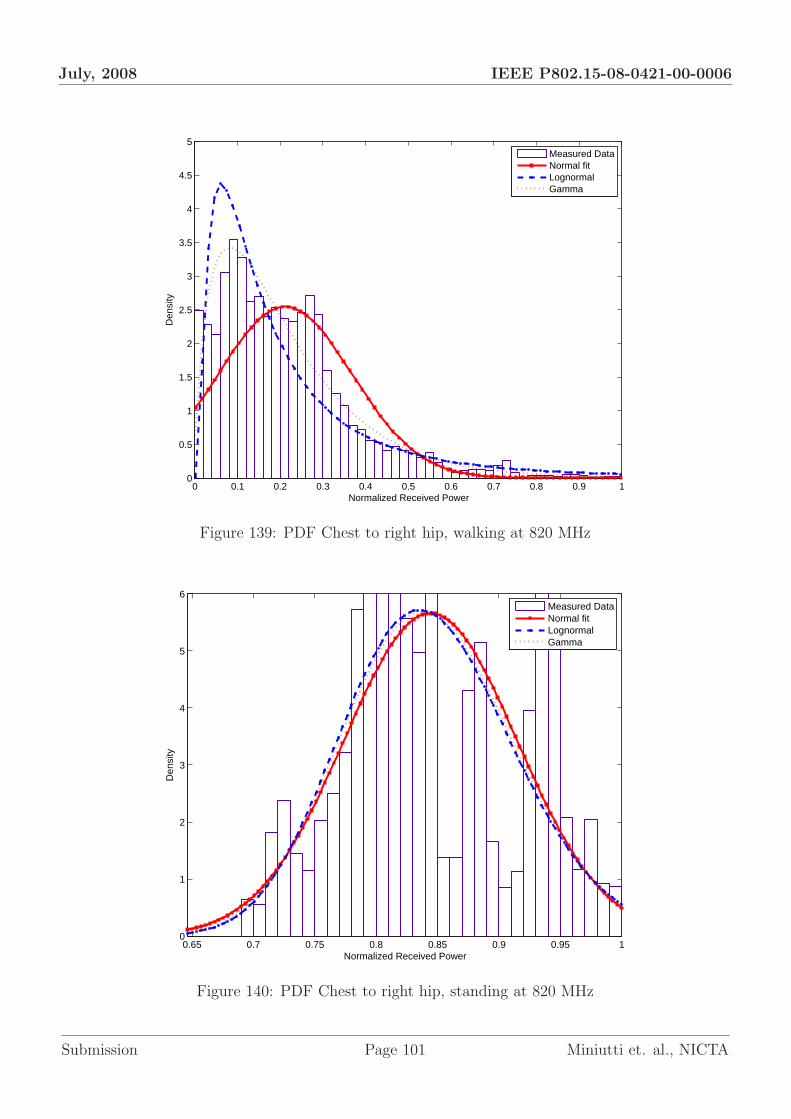
July, 2008 IEEE P802.15-08-0421-00-0006
0 0.1 0.2 0.3 0.4 0.5 0.6 0.7 0.8 0.9 10
0.5
1
1.5
2
2.5
3
3.5
4
4.5
5
Normalized Received Power
Den
sity
Measured DataNormal fitLognormalGamma
Figure 139: PDF Chest to right hip, walking at 820 MHz
0.65 0.7 0.75 0.8 0.85 0.9 0.95 10
1
2
3
4
5
6
Normalized Received Power
Den
sity
Measured DataNormal fitLognormalGamma
Figure 140: PDF Chest to right hip, standing at 820 MHz
Submission Page 101 Miniutti et. al., NICTA

July, 2008 IEEE P802.15-08-0421-00-0006
0.6 0.65 0.7 0.75 0.8 0.85 0.9 0.95 10
1
2
3
4
5
6
7
8
Normalized Received Power
Den
sity
Measured DataNormal fitLognormalGamma
Figure 141: PDF Right ankle to chest, running at 820 MHz
Submission Page 102 Miniutti et. al., NICTA

July, 2008 IEEE P802.15-08-0421-00-0006
0.55 0.6 0.65 0.7 0.75 0.8 0.85 0.9 0.95 10
2
4
6
8
10
12
14
16
Normalized Received Power
Den
sity
Measured DataNormal fitLognormalGamma
Figure 142: PDF Right ankle to chest, walking at 820 MHz
0.7 0.75 0.8 0.85 0.9 0.95 10
2
4
6
8
10
12
Normalized Received Power
Den
sity
Measured DataNormal fitLognormalGamma
Figure 143: Right ankle to chest, standing at 820 MHz
Submission Page 103 Miniutti et. al., NICTA
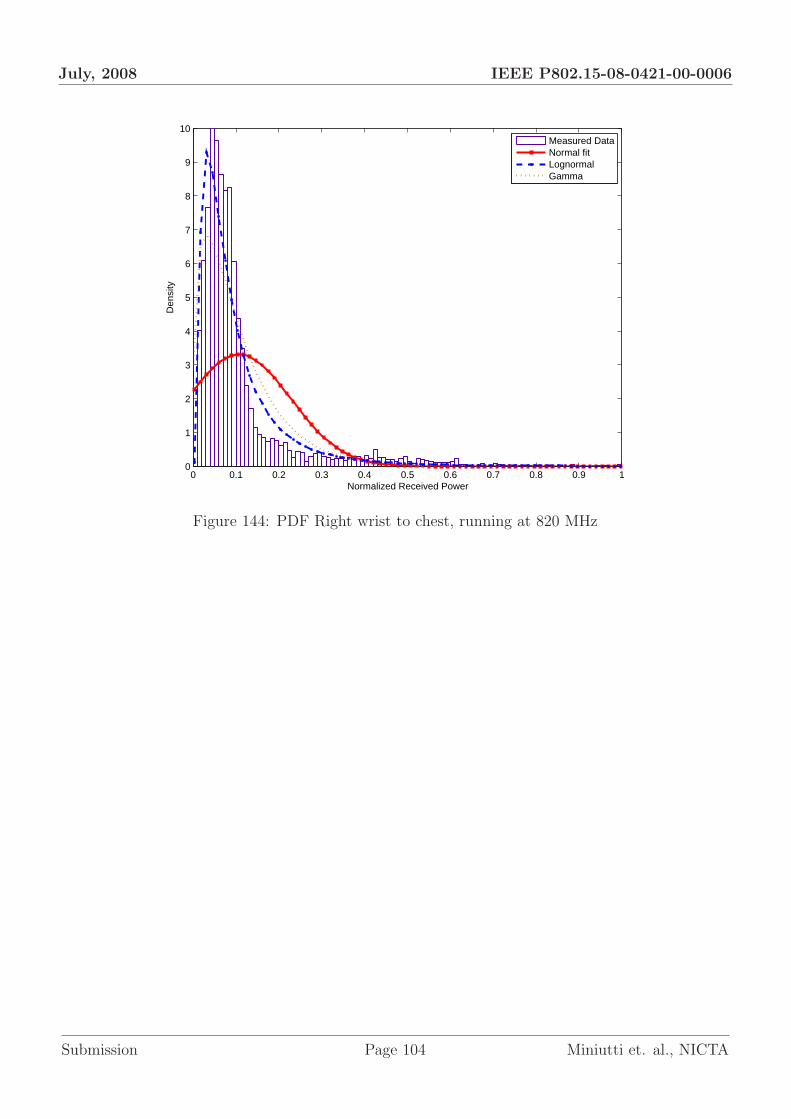
July, 2008 IEEE P802.15-08-0421-00-0006
0 0.1 0.2 0.3 0.4 0.5 0.6 0.7 0.8 0.9 10
1
2
3
4
5
6
7
8
9
10
Normalized Received Power
Den
sity
Measured DataNormal fitLognormalGamma
Figure 144: PDF Right wrist to chest, running at 820 MHz
Submission Page 104 Miniutti et. al., NICTA
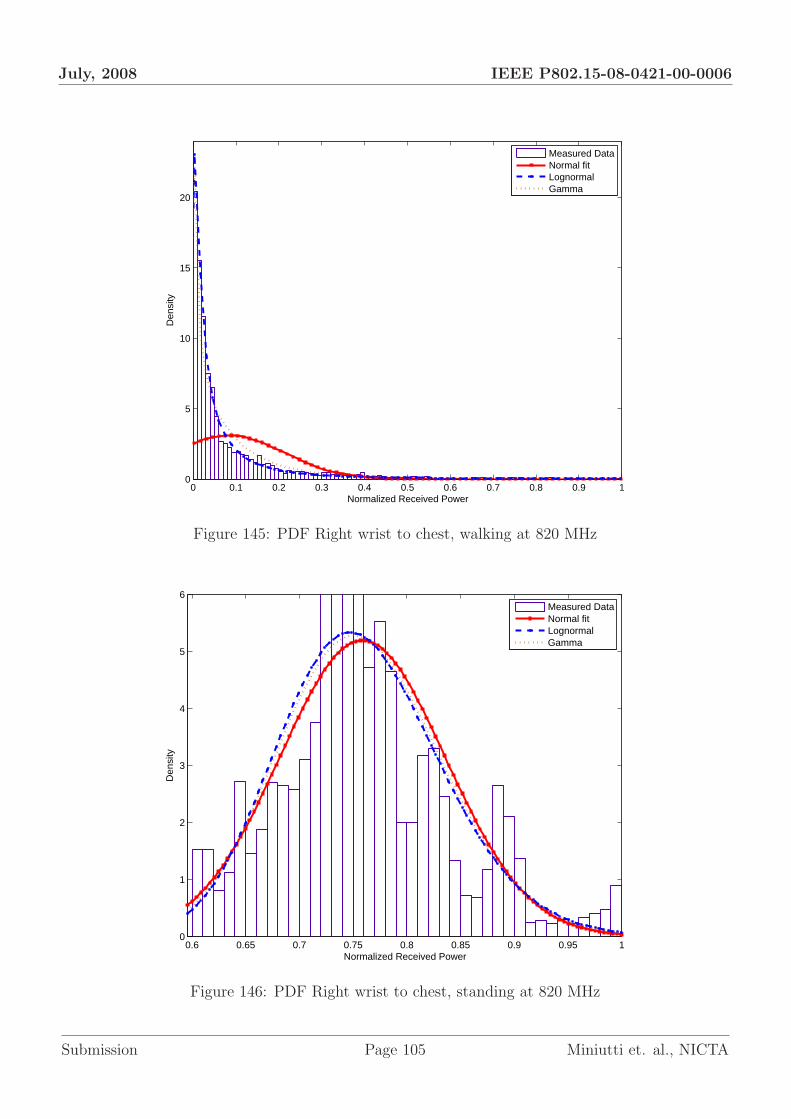
July, 2008 IEEE P802.15-08-0421-00-0006
0 0.1 0.2 0.3 0.4 0.5 0.6 0.7 0.8 0.9 10
5
10
15
20
Normalized Received Power
Den
sity
Measured DataNormal fitLognormalGamma
Figure 145: PDF Right wrist to chest, walking at 820 MHz
0.6 0.65 0.7 0.75 0.8 0.85 0.9 0.95 10
1
2
3
4
5
6
Normalized Received Power
Den
sity
Measured DataNormal fitLognormalGamma
Figure 146: PDF Right wrist to chest, standing at 820 MHz
Submission Page 105 Miniutti et. al., NICTA
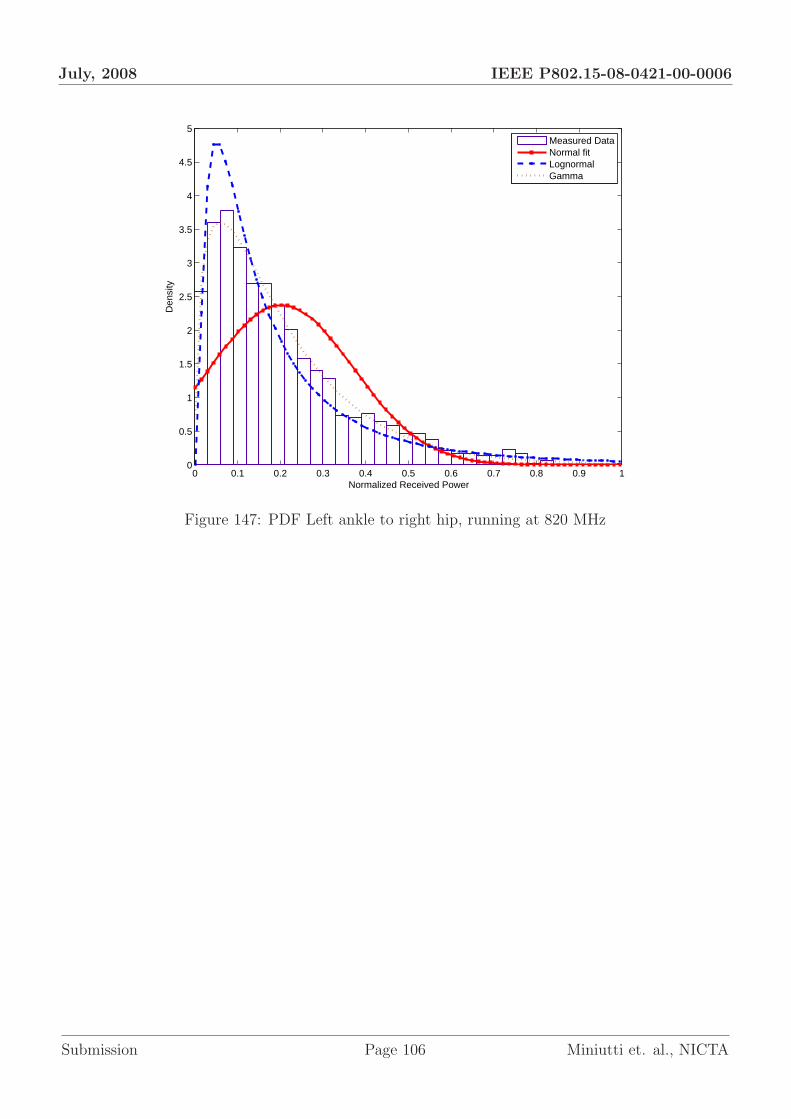
July, 2008 IEEE P802.15-08-0421-00-0006
0 0.1 0.2 0.3 0.4 0.5 0.6 0.7 0.8 0.9 10
0.5
1
1.5
2
2.5
3
3.5
4
4.5
5
Normalized Received Power
Den
sity
Measured DataNormal fitLognormalGamma
Figure 147: PDF Left ankle to right hip, running at 820 MHz
Submission Page 106 Miniutti et. al., NICTA
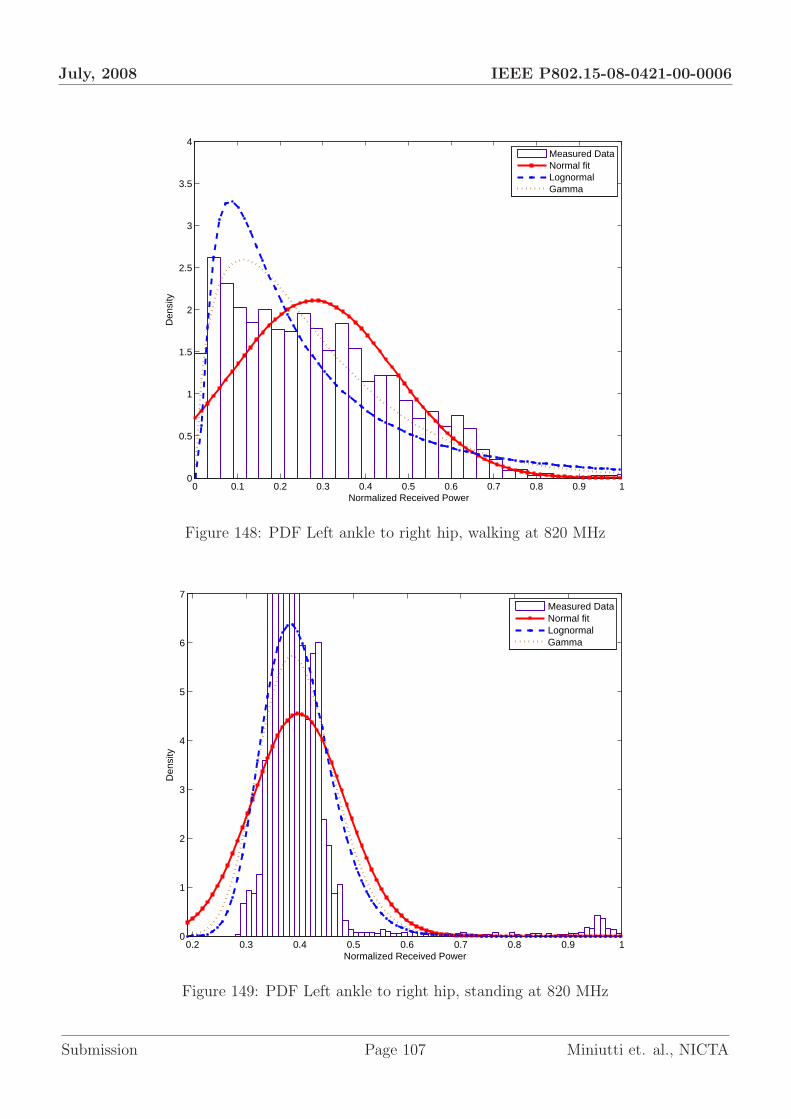
July, 2008 IEEE P802.15-08-0421-00-0006
0 0.1 0.2 0.3 0.4 0.5 0.6 0.7 0.8 0.9 10
0.5
1
1.5
2
2.5
3
3.5
4
Normalized Received Power
Den
sity
Measured DataNormal fitLognormalGamma
Figure 148: PDF Left ankle to right hip, walking at 820 MHz
0.2 0.3 0.4 0.5 0.6 0.7 0.8 0.9 10
1
2
3
4
5
6
7
Normalized Received Power
Den
sity
Measured DataNormal fitLognormalGamma
Figure 149: PDF Left ankle to right hip, standing at 820 MHz
Submission Page 107 Miniutti et. al., NICTA

July, 2008 IEEE P802.15-08-0421-00-0006
0 0.1 0.2 0.3 0.4 0.5 0.6 0.7 0.8 0.9 10
2
4
6
8
10
12
Normalized Received Power
Den
sity
Measured DataNormal fitLognormalGamma
Figure 150: PDF Right ankle to right hip, running at 820 MHz
Submission Page 108 Miniutti et. al., NICTA

July, 2008 IEEE P802.15-08-0421-00-0006
0 0.1 0.2 0.3 0.4 0.5 0.6 0.7 0.8 0.9 10
0.5
1
1.5
2
2.5
3
3.5
4
Normalized Received Power
Den
sity
Measured DataNormal fitLognormalGamma
Figure 151: PDF Right ankle to right hip, walking at 820 MHz
Submission Page 109 Miniutti et. al., NICTA

July, 2008 IEEE P802.15-08-0421-00-0006
0.2 0.3 0.4 0.5 0.6 0.7 0.8 0.9 10
1
2
3
4
5
6
Normalized Received Power
Den
sity
Measured DataNormal fitLognormalGamma
Figure 152: PDF Right ankle to right hip, standing at 820 MHz
0 0.1 0.2 0.3 0.4 0.5 0.6 0.7 0.8 0.9 10
2
4
6
8
10
12
Normalized Received Power
Den
sity
Measured DataNormal fitLognormalGamma
Figure 153: PDF Left wrist to right hip, running at 820 MHz
Submission Page 110 Miniutti et. al., NICTA
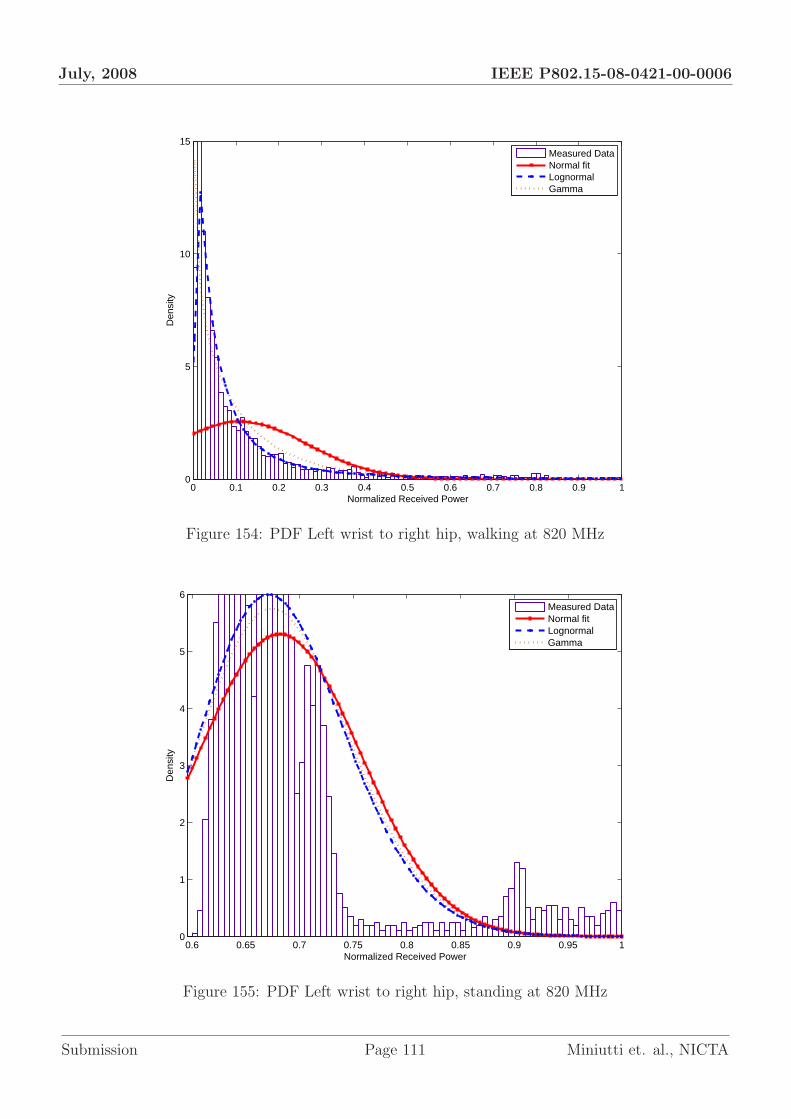
July, 2008 IEEE P802.15-08-0421-00-0006
0 0.1 0.2 0.3 0.4 0.5 0.6 0.7 0.8 0.9 10
5
10
15
Normalized Received Power
Den
sity
Measured DataNormal fitLognormalGamma
Figure 154: PDF Left wrist to right hip, walking at 820 MHz
0.6 0.65 0.7 0.75 0.8 0.85 0.9 0.95 10
1
2
3
4
5
6
Normalized Received Power
Den
sity
Measured DataNormal fitLognormalGamma
Figure 155: PDF Left wrist to right hip, standing at 820 MHz
Submission Page 111 Miniutti et. al., NICTA

July, 2008 IEEE P802.15-08-0421-00-0006
0 0.1 0.2 0.3 0.4 0.5 0.6 0.7 0.8 0.9 10
1
2
3
4
5
6
7
8
9
10
Normalized Received Power
Den
sity
Measured DataNormal fitLognormalGamma
Figure 156: PDF Back to Chest, Running at 820 MHz
0 0.1 0.2 0.3 0.4 0.5 0.6 0.7 0.8 0.9 10
0.5
1
1.5
2
2.5
3
3.5
4
Normalized Received Power
Den
sity
Measured DataNormal fitLognormalGamma
Figure 157: PDF Back to Chest, Walking at 820 MHz
Submission Page 112 Miniutti et. al., NICTA

July, 2008 IEEE P802.15-08-0421-00-0006
0.2 0.3 0.4 0.5 0.6 0.7 0.8 0.9 10
0.5
1
1.5
2
2.5
3
Normalized Received Power
Den
sity
Measured DataNormal fitLognormalGamma
Figure 158: PDF Back to Chest, Standing at 820 MHz
0 0.1 0.2 0.3 0.4 0.5 0.6 0.7 0.8 0.9 10
10
20
30
40
50
60
70
80
90
100
Normalized Received Power
Den
sity
Measured DataNormal fitLognormalGamma
Figure 159: PDF Back to Chest, Running at 820 MHz
Submission Page 113 Miniutti et. al., NICTA

July, 2008 IEEE P802.15-08-0421-00-0006
0 0.1 0.2 0.3 0.4 0.5 0.6 0.7 0.8 0.9 10
5
10
15
Normalized Received Power
Den
sity
Measured DataNormal fitLognormalGamma
Figure 160: PDF Back to Chest, Walking at 820 MHz
0.4 0.5 0.6 0.7 0.8 0.9 10
0.5
1
1.5
2
2.5
3
3.5
4
Normalized Received Power
Den
sity
Measured DataNormal fitLognormalGamma
Figure 161: PDF Back to Chest, Standing at 820 MHz
Submission Page 114 Miniutti et. al., NICTA

July, 2008 IEEE P802.15-08-0421-00-0006
0 0.1 0.2 0.3 0.4 0.5 0.6 0.7 0.8 0.9 10
10
20
30
40
50
Normalized Received Power
Den
sity
Measured DataNormal fitLognormalGamma
Figure 162: PDF Right wrist to right hip, running at 820 MHz
0 0.1 0.2 0.3 0.4 0.5 0.6 0.7 0.8 0.9 10
5
10
15
20
25
Normalized Received Power
Den
sity
Measured DataNormal fitLognormalGamma
Figure 163: PDF Right wrist to right hip, walking at 820 MHz
Submission Page 115 Miniutti et. al., NICTA
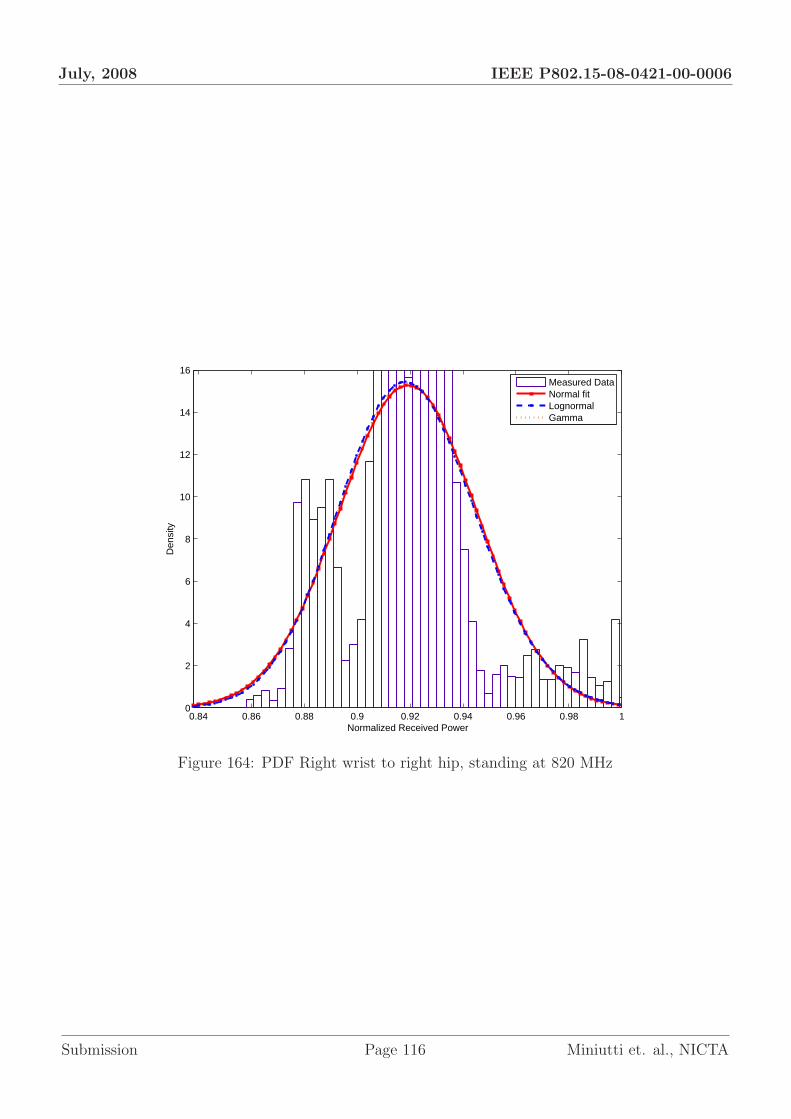
July, 2008 IEEE P802.15-08-0421-00-0006
0.84 0.86 0.88 0.9 0.92 0.94 0.96 0.98 10
2
4
6
8
10
12
14
16
Normalized Received Power
Den
sity
Measured DataNormal fitLognormalGamma
Figure 164: PDF Right wrist to right hip, standing at 820 MHz
Submission Page 116 Miniutti et. al., NICTA
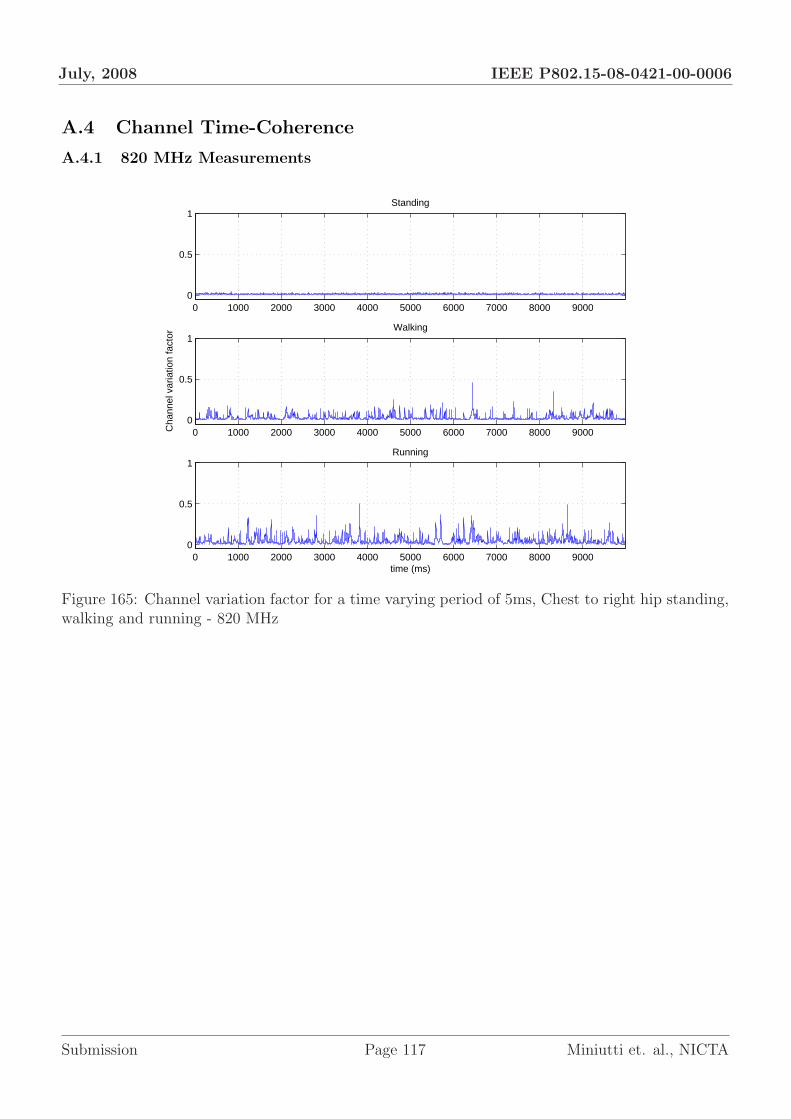
July, 2008 IEEE P802.15-08-0421-00-0006
A.4 Channel Time-Coherence
A.4.1 820 MHz Measurements
0 1000 2000 3000 4000 5000 6000 7000 8000 90000
0.5
1Standing
0 1000 2000 3000 4000 5000 6000 7000 8000 90000
0.5
1
Cha
nnel
var
iatio
n fa
ctor
Walking
0 1000 2000 3000 4000 5000 6000 7000 8000 90000
0.5
1
time (ms)
Running
Figure 165: Channel variation factor for a time varying period of 5ms, Chest to right hip standing,walking and running - 820 MHz
Submission Page 117 Miniutti et. al., NICTA
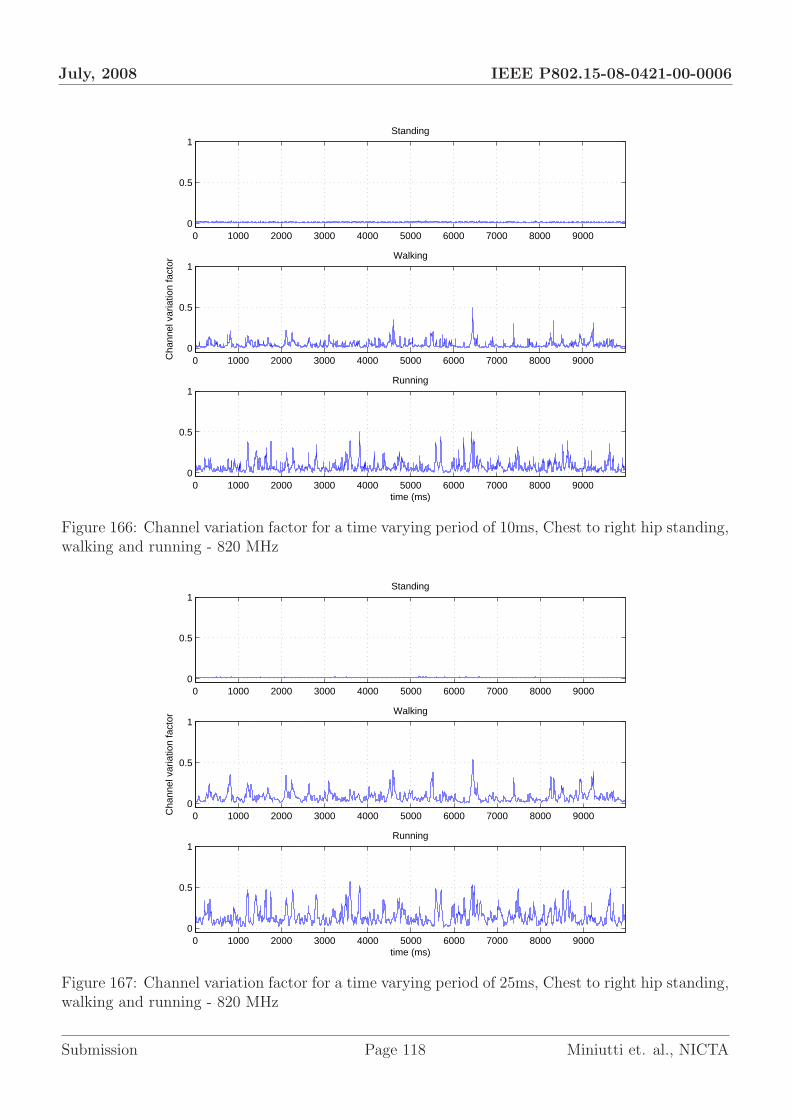
July, 2008 IEEE P802.15-08-0421-00-0006
0 1000 2000 3000 4000 5000 6000 7000 8000 90000
0.5
1Standing
0 1000 2000 3000 4000 5000 6000 7000 8000 90000
0.5
1
Cha
nnel
var
iatio
n fa
ctor
Walking
0 1000 2000 3000 4000 5000 6000 7000 8000 90000
0.5
1
time (ms)
Running
Figure 166: Channel variation factor for a time varying period of 10ms, Chest to right hip standing,walking and running - 820 MHz
0 1000 2000 3000 4000 5000 6000 7000 8000 90000
0.5
1Standing
0 1000 2000 3000 4000 5000 6000 7000 8000 90000
0.5
1
Cha
nnel
var
iatio
n fa
ctor
Walking
0 1000 2000 3000 4000 5000 6000 7000 8000 90000
0.5
1
time (ms)
Running
Figure 167: Channel variation factor for a time varying period of 25ms, Chest to right hip standing,walking and running - 820 MHz
Submission Page 118 Miniutti et. al., NICTA
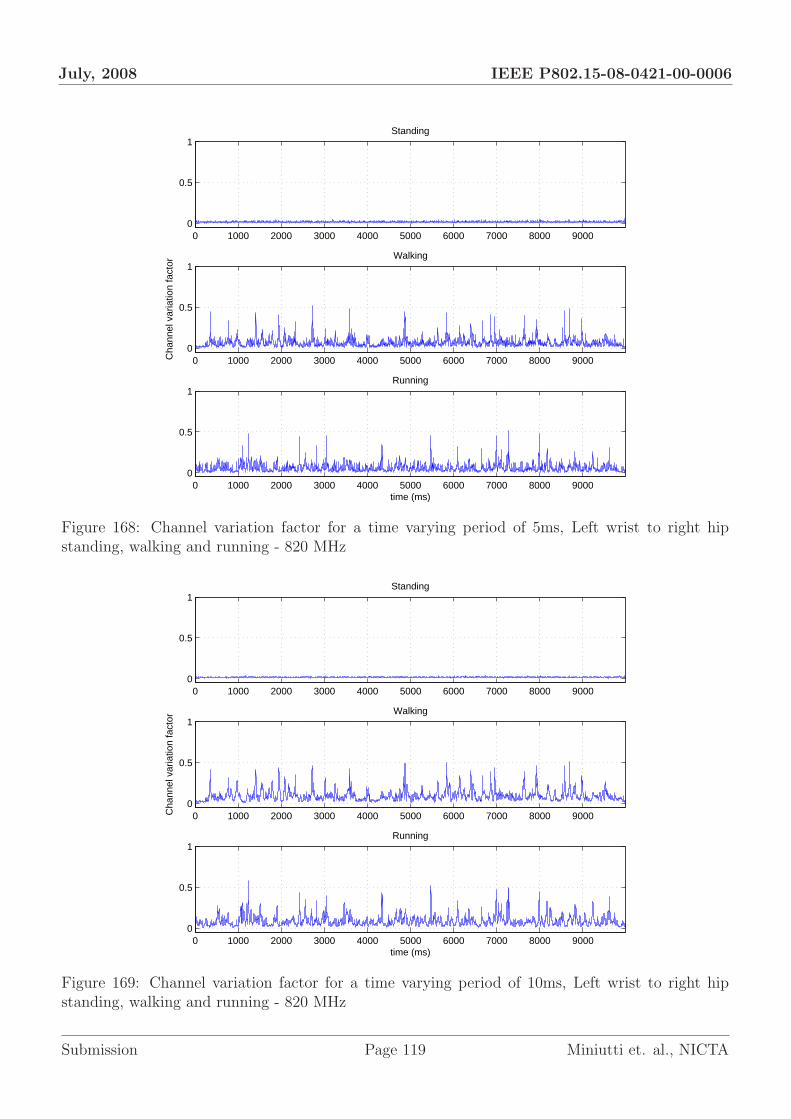
July, 2008 IEEE P802.15-08-0421-00-0006
0 1000 2000 3000 4000 5000 6000 7000 8000 90000
0.5
1Standing
0 1000 2000 3000 4000 5000 6000 7000 8000 90000
0.5
1
Cha
nnel
var
iatio
n fa
ctor
Walking
0 1000 2000 3000 4000 5000 6000 7000 8000 90000
0.5
1
time (ms)
Running
Figure 168: Channel variation factor for a time varying period of 5ms, Left wrist to right hipstanding, walking and running - 820 MHz
0 1000 2000 3000 4000 5000 6000 7000 8000 90000
0.5
1Standing
0 1000 2000 3000 4000 5000 6000 7000 8000 90000
0.5
1
Cha
nnel
var
iatio
n fa
ctor
Walking
0 1000 2000 3000 4000 5000 6000 7000 8000 90000
0.5
1
time (ms)
Running
Figure 169: Channel variation factor for a time varying period of 10ms, Left wrist to right hipstanding, walking and running - 820 MHz
Submission Page 119 Miniutti et. al., NICTA
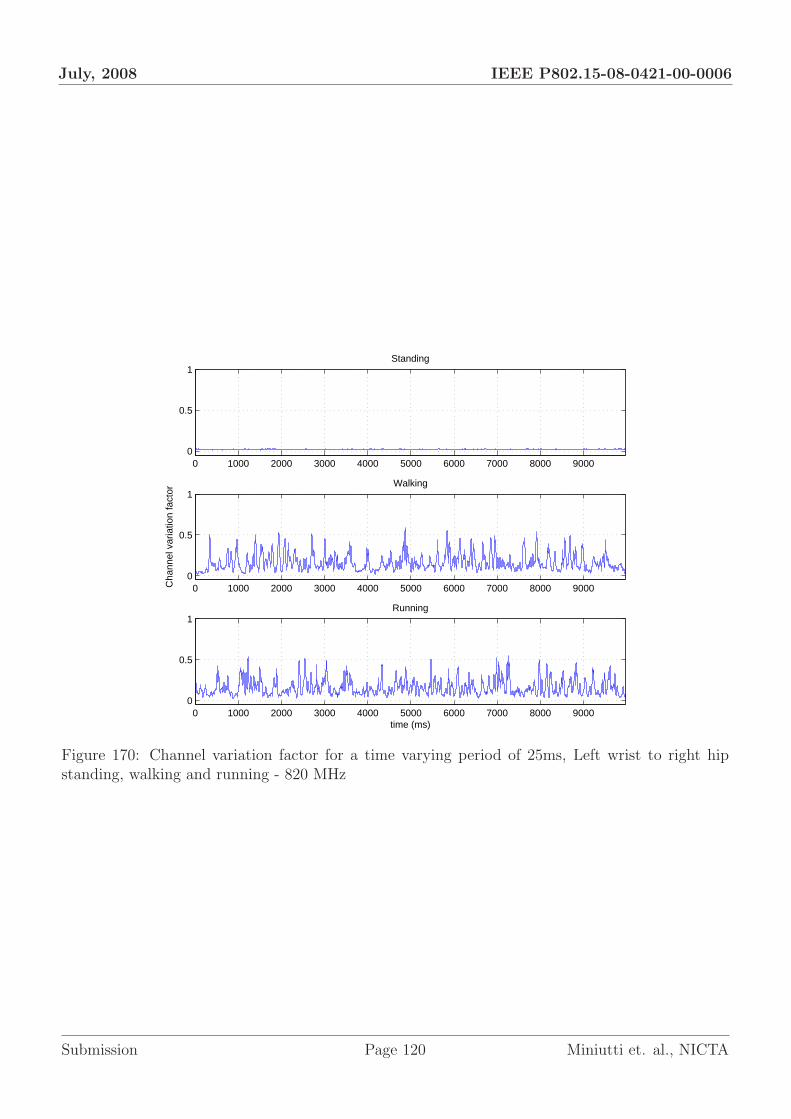
July, 2008 IEEE P802.15-08-0421-00-0006
0 1000 2000 3000 4000 5000 6000 7000 8000 90000
0.5
1Standing
0 1000 2000 3000 4000 5000 6000 7000 8000 90000
0.5
1
Cha
nnel
var
iatio
n fa
ctor
Walking
0 1000 2000 3000 4000 5000 6000 7000 8000 90000
0.5
1
time (ms)
Running
Figure 170: Channel variation factor for a time varying period of 25ms, Left wrist to right hipstanding, walking and running - 820 MHz
Submission Page 120 Miniutti et. al., NICTA
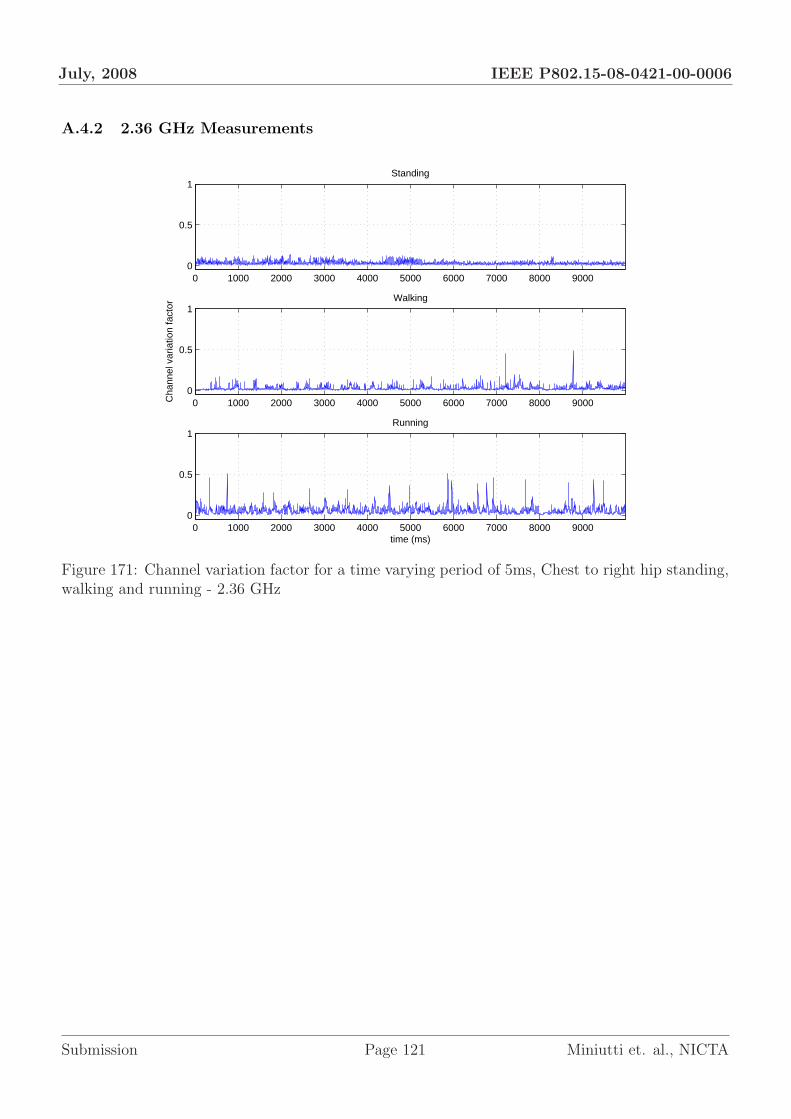
July, 2008 IEEE P802.15-08-0421-00-0006
A.4.2 2.36 GHz Measurements
0 1000 2000 3000 4000 5000 6000 7000 8000 90000
0.5
1Standing
0 1000 2000 3000 4000 5000 6000 7000 8000 90000
0.5
1
Cha
nnel
var
iatio
n fa
ctor
Walking
0 1000 2000 3000 4000 5000 6000 7000 8000 90000
0.5
1
time (ms)
Running
Figure 171: Channel variation factor for a time varying period of 5ms, Chest to right hip standing,walking and running - 2.36 GHz
Submission Page 121 Miniutti et. al., NICTA
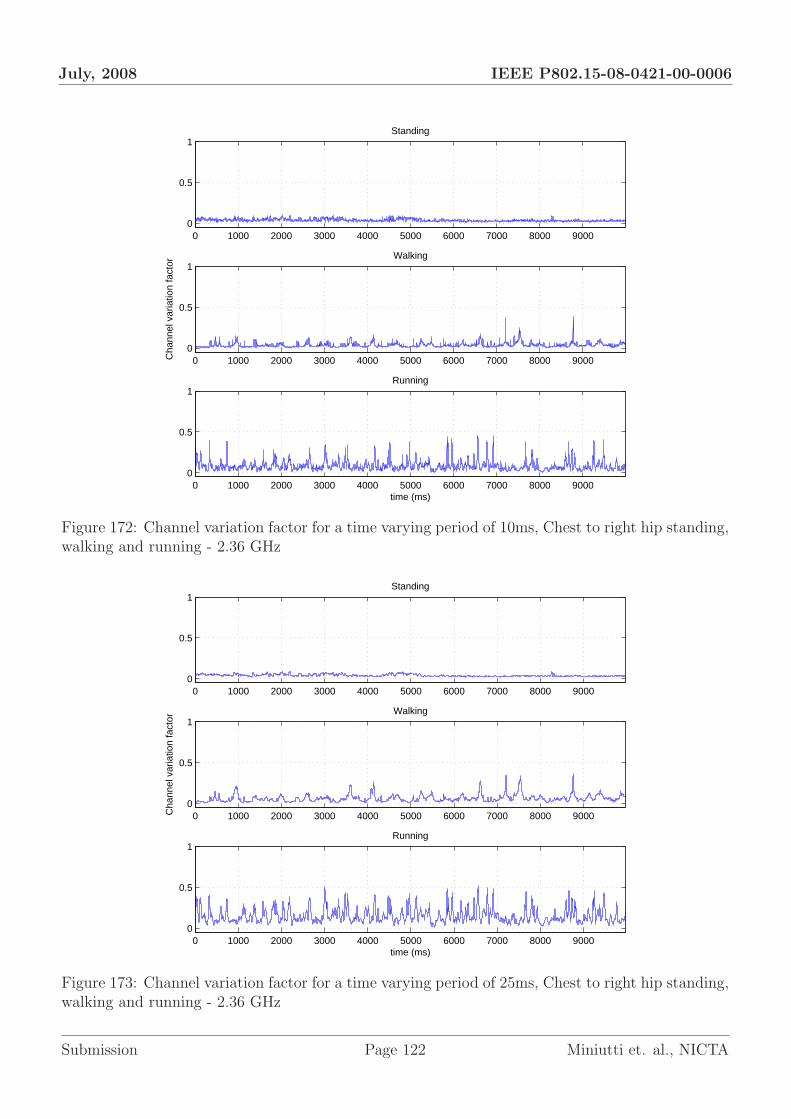
July, 2008 IEEE P802.15-08-0421-00-0006
0 1000 2000 3000 4000 5000 6000 7000 8000 90000
0.5
1Standing
0 1000 2000 3000 4000 5000 6000 7000 8000 90000
0.5
1
Cha
nnel
var
iatio
n fa
ctor
Walking
0 1000 2000 3000 4000 5000 6000 7000 8000 90000
0.5
1
time (ms)
Running
Figure 172: Channel variation factor for a time varying period of 10ms, Chest to right hip standing,walking and running - 2.36 GHz
0 1000 2000 3000 4000 5000 6000 7000 8000 90000
0.5
1Standing
0 1000 2000 3000 4000 5000 6000 7000 8000 90000
0.5
1
Cha
nnel
var
iatio
n fa
ctor
Walking
0 1000 2000 3000 4000 5000 6000 7000 8000 90000
0.5
1
time (ms)
Running
Figure 173: Channel variation factor for a time varying period of 25ms, Chest to right hip standing,walking and running - 2.36 GHz
Submission Page 122 Miniutti et. al., NICTA
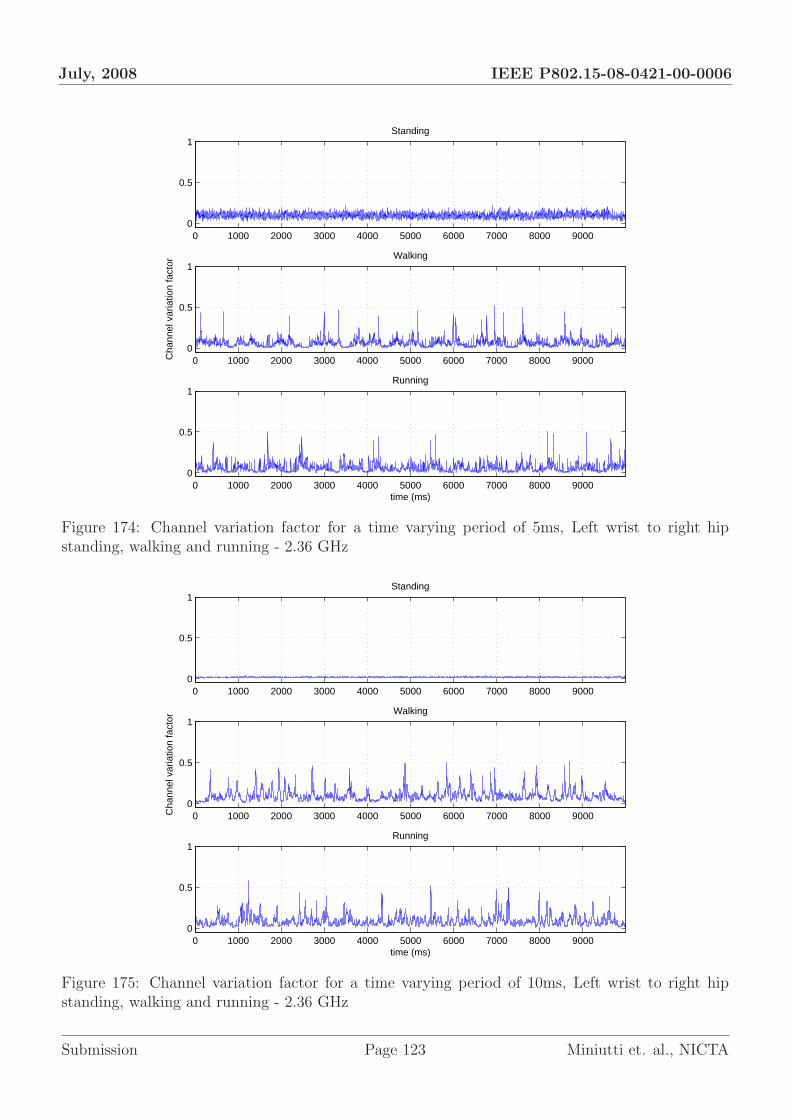
July, 2008 IEEE P802.15-08-0421-00-0006
0 1000 2000 3000 4000 5000 6000 7000 8000 90000
0.5
1Standing
0 1000 2000 3000 4000 5000 6000 7000 8000 90000
0.5
1
Cha
nnel
var
iatio
n fa
ctor
Walking
0 1000 2000 3000 4000 5000 6000 7000 8000 90000
0.5
1
time (ms)
Running
Figure 174: Channel variation factor for a time varying period of 5ms, Left wrist to right hipstanding, walking and running - 2.36 GHz
0 1000 2000 3000 4000 5000 6000 7000 8000 90000
0.5
1Standing
0 1000 2000 3000 4000 5000 6000 7000 8000 90000
0.5
1
Cha
nnel
var
iatio
n fa
ctor
Walking
0 1000 2000 3000 4000 5000 6000 7000 8000 90000
0.5
1
time (ms)
Running
Figure 175: Channel variation factor for a time varying period of 10ms, Left wrist to right hipstanding, walking and running - 2.36 GHz
Submission Page 123 Miniutti et. al., NICTA

July, 2008 IEEE P802.15-08-0421-00-0006
0 1000 2000 3000 4000 5000 6000 7000 8000 90000
0.5
1Standing
0 1000 2000 3000 4000 5000 6000 7000 8000 90000
0.5
1
Cha
nnel
var
iatio
n fa
ctor
Walking
0 1000 2000 3000 4000 5000 6000 7000 8000 90000
0.5
1
time (ms)
Running
Figure 176: Channel variation factor for a time varying period of 25ms, Left wrist to right hipstanding, walking and running - 2.36 GHz
Submission Page 124 Miniutti et. al., NICTA
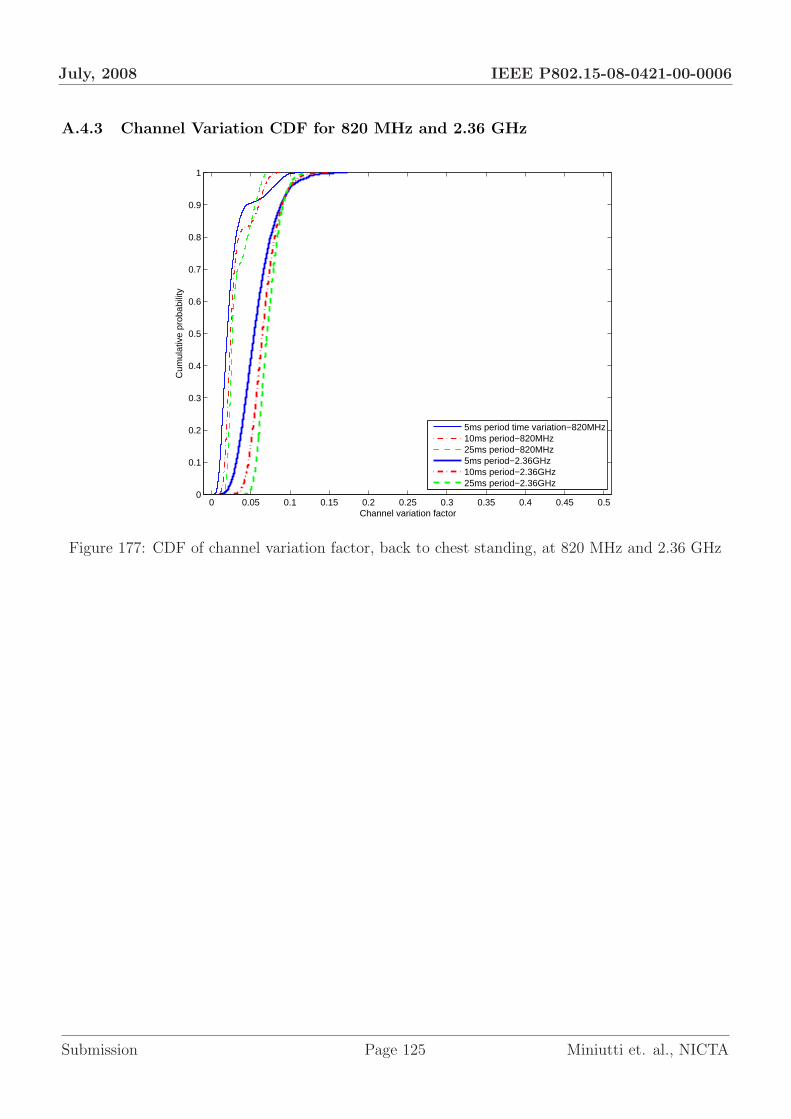
July, 2008 IEEE P802.15-08-0421-00-0006
A.4.3 Channel Variation CDF for 820 MHz and 2.36 GHz
0 0.05 0.1 0.15 0.2 0.25 0.3 0.35 0.4 0.45 0.50
0.1
0.2
0.3
0.4
0.5
0.6
0.7
0.8
0.9
1
Channel variation factor
Cum
ulat
ive
prob
abili
ty
5ms period time variation−820MHz10ms period−820MHz25ms period−820MHz5ms period−2.36GHz10ms period−2.36GHz25ms period−2.36GHz
Figure 177: CDF of channel variation factor, back to chest standing, at 820 MHz and 2.36 GHz
Submission Page 125 Miniutti et. al., NICTA
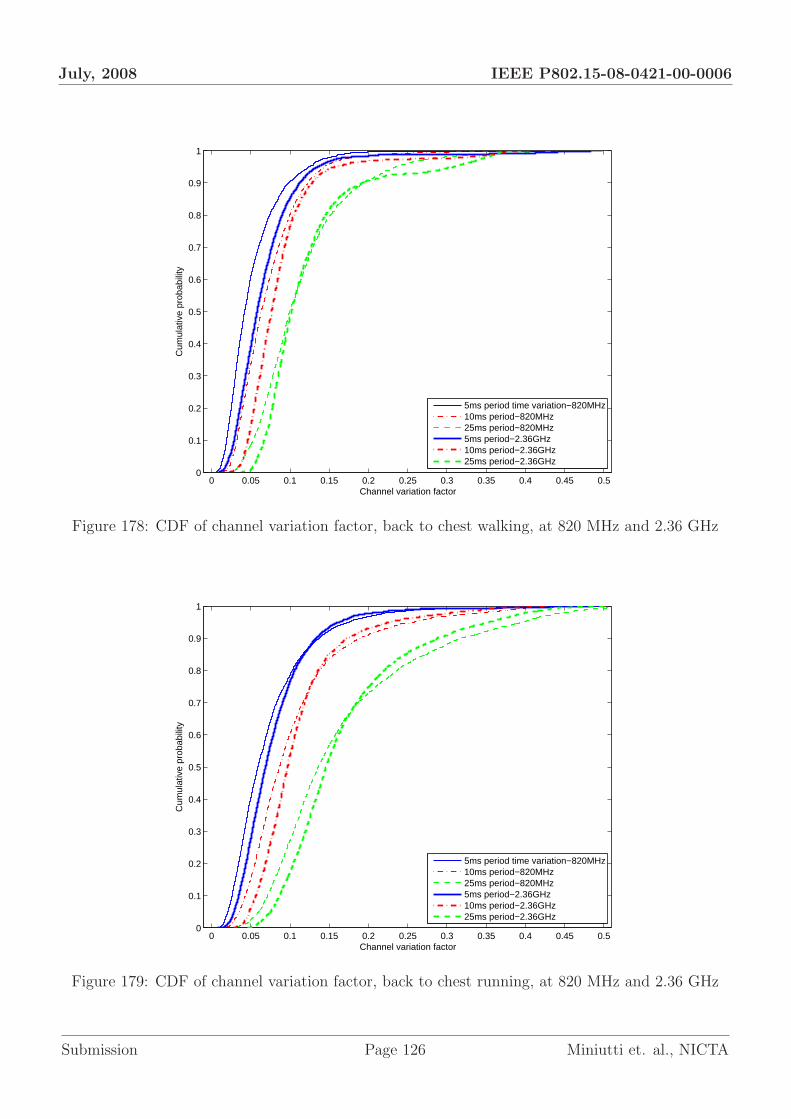
July, 2008 IEEE P802.15-08-0421-00-0006
0 0.05 0.1 0.15 0.2 0.25 0.3 0.35 0.4 0.45 0.50
0.1
0.2
0.3
0.4
0.5
0.6
0.7
0.8
0.9
1
Channel variation factor
Cum
ulat
ive
prob
abili
ty
5ms period time variation−820MHz10ms period−820MHz25ms period−820MHz5ms period−2.36GHz10ms period−2.36GHz25ms period−2.36GHz
Figure 178: CDF of channel variation factor, back to chest walking, at 820 MHz and 2.36 GHz
0 0.05 0.1 0.15 0.2 0.25 0.3 0.35 0.4 0.45 0.50
0.1
0.2
0.3
0.4
0.5
0.6
0.7
0.8
0.9
1
Channel variation factor
Cum
ulat
ive
prob
abili
ty
5ms period time variation−820MHz10ms period−820MHz25ms period−820MHz5ms period−2.36GHz10ms period−2.36GHz25ms period−2.36GHz
Figure 179: CDF of channel variation factor, back to chest running, at 820 MHz and 2.36 GHz
Submission Page 126 Miniutti et. al., NICTA
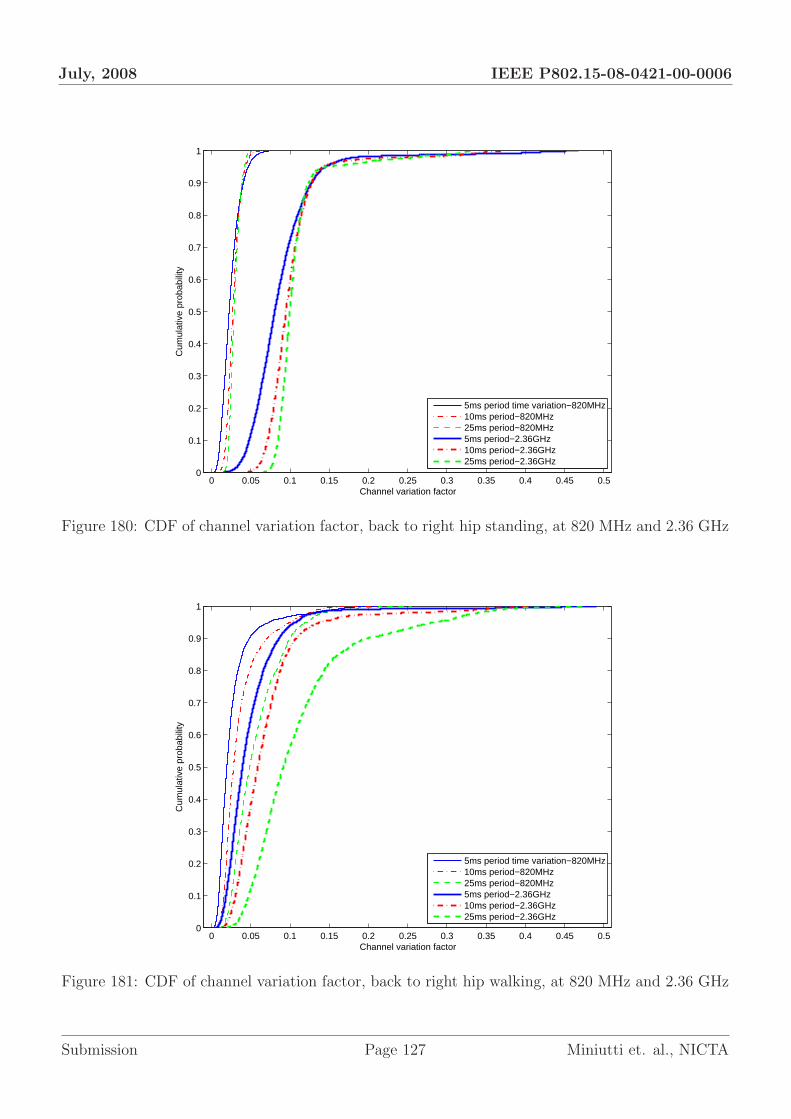
July, 2008 IEEE P802.15-08-0421-00-0006
0 0.05 0.1 0.15 0.2 0.25 0.3 0.35 0.4 0.45 0.50
0.1
0.2
0.3
0.4
0.5
0.6
0.7
0.8
0.9
1
Channel variation factor
Cum
ulat
ive
prob
abili
ty
5ms period time variation−820MHz10ms period−820MHz25ms period−820MHz5ms period−2.36GHz10ms period−2.36GHz25ms period−2.36GHz
Figure 180: CDF of channel variation factor, back to right hip standing, at 820 MHz and 2.36 GHz
0 0.05 0.1 0.15 0.2 0.25 0.3 0.35 0.4 0.45 0.50
0.1
0.2
0.3
0.4
0.5
0.6
0.7
0.8
0.9
1
Channel variation factor
Cum
ulat
ive
prob
abili
ty
5ms period time variation−820MHz10ms period−820MHz25ms period−820MHz5ms period−2.36GHz10ms period−2.36GHz25ms period−2.36GHz
Figure 181: CDF of channel variation factor, back to right hip walking, at 820 MHz and 2.36 GHz
Submission Page 127 Miniutti et. al., NICTA

July, 2008 IEEE P802.15-08-0421-00-0006
0 0.05 0.1 0.15 0.2 0.25 0.3 0.35 0.4 0.45 0.50
0.1
0.2
0.3
0.4
0.5
0.6
0.7
0.8
0.9
1
Channel variation factor
Cum
ulat
ive
prob
abili
ty
5ms period time variation−820MHz10ms period−820MHz25ms period−820MHz5ms period−2.36GHz10ms period−2.36GHz25ms period−2.36GHz
Figure 182: CDF of channel variation factor, back to right hip running, at 820 MHz and 2.36 GHz
0 0.05 0.1 0.15 0.2 0.25 0.3 0.35 0.4 0.45 0.50
0.1
0.2
0.3
0.4
0.5
0.6
0.7
0.8
0.9
1
Channel variation factor
Cum
ulat
ive
prob
abili
ty
5ms period time variation−820MHz10ms period−820MHz25ms period−820MHz5ms period−2.36GHz10ms period−2.36GHz25ms period−2.36GHz
Figure 183: CDF of channel variation factor, chest to right hip standing, at 820 MHz and 2.36 GHz
Submission Page 128 Miniutti et. al., NICTA

July, 2008 IEEE P802.15-08-0421-00-0006
0 0.05 0.1 0.15 0.2 0.25 0.3 0.35 0.4 0.45 0.50
0.1
0.2
0.3
0.4
0.5
0.6
0.7
0.8
0.9
1
Channel variation factor
Cum
ulat
ive
prob
abili
ty
5ms period time variation−820MHz10ms period−820MHz25ms period−820MHz5ms period−2.36GHz10ms period−2.36GHz25ms period−2.36GHz
Figure 184: CDF of channel variation factor, chest to right hip walking, at 820 MHz and 2.36 GHz
0 0.05 0.1 0.15 0.2 0.25 0.3 0.35 0.4 0.45 0.50
0.1
0.2
0.3
0.4
0.5
0.6
0.7
0.8
0.9
1
Channel variation factor
Cum
ulat
ive
prob
abili
ty
5ms period time variation−820MHz10ms period−820MHz25ms period−820MHz5ms period−2.36GHz10ms period−2.36GHz25ms period−2.36GHz
Figure 185: CDF of channel variation factor, chest to right hip running, at 820 MHz and 2.36 GHz
Submission Page 129 Miniutti et. al., NICTA

July, 2008 IEEE P802.15-08-0421-00-0006
0 0.05 0.1 0.15 0.2 0.25 0.3 0.35 0.4 0.45 0.50
0.1
0.2
0.3
0.4
0.5
0.6
0.7
0.8
0.9
1
Channel variation factor
Cum
ulat
ive
prob
abili
ty
5ms period time variation−820MHz10ms period−820MHz25ms period−820MHz5ms period−2.36GHz10ms period−2.36GHz25ms period−2.36GHz
Figure 186: CDF of channel variation factor, left ankle to right hip standing, at 820 MHz and2.36 GHz
0 0.05 0.1 0.15 0.2 0.25 0.3 0.35 0.4 0.45 0.50
0.1
0.2
0.3
0.4
0.5
0.6
0.7
0.8
0.9
1
Channel variation factor
Cum
ulat
ive
prob
abili
ty
5ms period time variation−820MHz10ms period−820MHz25ms period−820MHz5ms period−2.36GHz10ms period−2.36GHz25ms period−2.36GHz
Figure 187: CDF of channel variation factor, left ankle to right hip walking, at 820 MHz and2.36 GHz
Submission Page 130 Miniutti et. al., NICTA

July, 2008 IEEE P802.15-08-0421-00-0006
0 0.05 0.1 0.15 0.2 0.25 0.3 0.35 0.4 0.45 0.50
0.1
0.2
0.3
0.4
0.5
0.6
0.7
0.8
0.9
1
Channel variation factor
Cum
ulat
ive
prob
abili
ty
5ms period time variation−820MHz10ms period−820MHz25ms period−820MHz5ms period−2.36GHz10ms period−2.36GHz25ms period−2.36GHz
Figure 188: CDF of channel variation factor, left ankle to right hip running, at 820 MHz and2.36 GHz
0 0.05 0.1 0.15 0.2 0.25 0.3 0.35 0.4 0.45 0.50
0.1
0.2
0.3
0.4
0.5
0.6
0.7
0.8
0.9
1
Channel variation factor
Cum
ulat
ive
prob
abili
ty
5ms period time variation−820MHz10ms period−820MHz25ms period−820MHz5ms period−2.36GHz10ms period−2.36GHz25ms period−2.36GHz
Figure 189: CDF of channel variation factor, left wrist to right hip standing, at 820 MHz and2.36 GHz
Submission Page 131 Miniutti et. al., NICTA

July, 2008 IEEE P802.15-08-0421-00-0006
0 0.05 0.1 0.15 0.2 0.25 0.3 0.35 0.4 0.45 0.50
0.1
0.2
0.3
0.4
0.5
0.6
0.7
0.8
0.9
1
Channel variation factor
Cum
ulat
ive
prob
abili
ty
5ms period time variation−820MHz10ms period−820MHz25ms period−820MHz5ms period−2.36GHz10ms period−2.36GHz25ms period−2.36GHz
Figure 190: CDF of channel variation factor, left wrist to right hip walking, at 820 MHz and2.36 GHz
0 0.05 0.1 0.15 0.2 0.25 0.3 0.35 0.4 0.45 0.50
0.1
0.2
0.3
0.4
0.5
0.6
0.7
0.8
0.9
1
Channel variation factor
Cum
ulat
ive
prob
abili
ty
5ms period time variation−820MHz10ms period−820MHz25ms period−820MHz5ms period−2.36GHz10ms period−2.36GHz25ms period−2.36GHz
Figure 191: CDF of channel variation factor, left wrist to right hip running, at 820 MHz and2.36 GHz
Submission Page 132 Miniutti et. al., NICTA

July, 2008 IEEE P802.15-08-0421-00-0006
0 0.05 0.1 0.15 0.2 0.25 0.3 0.35 0.4 0.45 0.50
0.1
0.2
0.3
0.4
0.5
0.6
0.7
0.8
0.9
1
Channel variation factor
Cum
ulat
ive
prob
abili
ty
5ms period time variation−820MHz10ms period−820MHz25ms period−820MHz5ms period−2.36GHz10ms period−2.36GHz25ms period−2.36GHz
Figure 192: CDF of channel variation factor, right ankle to chest standing, at 820 MHz and2.36 GHz
0 0.05 0.1 0.15 0.2 0.25 0.3 0.35 0.4 0.45 0.50
0.1
0.2
0.3
0.4
0.5
0.6
0.7
0.8
0.9
1
Channel variation factor
Cum
ulat
ive
prob
abili
ty
5ms period time variation−820MHz10ms period−820MHz25ms period−820MHz5ms period−2.36GHz10ms period−2.36GHz25ms period−2.36GHz
Figure 193: CDF of channel variation factor, right ankle to chest walking, at 820 MHz and 2.36 GHz
Submission Page 133 Miniutti et. al., NICTA
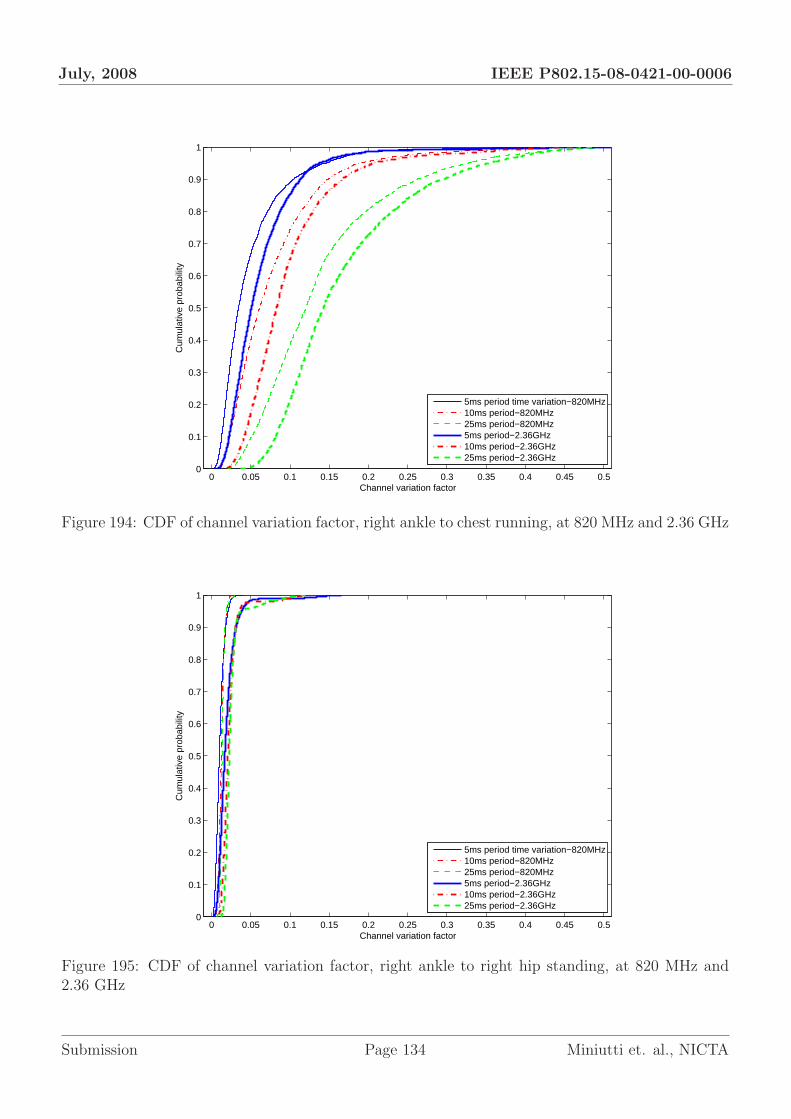
July, 2008 IEEE P802.15-08-0421-00-0006
0 0.05 0.1 0.15 0.2 0.25 0.3 0.35 0.4 0.45 0.50
0.1
0.2
0.3
0.4
0.5
0.6
0.7
0.8
0.9
1
Channel variation factor
Cum
ulat
ive
prob
abili
ty
5ms period time variation−820MHz10ms period−820MHz25ms period−820MHz5ms period−2.36GHz10ms period−2.36GHz25ms period−2.36GHz
Figure 194: CDF of channel variation factor, right ankle to chest running, at 820 MHz and 2.36 GHz
0 0.05 0.1 0.15 0.2 0.25 0.3 0.35 0.4 0.45 0.50
0.1
0.2
0.3
0.4
0.5
0.6
0.7
0.8
0.9
1
Channel variation factor
Cum
ulat
ive
prob
abili
ty
5ms period time variation−820MHz10ms period−820MHz25ms period−820MHz5ms period−2.36GHz10ms period−2.36GHz25ms period−2.36GHz
Figure 195: CDF of channel variation factor, right ankle to right hip standing, at 820 MHz and2.36 GHz
Submission Page 134 Miniutti et. al., NICTA

July, 2008 IEEE P802.15-08-0421-00-0006
0 0.05 0.1 0.15 0.2 0.25 0.3 0.35 0.4 0.45 0.50
0.1
0.2
0.3
0.4
0.5
0.6
0.7
0.8
0.9
1
Channel variation factor
Cum
ulat
ive
prob
abili
ty
5ms period time variation−820MHz10ms period−820MHz25ms period−820MHz5ms period−2.36GHz10ms period−2.36GHz25ms period−2.36GHz
Figure 196: CDF of channel variation factor, right ankle to right hip walking, at 820 MHz and2.36 GHz
0 0.05 0.1 0.15 0.2 0.25 0.3 0.35 0.4 0.45 0.50
0.1
0.2
0.3
0.4
0.5
0.6
0.7
0.8
0.9
1
Channel variation factor
Cum
ulat
ive
prob
abili
ty
5ms period time variation−820MHz10ms period−820MHz25ms period−820MHz5ms period−2.36GHz10ms period−2.36GHz25ms period−2.36GHz
Figure 197: CDF of channel variation factor, right ankle to right hip running, at 820 MHz and2.36 GHz
Submission Page 135 Miniutti et. al., NICTA

July, 2008 IEEE P802.15-08-0421-00-0006
0 0.05 0.1 0.15 0.2 0.25 0.3 0.35 0.4 0.45 0.50
0.1
0.2
0.3
0.4
0.5
0.6
0.7
0.8
0.9
1
Channel variation factor
Cum
ulat
ive
prob
abili
ty
5ms period time variation−820MHz10ms period−820MHz25ms period−820MHz5ms period−2.36GHz10ms period−2.36GHz25ms period−2.36GHz
Figure 198: CDF of channel variation factor, right wrist to chest standing, at 820 MHz and 2.36 GHz
0 0.05 0.1 0.15 0.2 0.25 0.3 0.35 0.4 0.45 0.50
0.1
0.2
0.3
0.4
0.5
0.6
0.7
0.8
0.9
1
Channel variation factor
Cum
ulat
ive
prob
abili
ty
5ms period time variation−820MHz10ms period−820MHz25ms period−820MHz5ms period−2.36GHz10ms period−2.36GHz25ms period−2.36GHz
Figure 199: CDF of channel variation factor, right wrist to chest walking, at 820 MHz and 2.36 GHz
Submission Page 136 Miniutti et. al., NICTA

July, 2008 IEEE P802.15-08-0421-00-0006
0 0.05 0.1 0.15 0.2 0.25 0.3 0.35 0.4 0.45 0.50
0.1
0.2
0.3
0.4
0.5
0.6
0.7
0.8
0.9
1
Channel variation factor
Cum
ulat
ive
prob
abili
ty
5ms period time variation−820MHz10ms period−820MHz25ms period−820MHz5ms period−2.36GHz10ms period−2.36GHz25ms period−2.36GHz
Figure 200: CDF of channel variation factor, right wrist to chest running, at 820 MHz and 2.36 GHz
0 0.05 0.1 0.15 0.2 0.25 0.3 0.35 0.4 0.45 0.50
0.1
0.2
0.3
0.4
0.5
0.6
0.7
0.8
0.9
1
Channel variation factor
Cum
ulat
ive
prob
abili
ty
5ms period time variation−820MHz10ms period−820MHz25ms period−820MHz5ms period−2.36GHz10ms period−2.36GHz25ms period−2.36GHz
Figure 201: CDF of channel variation factor, right wrist to right hip standing, at 820 MHz and2.36 GHz
Submission Page 137 Miniutti et. al., NICTA

July, 2008 IEEE P802.15-08-0421-00-0006
0 0.05 0.1 0.15 0.2 0.25 0.3 0.35 0.4 0.45 0.50
0.1
0.2
0.3
0.4
0.5
0.6
0.7
0.8
0.9
1
Channel variation factor
Cum
ulat
ive
prob
abili
ty
5ms period time variation−820MHz10ms period−820MHz25ms period−820MHz5ms period−2.36GHz10ms period−2.36GHz25ms period−2.36GHz
Figure 202: CDF of channel variation factor, right wrist to right hip walking, at 820 MHz and2.36 GHz
0 0.05 0.1 0.15 0.2 0.25 0.3 0.35 0.4 0.45 0.50
0.1
0.2
0.3
0.4
0.5
0.6
0.7
0.8
0.9
1
Channel variation factor
Cum
ulat
ive
prob
abili
ty
5ms period time variation−820MHz10ms period−820MHz25ms period−820MHz5ms period−2.36GHz10ms period−2.36GHz25ms period−2.36GHz
Figure 203: CDF of channel variation factor, right wrist to right hip running, at 820 MHz and2.36 GHz
Submission Page 138 Miniutti et. al., NICTA