Embed Size (px)
Citation preview
8/13/2019 N 564 EKG Interpretation Lecture Version 2013 Stein
http://slidepdf.com/reader/full/n-564-ekg-interpretation-lecture-version-2013-stein 1/189
EKG Interpretation
Kevin Stein, MS, CRNA, APN
8/13/2019 N 564 EKG Interpretation Lecture Version 2013 Stein
http://slidepdf.com/reader/full/n-564-ekg-interpretation-lecture-version-2013-stein 2/189
2004 Anna Story 2
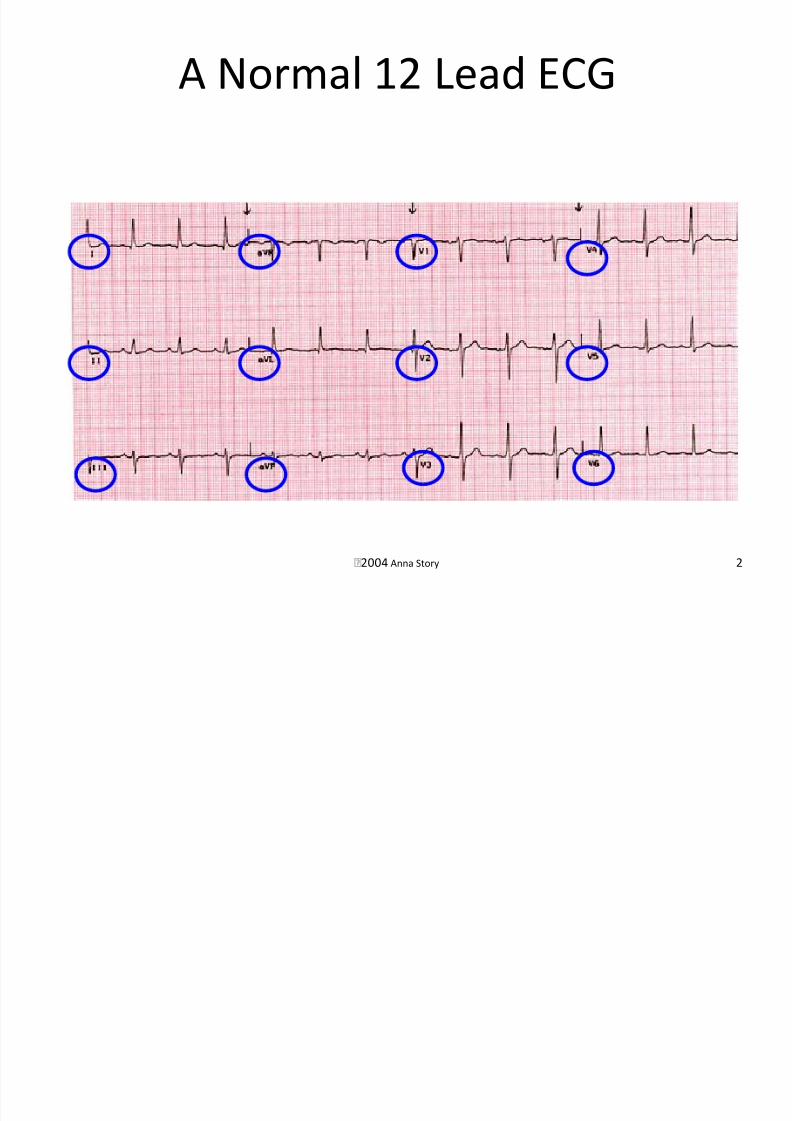
A Normal 12 Lead ECG
8/13/2019 N 564 EKG Interpretation Lecture Version 2013 Stein
http://slidepdf.com/reader/full/n-564-ekg-interpretation-lecture-version-2013-stein 3/189
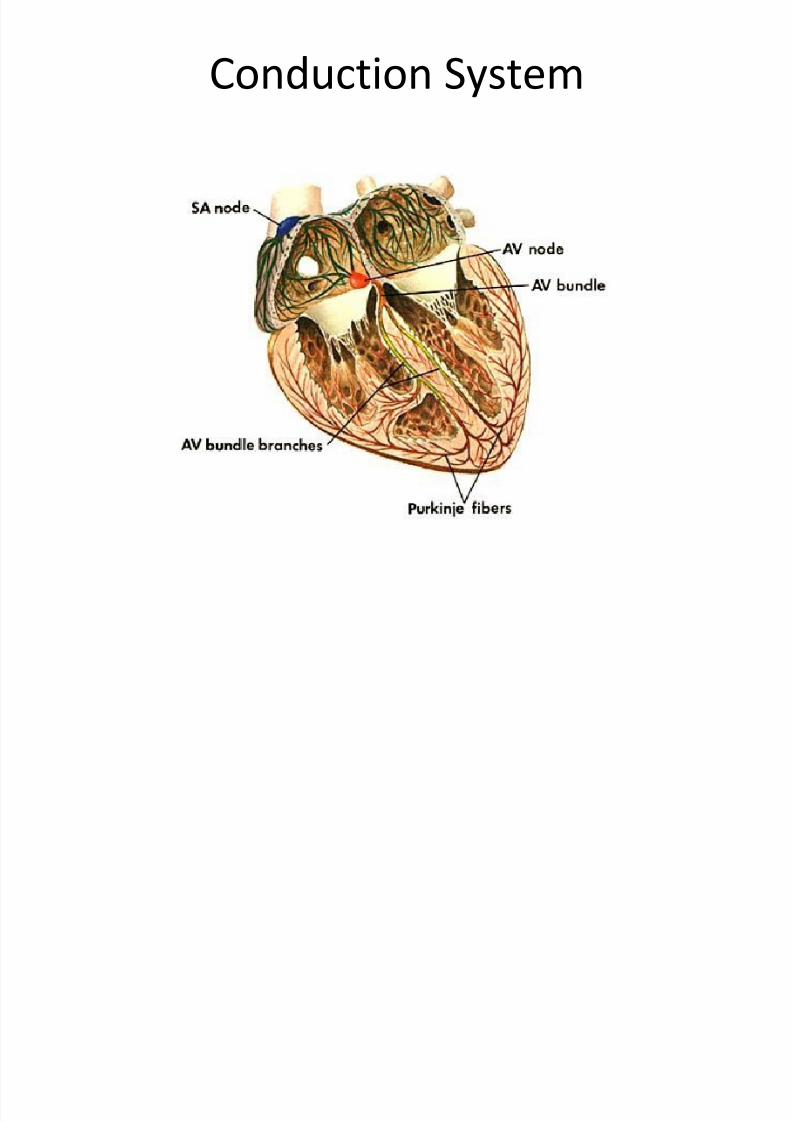
Conduction System

8/13/2019 N 564 EKG Interpretation Lecture Version 2013 Stein
http://slidepdf.com/reader/full/n-564-ekg-interpretation-lecture-version-2013-stein 4/189
8/13/2019 N 564 EKG Interpretation Lecture Version 2013 Stein
http://slidepdf.com/reader/full/n-564-ekg-interpretation-lecture-version-2013-stein 5/189
SA Node
• Heart’s dominate pacemaker
• Responsible for ‘sinus rhythm’ of heart
• Located in upper-posterior wall of RA
• Automaticity – ability to generate pacemakingstimuli
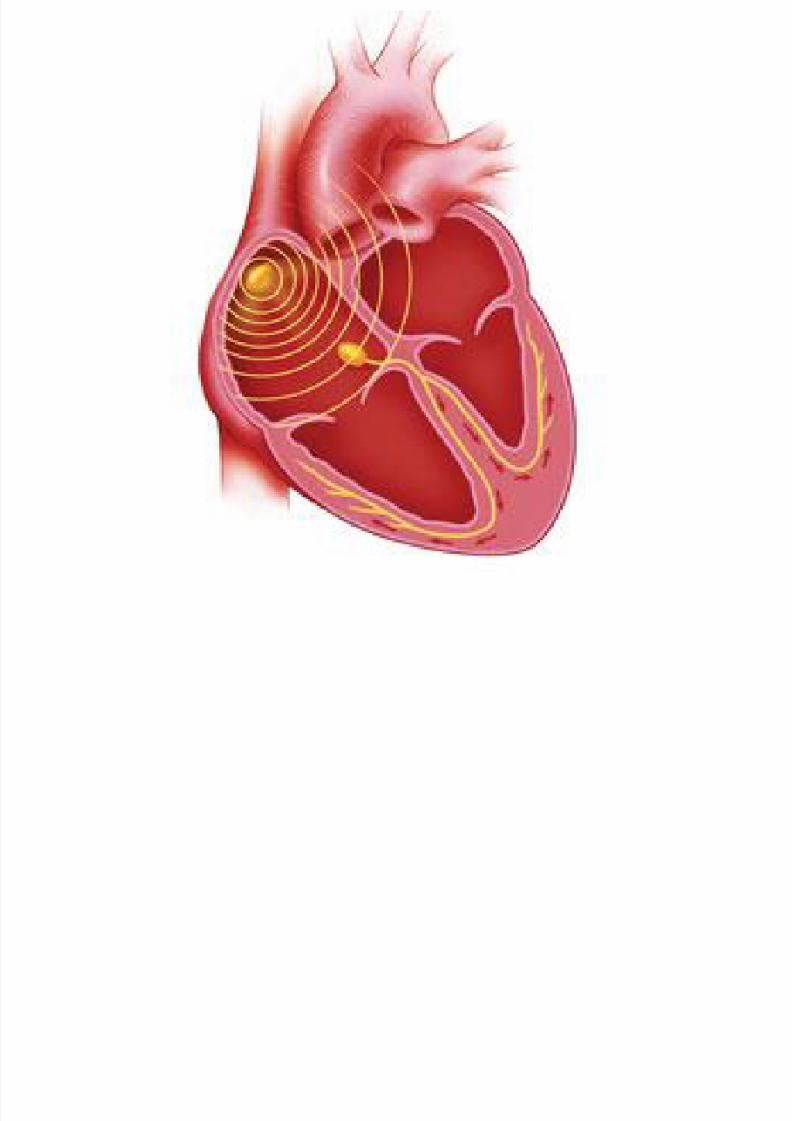
• Depolarization spreads outwards from SA node
like the waves created from a pebble dropped ina lake
• Depolarization of SA node produces p-wave
8/13/2019 N 564 EKG Interpretation Lecture Version 2013 Stein
http://slidepdf.com/reader/full/n-564-ekg-interpretation-lecture-version-2013-stein 6/189
8/13/2019 N 564 EKG Interpretation Lecture Version 2013 Stein
http://slidepdf.com/reader/full/n-564-ekg-interpretation-lecture-version-2013-stein 7/189
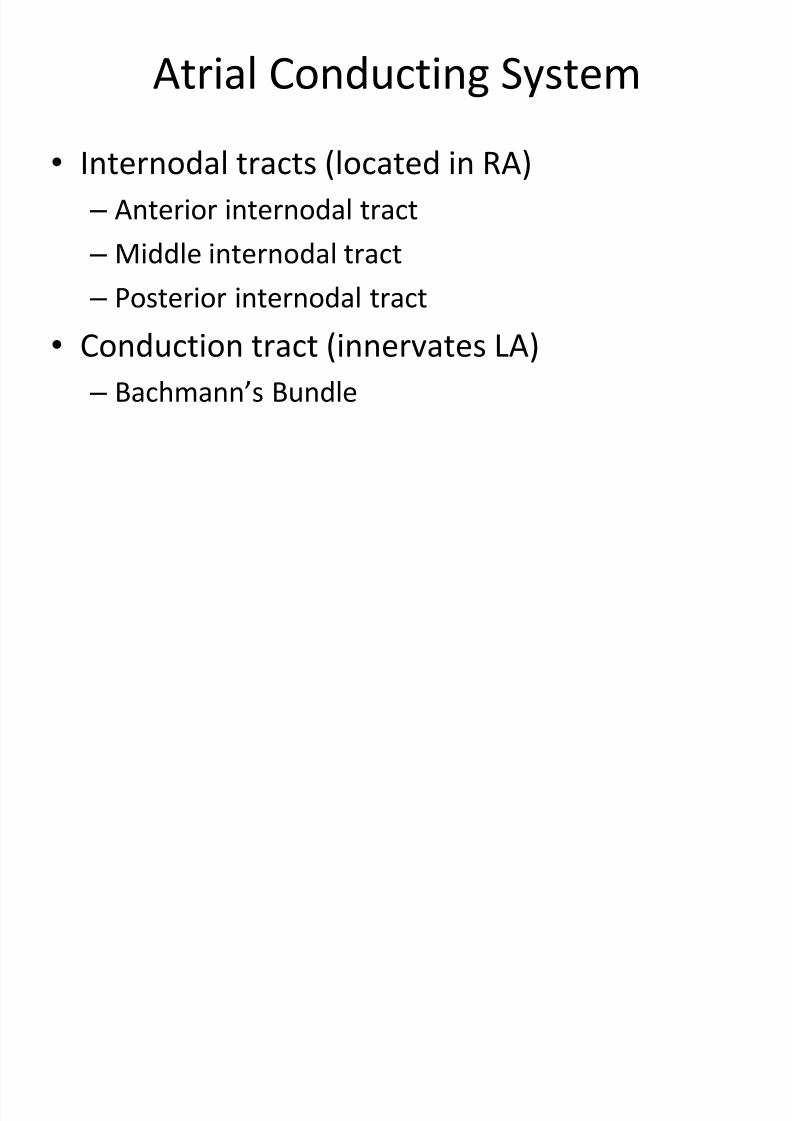
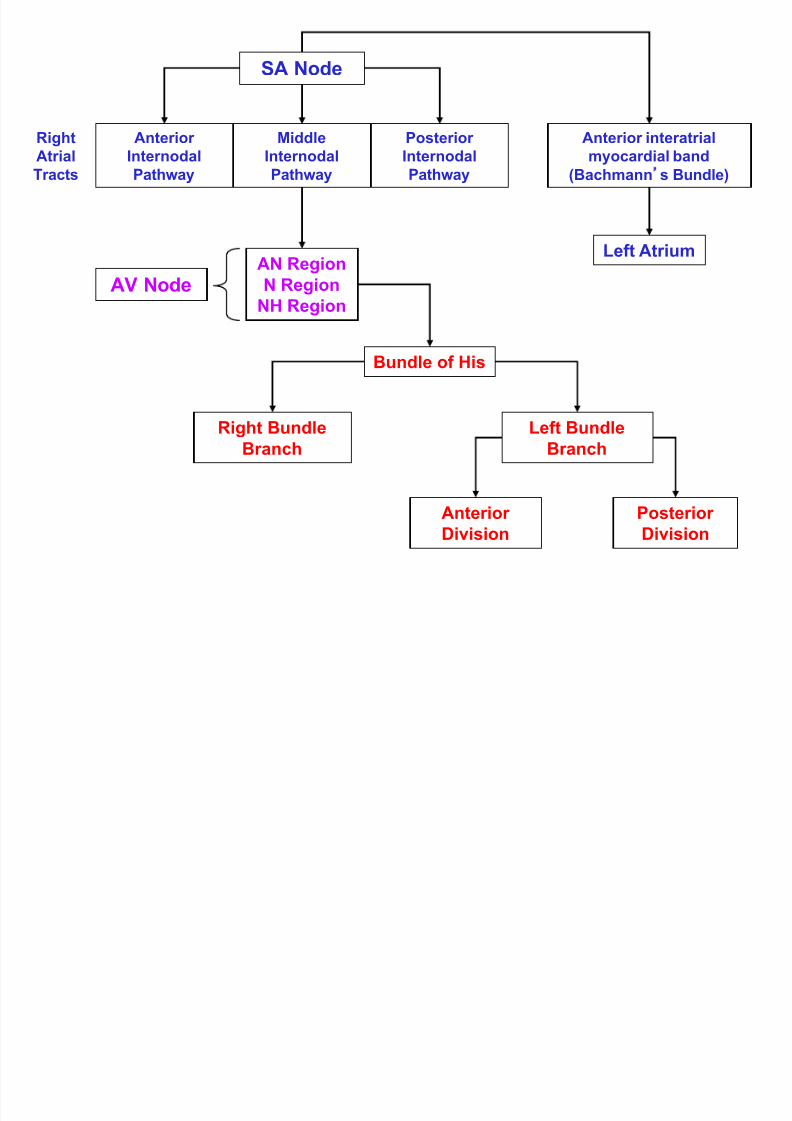
Atrial Conducting System
• Internodal tracts (located in RA)
– Anterior internodal tract
– Middle internodal tract
– Posterior internodal tract
• Conduction tract (innervates LA)
– Bachmann’s Bundle

8/13/2019 N 564 EKG Interpretation Lecture Version 2013 Stein
http://slidepdf.com/reader/full/n-564-ekg-interpretation-lecture-version-2013-stein 8/189
Atrial Conducting System
• Internodal Tracts
– Course from the SA node to the AV node
• Bachmann’s Bundle
– Originates in SA node and distributes
depolarization to LA
• Results in simultaneous contraction of atria
• Depolarization of right and left atrial
myocardium produces p-wave
8/13/2019 N 564 EKG Interpretation Lecture Version 2013 Stein
http://slidepdf.com/reader/full/n-564-ekg-interpretation-lecture-version-2013-stein 9/189
AV Node
• When wave of atrial depolarization enters the
AV node, depolarization slows
– Produces brief pause
• Seen with flat baseline following p-wave on EKG
– Allows time for blood to enter ventricles
– Slowed conduction through AV node carried by
calcium ions

8/13/2019 N 564 EKG Interpretation Lecture Version 2013 Stein
http://slidepdf.com/reader/full/n-564-ekg-interpretation-lecture-version-2013-stein 10/189
8/13/2019 N 564 EKG Interpretation Lecture Version 2013 Stein
http://slidepdf.com/reader/full/n-564-ekg-interpretation-lecture-version-2013-stein 11/189
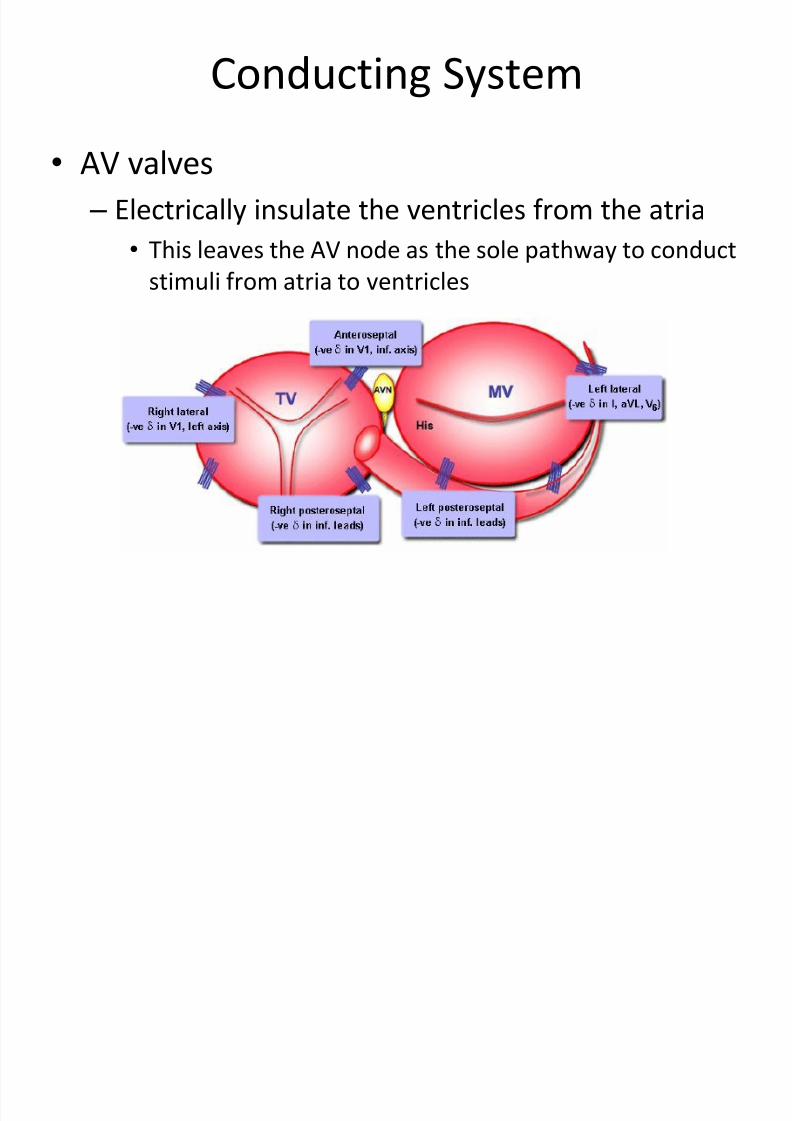
Conducting System
• AV valves
– Electrically insulate the ventricles from the atria
• This leaves the AV node as the sole pathway to conduct
stimuli from atria to ventricles
8/13/2019 N 564 EKG Interpretation Lecture Version 2013 Stein
http://slidepdf.com/reader/full/n-564-ekg-interpretation-lecture-version-2013-stein 12/189
Ventricular Conduction System
• After a slow depolarization through the AV node,depolarization shoots rapidly through the ventricularconduction system
• Ventricular conduction system originates in the Bundle
of His• Bundle of His immediately bifurcates in the
interventricular septum into the RBB and LBB – Ventricular depolarization begins midway down the
interventricular septum, where the LBB produces fine
terminal filaments – The RBB does not produce terminal filaments in the
septum• Left-to-right depolarization of septum
8/13/2019 N 564 EKG Interpretation Lecture Version 2013 Stein
http://slidepdf.com/reader/full/n-564-ekg-interpretation-lecture-version-2013-stein 13/189
8/13/2019 N 564 EKG Interpretation Lecture Version 2013 Stein
http://slidepdf.com/reader/full/n-564-ekg-interpretation-lecture-version-2013-stein 14/189
SA Node
AnteriorInternodal
Pathway
MiddleInternodal
Pathway
PosteriorInternodal
Pathway
Anterior interatrialmyocardial band
(Bachmann s Bundle)
Left AtriumAN Region
N Region
NH Region AV Node
Bundle of His
Right Bundle
Branch
Left Bundle
Branch
Anterior
Division
Posterior
Division
RightAtrial
Tracts

8/13/2019 N 564 EKG Interpretation Lecture Version 2013 Stein
http://slidepdf.com/reader/full/n-564-ekg-interpretation-lecture-version-2013-stein 15/189
P R t
8/13/2019 N 564 EKG Interpretation Lecture Version 2013 Stein
http://slidepdf.com/reader/full/n-564-ekg-interpretation-lecture-version-2013-stein 16/189
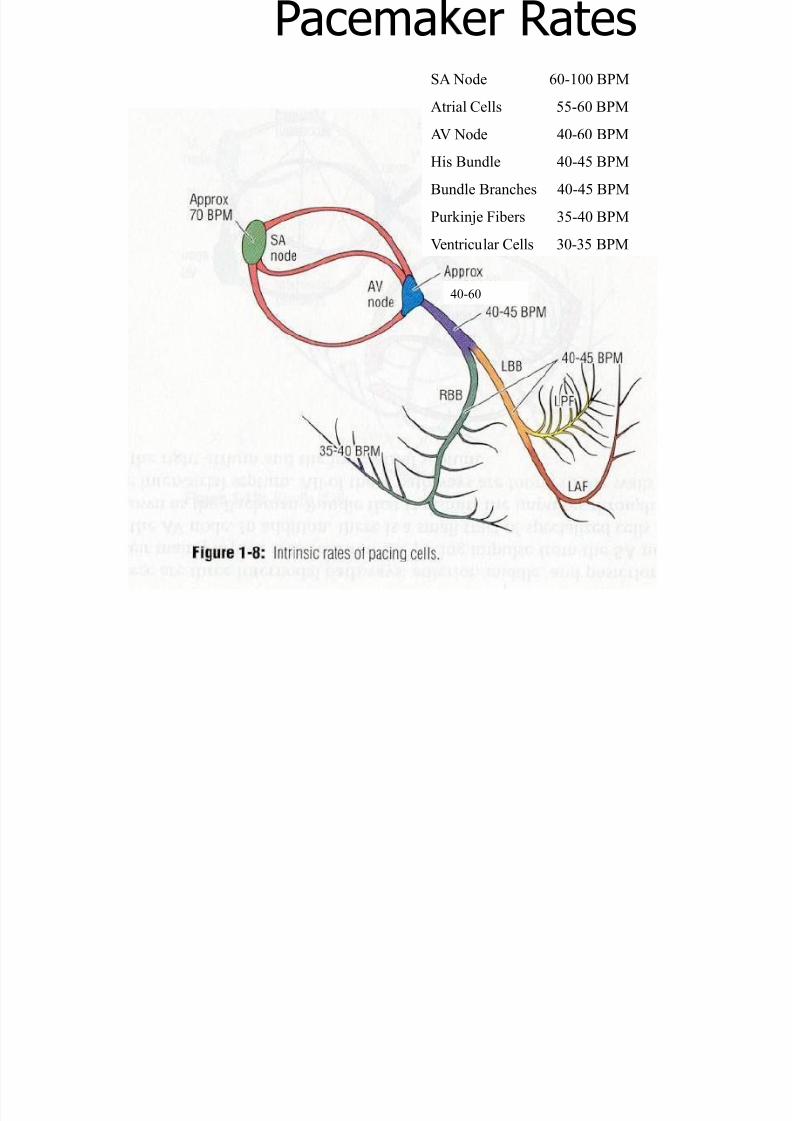
Pacema er Rates
40-60
0-60
SA Node 60-100 BPM
Atrial Cells 55-60 BPM
AV Node 40-60 BPMHis Bundle 40-45 BPM
Bundle Branches 40-45 BPM
Purkinje Fibers 35-40 BPM
Ventricular Cells 30-35 BPM
8/13/2019 N 564 EKG Interpretation Lecture Version 2013 Stein
http://slidepdf.com/reader/full/n-564-ekg-interpretation-lecture-version-2013-stein 17/189
8/13/2019 N 564 EKG Interpretation Lecture Version 2013 Stein
http://slidepdf.com/reader/full/n-564-ekg-interpretation-lecture-version-2013-stein 18/189
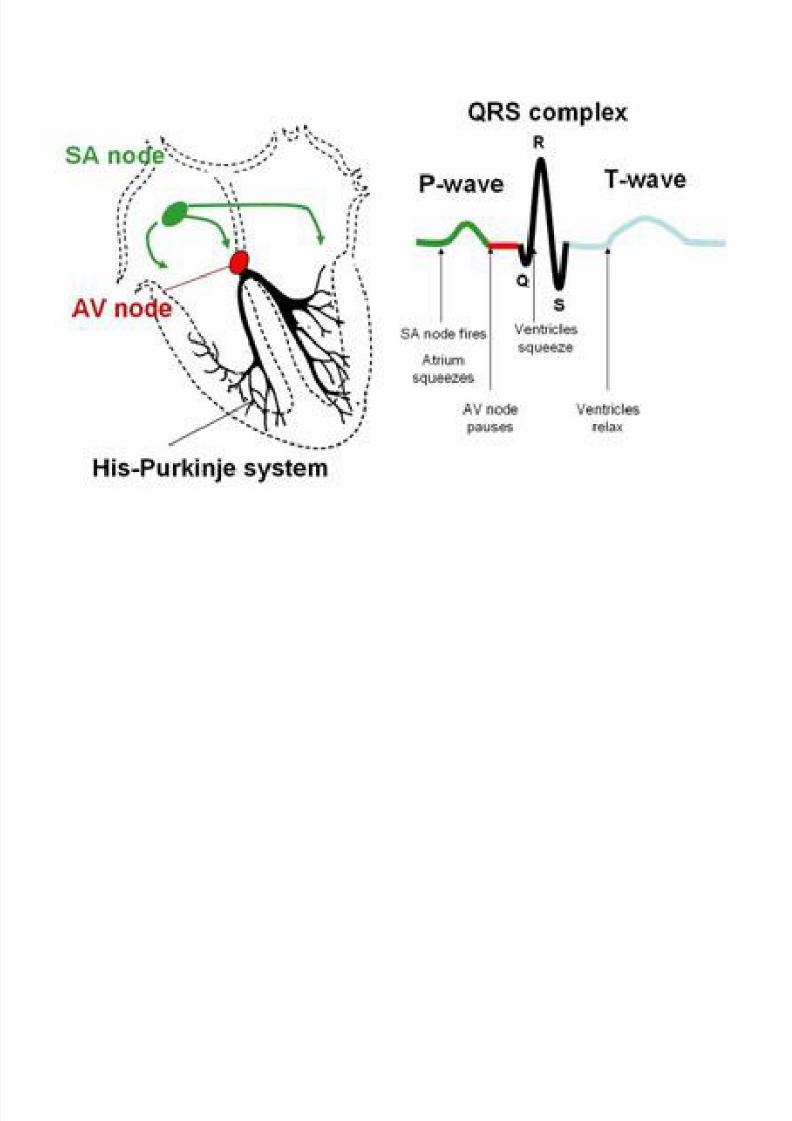
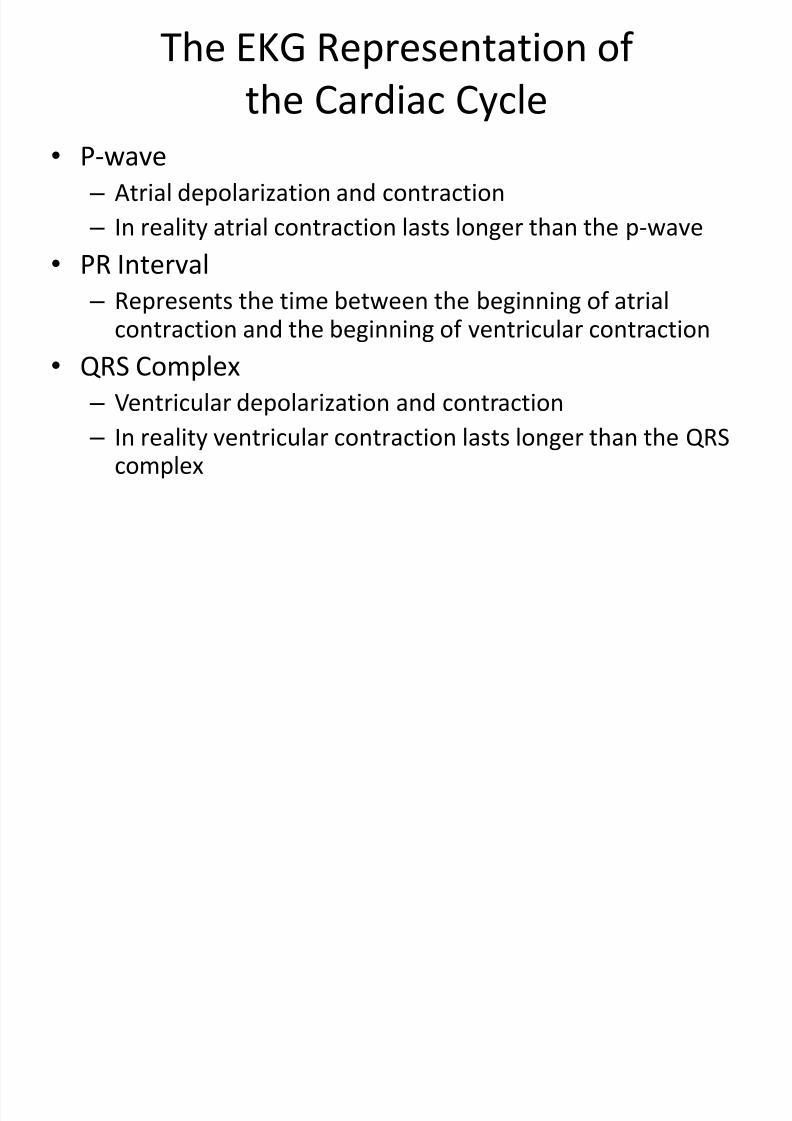
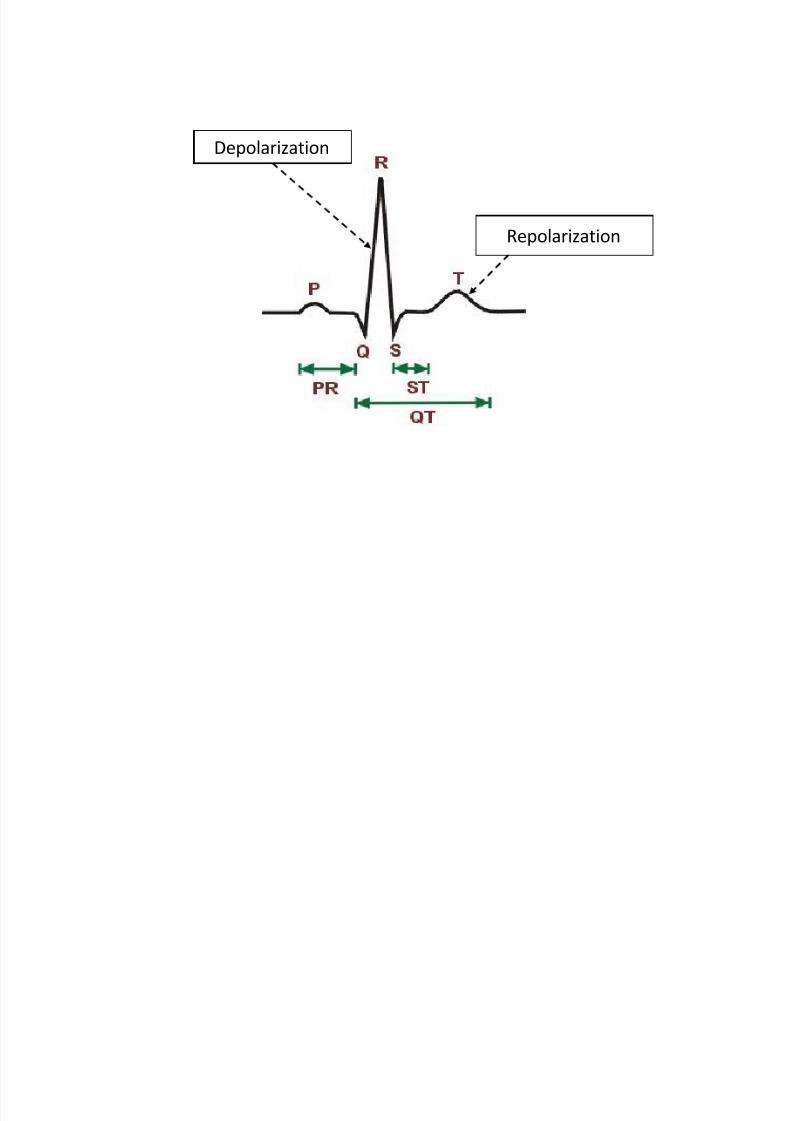
The EKG Representation of
the Cardiac Cycle
• P-wave
– Atrial depolarization and contraction
– In reality atrial contraction lasts longer than the p-wave
•
PR Interval – Represents the time between the beginning of atrial
contraction and the beginning of ventricular contraction
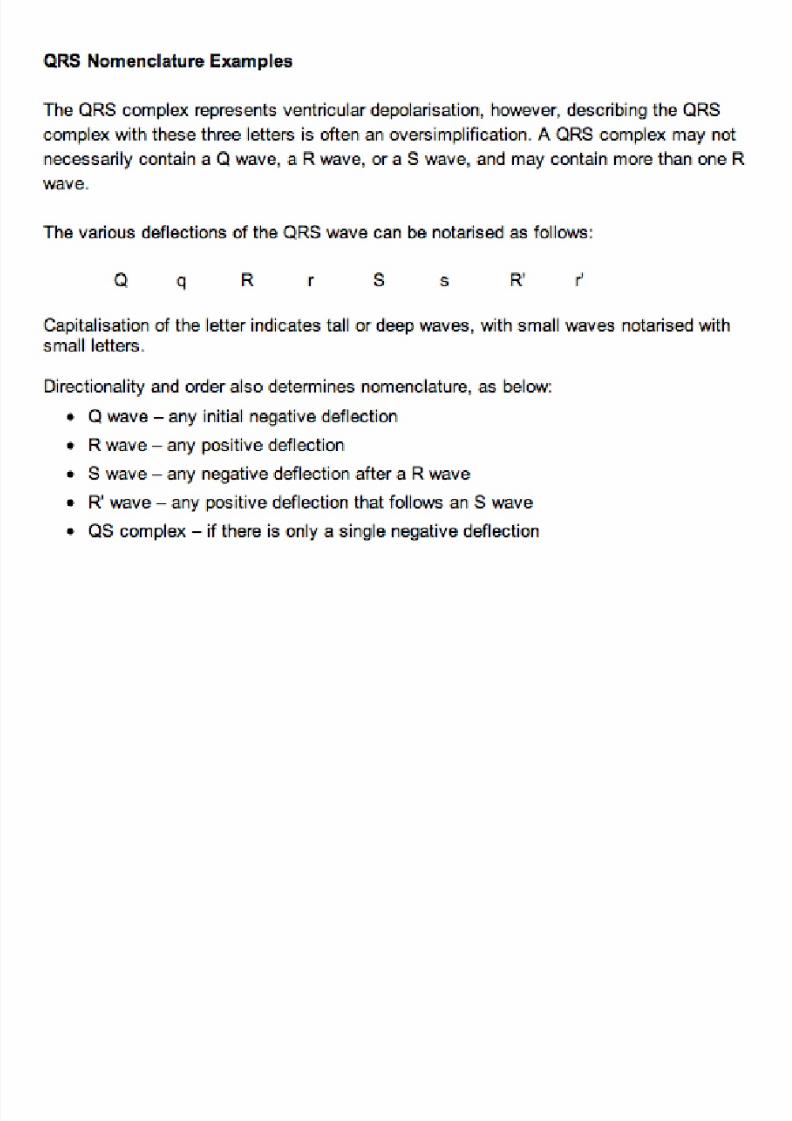
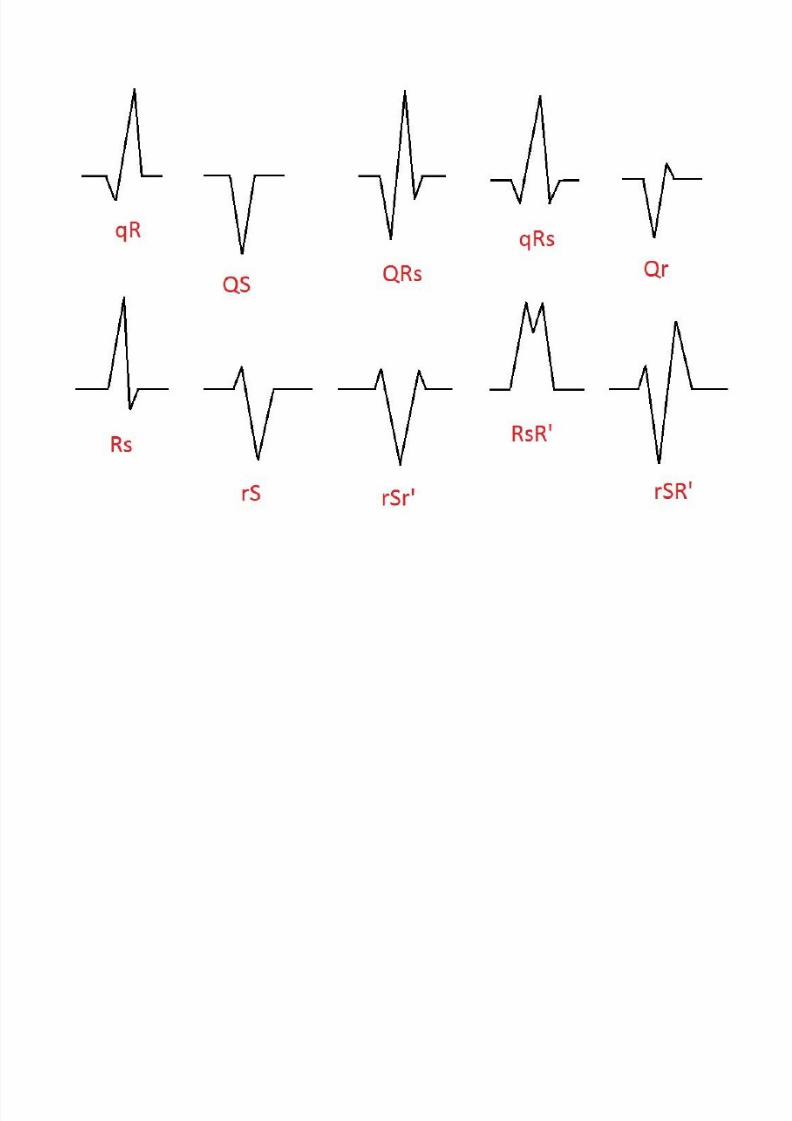
• QRS Complex
– Ventricular depolarization and contraction
– In reality ventricular contraction lasts longer than the QRScomplex
8/13/2019 N 564 EKG Interpretation Lecture Version 2013 Stein
http://slidepdf.com/reader/full/n-564-ekg-interpretation-lecture-version-2013-stein 19/189
8/13/2019 N 564 EKG Interpretation Lecture Version 2013 Stein
http://slidepdf.com/reader/full/n-564-ekg-interpretation-lecture-version-2013-stein 20/189
8/13/2019 N 564 EKG Interpretation Lecture Version 2013 Stein
http://slidepdf.com/reader/full/n-564-ekg-interpretation-lecture-version-2013-stein 21/189
8/13/2019 N 564 EKG Interpretation Lecture Version 2013 Stein
http://slidepdf.com/reader/full/n-564-ekg-interpretation-lecture-version-2013-stein 22/189
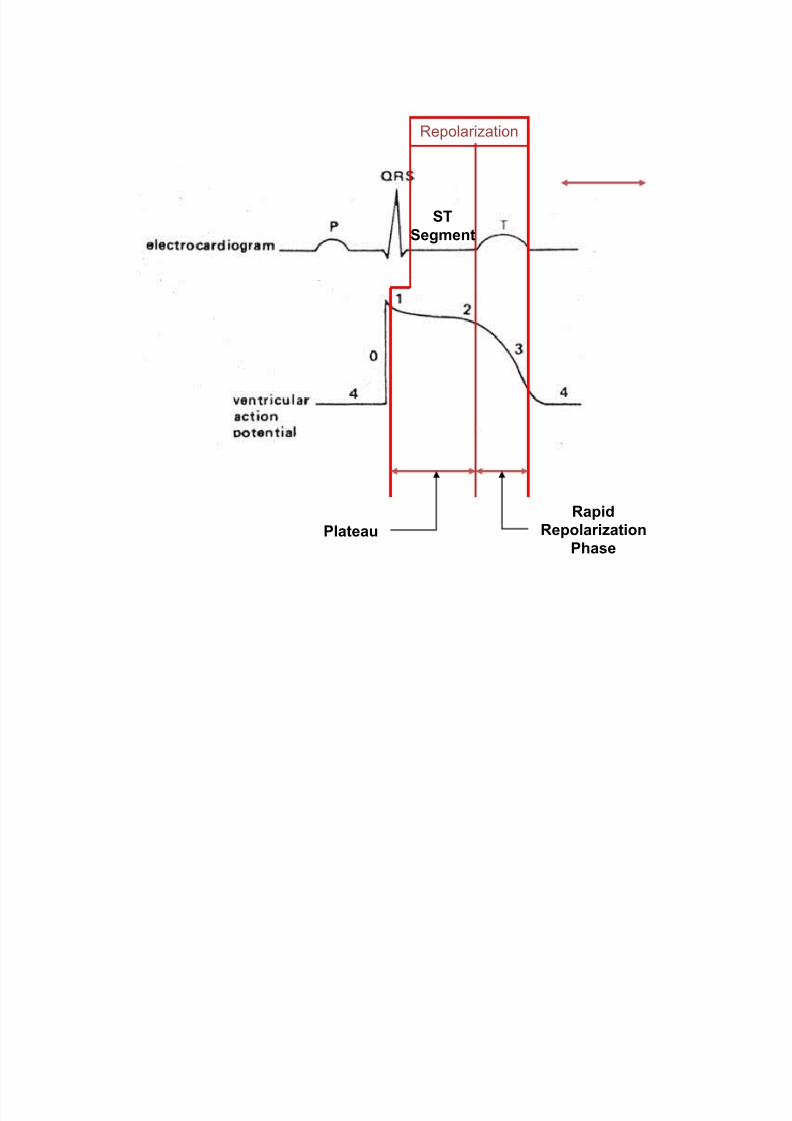
The EKG Representation of
the Cardiac Cycle
• Repolarization of ventricular myocytes beginimmediately after QRS and persist until end of T-wave
• QT Interval – Represents the duration of ventricular
systole/contraction
– Ventricular contraction begins with the QRS andpersists until the end of the T-wave
– Good indicator of repolarization – Normal QT interval is less that half of the R-to-R
interval• Corrected for heart rate
8/13/2019 N 564 EKG Interpretation Lecture Version 2013 Stein
http://slidepdf.com/reader/full/n-564-ekg-interpretation-lecture-version-2013-stein 23/189
Depolarization
Repolarization

8/13/2019 N 564 EKG Interpretation Lecture Version 2013 Stein
http://slidepdf.com/reader/full/n-564-ekg-interpretation-lecture-version-2013-stein 24/189
Ventricular
Systole
QT
Interval
8/13/2019 N 564 EKG Interpretation Lecture Version 2013 Stein
http://slidepdf.com/reader/full/n-564-ekg-interpretation-lecture-version-2013-stein 25/189
Repolarization
Plateau
Rapid
Repolarization
Phase
ST
Segment
8/13/2019 N 564 EKG Interpretation Lecture Version 2013 Stein
http://slidepdf.com/reader/full/n-564-ekg-interpretation-lecture-version-2013-stein 26/189
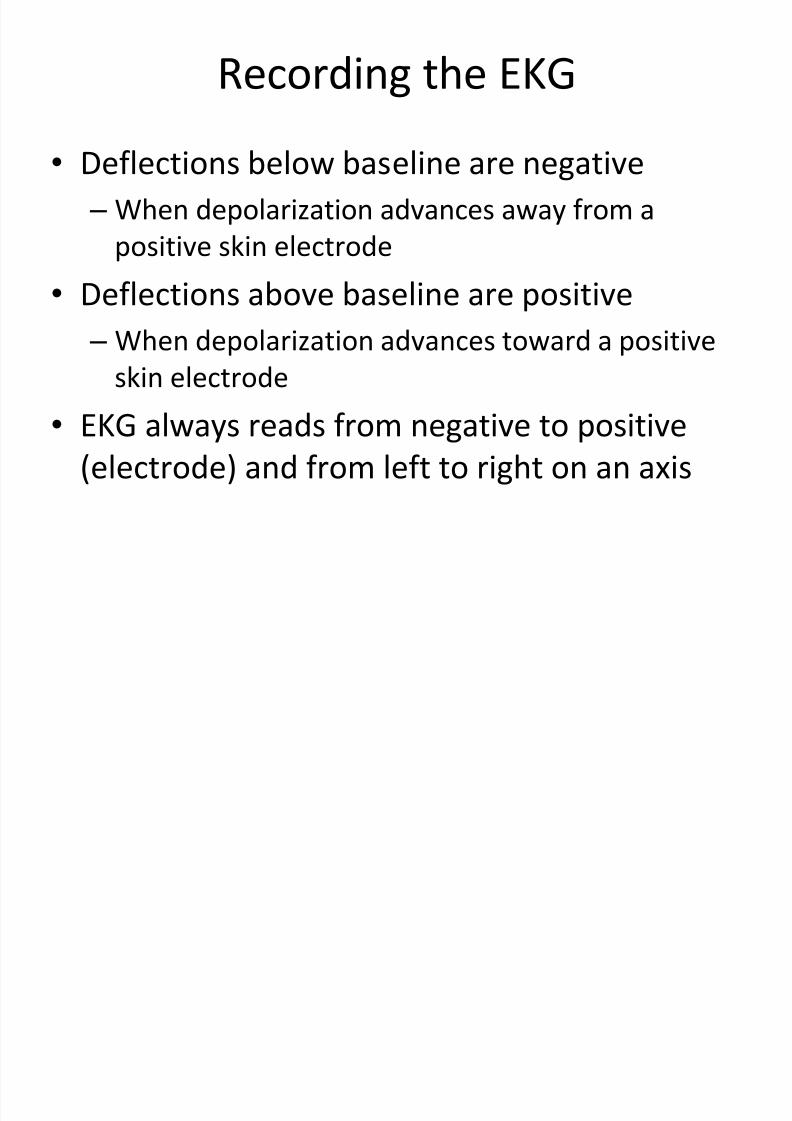
Recording the EKG
8/13/2019 N 564 EKG Interpretation Lecture Version 2013 Stein
http://slidepdf.com/reader/full/n-564-ekg-interpretation-lecture-version-2013-stein 27/189
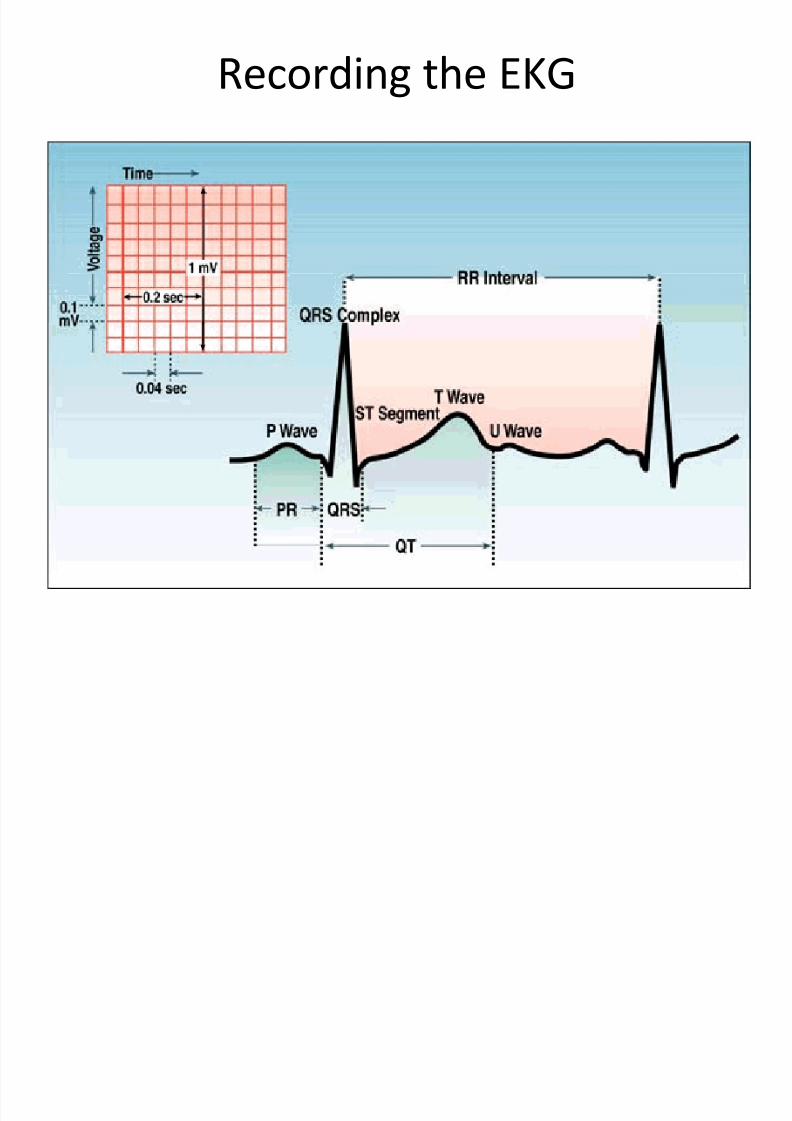
Recording the EKG

8/13/2019 N 564 EKG Interpretation Lecture Version 2013 Stein
http://slidepdf.com/reader/full/n-564-ekg-interpretation-lecture-version-2013-stein 28/189
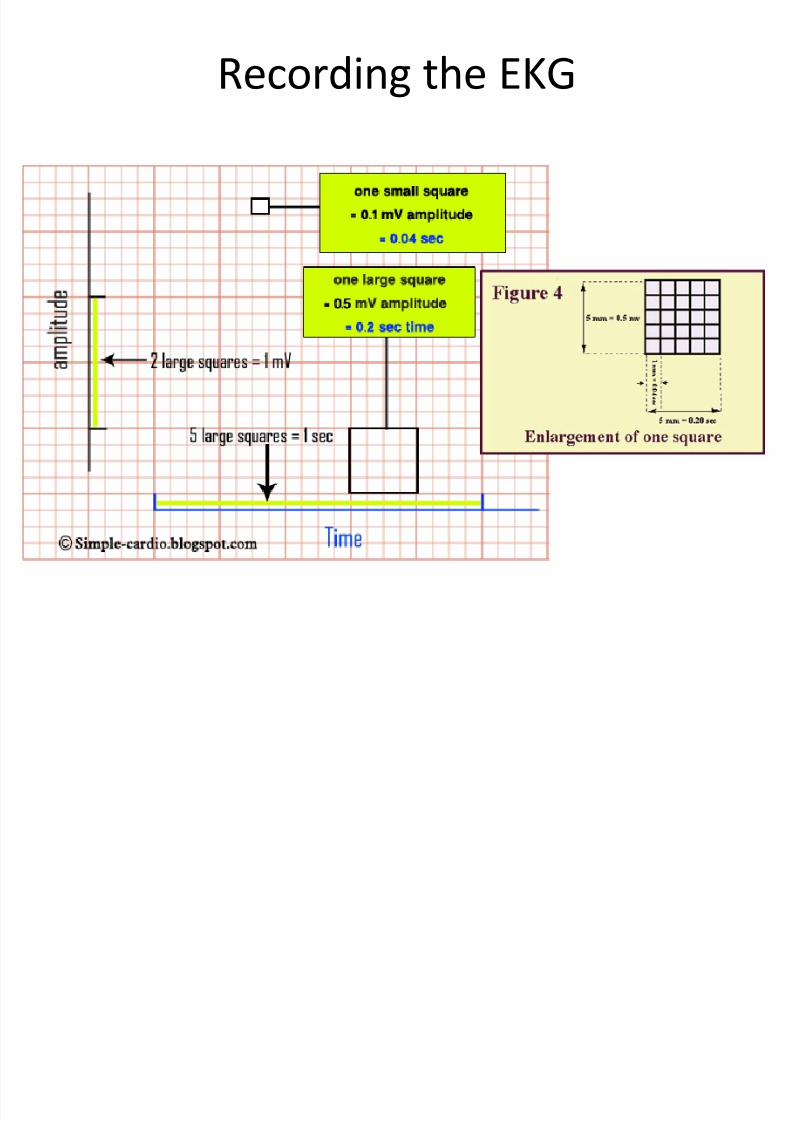
Recording the EKG
• y-axis – amplitude (mV)
• x-axis – time (sec)
•
1 small square = 1mm x 1mm or 0.1mV x0.04sec
• 1 large square = 5mm x 5mm or 0.5mV x
0.2sec
• 2 large squares = 1mV
• 5 large squares = 1 sec
8/13/2019 N 564 EKG Interpretation Lecture Version 2013 Stein
http://slidepdf.com/reader/full/n-564-ekg-interpretation-lecture-version-2013-stein 29/189
8/13/2019 N 564 EKG Interpretation Lecture Version 2013 Stein
http://slidepdf.com/reader/full/n-564-ekg-interpretation-lecture-version-2013-stein 30/189
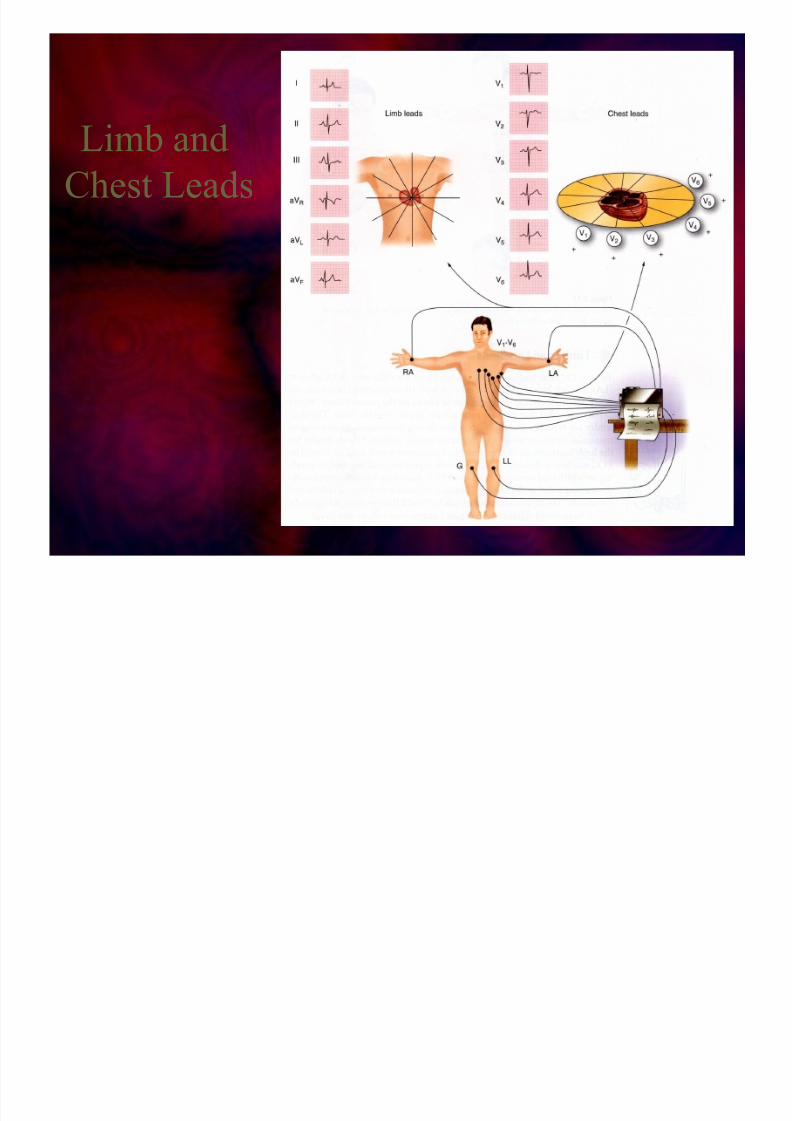
• Limb Leads
–I
– II
– III
–
AVR – AVL
– AVF
• Chest Leads
–V1
– V2
– V3
–
V4
– V5
– V6

8/13/2019 N 564 EKG Interpretation Lecture Version 2013 Stein
http://slidepdf.com/reader/full/n-564-ekg-interpretation-lecture-version-2013-stein 31/189
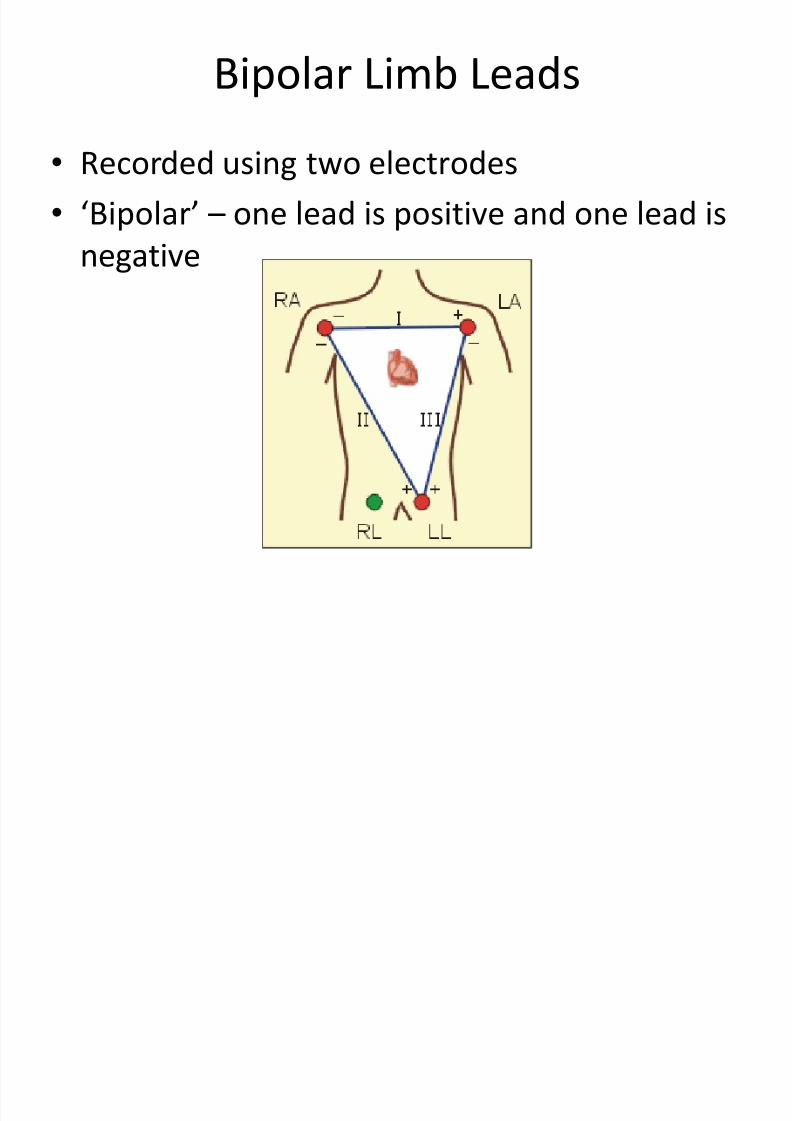
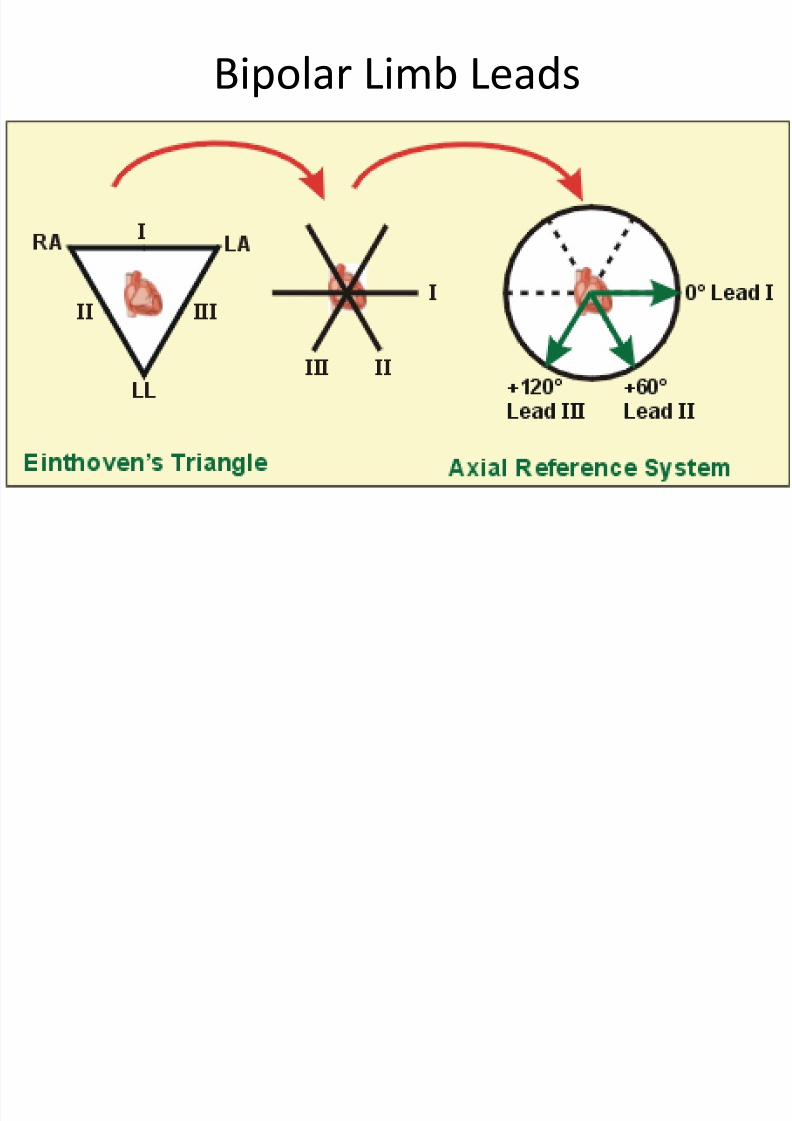
Limb Leads
• Electrodes are placed on the right arm, the leftarm, and the left leg
• A pair of electrodes is used to record one lead
–A different pair is used for each lead
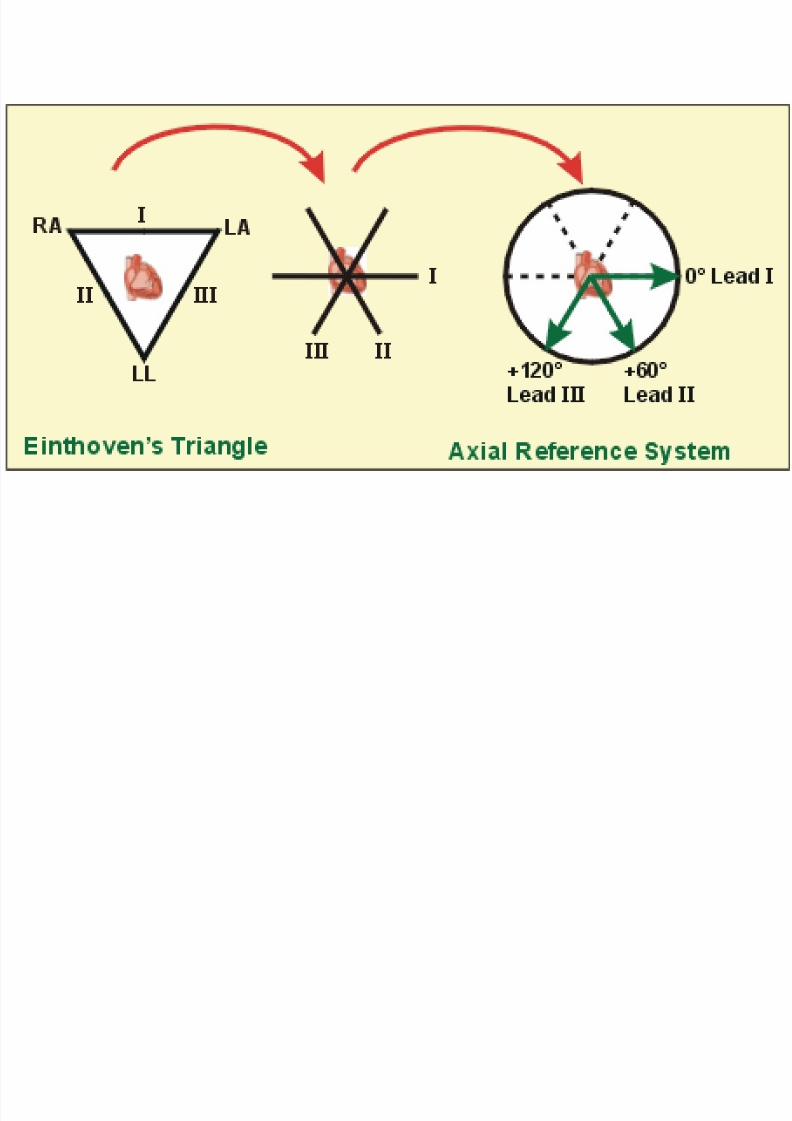
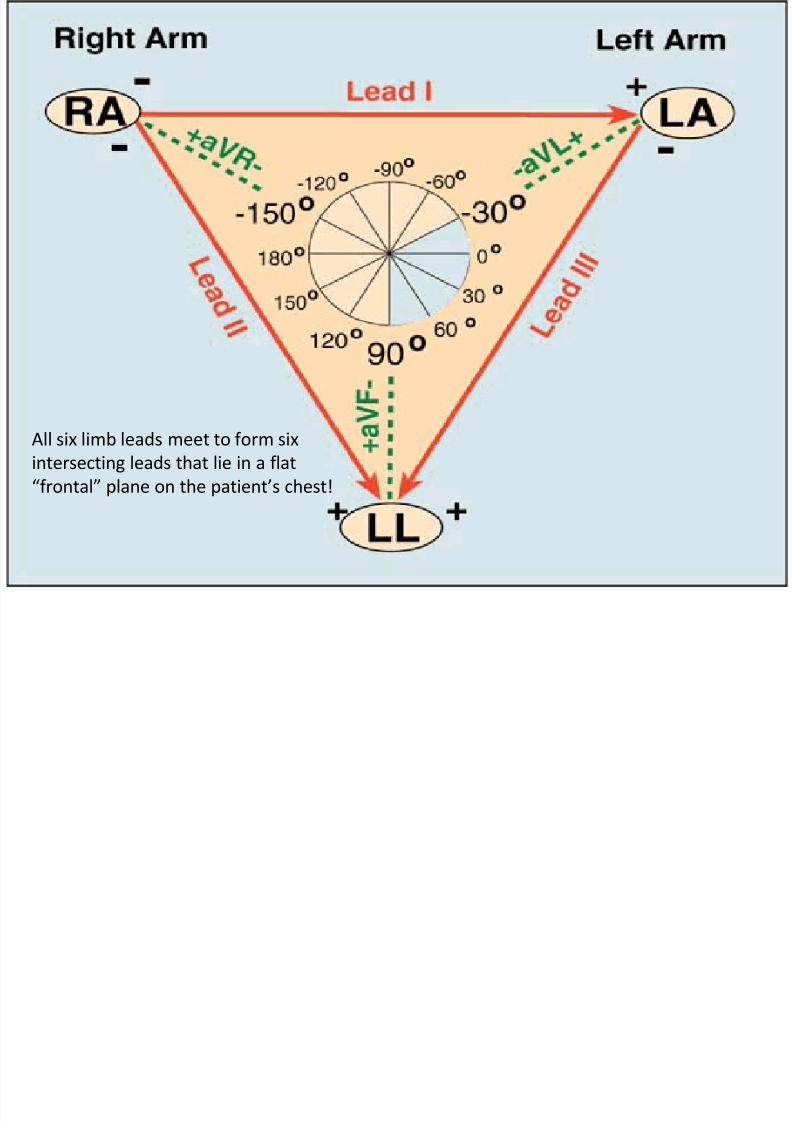
• Einthoven’s triangle
• Bipolar limb leads
– I, II, III
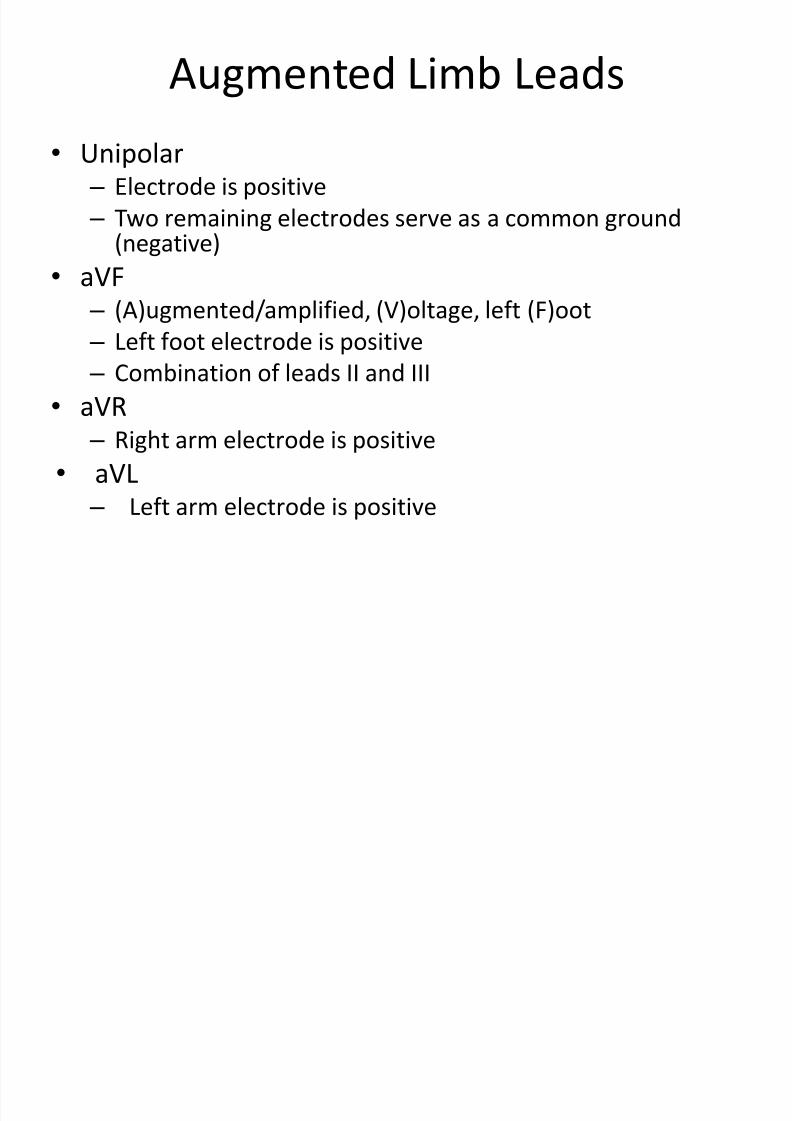
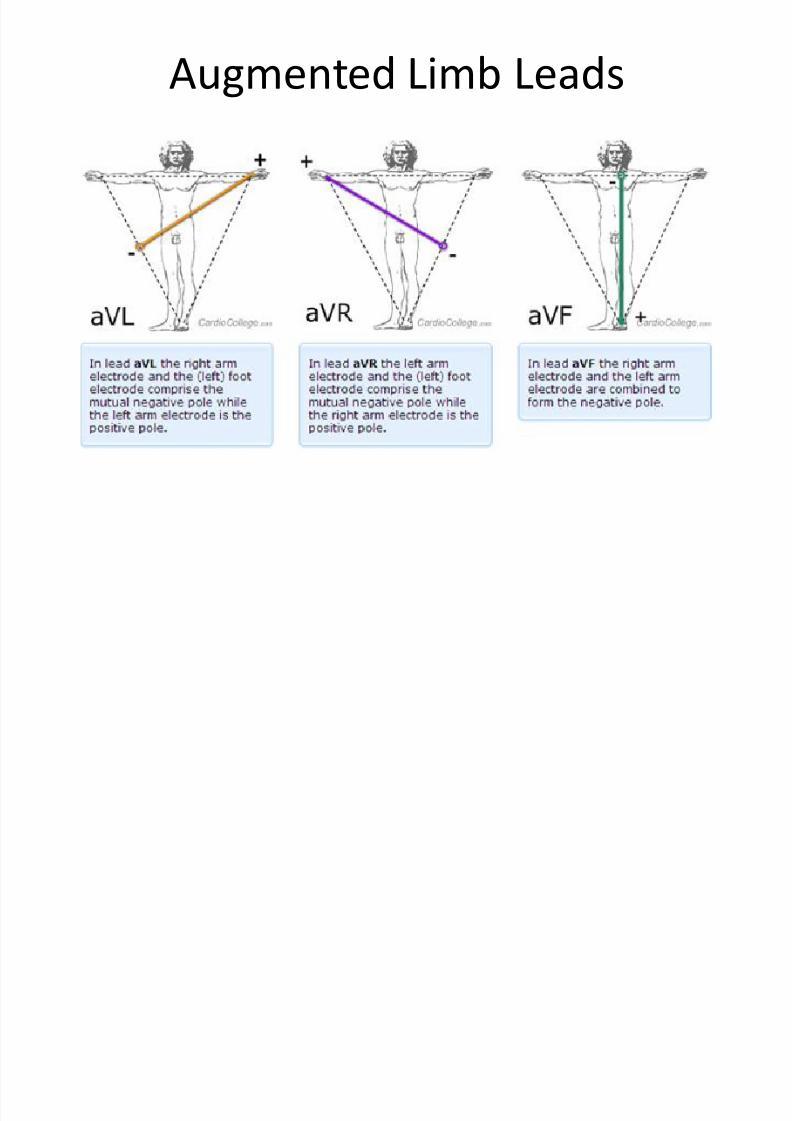
• Unipolar/Augmented limb leads
– aVF, aVR, aVL
8/13/2019 N 564 EKG Interpretation Lecture Version 2013 Stein
http://slidepdf.com/reader/full/n-564-ekg-interpretation-lecture-version-2013-stein 32/189
8/13/2019 N 564 EKG Interpretation Lecture Version 2013 Stein
http://slidepdf.com/reader/full/n-564-ekg-interpretation-lecture-version-2013-stein 33/189
8/13/2019 N 564 EKG Interpretation Lecture Version 2013 Stein
http://slidepdf.com/reader/full/n-564-ekg-interpretation-lecture-version-2013-stein 34/189
8/13/2019 N 564 EKG Interpretation Lecture Version 2013 Stein
http://slidepdf.com/reader/full/n-564-ekg-interpretation-lecture-version-2013-stein 35/189
8/13/2019 N 564 EKG Interpretation Lecture Version 2013 Stein
http://slidepdf.com/reader/full/n-564-ekg-interpretation-lecture-version-2013-stein 36/189
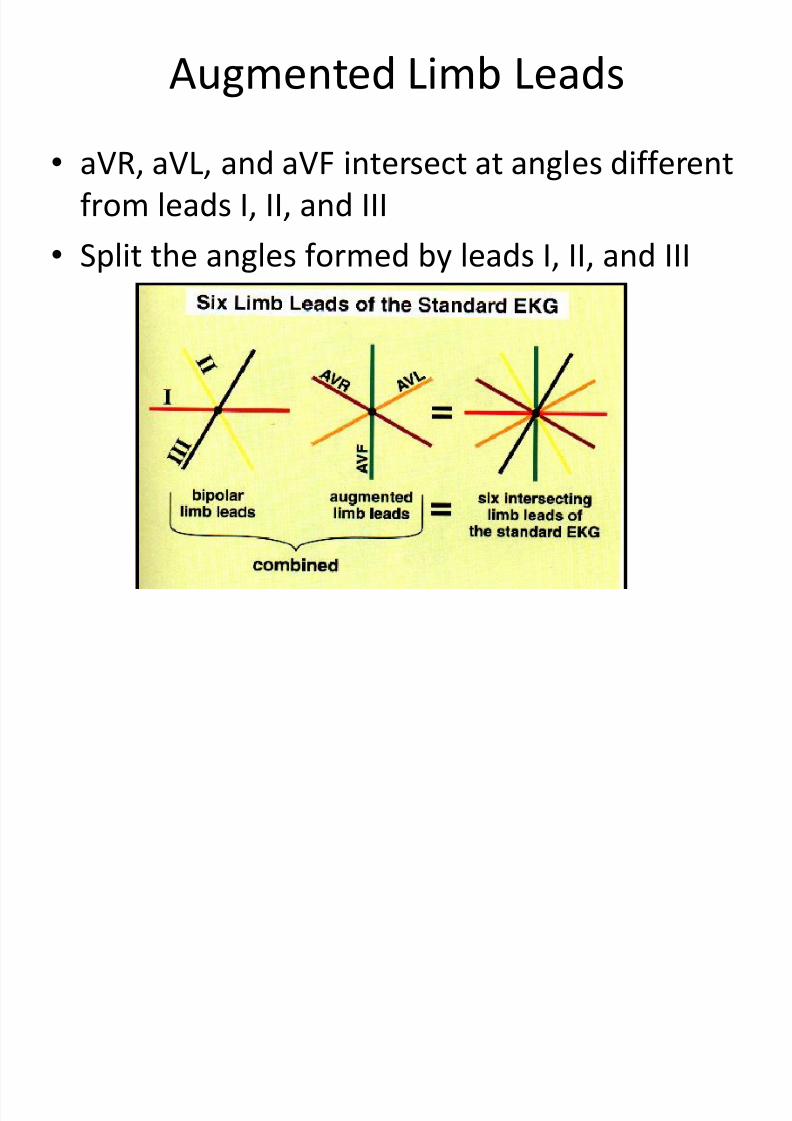
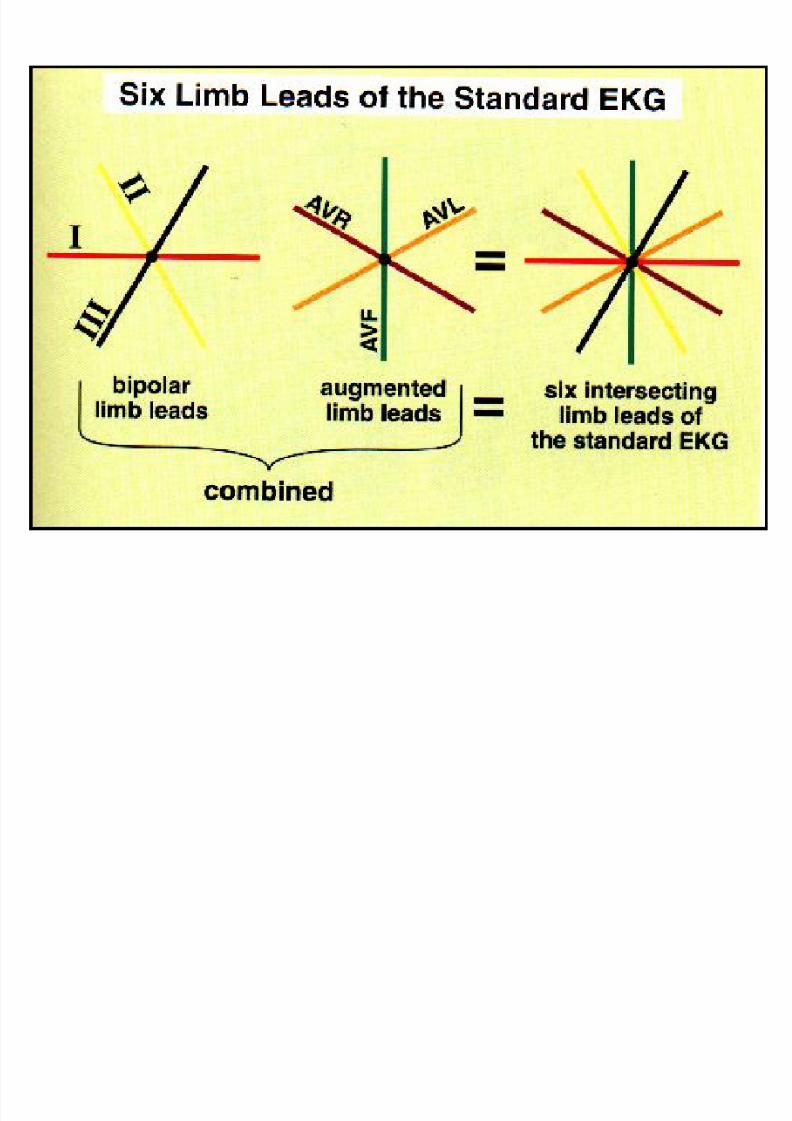
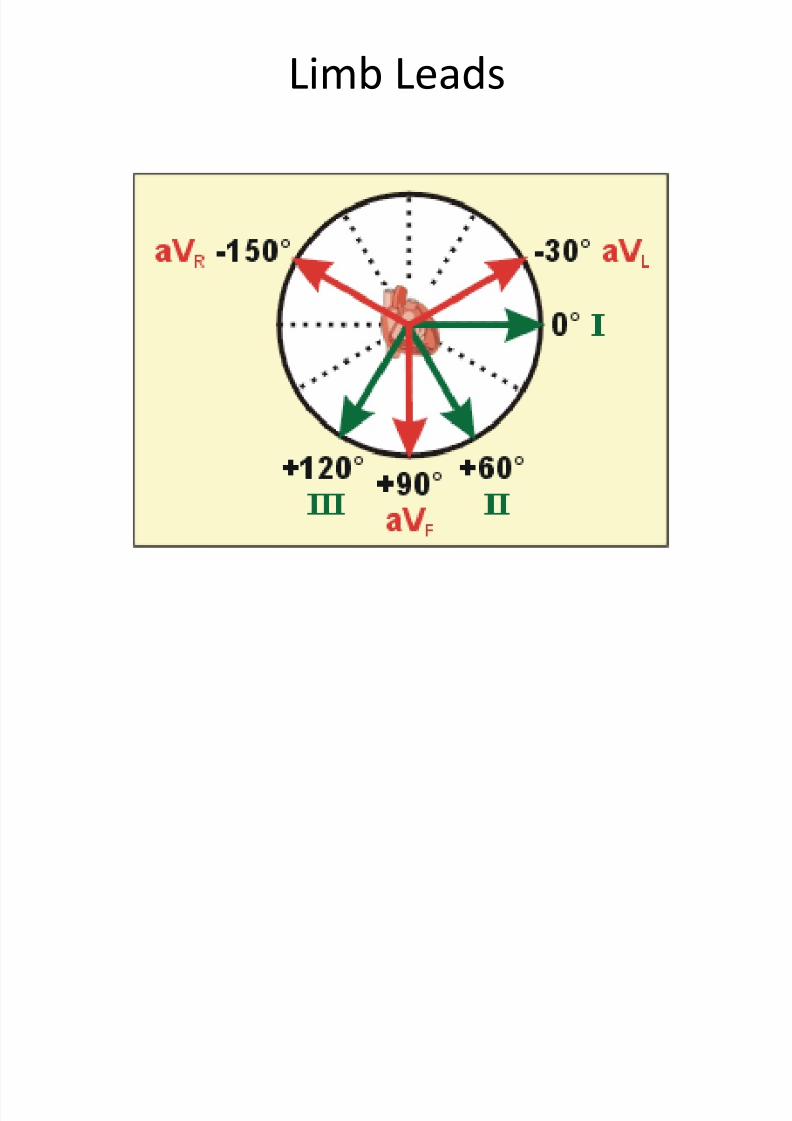
Augmented Limb Leads
• aVR, aVL, and aVF intersect at angles different
from leads I, II, and III
• Split the angles formed by leads I, II, and III

8/13/2019 N 564 EKG Interpretation Lecture Version 2013 Stein
http://slidepdf.com/reader/full/n-564-ekg-interpretation-lecture-version-2013-stein 37/189
Limb Leads

8/13/2019 N 564 EKG Interpretation Lecture Version 2013 Stein
http://slidepdf.com/reader/full/n-564-ekg-interpretation-lecture-version-2013-stein 38/189
All six limb leads meet to form six
intersecting leads that lie in a flat
“frontal” plane on the patient’s chest!
8/13/2019 N 564 EKG Interpretation Lecture Version 2013 Stein
http://slidepdf.com/reader/full/n-564-ekg-interpretation-lecture-version-2013-stein 39/189
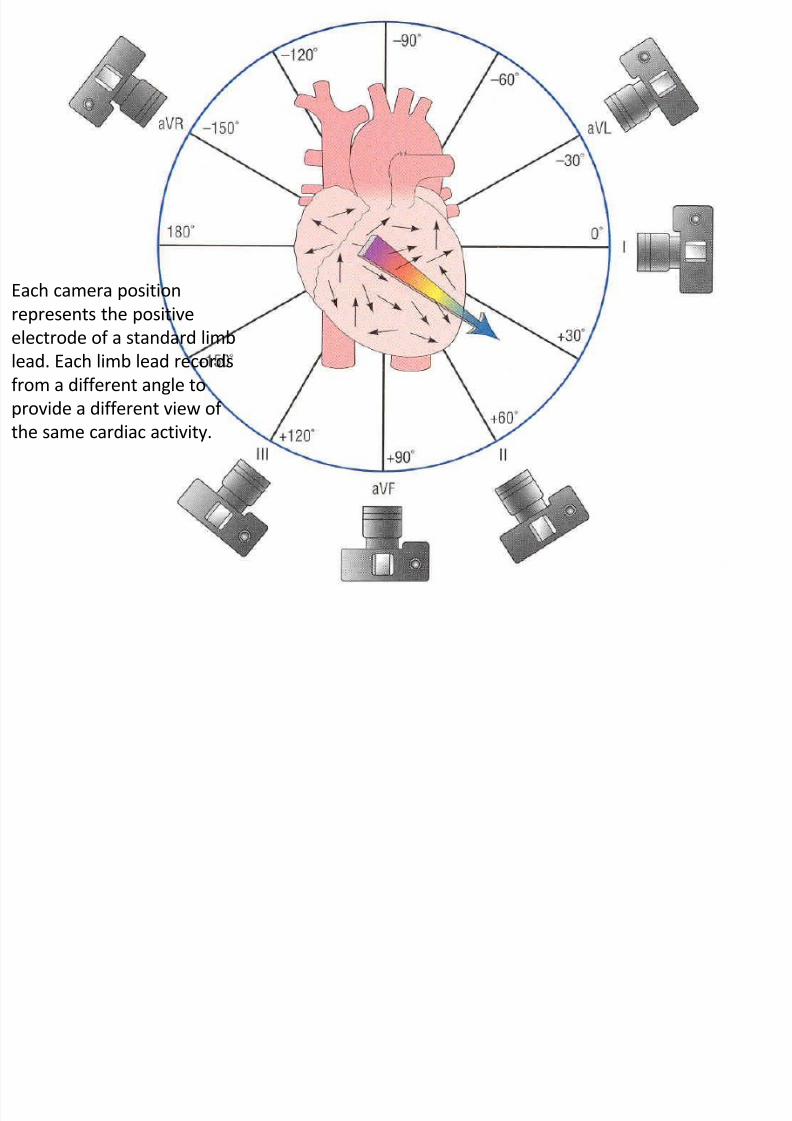
Each camera position
represents the positive
electrode of a standard limb
lead. Each limb lead records
from a different angle to
provide a different view of
the same cardiac activity.
8/13/2019 N 564 EKG Interpretation Lecture Version 2013 Stein
http://slidepdf.com/reader/full/n-564-ekg-interpretation-lecture-version-2013-stein 40/189
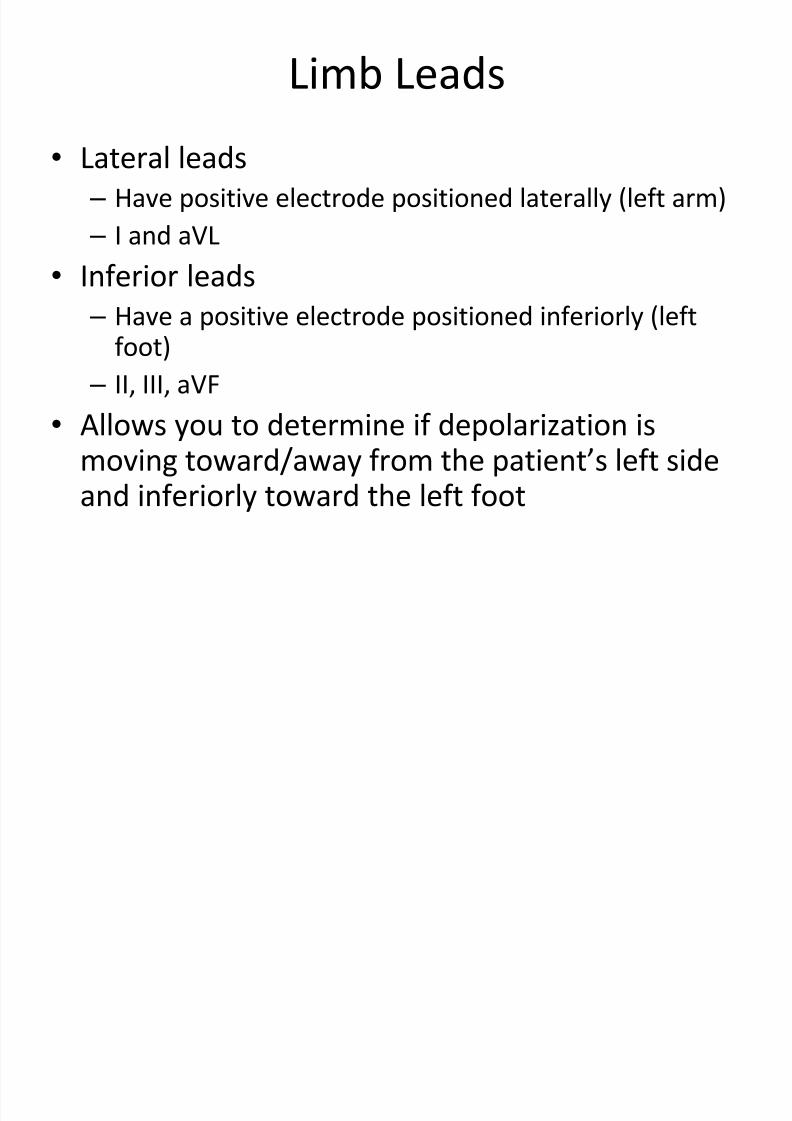
Limb Leads
• Lateral leads
– Have positive electrode positioned laterally (left arm)
– I and aVL
•Inferior leads – Have a positive electrode positioned inferiorly (left
foot)
– II, III, aVF
• Allows you to determine if depolarization ismoving toward/away from the patient’s left sideand inferiorly toward the left foot
8/13/2019 N 564 EKG Interpretation Lecture Version 2013 Stein
http://slidepdf.com/reader/full/n-564-ekg-interpretation-lecture-version-2013-stein 41/189
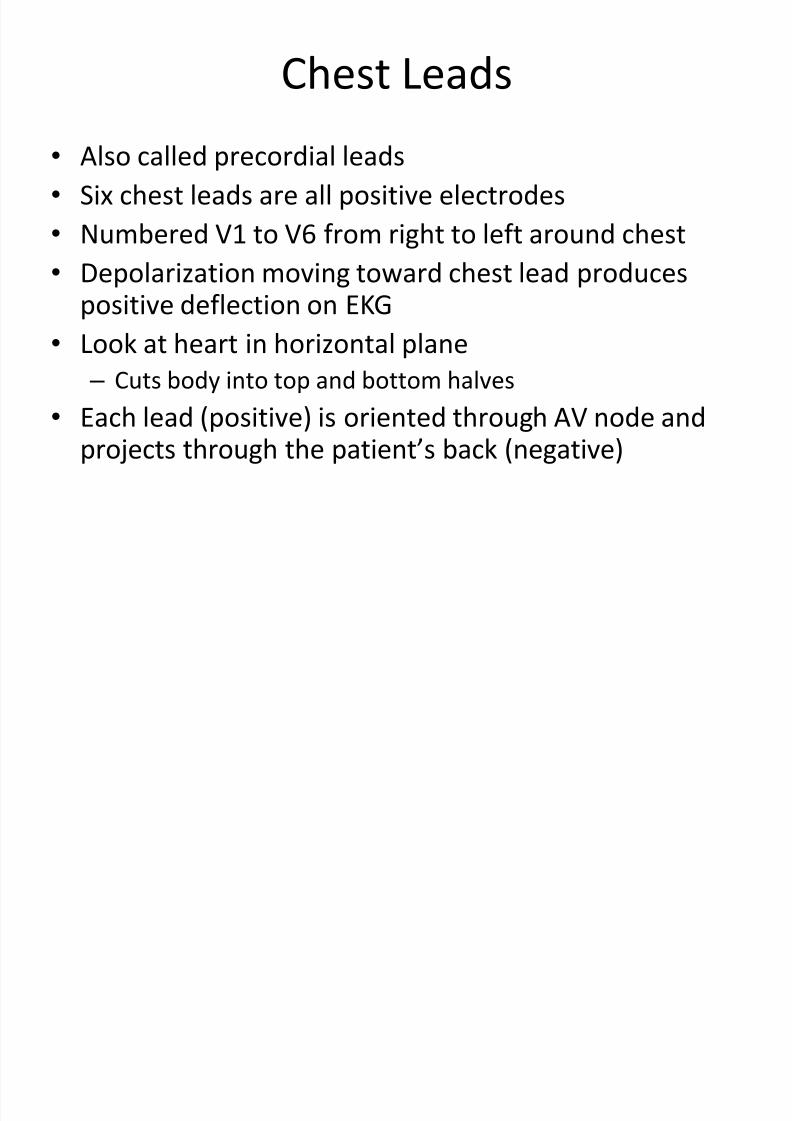
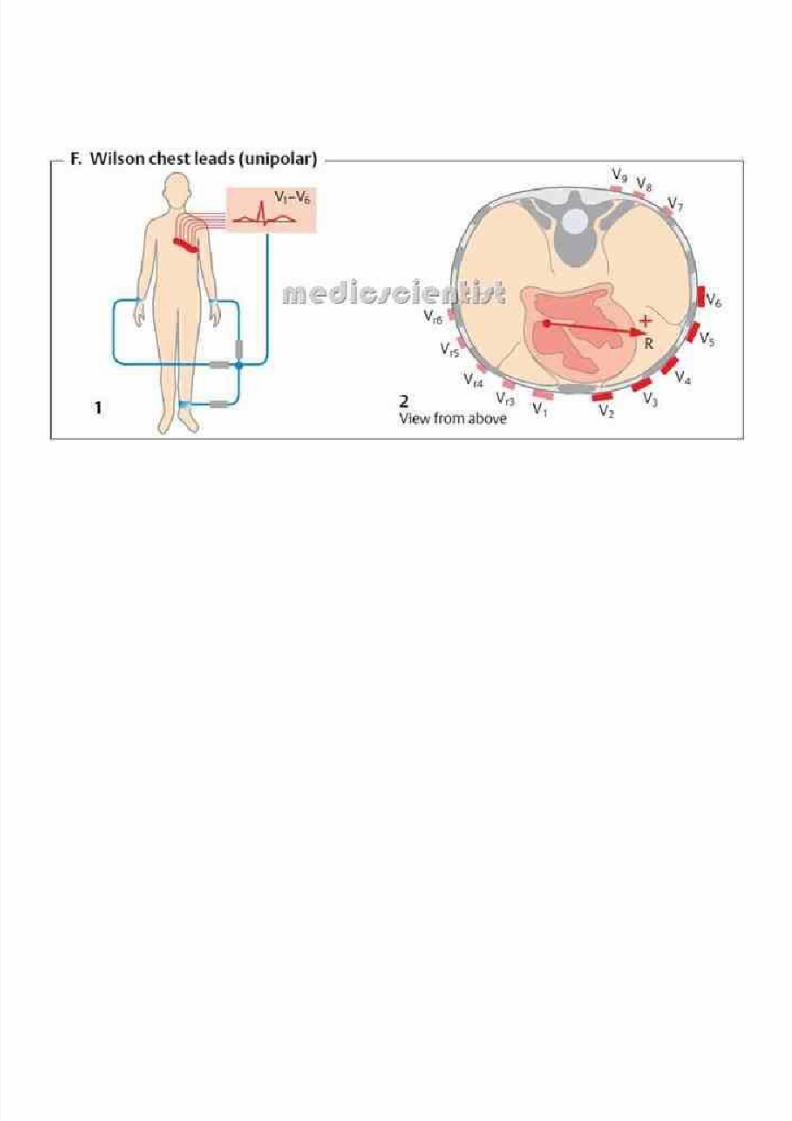
Chest Leads
• Also called precordial leads
• Six chest leads are all positive electrodes
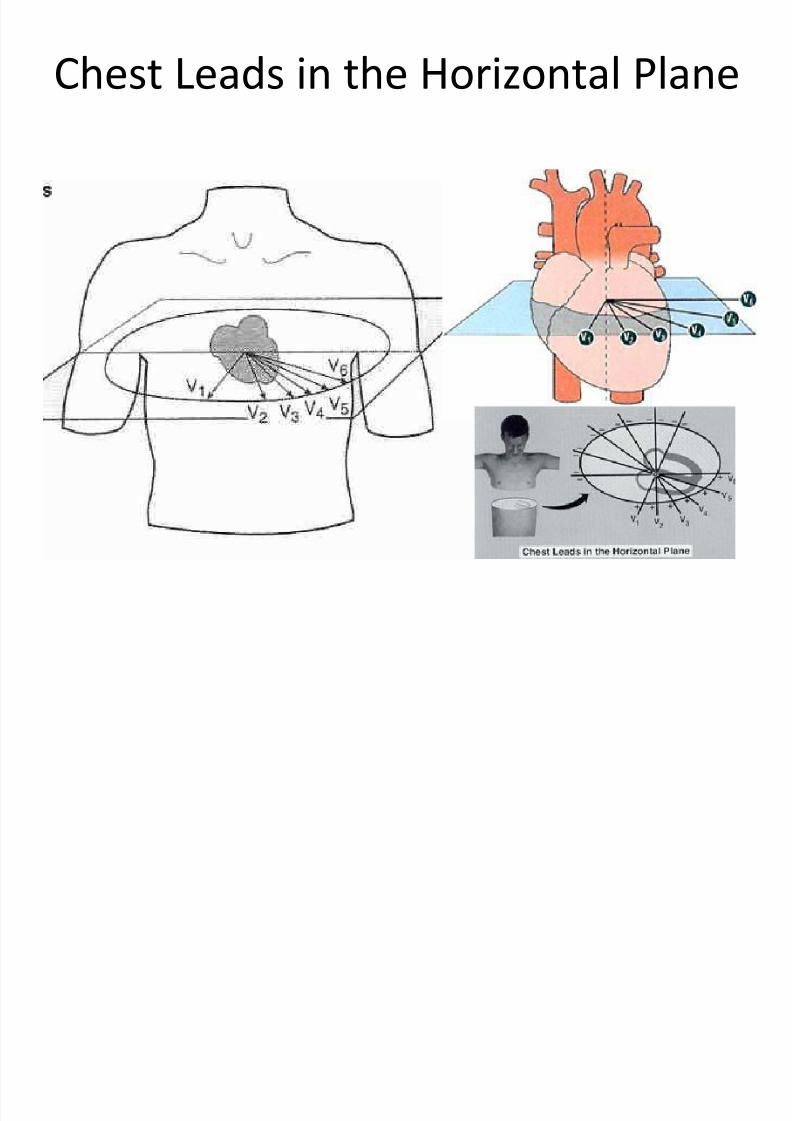
• Numbered V1 to V6 from right to left around chest
•
Depolarization moving toward chest lead producespositive deflection on EKG
• Look at heart in horizontal plane
– Cuts body into top and bottom halves
•Each lead (positive) is oriented through AV node andprojects through the patient’s back (negative)

8/13/2019 N 564 EKG Interpretation Lecture Version 2013 Stein
http://slidepdf.com/reader/full/n-564-ekg-interpretation-lecture-version-2013-stein 42/189
Horizontal View with Chest Leads

8/13/2019 N 564 EKG Interpretation Lecture Version 2013 Stein
http://slidepdf.com/reader/full/n-564-ekg-interpretation-lecture-version-2013-stein 43/189
8/13/2019 N 564 EKG Interpretation Lecture Version 2013 Stein
http://slidepdf.com/reader/full/n-564-ekg-interpretation-lecture-version-2013-stein 44/189
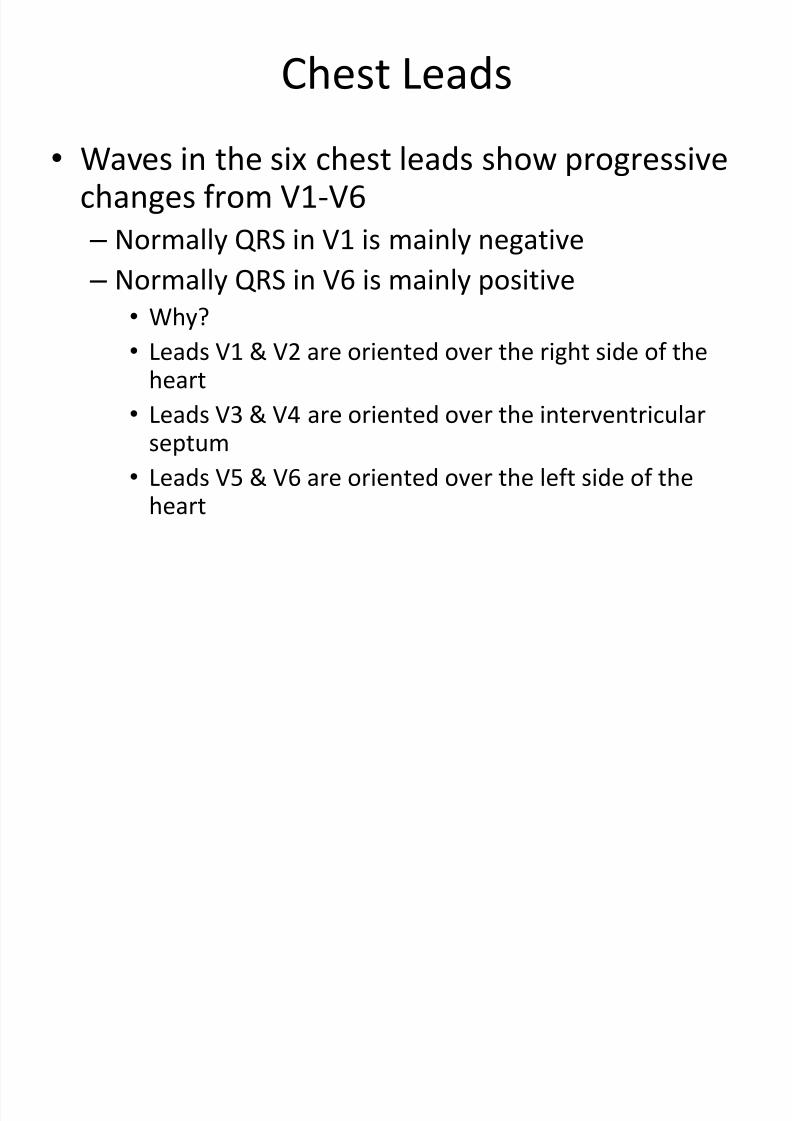
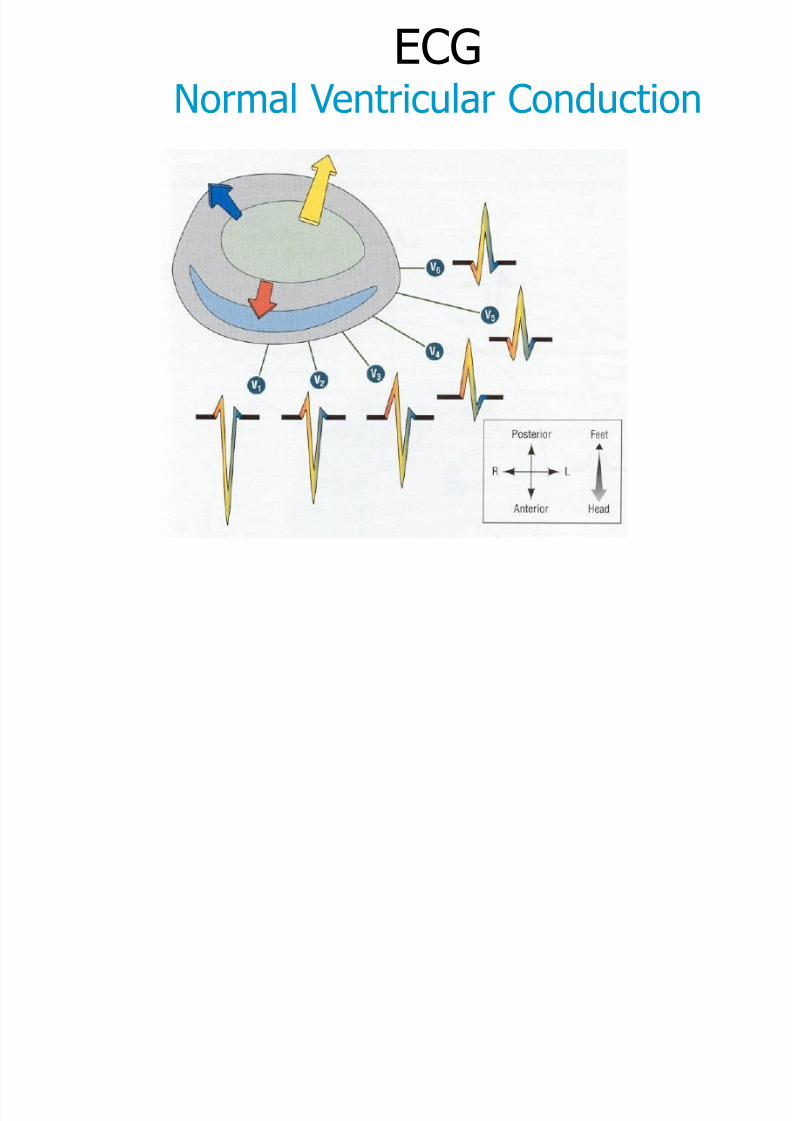
Chest Leads
• Waves in the six chest leads show progressivechanges from V1-V6
– Normally QRS in V1 is mainly negative
–Normally QRS in V6 is mainly positive• Why?
• Leads V1 & V2 are oriented over the right side of theheart
•
Leads V3 & V4 are oriented over the interventricularseptum
• Leads V5 & V6 are oriented over the left side of theheart
8/13/2019 N 564 EKG Interpretation Lecture Version 2013 Stein
http://slidepdf.com/reader/full/n-564-ekg-interpretation-lecture-version-2013-stein 45/189
8/13/2019 N 564 EKG Interpretation Lecture Version 2013 Stein
http://slidepdf.com/reader/full/n-564-ekg-interpretation-lecture-version-2013-stein 46/189
Limb andChest Leads

8/13/2019 N 564 EKG Interpretation Lecture Version 2013 Stein
http://slidepdf.com/reader/full/n-564-ekg-interpretation-lecture-version-2013-stein 47/189

8/13/2019 N 564 EKG Interpretation Lecture Version 2013 Stein
http://slidepdf.com/reader/full/n-564-ekg-interpretation-lecture-version-2013-stein 48/189
EKG Interpretation
1. RATE
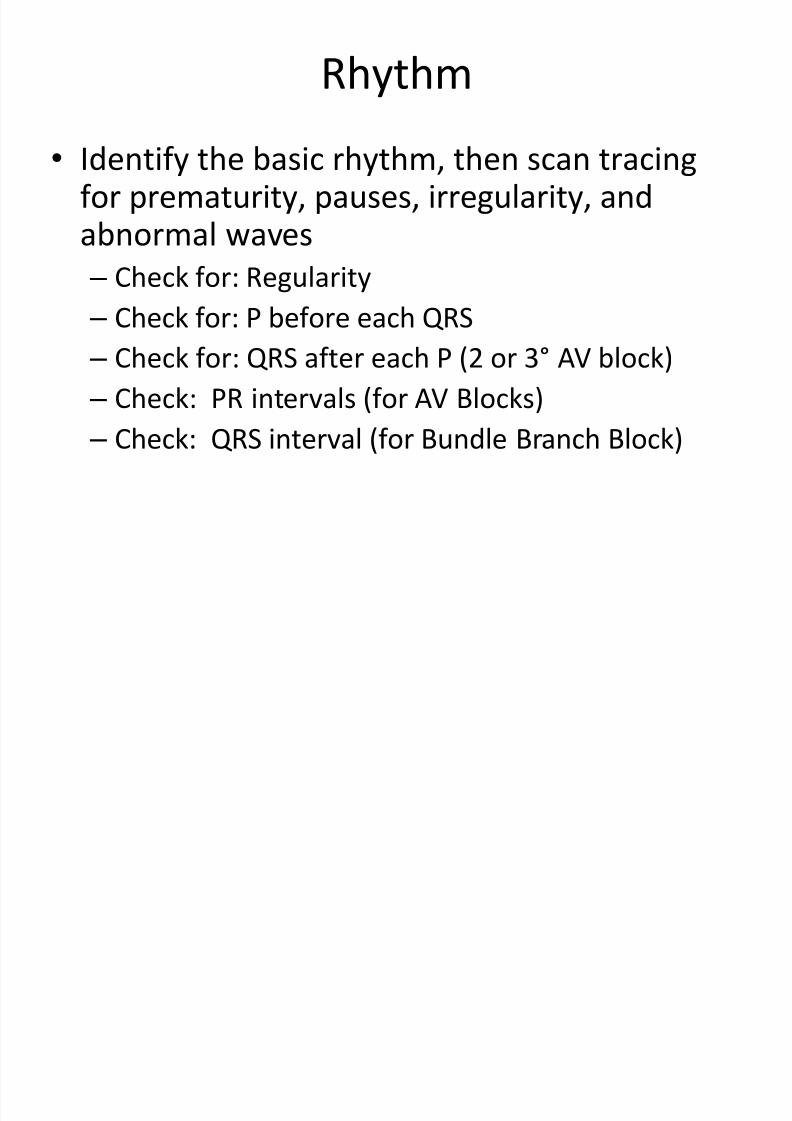
2. Rhythm
3. Axis
4. Hypertrophy
5. Infarction
8/13/2019 N 564 EKG Interpretation Lecture Version 2013 Stein
http://slidepdf.com/reader/full/n-564-ekg-interpretation-lecture-version-2013-stein 49/189
Rate
• First step in EKG interpretation
• Measured in cycles/min
• SA node
8/13/2019 N 564 EKG Interpretation Lecture Version 2013 Stein
http://slidepdf.com/reader/full/n-564-ekg-interpretation-lecture-version-2013-stein 50/189
Automaticity Foci
• Also called eptopic foci
• Focal areas of automaticity in heart
• Potential pacemakers
• Capable of taking over pacemakingresponsibilities from SA node in an emergency
• Under normal circumstances, these foci areelectrically silent
• Can be found in the atria, ventricles, and the AVJunction

8/13/2019 N 564 EKG Interpretation Lecture Version 2013 Stein
http://slidepdf.com/reader/full/n-564-ekg-interpretation-lecture-version-2013-stein 51/189
Automaticity Foci
• Level
– Atria
• Atrial automaticity foci
– AV Junction
• Junctional automaticity
foci
– Ventricles
• Ventricular automaticity
foci
• Inherent Rate Range
– 60-80/min
– 40-60/min
– 20-40/min

8/13/2019 N 564 EKG Interpretation Lecture Version 2013 Stein
http://slidepdf.com/reader/full/n-564-ekg-interpretation-lecture-version-2013-stein 52/189
Overdrive Suppression
SA Node
Atrial Foci (60-80 bpm)
Junctional Foci (40-60 bpm)
Ventricular Foci (20-40 bpm)
Overdrive Suppression
Any automaticity center willoverdrive-suppress all others
that have a slower inherent
pacemaking rate.
Emergency failsafe pacing at 3
separate levels.
8/13/2019 N 564 EKG Interpretation Lecture Version 2013 Stein
http://slidepdf.com/reader/full/n-564-ekg-interpretation-lecture-version-2013-stein 53/189
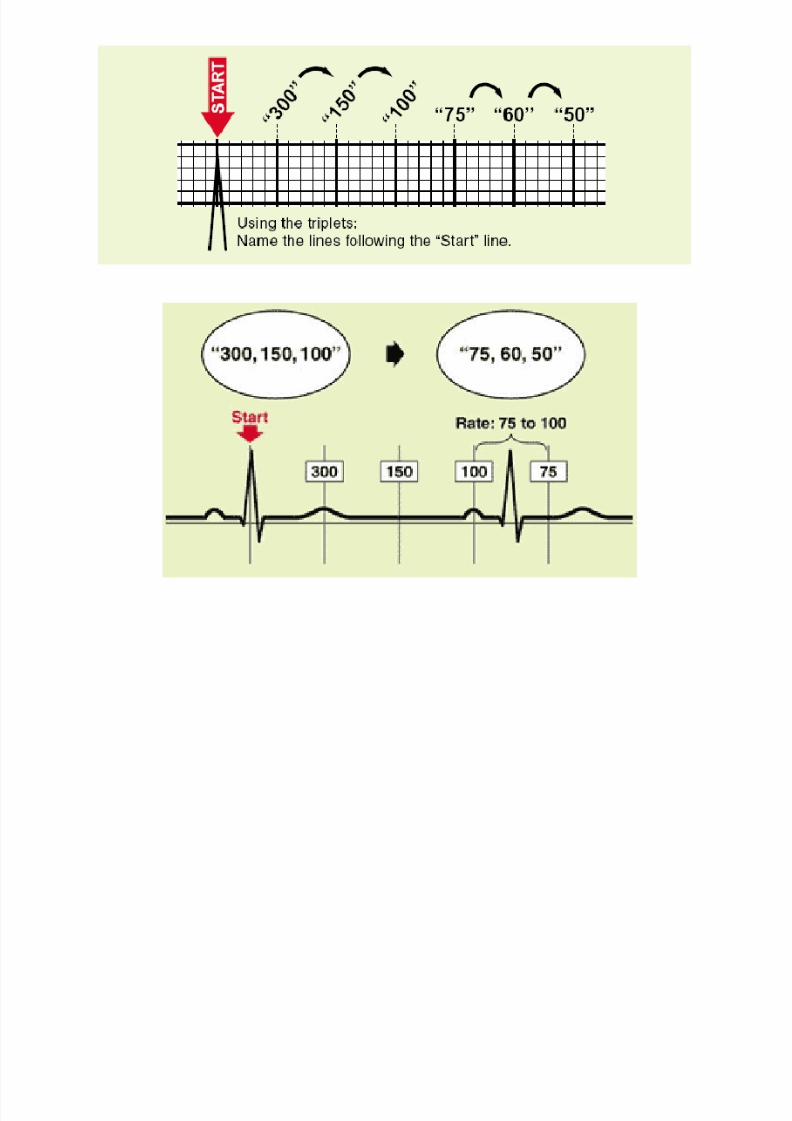
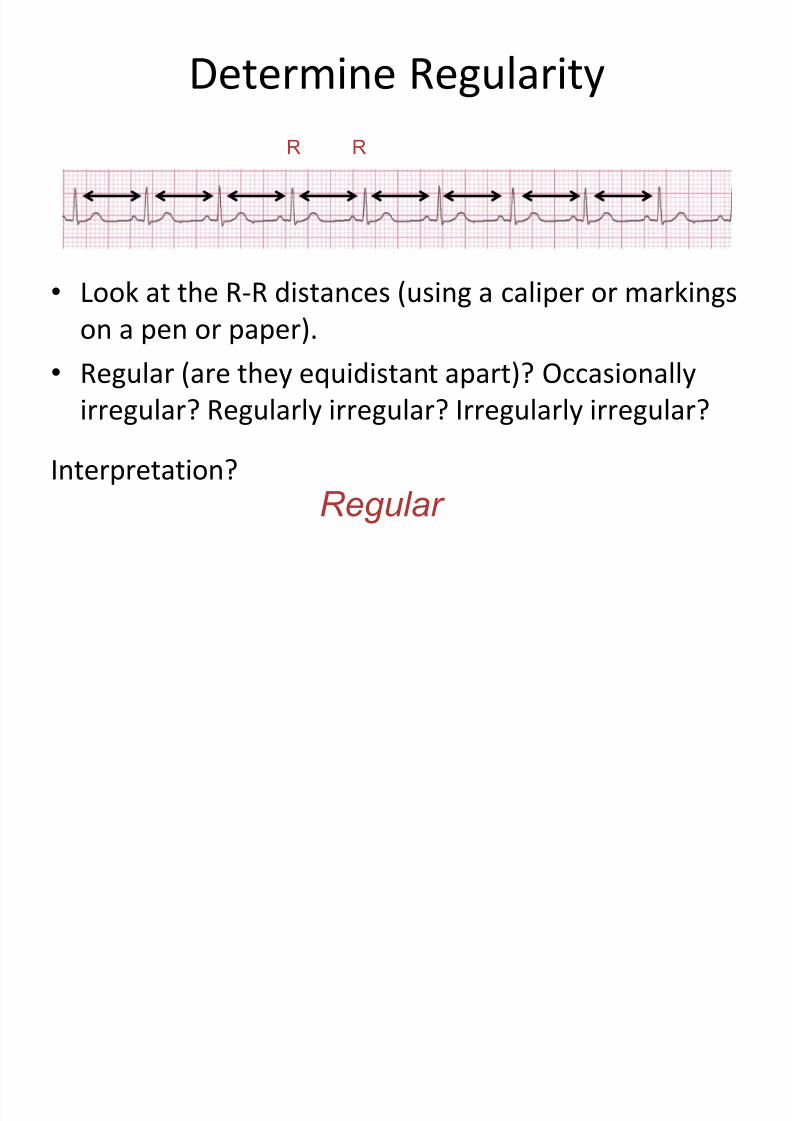
Determine the Rate
1. Find an R-wave that peaks on a heavy black
line (start line)
2. Count off ‘300, 150, 100’ for the three thick
lines that follow the start line
3. Count off the next three lines as ‘75, 60, 50’
4. Where the next R-wave falls, determines the
rate
8/13/2019 N 564 EKG Interpretation Lecture Version 2013 Stein
http://slidepdf.com/reader/full/n-564-ekg-interpretation-lecture-version-2013-stein 54/189
8/13/2019 N 564 EKG Interpretation Lecture Version 2013 Stein
http://slidepdf.com/reader/full/n-564-ekg-interpretation-lecture-version-2013-stein 55/189
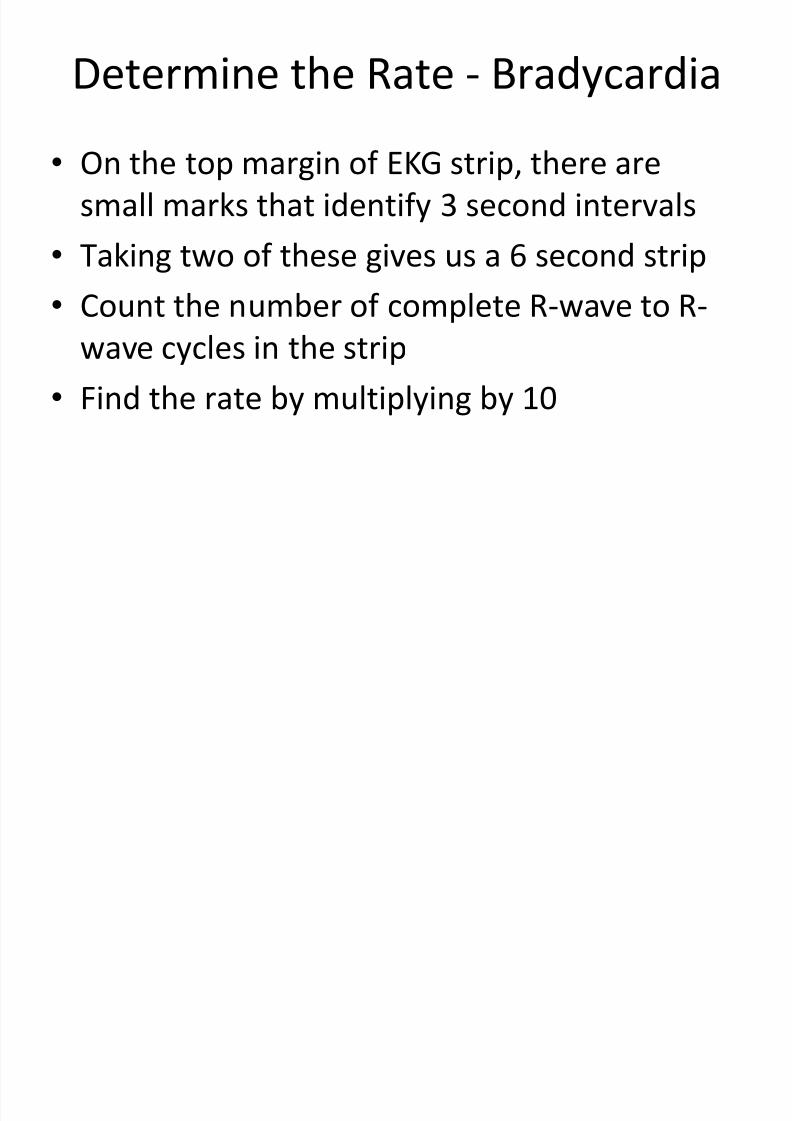
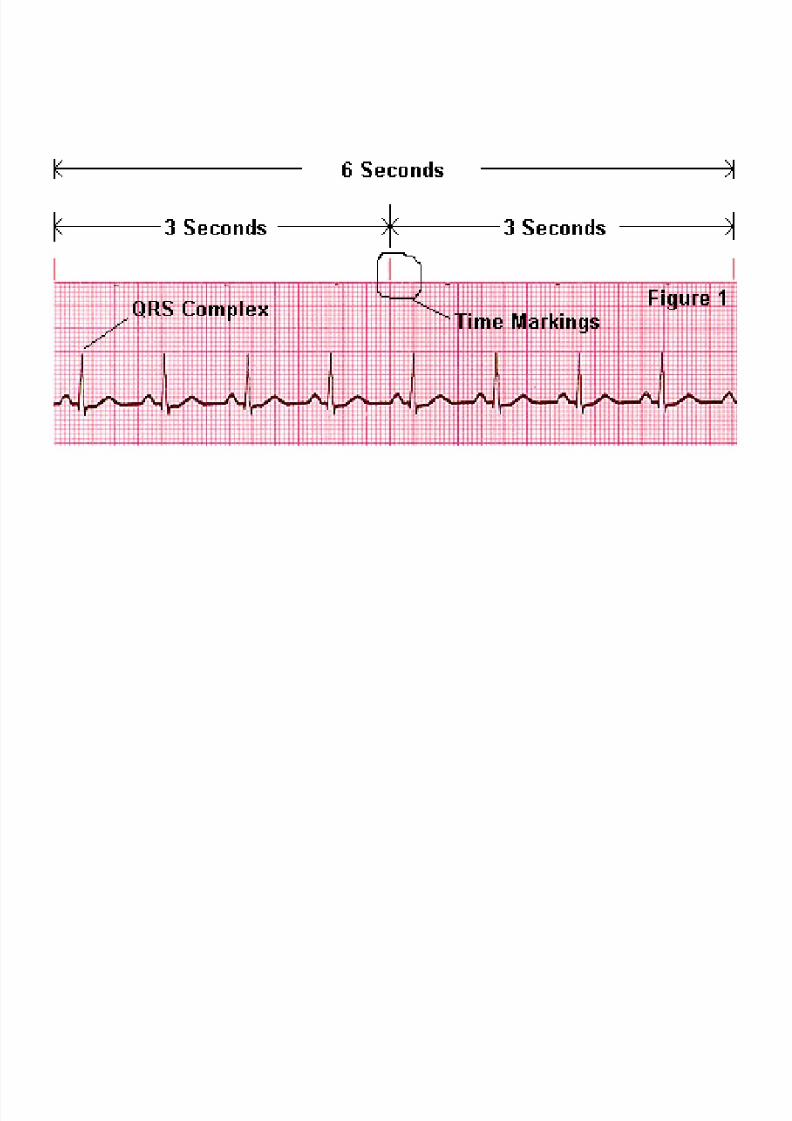
Determine the Rate - Bradycardia
• On the top margin of EKG strip, there are
small marks that identify 3 second intervals
• Taking two of these gives us a 6 second strip
• Count the number of complete R-wave to R-
wave cycles in the strip
• Find the rate by multiplying by 10
8/13/2019 N 564 EKG Interpretation Lecture Version 2013 Stein
http://slidepdf.com/reader/full/n-564-ekg-interpretation-lecture-version-2013-stein 56/189
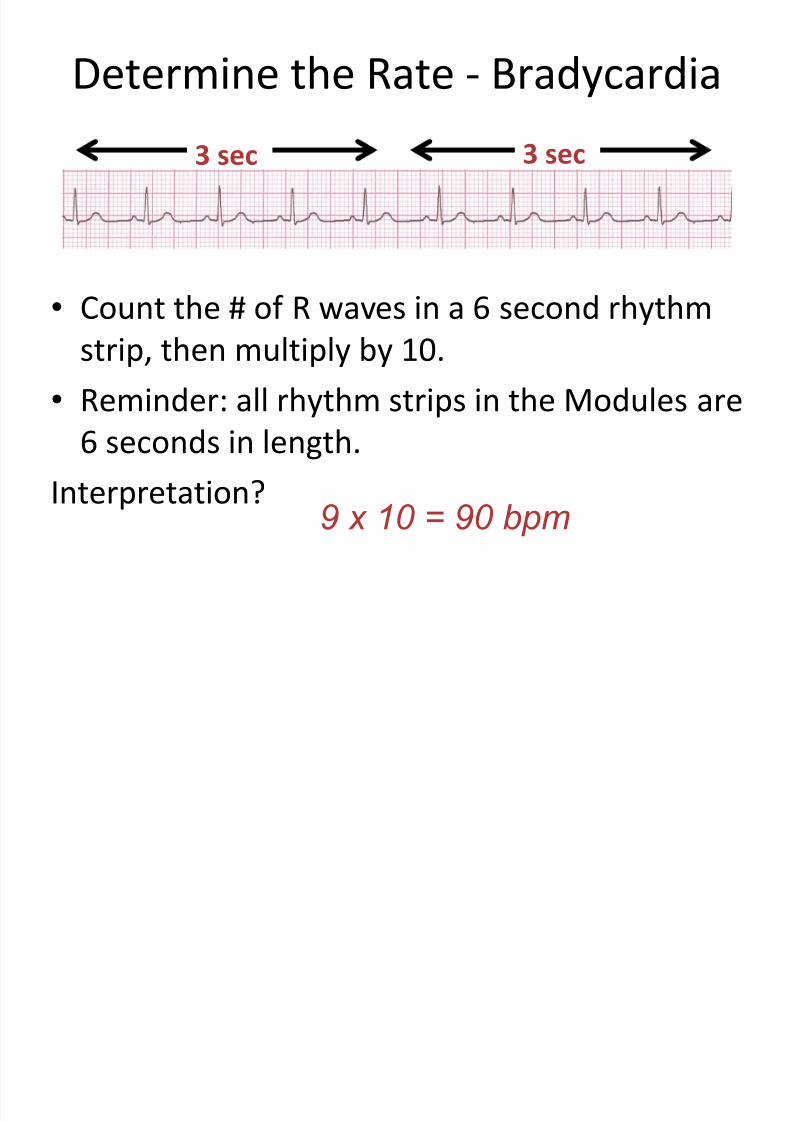
Determine the Rate - Bradycardia
• Count the # of R waves in a 6 second rhythm
strip, then multiply by 10.
• Reminder: all rhythm strips in the Modules are
6 seconds in length.
Interpretation?9 x 10 = 90 bpm
3 sec 3 sec
8/13/2019 N 564 EKG Interpretation Lecture Version 2013 Stein
http://slidepdf.com/reader/full/n-564-ekg-interpretation-lecture-version-2013-stein 57/189

8/13/2019 N 564 EKG Interpretation Lecture Version 2013 Stein
http://slidepdf.com/reader/full/n-564-ekg-interpretation-lecture-version-2013-stein 58/189
Determine the Rate
• Say “300, 150, 100” …“75, 60, 50”
• But for bradycardia: rate = cycles/6 sec. strip
✕ 10

8/13/2019 N 564 EKG Interpretation Lecture Version 2013 Stein
http://slidepdf.com/reader/full/n-564-ekg-interpretation-lecture-version-2013-stein 59/189
EKG Interpretation
1. Rate
2. RHYTHM
3. Axis
4. Hypertrophy
5. Infarction
8/13/2019 N 564 EKG Interpretation Lecture Version 2013 Stein
http://slidepdf.com/reader/full/n-564-ekg-interpretation-lecture-version-2013-stein 60/189
8/13/2019 N 564 EKG Interpretation Lecture Version 2013 Stein
http://slidepdf.com/reader/full/n-564-ekg-interpretation-lecture-version-2013-stein 61/189
8/13/2019 N 564 EKG Interpretation Lecture Version 2013 Stein
http://slidepdf.com/reader/full/n-564-ekg-interpretation-lecture-version-2013-stein 62/189
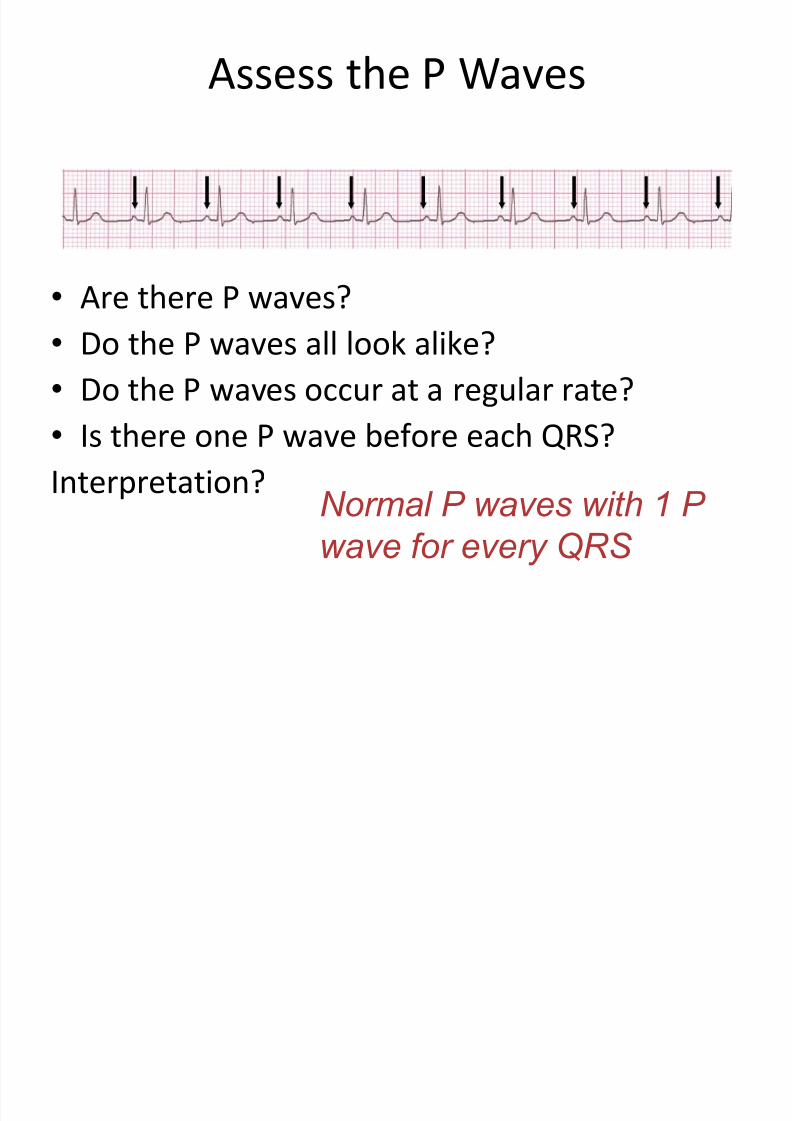
Assess the P Waves
• Are there P waves?
• Do the P waves all look alike?
• Do the P waves occur at a regular rate?
• Is there one P wave before each QRS? Interpretation?
Normal P waves with 1 P
wave for every QRS
8/13/2019 N 564 EKG Interpretation Lecture Version 2013 Stein
http://slidepdf.com/reader/full/n-564-ekg-interpretation-lecture-version-2013-stein 63/189
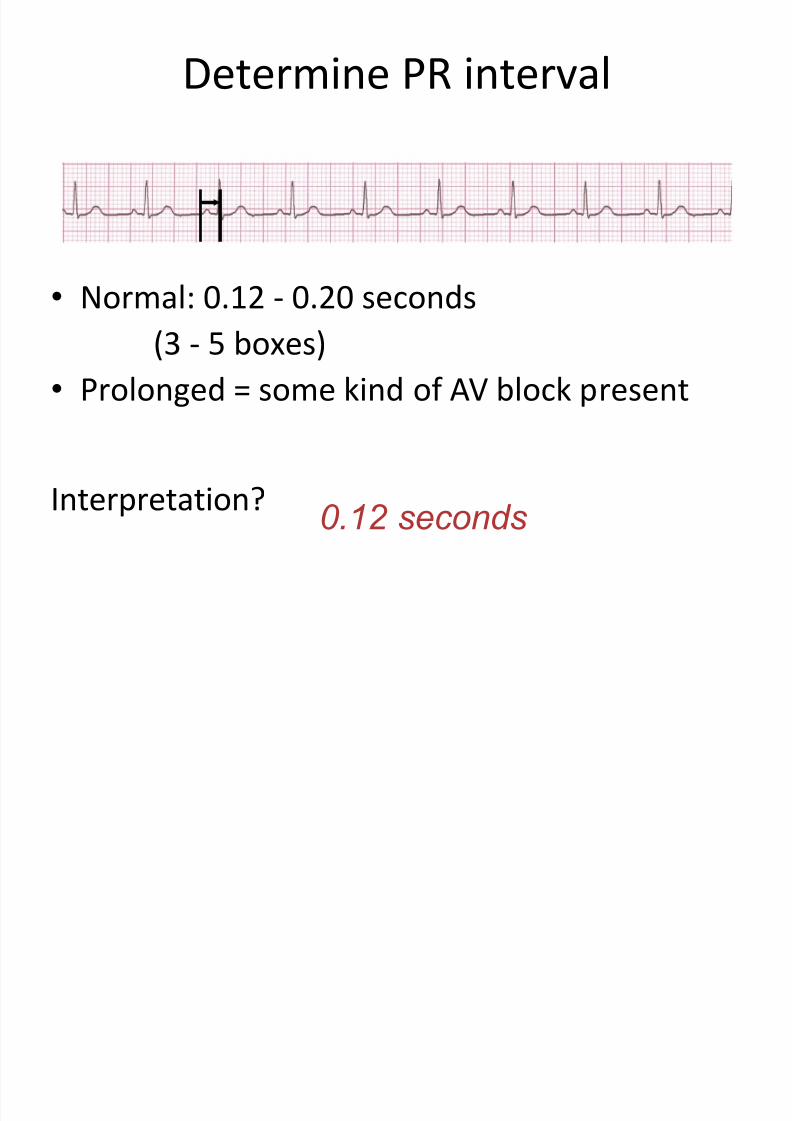
Determine PR interval
• Normal: 0.12 - 0.20 seconds
(3 - 5 boxes)
• Prolonged = some kind of AV block present
Interpretation? 0.12 seconds
8/13/2019 N 564 EKG Interpretation Lecture Version 2013 Stein
http://slidepdf.com/reader/full/n-564-ekg-interpretation-lecture-version-2013-stein 64/189
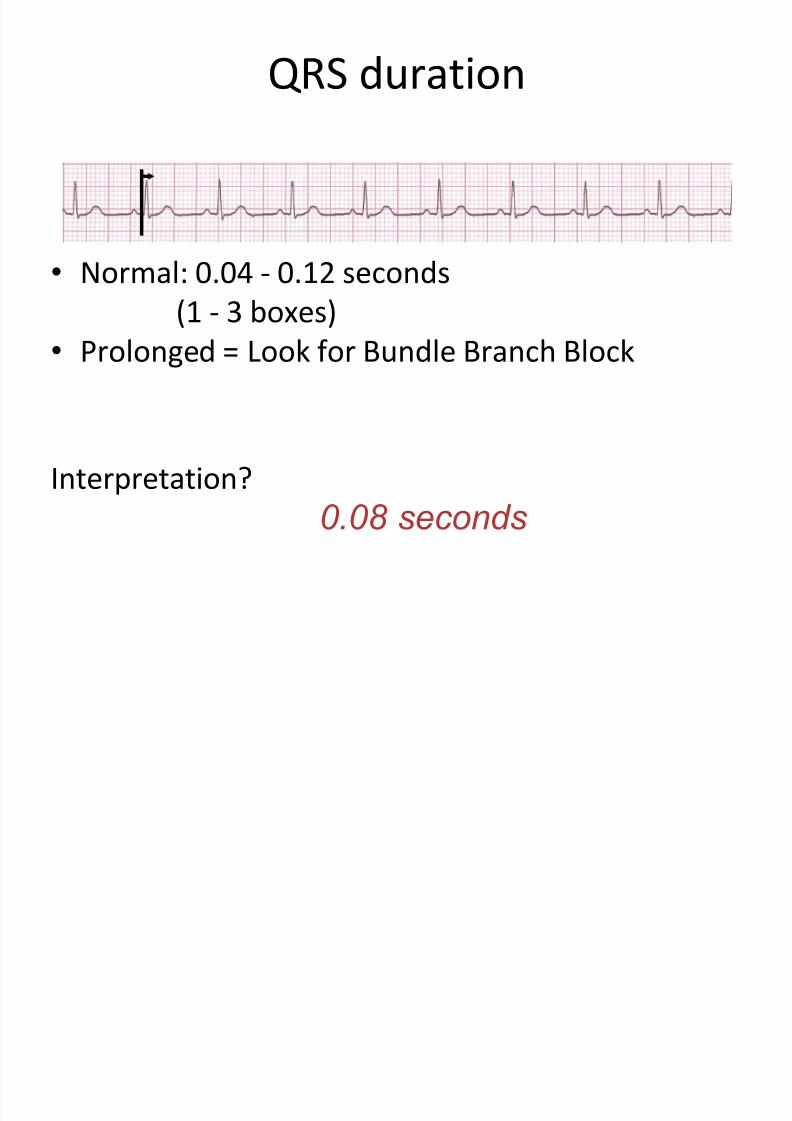
QRS duration
•
Normal: 0.04 - 0.12 seconds(1 - 3 boxes)
• Prolonged = Look for Bundle Branch Block
Interpretation?
0.08 seconds

8/13/2019 N 564 EKG Interpretation Lecture Version 2013 Stein
http://slidepdf.com/reader/full/n-564-ekg-interpretation-lecture-version-2013-stein 65/189
Sinus Rhythm
• Origin is the SA Node (“Sinus Node”)
• Normal sinus rate is 60 to 100/minute
• Rate more than 100/min. = Sinus Tachycardia
• Rate less than 60/min. = Sinus Bradycardia
8/13/2019 N 564 EKG Interpretation Lecture Version 2013 Stein
http://slidepdf.com/reader/full/n-564-ekg-interpretation-lecture-version-2013-stein 66/189
Arrhythmias
• Irregular rhythms
• Escape
• Premature beats
• Tachy-arrhythmias
8/13/2019 N 564 EKG Interpretation Lecture Version 2013 Stein
http://slidepdf.com/reader/full/n-564-ekg-interpretation-lecture-version-2013-stein 67/189
Irregular Rhythms
• Sinus Arrhythmia
• Wandering Pacemaker
• Multifocal Atrial Tachycardia
• Atrial Fibrillation
Usually caused by multiple, active automaticity
sites!
8/13/2019 N 564 EKG Interpretation Lecture Version 2013 Stein
http://slidepdf.com/reader/full/n-564-ekg-interpretation-lecture-version-2013-stein 68/189
Escape
• Escape Rhythm – an automaticity focus escapesoverdrive suppression to pace at its inherent rate
– Atrial Escape Rhythm
– Junctional Escape Rhythm
– Ventricular Escape Rhythm
• Escape Beat – an automaticity focus transientlyescapes overdrive suppression to emit one beat
– Atrial Escape Beat – Junctional Escape Beat
– Ventricular Escape Beat
8/13/2019 N 564 EKG Interpretation Lecture Version 2013 Stein
http://slidepdf.com/reader/full/n-564-ekg-interpretation-lecture-version-2013-stein 69/189
Premature Beats
• Premature Beat – an irritable focus
spontaneously fires a single stimulus
– Premature Atrial Beat
– Premature Junctional Beat
– Premature Ventricular Contraction (PVC)

8/13/2019 N 564 EKG Interpretation Lecture Version 2013 Stein
http://slidepdf.com/reader/full/n-564-ekg-interpretation-lecture-version-2013-stein 70/189
Tachyarrhythmias

8/13/2019 N 564 EKG Interpretation Lecture Version 2013 Stein
http://slidepdf.com/reader/full/n-564-ekg-interpretation-lecture-version-2013-stein 71/189
Blocks
• Sinus Block
• AV Block
• Bundle Branch Block
• Hemiblock
8/13/2019 N 564 EKG Interpretation Lecture Version 2013 Stein
http://slidepdf.com/reader/full/n-564-ekg-interpretation-lecture-version-2013-stein 72/189
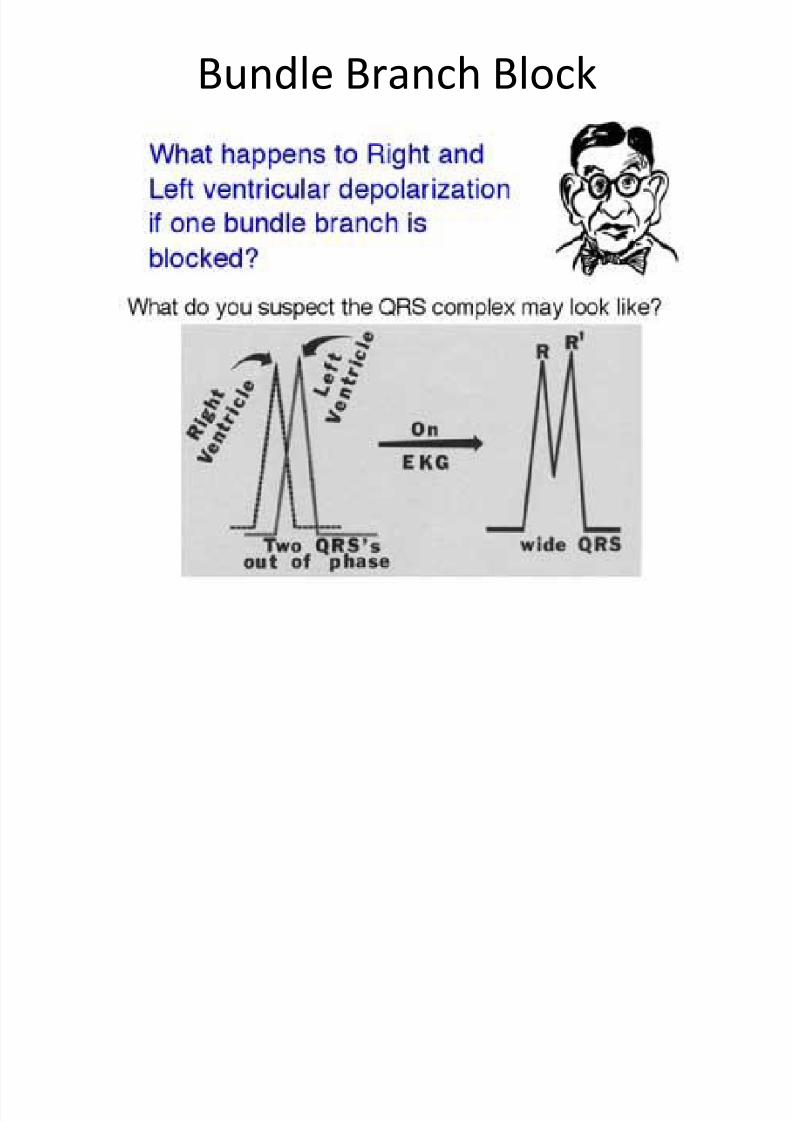
Bundle Branch Block
• Caused by a block of conduction in the Right orLeft Bundle Branch
• Delays depolarization to the ventricle that itsupplies
• Ordinarily both ventricles depolarizesimultaneously
• With BBB, one ventricle depolarizes slightly laterthan the other – RBBB – Right ventricular depolarization is delayed – LBBB – Left ventricular depolarization is delayed
8/13/2019 N 564 EKG Interpretation Lecture Version 2013 Stein
http://slidepdf.com/reader/full/n-564-ekg-interpretation-lecture-version-2013-stein 73/189
Bundle Branch Block
8/13/2019 N 564 EKG Interpretation Lecture Version 2013 Stein
http://slidepdf.com/reader/full/n-564-ekg-interpretation-lecture-version-2013-stein 74/189
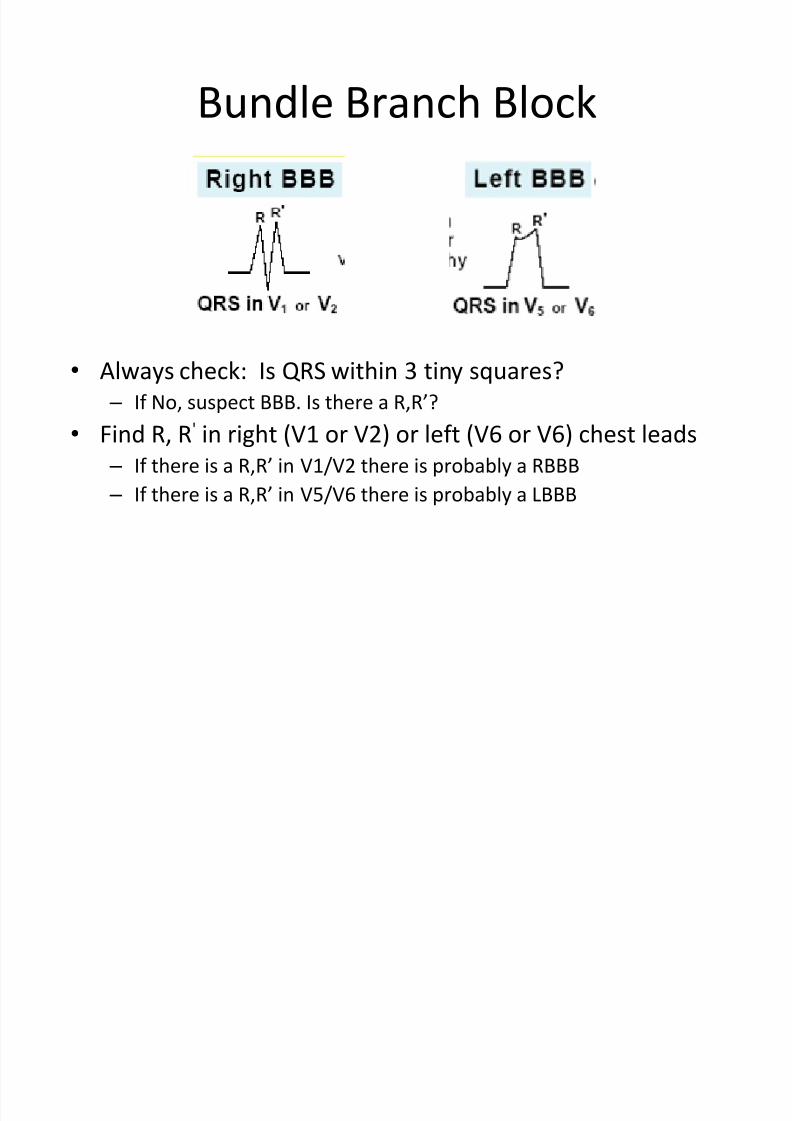
Bundle Branch Block
• Widened QRS
– Greater than 3 small squares or 0.12 sec
• Look for two R-waves
– R and R’
• Look for wide S
8/13/2019 N 564 EKG Interpretation Lecture Version 2013 Stein
http://slidepdf.com/reader/full/n-564-ekg-interpretation-lecture-version-2013-stein 75/189
Bundle Branch Block
• Always check: Is QRS within 3 tiny squares?
– If No, suspect BBB. Is there a R,R’?
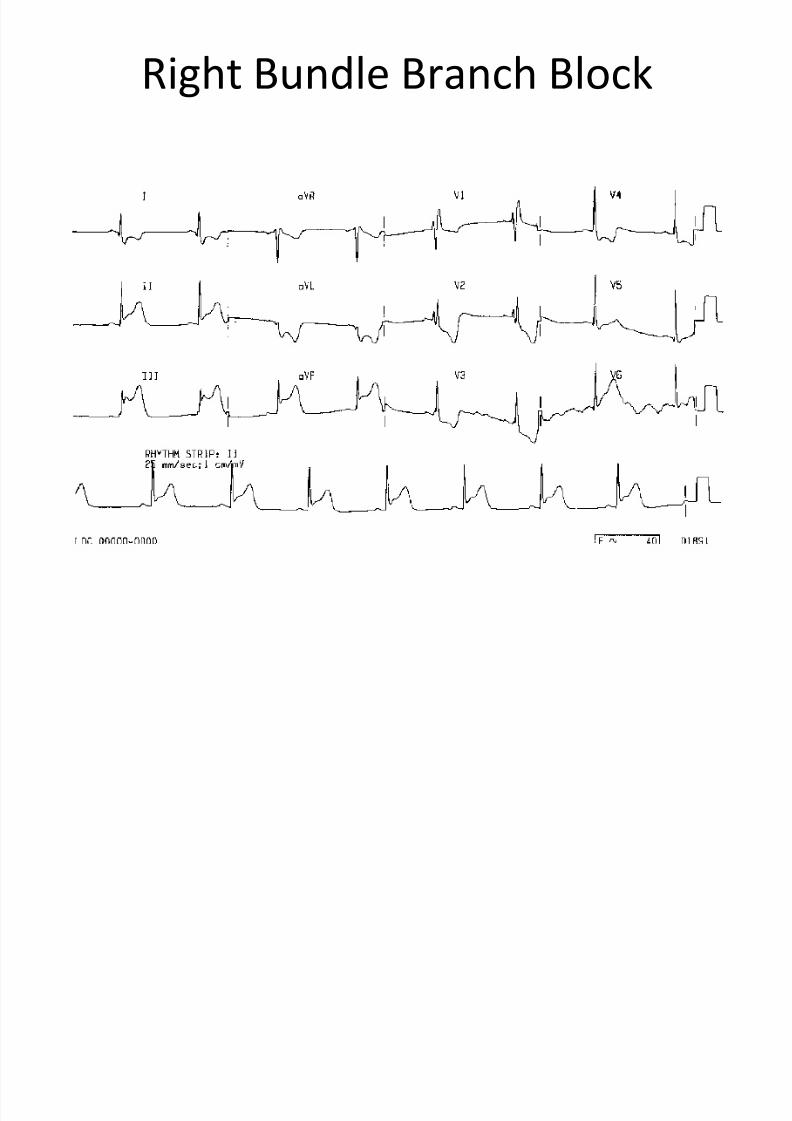
• Find R, R' in right (V1 or V2) or left (V6 or V6) chest leads – If there is a R,R’ in V1/V2 there is probably a RBBB
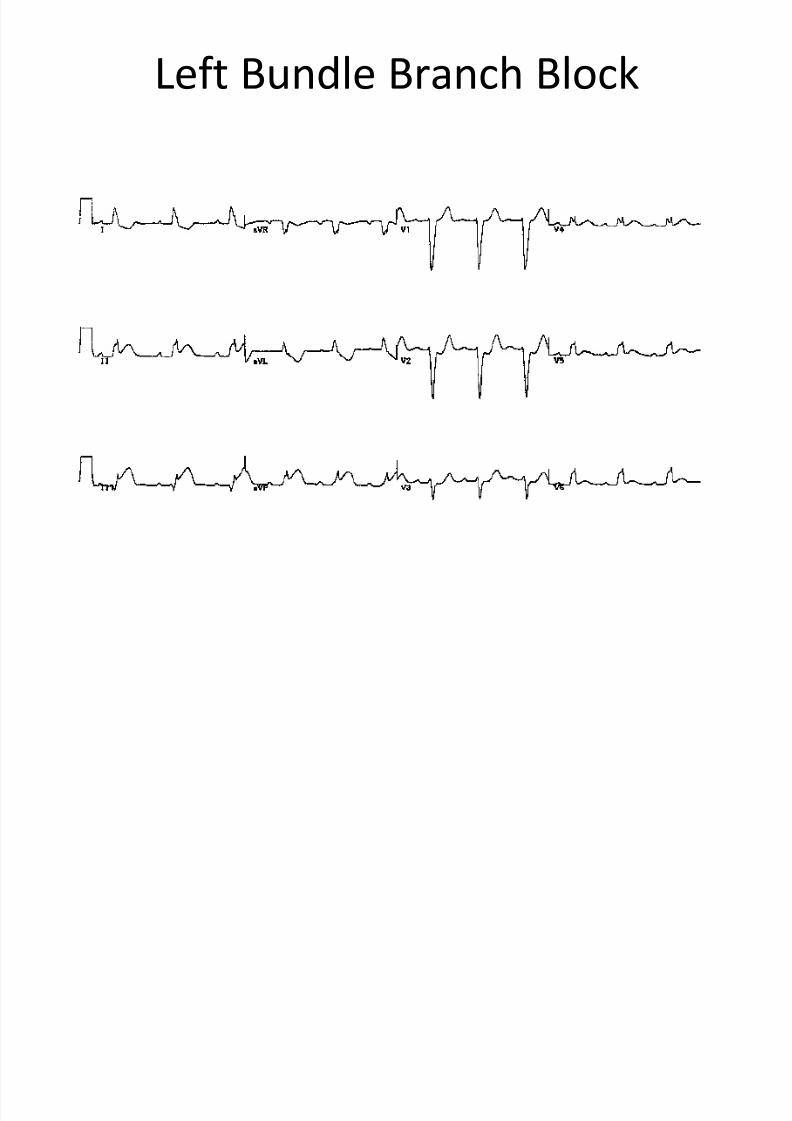
– If there is a R,R’ in V5/V6 there is probably a LBBB

8/13/2019 N 564 EKG Interpretation Lecture Version 2013 Stein
http://slidepdf.com/reader/full/n-564-ekg-interpretation-lecture-version-2013-stein 76/189
8/13/2019 N 564 EKG Interpretation Lecture Version 2013 Stein
http://slidepdf.com/reader/full/n-564-ekg-interpretation-lecture-version-2013-stein 77/189
Right Bundle Branch Block

8/13/2019 N 564 EKG Interpretation Lecture Version 2013 Stein
http://slidepdf.com/reader/full/n-564-ekg-interpretation-lecture-version-2013-stein 78/189
f dl h l k
8/13/2019 N 564 EKG Interpretation Lecture Version 2013 Stein
http://slidepdf.com/reader/full/n-564-ekg-interpretation-lecture-version-2013-stein 79/189
Left Bundle Branch Block
dl h l k
8/13/2019 N 564 EKG Interpretation Lecture Version 2013 Stein
http://slidepdf.com/reader/full/n-564-ekg-interpretation-lecture-version-2013-stein 80/189
Bundle Branch Block
• The mean axis can’t be determined in the
presence of a BBB
• Ventricular hypertrophy can’t be determined
accurately in presence of BBB
ibl k
8/13/2019 N 564 EKG Interpretation Lecture Version 2013 Stein
http://slidepdf.com/reader/full/n-564-ekg-interpretation-lecture-version-2013-stein 81/189
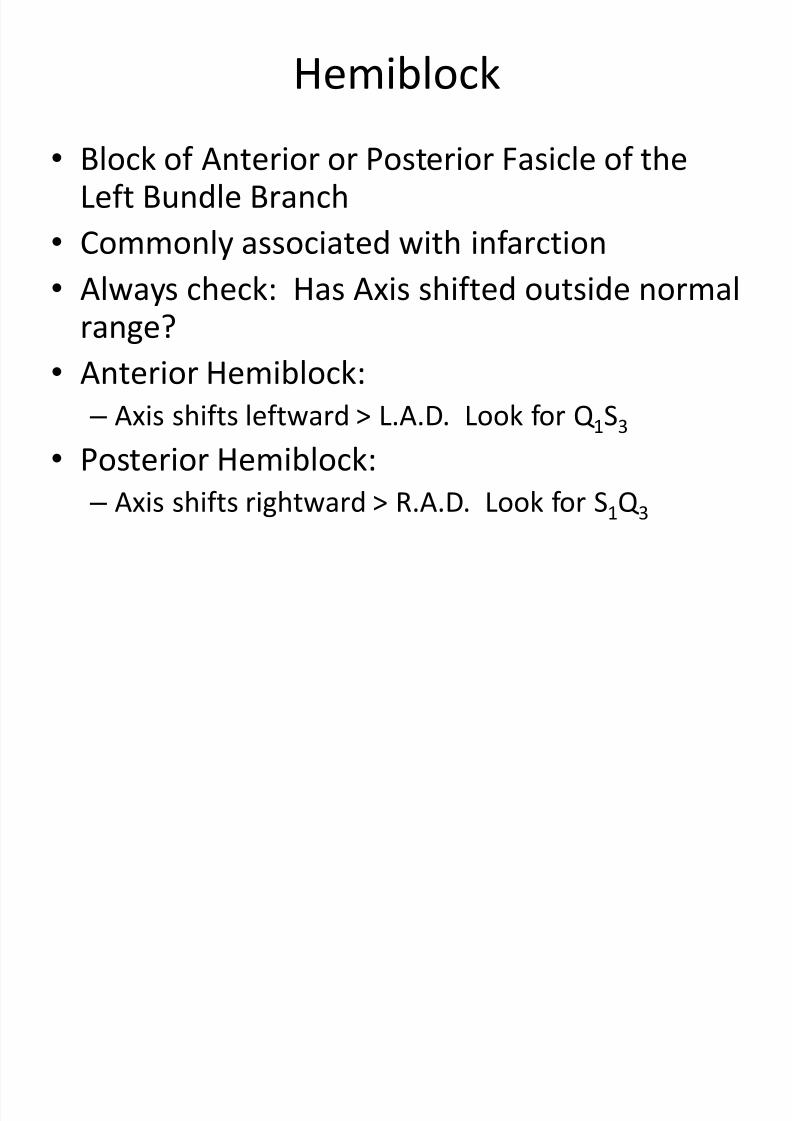
Hemiblock
• Block of Anterior or Posterior Fasicle of theLeft Bundle Branch
• Commonly associated with infarction
• Always check: Has Axis shifted outside normalrange?
• Anterior Hemiblock:
–
Axis shifts leftward > L.A.D. Look for Q 1S3
• Posterior Hemiblock:
– Axis shifts rightward > R.A.D. Look for S1Q 3
H ibl k

8/13/2019 N 564 EKG Interpretation Lecture Version 2013 Stein
http://slidepdf.com/reader/full/n-564-ekg-interpretation-lecture-version-2013-stein 82/189
Hemiblock
• Commonly due to loss of blood supply to theanterior or posterior division of the left bundlebranch – Anterior hemiblock
•Often associated with anterior infarction
• Results from occlusion of supply through branches of – LAD
– Posterior hemiblock• Rare d/t collateral circulation
• Results from occlusion of supply through branches of – RCA
– LCA
» LAD
A i H ibl k
8/13/2019 N 564 EKG Interpretation Lecture Version 2013 Stein
http://slidepdf.com/reader/full/n-564-ekg-interpretation-lecture-version-2013-stein 83/189
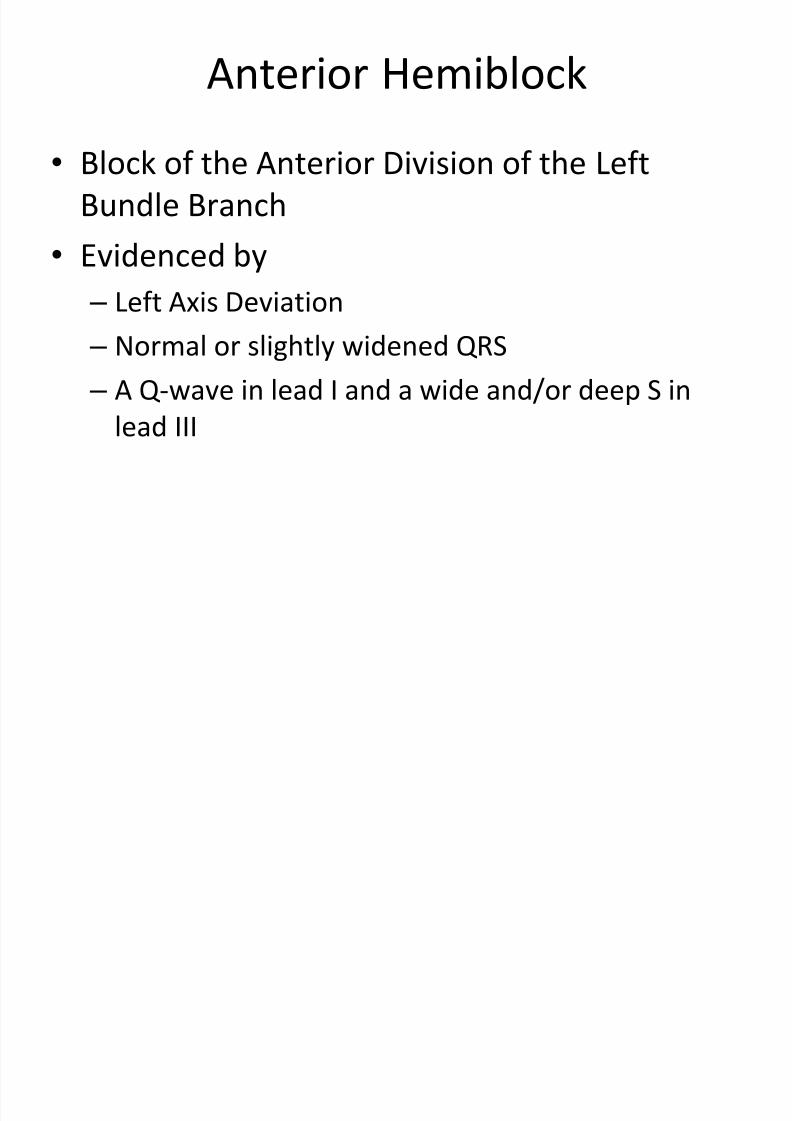
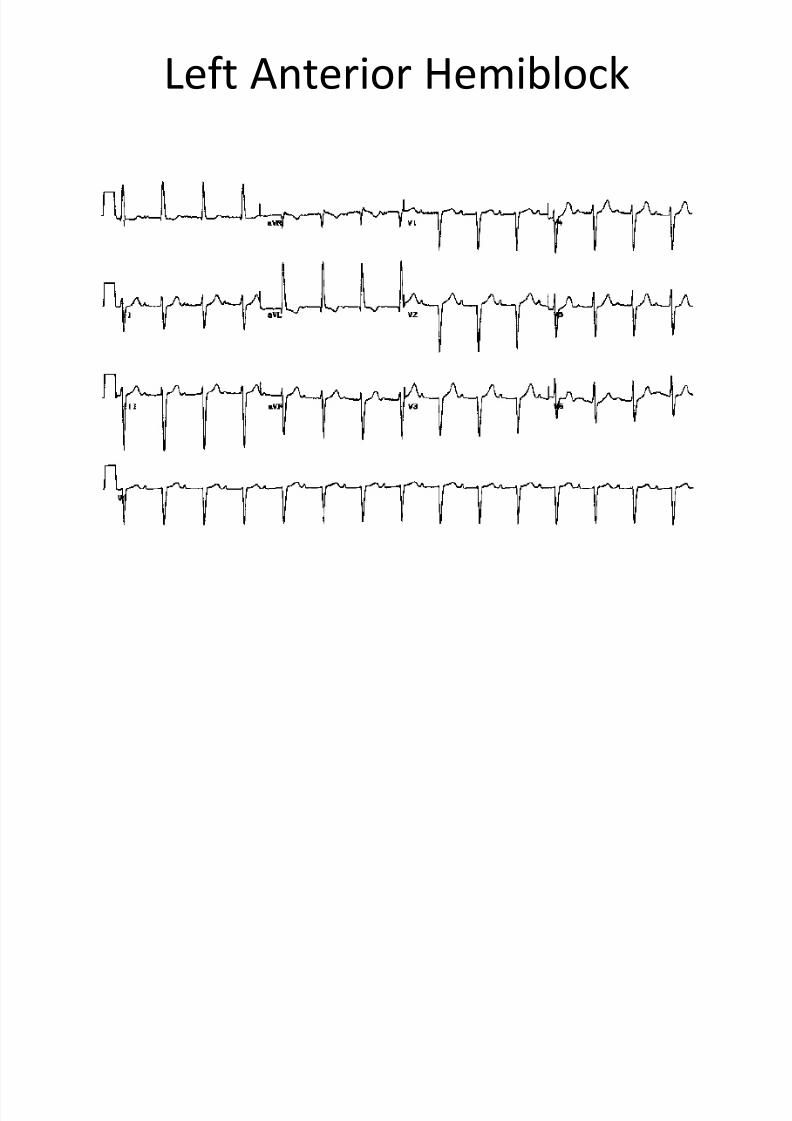
Anterior Hemiblock
• Block of the Anterior Division of the LeftBundle Branch
• Evidenced by
– Left Axis Deviation
– Normal or slightly widened QRS
– A Q-wave in lead I and a wide and/or deep S in
lead III
8/13/2019 N 564 EKG Interpretation Lecture Version 2013 Stein
http://slidepdf.com/reader/full/n-564-ekg-interpretation-lecture-version-2013-stein 84/189
P t i H ibl k
8/13/2019 N 564 EKG Interpretation Lecture Version 2013 Stein
http://slidepdf.com/reader/full/n-564-ekg-interpretation-lecture-version-2013-stein 85/189
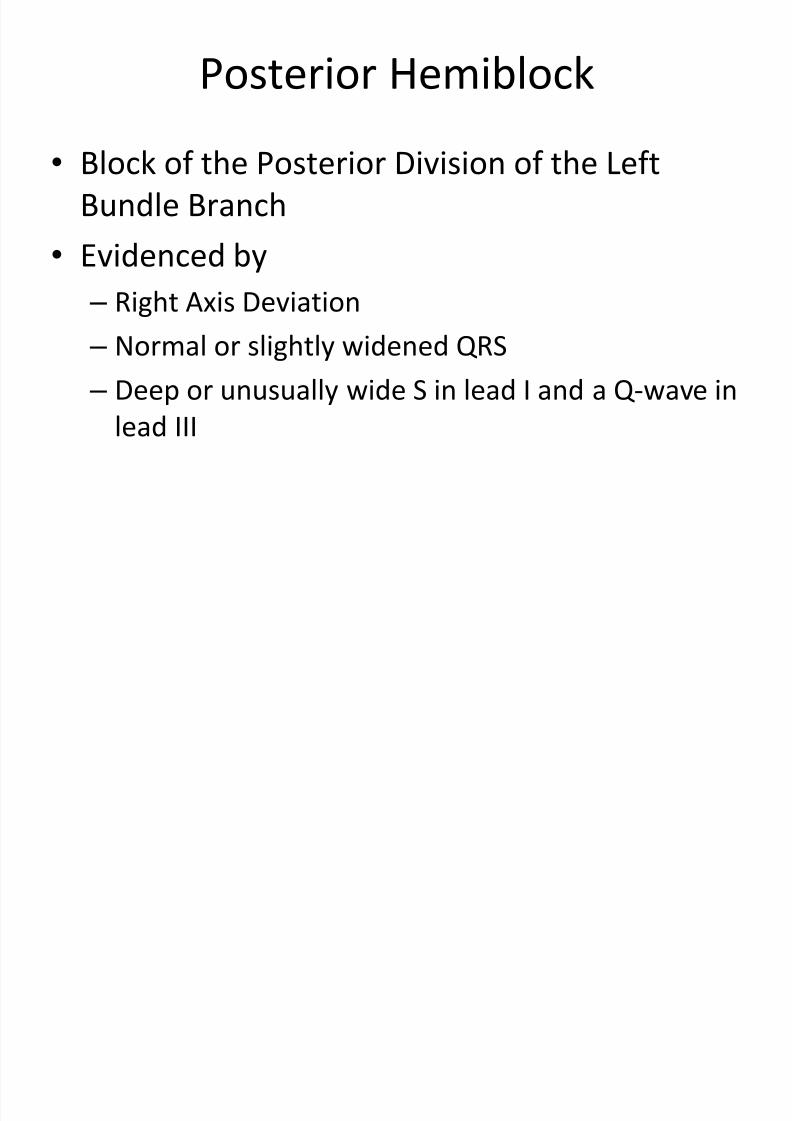
Posterior Hemiblock
• Block of the Posterior Division of the LeftBundle Branch
• Evidenced by
– Right Axis Deviation
– Normal or slightly widened QRS
– Deep or unusually wide S in lead I and a Q-wave in
lead III
Bif i l Bl k
8/13/2019 N 564 EKG Interpretation Lecture Version 2013 Stein
http://slidepdf.com/reader/full/n-564-ekg-interpretation-lecture-version-2013-stein 86/189
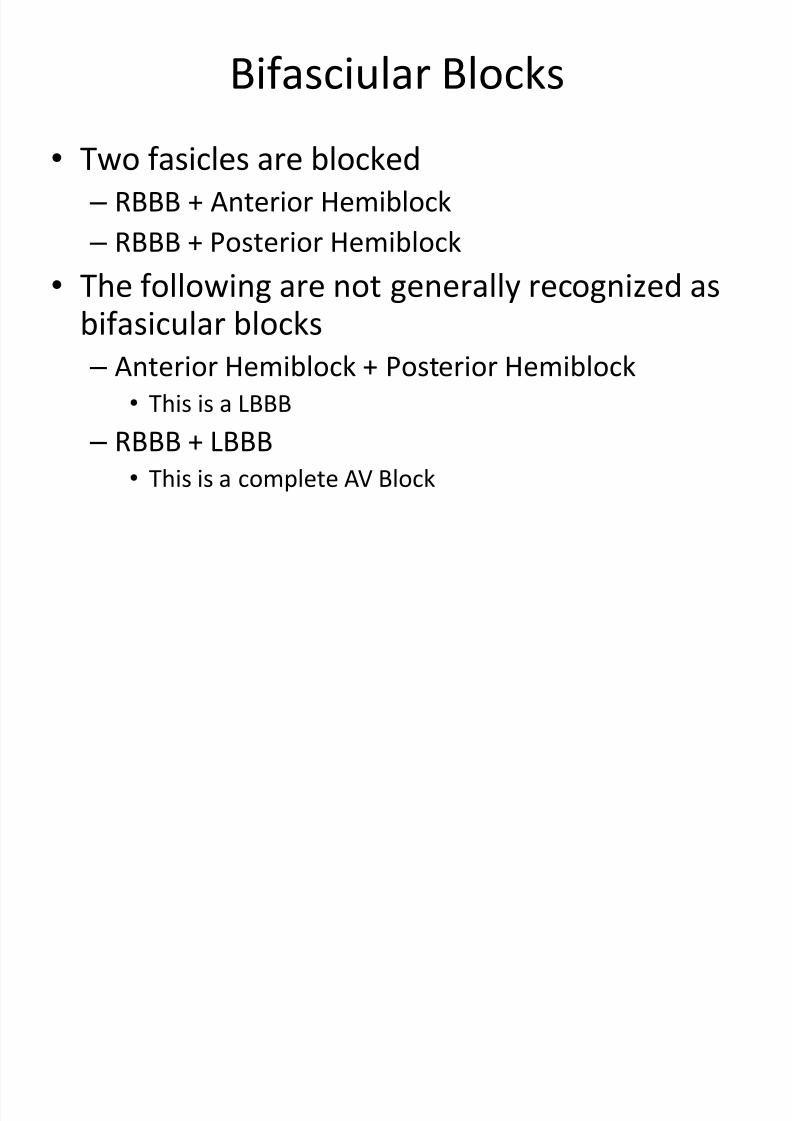
Bifasciular Blocks
• Two fasicles are blocked – RBBB + Anterior Hemiblock
– RBBB + Posterior Hemiblock
•The following are not generally recognized asbifasicular blocks
– Anterior Hemiblock + Posterior Hemiblock
• This is a LBBB
– RBBB + LBBB
• This is a complete AV Block
Ch k f th EKG

8/13/2019 N 564 EKG Interpretation Lecture Version 2013 Stein
http://slidepdf.com/reader/full/n-564-ekg-interpretation-lecture-version-2013-stein 87/189
Check for these on every EKG
• Rate
• Rhythm
• AXIS
• Hypertrophy
• Infarction
Using Vectors to Represent Electrical

8/13/2019 N 564 EKG Interpretation Lecture Version 2013 Stein
http://slidepdf.com/reader/full/n-564-ekg-interpretation-lecture-version-2013-stein 88/189
g p
Potentials
• A vector is an arrow that points in the direction of theelectrical potential generated by current flow
– Used to show the overall direction of the movement of
depolarization throughout the heart
• The arrowhead of the vector is in the positive direction
– Flow proceeds from negative pole to positive pole
• The length of the arrow is drawn proportional to the
voltage of the potential
8/13/2019 N 564 EKG Interpretation Lecture Version 2013 Stein
http://slidepdf.com/reader/full/n-564-ekg-interpretation-lecture-version-2013-stein 89/189
8/13/2019 N 564 EKG Interpretation Lecture Version 2013 Stein
http://slidepdf.com/reader/full/n-564-ekg-interpretation-lecture-version-2013-stein 90/189
M QRS V t
8/13/2019 N 564 EKG Interpretation Lecture Version 2013 Stein
http://slidepdf.com/reader/full/n-564-ekg-interpretation-lecture-version-2013-stein 91/189
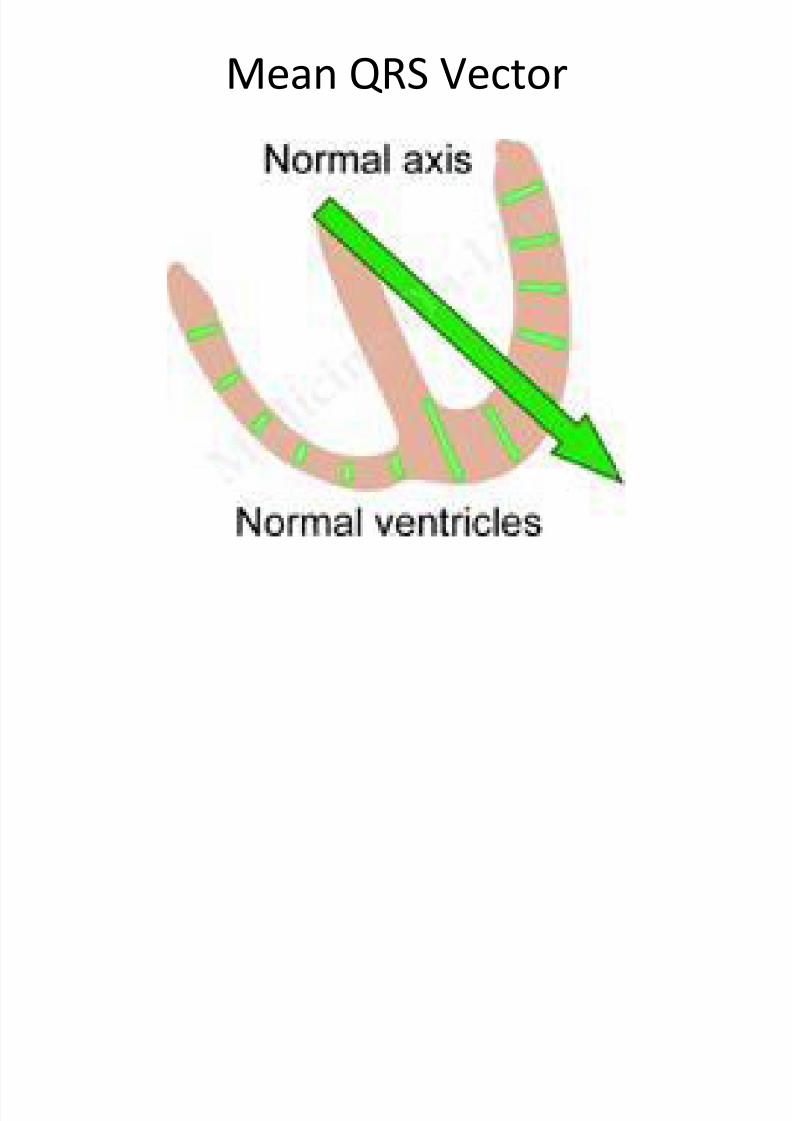
Mean QRS Vector
Causes of Axis Deviation
8/13/2019 N 564 EKG Interpretation Lecture Version 2013 Stein
http://slidepdf.com/reader/full/n-564-ekg-interpretation-lecture-version-2013-stein 92/189
Causes of Axis Deviation
• Change of the position of the heart in the chest – Obesity results in increased intrabdominal pressure
which places a horizontal displacement on the heart
– A tall slender pt may have a more vertical
displacement• Hypertrophy of one ventricle
– Axis deviates towards the hypertrophied muscle
• Myocardial infarction –
Axis deviated away from the damaged muscle• Bundle branch block
– Axis unreliable
8/13/2019 N 564 EKG Interpretation Lecture Version 2013 Stein
http://slidepdf.com/reader/full/n-564-ekg-interpretation-lecture-version-2013-stein 93/189
8/13/2019 N 564 EKG Interpretation Lecture Version 2013 Stein
http://slidepdf.com/reader/full/n-564-ekg-interpretation-lecture-version-2013-stein 94/189
Augmented Limb Leads

8/13/2019 N 564 EKG Interpretation Lecture Version 2013 Stein
http://slidepdf.com/reader/full/n-564-ekg-interpretation-lecture-version-2013-stein 95/189
Augmented Limb Leads
8/13/2019 N 564 EKG Interpretation Lecture Version 2013 Stein
http://slidepdf.com/reader/full/n-564-ekg-interpretation-lecture-version-2013-stein 96/189
Limb Leads
8/13/2019 N 564 EKG Interpretation Lecture Version 2013 Stein
http://slidepdf.com/reader/full/n-564-ekg-interpretation-lecture-version-2013-stein 97/189
Limb Leads
8/13/2019 N 564 EKG Interpretation Lecture Version 2013 Stein
http://slidepdf.com/reader/full/n-564-ekg-interpretation-lecture-version-2013-stein 98/189
All six limb leads meet to form six
intersecting leads that lie in a flat
“frontal” plane on the patient’s chest!

8/13/2019 N 564 EKG Interpretation Lecture Version 2013 Stein
http://slidepdf.com/reader/full/n-564-ekg-interpretation-lecture-version-2013-stein 99/189
8/13/2019 N 564 EKG Interpretation Lecture Version 2013 Stein
http://slidepdf.com/reader/full/n-564-ekg-interpretation-lecture-version-2013-stein 100/189
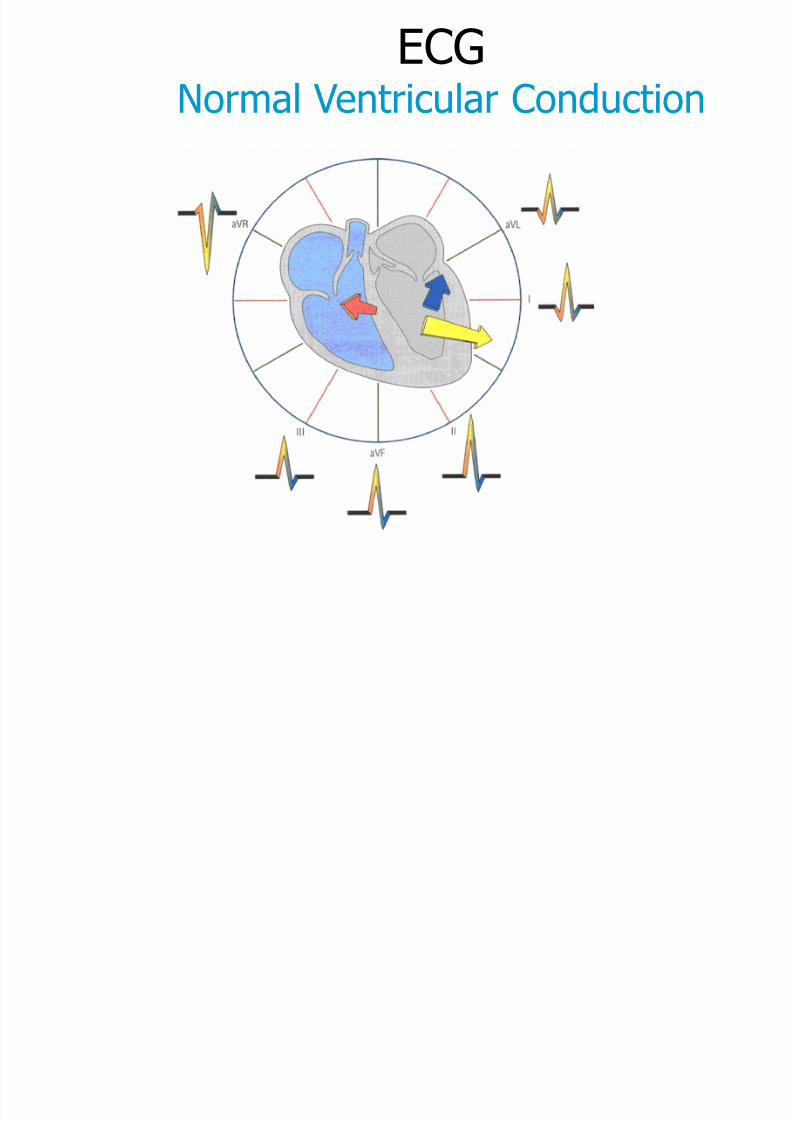
ECG
8/13/2019 N 564 EKG Interpretation Lecture Version 2013 Stein
http://slidepdf.com/reader/full/n-564-ekg-interpretation-lecture-version-2013-stein 101/189
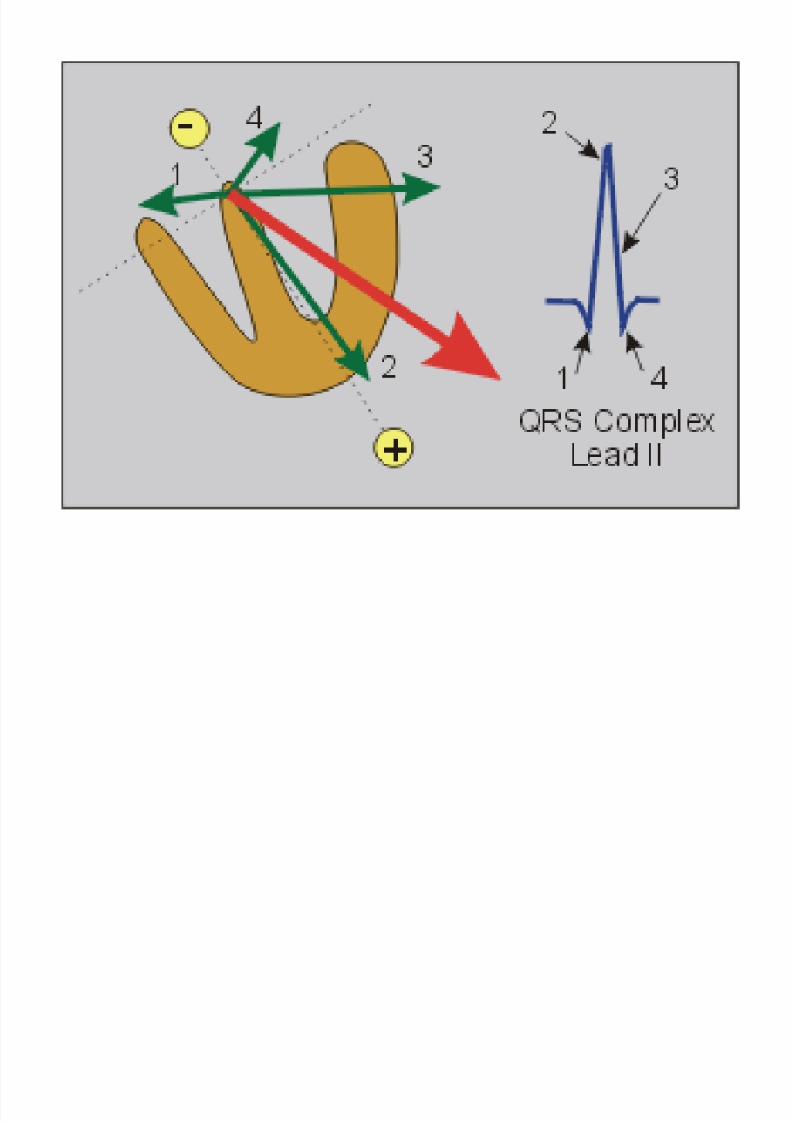
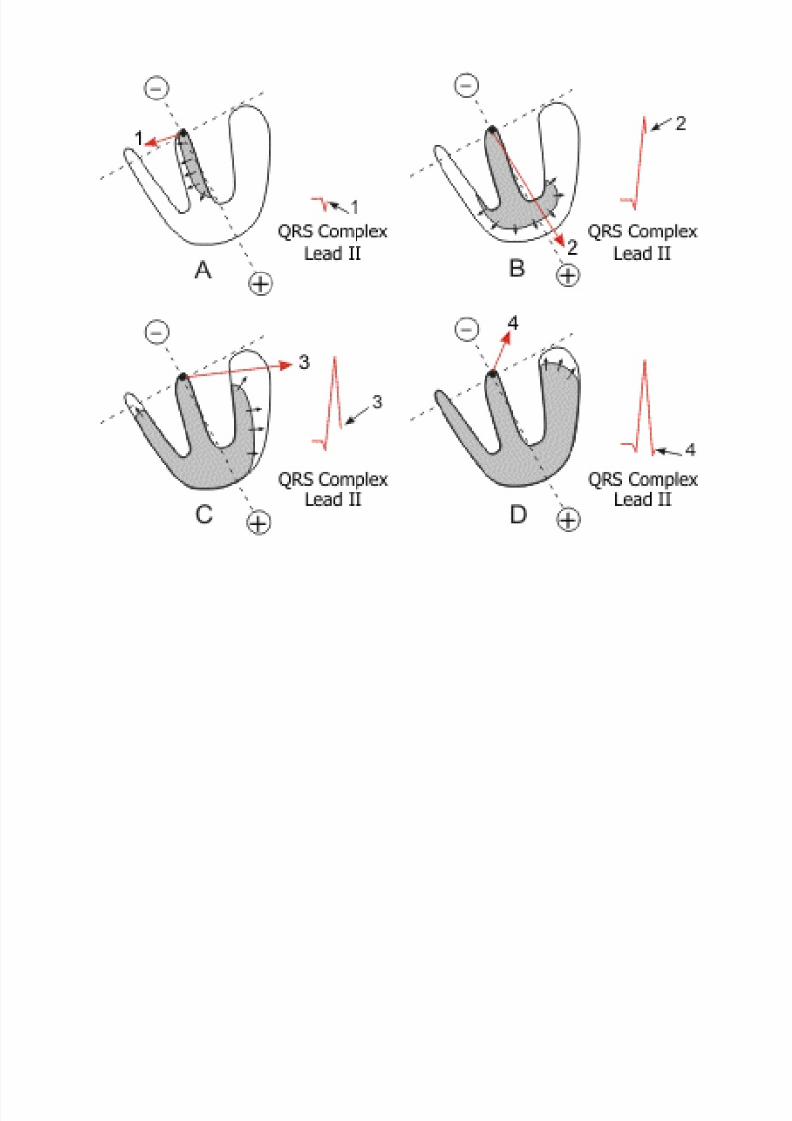
Normal Ventricular Conduction
Determining Axis Deviation
8/13/2019 N 564 EKG Interpretation Lecture Version 2013 Stein
http://slidepdf.com/reader/full/n-564-ekg-interpretation-lecture-version-2013-stein 102/189
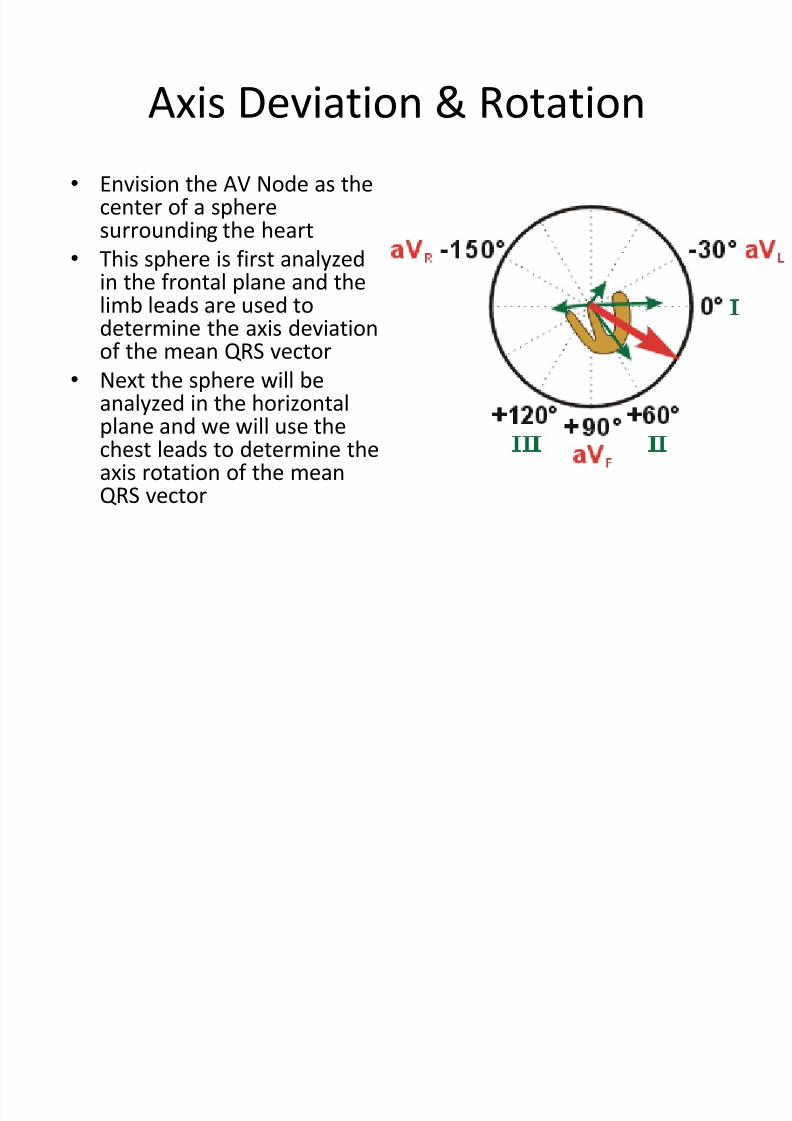
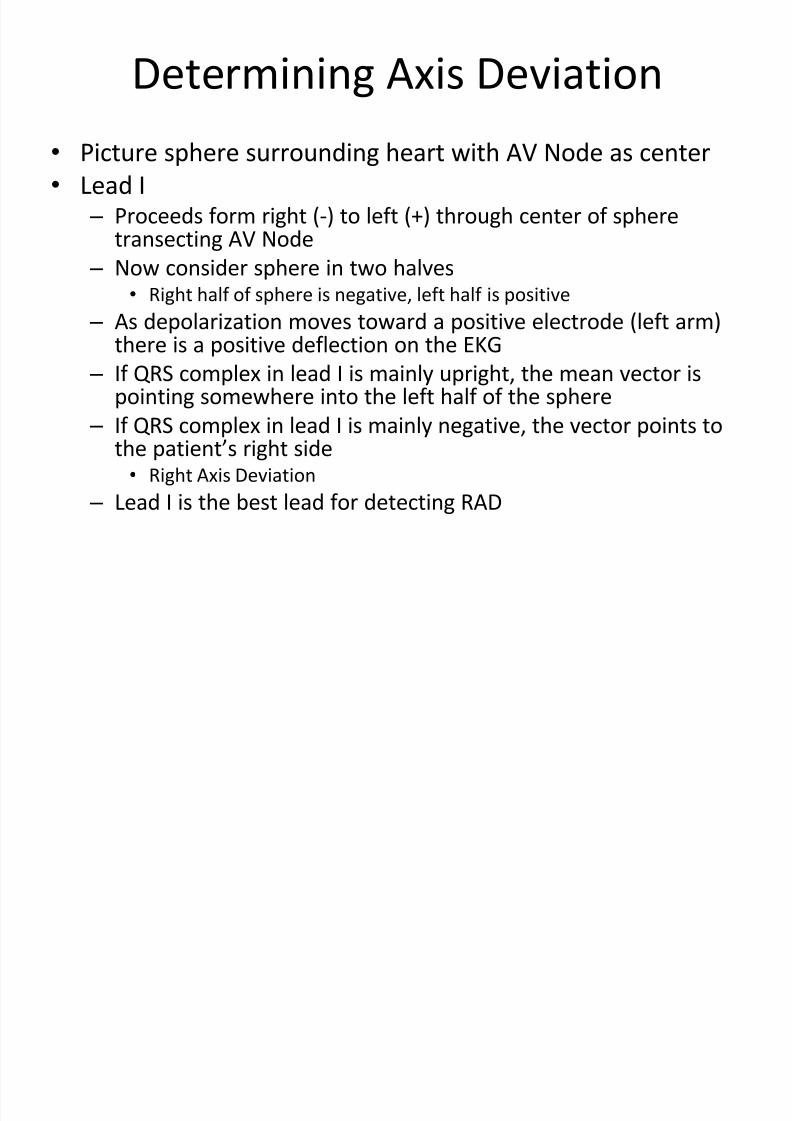
Determining Axis Deviation
•Picture sphere surrounding heart with AV Node as center
• Lead I – Proceeds form right (-) to left (+) through center of sphere
transecting AV Node
– Now consider sphere in two halves
• Right half of sphere is negative, left half is positive – As depolarization moves toward a positive electrode (left arm)
there is a positive deflection on the EKG
– If QRS complex in lead I is mainly upright, the mean vector ispointing somewhere into the left half of the sphere
–
If QRS complex in lead I is mainly negative, the vector points tothe patient’s right side • Right Axis Deviation
– Lead I is the best lead for detecting RAD
Determining Axis Deviation

8/13/2019 N 564 EKG Interpretation Lecture Version 2013 Stein
http://slidepdf.com/reader/full/n-564-ekg-interpretation-lecture-version-2013-stein 103/189
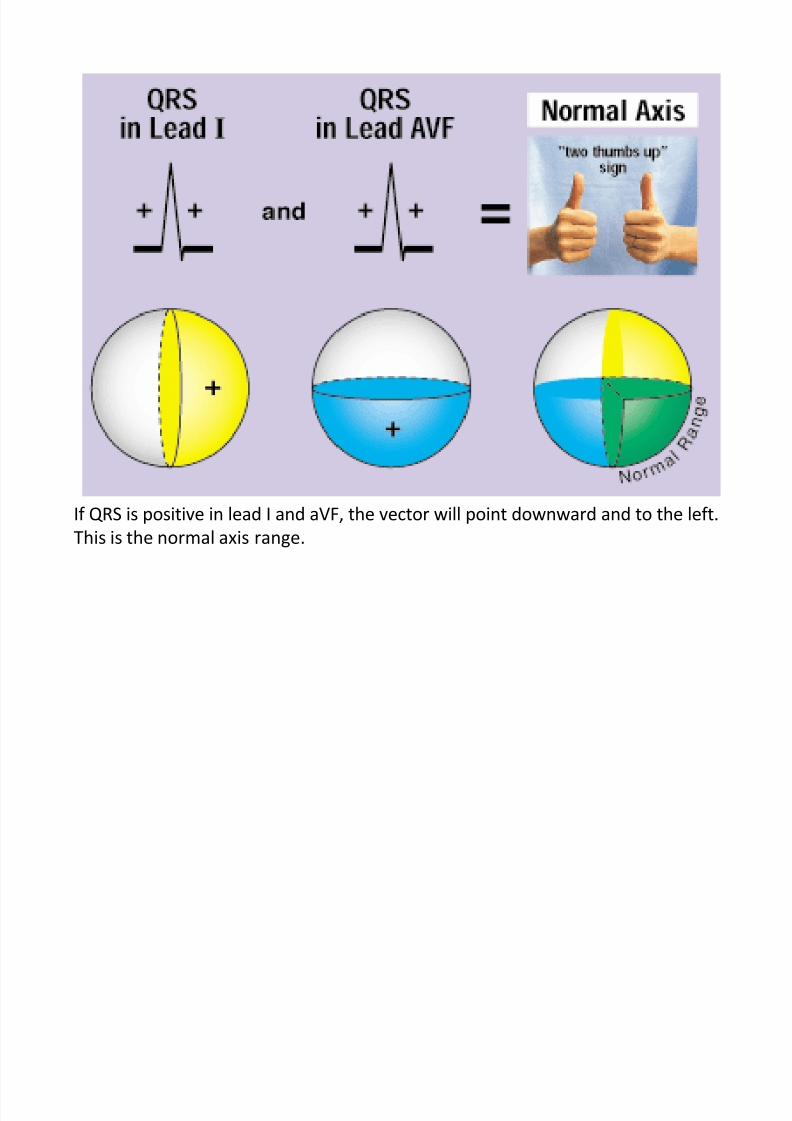
Determining Axis Deviation
• Picture sphere surrounding the patient with the AVNode as the center
• Lead aVF – Left foot has positive electrode
–
Lower half of the sphere is now positive – Upper half of sphere is now negative
– If the QRS is mainly positive in lead aVF, then the meanQRS vector points downward into the positive half of thesphere
–If QRS is negative in lead aVF, then the vector pointsupward into the negative half of the sphere
• Either LAD or extreme RAD
8/13/2019 N 564 EKG Interpretation Lecture Version 2013 Stein
http://slidepdf.com/reader/full/n-564-ekg-interpretation-lecture-version-2013-stein 104/189
If QRS is positive in lead I and aVF, the vector will point downward and to the left.
This is the normal axis range.
Axis Deviation
8/13/2019 N 564 EKG Interpretation Lecture Version 2013 Stein
http://slidepdf.com/reader/full/n-564-ekg-interpretation-lecture-version-2013-stein 105/189
Axis Deviation

8/13/2019 N 564 EKG Interpretation Lecture Version 2013 Stein
http://slidepdf.com/reader/full/n-564-ekg-interpretation-lecture-version-2013-stein 106/189
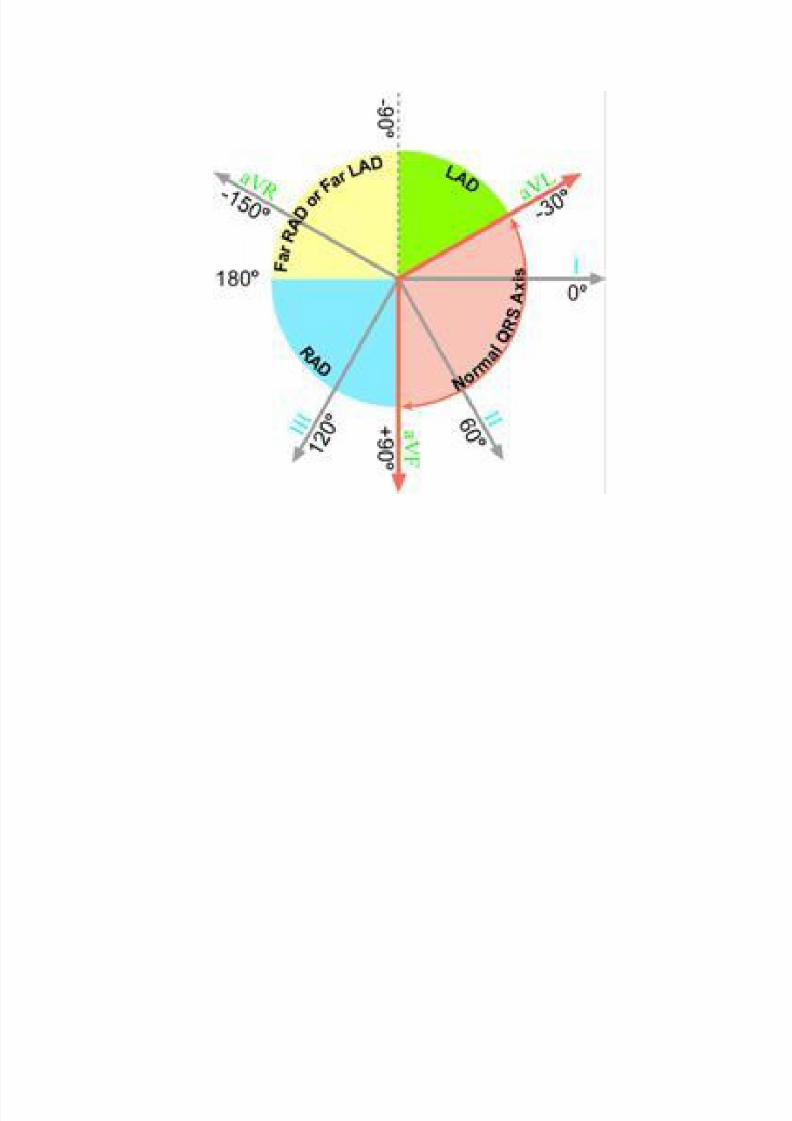
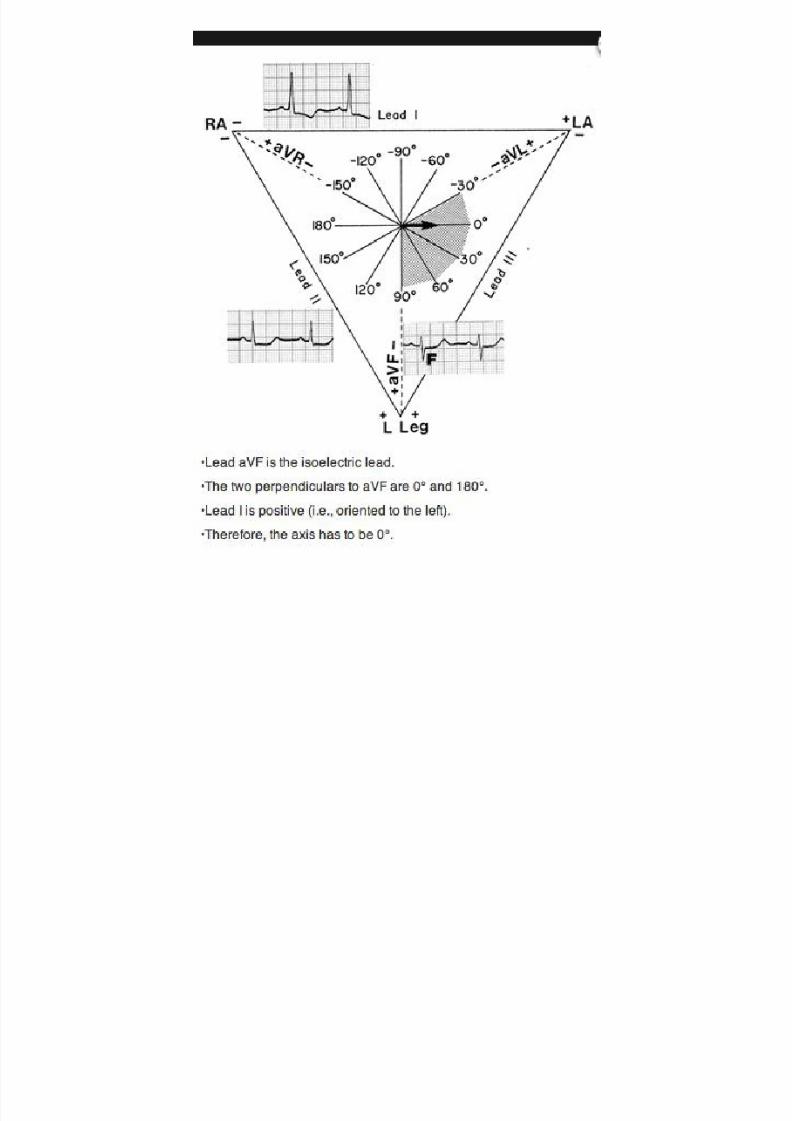
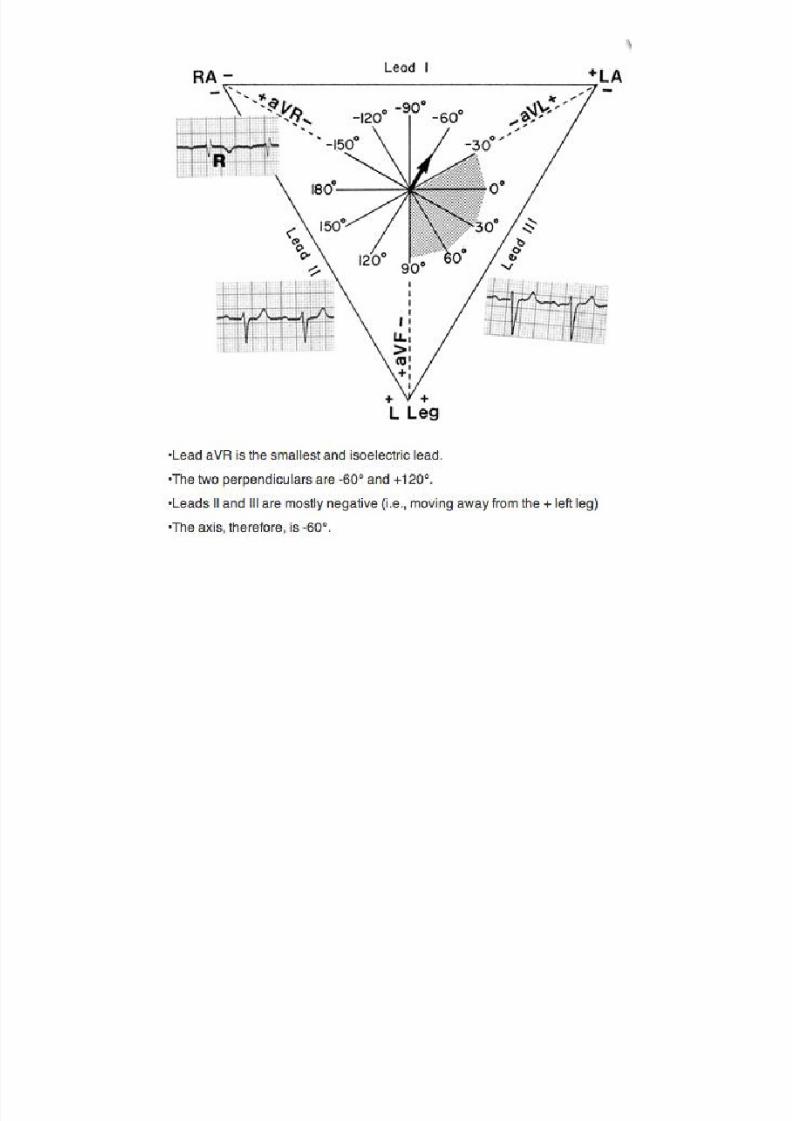
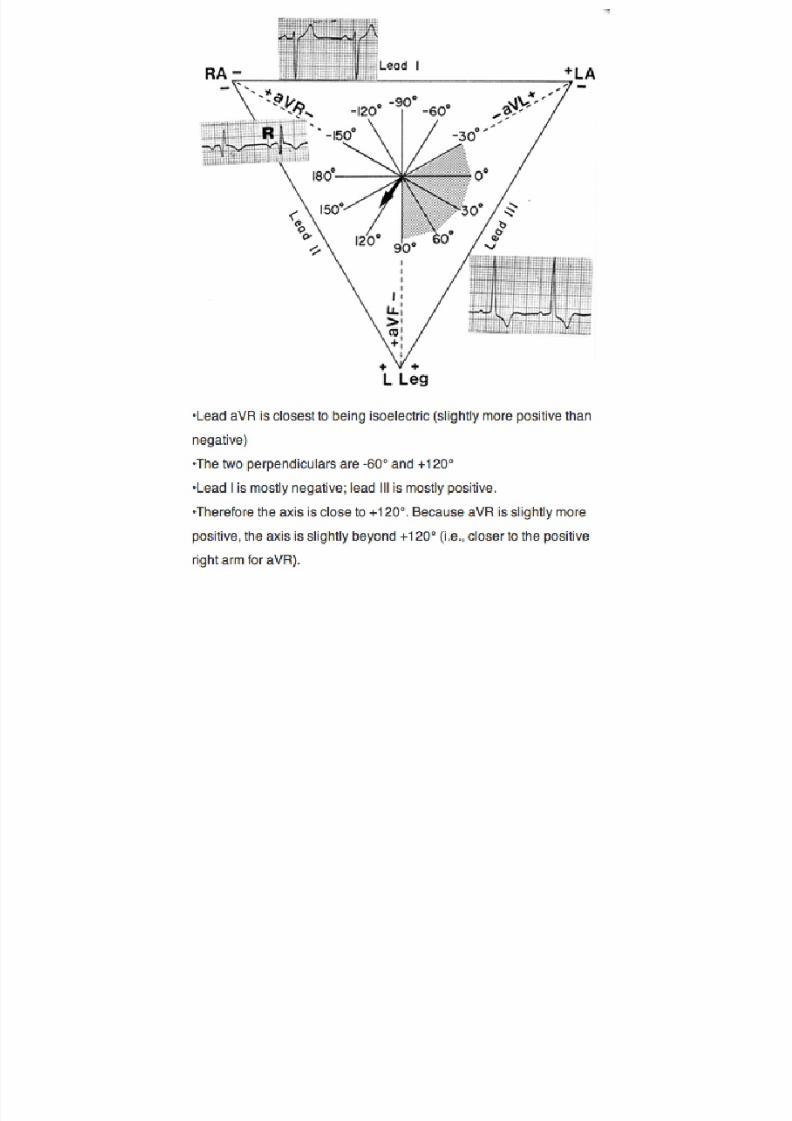
Determining the Axis in Degrees
8/13/2019 N 564 EKG Interpretation Lecture Version 2013 Stein
http://slidepdf.com/reader/full/n-564-ekg-interpretation-lecture-version-2013-stein 107/189
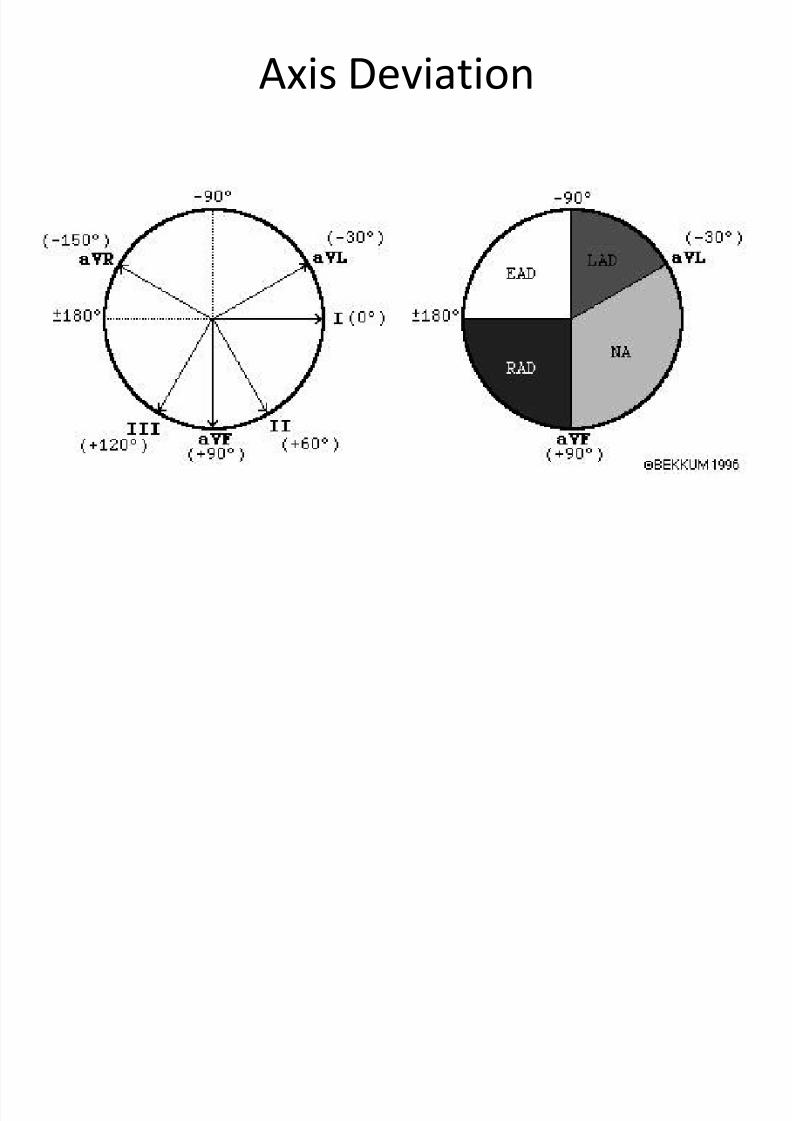
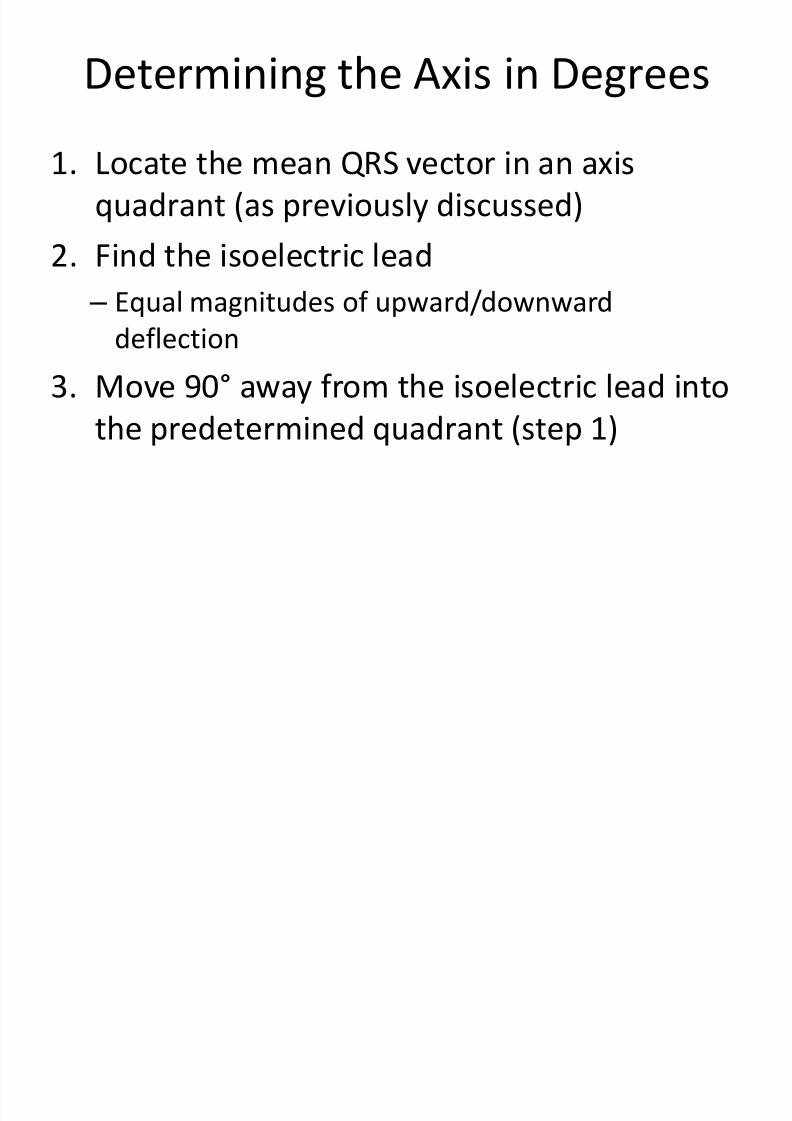
Determining the Axis in Degrees
1. Locate the mean QRS vector in an axisquadrant (as previously discussed)
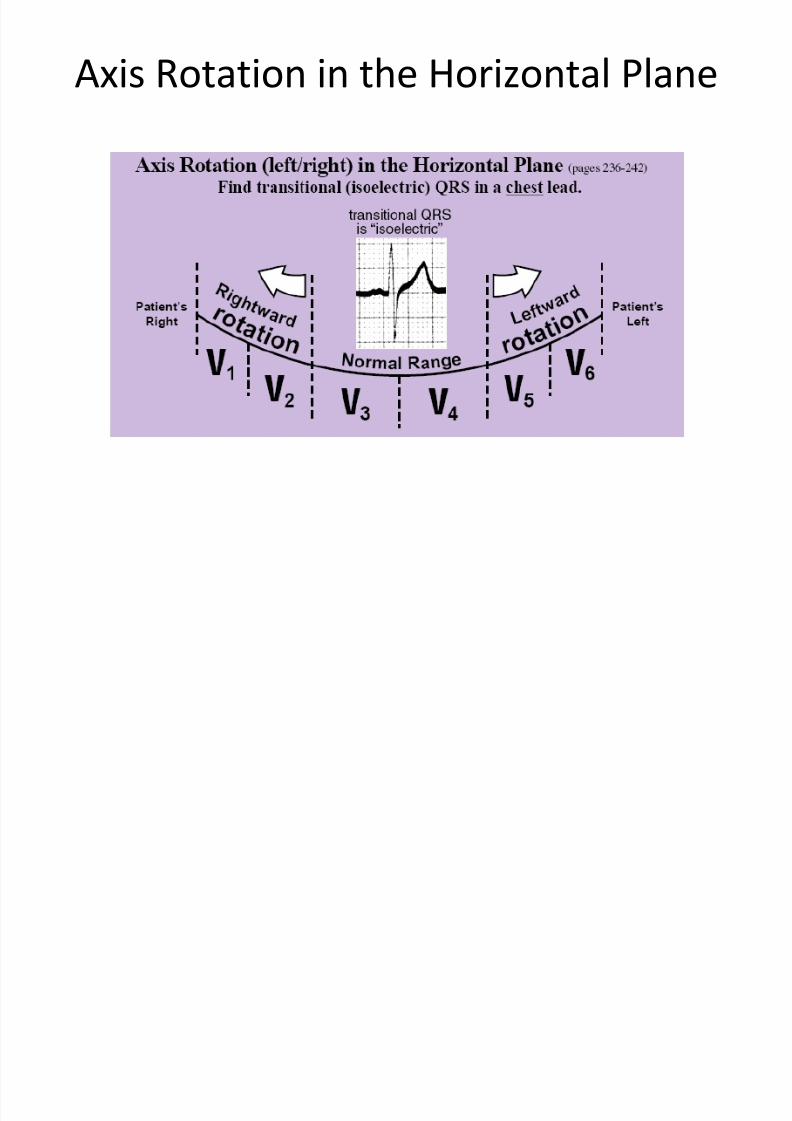
2. Find the isoelectric lead
– Equal magnitudes of upward/downwarddeflection
3. Move 90° away from the isoelectric lead into
the predetermined quadrant (step 1)
8/13/2019 N 564 EKG Interpretation Lecture Version 2013 Stein
http://slidepdf.com/reader/full/n-564-ekg-interpretation-lecture-version-2013-stein 108/189

8/13/2019 N 564 EKG Interpretation Lecture Version 2013 Stein
http://slidepdf.com/reader/full/n-564-ekg-interpretation-lecture-version-2013-stein 109/189
All six limb leads meet to form sixintersecting leads that lie in a flat
“frontal” plane on the patient’s chest!
8/13/2019 N 564 EKG Interpretation Lecture Version 2013 Stein
http://slidepdf.com/reader/full/n-564-ekg-interpretation-lecture-version-2013-stein 110/189
8/13/2019 N 564 EKG Interpretation Lecture Version 2013 Stein
http://slidepdf.com/reader/full/n-564-ekg-interpretation-lecture-version-2013-stein 111/189
8/13/2019 N 564 EKG Interpretation Lecture Version 2013 Stein
http://slidepdf.com/reader/full/n-564-ekg-interpretation-lecture-version-2013-stein 112/189
Chest Leads in the Horizontal Plane
8/13/2019 N 564 EKG Interpretation Lecture Version 2013 Stein
http://slidepdf.com/reader/full/n-564-ekg-interpretation-lecture-version-2013-stein 113/189
Chest Leads in the Horizontal Plane
Chest Leads on EKG
8/13/2019 N 564 EKG Interpretation Lecture Version 2013 Stein
http://slidepdf.com/reader/full/n-564-ekg-interpretation-lecture-version-2013-stein 114/189
Chest Leads on EKG
• Orientation of V2 makes it most informativelead for determination of both anterior and
posterior infarction of the left ventricle
• QRS is mainly negative in lead V1 andprogresses until it is mainly positive in lead V6
• Leads V3 and V4 are usually isoelectric
(transitional zone)
Axis Rotation in the Horizontal Plane
8/13/2019 N 564 EKG Interpretation Lecture Version 2013 Stein
http://slidepdf.com/reader/full/n-564-ekg-interpretation-lecture-version-2013-stein 115/189
Axis Rotation in the Horizontal Plane
Check for these on every EKG
8/13/2019 N 564 EKG Interpretation Lecture Version 2013 Stein
http://slidepdf.com/reader/full/n-564-ekg-interpretation-lecture-version-2013-stein 116/189
Check for these on every EKG
• Rate
• Rhythm
• Axis
• HYPERTROPHY
• Infarction
Hypertrophy
8/13/2019 N 564 EKG Interpretation Lecture Version 2013 Stein
http://slidepdf.com/reader/full/n-564-ekg-interpretation-lecture-version-2013-stein 117/189
Hypertrophy
• Examine p-wave for Atrial Hypertrophy
• Examine R-wave for Right Ventricular
Hypertrophy
• Examine S-wave depth in V1 and R-wave
height in V5 for Left Ventricular Hypertrophy
Atrial Hypertrophy

8/13/2019 N 564 EKG Interpretation Lecture Version 2013 Stein
http://slidepdf.com/reader/full/n-564-ekg-interpretation-lecture-version-2013-stein 118/189
Atrial Hypertrophy
• Examine p-wave – Normal amplitude is 2-3 mm
– Normal duration is <0.11 sec
• Abnormal p-waves
– P – Pulmonale
• Tall peaked
• Right atrial enlargement r/t pulmonary HTN (COPD)
– P – Mitrale
• Broad notched
• LA enlargement r/t mitral valve dx
i h i l h

8/13/2019 N 564 EKG Interpretation Lecture Version 2013 Stein
http://slidepdf.com/reader/full/n-564-ekg-interpretation-lecture-version-2013-stein 119/189
Right Atrial Hypertrophy
• Large, diphasic (both positive and negative) p-
wave with tall initial component
• Seen in lead V1
• Suspect if p-wave >2.5mm in any lead
L f A i l H h
8/13/2019 N 564 EKG Interpretation Lecture Version 2013 Stein
http://slidepdf.com/reader/full/n-564-ekg-interpretation-lecture-version-2013-stein 120/189
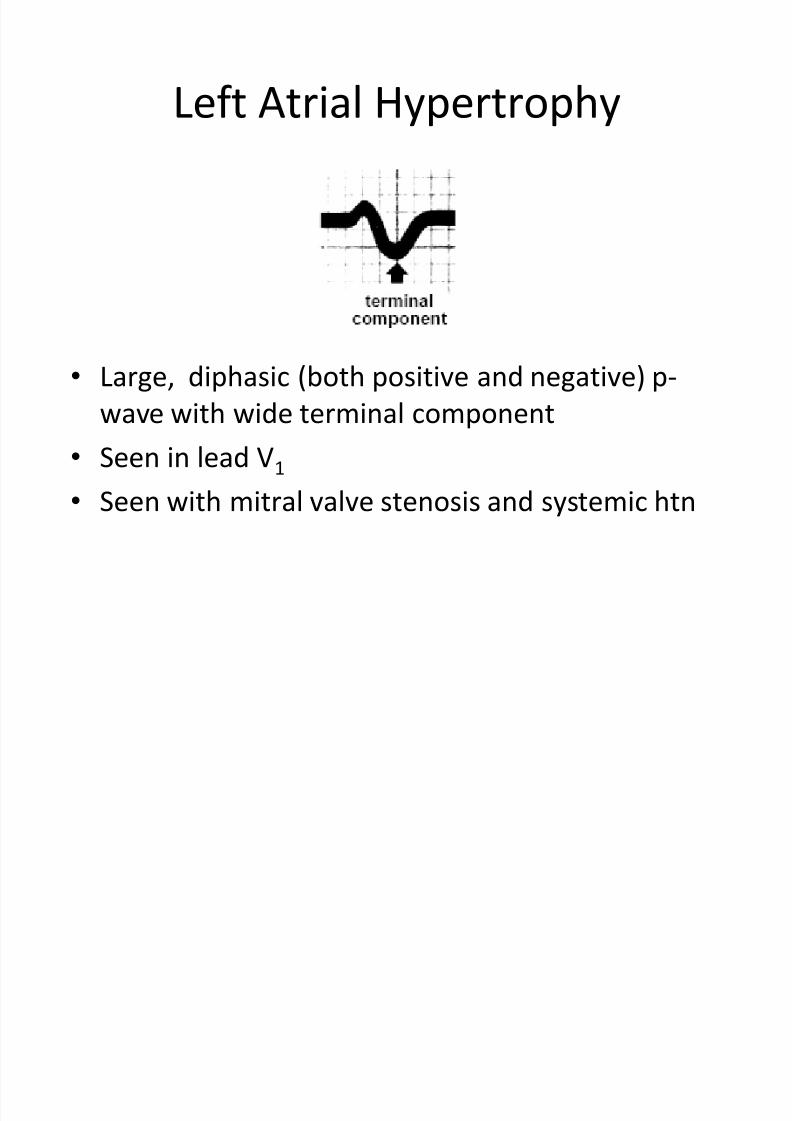
Left Atrial Hypertrophy
• Large, diphasic (both positive and negative) p-
wave with wide terminal component
• Seen in lead V1
• Seen with mitral valve stenosis and systemic htn
Right Ventricular Hypertrophy
8/13/2019 N 564 EKG Interpretation Lecture Version 2013 Stein
http://slidepdf.com/reader/full/n-564-ekg-interpretation-lecture-version-2013-stein 121/189
Right Ventricular Hypertrophy
• R > S wave in V1 – In RVH wall of RV is very thick so more
depolarization occurs towards V1 electrode
• R wave gets progressively smaller from V1-V6
– Enlarged RV adds more vectors toward right sideso rightward rotation of QRS seen
– Rightward rotation in the horizontal plane
• S wave persists in V5-V6• RAD with slightly widened QRS

8/13/2019 N 564 EKG Interpretation Lecture Version 2013 Stein
http://slidepdf.com/reader/full/n-564-ekg-interpretation-lecture-version-2013-stein 122/189
Left Ventricular Hypertrophy
8/13/2019 N 564 EKG Interpretation Lecture Version 2013 Stein
http://slidepdf.com/reader/full/n-564-ekg-interpretation-lecture-version-2013-stein 123/189
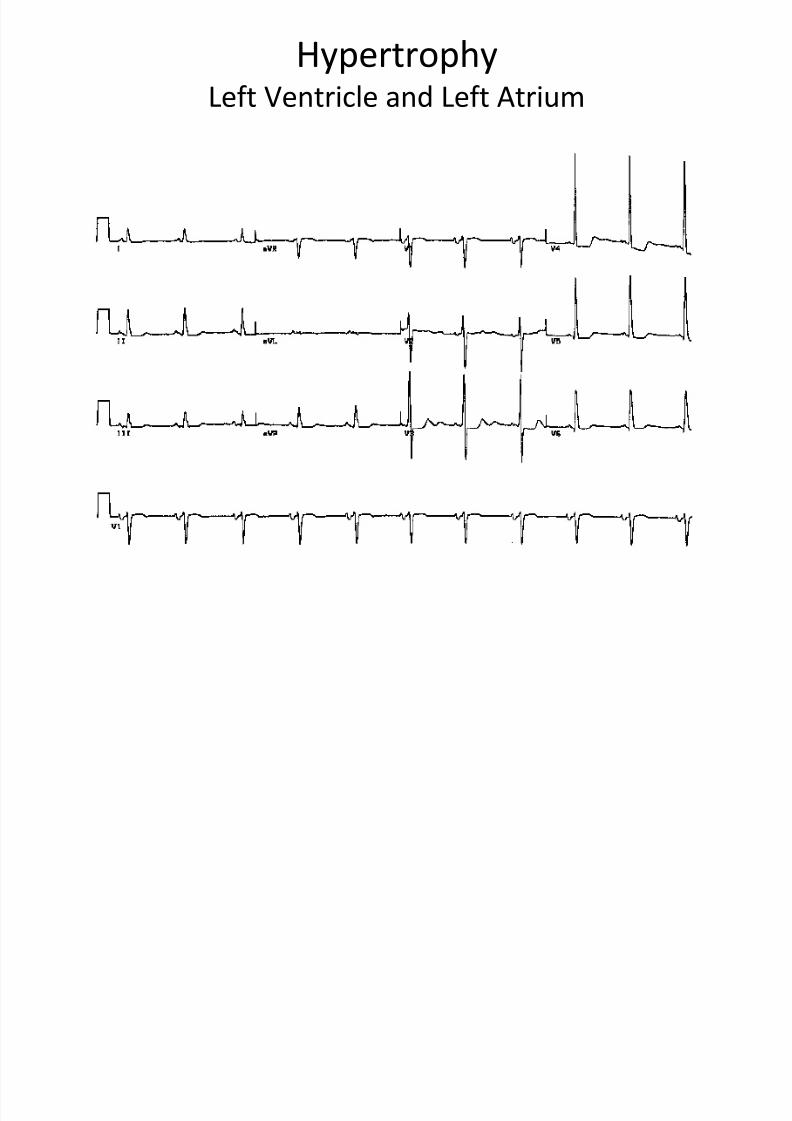
yp p y
• Left ventricular wall is very thick
• Exaggerated amplitude of QRS in chest leads
– Very deep S-wave in V1
– Large R in V5
• LAD

8/13/2019 N 564 EKG Interpretation Lecture Version 2013 Stein
http://slidepdf.com/reader/full/n-564-ekg-interpretation-lecture-version-2013-stein 124/189

8/13/2019 N 564 EKG Interpretation Lecture Version 2013 Stein
http://slidepdf.com/reader/full/n-564-ekg-interpretation-lecture-version-2013-stein 125/189
HypertrophyL ft V t i l d L ft At i
8/13/2019 N 564 EKG Interpretation Lecture Version 2013 Stein
http://slidepdf.com/reader/full/n-564-ekg-interpretation-lecture-version-2013-stein 126/189
Left Ventricle and Left Atrium
Check for these on every EKG
8/13/2019 N 564 EKG Interpretation Lecture Version 2013 Stein
http://slidepdf.com/reader/full/n-564-ekg-interpretation-lecture-version-2013-stein 127/189
y
• Rate
• Rhythm
• Axis
• Hypertrophy
• INFARCTION (and Ischemia)
Infarction
8/13/2019 N 564 EKG Interpretation Lecture Version 2013 Stein
http://slidepdf.com/reader/full/n-564-ekg-interpretation-lecture-version-2013-stein 128/189
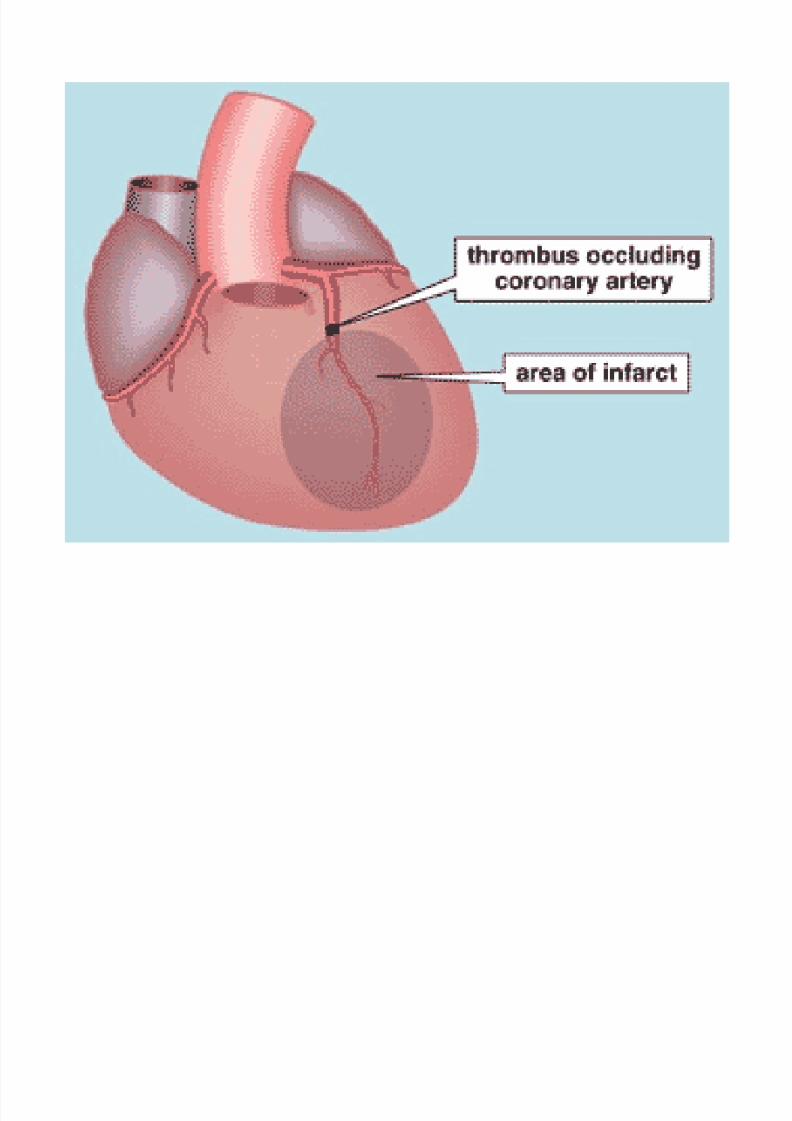
• Results from the occlusion of a coronaryartery
• Infarcted area can become necrotic so it can’tdepolarize or contract
• Ventricular foci in the hypoxic area around theinfarct become very irritable
– Can produce deadly ventricular arrhythmias
• Diagnosable with EKG
– Will tell us which coronary artery is occluded
8/13/2019 N 564 EKG Interpretation Lecture Version 2013 Stein
http://slidepdf.com/reader/full/n-564-ekg-interpretation-lecture-version-2013-stein 129/189
Infarction
8/13/2019 N 564 EKG Interpretation Lecture Version 2013 Stein
http://slidepdf.com/reader/full/n-564-ekg-interpretation-lecture-version-2013-stein 130/189
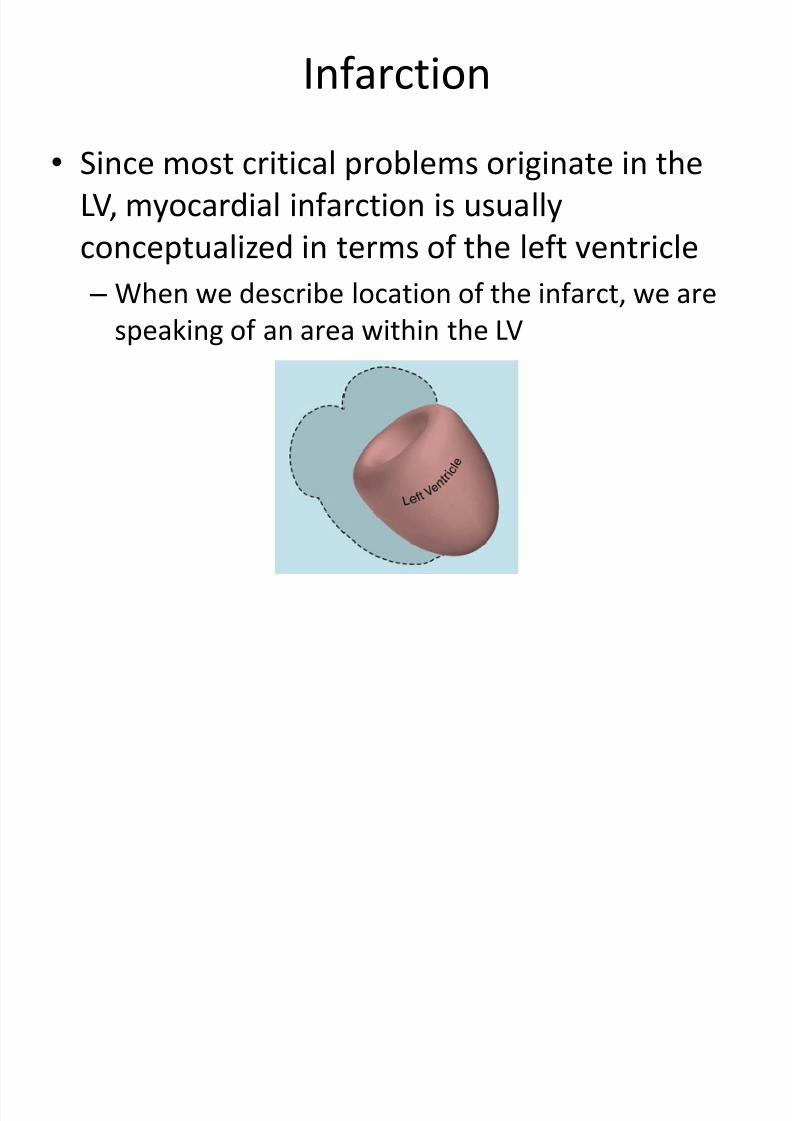
• Since most critical problems originate in theLV, myocardial infarction is usually
conceptualized in terms of the left ventricle
–When we describe location of the infarct, we arespeaking of an area within the LV
Coronary Anatomy

8/13/2019 N 564 EKG Interpretation Lecture Version 2013 Stein
http://slidepdf.com/reader/full/n-564-ekg-interpretation-lecture-version-2013-stein 131/189
y y

8/13/2019 N 564 EKG Interpretation Lecture Version 2013 Stein
http://slidepdf.com/reader/full/n-564-ekg-interpretation-lecture-version-2013-stein 132/189
Blood Supply
8/13/2019 N 564 EKG Interpretation Lecture Version 2013 Stein
http://slidepdf.com/reader/full/n-564-ekg-interpretation-lecture-version-2013-stein 133/189
pp y
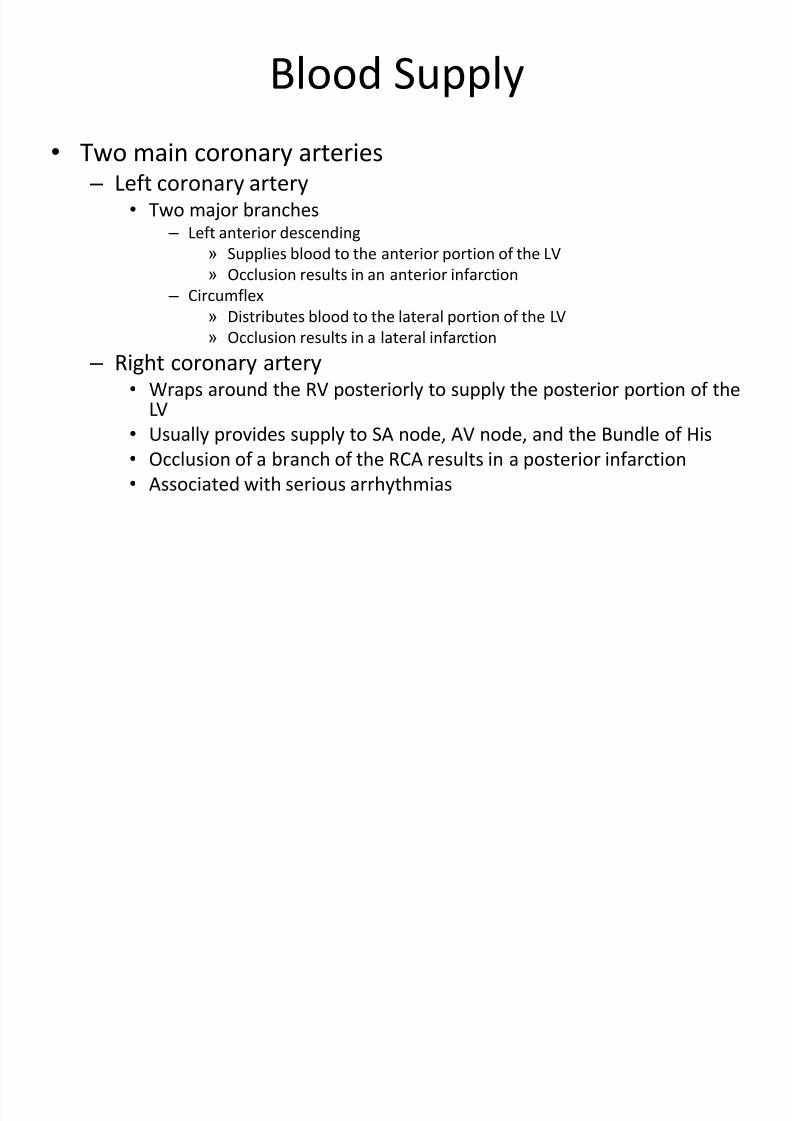
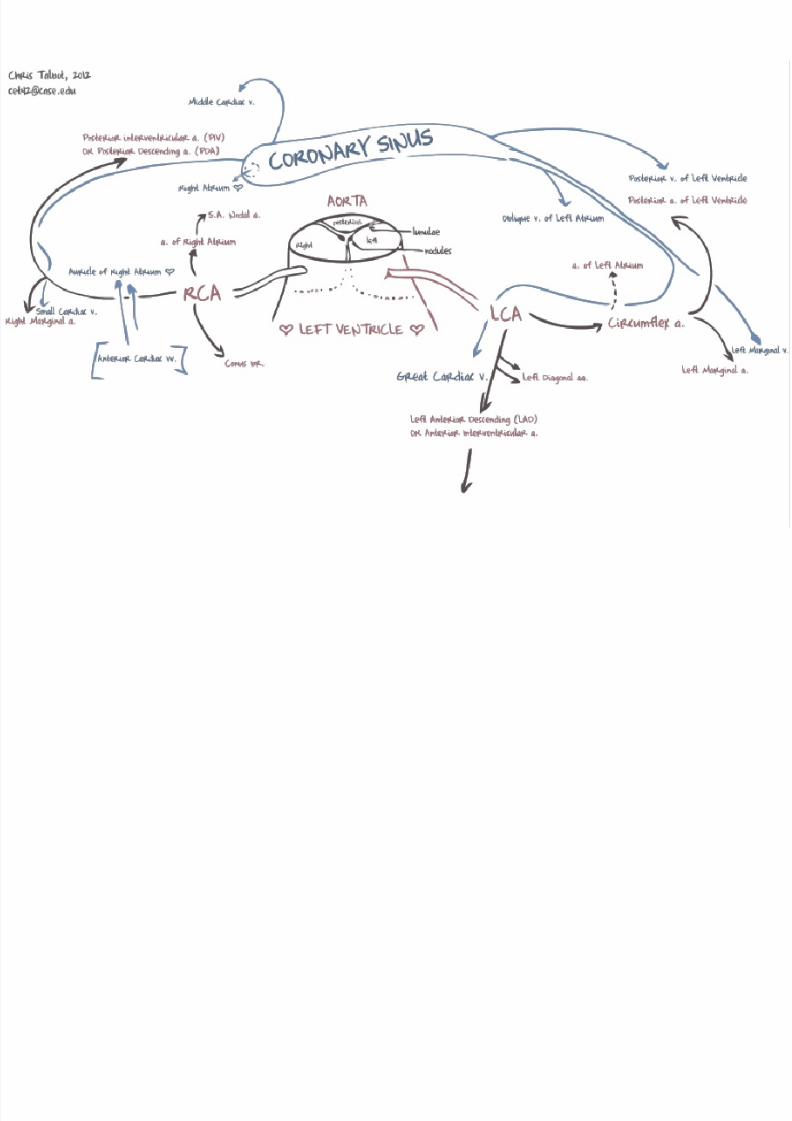
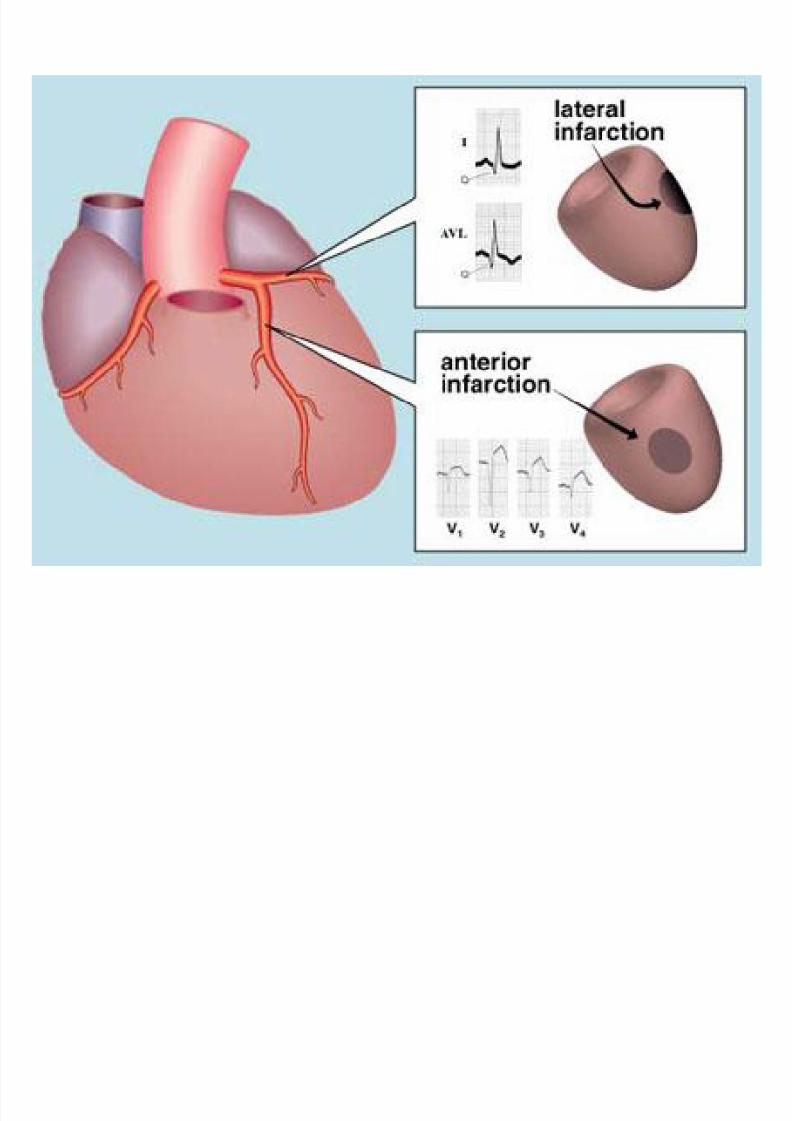
•
Two main coronary arteries – Left coronary artery
• Two major branches – Left anterior descending
» Supplies blood to the anterior portion of the LV
» Occlusion results in an anterior infarction
–Circumflex
» Distributes blood to the lateral portion of the LV
» Occlusion results in a lateral infarction
– Right coronary artery• Wraps around the RV posteriorly to supply the posterior portion of the
LV
•Usually provides supply to SA node, AV node, and the Bundle of His
• Occlusion of a branch of the RCA results in a posterior infarction
• Associated with serious arrhythmias

8/13/2019 N 564 EKG Interpretation Lecture Version 2013 Stein
http://slidepdf.com/reader/full/n-564-ekg-interpretation-lecture-version-2013-stein 134/189
8/13/2019 N 564 EKG Interpretation Lecture Version 2013 Stein
http://slidepdf.com/reader/full/n-564-ekg-interpretation-lecture-version-2013-stein 135/189
Infarction
8/13/2019 N 564 EKG Interpretation Lecture Version 2013 Stein
http://slidepdf.com/reader/full/n-564-ekg-interpretation-lecture-version-2013-stein 136/189
• Ischemia• Injury
• Necrosis
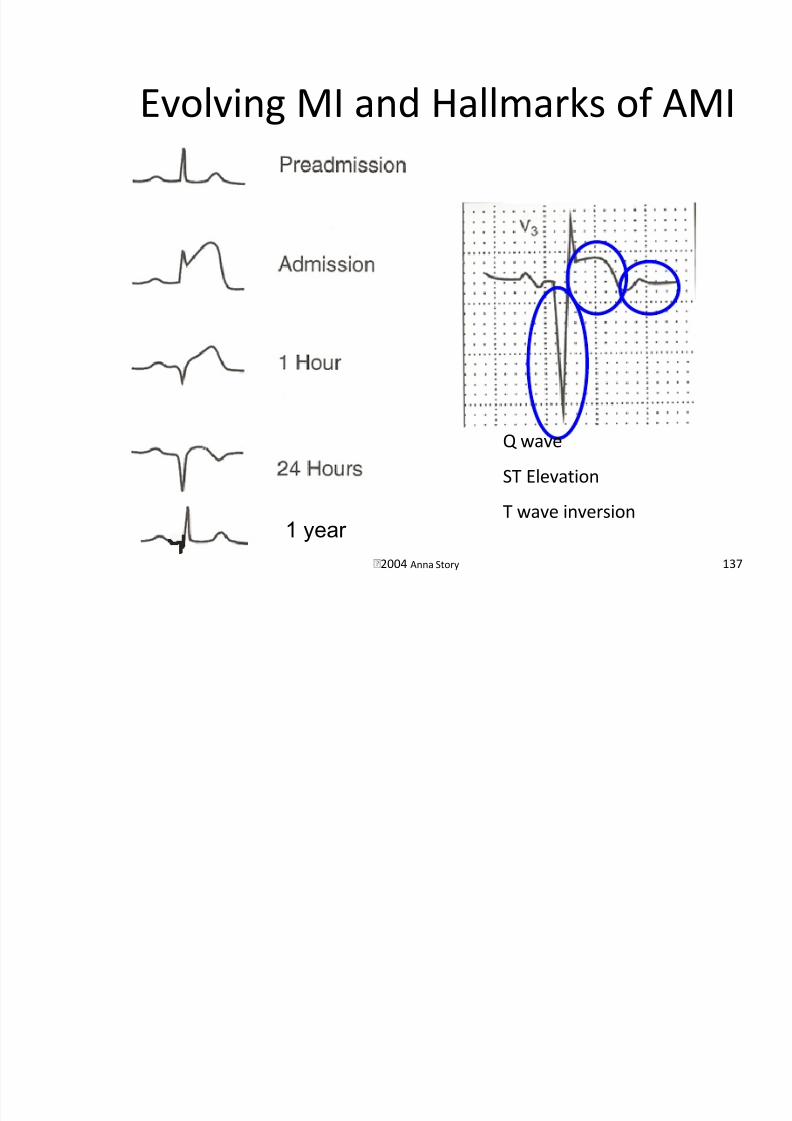
Evolving MI and Hallmarks of AMI
8/13/2019 N 564 EKG Interpretation Lecture Version 2013 Stein
http://slidepdf.com/reader/full/n-564-ekg-interpretation-lecture-version-2013-stein 137/189
2004 Anna Story 137
Evolving MI and Hallmarks of AMI
1 year
Q wave
ST Elevation
T wave inversion
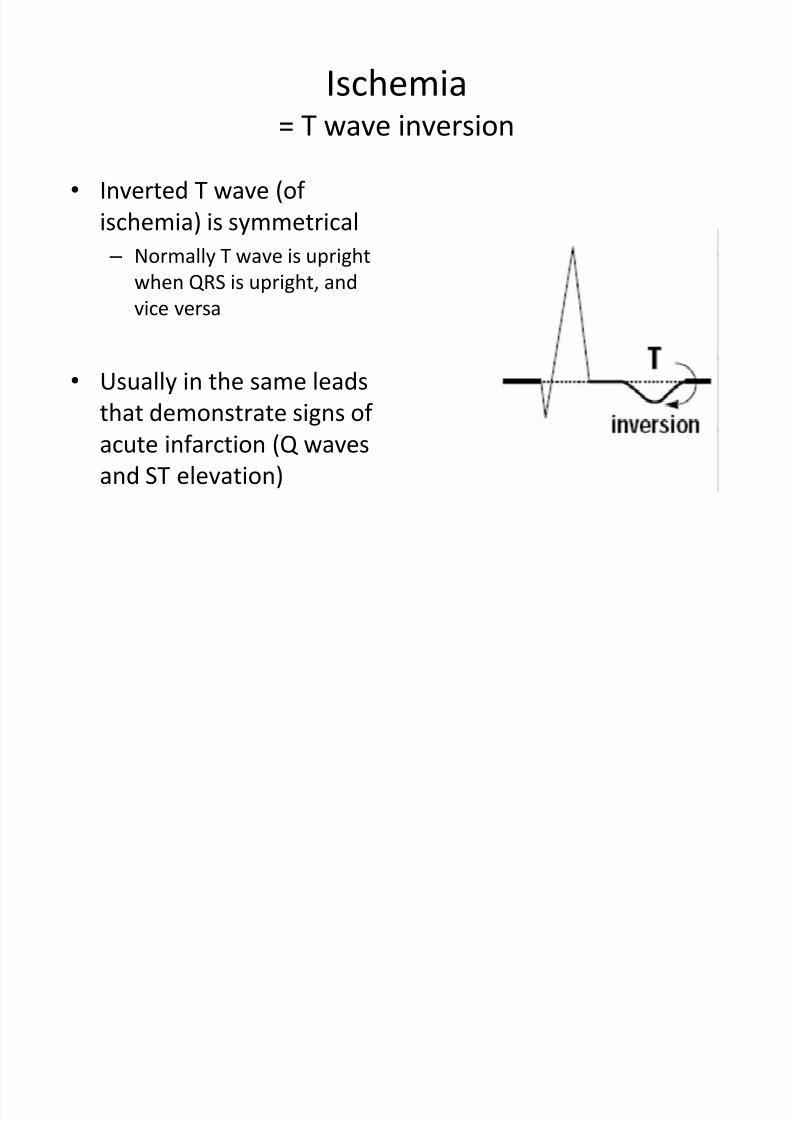
Ischemia
8/13/2019 N 564 EKG Interpretation Lecture Version 2013 Stein
http://slidepdf.com/reader/full/n-564-ekg-interpretation-lecture-version-2013-stein 138/189
• Decreased blood supply• Produces angina
• Characterized by transient inverted t-waves
– Usually symmetrically inverted – Inverted t-waves are most pronounced in the chest
leads
– Inverted t-waves in V2-V6 always pathological
– Inverted t-waves in V2-V3 alert us to stenosis of LAD
• Can also be seen at the periphery of an infarct
Ischemia
8/13/2019 N 564 EKG Interpretation Lecture Version 2013 Stein
http://slidepdf.com/reader/full/n-564-ekg-interpretation-lecture-version-2013-stein 139/189
= T wave inversion
• Inverted T wave (of
ischemia) is symmetrical
– Normally T wave is upright
when QRS is upright, and
vice versa
• Usually in the same leads
that demonstrate signs of
acute infarction (Q wavesand ST elevation)
Injury
8/13/2019 N 564 EKG Interpretation Lecture Version 2013 Stein
http://slidepdf.com/reader/full/n-564-ekg-interpretation-lecture-version-2013-stein 140/189
• Acute infarct• ST segment elevation
• Elevation of > 1mm above the baseline
• Usually the earliest EKG sign of an infarction
• With time the ST segment returns to baseline
• Prinzmetal’s angina can cause transient ST
elevation at rest in the absence of an
infarction
Injury

8/13/2019 N 564 EKG Interpretation Lecture Version 2013 Stein
http://slidepdf.com/reader/full/n-564-ekg-interpretation-lecture-version-2013-stein 141/189
= ST elevation
• Signifies an acute process
• ST elevation associatedwith significant Q wavesindicates an acute (or
recent) infarct – If ST elevation w/o Q-
waves, non-Q-waveinfarction must be r/o
• ST depression (persistent)
may represent a“subendocardialinfarction”
Depressed ST Segment
8/13/2019 N 564 EKG Interpretation Lecture Version 2013 Stein
http://slidepdf.com/reader/full/n-564-ekg-interpretation-lecture-version-2013-stein 142/189
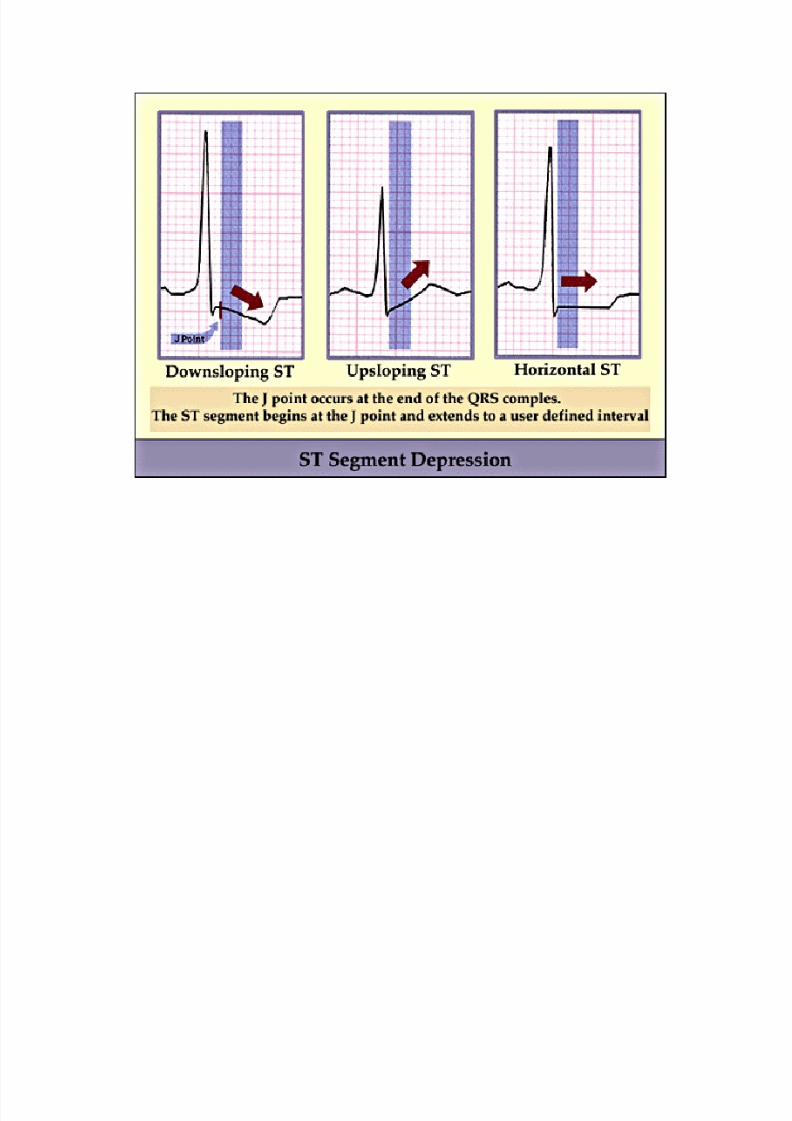
•
Depressed ST segment > 1 mm from baseline in leadswhere QRS is upright indicates compromised coronaryblood flow until proven otherwise – Requires complete workup
• Possible causes –
Angina• Chest pain caused by diminished coronary blood flow without
infarction
– Subendocardial infarction• An infarction that does not extend through the full thickness of the LV
– Positive stress test• With exercise the myocardium demands more blood than the
narrowed coronaries can deliver
– Digitalis
8/13/2019 N 564 EKG Interpretation Lecture Version 2013 Stein
http://slidepdf.com/reader/full/n-564-ekg-interpretation-lecture-version-2013-stein 143/189
Necrosis
8/13/2019 N 564 EKG Interpretation Lecture Version 2013 Stein
http://slidepdf.com/reader/full/n-564-ekg-interpretation-lecture-version-2013-stein 144/189
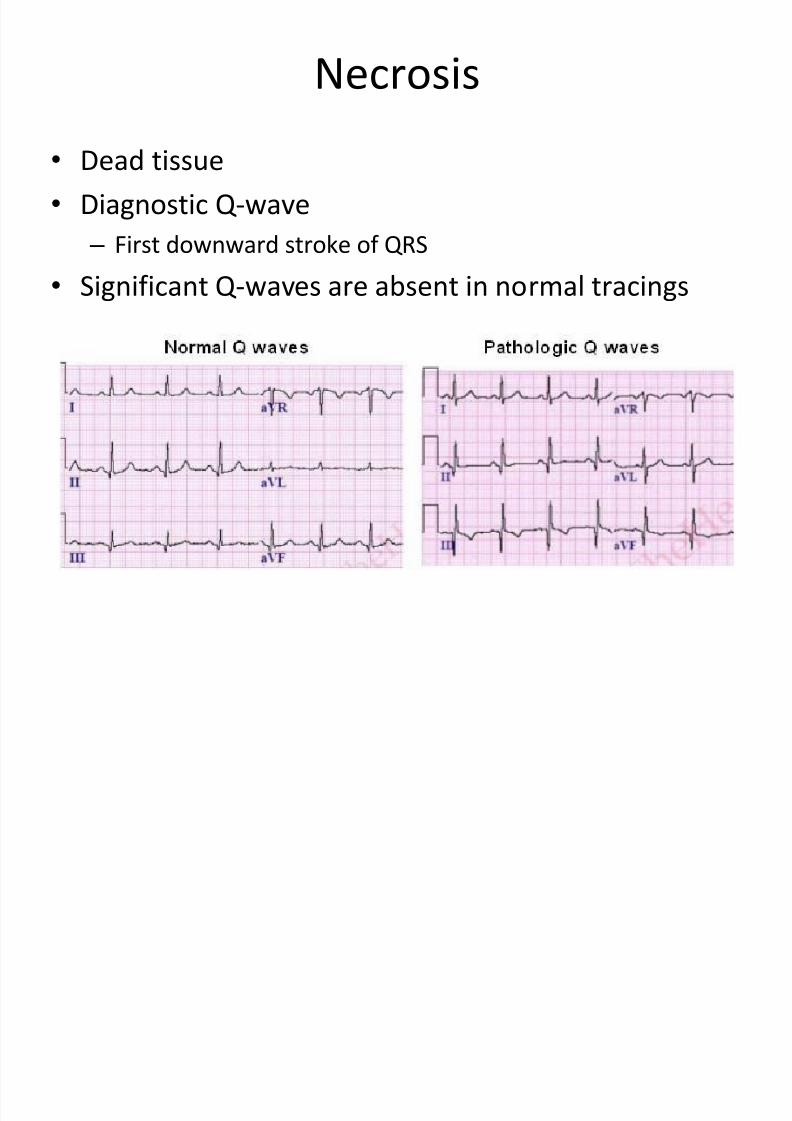
• Dead tissue• Diagnostic Q-wave
– First downward stroke of QRS
•
Significant Q-waves are absent in normal tracings
Necrosis
8/13/2019 N 564 EKG Interpretation Lecture Version 2013 Stein
http://slidepdf.com/reader/full/n-564-ekg-interpretation-lecture-version-2013-stein 145/189
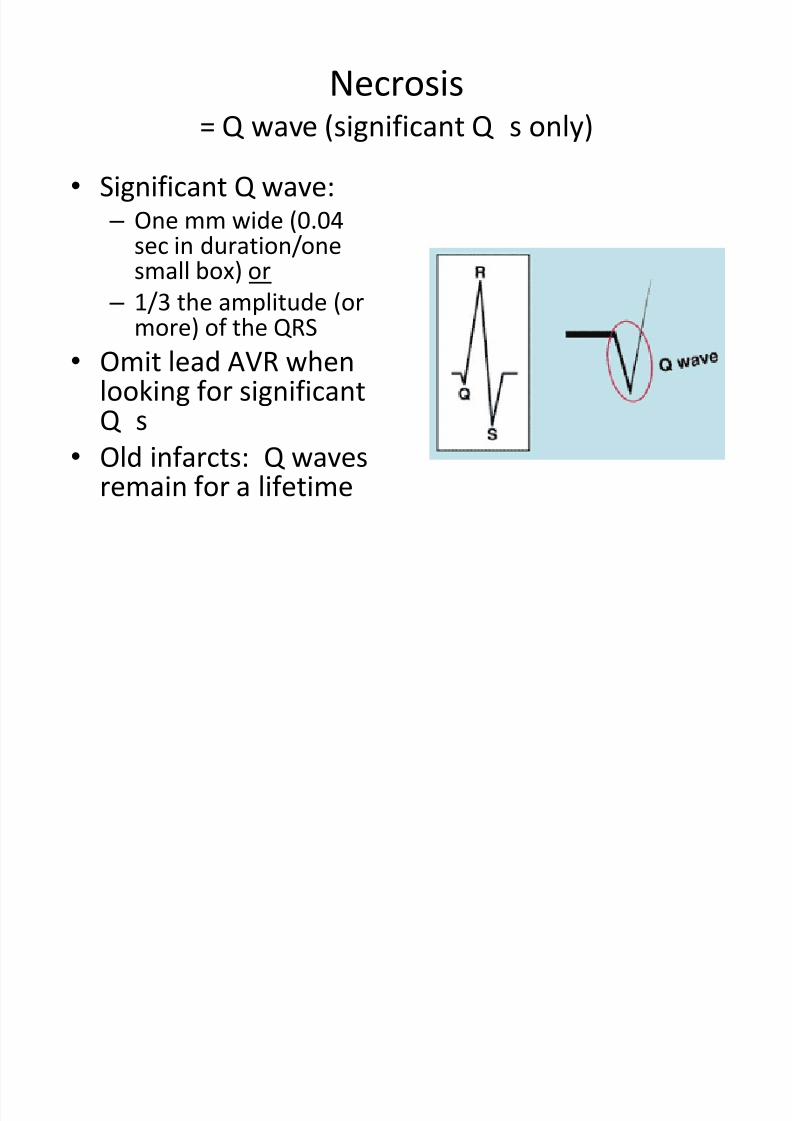
= Q wave (significant Q ’s only)
• Significant Q wave: – One mm wide (0.04
sec in duration/onesmall box) or
– 1/3 the amplitude (ormore) of the QRS
• Omit lead AVR whenlooking for significantQ ’s
• Old infarcts: Q wavesremain for a lifetime
The Q-wave
8/13/2019 N 564 EKG Interpretation Lecture Version 2013 Stein
http://slidepdf.com/reader/full/n-564-ekg-interpretation-lecture-version-2013-stein 146/189
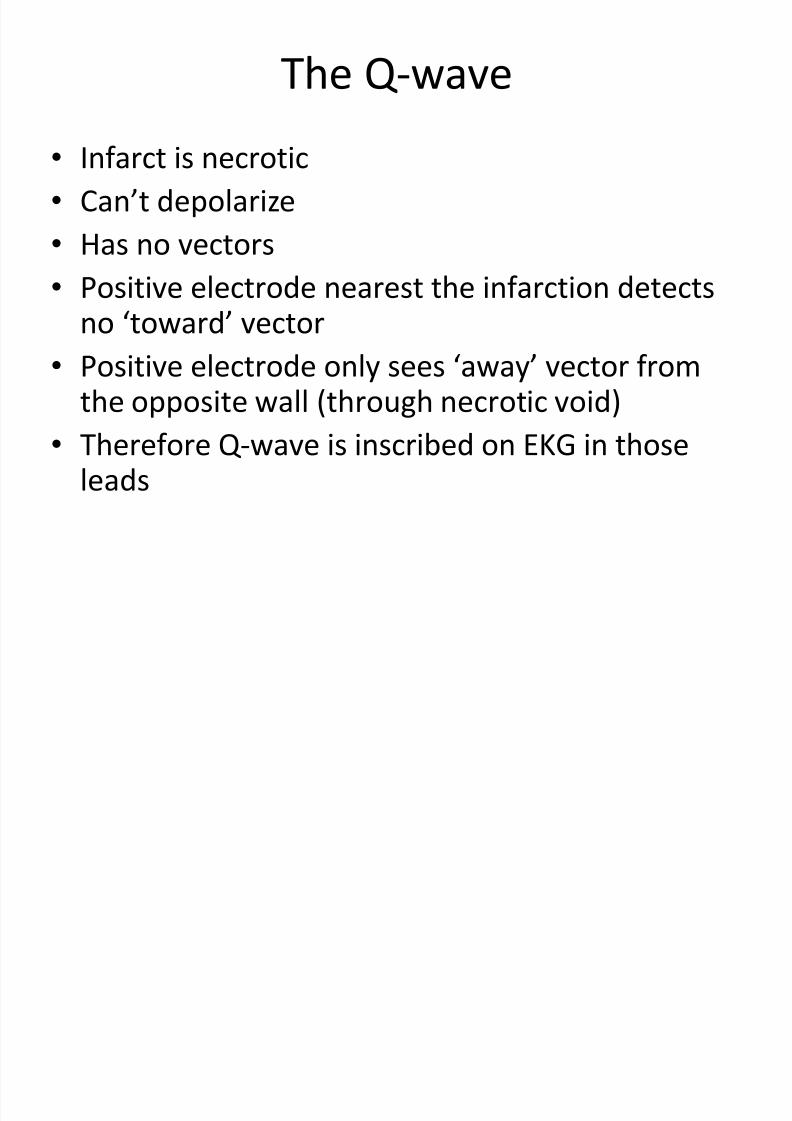
•Infarct is necrotic
• Can’t depolarize
• Has no vectors
•
Positive electrode nearest the infarction detectsno ‘toward’ vector
• Positive electrode only sees ‘away’ vector fromthe opposite wall (through necrotic void)
• Therefore Q-wave is inscribed on EKG in thoseleads
Infarction Review
8/13/2019 N 564 EKG Interpretation Lecture Version 2013 Stein
http://slidepdf.com/reader/full/n-564-ekg-interpretation-lecture-version-2013-stein 147/189
• Scan all leads for: – Q waves
– Inverted T waves
–ST segment elevation or depression
– Find the location of the pathology and then
identify the occluded coronary artery
8/13/2019 N 564 EKG Interpretation Lecture Version 2013 Stein
http://slidepdf.com/reader/full/n-564-ekg-interpretation-lecture-version-2013-stein 148/189
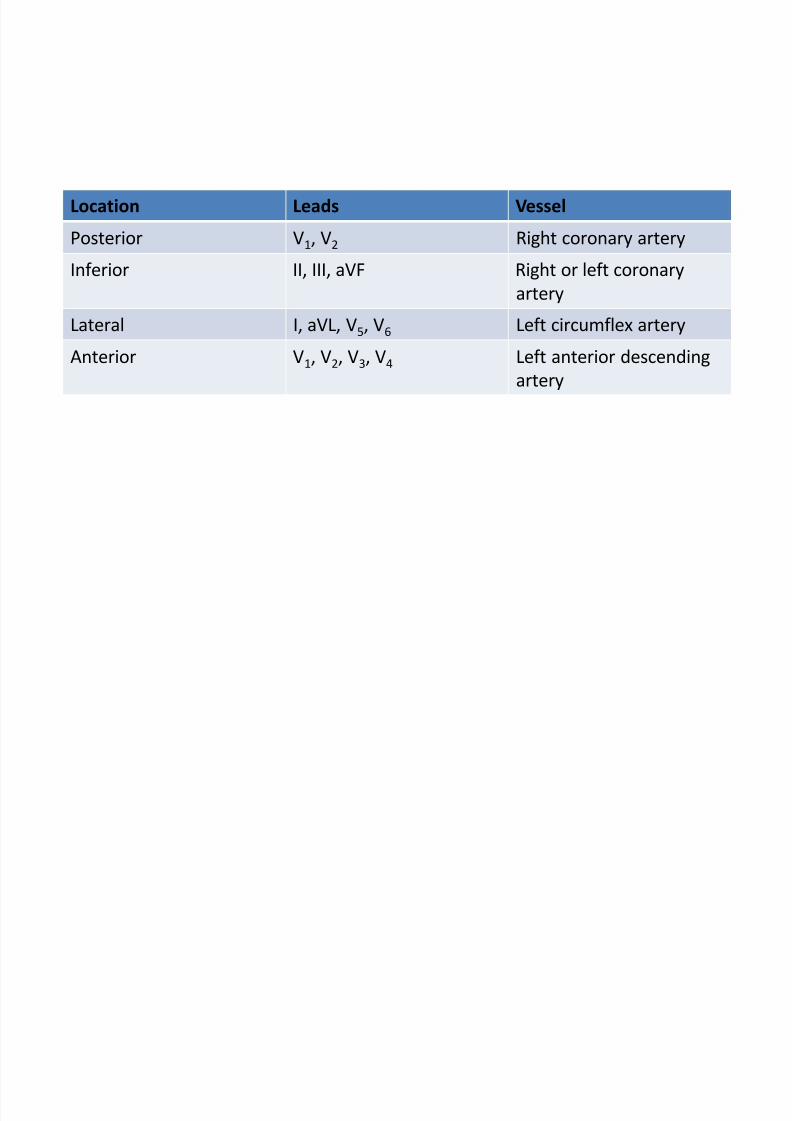
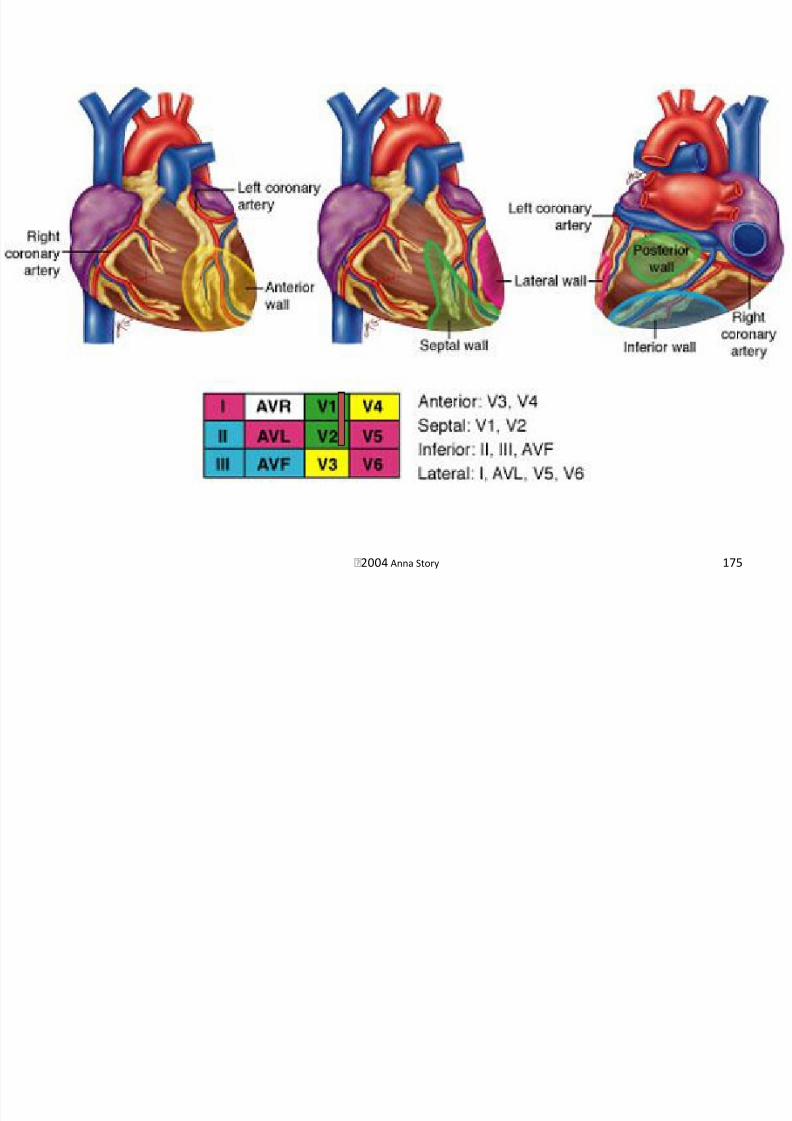
Location Leads Vessel
Posterior V1, V2 Right coronary artery
Inferior II, III, aVF Right or left coronary
arteryLateral I, aVL, V5, V6 Left circumflex artery
Anterior V1, V2, V3, V4 Left anterior descending
artery
8/13/2019 N 564 EKG Interpretation Lecture Version 2013 Stein
http://slidepdf.com/reader/full/n-564-ekg-interpretation-lecture-version-2013-stein 149/189
Anterior Infarction
8/13/2019 N 564 EKG Interpretation Lecture Version 2013 Stein
http://slidepdf.com/reader/full/n-564-ekg-interpretation-lecture-version-2013-stein 150/189
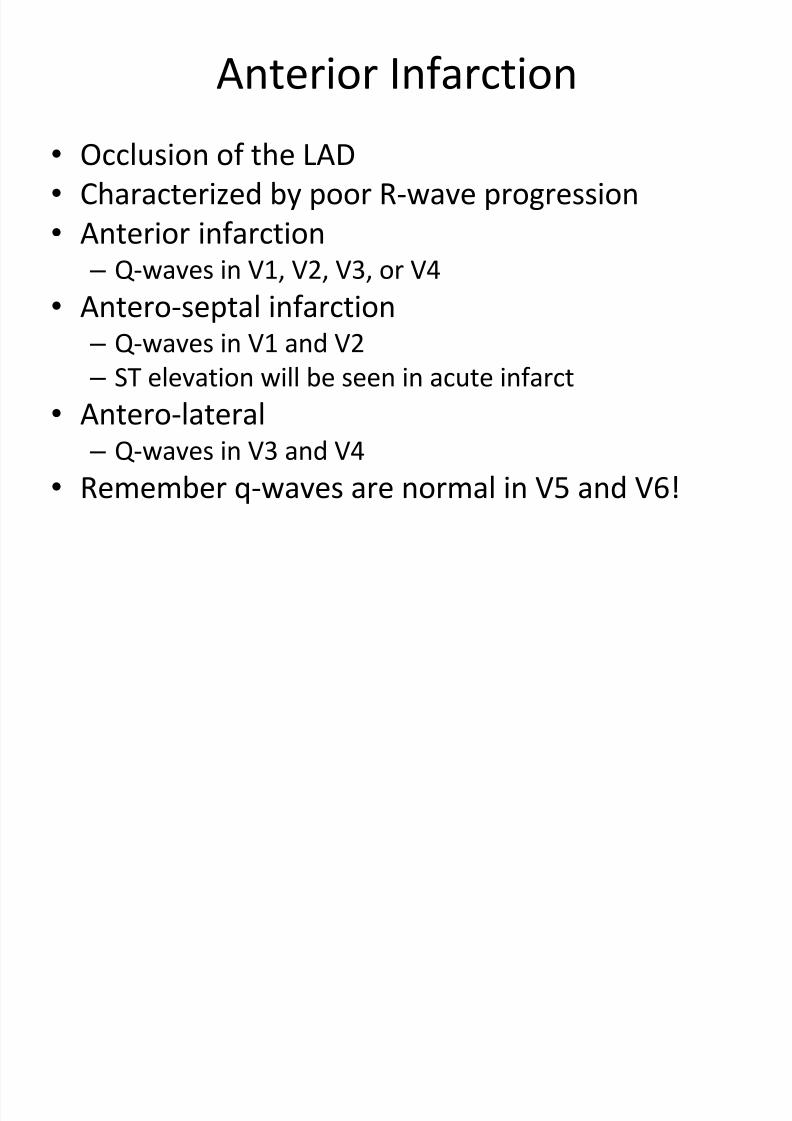
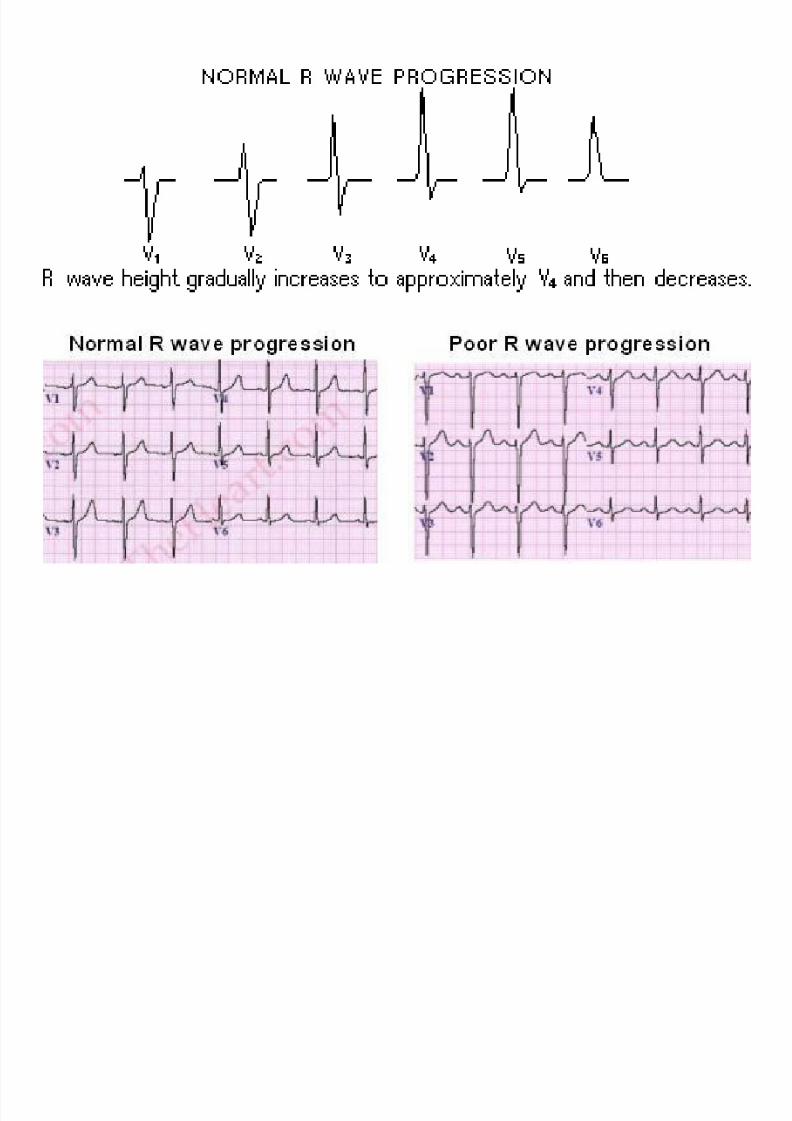
•
Occlusion of the LAD• Characterized by poor R-wave progression
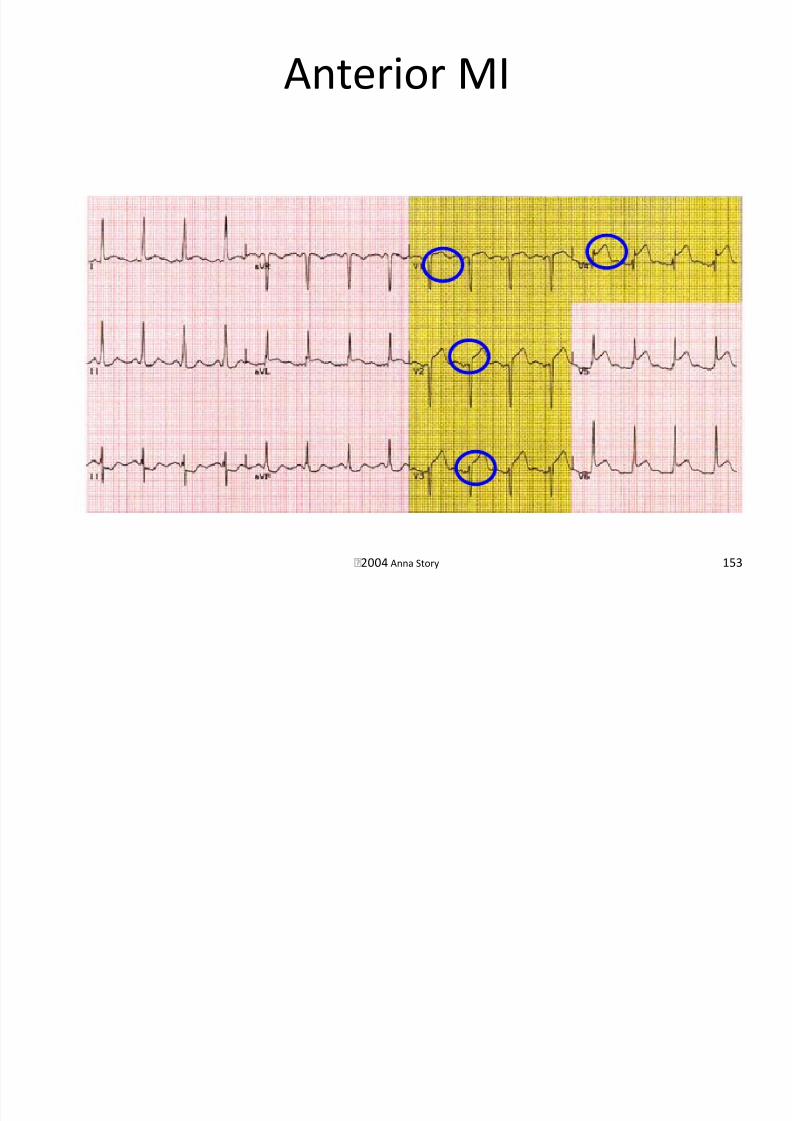
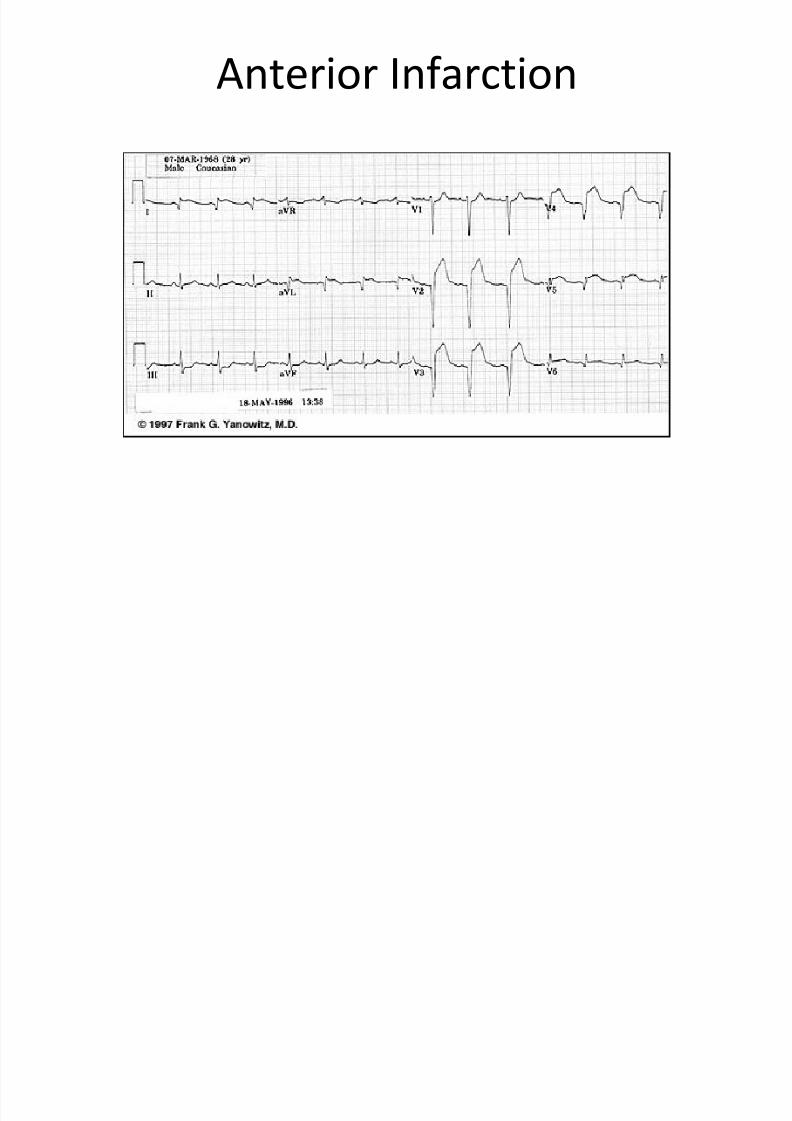
• Anterior infarction – Q-waves in V1, V2, V3, or V4
• Antero-septal infarction – Q-waves in V1 and V2
– ST elevation will be seen in acute infarct
• Antero-lateral – Q-waves in V3 and V4
• Remember q-waves are normal in V5 and V6!
8/13/2019 N 564 EKG Interpretation Lecture Version 2013 Stein
http://slidepdf.com/reader/full/n-564-ekg-interpretation-lecture-version-2013-stein 151/189

8/13/2019 N 564 EKG Interpretation Lecture Version 2013 Stein
http://slidepdf.com/reader/full/n-564-ekg-interpretation-lecture-version-2013-stein 152/189
8/13/2019 N 564 EKG Interpretation Lecture Version 2013 Stein
http://slidepdf.com/reader/full/n-564-ekg-interpretation-lecture-version-2013-stein 153/189
Anterior Infarction
8/13/2019 N 564 EKG Interpretation Lecture Version 2013 Stein
http://slidepdf.com/reader/full/n-564-ekg-interpretation-lecture-version-2013-stein 154/189
Antero-septal Infarction
8/13/2019 N 564 EKG Interpretation Lecture Version 2013 Stein
http://slidepdf.com/reader/full/n-564-ekg-interpretation-lecture-version-2013-stein 155/189
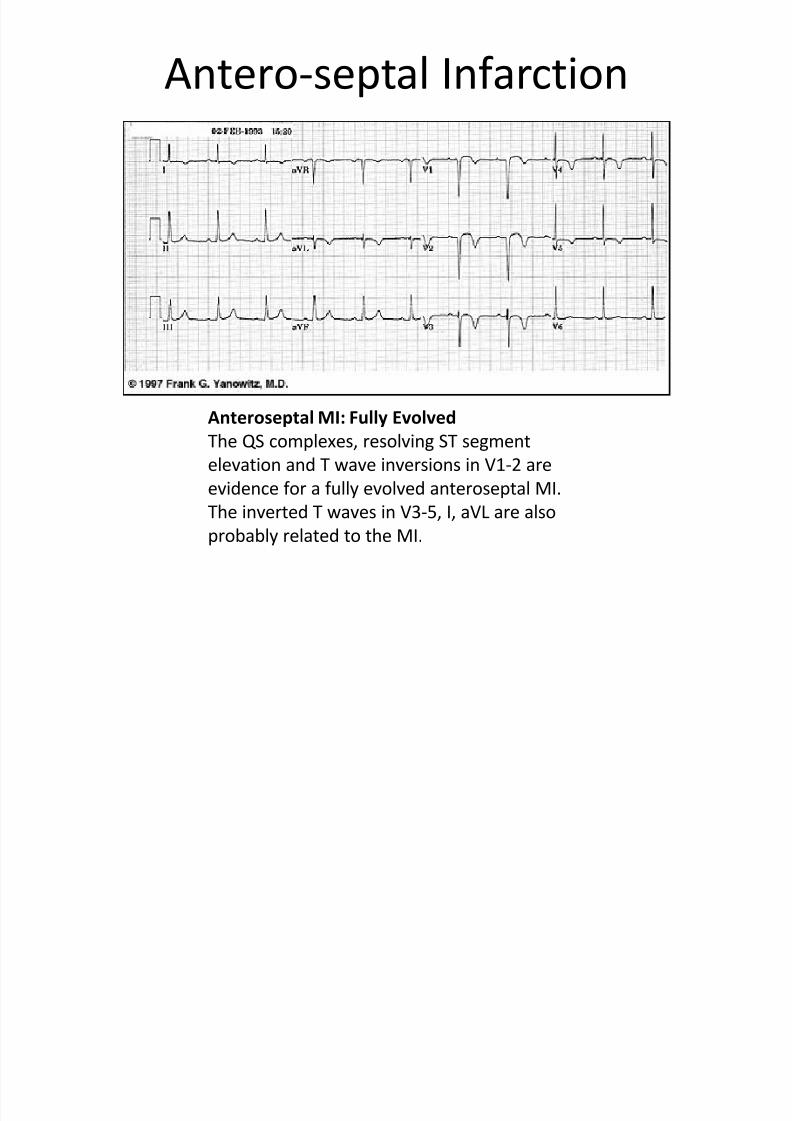
Anteroseptal MI: Fully Evolved
The QS complexes, resolving ST segmentelevation and T wave inversions in V1-2 are
evidence for a fully evolved anteroseptal MI.
The inverted T waves in V3-5, I, aVL are also
probably related to the MI.
Antero-lateral Infarction
8/13/2019 N 564 EKG Interpretation Lecture Version 2013 Stein
http://slidepdf.com/reader/full/n-564-ekg-interpretation-lecture-version-2013-stein 156/189
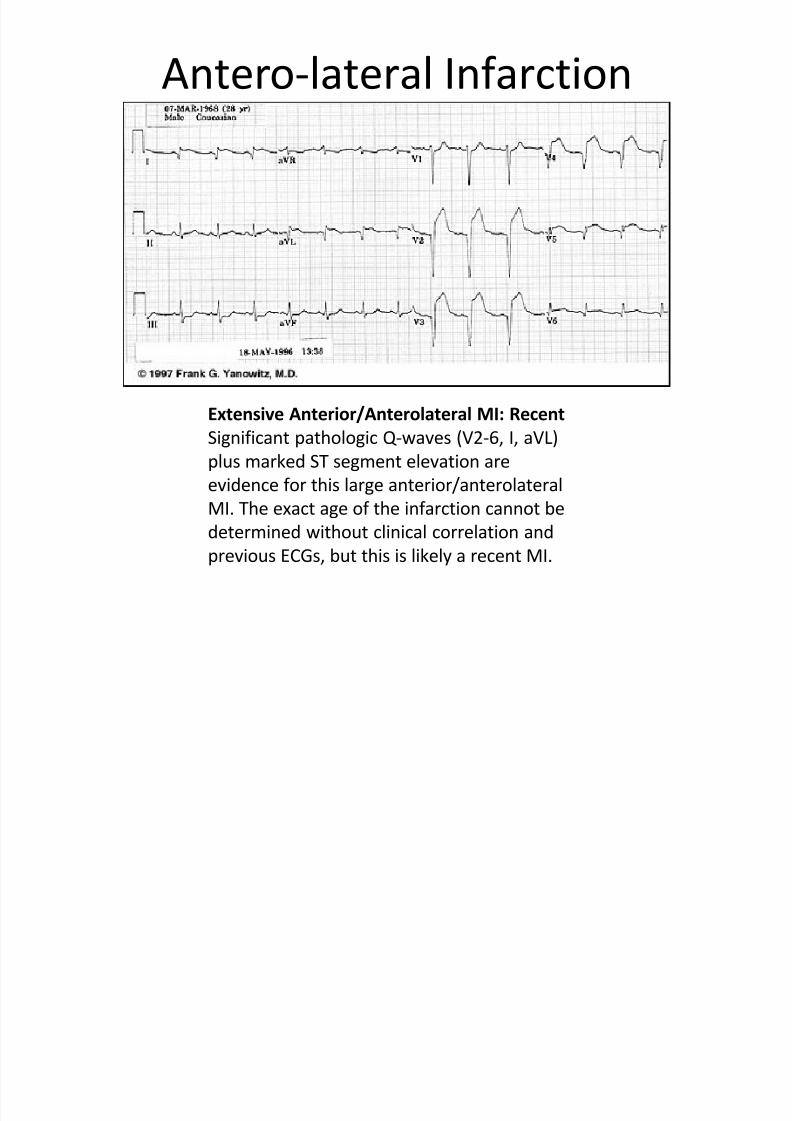
Extensive Anterior/Anterolateral MI: Recent
Significant pathologic Q-waves (V2-6, I, aVL)plus marked ST segment elevation are
evidence for this large anterior/anterolateral
MI. The exact age of the infarction cannot be
determined without clinical correlation and
previous ECGs, but this is likely a recent MI.
8/13/2019 N 564 EKG Interpretation Lecture Version 2013 Stein
http://slidepdf.com/reader/full/n-564-ekg-interpretation-lecture-version-2013-stein 157/189
Lateral Infarction
8/13/2019 N 564 EKG Interpretation Lecture Version 2013 Stein
http://slidepdf.com/reader/full/n-564-ekg-interpretation-lecture-version-2013-stein 158/189
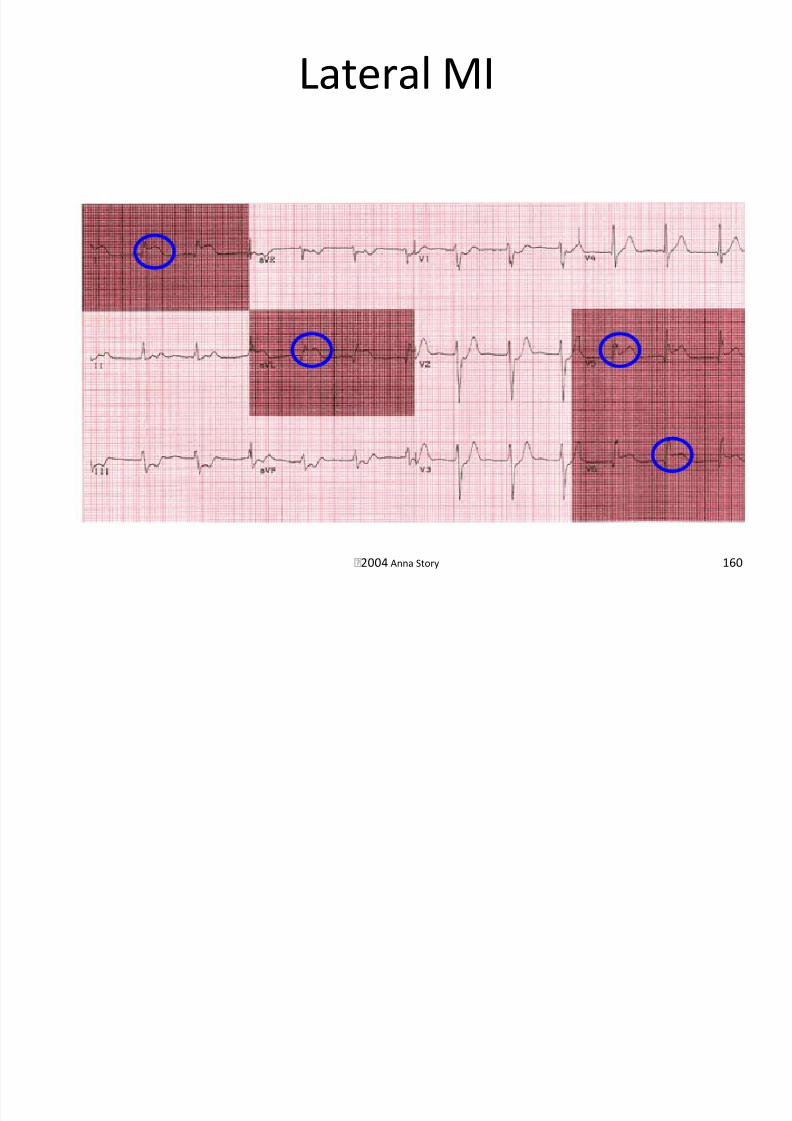
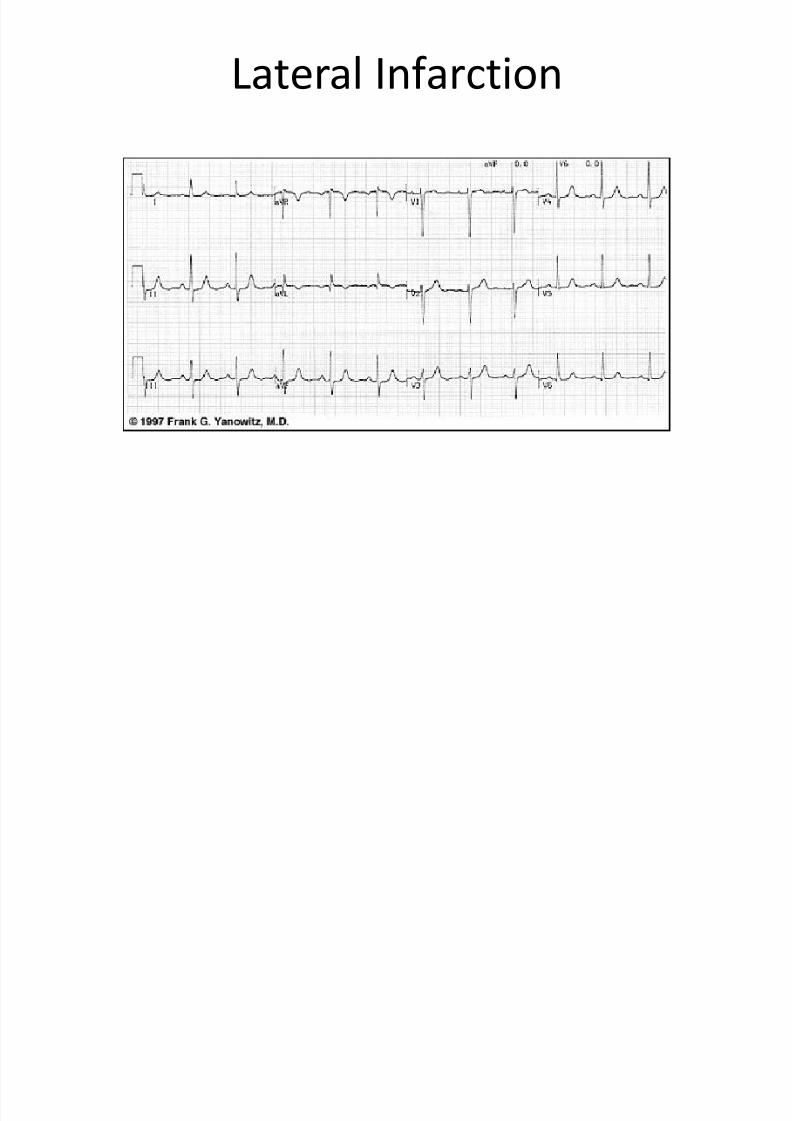
• Occlusion of the circumflex• Q-waves in the lateral leads
– I
– aVL
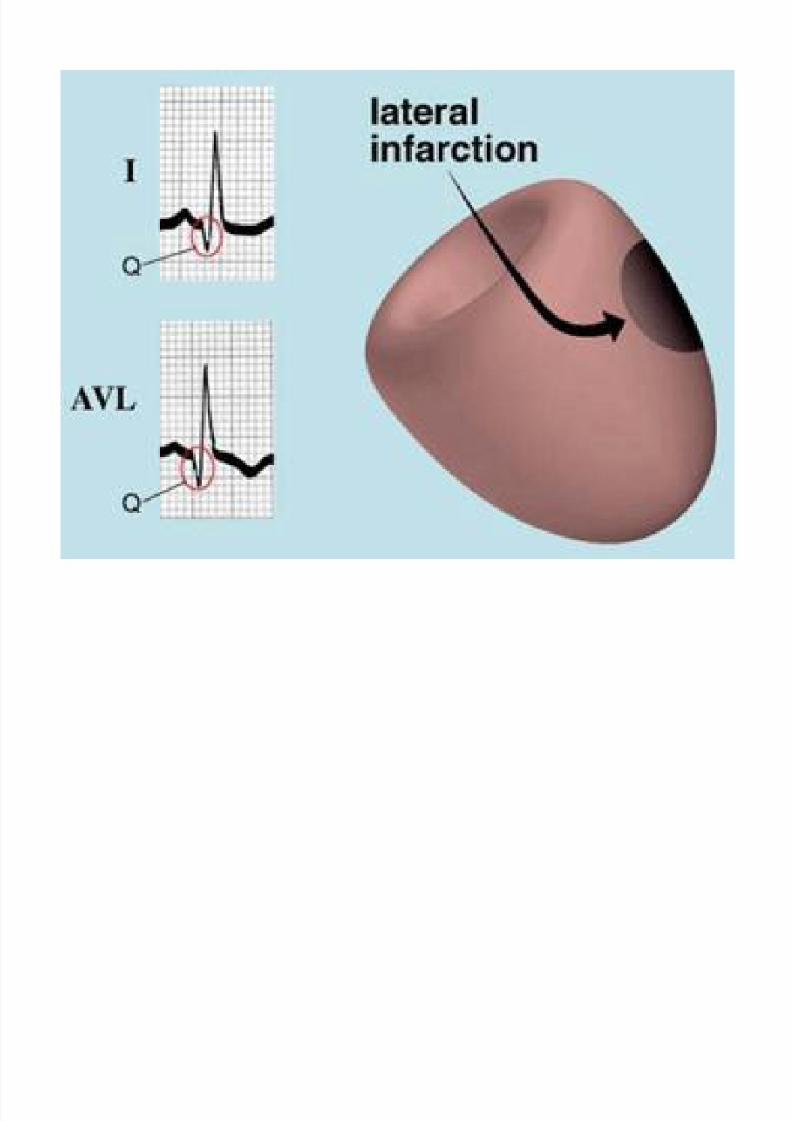
8/13/2019 N 564 EKG Interpretation Lecture Version 2013 Stein
http://slidepdf.com/reader/full/n-564-ekg-interpretation-lecture-version-2013-stein 159/189
Lateral MI
8/13/2019 N 564 EKG Interpretation Lecture Version 2013 Stein
http://slidepdf.com/reader/full/n-564-ekg-interpretation-lecture-version-2013-stein 160/189
2004 Anna Story 160
Lateral Infarction
8/13/2019 N 564 EKG Interpretation Lecture Version 2013 Stein
http://slidepdf.com/reader/full/n-564-ekg-interpretation-lecture-version-2013-stein 161/189
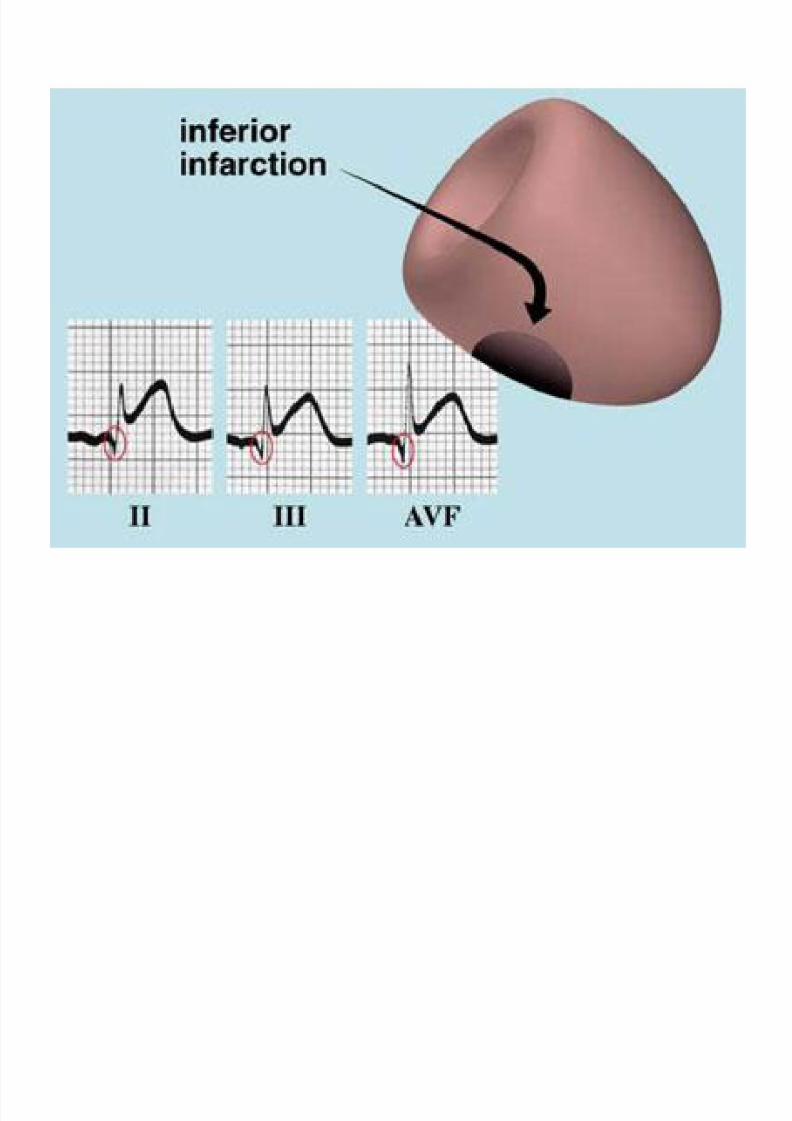
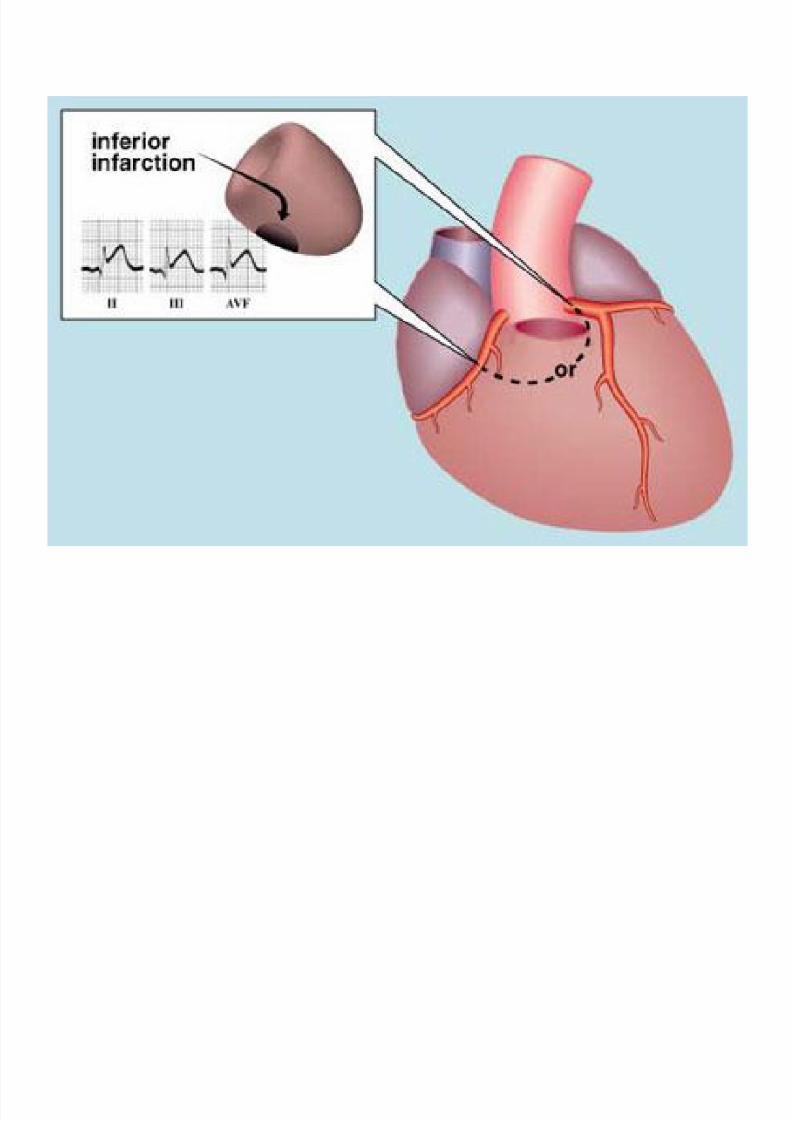
Inferior Infarction

8/13/2019 N 564 EKG Interpretation Lecture Version 2013 Stein
http://slidepdf.com/reader/full/n-564-ekg-interpretation-lecture-version-2013-stein 162/189
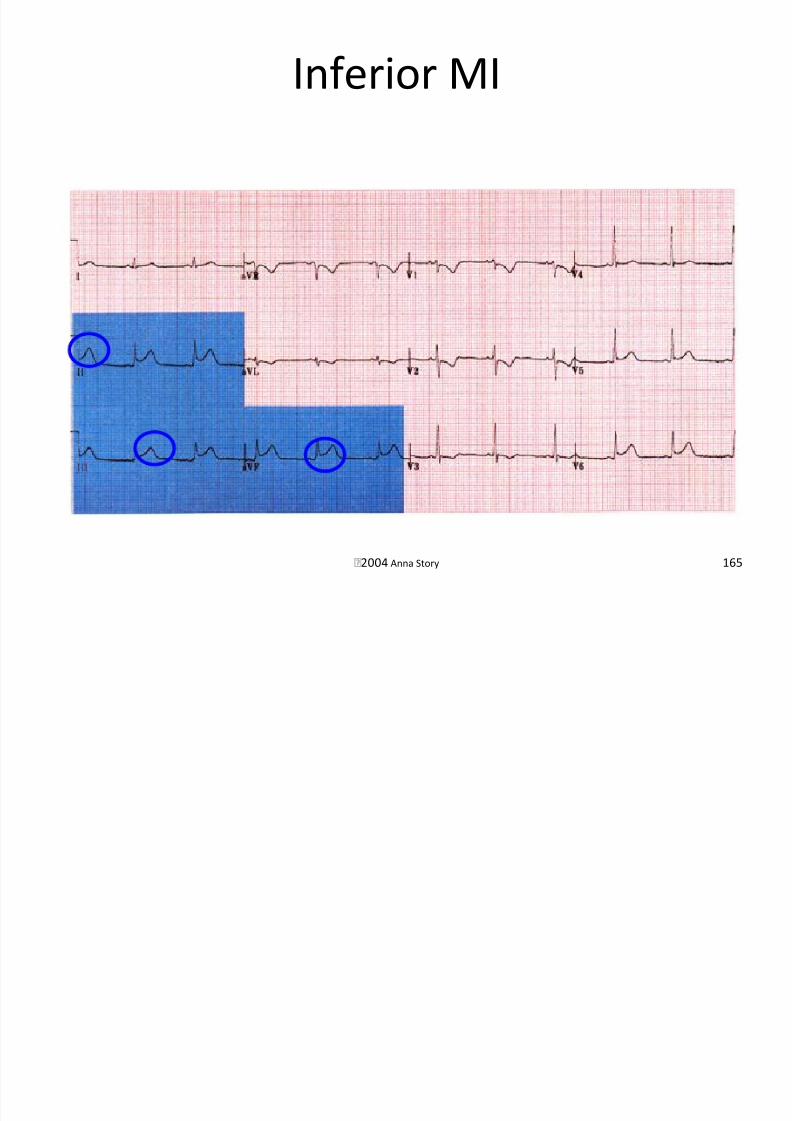
• Occlusion of the RCA or LCA• Q-waves in the inferior leads
– II, III, aVF
– ST segment changes seen in an acute MI
• One-third of inferior infarctions also include
portions of the RV
8/13/2019 N 564 EKG Interpretation Lecture Version 2013 Stein
http://slidepdf.com/reader/full/n-564-ekg-interpretation-lecture-version-2013-stein 163/189
8/13/2019 N 564 EKG Interpretation Lecture Version 2013 Stein
http://slidepdf.com/reader/full/n-564-ekg-interpretation-lecture-version-2013-stein 164/189
Inferior MI
8/13/2019 N 564 EKG Interpretation Lecture Version 2013 Stein
http://slidepdf.com/reader/full/n-564-ekg-interpretation-lecture-version-2013-stein 165/189
2004 Anna Story 165
Inferior Infarction
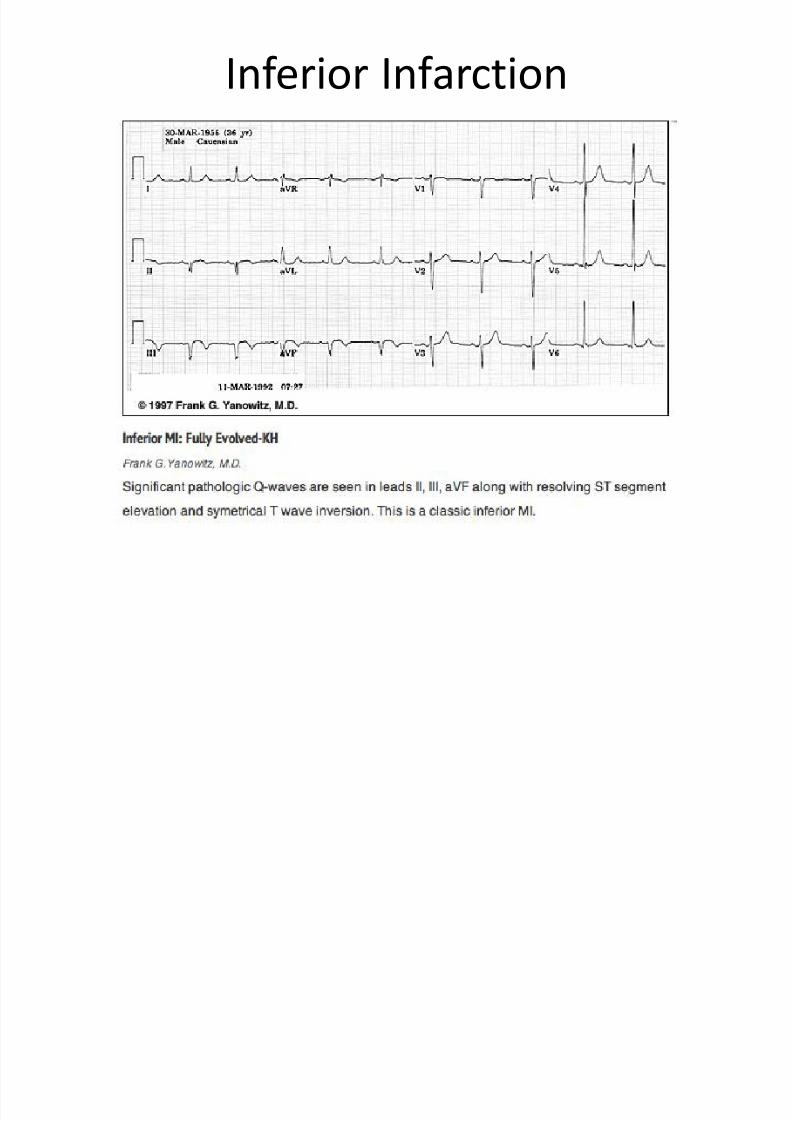
8/13/2019 N 564 EKG Interpretation Lecture Version 2013 Stein
http://slidepdf.com/reader/full/n-564-ekg-interpretation-lecture-version-2013-stein 166/189
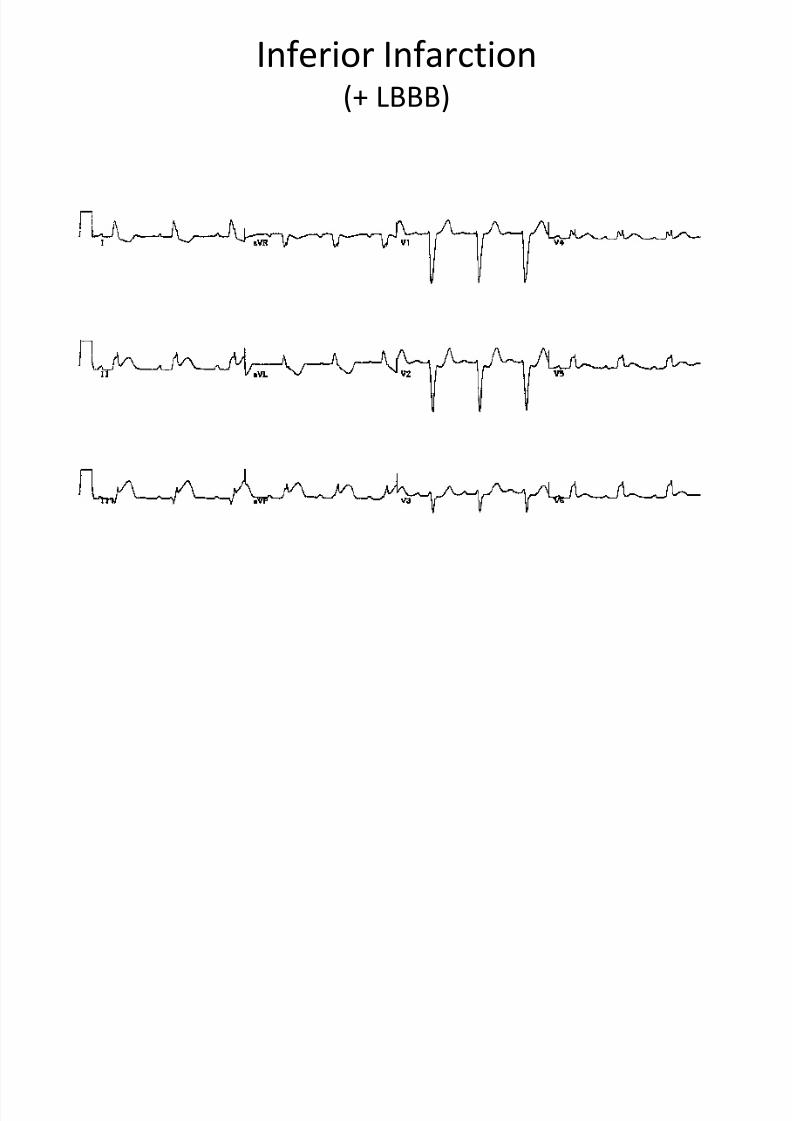
Inferior Infarction(+ LBBB)
8/13/2019 N 564 EKG Interpretation Lecture Version 2013 Stein
http://slidepdf.com/reader/full/n-564-ekg-interpretation-lecture-version-2013-stein 167/189
Posterior Infarction
8/13/2019 N 564 EKG Interpretation Lecture Version 2013 Stein
http://slidepdf.com/reader/full/n-564-ekg-interpretation-lecture-version-2013-stein 168/189
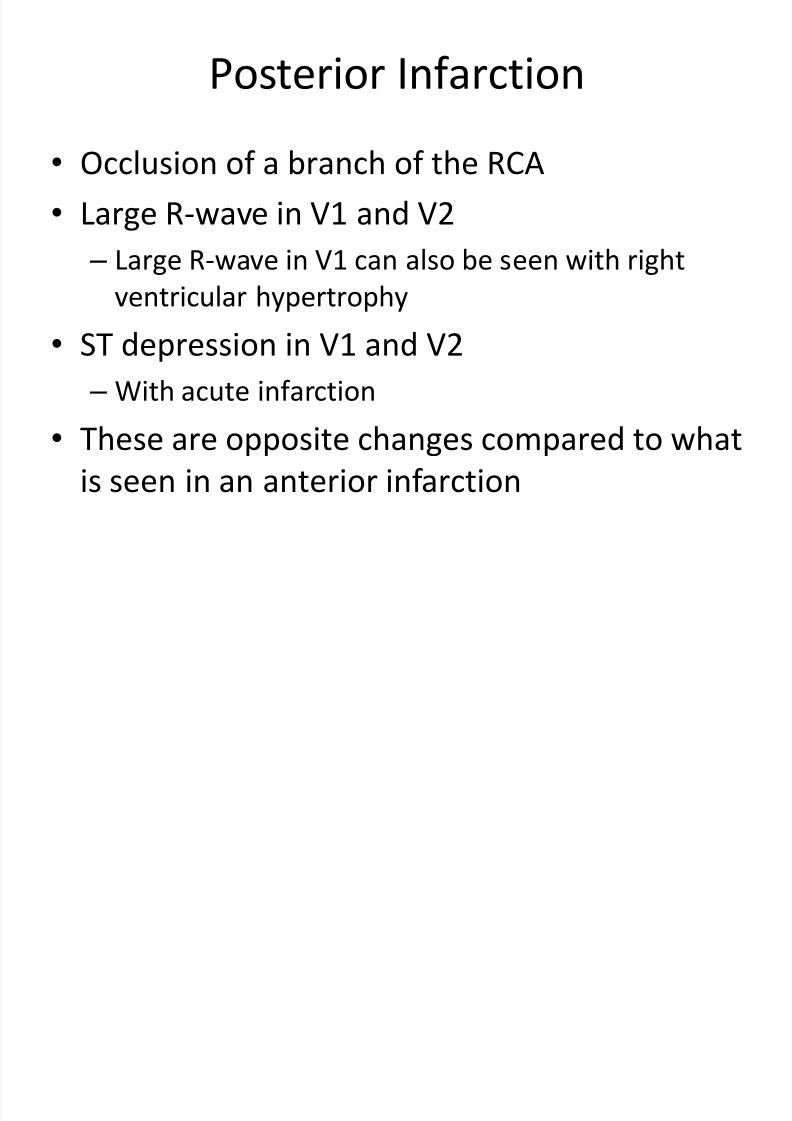
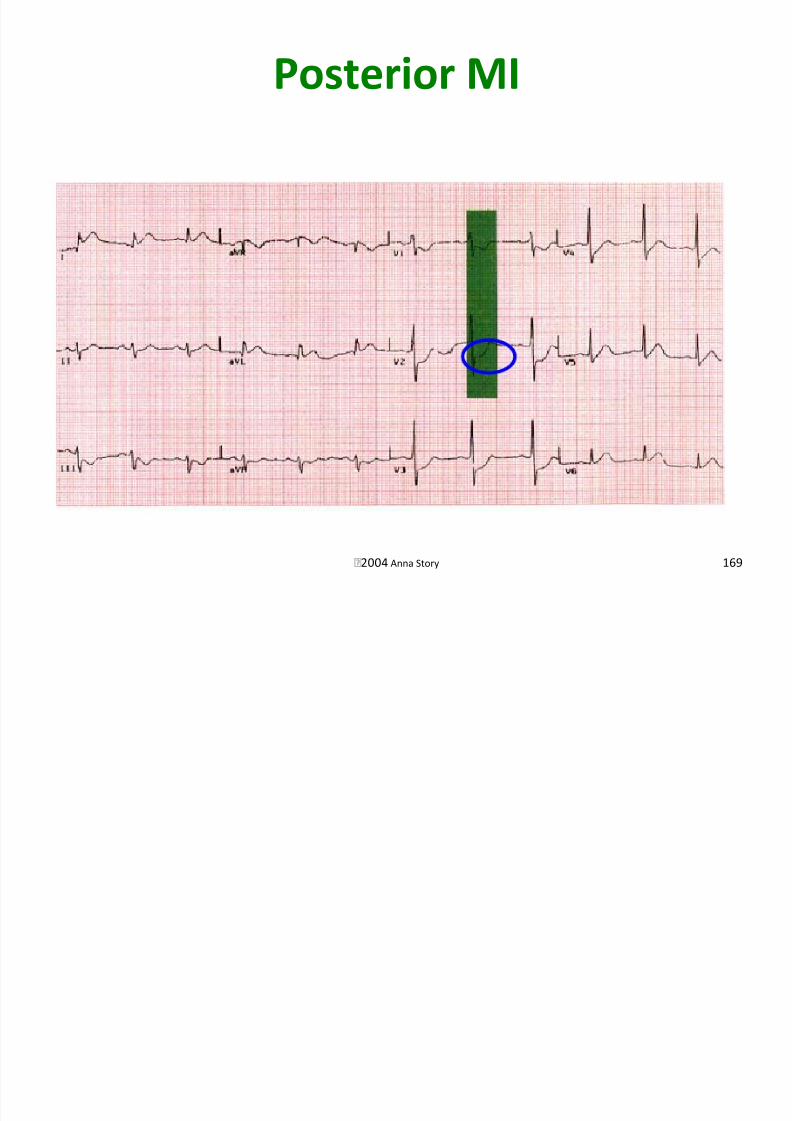
•Occlusion of a branch of the RCA
• Large R-wave in V1 and V2
– Large R-wave in V1 can also be seen with right
ventricular hypertrophy• ST depression in V1 and V2
– With acute infarction
•These are opposite changes compared to whatis seen in an anterior infarction
Posterior MI
8/13/2019 N 564 EKG Interpretation Lecture Version 2013 Stein
http://slidepdf.com/reader/full/n-564-ekg-interpretation-lecture-version-2013-stein 169/189
2004 Anna Story 169
Posterior Infarction

8/13/2019 N 564 EKG Interpretation Lecture Version 2013 Stein
http://slidepdf.com/reader/full/n-564-ekg-interpretation-lecture-version-2013-stein 170/189
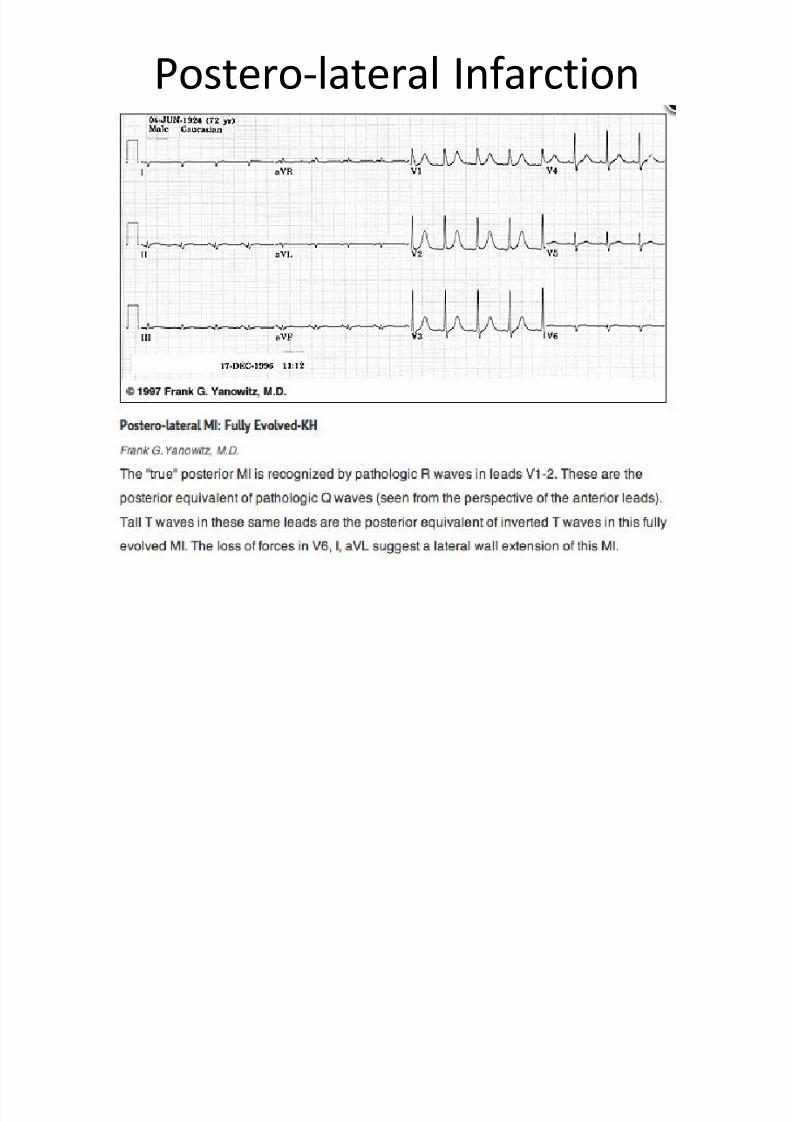
Postero-lateral Infarction
8/13/2019 N 564 EKG Interpretation Lecture Version 2013 Stein
http://slidepdf.com/reader/full/n-564-ekg-interpretation-lecture-version-2013-stein 171/189
Acute Infero-posterior Infarction

8/13/2019 N 564 EKG Interpretation Lecture Version 2013 Stein
http://slidepdf.com/reader/full/n-564-ekg-interpretation-lecture-version-2013-stein 172/189
8/13/2019 N 564 EKG Interpretation Lecture Version 2013 Stein
http://slidepdf.com/reader/full/n-564-ekg-interpretation-lecture-version-2013-stein 173/189
2004 Anna Story 173
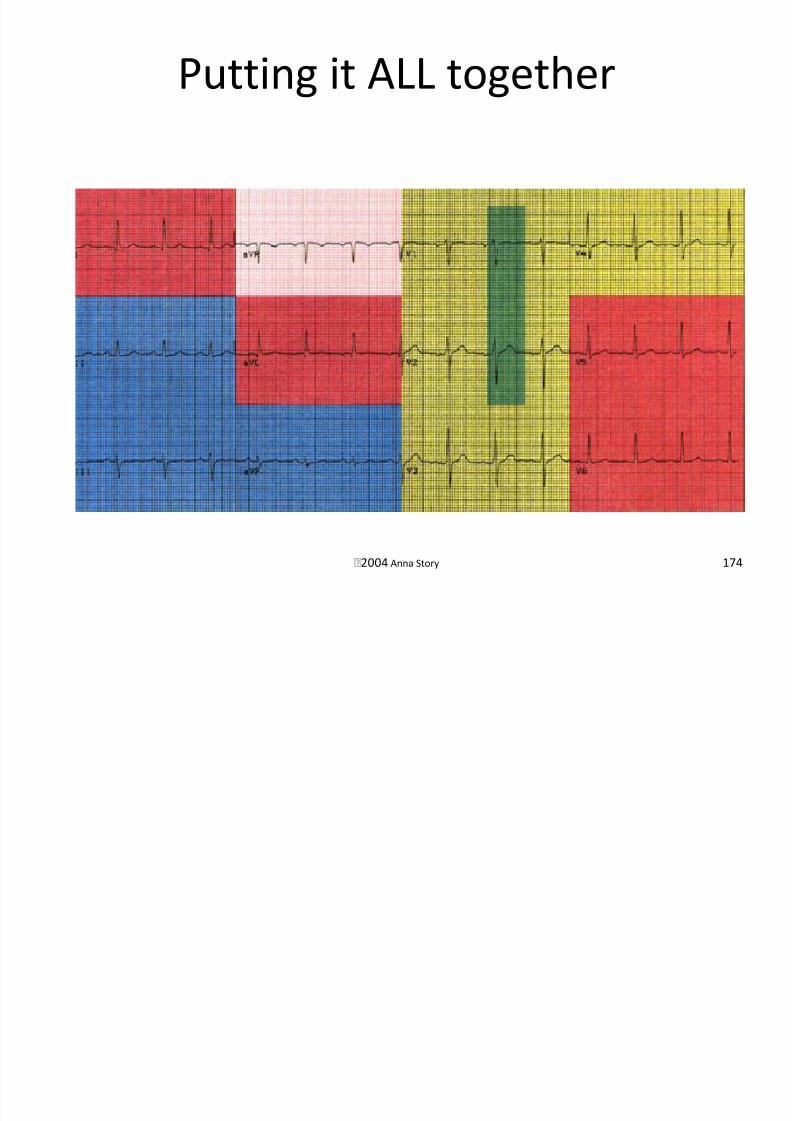
•A combination of infarcts such as: – Anterolateral yellow and red
– Inferoposterior blue and green
–
Anteroseptal yellow and green
Putting it ALL together
8/13/2019 N 564 EKG Interpretation Lecture Version 2013 Stein
http://slidepdf.com/reader/full/n-564-ekg-interpretation-lecture-version-2013-stein 174/189
2004 Anna Story 174
8/13/2019 N 564 EKG Interpretation Lecture Version 2013 Stein
http://slidepdf.com/reader/full/n-564-ekg-interpretation-lecture-version-2013-stein 175/189
2004 Anna Story 175
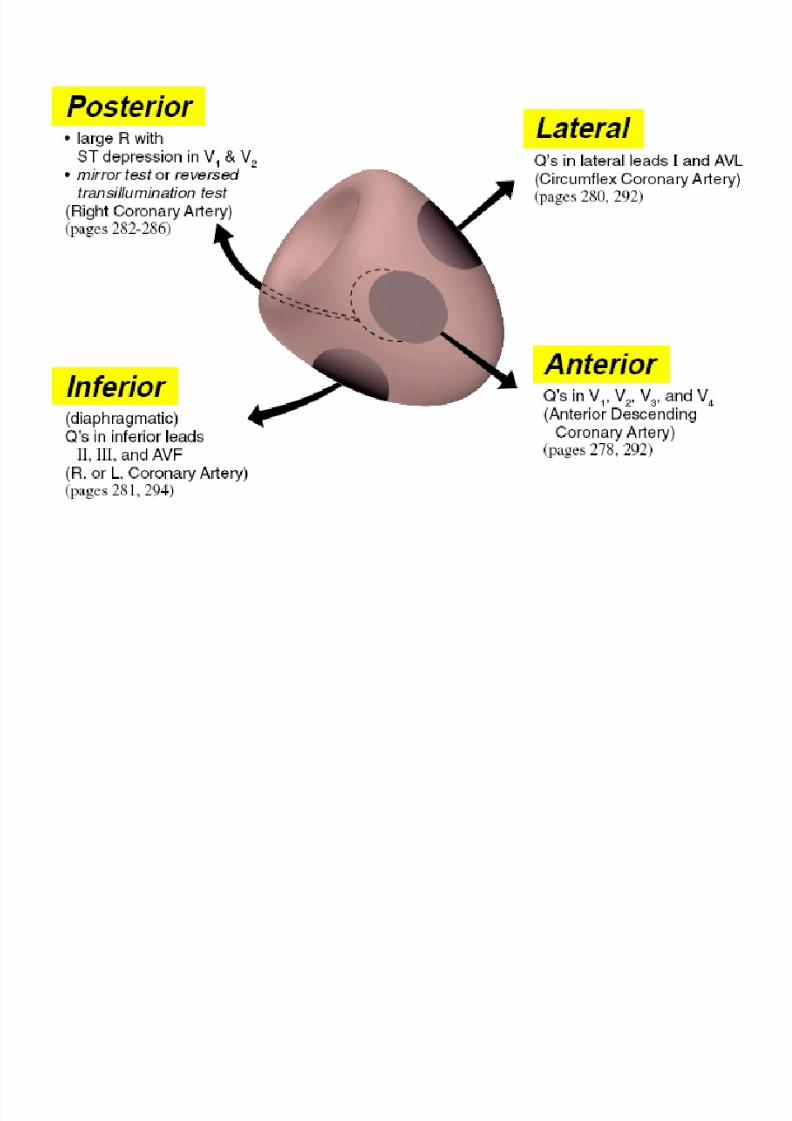
Locating Infarct or Ischemic Area
8/13/2019 N 564 EKG Interpretation Lecture Version 2013 Stein
http://slidepdf.com/reader/full/n-564-ekg-interpretation-lecture-version-2013-stein 176/189
•Important because treatment and prognosisdepend on location
• Four general areas within the LV
–Lateral
– Inferior
– Anterior
–
Posterior• Infarct may include more than one area

8/13/2019 N 564 EKG Interpretation Lecture Version 2013 Stein
http://slidepdf.com/reader/full/n-564-ekg-interpretation-lecture-version-2013-stein 177/189
EKG Distributions
8/13/2019 N 564 EKG Interpretation Lecture Version 2013 Stein
http://slidepdf.com/reader/full/n-564-ekg-interpretation-lecture-version-2013-stein 178/189
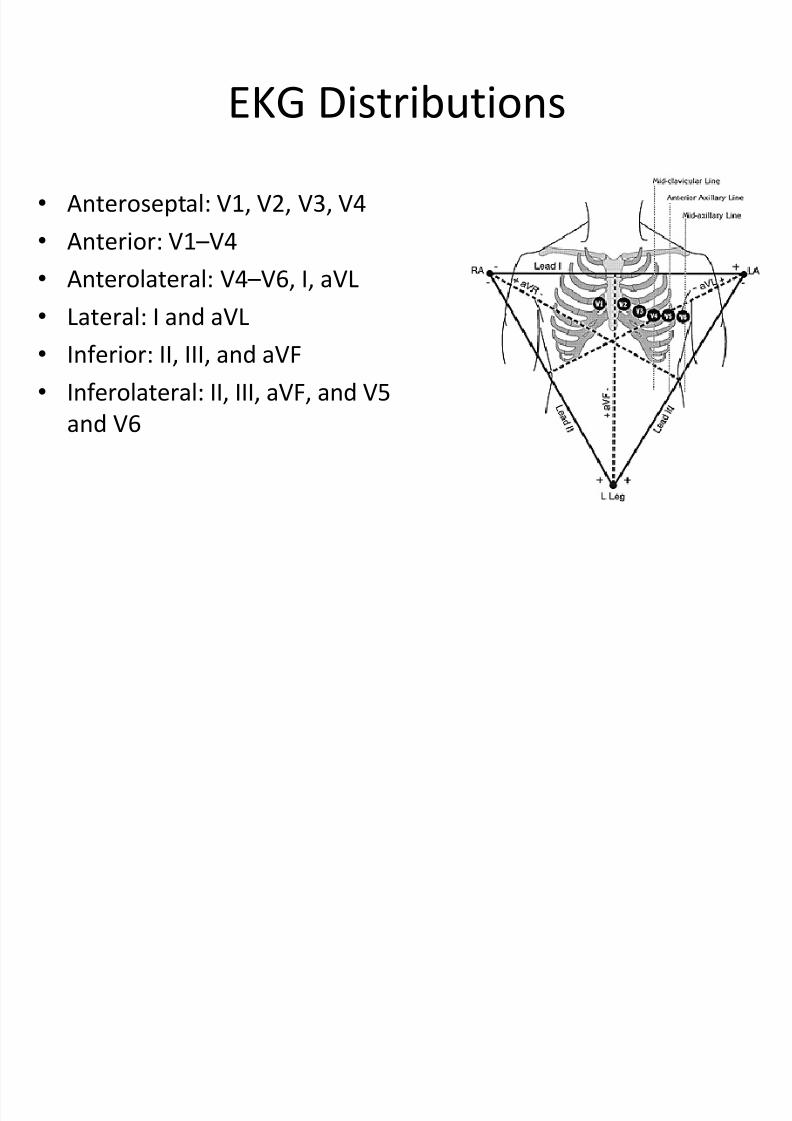
• Anteroseptal: V1, V2, V3, V4
• Anterior: V1 –V4
• Anterolateral: V4 –V6, I, aVL
• Lateral: I and aVL
• Inferior: II, III, and aVF
• Inferolateral: II, III, aVF, and V5
and V6
Warning
8/13/2019 N 564 EKG Interpretation Lecture Version 2013 Stein
http://slidepdf.com/reader/full/n-564-ekg-interpretation-lecture-version-2013-stein 179/189
•EKG diagnosis of infarction is generally notvalid in the presence of a LBBB
– LV depolarizes after RV with LBBB
–
Any Q-waves originating in the LV would fall in themiddle of the QRS complex
– Difficult to detect Q-waves
COPD
8/13/2019 N 564 EKG Interpretation Lecture Version 2013 Stein
http://slidepdf.com/reader/full/n-564-ekg-interpretation-lecture-version-2013-stein 180/189
•Often produces low voltage amplitude in allleads
• Usually RAD
• Multifocal Atrial Tachycardia is also seen withCOPD
8/13/2019 N 564 EKG Interpretation Lecture Version 2013 Stein
http://slidepdf.com/reader/full/n-564-ekg-interpretation-lecture-version-2013-stein 181/189
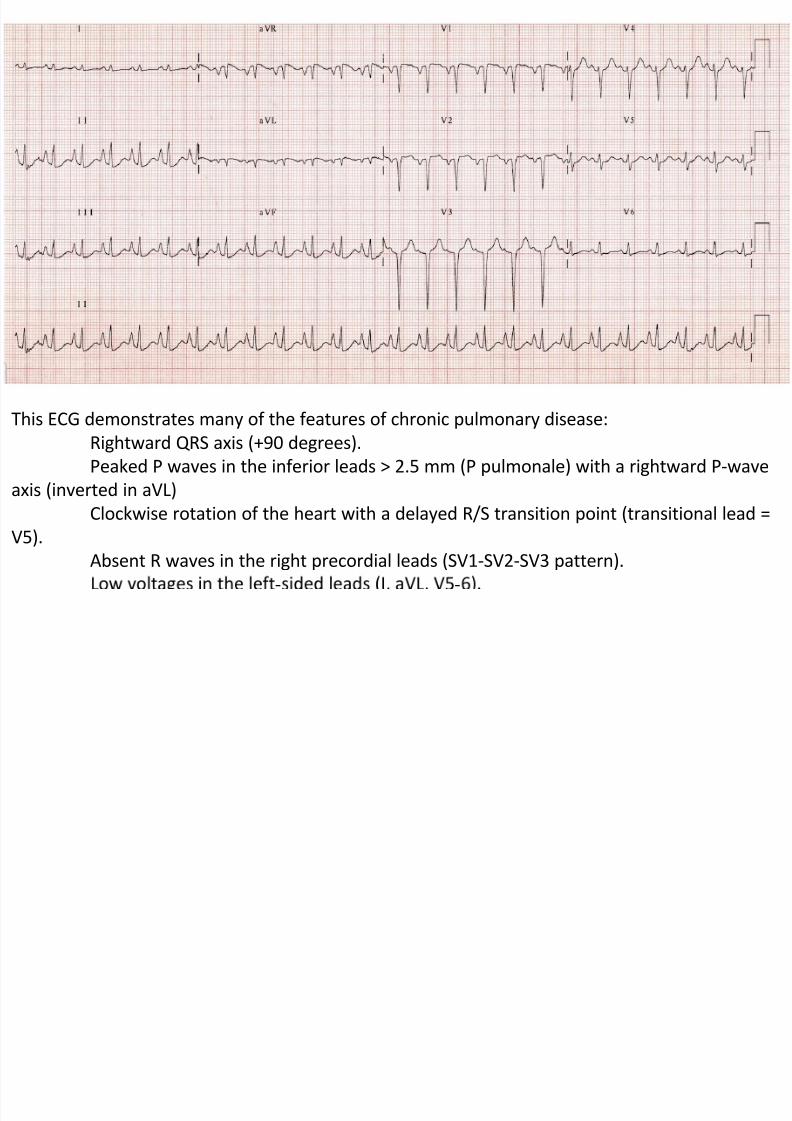
This ECG demonstrates many of the features of chronic pulmonary disease:
Rightward QRS axis (+90 degrees).Peaked P waves in the inferior leads > 2.5 mm (P pulmonale) with a rightward P-wave
axis (inverted in aVL)
Clockwise rotation of the heart with a delayed R/S transition point (transitional lead =
V5).
Absent R waves in the right precordial leads (SV1-SV2-SV3 pattern).
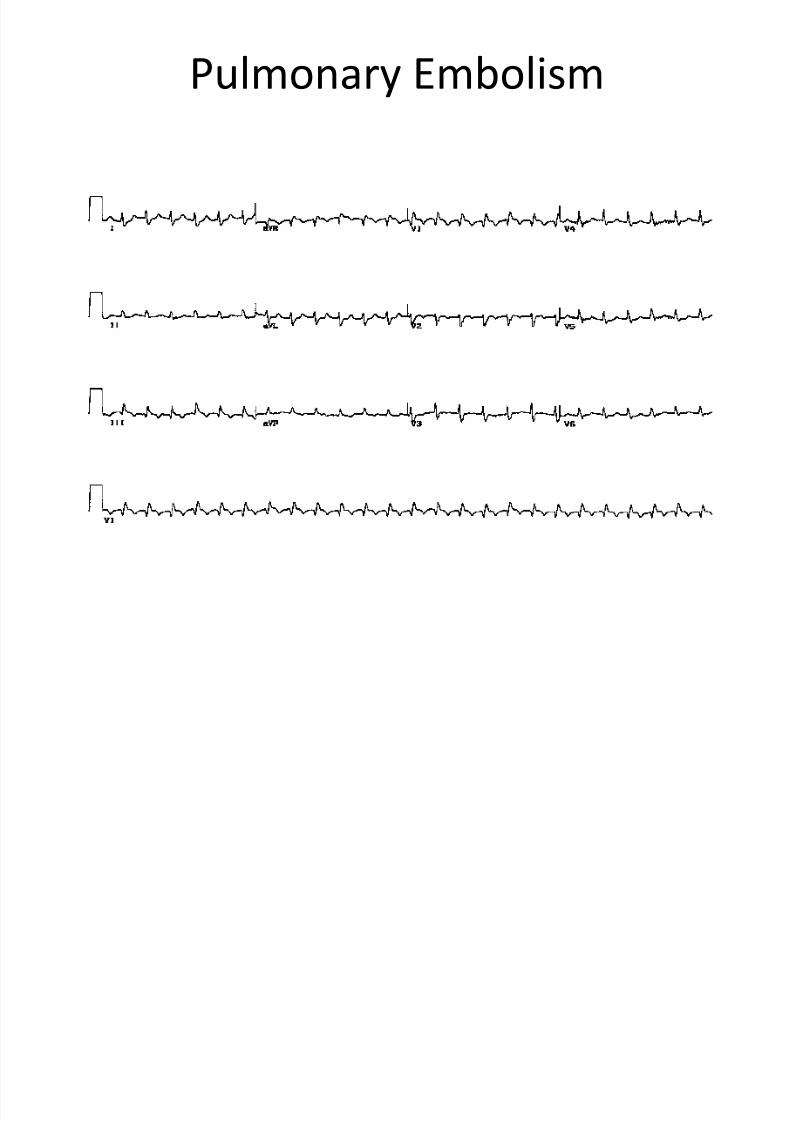
Pulmonary Embolism
8/13/2019 N 564 EKG Interpretation Lecture Version 2013 Stein
http://slidepdf.com/reader/full/n-564-ekg-interpretation-lecture-version-2013-stein 182/189
•S1Q 3T3
– Wide S-wave in Lead I
– Large Q-wave in lead III
–
Inverted t-wave in Lead III• Acute transient Right Bundle Branch Block
• R.A.D. and clockwise rotation
• Inverted t-waves in V1 – V4• ST depression in Lead II

8/13/2019 N 564 EKG Interpretation Lecture Version 2013 Stein
http://slidepdf.com/reader/full/n-564-ekg-interpretation-lecture-version-2013-stein 183/189
Pulmonary Embolism
8/13/2019 N 564 EKG Interpretation Lecture Version 2013 Stein
http://slidepdf.com/reader/full/n-564-ekg-interpretation-lecture-version-2013-stein 184/189
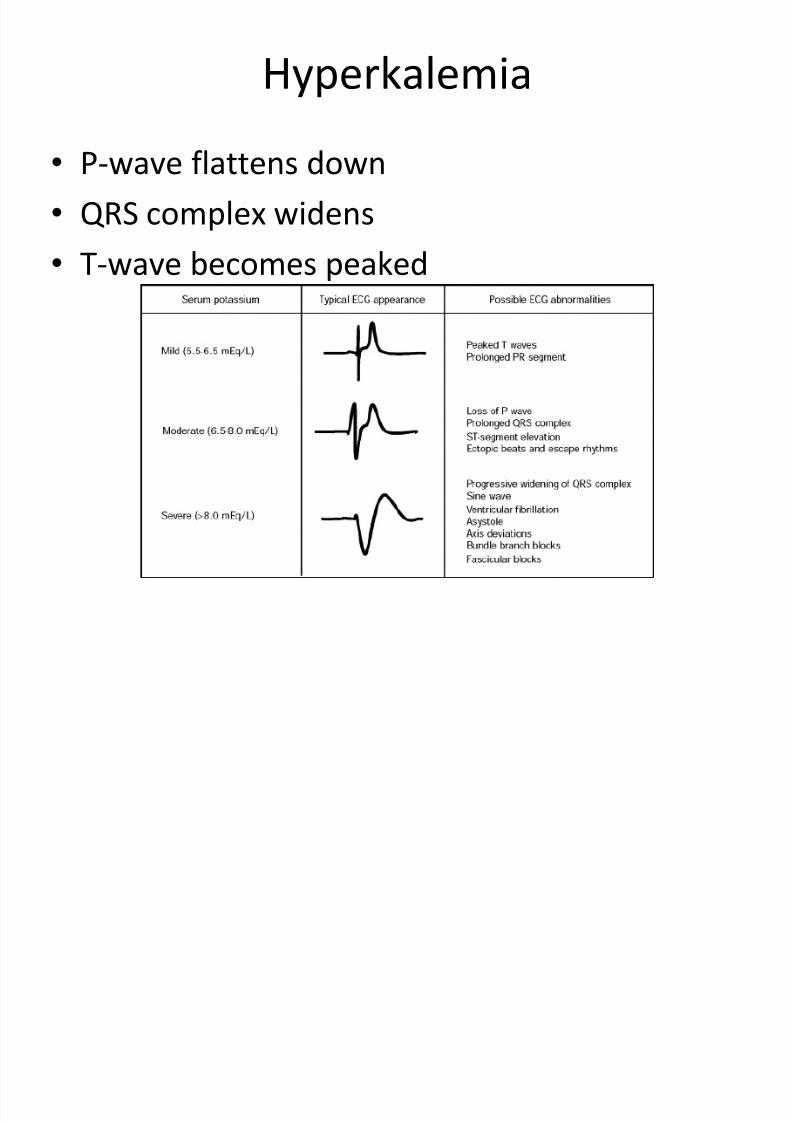
Hyperkalemia
8/13/2019 N 564 EKG Interpretation Lecture Version 2013 Stein
http://slidepdf.com/reader/full/n-564-ekg-interpretation-lecture-version-2013-stein 185/189
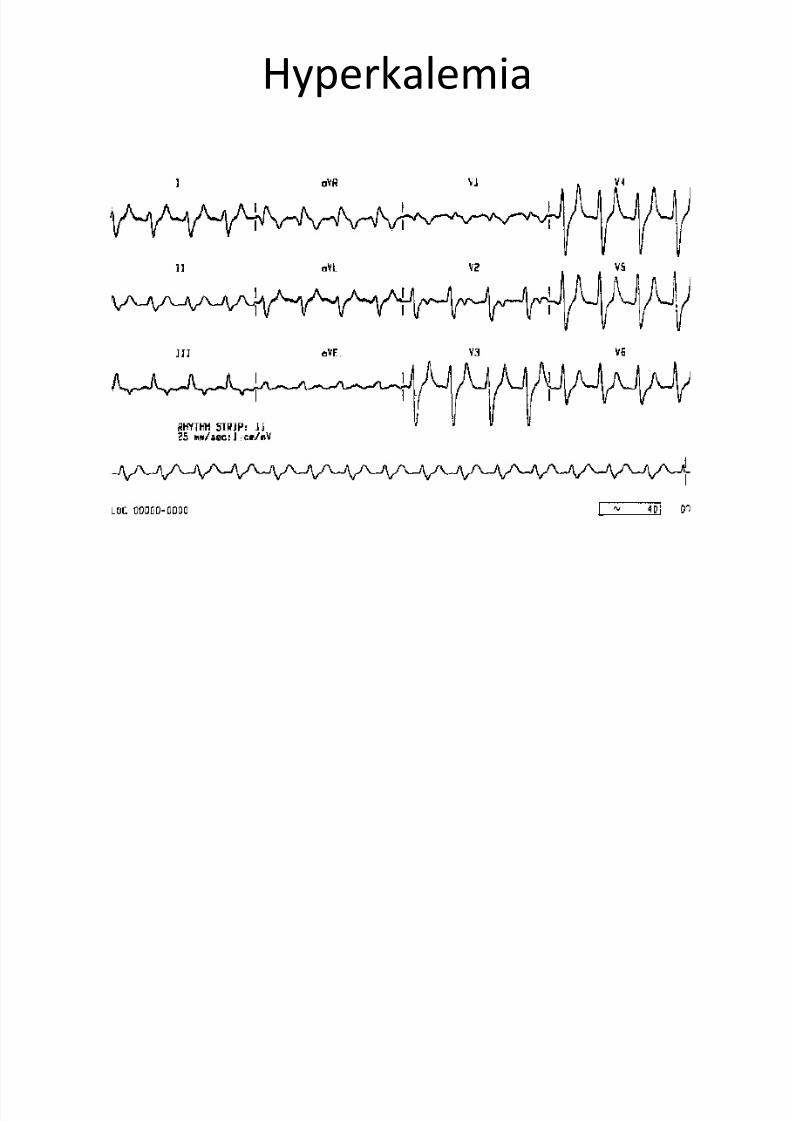
•P-wave flattens down
• QRS complex widens
• T-wave becomes peaked
Hyperkalemia
8/13/2019 N 564 EKG Interpretation Lecture Version 2013 Stein
http://slidepdf.com/reader/full/n-564-ekg-interpretation-lecture-version-2013-stein 186/189
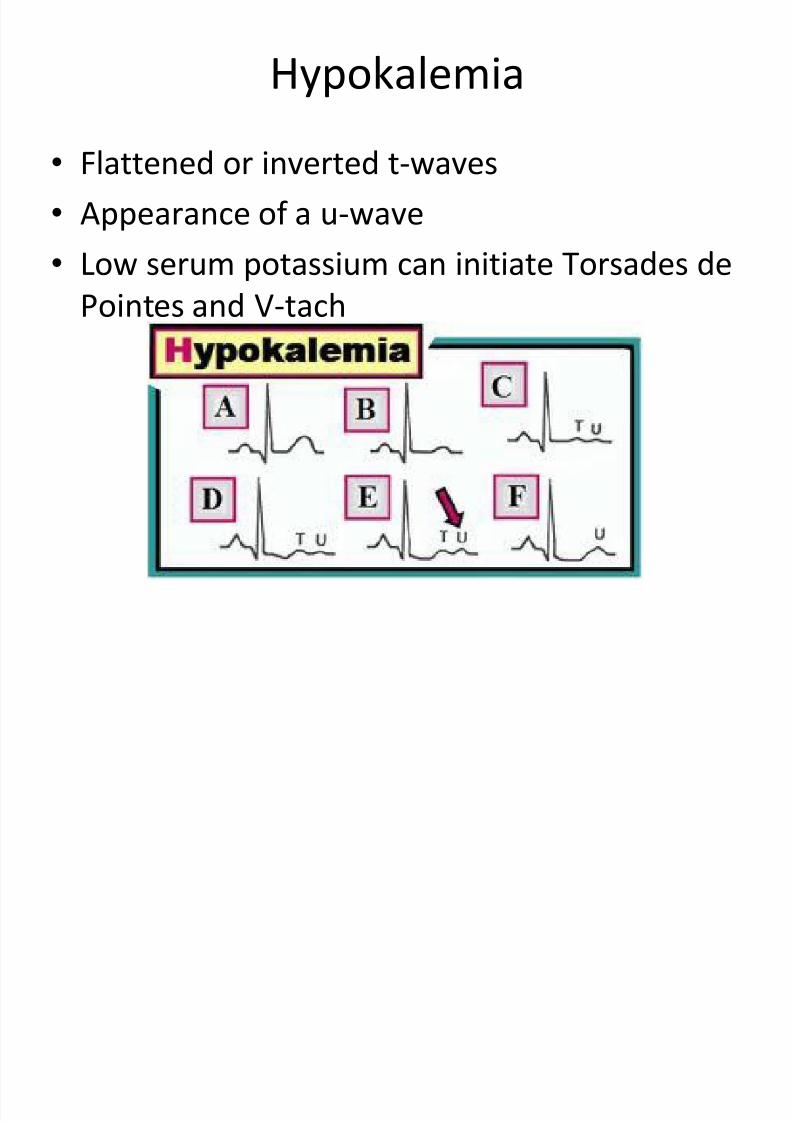
Hypokalemia
8/13/2019 N 564 EKG Interpretation Lecture Version 2013 Stein
http://slidepdf.com/reader/full/n-564-ekg-interpretation-lecture-version-2013-stein 187/189
•Flattened or inverted t-waves
• Appearance of a u-wave
• Low serum potassium can initiate Torsades de
Pointes and V-tach
Calcium
8/13/2019 N 564 EKG Interpretation Lecture Version 2013 Stein
http://slidepdf.com/reader/full/n-564-ekg-interpretation-lecture-version-2013-stein 188/189
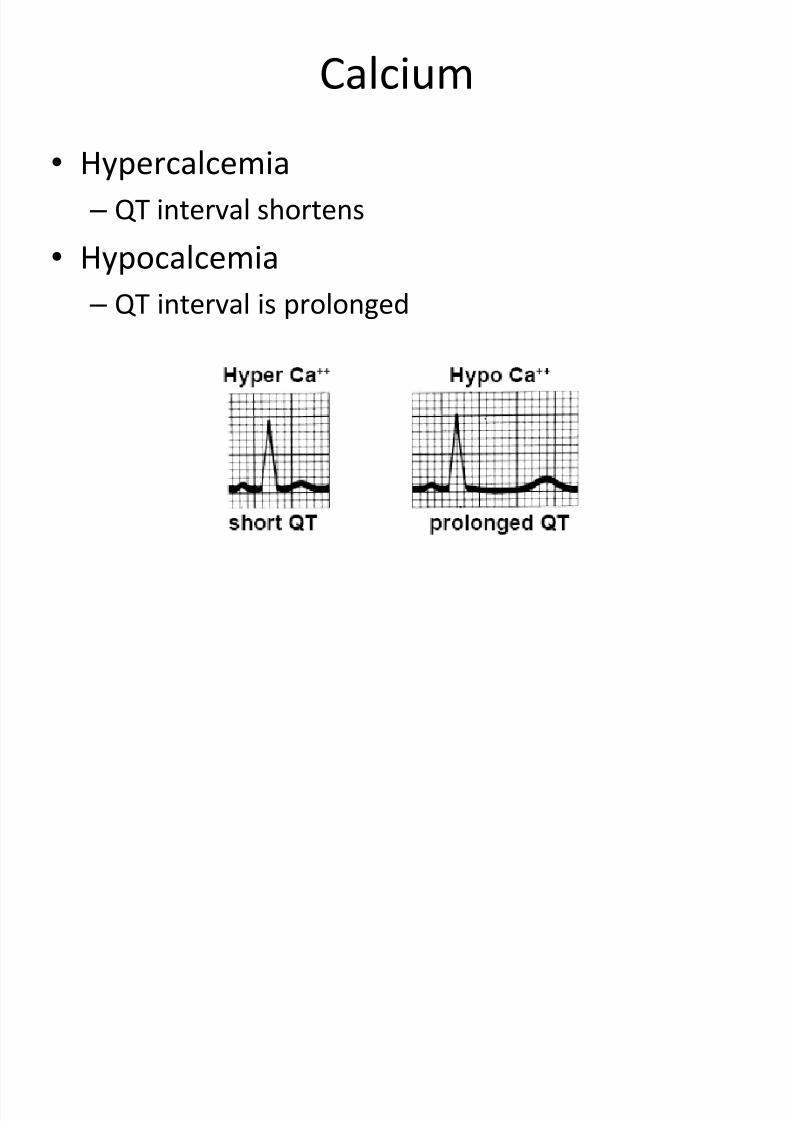
•Hypercalcemia – QT interval shortens
• Hypocalcemia
–QT interval is prolonged

8/13/2019 N 564 EKG Interpretation Lecture Version 2013 Stein
http://slidepdf.com/reader/full/n-564-ekg-interpretation-lecture-version-2013-stein 189/189