Embed Size (px)
Citation preview

FINAL DRAFT
Moving out of Poverty: Understanding Freedom, Democracy and Growth from the
Bottom-Up
National Synthesis Report
Shahana Rahman Fatima Jahan Seema
Nishat Sharmin Gautam Shuvra Biswas
Poverty Reduction and Economic Management The World Bank
2007

Content
EXECUTIVE SUMMARY ............................................................................................... 1
SECTION I: OBJECTIVES AND METHODOLOGY ................................................. 7 1.1 PURPOSE AND SCOPE OF THE STUDY ............................................................................ 7 1.2 STUDY METHODOLOGY ............................................................................................... 8
1.2.1 Identification of the Sample ................................................................................ 8 1.2.2 Tools and technique and selection of respondent: ............................................ 12 1.2.3 Unit of analysis:/ household categorization by official poverty line (OPL) ..... 13
1.3 NATIONAL CONDITIONS AND TRENDS ...................................................................... 14 1.3.1 Macroeconomic performance and poverty reduction in Bangladesh ............... 14
SECTION II. HOW IS MOBILITY AFFECTED BY POLICY FOCUS DEMOGRAPHIC FACTORS ........................................................................................ 28
2.1. WOMEN'S EMPOWERMENT WHAT DOES IT MEAN AND HOW TO MEASURE ................. 28 2.1.1 Community's understanding of women's empowerment ................................... 31 2.1.2. What are the most common ways of women empowerment? ........................... 35 2.1.3. What other factors make women empowered .................................................. 40
2.3.1.1. Community level factors ........................................................................... 42 2.3.1.2. Household level factors............................................................................. 42 2.1.3.1 Are the women from solvent families more empowered? ......................... 43
2.2. INTERACTION BETWEEN COMMUNITY MOBILITY AND WOMEN'S AGENCY ................. 44 2.2.1. Initial (2001) conditions in policy focus and growth ....................................... 46 2.2.2. Interaction between initial (2001) women's agency and the summery statistics of LOL ........................................................................................................................ 47 2.2.3. Women's empowerment at the community level and MOP Index .................... 47 2.2.4. Women's empowerment at the community level by Net Prosperity Index ....... 48 2.2.5. Women's agency is considered as an important means/ dimension of family welfare........................................................................................................................ 48 2.2.6. Findings from the qualitative analysis: ........................................................... 51
2.2.6.1. For her own well-being ............................................................................. 52 2.2.6.2. Family well-being ..................................................................................... 54 2.2.6.3. Community level well-being..................................................................... 55
2.3 HOW DO DEMOGRAPHIC FACTORS, ECONOMIC FACTORS AND ECONOMIC ASPIRATIONS AFFECT MOBILITY? .......................................................................................................... 57
2.3.1 Household composition ..................................................................................... 57 2.3.2.1 Community level initial condition ............................................................. 59
2.3.3 Credit and debit ................................................................................................ 63 2.3.4 Access to market ............................................................................................... 64 2.3.5 Migration .......................................................................................................... 66 2.3.6 Education .......................................................................................................... 67 2.3.7 Health ................................................................................................................ 68 2.3.8 Economic aspirations........................................................................................ 71
SECTION III: HOW DO SOCIAL FACTORS AFFECT MOBILITY? ........................ 74 3.1. SOCIAL STRATIFICATION ......................................................................................... 74
3.1.1. Measuring social stratification ........................................................................ 74

3.1.2. Relationship between prosperity (moving out of poverty) and social stratification ............................................................................................................... 76
3.2. SOCIAL CAPITAL ...................................................................................................... 77 3.2.1. Measuring social capital: ............................................................................... 78 3.2.3 Importance of social capital to community prosperity: .................................... 79
3.3. THE INTERACTION BETWEEN SOCIAL CAPITAL AND SOCIAL STRATIFICATION ........... 82 3.4. MOST PREVALENT TYPE OF SOCIAL CAPITAL PRESENT ............................................. 83
3.4.1. The type of social groups or associations: ...................................................... 84 3.4.2 Source of credit ................................................................................................. 88 3.4.3. Interaction and communal activities ................................................................ 93 3.4.4. Source of information: ..................................................................................... 94
SECTION IV: HOW DO POLITICAL FACTORS AFFECT MOBILITY .............. 97 4.1 DEFINITIONS OF LOCAL LEVEL DEMOCRACY AND GOVERNANCE ............................. 97
4.1.1 Definition of Democracy ................................................................................... 97 4.1.2 Local Level Governance ................................................................................... 98 4.1.3 Methodology ..................................................................................................... 99
4.2 LOCAL LEVEL STRATIFICATION .............................................................................. 100 4.2.1 Community stratification based on election situation .................................... 100
4.2.2 COMMUNITY STRATIFICATION BASED ON VOICE AND PARTICIPATION .................. 101 4.2.3 Community stratification based on local democracy ...................................... 102
4.2.4 Local Level Governance ................................................................................. 102
4.3. DEMOCRACY GOVERNANCE AND MOVING OUT OF POVERTY ................................ 104 4.3.1. Democracy and prosperity ............................................................................. 104 4.3.2 Local Governance and net Prosperity ............................................................ 105 4.3.3. Local Level Democracy, Local Governance and Mobility ............................ 106 4.3.2. Household Level Analysis .............................................................................. 108 4.3.3. Democracy, Governance and Four Transaction Group ................................ 109
4.4. UNDERSTANDING THE PROCESS, HOWS AND WHYS ............................................... 110 4.4.1 Community Level Analysis .............................................................................. 110
4.4.1.1 Some leading factors which have helped community prosperity ........... 110 4.4.2. Household Level Analysis .............................................................................. 114
4.4.2.1. Local Level Democracy .......................................................................... 114 4.4.2.2. Local level governance on access to services delivery ........................... 119
SECTION V: INEQUALITY ....................................................................................... 123 5.1 DEFINITION OF INEQUALITY .................................................................................... 123 5.2 RELATIONSHIP BETWEEN INEQUALITY AND COMMUNITY PROSPERITY .................... 124 5.3 INEQUALITY AND MOBILITY .................................................................................... 126
5.3.1 Distribution of four transition groups according to economic opportunities 127 5.3.2 Access to economic opportunities ................................................................... 128
5.4 REASONS OF CHANGES IN INEQUALITY .................................................................... 128 5.5 COMPARISON BETWEEN BOTTOM AND TOP STEPS OF LOL ....................................... 130
SECTION VI: ROLE OF FREEDOM, POWER AND INDIVIDUAL AGENCY .. 131 6.1 COMMUNITY LEVEL ANALYSIS ................................................................................ 131
6.1.1 Freedom .......................................................................................................... 131 6.1.2 Power .............................................................................................................. 135
6.2 HOUSEHOLD LEVEL ANALYSIS: ............................................................................... 137

SECTION VII: INTERACTIONS ACROSS FACTORS .......................................... 141 7.1. LADDER OF LIFE ANALYSIS: .................................................................................. 141
7.1.1. Factors to move up from far below the CPL ................................................. 141 7.1.1.1. Interaction between the factors of far below the CPL ............................ 144
7.1.2. Factors for moving up of the group far above the CPL ................................ 147 7.1.3. Compare the factors far above the CPL and far below the CPL ................... 150
7.1.3.1 Extent of factors ....................................................................................... 150 7.1.3.2. Differences having some factors ............................................................. 151
7.1.4. Interaction the factors of far above the CPL ................................................. 152 7.1.5. Factors for the communities just below the CPL ........................................... 153 7.1.7. Factors what impact OPL, CPL .................................................................... 159
7.1.7.1. Comparison between OPL and CPL ....................................................... 159 7.1.7.2. Factors What Make Possible to Move Up From Most Difficult Step..... 161 7.1.7.3. The Categories Which Consider a Step as a Middle Class ..................... 162
7.2. ANALYSIS OF INDIVIDUAL LIFE STORIES: ............................................................... 163 7.2.1. Factors for moving up from the chronic poor ............................................... 163 7.2.2. Factors for moving up from Mover ................................................................ 164 7.2.3. Factors for staying in the same level of Always Better off ............................ 165 7.2.4. Factors hinder faller from moving up ............................................................ 166
SECTION VIII: ASPIRATION OF YOUTH ............................................................. 168 8.1 CURRENT LIVELIHOODS SCENARIO OF THE YOUTH ................................................. 169 8.2 INTER GENERATION OCCUPATIONAL DIFFERENCES ................................................ 170 8.3 PROBLEM FACED BY THE YOUTH TO FULFIL THEIR CAREER ASPIRATION .................. 171 8.5 YOUTH'S PREPARATION TO DO FOR EARNING OF LIVING .......................................... 181 8.6 ASPIRATION OF FUTURE OCCUPATION OF THE YOUTH ............................................ 187
SECTION IX: CONCLUSION ..................................................................................... 191
1
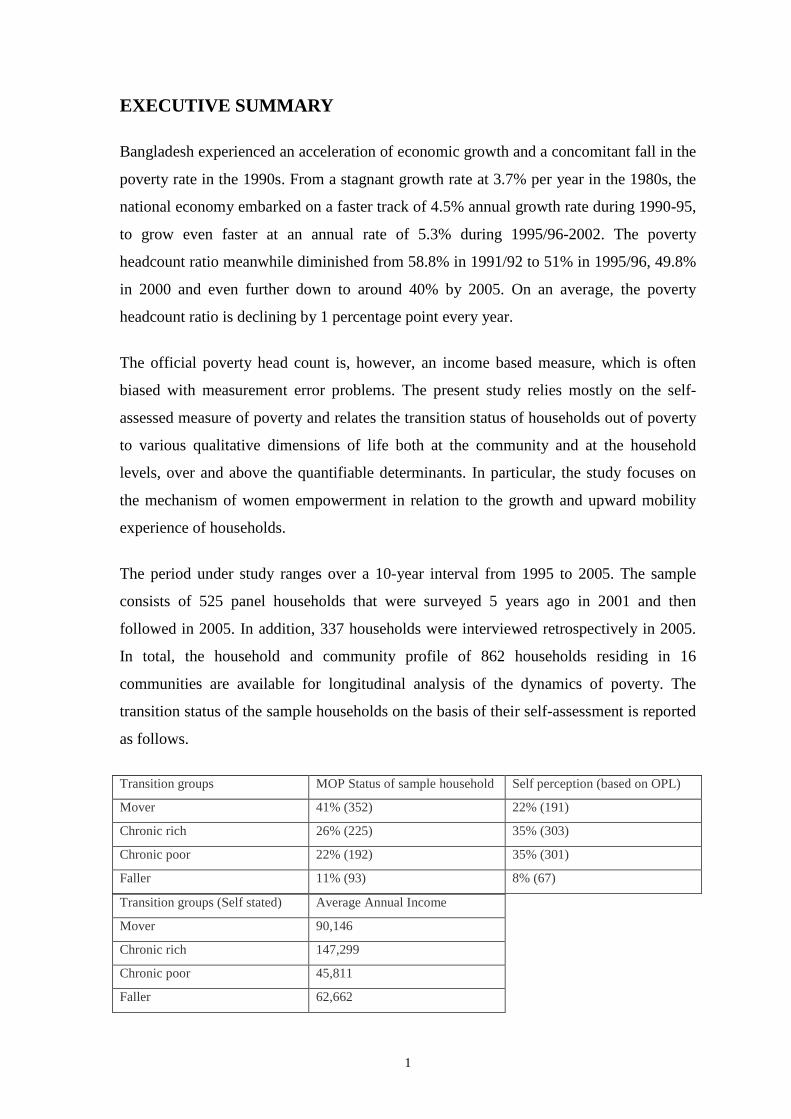
EXECUTIVE SUMMARY Bangladesh experienced an acceleration of economic growth and a concomitant fall in the
poverty rate in the 1990s. From a stagnant growth rate at 3.7% per year in the 1980s, the
national economy embarked on a faster track of 4.5% annual growth rate during 1990-95,
to grow even faster at an annual rate of 5.3% during 1995/96-2002. The poverty
headcount ratio meanwhile diminished from 58.8% in 1991/92 to 51% in 1995/96, 49.8%
in 2000 and even further down to around 40% by 2005. On an average, the poverty
headcount ratio is declining by 1 percentage point every year.
The official poverty head count is, however, an income based measure, which is often
biased with measurement error problems. The present study relies mostly on the self-
assessed measure of poverty and relates the transition status of households out of poverty
to various qualitative dimensions of life both at the community and at the household
levels, over and above the quantifiable determinants. In particular, the study focuses on
the mechanism of women empowerment in relation to the growth and upward mobility
experience of households.
The period under study ranges over a 10-year interval from 1995 to 2005. The sample
consists of 525 panel households that were surveyed 5 years ago in 2001 and then
followed in 2005. In addition, 337 households were interviewed retrospectively in 2005.
In total, the household and community profile of 862 households residing in 16
communities are available for longitudinal analysis of the dynamics of poverty. The
transition status of the sample households on the basis of their self-assessment is reported
as follows.
Transition groups MOP Status of sample household Self perception (based on OPL)
Mover 41% (352) 22% (191)
Chronic rich 26% (225) 35% (303)
Chronic poor 22% (192) 35% (301)
Faller 11% (93) 8% (67)
Transition groups (Self stated) Average Annual Income
Mover 90,146
Chronic rich 147,299
Chronic poor 45,811
Faller 62,662

2
By the self-reported measure of well-being in the ladder of life, there has been an
aggregate welfare gain during 1995-2005. However, the improvement concentrated
mostly in the middle of the initial distribution of well-being. Growth in employment,
productivity and income appears to be the major force contributing to the perceived
improved status of the movers. Increase in the number of working members, their
increased educational attainment and remittance from migrants workers contributed
largely to the increase in income and movement out of poverty. Among the broad
occupational groups engaged in farming, trade, services, and agricultural/nonagricultural
laborers, the agricultural/nonagricultural laborers were in the most disadvantageous
position to stride out of poverty.
On the contrary, aggregate and individual level shocks to household resources are found
to be mostly responsible for the downward movement of households. It, in turn, implies
that households unable to absorb shocks are the most vulnerable group to fall down the
ladder of well-being. It is mostly limited human capital and assets that led to the
stagnation of a part of the sample households caught in poverty.
Communities, beginning from a highly stratified state of socio-economic status and well-
being, ended up with a low level of women empowerment. The equality of socio-
economic opportunities thus proves to be a precondition for the progress of women at par
with men. Access to information resources, such as, library, newspaper, radio, is found to
significantly contribute to women empowerment. Higher initial household annual income
level predicts greater women empowerment. Women are more privileged in households
with heads having above secondary education, while education of spouse who is usually
female at the primary level plays a significant role in their empowerment. While larger
landholding does not help women, access of households to electricity and greater
availability of informal credit work in their favor in offering them greater freedom and
control over household decision-making and use of resources.
Households living in communities endowed with greater social capital and better social
infrastructure enjoy a much greater advantage of moving out of poverty. On the other
hand, good governance and access to market may not help upward mobility. At the
household level, increased household income and access to electricity tend to increase the

3
probability of moving out of poverty. While access to formal credit may not necessarily
help the poor, larger amount of formal credit turns out to be instrumental. The probability
of escape from poverty is lower for the agricultural and non-agricultural laborers in
comparison to other occupational groups. The factors that determine women
empowerment (as found earlier in regression analysis) do not necessarily influence
upward mobility, except for initial household income.
Overall, 95 percent households are headed by the male members. The number of female
headed households is higher among the chronic poor and fallers. Almost cent percent rich
households are headed by the male members and there are 97 percent male heads among
the mover households. About three-fourth household heads are literate. This is higher
among the chronic poor families and lower among the always rich. About 69 per cent
household heads among the movers are literate. The number of productive members is
more than 50 percent in all transition groups, but the number is the highest 63 per cent
among the always rich followed by 59 per cent among the movers, 55 per cent among the
chronic poor and 57 per cent among the fallers. More than 40 per cent households of
movers and the always rich have five members with jobs. Not a single household is found
among the fallers which has five members with jobs.
The number of farmers is highest among the always rich and the lowest among the
chronic poor. Among the movers 30 per cent are farmers and 22 per cent are involved in
trading. One-third of the working members also have a secondary occupation and 39 per
cent of them are involved in farming. The highest 47 per cent movers chose farming as
their secondary occupation.
At the community level, differences in religion, ethnicity, social status, and household
wealth are important in determining household upward mobility. With the transition of
households out of poverty status, social stratification in the dimension of economic status
gets leveled off and reinforces upward mobility of the poorer segment of the community.
Similarly, the strength of social capital, reflected in the bonding of community people in
developing social networks and initiating collective efforts, also widens the path of
movement out of poverty.

4
The study finds that the households from communities with initially high social
stratification and strong social capital were more successful in moving out of poverty. A
high level of social capital is also found to prevent descent into poverty. Communities
with high social capital are characterized by greater prevalence of NGO activities in
extending loans to the poor for the most part. The most common and important group in
household level social capital formation appears to be the micro-finance institutions. The
chronic poor and the movers constitute the largest portion of the participants in their
micro-credit programs. As such, linking social capital is most prevalent type of social
capital in both types of communities with high and low degrees of social stratification.
By examining the community level findings on local democracy it has been found that in
most cases high democracy communities ten years ago have become more prosperous
now. Comparing the communities with high and low mobility with high and low local-
level democracy it has been found that there is a significant correlation between
prosperity and a community which is high in democracy based on election, voice and
participation and high mobility. As for access to information media and different service
deliveries like electricity we have also found the chronic poor have less access to such
facilities and services. For example, households which have access to electricity are
mostly always rich (48.8 %), and those which have less access are chronic poor (26.2 %).
That means that the communities where there was a better situation of local level
democracy and governance have now less poverty.
To define inequality most of the participants give emphasis on wealth, education,
intelligence, power, occupation, gender, age, religion, socio-political position within
society etc. But the commonality among them is that all participants have defined
inequality from the economic point of view. According to them, wealth creates inequality
in society. Inequality has decreased in some sample communities and has increased in
others. At the same time, access to economic opportunities has increased because of
large-scale NGO intervention as well as increasing access to markets, diversifications in
rural productions etc. The quantitative data shows that 23 per cent of the sample
households are movers in those communities where villagers have more access to
economic opportunities while only 12 percent are mover communities with less access to
economic opportunities. The numbers of the rich and the chronic poor are comparatively
higher in the communities where villagers have less access to new economic

5
opportunities. As mentioned earlier, economic inequality has decreased over the last 10
years. For them it means that access to new economic opportunities has increased in those
communities. Nowadays more people get access to economic opportunities.
There is a positive relationship between freedom and wealth. That means the improvment
of economic condition enriches freedom. However, none of the respondents reported that
through freedom people could move out of poverty. In all communities both the men and
women agreed that there is a link between moving out poverty and power. However, there
is a controversy whether money is the cause of moving out of poverty or money brings
power. In six villages men's opinion is that when the poor become rich by earning money,
power comes in automatically. On the contrary the other opinion is: “When one is
powerful, one's economic conditions becomes good” (Ameer Hossain, male Daxin
Betabaria).
About 74 per cent youth population (at the age between 15 and 25 years old) are
unemployed in the 16 study communities, which is mostly double than the national
unemployment rate. About one-fourth of the young population work as wage labourers
followed by 16 per cent runing business and 14 per cent working in agriculture. The
youth are mostly interested in either salaried jobs (39 per cent) or running business (33
per cent). Based on the FGDs it can be said that some of the young men aspire to do the
same as their parents did. Most of the young men studying at different levels are
interested to do jobs, run businesses, and go abroad. But the less educated are interested
in doing something by cultivating the existing opportunities in their localities. The youth
face various problems to build their future careers. The major problems are lack of
parents’ education, financial crisis, early marriage, particularly for the young women,
lack of opportunities, and the overall socio-economic and political environment of the
communities.
The young participants identify some factors which will be helpful for them to reach their
future livelihoods options. These are: education, money or capital, supports and
encouragement from parents/in-laws, community people as well as government.
Moreover, young people's efforts, confidence, enthusiasm and overall environment are
also important for them to fulfil their career aspirations. Considering all difficulties and

6
potentialities, it is found that 94 per cent of the young respondents express their future
aspiration. Of them more than a half (54 per cent) hope to do jobs followed by 31 per cent
who want to run business and about 10 per cent who will be happy to either run a
business or have a job in future. It is not clear from the survey whether or not six per cent
youth are willing to do anything in future.

7
SECTION I: OBJECTIVES AND METHODOLOGY 1.1 Purpose and scope of the study
Despite being a traditionally Muslim society, Bangladesh has achieved considerable
success in its efforts to empower women at the grassroots level over the past decade.
Progressive policies and institutional innovations have resulted in impressive
achievements in social indicators for women (indicators on wage differentials between
men and women; access to credit for women; education; and infant and child mortality all
seem to have improved over the past 10 years).
The policy focus of the Moving Out of Poverty (MOP) study in Bangladesh would be to
understand how and why women’s empowerment gained force in rural areas in the
country and more importantly to probe in depth whether it made a difference to mobility
outcomes.
A leading principle in the approach of the global study is to build on existing data sets to
better understand poverty dynamics over time. The Bangladesh Moving Out of Poverty
study would build on a country-wide study on Participatory Poverty Assessment (PPA)
conducted by PROSHIKA in 2001. The PPA study covered 32 rural villages and 4
metropolitan cities (in addition to Dhaka) across Bangladesh.
The 2001 PPA study employed both quantitative and qualitative data collection methods.
A village census, and household level questionnaires were conducted in each community
in addition to a unique questionnaire on women’s status. The latter included modules to
collect data on economic/income earning activities of women; their access to credit;
women’s physical mobility; their decision-making powers; land-ownership issues;
domestic violence; marriage; and political participation. The Moving Out of Poverty study
would build on this unique data set to explore its main hypothesis in rural areas in
Bangladesh i.e. whether women’s empowerment makes a difference to mobility
outcomes.

8
1.2 Study methodology
The panel data (2001) set contains a unique module on women’s status. The first step in
the research was to conduct principal component analysis/factor analysis using data from
this module. Simple correlation matrices have been constructed across indicators such as
economic/income earning activities of women; their access to credit; women’s physical
mobility etc. Of the variables that exhibit a correlation, some have been picked up to
construct an index on women’s agency. Households across the sample for the 2001 study
have then been categorized into those exhibiting high, medium, and low women’s agency.
A similar analysis has been done on households in the 2001 PPA sample to divide them
into those exhibiting high and low mobility. (Categorization was based on a question in
the 2001 PPA Household Questionnaire that asked each household whether its income
had increased, stayed the same or decreased in the past 5 years i.e. since 1996).
The above statistical analysis has been used to draw up the following 2x3 matrix:
Table 1.1: Categorization of Households Using 2001 PPA Data High Mobility Low Mobility
High Agency Medium Agency
Low Agency Table 1 has given an idea of how households with certain level of agency and mobility,
has been distributed across villages in the PPA study. Geographical concentration, if any,
has then been used to inform sampling.
1.2.1 Identification of the Sample
The MOP study in Bangladesh has followed the same sample design as adopted in the
Participatory Poverty Assessment (PPA), 2001 with some modification. A multi stage
stratified purposive and random sampling technique has been employed to select the
sample location for the study.
Stage 1: At the first stage of sampling design for the MOP study in rural areas of
Bangladesh, all districts (64) in the country have been stratified into four different groups
on the basis of the value of poverty head count index of those districts. The four groups,
which had been considered in the PPA study, include the value of the head count index up

9
to 40.0, from 40.1-45.0, 45.1 to 50.0, and 50.1 and above. Group I had included 13
districts, group II had included 24 districts, group III 17 and group IV 10 districts.
In the PPA study in 2001, 16 districts were selected to cover 25 percent of the total
districts in the country so as to ensure the representation of the whole country. The MOP
study has covered 8 districts from different agro ecological regions using the same IPI
(Income Poverty Index) classification as the PPA study. In other words, the entire sample
of the original PPA study was halved.
However, the number of districts has been chosen from each of the IPI groups, using the
following formula: xi = X (ni / N) where, xi = sample districts in ith (each) group, X = total sample size, ni = number of districts in ith (each) group, and N = total number of districts.
Hence, The sample size for group I is: x1 = 8 (13/64) = 2 (with rounding up),
For group II is: x1 = 8 (24/64) = 3 For group III is: x1 = 8 (17/64) = 2 (ignoring the decimal points), For group IV is: x1 = 8 (10/64) = 1 (with rounding up).
Table 1.2: Selecting Districts from the PPA Sample
Districts Value of Head-Count Index
Upto 40.0 40.1-45.0 45.1-50.0 50.1 & above Total number of districts
13 24 17 10
Number of the districts chosen
2 3 2 1
The districts from each of the four groups have been first categorized on the basis of the
administrative divisions and then the districts that were closest to the mid-value of the
group have been chosen as the sample district from different divisions/agro ecological
regions. Presumably, the above procedure has helped to select a set of districts which
have been representative of the whole country.
10
Stage 2: At the second stage, one upazila has been selected from each of the previously
selected 8 districts. To ensure district level representation, average landholding status and
literacy rates of the households of the upazilas have been considered. (This was in line
with the stratification scheme for selecting upazilas in the 2001 PPA study). Community
Series of the Bangladesh Bureau of Statistics and PPA has a good database for this. All
the upazilas of each of the selected districts have been ranked on the basis of both the
proportion of households owning no land and the rates of illiteracy (giving equal weights
to both of them) and then, the upazila that has been ranked middle has been selected as
the sample upazila for the selected district. In cases where there were two upazilas at the
middle on the basis of the above criteria, either of the two have been selected randomly.
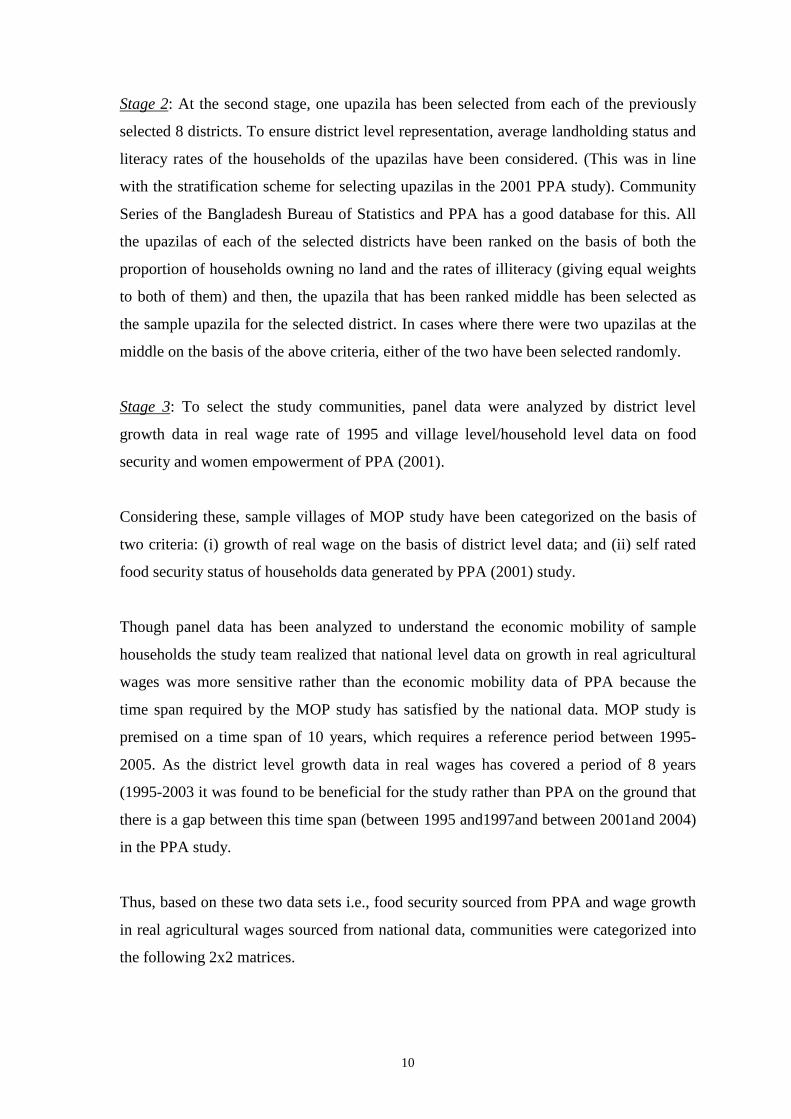
Stage 3: To select the study communities, panel data were analyzed by district level
growth data in real wage rate of 1995 and village level/household level data on food
security and women empowerment of PPA (2001).
Considering these, sample villages of MOP study have been categorized on the basis of
two criteria: (i) growth of real wage on the basis of district level data; and (ii) self rated
food security status of households data generated by PPA (2001) study.
Though panel data has been analyzed to understand the economic mobility of sample
households the study team realized that national level data on growth in real agricultural
wages was more sensitive rather than the economic mobility data of PPA because the
time span required by the MOP study has satisfied by the national data. MOP study is
premised on a time span of 10 years, which requires a reference period between 1995-
2005. As the district level growth data in real wages has covered a period of 8 years
(1995-2003 it was found to be beneficial for the study rather than PPA on the ground that
there is a gap between this time span (between 1995 and1997and between 2001and 2004)
in the PPA study.
Thus, based on these two data sets i.e., food security sourced from PPA and wage growth
in real agricultural wages sourced from national data, communities were categorized into
the following 2x2 matrices.

11
High Food Security Low Food Security
High Wage Barisal: Bisharikhati
Narsingdi: Char belabo,
Chitain
Faridpur: Arairashi, Char
Kumaria
Feni : Beriabaria
Panchagarh:
Patnipara,
Ranochandi
Barisal: Badalpara
Jamalpur: Guthi
Feni: Uttar Ghutuma
Low Wage Gazipur: Dorikhojikhani,
Gillarchala
Kurigram: Ikumarivathi
Sumangonj:
Daspara, Modhupur
From this distribution of villages, an over sampling was done from high-high cell in order
to address the requirement of MOP study. Thus, 16 villages were finally selected of
which 6 villages were selected from high-high cell, 5 villages were selected from high-
low cell, 3 villages were selected from low-high cell and 2 villages were selected from
low-low cell. These are following: High Food Security/ High Wage Rate: Bisharikhathi,
Stage 4: The Focus Group Discussion on Ladder of Life has been used to rank the
mobility status of households in each village now versus what it was 10 years ago. The
PPA household list has been used for household classifications namely movers, always
better of (always rich), the chronic poor and fallers. The proportion of households
selected from the above categories are 40% from movers, 30% from always better off,
20% chronic poor and 10% fallers. To capture the reason of moving out of poverty
movers have been over-sampled.
In addition, a Focus Group Discussion on Empowerment has been conducted primarily
with women in each village to identify the indicators for measuring women’s agency. On
the basis of the indicators identified by the group, the group has then been asked to
classify households in the original PPA study into 3 categories: those exhibiting high
women’s agency; medium; and low women’s agency. This data has been overlaid with
Chitani, Arairashi, Char Kumaria, Daxin Betabaria, Char Belabo: High Food Security/
Low Wage Rate: Dorikhozikhani , Gilarchala, Ikumeribhati. Low Food Security/ High
Wage Rate: Patnipara ,Ranchandi, Badalpara, Gotia, Uttar Gutuma; Low Food
Security/Low Wage Rate: Dashpara, Modhopur.

12
the data on household mobility from the Focus Group Discussion: Ladder of Life, to
arrive at the following 2x3 matrix:
Table 3: Categorization of Households Using Focus Group Discussions
High Mobility Low Mobility High Agency Medium Agency Low Agency 1.2.2 Tools and technique and selection of respondent:
Quantitative: Household questionnaire: For the quantitative data collection a structured questionnaire
has been administered which included seven sections; Section 1: Household Roster,
Section 2: Economic Characteristics, Section 3: Education and health, Section 4: Social
capital, Section 5: Power, Governance and Access to Information, Section 6: Freedom,
Crime and Violence and Section 7: Perceptions of Well-being and Aspirations.
In addition as the policy focus of the Moving Out of Poverty (MOP) study in Bangladesh
is to understand how and why women’s empowerment gained force in rural areas in the
country and more importantly to probe in depth whether it made a difference to mobility
outcomes, an additional questionnaire has been used to capture the relation between
women empowerment mobility and growth at individual level.
Community profile questionnaire: the community profile has intended to provide data that
compliments the data collected through the household questionnaire and therefore flowed
largely the same structure.
Respondents for household Questionnaire:
Three types of respondents have been selected to collect information household heads
aged between 30 to 60 (the reason for selecting this age group was to capture information
over the last 10 years), wives of household heads and children of household aged between
15 to 25 (male or female).
The information for the community profile has been collected from one or two local key
informants who are very knowledgeable about the community. They are usually either

13
community leaders or government officials or politician or important local employers or
businessmen or teachers. The consideration for the selection of informants for this
instrument is not only which informant is most likely to know the requested information
but also, which informant is most likely to provide it in an unbiased manner.
Qualitative: Different types of qualitative methods have been used e.g. FGD, ladder of life, timeline,
case study and individual life story.
The same criteria have been used in selecting participants in various FGDs. Four FGDs
on ladder of life; livelihood, freedom, power, democracy and local governance;
community time line, have been conducted with male and female groups in each
community. FGD on Aspiration of youth has only been conducted with the young men
and women.
Two mini case studies have been done with the person who are knowledgeable about the
selected topics.
Individual life story: In each community 12 individual life stories have been conducted.
Of them five (40%) individual life stories have been conducted among the movers
followed by four (30%) among always rich, two (20%) among chronic poor and one
(10%) among fallers. It has also tried to bring equal number of male and female
respondents in conducting individual life stories.
1.2.3 Unit of analysis:/ household categorization by official poverty line (OPL)
Data has been analyzed at three different levels: community, household and individual.
Households have been categorized based on a community poverty line drawn by the
community people. But the community poverty lines varied among the 16 sample
communities. Therefore, to standardize the categorization 'official poverty line' (define a
family of 4 persons having an income of Tk. 130 per day) has been used to categorize the
sample households into four types e.g. mover, always better off, chronic poor, faller. The
respondents placed their households in the ladders on the questionnaire now and 10 years
before considering the OPL. Based on that each household has been categorized
accordingly.

14
1.3 National Conditions and Trends
1.3.1 Macroeconomic performance and poverty reduction in Bangladesh
Bangladesh experienced an acceleration of economic growth and a concomitant fall in
poverty rate in the 1990s. From a stagnant growth rate at 3.7% per year in the 1980s, the
national economy embarked on a faster track of 4.5% annual growth rate during 1990-95,
to grow even faster at an annual rate of 5.3% during 1995/96-2002 (BBS, 2005). The
poverty headcount ratio meanwhile diminished from 58.8% in 1991/92 to 51% in 1995/96
and further dropped to 49.8% in 2000 (BBS, 2001).
The continuation of this impressive macroeconomic performance in the first five years of
the twenty-first century has led development practitioners and policy makers to believe
that Bangladesh is on the way to halving the rate of poverty by 2015 and Millennium
Development Goals are not far away (IMF, 2005). According to a projection, if per capita
consumption expenditure grows at an annual rate of 4%, the poverty rate would be as low
as 25.8% by 2020 (MOF, 2003). Against this backdrop, a pertinent question arises: how
changes in important macroeconomic variables have shaped the dynamics of poverty in
Bangladesh over the last 15 years?
The implications of macroeconomic performance for the poverty situation in a country
have occupied an important part of the large body of literature on poverty analysis since
the 1970s, a trend which gained momentum in the 1980s onwards. A series of macro-
econometric studies paid attention to the quantification of the relationships among
poverty and key macroeconomic variables, particularly unemployment and inflation,
using reduced form models (Blank and Blinder, 1986; Cutler and Katz, 1991; Blank,
1993; Blank and Card, 1993; Tobin, 1994; Powers, 1995).
Decomposition of poverty change
Economic growth is expected to reduce poverty, more so if accompanied by lower
economic inequality. This expectation is substantiated by Bruno, Ravallion, and Squire
(1996). Using cross-country data for 20 countries, they regressed the rate of change in the
proportion of the population living on less than $1 per person per day on the rate of
change in real per capita income and the change in inequality measured by the Gini
coefficient. They found that a 10% increase in the real per capita income can be expected

15
to lead to 22.8% decrease in the proportion of population in poverty; and a 10% increase
in the Gini coefficient is expected to raise poverty rate by 38.6%.
The above results are based on the formulation presented in Ravallion and Huppi (1991)
and Datt and Ravallion (1992)) in the following implicit functional expression:
),/( ttt DzPP µ= , where Pt is the poverty rate in a country at time t, z is the poverty line, µt is per capita income, and Dt is the measure of inequality in the per capita income distribution. The change in poverty rate between two periods under observation can be decomposed in the following manner:
tt
tt
t
tt D
DPP
P ∆∂∂
+∆∂∂
=∆ µµ
+ residual.
Alternatively, t
t
t
t
t
t
t
t
t
t
t
t
t
t
DD
PD
DP
PP
PP ∆
∂∂
+∆
∂∂
=∆
µµµ
µ+ residual.
That is, t
tD
t
t
t
t
DD
eePP ∆
+∆
=∆
µµ
µ + residual,
where eµ and eD are respectively the elasticity of poverty rate with respect to per capita income and degree of inequality. We can apply this decomposition method to the changes in poverty, per capita income
and Gini index of Bangladesh over a decade from 1991/92 to 2000/01. In the absence of
consistent time series data on the poverty headcount index, the elasticities of poverty
headcount ratio with respect to real per capita income and inequality cannot be estimated.
Extrapolating the Bruno-Ravallion-Squire estimates of these elasticities to Bangladesh,
we can obtain the growth and redistribution components of poverty change.
As shown in Table 1, over the decade under observation, per capita GDP increased by
about 74% which is expected to warrant 168% decline in the poverty headcount ratio.
This possibility of eradication of poverty was counteracted by simultaneous growth in
inequality by 18% which is expected to cause the poverty index to increase by 70%. The
growth effect (controlled for inequality) thus appears to be more than twice larger than
the redistribution effect (controlled for economic growth). The combined effect predicts
the decline of the proportion of population in poverty from 0.588 in 1991/92 to 0.014 by
2000/01, an almost complete alleviation of poverty. However, the reality is much
starker—still half of the total population was enumerated below the poverty line. The
residual headcount ratio of 0.484 begs explanation beyond the growth performance or
income distributional consequences of the economy. The question therefore remains:

16
What caused the reversal of the growth impact on the poverty situation in Bangladesh
over the 1990s?
Table 1: Decomposition of change in poverty rate by growth and redistribution
components in Bangladesh, 1991/92-2000/01
Headcount ratio
Per capita GDP in 1995/96
prices Gini index of
inequality 1991/92 0.588 9575 0.259 2000/01 0.498 16613 0.306 Actual change (%) -15.31 73.50 18.15 Elasticity -2.28 3.86 Predicted change (%) -167.59 70.05 Decomposition of poverty change
Growth component
Redistribution component
Predicted change -0.574 -0.985 0.412 Predicted value in 2000/01 0.014 Residual 0.484
Sources: 1. For poverty, per capita GDP and inequality measures, BBS, Household Income and Expenditure Survey 2000, Dhaka 2003. 2. For the elasticity estimates representing percentage changes in headcount ratio in response to given percentage changes in per capita GDP and Gini coefficient, Bruno, Ravallion and Squire (1995). Divergence between economic growth and poverty reduction performance The decline in the percentage of population below poverty line by one point a year during
1990s masks the grim reality that the absolute number of people in poverty increased by
3.9 million over the decade (Table 2). Two-thirds of this increase in the size of the poor
population occurred in the rural areas where about 80% of the total population of the
country resides. In Sen (1998), this phenomenon was initially referred to as the growing
mis-match between what one may call “micro-success” and “macro-failure” of poverty
alleviation. The paradoxical increase in the number of poor people despite lowering of the
total fertility rate and faster growth performance suggests that the links between growth
and poverty are perhaps missing in some places a phenomenon which merits to
investigation.
As a matter of fact, Bangladesh experienced a slowdown of the rate of poverty reduction
in the second half of the 1990s compared to the first half although the rate of economic
growth was higher during the second half. While the poverty rate fell by 1.43 percentage

17
points during 1991/92-1995/96, the fall was merely 0.83 percentage points over 1995/96-
2000. Several factors, economic as well as non-economic, can be identified in explaining
the divergence of the observed pace of poverty reduction from that predicted by the
accelerated growth performance of the economy. Those are discussed as follows.
Table 2: Size of population below the poverty line in Bangladesh, 1991/92-2000/01
National
Total
population Population in
poverty Headcount ratio
(%) 1991/92 106,315,000 62,513,220 58.8 2000/01 133,413,000 66,439,674 49.8 Change 27,098,000 3,926,454 -9.0 Rural
Total
population Population in
poverty Headcount ratio
(%) 1991/92 85,052,000 52,051,824 61.2 2000/01 102,204,000 54,168,120 53.0 Change 17,152,000 2,116,296 -8.2 Urban
Total
population Population in
poverty Headcount ratio
(%) 1991/92 21,263,000 9,547,087 44.9 2000/01 31,209,000 11,422,494 36.6 Change 9,946,000 1,875,407 -8.3
Source: For total population by residence, Population Census, 1991 and 2000. Human poverty In contrast to the sluggish performance in reduction in income poverty, Bangladesh
succeeded in cutting the extent of human poverty index from 61.3 to 34.8 in 20 years
beginning from 1981 (Figure 1). This index is based on three broad sets of indicators of
human capability: deprivation in education, health and nutrition (including food security).

18
Figure 1: Human Poverty Index (HPI) in Bangladesh
61.3
47.2
41.6
34.8
0
10
20
30
40
50
60
70
1981
/1983
1993
/1994
1995
/1997
1998
/2000
Year
HPI
Education Bangladesh made remarkable progress in expanding primary education in the 1990s in
terms of increase in gross enrollment in primary schools from 59% in 1982 to 96% in
1999 (MOF, 2003). This achievement seems brought forth by the Food-for-education
(FFE) program of the government introduced for the poor in 1993. In a BIDS survey, it
was found that FFE schools have a considerable higher proportion of children from land-
poor households, such as, agricultural laborers, low-income artisans, distressed widows,
etc., than non-FFE schools, compare 74% with 58% (Sen, 1998). However, high dropout
rates from education system as well as high repeater rates signal that the provision of food
to poor parents to send their children to schools has failed to deliver appropriate
incentives to continue education.
The BIDS study identified three fundamental impediments to the effectiveness of the FFE
program in addressing the needs of the poor. First, the limited capacity of existing schools
in the wake of surge in demand for primary education has led to overcrowding of classes
in the FFE schools and consequent degeneration of the quality of education. The average
number of students in grade 1 was found 113 in FFE schools in contrast to 89 in non-FFE

19
schools, whereas the optimal class size is 50 or less. Second, the FFE program suffers
from the standard adverse selection problem arising from inclusion of many children from
non-poor households hiding their eligibility status. Third, drawing as much as one-third of
the development budget for the education sector, FFE schools covers merely 13 to 15% of
students enrolled in the mainstream schools, which suggests inefficient use public
resources presumably due to high transactions cost and leakage.
The policy of universal education for girls has contributed to closing the gender gap in
primary and secondary education, although higher secondary and tertiary levels of
education are still suffering from this inequality of access. At the same time, returns to
education increased leaving less educated poor people less able to reap the benefits of
economic expansion.
Health Infant mortality was cut substantially from 94 per thousand live births in 1990 to 66 by
2000, falling at the rate of 3% annually. The incidence of infant mortality is about 70%
higher for the poorest population than for the richest group (Demographic and Health
Survey). Hence, the drop in infant mortality mostly benefited the poor group. Similarly,
the drop in maternal mortality rate per thousand live births from 480 to 320 during the
1990s had positive implication for the poorest (Bangladesh Maternal Mortality Survey).
The impressive progress in preventing infant and maternal mortality is, however,
overshadowed by the poor state of public health care facilities. According to an estimate
from the BIDS survey, in the rural areas, only 12% of the illnesses are treated in public
health care centers. While the bottom 20% of the rural population spends about 7-10% of
their income on meeting private medical expenses, the benefits received through the
public health system is about only 1-3% of their income (Sen, 1998). The shortage of
curative health care facilities is further aggravated by poor quality of services that poses a
serious threat to the goal of elimination of health deprivation.
Nutrition The 1999-2000 Demographic and Health Survey reports that 47% children in rural areas
and 35% children in urban areas are stunted; 49% children in rural areas and 40% in
urban areas are underweight. This statistics register remarkable improvement over the

20
national average of 68.7% stunted and 72% underweight children observed in 1990. The
proportion of malnourished mother improved slightly from 52% in 1996/1997 to 45% in
1999/2000, although the rural-urban gap in this respect has increased from 50 to 63%
during the same period.
Goals of poverty reduction Depending on the historical rate of progress along these three dimensions over 1990-
2000, the government has adopted an accelerated poverty reduction and social
development strategy nested within the national strategy of economic growth against the
benchmark level of 1990. With the planned level of thrust on poverty reduction, it is
projected that by 2015, there will be substantial gain in terms of a number of socio-
economic indicators (Figure 2). As for example,
i. income poverty would go down from one half to about one third of the total
population;
ii. adult literacy would be as high as 88%;
iii. primary and secondary school enrollment would hit 100%;
iv. the infant mortality rate would go down to 24 per thousand live births;
v. the maternal mortality rate would be as low as 80 per thousand live births;
vi. life expectancy at birth would reach 69 years; and
vii. underweight children would be nearly a quarter of the total child population.

21
Figure 2: Major goal posts in poverty and social targets against the 1990 benchmark
Income poverty (%)
5950
37
010203040506070
1990 2000 2015
Adult literacy (%)
35
56
88
0
20
40
60
80
100
1990 2000 2015
Primary enrollment (%)
5675
100
020406080
100120
1990 2000 2015
Secondary enrollment (%)
28
65
100
020406080
100120
1990 2000 2015
Infant mortality rate
(per thousand live births)
94
66
24
020406080
100
1990 2000 2015
Maternal mortality rate (per thousand live births)
480
320
80
0100200300400500600
1990 2000 2015
Life expectancy (years)
56 6169
0
20
40
60
80
1990 2000 2015
Children underweight (%)
67
51
27
0
20
40
60
80
1990 2000 2015
Source: A National Strategy for Economic Growth, Poverty Reduction and Social Development, March, 2003.

22
Public resource allocation to poverty alleviation
Analysis of trends in public expenditure for poverty alleviation is difficult since
government budget is not earmarked for poverty alleviation programs as such. Sen (1998)
estimated the share of public resources allocated to alleviating poverty for the period of
1983/84-1994/95 as provided in Table 6. He classified the following three groups of
projects under the Annual Development Plan (ADP) as far as the objective of poverty
alleviation is concerned along with broader goals of the development budget:
(i) Growth projects related to production sectors, such as, agriculture and rural
industry; and physical infrastructure, such as, rural road, rural electrification, irrigation and embankment;
(ii) Human and social development projects related to education, health, family planning, water supply and sanitation, housing, youth and women affairs; and
(iii) Safety net projects, such as relief and Vulnerable Group Development (VGD) programs.
Table 3: Allocation of Development Budget for “Poverty Alleviation” Projects and
Programs in Rural Areas, 1983/84-1994/95 Sectors
1983/84 1988/89 1992/93 1994/95
A. Growth Production Infrastructures
- Rural roads - Rural electricity
63.8 10.5 50.0
4.2 4.1
61.2 13.8 49.8
5.9 7.9
55.0 11.0 45.8 11.3
9.3
48.2 49.2 37.7 14.3 10.4
B. Human & Social Development Primary & secondary education Health Others
36.2 10.8
7.0 18.4
33.0 11.5
4.7 16.8
40.1 20.3
7.0 12.8
48.1 27.4
6.8 13.9
C. Safety net 5.8 4.9 3.7 D. Total allocation for poverty alleviation (A+B+C), million Taka
9, 266 16, 741 32, 725 49, 702
E. Total ADP budget, million Taka 30, 683 38, 299 67, 904 99, 786 F. D as % of E 30.2 43.7 48.2 49.8 Source: Reproduced from Sen (1998), p.166. As shown in Table 3, the total allocation to poverty alleviation projects in the ADP went
up by 20 percentage points since the early 1980s till the mid 1990s to channel 50% of
development expenditure of government for this purpose. Within this allocation, human
and social development projects gained increasing weight, while proportional allocation
to growth and safety net programs were curtailed. Further disaggregation shows that
primary and secondary education received increasing priority among human and social
development projects in terms of public spending. Human capability development turned

23
to the top of the agenda for poverty alleviation strategies. Based on a social accounting
matrix, it is indeed inferred that poverty alleviation effects are largest for the education
sector, followed closely by the health sector (MOF, 2003).
Social sector allocation
During the first four years of the 1990s, the percentage allocation to social sectors went
up in both the revenue and the development budgets of the government. The social
sectors include education, religion, health and family planning, social welfare and women
affairs, youth development, sports and cultural affairs, and labor and manpower. Since
1995/1995, the allocation to social sectors in the revenue budget slightly went down,
while that in the development budget went up by 10 percentage points up to 26% of ADP
expenditure by 2002/2003 (Figure 3). These opposite trends in two parts of the
government budget resulted in a steady state of the share of social sector allocation in
total annual government expenditure (24%) as well as GDP (3.5%) by the turn of the
millennium.
Figure 3: Allocation to social sectors as percentage of government expenditure
15
17
19
21
23
25
27
29
1991
/1992
1992
/1993
1993
/1994
1994
/1995
1995
/1996
1996
/1997
1997
/1998
1998
/1999
1999
/2000
2000
/2001
2001
/2002
2002
/2003
Year
Perc
ent
Social sector allocation as % of revenueexpenditureSocial sector allocation as % of ADP expenditure
Social sector allocation as % of governmentexpenditure
Source: MOF (2003).

24
Figure 4: Allocation to social sectors as percentage GDP
2.5
2.7
2.9
3.1
3.3
3.5
3.7
1991/1992 1992/1993 1993/1994 1994/1995 1995/1996 1996/1997 1997/1998 1998/1999 1999/2000 2000/2001 2001/2002 2002/2003
Year
Soci
al se
ctor
allo
catio
n as
% o
f GD
P
Safety net programs The major safety net programs financed from the revenue budget include Food for Work
(FFW), Gratuitious Relief (GR), Test Relief (TR), Vulnerable Group Development
(VGD), and Vulnerable Group Feeding (VGF). It is observed that the allocation to these
programs as percentage of total revenue expenditure as well as percentage of GDP
declined since the late 1990s (Figures 5 and 6).

25
Figure 5: Allocation to safety net programs as percent of revenue expenditure
0
2
4
6
8
10
12
1991
/1992
1992
/1993
1993
/1994
1994
/1995
1995
/1996
1996
/1997
1997
/1998
1998
/1999
1999
/2000
2000
/2001
2001
/2002
2002
/2003
2003
/2004
Year
Safe
ty n
et a
lloca
tion
as %
of r
even
ue b
udge
t
Figure 6: Allocation to safety net programs as percent of GDP
0
0.1
0.2
0.3
0.4
0.5
0.6
0.7
0.8
0.9
1991
/1992
1992
/1993
1993
/1994
1994
/1995
1995
/1996
1996
/1997
1997
/1998
1998
/1999
1999
/2000
2000
/2001
2001
/2002
2002
/2003
2003
/2004
Year
Safe
ty n
et a
lloca
tion
as %
of G
DP
The gradual reallocation of government spending from revenue to development budget
suggests incremental shifting in emphasis away from the maintenance of regular heads of
accounts necessary to prioritize allocation for poverty alleviation programs. As a
consequence, the pace of poverty reduction remained slow despite the pro-poor shifting
of budgetary allocation. The fact that the easing of resource constraint did not warrant the
intended impact on the lot of the poor indicates that the problem was with implementation
and governance of development projects. Using a sample of 239 poverty alleviation
related projects which were approved as of December 1994, Sen (1998) observed the

26
financial progress in project implementation by 1995/96 to find that 52% of projects
attained less than 50% progress, while the performance of only 35% projects could be
rated in the range of 76-100%. The rate of financial progress, however, tells part of the
story as it does not reflect the quality of disbursements.
Special programs for poverty alleviation
Apart from the core programs designed to alleviate poverty, the government has some
special programs targeted to the poor. These programs provide incentive to a wide range
of economic and social activities, such as, tree plantation, aquaculture, goat rearing,
primary and female education, information and communication technology, library
development, children’s rights, vocational and technical education, housing for distressed
people, allowance for elderly poor people, employment generation for the unemployed
youth, widow and destitute women allowance program, special micro-credit programs for
the acid-burnt women and the physically disabled, self-employment credit program for
the poor unemployed women, micro-credit for farmers, micro enterprise development for
tribal people.
The micro-credit programs are operated by nearly 700 NGOs, Bangladesh Rural
Development Board, nationalized banks, other commercial banks, and concerned
administrative ministries and divisions of the government throughout the country
covering 1.8 million men and 10.9 million women as of June 2002 (MOF, 2003). Of the
total disbursement, 41.79% was invested in small business, 17.64% in livestock, 12.31%
in agriculture, and 7.39% in fisheries. The rate of loan recovery at over 95% across the
micro finance institutions has attracted a great deal of global attention followed by
widespread replication of the microcredit model of Bangladesh in more than 50 countries
of the world.
However, the recent time series on microcredit shows that the total amount of
disbursements both by the NGOs and government organizations (GOs) declined in 2000
mostly because of drop in loan disbursement by the GOs (Figure 8). As a result, the
NGOs overtook the GOs in bearing the major share of responsibility of operation of the
program. Apparently, these microfinance institutions have contributed significantly to the
micro success of poverty alleviation drive in the country.

27
Figure 7: Annual microcredit disbursement by GOs and NGOs during 1998-2003.
0
1000
2000
3000
4000
5000
6000
1998 1999 2000 2001 2002
Year
Ann
ual d
isbu
rsem
ent o
f mic
rocr
edit
(in c
rore
Tak
a)
Annual disbursement
NGOs
GOs
28
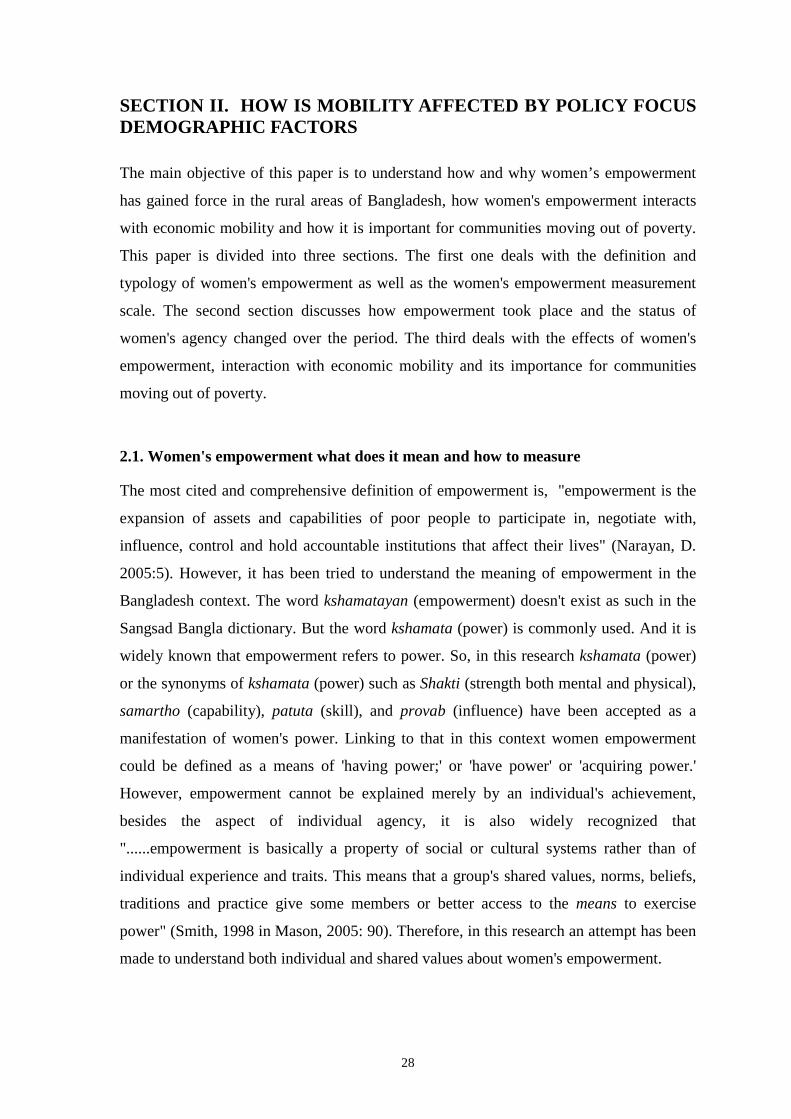
SECTION II. HOW IS MOBILITY AFFECTED BY POLICY FOCUS DEMOGRAPHIC FACTORS The main objective of this paper is to understand how and why women’s empowerment
has gained force in the rural areas of Bangladesh, how women's empowerment interacts
with economic mobility and how it is important for communities moving out of poverty.
This paper is divided into three sections. The first one deals with the definition and
typology of women's empowerment as well as the women's empowerment measurement
scale. The second section discusses how empowerment took place and the status of
women's agency changed over the period. The third deals with the effects of women's
empowerment, interaction with economic mobility and its importance for communities
moving out of poverty.
2.1. Women's empowerment what does it mean and how to measure
The most cited and comprehensive definition of empowerment is, "empowerment is the
expansion of assets and capabilities of poor people to participate in, negotiate with,
influence, control and hold accountable institutions that affect their lives" (Narayan, D.
2005:5). However, it has been tried to understand the meaning of empowerment in the
Bangladesh context. The word kshamatayan (empowerment) doesn't exist as such in the
Sangsad Bangla dictionary. But the word kshamata (power) is commonly used. And it is
widely known that empowerment refers to power. So, in this research kshamata (power)
or the synonyms of kshamata (power) such as Shakti (strength both mental and physical),
samartho (capability), patuta (skill), and provab (influence) have been accepted as a
manifestation of women's power. Linking to that in this context women empowerment
could be defined as a means of 'having power;' or 'have power' or 'acquiring power.'
However, empowerment cannot be explained merely by an individual's achievement,
besides the aspect of individual agency, it is also widely recognized that
"......empowerment is basically a property of social or cultural systems rather than of
individual experience and traits. This means that a group's shared values, norms, beliefs,
traditions and practice give some members or better access to the means to exercise
power" (Smith, 1998 in Mason, 2005: 90). Therefore, in this research an attempt has been
made to understand both individual and shared values about women's empowerment.

29
Measuring empowerment is as critical as defining it. "There are four choices regarding
the measurement of empowerment, none of which is wholly satisfactory" (Mason in
Narayan, 2005: 95). In this study two approaches have been followed for measuring
women's empowerment. One is the observational approach and the other is sample survey
on different aspects of women's empowerment. Qualitative investigation was carried out
to explore both women's and men's perceptions about power, women's empowerment,
classification of women's empowerment, changes in women's empowerment over the last
ten years, the relationship between economic mobility and women’s empowerment, and
the factors that determine women's empowerment.
Subsequently to measure women's empowerment through quantitative data, an index is
formulated comprising both material and immaterial aspects of women's livelihoods and
considering these factors as a manifestation of women's empowerment. The index has
been developed following Hashemi, Schuler, and Rilley's measurement scale based on
panel (2001) data and later it has been compared with current data (2005) to measure the
changes. This widely accepted scale was developed through the studies of recipients of
micro-credit in Bangladesh. The study "developed a series of questions encompassing a
variety of aspects of women's roles, relative power and degree of autonomy within the
family and community. The responses were consolidated into eight indicators, each
including a variety of specific actions or items (Schuler, 1998: 566)."
Following this measurement scale women's responses in both panel (2001) and present
(2005) studies were consolidated into eight indicators. The eight indicators are: 1)
freedom of mobility, 2) the ability to make small purchases, 3) involvement in major
household decisions, 4) involvement in minor household decisions, 5) relative freedom
from domination within the family, 6) political and legal awareness, 7) participation in
public protest and political campaigns and 8) economic security. It could be noted here
that, one indicator, e. g. the ability to make large purchases has been deleted from
Hashemi & Schuler index and on the contrary, one indicator, e. g. involvement in minor
household decisions has been added, according to the availability of data/response of the
PPA (2001) study. The variables are as follows1
1 a detail process of scoring have attached in the annex
:

30
-Physical Mobility: Each respondent was given one point for each place she had
visited and an additional point if she had ever gone there alone. Such movements
included travels outside the home, and visits to the Thana sadar, markets health/medical
centres, theatre/movies, houses of relatives or friends.
- The ability to make small purchases: Each respondent was given one point for
purchasing small items for oneself.
- Involvement in major household decisions: One point was given for making a
decision (individually or jointly with the husband) on whether women should work for
earning outside the household or not, borrowed credit, become members of NGOs or
samitis (cooperatives) and bear children.
- Involvement in minor household decisions: One point was given for making a
decision (individually or jointly) on spending on food, spending on clothes, spending on
children's education, purchasing furniture.
-Relative freedom from domination within the family: Respondents were asked the
reasons for not working. If the husband or other relatives prevented a woman from
earning activities then she was given '0'. In reply to the question whether the husband
allowed a woman to work, they said that she was allowed to do any type of work, or only
a high salaried work, she got one point. When asked if the husband threatened to divorce
a woman during the last year and she said 'never' then she was given one point; if she said
'never' in reply to the question whether the husband had threatened to go for the second
marriage she was given one point.
- Political and Legal Awareness: One point was given for having marriage
documents registered.
- Participation in Public Protest and Political Campaign: One point was given for
voting according to one's own decision. If a woman said, 'yes' in reply to the question if
she thought a woman could be the chairperson or a member of the Union Parishad, she
was given one point. A woman was given two points for thinking herself as competent to
contest for a UP chairperson or member.
-Economic security: Two points were given for the ownership of land, one point
was given for the involvement in any income-earning activities and two points were given
for sharing the household expenditure cost from a woman's earning.

31
Data and Methods: The study used a mix of both qualitative and quantitative research
methods. A survey was conducted on 862 households. A total of 761 (88% of total
households) spouses under the age 60 from those households were interviewed with a
separate questionnaire on women’s status. Among the 759 women respondents, 465
(61%) were from panel households and 294 (38%) were from non- panel households. For
the qualitative investigation two Focus Group Discussions (one with men and another
with women) on women's empowerment were carried out in 16 communities. Besides,
relevant information of individual life stories, a Ladder of Life exercise, FGDs on
livelihoods, freedom, power and democracy, and mini case studies were also used to
strengthen the argument.
It is worth noting here that while comparing panel (PPA, 2001) and present data (MOP,
2005) the index-scoring rules has remained unchanged. Moreover, any kind of change in
the questionnaire has been recorded carefully to avoid duplication and error.
Community level measurement: For the community level analysis the individual score
for each household at the village level has been aggregated. The villages with scoring
above the median value have been classified as high empowered and those below the
median value have been considered low empowered.
Household level measurement: At the household level, points were given for each
variable/responses across indicators such as economic/income earning activities of
women; their access to credit; their physical mobility etc. to each respondent. The score
was calculated accordingly. Based on these scores of households, both panel and new
sample, communities were then categorized into those exhibiting high, medium, and low
women’s agency. The scoring ranges are 1-10 for low, 11-15 for medium and >15 for
high women empowerment.
2.1.1 Community's understanding of women's empowerment
Through the Focus Group Discussion we tried to know the local definition of
empowerment both from the men and women groups. Both the study men and women have associated women's empowerment with knowledge,
intelligence, education, paid jobs, purchasing power, the capacity to go about at one's own
free will, access to information, equality etc.

32
"The woman who has education, can earn and manage her family in an efficient manner
is empowered ( Murshida, Drokhojiokhani)." They have also associated empowerment
with a woman's ability to take good decisions for herself and for others as well as the
ability to advise and interact with community people nicely.
However, men and women define empowerment in slightly different ways. The male
participants give emphasis on the income-earning capacity, freedom of movement and
skills to run the family. They say that women's empowerment means the freedom of
women. Explaining this they add that now women can work both inside and outside of
their houses. They are earning money by doing jobs and small business, rearing cow and
poultry, tailoring, and crushing stones which help them to maintain their families well.
Husbands and wives work together in the agricultural field; women often go outside to
work if needed. For instance, Amzad Hossain of village Ronochandi says, "While the
husband is at work the wife takes care of the cattle. She does everything margining from
grazing to vaccination of the cattle. As a result, the cattle give more milk and their income
increase. All this happens because women are now allowed to go outside and this is called
women's empowerment." The men of Chitain village say, "A daughter is working more
than a son in many families. This is power. Those who are literate have more power.
They are involved in teaching, agricultural work and samitis (group). They are working in
the family planning program. The women who have jobs and education, can move around
bravely and this is their empowerment."
To define women's empowerment the male participants also focus on women's ability to
work for savings and decision-making. They say, when women involve themselves in
some income generating activities, they can accumulate some cash money in their hands.
They do not have to dependent on others. They can also enforce their decisions on family
matters. Their suggestions are honored. In most cases, male respondents have reported
that women's empowerment has thus been established in society. However, most men
relates women's empowerment to involvement in income earning activities. They also
mention the importance of women's skills and merit to attain empowerment. For example,
Jalal Uddin of Charbelabo village says, "Women’s power means their ability to do
something tactfully by applying their merit and skills. If a woman can attain this quality
she can run her family and involve herself in income generating activities." According to

33
men, if women want to be empowered they should have education, money, income and
people should listen to them.
According to the men of Uttar Guthuma village, to be empowered, women should have
education and culture; they should behave well, speak well and tactfully; explain a
situation convincingly and clearly; have qualities to control people; have good moral
character; be intelligent; and show respect to elders.
While defining women's empowerment women participants give importance to equity,
power, ability and the intelligence of women. A schoolteacher, Shahida Parvin of
Bisharikathi village says, "the empowerment of women means equality in every aspect of
life between male and female. Women's empowerment has nothing to do with wealth. A
woman who can work independently is an empowered woman”. Rupjan, a woman of
Chitain village, adds, "Women listen to men, but men have to listen to women. This is
women's empowerment."
According to Fatema (aged, 36, tailor) " Women's empowerment means that women can
work like men. Their husbands and mothers-in-law listen to them. An income-earning
woman's husband and other men cannot verbally abuse her." The women FGD of Char
Kumuria village suggests that, women's empowerment means the opportunity to
implement women's rights. For them, women's rights mean that one can give opinion in
the family, get respect from her husband. Women become empowered if they are aware,
if their rights are being respected, if they can freely work within the family. In addition,
women's empowerment means they are free to choose the way they want to work, and
there will be no adverse repercussion on society due to their working. A woman is
considered to have power only if she is educated and her opinion is used for the benefit of
society. Her power means she can go out when needed, and can give decisions.
According to women, intelligence is also an attribute of women's empowerment.
Intelligence means the aptitude for saving and calculating money, smartness, the ability to
talk in front of others, the ability to go to the district town for banking or attending courts.
In relation to economic mobility and empowerment, they further say that "because of
intelligence someone goes up and someone falls down" (Rahima Khatun, Chitain ). A
female participant says, "Women’s power means to be able to act and go by a woman’s

34
own will" (Rina Begum,Charbelabo). Taslima Akter (Charbelabo) says, "If women have
the freedom to give their decisions in the family, that is their power."
Selina Begum says, "If women can understand their likes and dislikes if they can express
their opinions and decisions, if they can spend their money at their will, if they can go to
any place, without the permission of their husbands – then own woman will have power".
Defining the empowerment of women Khodeja Khatun (Chitain) says, "Women show
their power in maintaining their families. Working hard to maintain families, bearing
children, saving money, rearing poultry and livestock, taking care of children's education
– all these are done by women. The capability of doing all these is called women's
empowerment". Some also state that the ability to earn money and maintain household
properly means power. "I have a great deal of power. My husband has left me. I maintain
my family. My mother lives with me. I have four children. It is I who manage to find food
for all. I rear poultry, and work in other's houses. It is I who earn money. This is my
empowerment".- this is what Bilqis of Uttar Guthama says.
Like men women have also associated women's empowerment with the power to speak.
For instance, they say, “Those who are smart and have the ability to converse with all in
an articulated manner are powerful” (Hosne Ara, Daxin-berabaria). “The power of a
woman implies her ability to talk with different people in a manner commensurate with
her position." (Rasheda Akhter, Daxin-berabaria).
There are some differences of opinion in this matter also. Some participants in
different communities have given different views on women's empowerment. For
instance, the male participants of Gilarchala say, "Women's empowerment mostly
depends on the husband's power". Anis Mia (aged, 32 farmer, Modhopur) says,
"Women's power, what is that! Whatever we say to our mothers, wives and sisters
they do the same. If we give them taka 500 they keep it safely and can give it back
timely. Women's power means to look after the house, to fulfill the responsibilities,
to give in services to relatives. "A women respondent Rasheda says, "Narir abar
khomota?(women have empowerment?) A woman does not gain power even inside
the home or even from her husband. If my father would have enough property then
my husband would also give me rights" (Gilarchala). A small number of women

35
participants say, those women are most empowered whose husbands have wealth, big
business, land and property, big houses and power.
Disagreements on women's empowerment exist even in the same community. For
example, “Actually, women do not have any power. They only spend money, eat and
sleep. Men and women are not homan [equal]. It is dangerous if they are given equal
rights. They will supersede their husbands. They would not be at home any more.
They would say, ‘why should I listen to you. I have the equal power”- Oli Mia,
Chitain.
Following this comment of Oli Mia an exciting situation arose among the informants.
Abdul Sobhan said, “It is totally wrong that the women only eat and sleep. This man
[Oli Mia] used to work as a day labourer in others' land. But now he does not do that.
He used to live in a thatched house. But now how can he earn taka 200/300 every
week? His wife makes bamboo cages. She is working. Then whose power is this?" In
this regard Abdul Awal (Chtain) says, "There is a proverb that by virtue of a wife’s
good quality one can live in the mountains. All sides of a man are good if his wife is
good and talented."
2.1.2. What are the most common ways of women empowerment?
In Bangladesh women constitute almost half of the total population (49.5 percent) but
traditionally, they have been denied access to each and every empowering sphere of life.
Instead, since time immemorial, it has rather become customary, if not mandatory, that
women have to sacrifice their claim to everything whenever the occasion calls for it. But
recently this frustrating situation has improved. Women are now playing a more confident
role in every sphere of life. For this positive change the credit partially goes to the gender
policy of the Bangladesh government and its enforcement on however humble a scale.
Gender policies are targeted towards the development of the weaker gender, that is,
women thorough various provisions, sometimes privileges so that they can attain equality.
To move towards gender equity in the country, specific gender policies have been
undertaken during the last 10 years under the Fifth Five-Year plan and the PRSP (Poverty
Reduction Strategy Paper). The Fifth Five-Year Plan (1997-2002) mainly had its focus on
gender policy advocacy, which was executed in a poor manner in Bangladesh. Only the
social sectors contained budgetary expenditures aimed at women. Moreover, women-
specific projects were mainly donor funded and not a part of the core portfolio of the
relevant ministries. Government sponsored women centered projects tended to be of

36
traditional nature, giving limited skills training and promoting income generating
activities which gave a poor financial return. In the health field, there was an over-
emphasis on population and related programs. However, there were some initiatives
supported by UNDP, to support institution and capacity building in some areas. It seemed
that credit and health related interventions were the most common activities. Furthermore,
many NGOs include large numbers of women among their beneficiaries and they have
undoubtedly pioneered innovations in some areas. However, the results have been
partially successful and partially abortive. There is a considerable debate on women's
empowerment policies taken by government and NGOs. A detail review on gender
policies of the last ten years have been attached in the Annex 2. However, it is important
to note here that for this study, besides macro level policy review, emphasis has been
given on community people's perceptions about factors that bring women's
empowerment.
To know the empowerment status and the determinants of women's empowerment, data
was collected in retrospect for the period of 2001-2005, and in contrast to that 10-year
reference period (1995-2005) information was collected for other determinants i.e. social
stratification, social capital, economic growth, governance, voice and participation,
physical infrastructure, social infrastructure, access to information, economic status etc.
for the analysis.
Controlling for household level indicators that characterize initial household capacity of
natural, financial, human and social capital, household income, and transition status in
relation to poverty threshold, we verify whether the relationship between initial
community level indicators and women empowerment holds as observed in the bivariate
analysis.
The estimates of the coefficients reported in Table 2.8 indicate that communities,
beginning from a highly stratified state of socio-economic status and well-being, ended
up with low level of women empowerment. The equality of socio-economic opportunities
thus proves to be a precondition for the progress of women at par with men. Access to
information resources, such as, library, newspaper, radio, is found to significantly
contribute to women empowerment.

37
Higher initial household annual income level predicts greater women empowerment.
Women are more privileged in households with heads having above secondary education,
while education of spouse who is usually female at the primary level plays a significant
role in their empowerment. While larger landholding does not help women, access of
household to electricity and greater availability of informal credit work in their favor in
offering them greater freedom and control over household decision-making and use of
resources.
We can conclude from the above findings that social equality, access to information
resources, and household specific growth factors, such as household financial, physical
and human resources, tend to place women in a stronger socio-economic status over time.

38
Table 2.1: The determinants of women empowerment Dependent variable: Women empowerment index Coefficient Standard error Initial levels of community indicators:
a. Social stratification b. Social capital c. Governance d. Democracy e. Physical infrastructure f. Social infrastructure g. Communication h. Access to information i. Access to market
-3.12***
0.25 -0.29 -0.40 -0.05 -2.33 0.70
2.77*** 1.63
1.21 2.57 0.96 1.17 0.83 1.55 2.42 0.78 0.97
Initial household level indicators:
a. Annual household income (‘000 Taka) b. Number of working members c. Education of head Primary Secondary Above secondary d. Education of spouse
Primary Secondary
e. Total land (10 decimals) f. Access to electricity g. Amount of formal credit h. Amount of informal credit i. Access to formal credit j. Mover
0.01*
-0.23
-0.86 0.03
6.59***
1.37** 0.10
-0.04* -1.77**
0.03 0.06**
0.86 0.30
0.01 0.29
0.63 0.81 1.85
0.69 1.11 0.02 0.70 0.10 0.03 0.96 0.56
Initial primary occupation: a. Trade b. Service c. Agricultural/Non-agricultural labor
-0.67 -1.19 0.68
0.71 1.21 0.65
Constant term 13.93*** 1.44 Number of observations F (26, 279) Prob>F R-squared
305 6.99
0.0000 0.2535
Notes: 1. The sample includes households that moved out of poverty or persisted in poverty in the last ten- year period. 2. ***, **, and * stand for 1%, 5%, and 10% level of significance. 3. The standard errors are adjusted for heteroscedastic error structure arising from cross-sectional heterogeneity of households. 4. The base categories include low level of community indicators, no education of head or spouse, no access to electricity or formal credit, constant poverty status in the two periods under observation, and primary occupation in agriculture or manufacturing or others.

39
"The confidence to do something is power. Women who can go to Barisal ( a district
town), can do everything by themselves, can bring something, can make everyone
understand things, can resolve disputes — this is women's power.” As community
people define what they mean women's empowerment at the same time they also find out
the factors that enhance women's empowerment.
In the FGD on women's empowerment both men and women have identified the link
between macro governmental policies with women empowerment. The important policy
linkages that the FGD groups have identified are as follows:
1. Laws have been reformed in favor of women. Now women can sue their husband if
required. For example, Selina Begum says, "At present if any husband tortures his wife,
she can protest against it. So, men cannot torture to their wives." In this regard it is
relevant to note Lailey Begum's example. The informant, Lailey Begum relates her
experience, "We were foolish in the past. My husband showed me a chain at the bridal
night to threaten me and said, 'If you don't obey me any time, I will just leave you.' I has
to be silent for his threat. If he rebuked me in a loud voice, I just shipped into the house.
In the past the males used to orally divorce their wives. But now we have come to know
about the rules of divorce. To divorce a wife one has to go the court. We have come to
know about divorce from BRAC (a national NGO) and have attended a class on this
subject for one month. Now the females are more intelligent than before (Ariroshi)." In a
similar vein, Ayshea Begum a woman of Chitain village says, ''The government has
introduced a system which has made it easier for women to get justice. Before, there was
no system such and women had not that much courage to face the court. Now women can
demand justice."
2. The education policy favors women now as education for girls is free and they get
scholarships too. On the discussion on women's empowerment the local people have said,
"Their [women's] interest in education is increasing because girl students now get
stipends from the government. The women who are educated and intelligent are
nowadays working in different offices and NGOs (Men FGD, Uttar Guthuma).
''Regarding this the women of Chitain village say, "Now girls are getting educational
expenses from the school. They are passing even twelve classes. At present the girls can
study more to get jobs and they have a scope for getting suitable husbands. Education

40
helps a girl to learn good manners. More girls are going to school now than before".
Amena Khatun of Dorokhojikhani says, "There was no highly educated (more than SSC)
woman in the village 10 years ago. Those who were educated were not living in the
village. At present, a good number girls are going to school. Some girls go to college after
the completion of their school. Among them some girls have become school teachers.
Again, some are engaged in tuition. As a result, they get 2000-3000 taka per month that
enhances their power in the family."
In this connection Moslem Uddin says, “Now, in educational institutes the females
constitute 60 per cent while the male 40 per cent. Such was not the picture 10 years ago.
Farid Mia of the same community added "Women's education has increased and so have
their ability and skills. Now they are equal to their male counterparts. The government
has also given equal power to both males and females (Charbelabo)."
3. The health policy has also made positive changes towards women—family planning
and sanitation have improved women’s lives.
4. Women functioning as prime ministers, their involvement in politics and in the local
government has created a tremendous demonstration effect for rural women and their
empowerment. For instance, “We have gained courage by having a woman as our Prime
Minster says, ''Selina Begum. On the other hand Rafique Miah (axin Bera-barai add,
“Some women have won UP (Union Parishad) elections, and they are doing good work
for the area. This inspires other women to be empowered”.
2.1.3. What other factors make women empowered
• It is evident from the qualitative information that not only macro policies, but also
media playd an important role in women's empowerment. For example Firoz
Talukdar says, "Ten years ago, women were not aware that they could work
outside their home that they themselves could their dresses, earn money. Now lots
of changes have happened in their perception''. He add that women are becoming
aware about their rights through radio and TV programmes, NGO training and
education that they are receiving (Arairoshi). " Regarding this, the women of Char
kumuria says, "Formerlly parents did not send their daughters to school. Now they

41
do. Even while choosing a bride for their son, they prefer educated girls. Now,
television is also playing a good role to increase awareness of the women."
Related to this Kalam Khondker says "Earlier, women of this village couldn't go
out but now they can. This has been possible, as the women have become
educated due to the mass education programme and NGO activities.
• FGD groups have also identified NGOs as an empowering factor. Micro-credit has
definitely created opportunities for income-generation and helped women to be
economically empowered. It has also helped to increase women's physical
mobility. For instance, Ameena, a woman of village Gotia, says, “ Those who are
engaged in somates (NGO group), save money in the group and take credit for
earning and rear up chickens, ducks and cows are the powerful ones”. Women of
Char Kumuria village say, "Thus the power of women is undergoing changes.
Now they keep and breed poultry cultivate green vegetables and earn money.
Thus their power is growing. Now the rural women can go to the bank and the
NGOs to draw money." In this regard Najma Khatun says, “Formerly, we could
not go to anywhere. Now we can go. We go to the NGOs for taking credit, saving
money and receiving training on different issues. In case of calling a doctor or
doing some marketing, we can go to the city without taking our husbands as guids.
The reasons behind these changes according to the respondents are the benefits of
NGOs and education. On the contribution of NGOs, Sajeda, a women of
Patnipara village, comments, “I did not have any property. Then I became a
member of Grameen bank cap and borrowed 4000 taka. I than constructed a house
and established a shop for my husband. I am now repaying the installments with
the income of the shop and cow rearing”. Khairul Islam of Gilarchala village says,
“Women receive different types of training from the NGOs like ASA,
PROSHIKA, etc. As they are involved with different samitis they can take loan
very easily and can utilize those loans" which help them to be self-reliant.
• Garments industries have also helped to empower women economically. If the
power of women in the community increases, it plays a positive role in the
development of the village. "As a result of the establishment of mills and factories
in the community, the women have been able to earn and as such many problems

42
in the family are being solved now. The girls of the poor families are now meeting
the essential demands of their families (Khairul Islam, Gilarchala) " Regarding
this a woman respondent, Nasia (35, Dorojhojikhani ) says, “A good number of
girls of the village are doing jobs in garment factories and other places in
Sreepur, Gazipur and even in Dhaka. Thus they are earning money and their
importance in the family has increased. This made them empowered." Sultan
Ahmed, a businessman of the Bisharikhati community common on the changes in
the power of women over the last ten years, "Women are working in garments and
NGOs and they are earning money that has indeed made some difference and also
empowered the women of this village." Jahangir of the same community says,
“Needs have became very acute nowadays. In this situation women are getting
work in garments and getting trained in NGOs. They have their insurance and
that’s the way they have been empowered.” Another observation of Ansar Uddin
of Arairoshi is relevant in this context: "Earlier women would cook and do
household chores; now they are not confined to home, they are working at
garments factories, spinning mills, and different government and non-government
offices. Such working capacity is their empowerment (Ansar Uddin)."
2.3.1.1. Community level factors According to the local people, over the years, the attitude of people towards women has
changed and that is playing a positive role in women's empowerment. For example, Firoz
Talukder of Arairoshi feels that "women riding motorcycles was a hateful matter ten
years ago. A woman staff of BRAC was criticized awfully by the community people
during that period but now people are accepting it and their attitude towards women has
changed. Now people are giving equal attention to both girls' and boys' children.
2.3.1.2. Household level factors
The FGD groups have identified that at the household level to acquire empowerment
women need cooperation, support and freedom from their parents and husbands. They
need education, mobility, and the opportunity to take part in income earning activities. As
the participants feel, the environment has improved over the years. They say now girls are
not married off early; parents are trying to educate them; people look for educated brides;
all these attitudinal changes contributed to acquire women's empowerment.

43
At the family level the migration of male household members create both extra
responsibility and authority of women. In this context, Kazi Abul Kashem of Daxin-
berabaria says, “If husbands live abroad, their wives become more powerful. After
receiving the remitted money, they carry out all responsibilities. They have to go to the
market for purchases. They have to rear up their children. Employment of labor in
cultivation is also their responsibility. If needed, they have to go to hospitals also. All
expenses of the family are borne by them. They also do the registration work for land.”
Another example of Chur Kumuria village shows that the migration of the male
household head leads to women's enhanced responsibility and authority. About this Pravat
Talukder of this village says "Women can be empowered if they take hold of the family.
Many people of our village live abroad and women look after their families. This change
has occurred because they have money in their hand and can spend it they way they want
to."
2.1.3.1 Are the women from solvent families more empowered? Regarding the relationship between affluent families and women's empowerment the
answer was mixed. The respondents give more emphasis on education and the
intelligence of women rather than families' economic solvency. For example, "The
women of the most solvent families of the village are most powerful. Because they have
much income. They get more respect in society, and people listen to them. Since they are
economically solvent, they need not beg from others. However, the educated women in
the village, though they do not have the best economic condition, are powerful. Because
they can do jobs with their education, and those who do not do any job, maintain their
family very well. Gradually they can attain a better economic position" (Dorokhojikhani).
In the same way Anowara of Badalpara village says that even in a poor family there can
be empowered women. Similarly, it is not that the women of well-off families are all
empowered. She further says "Education doesn’t mean acquiring knowledge. A women
has huge money, got education but doesn’t have the capacity to implement it—how can
she get empowered? The poor, the recent poor can have power too. They themselves can
do a work—they have enthusiasm. The rich, who have money, sometimes do not have
enthusiasm.” Correspondingly, Ayseha Begum of Chitain village says, "Only money is
not sufficient, brain is also required. If I hear anything I need to realize the reasons. If I

44
can do my understanding will increase. If I cannot analyze any situation then there will be
no development. Education is also required for analyzing everything."
However, the FGD groups have identified that at the individual level, the capacity to earn
money is an essential element to acquire empowerment. In their words, "Those who
cannot earn money, they have to obey all sorts of order of their husbands. Therefore, a
woman who earns money, has more power. But the standard of their power depends on
the amount of money they earn. For instance, those who earn Tk.3000-Tk.2500, have
more power. The monthly expenditures of such families are five to six thousand taka. If a
woman does not earn money and tries to show power her husband would say, 'Why talk
so much? How much money have you brought from your father’s house?' Those who earn
Tk.500-Tk.700, have also some power. Therefore, the extent of women’s power is related
to the amounts of money they have.
The more a woman earns, the more power she has" (women FGD, Char kumuria). In
other words, "When a woman earns money, her dignity in the family increases. She can
spend. She can use money in good work. When a woman can spend her income, she gets
the inspiration to earn more, and she tries to earn more. Thus development takes place in
the family" (Female, Dorokhojikhani).
2.2. Interaction between community mobility and women's agency
"There are changes, people have become more aware and due to the in increased
awareness families are developing. Now families are being run by the income of both the
husband and the wife. If the husband earn 50 taka and the wife 10 taka, then they keep 10
taka as savings for future needs. If they can save 20 taka from the income of 50 taka a day
then they can be able to invest the saving in another income generating activity. All these
efforts encourage others to follow those for their development. These are beneficial for
the village as well for people's own development (Rokeya Begum, Chitain village,
Bangladesh ).
"The literature on empowerment shows two understandings of the concept.
Empowerment is sometimes understood as a means to a specific end, such as increased
welfare of the empowered agent. It is also often conceived as an end valuable for its own

45
sake" (Khwaja, 2005, pp:268). The hypothesis for this study was to see how women's
empowerment influences in economic mobility, if it does not what are the other factors
that effect on mobility.
Logit analysis of the probability of moving out of poverty
The results of multivariate logit analysis of the probability of moving out of poverty, as
presented in Table 2.2, shows that households living in communities endowed with
greater social capital and better social infrastructure enjoy much greater advantage of
moving out of poverty. On the other hand, good governance and access to market may not
help upward mobility.
At the household level, increased household income and access to electricity tend to
increase the probability of moving out of poverty. While access to formal credit may not
necessarily help the poor, larger amount of formal credit turns out to be instrumental. The
probability of escape from poverty is lower for the agricultural and non-agricultural
laborers in comparison to other occupational groups.
The factors that determine women enpowerment (as found earlier in regression analysis)
do not necessarily influence upward mobility, except for initial household income. The
upshot is that a household that starts from a higher level of income stands a greater
chance of moving out of poverty as well as empower its female members over time. Table 2.2: The estimates of logit regression of movement out of poverty Dependent variable: Movement out of poverty Coefficient Standard error Odds ratio Initial levels of community indicators:
a. Social stratification b. Social capital c. Governance d. Democracy e. Physical infrastructure f. Social infrastructure g. Communication h. Access to information i. Access to market
0.70
2.70** -1.32***
-0.65 -0.55
1.77** -0.80 0.68
-1.28**
0.75 1.54 0.49 0.87 0.41 0.83 1.36 0.49 0.56
2.01 14.89 0.27 0.52 0.58 5.90 0.45 1.98 0.28
Initial household level indicators:
a. Annual household income (‘000 Taka) b. Number of working members c. Education of head Primary Secondary d. Education of spouse
Primary Secondary
0.01*
0.09
0.12 0.35
0.52 0.58
0.00 0.15
0.33 0.42
0.33 0.52
1.01 1.10
1.13 1.41
1.69 1.78

46
e. Male head f. Total land (10 decimals) g. Access to electricity h. Amount of formal credit i. Amount of informal credit j. Access to formal credit
0.66 0.01
0.62* 0.12**
0.02 -0.85*
0.77 0.01 0.37 0.05 0.02 0.50
1.93 1.01 1.87 1.13 1.02 0.43
Initial primary occupation: a. Trade b. Service c. Agricultural/Non-agricultural labor
-0.06 -0.70
-1.17***
0.40 0.51 0.37
0.94 0.50 0.31
Constant term -3.52*** 1.07 Log pseudolikelihood -165.74 Number of observations Wald chi2 (24) Prob>chi2 Pseudo R-squared
318 59.35
0.0001 0.1754
Notes: 1. The sample includes households that moved out of poverty or persisted in poverty in the last ten- year period. 2. ***, **, and * stand for 1%, 5%, and 10% level of significance. 3. The standard errors are adjusted for heteroscedastic error structure arising from cross-sectional heterogeneity of households. 4. The base categories include low level of community indicators, no education of head or spouse, no access to electricity or formal credit, constant poverty status in the two periods under observation, and primary occupation in agriculture or manufacturing or others. 5. The odds ratio is given by the exponentiated value of the corresponding estimated coefficient.
However, in this study it has been proved from the analysis that women's agency in some
way have influenced mobility.
2.2.1. Initial (2001) conditions in policy focus and growth
A raw percentage of movers, fallers, the chronic poor and the chronic rich as obtained
from the broader mobility matrix sorted in the male Ladder of Life exercise, shows (Table
2.3) a little positive interaction between mobility and high women's agency communities.
Table 2. 3: Percentage distribution of community perception of the individual's well-being and initial (2001) women's agency situation
Community classification by initial
(2001) women's agency
Four transition groups identified by community people
Mover % (N)
Always better off
% (N)
Chronic poor % (N)
Faller % (N)
High women's agency
26 (222) 30 (260) 38 (330) 6 (50)
Low women's agency
25 (126) 29(145) 39(194) 7 (37)
Note: the percentage of the four transition groups has been calculated from the broader mobility matrix that has been used for household sorting.

47
Again the calculation of self-identified transition groups and women's agency, reveals that
to some extent women's empowerment matters for household mobility. Table 10 shows
that the villages ranked high on initial (2001) women's agency are also high on the
percentage of movers compared to low women's agency communities.
Table 2. 4: Interactions between high/low women's agency communities and
household mobility
Community classification by initial (2001) women's agency
Self identified four transition group Mover % (N)
Always better off
% (N)
Chronic poor % (N)
Faller % (N)
High women's agency
23 (153) 35 (233) 34 (221) 8 (51)
Low women's agency
18 (38) 34 (70) 39 (80) 8 (16)
Total Pearson chi-square=2.9712 Pr =0.396 Note: Four transition groups have been identified by comparing self-identified positions in the ten steps ladder and the self- identified Official Poverty Line (OPL) (HQ, 701,702, 706) 2.2.2. Interaction between initial (2001) women's agency and the summery statistics of LOL
To analyze the differences in mobility between villages ranked on high/low women
agency village, data has been compared with two summery statistics that derive from the
ladder of life through qualitative measures. These are: Net prosperity and MOP index.
Net prosperity Index shows the extent of net upward mobility (upward minus downward)
in a community. Moving Out of Poverty Index shows the extent of upward mobility of
the poor across the community poverty line in a community.
2.2.3. Women's empowerment at the community level and MOP Index
Of the ten villages with a high women's empowerment, the larger number of households
have moved out of poverty (MOP) in 5 villages (Arairoshi, Char Kumuria, Charbelabo,
Chitain, and Daxin-betabaria) while five communities (Gilarchala, Ranachandi,
Dorikhojikhani, Ikumaribhati and Patnipara) are less successful in poverty exits. Among
the initial low women agency ranked villages most of the (4) showed high MOP (Gutia
and Modhopur, Bisharikhati and Uttar-Guthuma) while two villages (Dashpara
Badalpara) have low MOP.

48
2.2.4. Women's empowerment at the community level by Net Prosperity Index
Among the ten villages with high women empowerment of the five-year observation
period, mobility by both gross and net prosperity indices is greater in six villages
(Gilarchala, Char Kumuria, Arairoshi, Daxin-betabaria, Chitain, Charbelabo) while it is
lower in four village (Ikumaribhati, Dorikhojikhani, Ranachandi, Patnipara). Of the
villages, with low initial women empowerment only two villages (Badalpara, Uttar-
Guthuma) experienced high mobility while three villages (Gutia, Modhopur, Dashpara)
show low mobility while one village (Bisharikhati) saw no change.
2.2.5. Women's agency is considered as an important means/ dimension of family welfare.
The household questionnaire data on the present situation of women agency and
economic mobility has been analyzed both with the current status of 515 panel
households and 763 present households. Households across the sample for both the panel
and present studies have been categorize into high, medium, and low women’s agency.
The scoring ranges are 1-10 for low, 11-15 for medium and >15 for highly empowered
women. However, in some cases analysis has been done by a 5 score interval to see the
variation.
Majority (36.48%) chronic poor are in the low agency category while the highest (40%)
proportion of movers belong to the high agency category. However in the always better of
category less difference in women's agency has been had observed (Table 5).
Table 2.5: Percentage distribution on sample household distribution of four transition groups by initial (2001) women's agency
Women's agency categories by individuals score
Mover (%)
Always better of
Chronic poor
Faller
High Agency >15 39.87 21.52 27.85 10.76 Medium Agency (11-15) 37.37 21.72 28.79 12.12
Low Agency (1-10) 32.70 21.38 36.48 9.43 Pearson chi-square = 4.1078 Pr = 0.662 Note: sample household have chosen by 40:30:20:10 by economic status The initial (2001) women's agency status of 515 panel households of the self-identified
four transition categories can be seen in Table 12, the difference between low and high
agency in all categories evident more clearly than sample household distribution (Table.5)
of four-transition group. Most of the high agency households (23%) belong to the mover

49
group and the least of them (6.33%) belong to the faller group. Highest percentage of
always better of and the lowest number of chronic poor is observed for this score range
>15. Thus the hypothesis that women's empowerment contributes to on uplift of a
household's position in the ladder of life is to some extent confirmed by the data. Table 2.6: Percentage distribution of self-identified four transition groups by initial
(2001) women's agency
Women's agency categories by individuals score
Mover (%)
Always better of
Chronic poor
Faller
High Agency >15 23.42 37.34 32.91 6.33 Medium Agency (11-15) 18.69 28.79 44.95 7.58
Low Agency (1-10) 19.50 27.04 45.28 8.18 Pearson chi-square = 8.5483 Pr = 0.201 Note: Note: Four transition groups have been identified by comparing self-identified positions in the ten steps ladder and the self- identified Official Poverty Line (OPL) (HQ, 701,702, 706) In the qualitative investigation when local people were asked whether the empowerment
of women has anything to do with the well-being of the village, in most cases they all
agreed that it helped them to overcome the poverty of the poor families in the village.
They have said that though their wants were very acute they are now decreasing now due
to the garments and NGOs that are creating opportunities of income for their women
(Bisharikhati.). Shanti, a women of Gotia village, says, “ Nowadays, the women work
more than the men. They now pluck chili, cut tobacco leaf, dig soil, cut grass for cows,
till lands, harvest potatoes and undertake other activities whenever available."
However in the current (2005) questioner survey it has been found that the highest
number of women income-earners (20.60%) belong to the high women agency
communities' and lowest (10.85) belong to the low agency communities (Table 2.7). The
income generated by female members of households has clearly contributed to the
betterment of economic conditions of their families.
Table 2.7 Percentage distribution of income earning working status by present
(2005) community level women's agency
Community Category % of income earner women
% of non-income earner women
High agency community 20.60 79.40 Low agency community 10.85 89.15
Pearson chi-square = 45.2786 Pr = 0.000 Note: 15-59 year old women are considered for this analysis.

50
According to Table 2.8 about 70% earning women scored between 15 and 24 in the
empowerment scale. 13% working women scored 25 and above, while another 13%
scored between 10 and 14. Only 3% working women scored very low in the range of 5 to
9. There is a clearly significant positive relation between the earning ability of women
and their empowerment indicator.
Table 2.8: Distribution of earning women by present (2005) empowerment score
Women empowerment scoring range by five interval % Of women Up to 9 3 10-14 13 15-19 36 20-24 35 25+ 13 All 100 Access to electricity was strongly positively correlated with women empowerment 10
years ago, as shown in Table 2.9. At present, more households gained access to electricity
across all groups by women empowerment scoring. However, there is more equality in
terms of the percentage of households having access to electricity across women's
empowerment score, except for the highest score group (25+) that gained significantly
greater access.
Table 2.9 : Access to electricity by present (2005) women empowerment scoring
Scoring range Have access to electricity at present
Had access to electricity 10 years ago
Up to 4 38% - 5-9 38% 9%
10-14 33% 11% 15-19 37% 12% 20-24 36% 13% 25+ 44% 28% All 36% 12%
The household annual income distribution by women empowerment status in Table 2.9
reveals that more than a third of households in the top empowerment group belongs to the
highest income group (200, 000 +). For other empowerment group, no clear systematic
difference in household annual income level is observed by empowerment status. The
reason is that the larger percentage of women in middle-income households tend to work,
while women in low-income and high-income households work less (Table 2.11). As the

51
labor force participation status of women is a determinant of women agency, the
empowerment score does not necessarily correspond to the level of household income.
Table 2.10: Households annual income (Taka) by present (2005) women
empowerment scoring Scoring range < 20,000 20,000-50,000 50,000-100,000 100,000-200,000 200,000+ Total Up to 4 - 38% 38% 13% 13% 100% 5-9 5% 39% 33% 18% 5% 100% 10-14 8% 33% 31% 20% 8% 100% 15-19 5% 29% 36% 20% 10% 100% 20-24 4% 34% 19% 27% 16% 100% 25+ - 28% 20% 16% 36% 100% All 6% 33% 31% 20% 10% 100% Table 2.11: Income difference by current (2005) female labor force participation
status
Income range Participant Non-participant Total Up to 20,000 6% 5% 6% 20,000-50,000 39% 31% 33% 50,000-100,000 26% 32% 31% 100,000-200,000 17% 21% 20% 200,000+ 12% 10% 10% Among the food deficit households, greater percentage is on the lower side of the women
empowerment scale, as shown in Table 2.12. Half of the lowest score group breaks even
in food security. The joint distribution of households by current food security status and
women empowerment score shows no other significant association.
Table 2.12: Households food security status at present (2005) by women empowerment score
Scoring range Food deficit Not adequate Breakeven Surplus Total Up to 4 13% 13% 50% 25% 100% 5-9 11% 21% 30% 38% 100% 10-14 13% 24% 35% 28% 100% 15-19 6% 25% 41% 27% 100% 20-24 9% 13% 42% 36% 100% 25+ 8% 24% 32% 36% 100% All 10% 22% 37% 31% 100% To confirm the results from quantitative analysis, we now turn to qualitative findings in the next section. 2.2.6. Findings from the qualitative analysis:
Most FGDs illustrate that there is a link between moving out of poverty and women's
empowerment. The major findings on impact of women's empowerment could be

52
summarized in the following three levels: i) for her own well being, ii) family well-being
and for the iii) communities betterment.
2.2.6.1. For her own well-being Freedom of movement Besides their household work, women are now working outside.
"Earlier, we wouldn’t go out of home. Now we go to school, college, work in town"
The women who have jobs and education, can move around bravely.
"They go to doctors, to market, become members of a samity. And if women don’t take
loan with what the men will do business?- Joytun Nahar, Badalpara."
Increasing participation in the Household level and reducing domestic hierarchy
• Women's decision-making power is greater than before at the family leve.
–Women now actively take part in making decision on child education, marriage;
investment and can follow up on husband’s work.
–Wives do not fully wait for husbands' decision/permission for every single matter.
–Now they do not tolerate husband's torture silently. Besides they can protest against
husband's unjust acts. To some extent now women are free from fear of their husbands'
threat.
• "Both husband and wife work together to improve their family conditions.
Therefore, the value of women's opinions has increased within their families".
Anawara Begum, Charbelabo.
–"At present if any husband tortures his wife, she protests against it. So, he cannot torture
his wife- Rokea, Ariroshi."
–"In the past, the males used to bring a saree (cloth) by taka fifty for their wives. But now,
the females just tell their husbands to give them money for shopping." – Selina Begum,
Charkumuria.
Economic freedom and economic opportunity
• Now women have more purchasing power both for themselves and for their
families
• Sole dependency on husbands for living is reducing; now they are capable of
making their living if necessary.

53
• Now women can buy daily necessities and can expend money for children's
education cost, for any sudden needs with a greater freedom.
“The money that husband used to earn was not enough to run the family. Now they two
run the family. Now they can use soap, buy dresses or sharees”-Hawatun Bewa,
Patnipara.
“Now we can sell well, which we could not do in the past. Now we can sell from home
and also can sell roosters standing in the streets on the weekly market day”-Ramisha,
Ronuchandi.
Openness
• Women’s Do not feel shy or hesitate to speak with outsiders or men if required
• Increased capability to integrate oneself with the outside environment.
Skills and ability • Empowered women have built their houses by their own earning and improved the
economic condition of their families-FGD,Dorikhojikhani.
"I have taken training in tailoring. And for the last 10 years I have been working as a
tailor. Now I can maintain all my family- expenditure". Women's aptitude increases to
save and calculate money.
"Now women are more powerful in maintaining their families; working out everything to
maintain families, bearing and caring children, saving money, rearing poultry and
livestock, taking care of children's education; all these are done by women- Khodeza
Khatun.
"I, myself, is a lesson to me. It would be possible to sell a cow by taka 40,000. I have read
up to class six. In the past, I was a foolish woman. There are many people who have
passed M. A. and B. A. but don't gain enough knowledge. But if everyone would become
knowledgeable, no one lives in poverty- Johora Begum.
" I can not count the big amount of money (such as; 1000 taka) but can count ten or
twenty taka. If one cannot to do, another can do. I can draw the loan from the Bank. I
have also opened an account of DPS. In the past, I couldn't go to Faridpur but now I can"
Rokea Begum.
“By taking loan, we invest money for enlarging the business” FGD, Char Kumuria.

54
" In the past, people were not well educated. That is why, they used to take ten or fifteen
children. But now they take only one or two. That time, they couldn't scold their husband
in any need and even they couldn't talk with their husband. But now they can. They were
then compeled to obey their husband- Khodeja Begum.
Self-esteem • “Women empowerment has nothing to do with wealth. The women who can work
independently is an empowered woman.”
• They are becoming courageous and above all have increased self-esteem
• They are now aware of their rights.
• "I rear poultry and cattle, and I maintain my family with that money. I have no
male member in my family. I have to maintain everything I have a great deal of
power" -Uttar Ghutuma.
• " A man could marry many times but now it is not possible; He has to take
permission of his elder wife. The law has given more power to women."
Ikumeribhati"I was afraid of the police. But now I can ask any question to the
police. I have realized that the police are also human beings. In spite of my
illiteracy, I have become an intelligent woman, Lily Begum, Arairoshi."
2.2.6.2. Family well-being Prospect of upward mobility
• "While the husband is at work the wife takes the cattle to the field for grazing. As
a result, the cattle give more milk and their income increase"-Ranahandi
• "I cannot take the cattle to the market for sale without the prior permission of the
female members who rear them at home. It is one kind of power they are
experiencing. Things were not so in the past." Gias Uddin
• “Husband and wife's working together increases the income of the family and
reduces quarrels between them. Moreover, the wife can then say 'you do not earn
alone, I earn too" –Rafiq Uddin, Chitain
• Women's mobility and income are the two key factors leading to their
empowerment.

55
• “If the husband has his pot broken and the wife has her net broken. In that case,
how will the pot fill up no matter how much fish is kept inside. Husband is like
pot that can never prosper. Women are like the net”- Lovely, Patnipara.
Economic opportunities of women have increased. All FGDs agreed that economic
empowerment of women does have a certain relationship with economic mobility of the
family.
Happiness ensured “I could not put on the sharee that I am wearing now. That time I
only wore what the men had brought. Now, we can wear (dresses) as we are able to
exercise our power. Now I myself purchase it from the hawkers who come to the house. I
can buy anything – like this nose ring, on my own. Husband did not buy it for me, isn’t it
a change? Previously, he used to get upset, “You brought it while being in poverty’? Now
he smiles and says, ‘well done, you have made use of it.”- Sajeda, Patnipara.
2.2.6.3. Community level well-being
Pro women attitude
• Women's physical mobility is no more highly restricted and the notion of parda is
not so rigid as it was in the past.
• Now working outside of their houses, talks with unknown persons are no more
considered as sin.
• Now community is realizing the needs of woman's education, jobs and their rights.
• Now people are giving equal attention to both girl and boy children.
• Women's participation in the national politics and representation in the local
government contributes towards achieving women's rights. For instance,
Murshida, a 45 year old woman of village Dorikhjikhani, says, "There is a female
ward member in the neighboring village. She can talk in the arbitration/judgment.
She gives decisions in a judgment. Women’s empowerment means to give
decisions in judgment”. As a result, salish does work in favor of women; women
get more prestige than before.

56
There is some difference also in the village Gilerchala, the women have reported that
though women have learned more, the economic situation of households has developed,
and women can feed their children, they are not happy now. Ms. Rasheda says,
"Previously, we were not aware and we did not understand how to be cleverer but now
we see that the outside girls are very smart and our men like them very much. As outside
girls work in industries we are also feeling an inspiration to get involved there." Mallika
regrets that men are getting spoiled to see outside smart girls. She says, "The situation
was better ten years ago. Men did agricultural work and women did household work then.
Women always feared men. Husbands used to beat them if women made any mistake.
We could not take proper food, but there was no mental stress then. " In this regard, Ms.
Rasheda says, "Because of these industries we can take food, and we have solvency but
we do not have mental peace."
Conclusion:
We can conclude from the above findings that women's empowerment has a positive
contribution to a household's economic mobilty to some extent. It is also further confirms
on Logit analysis of the probability of moving out of poverty that when female members
in the family particiapte in the labor market, the number of working members increases,
which in turn empowers the female members and contributes to the household’s upward
mobility.

57
2.3 How do demographic factors, economic factors and economic aspirations affect mobility?
2.3.1 Household composition
Demography is an important factor that affects economic mobility. Household
composition plays a significant role in the income and expenditure of households. In this
sub-section we will examine how the demographic factor affects mobility. The family
size of the surveyed population is almost the same as the national average (5.5), but it is
little higher among the chronic rich (6.1) and lower among the chronic poor (5.0). The
household size among the movers is 5.4. Out of four the transition groups identified in the
study, the family size of the chronic poor is the smallest and its main reason could be the
migration of the family members for alternative employment outside their community or
in urban area and the splitting up of the family due to poverty.
In this report the members of the household are considered as two types such as
productive and dependent because productive members can contribute to the household
income, which is important for economic mobility but the dependent members mainly
consume. The dependent members are mostly those who are below 15 years and above 64
years, and the productive members are those who are between 15 and 64 years old. The
following table shows the distribution of dependent and productive members among the
four transition groups. The number of productive members is more than 50 percent in all
transition groups, but the number is highest, that is 63 per cent in the chronic rich group
followed by 59 per cent in the movers, 55 per cent in the chronic poor and 57 per cent in
the fallers. FGDs on LoL suggest that the families belonging to the upper steps of the
ladder have more than one income earners, and it is common in the rich families in all
sample communities. The number of income earners per family will be examined later in
this section. However, the number of productive members could be one of the factors that
an affect household’s mobility, as it is higher among the movers and the always better off
families than among the chronic poor and fallers.
About one-third sample households are headed by a person of 70 years. It is more or less
the same in all transition groups. The highest 27 per cent household heads are at an age
between 30 and 39 years among the chronic poor.

58
Table 2.13 Age distribution of household heads by transition group
Age Mover Chronic Rich Chronic Poor Faller Grand Total
20-29 4% 3% 5% 4% 4%
30-39 23% 15% 27% 12% 21%
40-49 14% 9% 14% 21% 13%
50-59 21% 26% 18% 19% 22%
60-69 12% 15% 10% 12% 12%
70+ 27% 32% 26% 31% 29%
Grand Total 100% 100% 100% 100% 100%
The gender of a household head plays an important part in the overall well-being of the
family in a traditional society like Bangladesh. Overall, 95 percent households are headed
by their male members. The number of female headed households is higher among the
chronic poor and fallers. Almost cent percent rich households are headed by the male
members and there are 97 per cent male heads among the mover households. Most of the
FGDs on LoL reveal that households have fallen down or become unable to move up
because of the illness or death of the main income earners and the largest part of them are
men.
Table 2.14: Education level of the HH head by transition groups
Education level Mover Chronic rich Chronic poor Faller Grand Total
Primary incomplete 9% 7% 11% 10% 9%
Primary complete 9% 12% 9% 7% 10%
Secondary incomplete 22% 20% 14% 33% 20%
Secondary complete 9% 22% 4% 6% 12%
Higher secondary 1% 2% 1% - 1%
University 2% 6% 1% - 3%
Vocational/technical 1% 1% - - 1%
No schooling/illiterate 31% 15% 38% 22% 27%
No schooling/literate 16% 15% 23% 21% 18%
Other - 1% - - -
Grand total 100% 100% 100% 100% 100%

59
More than one-fourth household heads are illiterate. This is higher among the chronic
poor families and lower among the chronic rich. About 31 per cent household heads
among the mover transition groups are illiterate.
2.3.2.1 Community level initial condition In the initial period (1995), less than two per cent community people were employed by
the government, but not in public works projects. In eight of the sample communities
none was employed by the government. Data shows that some people from
Darikhozekhani (3%), Char Belabo (5%), Chitain (1%), Arairoshi (10%), Char Kumaria
(2%), Ikumaribhat (2%), Daxin Betabaria (1%) and Uttar Guthuma (4%) were employed
by the government.
The employment situation has, however, changed over the last 10 years. According to the
community profiles currently a number of people in 11 communities has been employed
by the government. These communities are Darikhozekhani (5%), Gilarchhala (2%),
Patnipara (2%), Dashpara (1%), Char Belabo (10%), Chitain (1%), Arairoshi (15%), Char
Kumaria (4%), Ikumaribhati (3%), Daxin Berabaria (5%), Uttar Gutuma (5%). These
percentages were zero in Gilarchala, Patnipara and Daspara in 10 years before. Moreover,
except Chitain, the number of employees has increased in the remaining eight
communities and it is completely double in Char Belabo. The situation of Ranachandi,
Modhupur, Bisharikathi, Badalpara and Gutia has remained the same.
The average wage of agricultural and non-agricultural male laborers was Tk. 43 10 years
before. The wage was more than the average in eight communities like Darikhozekhani
(45), Ranchandi (50), Bisarikathi (50), Chitain (50), Arairashi (70), Char Kumaria (70),
Daxin Betabaria (50), and Uttar Gutuma (60). In the remaining eight communities the
wage was less than the average ranging from Tk.20 to Tk.40. Over the last 10 years the
wage has increased in all sample communities. The increase rate of wage is highest in
Daspara (220%) followed by Modhupur (200%), Patnipara (180%), Char Belabo (133%),
Gilarchala (100%), Ranachandi (100%), Bisharikathi (100%), Chitain (100%),
Ikumaribhati (100%), Gutia (100%), and Doxin Berabaria (100%). The increasing rate of
the other communities is less than 100%. Among them Gilarchhala, Patnipara, Dashpara,
Madhupur, Char Belabo, Ikumaribhati, Gutia were low wage communities. The presence

60
of private employers has been found in Patnipara, Daxin Betabaria, Gilarchhala, Char
Kumaria, Arairashi, Chitain, Ranchandi.
The proportion of agricultural wage laborers were between two and nine per cent in all
communities except Gilarchala and Bisharikathi 10 years ago. The percentage of
agricultural laborers has increased in Dorikhuzikhani, Ranachandi, Daspara, Char Belabo
and has decreased in Patnipara, Badalpara, Madhupur, Chitain, Arairashi, Ikumaribhat,
and Uttar Gutuma over the study period.
Economic mobility and occupation are closely related. Moreover, the number of members
with jobs also affects a household's economic mobility. The number of members with
jobs rang from one to five in sample households. It is found that the number of single
earner households is highest among the chronic poor and lowest among the fallers. More
than 40 per cent households of movers and the chronic rich have five members with jobs.
Not a single household is found among the fallers which has five members with job.
Table: 2.15 Number of members with jobs by transition groups
Numbe of working
members
Mover Chronic rich Chronic poor Faller
1 23% 31% 36% 10%
2 19% 36% 40% 5%
3 22% 49% 23% 5%
4 26% 52% 17% 4%
5 42% 42% 17% 0%
Grand Total 22% 35% 35% 8%
However, those household members are doing different jobs. Data shows that the major
occupations of the members of the sample households are farming, trading and non-
agriculture labors. The following table reveals that the number of farmers is highest in the
always better off group and the lowest among the chronic poor. Among the movers 30 per
cent are farmers and 22 per cent are involved in trading.

61
Table: 2.16 Primary occupation of the household members
Occupation Mover Chronic Rich Chronic Poor Faller Grand Total Agricultural wage labor 3% 1% 15% 5% 6% Farmer 30% 37% 21% 44% 30% Fisherman 2% - 4% 1% 2% Manufacturing artisanal - 1% 3% 2% 2% Manufacturing industrial 2% 3% 3% 1% 2% Non-agricultural wage labor 13% 4% 16% 15% 11% Other service (pvt sector)/skill work 8% 12% 5% 5% 8%
Other services (pvt sector)/unskilled work 8% 6% 6% 2% 6%
Public sector skill work 1% 6% 1% 1% 3% Public sector unskill work 2% 2% - 1% 1% Trade 22% 19% 12% 7% 17% Others 10% 9% 13% 16% 11% Grand total 100% 100% 100% 100% 100%
One-third of the working members also have a secondary occupation and 39 per cent of
them are involved in farming. The highest 47 per cent movers chose farming as their
secondary occupation.
Table 2.17 Secondary occupation of household members
Secondary occupation Mover Chronic Rich Chronic Poor Faller Grand Total Agricultural wage labor 8% 5% 16% 12% 10% Farmer 47% 41% 36% 12% 39% Fisherman 2% 1% 7% 4% 4% Manufacturing artisanal 1% 1% 2% - 1% Manufacturing industrial - 3% 3% 8% 3% Non-agricultural wage labor 7% 2% 9% 16% 6% Other service (pvt sector)/skill work
- 2% 1% - 1%
Other services (pvt sector)/unskill work
3% 3% 1% - 2%
Public sector skill work - 1% - - - Trade 18% 24% 8% 24% 17% Others 15% 17% 17% 24% 17% Grand total 100% 100% 100% 100% 100%

62
It is clear from the above discussion that more than one income earners and multiple
occupations help people to move out of poverty.
Table 2.18 Unemployment and change in difficulty of finding work
Transition groups Anyone in household unemployed
Yes No
Mover 19% 81%
Always better off 25% 75%
Chronic poor 22% 78%
Faller 42% 58%
Grand Total 24% 76%
Pearson Chi-Square = 15.058(a), p = .002
The employment status of the household members is much satisfactory. More than three-
fourth (76%) households report that none was unemployed in the last one year. The
employment rate is higher among the mover households and lower among the fallers. So
it could be said that employment enhances economic mobility.
Table 2.19 Changes in getting jobs over the last 10 years
Transition groups Changes over the last 10 years
Easier Remain the same Hard
Mover 32% 10% 58%
Always better off 40% 13% 47%
Chronic poor 32% 12% 56%
Faller 33% 9% 58%
Grand Total 35% 12% 53%
Pearson Chi-Square = 8.384(a), p = .211
More than a half of the respondents think that it has become harder to get a job compared
to 10 years before. The movers, fallers and the chronic poor perceive almost the same. It
becomes easier for the rich rather than others.

63
Table 2.20 Difficulty of finding jobs at private sector at present
Mover Chronic rich Chronic poor Faller Grand Total Very easy 8% 15% 14% 12% 13% Fairly easy 30% 34% 24% 22% 29% Not so hard if help is available from a paid agent
9% 5% 6% 6% 6%
Not so hard if help is available from relatives
12% 9% 6% 12% 9%
Somewhat difficult 24% 19% 20% 19% 21% Very difficult 17% 19% 31% 28% 23% Grand total 100% 100% 100% 100% 100%
The highest number of the movers and the rich think it is fairly easy to get a job at private
sector whereas the highest number of chronic poor and the faller have reported that it is
very difficult to get a job.
2.3.3 Credit and debit
About 62 per cent households have taken loans with or without service charge over the
last one year. Data reveals that three-quarters of the fallers and 68 per cent of the chronic
poor have taken loans. But the average amount of loan is the highest in the rich. Fifty-four
per cent rich households have taken loans over the last one year with an average amount
of Tk. 31,730. The average amount of loan is Tk.23,133 in the mover households and
below 20,000 among the chronic poor and fallers.
People have less access to banks to borrow loan. It is found that less than one-fifth of the
borrowers have access to banks or have gone to banks to take loan. The highest 45 per
cent have taken loans from relatives, neighbors, friends or local money-lenders. However,
40 per cent people have taken loans from different NGOs. Among the four transition
groups, the movers (44%) and the chronic poor (45%) have gone to the NGOs to borrow
money.
The main purposes of loans are investment and household consumption. It is found that
the highest 25 per cent people have taken loans for running business followed by 21 per
cent for consumption and 14 per cent are for agricultural work. Among the movers 39 per
cent have taken loans to invest the money in business and among the chronic poor 26 per
cent have taken loans for consumption.

64
2.3.4 Access to market
Currently there is no bus and/or train station and no daily and/or weekly bazaar near
Darikhozekhani, Madhupur, Ghutia, Daxin Betabaria. These four communities did not
have access to any bus/train station or daily/weekly bazaar 10 years ago also. The other
seven communities like Gilarchhala, Ranchandi, Badalpara, Arairoshi, Char Kumaria,
Ilkumaribhati, Uttar Guthuma currently have access to bus/train stations and daily/weekly
bazaars and they also had access to those 10 years before. Patnipara, Bisharikathi,
Daspara, Char Belabo and Chitain did not have access to bus/train station 10 years ago,
but currently only Char Belabo has access to a bus station. These five communities had
access to daily/weekly bazaars 10 years ago but currently Bisharikathi does not have
access to any daily/weekly bazaar. According to the community timeline, a large area of
the Bisharikathi village went into river due to erosion, where a weekly market was
opened. After that river erosion, it was destroyed and people have now to go to the
neighborhood village. Data shows that regarding access to market the initial condition of
Gilarchhala, Ranchandi, Badalpara, Arairoshi, Char Kumaria, Ilkumaribhati, Uttar
Guthuma is the best among the 16 communities.
The average distance of the nearest town/urban center is about 10 km. The distance of the
nearest town/urban center from Char Kumaria is one km., from Darikhozikhani,
Gilarchala, Ranachandi, Char Belabo, Arairashi, Ikumaribhati, Daxin Berabari and Uttar
Gutuma it is between 2 and 5 km., from Daspara, Modhupur and Badalpara it is between
7 and 10 km., and from Patnipara, Bisharikathi, Chitain and Ghutia the distance is more
than 15 km. Patnipara is 40 km far from the nearest town.
The local economy has improved in 14 communities. The local economic condition of
Char Belabo was strong which has changed and moved downward during the study
period. Now it is a medium economy and the economic strength of Ranachandi has
remained the same.
The following features are considered as the factors related to market access that caused
upward mobility among the community people:
1. Access to a job/better job/more work opportunities

65
2. Improvement of the national economy
3. Improved access to market
4. Increased crop production
5. Increased community prosperity
6. New business/better business
7. Women's stepping out to work
Table 2.21 Movement upward due to access to market
Factors Mover Chronic Rich Chronic Poor Grand Total
Got a job/better job/more
work opportunities
14% 13% 23% 16%
Improve national economy 12% 7% 5% 9%
Improved access to market 5% 3% 4% 4%
Increase crop production 37% 38% 37% 37%
Increase in community
prosperity
- 1% 1% -
New business/better business 31% 37% 30% 33%
Women stepped out to work - 1% - -
Grand total 100% 100% 100% 100%
The above table shows that the main factors that help people to move forward are
increased crop production (37%) and new business/better business (33%). Twenty-three
per cent chronic poor report that getting better jobs or work opportunities is one of the
main causes of upward mobility.
Job loss/unemployment, inconsistent work opportunities, increased restriction on business
tax, vulnerability to market price fluctuation, the economy getting worse are considered
as the major reasons for downward movement that relate to less access to market. The
highest number of respondents blame the worse off economic condition as a reason of
moving downward. Vulnerability to market price fluctuation and unemployment are also
causes of moving downward.

66
Table 2.22 Move downward due to get access to market
Factor Chronic rich Chronic poor Faller Grand Total
Job loss/unemployment 24% 21% 27% 24%
Inconsistent work opportunities - 8% - 3%
Increase restriction on business tax 3% - - 1%
Vulnerability to market price fluctuation 30% 26% 24% 27%
Economy got worse 43% 46% 48% 46%
Grand Total 100% 100% 100% 100%
2.3.5 Migration
In terms of population Patnipara was the smallest community with 175 people whereas
Char Belabo was the largest community with an 8,000 population. Currently Madhupur is
the smallest community and Char Belabo is the largest one. According to the community
profile about 90 per cent of the community population of Daspara left temporarily to look
for work followed by 50 per cent in Madhupur, 40 per cent in Ranachandi and
Dorikhozikhani and 25 per cent in Gutia. The situation has been changed over the last 10
years in both ways. Temporary out-migration has increased during the study period in
Daxin Betabaria (7%), Arairoshi (8%), Patnipara (10%), Char Belabo (10%),
Ikumaribhati (15%), Bisarikathi (20%), Uttar Guthuma (20%) and decreased in Ghutia
(20%), Ranchandi (30%), Madhupur (30%), Darikhozekhani (40%), Daspara (80%).
People came to Darikhozekhani (10%), Gilarchhala (10%), Daspara (10%), Uttar Gutuma
(15%), Arairashi (40%) temporarily in certain times to look for work 10 years ago. None
came to look for work in Patnipara, Badalpara, Bisarikathi, Madhupur, Char Belabo,
Chitain, Char Kumaria. In-migration has increased in Patnipara (15%), Darikhozekhani
(20%), Uttar Gutuma (20%), and Gilarchhala (80%) and decreased Arairashi (10%) and
Daspara (0%). There was no in-migration in Ranchandia, Madhupur, Ikumaribhati, Gutia,
and Daxin Betabaria and the situation has remained the same over the last 10 years.
About half of the survey households (49%) have a migration history. On an average one
and a half persons per household have migrated over the last 10 years. About 13% of the
total surveyed population migrated. Of them 44 per cent were males and 56 per cent
females. More female members migrated than the male members in three transition

67
groups except the chronic poor. Among the chronic poor about 60 per cent female
members migrated overt the last 10 years. More than three-quarter (77%) of the migrated
population are the sons/daughters of the household heads of which the highest, that is,
78% were among the chronic poor.
About 67 per cent people migrated due to marriage or for forming a separate household.
Only 18 per cent people migrated for working away. Of them 22 per cent are from
movers and 21 per cent are from chronic rich households. As the main reason of
migration is marriage or forming separate households, 26 per cent of the total migrants
have been leaving in the same villages and 51 per cent in the other villages. Only 11 per
cent people migrated abroad and of them 17 per cent are from movers and 11 per cent
from rich households. Migration has a positive impact on them. About 60 per cent of the
migrants are better off and 28 per cent are the same since they left. It is more positive for
the movers and the rich compared to the chronic poor and the fallers.
2.3.6 Education
As the education level of the household head has already been described above, here we
will describe only the education level of the other family members. Usually the education
level of the members of the rich families is much better than other three groups. Members
who have completed higher secondary or university are only found among the movers
and rich families.
Table 2.23 Education level of the household members
Education Level Movers Chronic Rich Chronic Poor Faller Grand Total Primary Incomplete 20% 13% 23% 19% 18% Primary Complete 12% 14% 11% 15% 13% Secondary Incomplete 26% 28% 16% 25% 24% Secondary Complete 8% 15% 4% 5% 10% Higher Secondary 1% 2% - 1% 1% University 1% 4% - - 2% Vocational/Technical 1% 1% - - - No Schooling/Illiterate 23% 15% 30% 22% 22% No Schooling/Literate 8% 7% 14% 12% 10% Other - - 1% - - Grand Total 100% 100% 100% 100% 100%

68
2.3.7 Health
The presence of doctors, nurses and health clinics has been considered to understand the
health care facilities in the sample communities. Community profiles suggest that health
care facilities were much better in Daxin Betabaria, Char Belabo, Arairoshi, Char
Kumaria, Badalpara, Patnipara, Daspara, and Uttar Gutuma. Doctors were available in all
these communities 10 years ago. Four communities (Daxin Betabaria, Char Belabo, Char
Kumaria, Badalpara) had government health clinics and three communities (Doxin
Berabaria, Arairashi and Char Kumuria) had private health clinics. The remaining nine
communities did not have any health facilities 10 years ago. So the community people
received health service from either paramedics or village doctors or pharmacies. In
Madhupur, there was not a single facility available 10 years ago.
The situation has changed over the study period. Now one or more than one health
facilities are available in 12 communities. Those are Gilarchhala, Daxin Betabaria, Char
Belabo, Arairashi, Char Kumaria, Darikhozekhani, Ranchandia, Badalpara, Dashpara,
Ikumaribhat, Gutia, Uttar Gutuma. But still there is no facility available in four
communities like Patnipara, Bisarikathi, Madhupur, and Chitain.
The respondents were asked about health shocks that create crisis in their houses. About
45 per cent respondents replied that they had health shocks over the last 10 years. Almost
half of the chronic poor and more than a half of the fallers had health shocks over the last
10 years. The following figures reveal that the mover households had less health shocks
compared to the other three groups. It might help them to move forward, because they
had to spend less in treating their family members.
Table 2.24 Experience health shocks by transition groups
Transition groups Yes No Mover 37% 63% Always better off 45% 55% Chronic poor 49% 51% Faller 55% 45% Grand Total 45% 55%

69
FGDs on LoL suggest that severe, sudden or chronic illness is one of the major reasons
for falling down to the next step or stagnate in a certain step of the households belonging
to the steps below the community poverty line or just above.
The respondents who had health shocks in the last 10 years somehow coped with
financial costs mainly through borrowing money with interest or on easy terms. To cope
with the financial costs the highest 45 per cent mover and 28 per cent chronic rich were
able to borrow money on easy terms, but 40 per cent chronic poor and 38 per cent fallers
had to borrow money at high interests. Data reveals that coping with health shocks are
easier for the chronic rich rather than the poorer. Because the rich can borrow money on
easy terms whereas poorer have to borrow money at high interests.
Table 2.25 Way of copping with health shocks
Way of copping Mover Chronic rich Chronic poor Faller Grand Total
Borrowed money at
high interest
17% 18% 40% 38% 28%
Borrowed money on
easy terms
45% 28% 23% 27% 29%
Could not cope - 1% 1% - 1%
Dissaving 23% 33% 14% 8% 22%
Lease out assets 8% 7% 8% 14% 8%
Sold assets 7% 13% 14% 14% 12%
Grand total 100% 100% 100% 100% 100%
It is clear from the above discussion that health shocks and borrowing money at high
interests are two factors that hinder people’s economic mobility. Data shows that people
have to sell or lease out their assets to cope with financial costs. Nevertheless, it is harder
for the poorer to get back those assets that they either leased out or sold. The whole
process is like this. They fall in sickness that hampers their regular earnings, then they
either borrow money at high interests or sell/lease out their assets. And finally they spend
money to recover those assets. As a result, it becomes difficult for them to move out of
this trap.

70
The health condition of most of the respondents is average. Data shows that 58 per cent
respondents’ health conditions are fairly good and 26 per cent are fairly bad. The overall
health conditions of the respondents from the mover group are comparatively better than
others, even better than the rich, whereas fallers are in the worst situation. About a half of
the fallers’ health conditions are either fairly bad or very bad.
Table 2.26 Perception on health condition available in the community
Health Condition Mover Chronic rich Chronic poor Faller Grand Total
Excellent 8% 13% 4% 3% 8%
Fairly good 72% 58% 51% 45% 58%
Fairly bad 18% 22% 32% 39% 26%
Very bad 2% 6% 13% 13% 8%
Grand Total 100% 100% 100% 100% 100%
The highest 34 per cent respondents report that sometimes they get access to health
services. The movers and the chronic rich have comparatively better access to health
services. Among the four transition groups fallers have less access to health services even
than the chronic poor. Sixty-three percent fallers report that sometimes they can access
health services.
Table 2.27 Being able to access health service
Mover Chronic rich Chronic poor Faller Grand Total
Always 23% 35% 12% 7% 22%
Most of the time 28% 27% 21% 10% 24%
Sometimes 32% 28% 35% 63% 34%
Rarely 6% 5% 23% 16% 12%
Never 11% 5% 10% 3% 8%
Grand total 100% 100% 100% 100% 100%
The major reasons for not to being able to access health services are high expenses of
treatment and poor facilities. Sixty percent respondents report that they are unable to
access health services because treatment is too expensive which is highly significant.

71
Table 2.28 Factors making it difficult to be able to access health services
Factors Mover Chronic rich Chronic poor Faller Grand Total
Facilities have
inconvenient hours or often
closed
3% 2% 3% 2% 3%
Medical facilities to far 10% 21% 8% 16% 13%
Medical facilities to poor 22% 24% 20% 19% 21%
Treatment too expensive 64% 47% 67% 63% 60%
Others 1% 6% 2% 0% 3%
Grand total 100% 100% 100% 100% 100%
Pearson Chi-Square = 39.266(a), p = .000
2.3.8 Economic aspirations
The economic aspiration of 10 communities such as Darikhozekhani, Gilarchhala,
Daspara, Badalpara, Chitain, Arairashi, Char Kumaria, Ikumaribhati, Daxin Berabaria,
Uttar Gutuma is at the highest level. The key informant(s) and both the male and female
participants of FGDs on LoL think that the communities will be better of in the next 10
years, the next generation will be better off and the economic conditions in the
communities also will be better of by the next 10 years. In comparison with the net
prosperity index, it is found that among the above 10 communities, seven (Gilarchala,
Chitan, Char Kumaria, Uttar Gutuma, Arairashi, Badalpara, Daxin Berabaria) are high net
prosperous communities and the scores rang between 0.14 and 0.62. Char Belabo (0.35)
is found to be a high net prosperous community but the economic aspiration is
comparatively negative. Daspara and Ikumaribhati are found as low prosperous and the
scores are –0.05 and 0.11 respectively. Data suggests that both the economic aspiration
and MOP index are high among Char Kumaria, Daxin Berabaria, Arairashi, and Uttar
Gutuma. Though the MOP index is high among Modhupur, Char Belabo, Ghutia
Bisharikathi the community people’s aspirations are low. People of Patnipara, Gutia,
Bisharikathi and Madhupur have mixed views on the overall prosperity of their
community. But the people of Ranachandi believe that the situation will be worst off by
the next 10 years.

72
More than one-third of the respondents are somehow satisfied with their current economic
condition though the level of satisfaction varies among the four transition groups.
Satisfactions are high among the movers and always better off households. A contrary
scenario is found among the chronic poor and faller households.
Table 2.29 Satisfaction about economic condition
Level of satisfaction Mover Always better off Chronic poor Faller Grand Total
Fully satisfied 46% 38% 12% 7% 28%
Somewhat satisfied 39% 43% 34% 28% 38%
Neither satisfied nor
unsatisfied
9% 8% 16% 18% 12%
Somewhat unsatisfied 4% 9% 19% 30% 13%
Very unsatisfied 3% 2% 20% 16% 10%
Grand Total 100% 100% 100% 100% 100%
People have a good economic aspiration and would like to move forward by the next 10
years. About 92 per cent respondents want to see them in a better off position in future.
Considering the four transition groups, data shows that movers, the chronic poor and
fallers are more aspiring than the always better off households. Six per cent mover and
nine per cent rich respondents expected the situation will be the best of in the next 10
years.
Table 2.30 Change in economic condition over the last 10 years
Transition groups Better off Best off Worse off Grand Total
Mover 94% 6% 1% 100%
Always better of 90% 9% 1% 100%
Chronic poor 92% 3% 5% 100%
Faller 97% - 3% 100%
Grand Total 92% 6% 2% 100%
The respondents do not have better hopes only for themselves but also for their next
generations. Most of them think that their next generation will have a better economic

73
condition than the current situation. A very few respondents assume that the situation
would be worse off for their next generations.
Table 2.31 Economic aspiration by transition group
Transition groups Better off About the same Worse off
Mover 96% 4% -
Chronic rich 97% 2% -
Chronic poor 93% 5% 1%
Faller 93% 4% 3%
Grand Total 95% 4% 1%

74
SECTION III: HOW DO SOCIAL FACTORS AFFECT MOBILITY? This chapter will examine the types of social capital which are important to movements
out of poverty and whether such social capital varies among communities with high and
low levels of social stratification. The hypothesis is that in communities which are more
socially stratified, linking social capital will be more important to movements out of
poverty. In communities which are less socially stratified, bonding and bridging social
capital will be more important.
3.1. Social stratification
The study defines social stratification as:
Social stratification refers to institutionalized inequalities in power, wealth and status
between categories of individuals within a single social group (such as different castes,
ethnic or religious groups or different socioeconomic groups/steps of the ladder). 3.1.1. Measuring social stratification
There is very small information on social stratification of the communities in the initial
period (10 years ago). In order to divide the communities into high and low level social
stratification ones one question from the community profile questionnaire and another
from household the questionnaire have been selected to understand the difference
between the communities. The questions are i) what are the differences in characteristics
such as religion, social status or wealth between people living in the same community.
The same questions have been selected both from the community profile questionnaire
and the household questionnaire. From the household questionnaire the highest
percentage of responses have been considered.
On the basis of scoring according to these indicators 16 communities have been divided
into high/ low stratified communities (the high and low stratification is divided on the
basis of the median value) for the initial period.
There were 11 highly-stratified communities and 5 low stratified communities. The high
social stratified communities are: Gillarchala, Ranachandi, Badalpara, Bisharikathi,
Modhupur, Char belabo, Arirashi, Char kumari, Ghutia, Daxin Berabaria and Uttar
Guthuma. The remaining villages are socially low stratified communities. These are
Dorikhojekhani, Patnipara, Daspara, Chitain and Ikumaribhati.

75
In addition, from the Ladder of Life FGD by examining the characteristics of the top one
or two steps and in the mobility matrix it has been found that the stratification is very
similar. Among the high socially stratified communities the top one or two steps are
greatly different from the lower steps. In all the socially more stratified communities the
people of the highest steps were much wealthier, powerful or elite people. And very few
people were in this position.
Table 3.1: Characteristics of the top one or two steps of the ladder in the initial
period (10 years before) Community Characteristics of the top
one or two steps of the ladder
% Of people belong this step 10 years ago
Step High/low 10 years before
Dorikhujikhani Step variation was not much
2% Four Low
Gilarchalla Village leader or influential persons and higher class
10 years before None
Seven and eight
High
Patnipara Step variation is not much 8% Five & Six Low Ranachandi Step variation is not much 4% Five Low Badalpara Much wealthier .3% Eight High
(Medium) Bisharikathi Much wealthier
participate and give decision in local arbitration
10% Five High
Daspara Step variation is not much 2% Five Low Modhupur Much wealthier 1% Six High*
(medium) Char belabo Much wealthier 4% five High Chitain Much wealthier
Leader
3% difficult
five High (Medium)
Arairashi Financially strong, have
both money and property 4% six High
Char kumari Much wealthier leaders of their locality and do village salish;
8% Seven High (medium)
Aikumaribhatii Much wealthier, business of stocking rice, business of rajakar (unfair means business)
3% Five Low
Ghutia Similar 2% Low Berabaria Much wealthier 7% Six High Uttar Gutuma Much wealthier, politically
connected and influential 1% Six High

76
According to the LOL FGD in the initial period the high social stratified communities
were: Gillarchala, Badalpara, Bisharikathi, Modhupur, Char belabo, Chitain, Arirashi,
Char kumari, Daxin Berabaria and Utter Guthuma. The remaining villages were socially
low stratified communities. These were Dorikhujikhani, Patnipara, Ranachandi, Daspara,
Ikumaribhatii and Ghutia. By examining both the responses of questionnaires (the
community profile and the household questionnaire) and the Ladder of life it has been
found that most of the communities are identified to be of the similar category.
However in Ladder of Life Focus Group Discussion the difference between people in the
community has shown very clearly. And the findings of Ladder of Life Focus Group
Discussion are according to a group of people. Therefore it can be presumed that the
stratification based on Ladder of Life Focus Group Discussion (LOL FGD) is more
relatable. Hence to divide the communities into high and low more emphasis have been
given on the findings of Ladder of Life. In the initial period the high and low stratified
communities were as below.
Table 3.2 : Community stratification in initial period (10 year ago) Community High social stratified
community Community Low social stratified
community Gillarchala High Dorikhujikhani, Low Badalpara High Patnipara, Low Bisharikathi High Daspara, Low Modhupur High Ikumaribhatii Low Char belabo High Ghutia. Low Chitain High Ranachandi Low Arirashi High Daxin Berabaria High Char kumari High Utter Guthuma High
3.1.2. Relationship between prosperity (moving out of poverty) and social stratification
Table 3.3 : Percentage of households in socially high/low stratified communities by four transitional groups (individual self-perception OPL H706)
In initial period Mover (%) Always Rich (%)
Chronic poor (%)
Faller (%)
High stratified communities
89.53 77.89 73.75 79.10
Low stratified communities
10.47 22.11 26.25 20.90
Total 191 303 301 67 Chi2 =18.0496, p=0.000

77
A cross-tabulation of the level of social stratification by self-perception of transition in
poverty status, as presented in Table 3.3, reveals that the percentage of movers is higher
in the communities which were more stratified in the initial period than in socially less
stratified communities. In high-stratified communities the percentage of movers is highest
percentage 90 percent. And the percentage of chronic poor is lowest (74%). In the low
stratified communities the percentage of chronic poor is highest (26 percent). And the
percentage of movers is lowest (10%). However among the always rich, the chronic poor
and the faller groups, the difference is not much.
By examining the net prosperity index and social stratification it has been shown that high stratified communities have positive influence on communities net prosperity. Table 3.4: Net prosperity and social stratification
High net prosperity Medium net prosperity Low net prosperity Communities Level of
social stratification
Communities Level of social stratification
Communities Level of social stratification
Gillarchana High Badalpara High Patnipara Low Chitain High Arairashi High Ranachandi Low Char Kumaria High Ikumaribhati Low Bisharikhathi high Uttar Guthuma High Dorikhojikhani Low Daspara Low Char Belabo High Daxin Betabaria High Modhupur high Ghutia Low Comparing with net prosperity index it has been found that in high net prosperity cell all
communities are socially high-stratified communities in initial period. In medium
prosperity cell there are two communities are low social stratified communities. In low
net prosperity cell there are six communities and out of these six communities four
communities are low stratified communities. The findings reveal that there is a link
between social stratification and high net prosperity of the communities. Because the
level of social stratification is higher in high net prosperity communities. And among the
low net prosperity communities the level of social stratification is lower.
3.2. Social Capital
In this study social capital refers to the norms and networks that enable people to act
collectively.

78
3.2.1. Measuring social capital:
There is no widely held consensus on how to measure social capital, which is one of its
weaknesses (net). Several recent innovative studies have attempted to quantify social
capital and its contribution to economic development (Wooklcock and Narayan, 2000).
According to the Communitarian View the number and density of the groups in a given
community, hold that social capital is inherently good, that more is better, and that its
presence always has a positive effect on a community's welfare.
While classifying the communities as having high and low levels of social capital in the
initial period three types of information have been chosen from the community profile
questionnaire to understand the difference between the communities. Firstly, the number
and types of local groups or associations, networks and organizations that existed 10
years ago. Secondly, the number of communal activities / meetings held 10 years ago and
the types of the people attending these meetings. Thirdly, likeliness of collective action
for resolving community problems (e.g. around water shortage and unfortunate thing that
happened to someone) and parents teacher association 10 years ago.
The number and types of local groups or associations, networks and organizations
10 years ago
In measuring social capital, it is common to take the sum of society's membership of its
groups. To divide the community into high and low levels of social capital the total
number of groups or associations, networks and organizations are added. In eight
communities the total number of groups or associations, networks and organizations were
7 and above. There was no group in one community (Modhupur) ten years ago.
The number of communal activities/meetings 10 years ago
In the initial period in eight communities communal activities and meetings were held.
And in reaming eight communities no communal activities or meeting were held. In
classifying the communities as having high and low levels of social capital some
questions regarding communal activities /organizing meetings have been chosen. The
questions are: ten years ago, were there organized meetings of residents to discuss
community issues? What percentage of village residents attended? What percentage of
participants were women? Was the attendance concentrated in certain ethnic, religious

79
or language groups? The score have given 1 if there was any meeting held. In case of
percentage of village residence, percentage of women attended in the meeting for 1%
to25% 1 has scored, 26% to 50% have scored 2, for 51% to 75% have scored 3 and for
76% to 100 have scored 4 (appendix table--).
Likeliness of collective action for resolving community problems (around
water shortage, unfortunate happening and parents- teachers associations) 10 years ago
The questions of resolving community problems such as if there was a problem with
getting enough water and unfortunate happen to someone such as a serious illness, house
burning down assessment rating of these questions have been chosen. In these questions
the code, very likely have scored 4 and likely have scored 3, unlikely 2 and for very
unlikely for 1. If there is presence of a parent-teacher association in the village than it has
scored 1.
After combining the information (scoring) of local groups or association, the number of
communal activities/ meetings, likeliness of collective action for resolving community
problems (around water shortage) and presence of parents- teachers associations it is
found that ten communities have high levels of social capital and the remaining eight
communities low level of social capital. In the initial period the high social capital communities were Dorikhojekhani, Gilarchala,
Ranchandi, Badalpara, Char Belabo, Chitain, Arairashi, Char Kumaria, Ikumaribhatii and
Uttar Guthuma. And the low level social capital communities were Patnipara, Bisarikathi,
Daspara, Madhupur, Ghutia and Daxin Betabaria.
3.2.3 Importance of social capital to community prosperity:
To understand how level of social capital factor to move out of poverty? Level of social
capital and net prosperity index2
2 Net Prosperity Index: that shows the extent of net upward mobility (upward minus downward) in a community (according to the Ladder of Life Matrix)
has been examined.

80
Table 3.5: Net prosperity and social capital
High net prosperity Medium net prosperity Low net prosperity Communities Level of
social capital Communities Level of
social capital Communities Level of
social capital Gillarchana High Badalpara High Patnipara Low Chitain High Arairashi High Ranachandi High Char Kumaria
High Ikumaribhati High Bisharikhathi Low
Uttar Guthuma
High Dorikhojikhani High Daspara Low
Char Belabo High Daxin Betabaria Low Modhupur Low Ghutia Low Comparing the prosperity index it has been found that in the high net prosperity cell out
of five communities all were initially high social capital communities. In the medium net
prosperity cell there is one community having low social capital. The other four
communities were high social capital communities.
Among the low net prosperity communities there is one village, which is high social
capital community in the initial period. The reason is probably that in Ranachandi the
number of groups and associations is high and but ten years ago there was no communal
activities or organized meeting of residents to discuss community issues for the benefit of
the village among the community people. The community people were not likely to
resolve community problems such as getting water or serious illnesses or house burning.
Therefore it could be concluded that the social capital may be effective if there presence
of group, communal activity and cooperative relations (for resolving problems) among
people.
Moreover, in high social capital communities, the percentage of movers is higher (Table-
3.6).
Table 3.6: Percentage of households in high/low social capital communities by four transitional groups (individual self-perception OPL, H706)
In initial period Mover (%)
Always Rich (%)
Chronic poor (%)
Faller (%)
High social capital communities
87.96 84.49 77.74 83.58
Low social capital communities
12.04 15.51 22.26 16.42
Total 191 303 301 67 Chi2 =9.6261, p= 0.022

81
The findings suggest that there is a significant relation between social capital and the probability of moving
out of poverty. The percentage of movers in initially high social capital communities was much higher
(88%) than that of the initially low social capital communities (12%). And compared with the chronic poor
the percentage of movers is nearly 10% higher. The findings reveal that social capital thus plays an
important role in shaping the economic transition status of communities.
The qualitative findings have also revealed that social capital has a very positive impact
on the economic condition. In the FGDs on Community Timeline in nine communities the
key informants have mentioned that in the past ten years the top two most important
events or factors that have a positive effect on the economy or prosperity of the
community and movements out of poverty are the development of NGOs.
Similarly in the Ladder of Life FGDs in seven communities the FGD participants have
stated that NGOs activities are the most important factors that have helped the
communities to prosper. In the FGD of Charbelabo the male participants have mentioned
"Grameen Bank, PROSHIKA, BRAC, ASA and some other local NGOs who are
providing micro credit activities in this village. These organizations are mostly providing
loan for vegetable cultivation, small trade and to buy rickshaws and vans. The support of
micro credit benefited most of the poor people. About 80% people of this village are
involved with these micro finance organizations". In Charkumaria the female participants
have stated, " Earlier, the people of the village passed time sitting idle, now they work.
They can easily get loan from the NGOs. Moreover, BRAC and PROSHIKA have
provided various trainings to the men and women of the village. In this way, people have
become aware than before. They can realize the importance of education. Therefore, they
consider mass education and the NGO activities as the important factors in their
development. " In this connection Samina Aktar (Uttar Guthuma, Female participant)
said: “The women who have no husbands or who have no male member to earn a living
or who are poor ─ they all are taking loans from the NGOs like BRAC, ASA and thereby
changing their condition". The male participants of Ikumaribhati have said, "Now both
men and women are working inside and outside the homesteads due to the existence of
NGOs. I pull a rickshaw outside and my wife is rearing cows and chickens taking loan
from the NGOs. We have been benefited due to the NGOs".

82
Similarly out of sixteen communities in twelve communities the participants of Ladder of
Life have mentioned that the help from NGOs is one of the main reasons for their move
up being able. Community poverty line to the male FGD of Bisharikati Kamal Mridah
said, “ If the group just below the CPL can get loan from the NGOs, with that credit they
could buy fishing nets, could do fishing in the river; they also have some cultivable land
where they can produce crops. They could easily save something if they want. They could
also improve their condition by buying cows, goats, hens etc with the credit they took
from the NGOs".
In three communities the respondents have mentioned that getting remittance from
relatives from abroad is another factor, which help the community to prosper. According
to the respondents of Daxin Batebaria, "Those who go abroad from the village, earn
money and send it back home. With the remitted money, they buy lands, construct
buildings to replace the tin shed houses, send children to schools for studies, and develop
the village". In the Ladder of life FGD in three communities one of the main reasons of
moving above the poverty line is receiving remittance from relatives.
These evidences support that in the prosperity of the community social capital have a
positive effect on moving out of poverty.
As the findings indicate that social capital has a positive role of moving out of poverty.
Hence it is important to examine the types of social capital which are important for
movements out of poverty. The types of social capital which are important for
movements out of poverty will vary among communities with high and low levels of
social stratification.
3.3. The interaction between social capital and social stratification
The interaction between social capital and social stratification in the initial period the
findings reveals that in high social capital and high social stratified communities of initial
period the percentage of movers is highest, that is 83% (Table: 3.9).

83
Table 3.7: Percentage of high/low social stratified and social capital communities’ households by four transitional groups (individual self-perception)
In the initial period Mover (%)
Always rich (%)
Chronic poor (%)
Faller (%)
Total
High social stratified and high social capital communities
83.25 70.30 63.12 70.15 609
High social stratified and low social capital communities
4.19 6.27 7.31 7.46 54
Low social stratified and high social capital communities
6.81 15.51 17.94 14.93 124
Low social stratified and Low social capital communities
5.76 7.92 11.63 7.46 75
Total 191 303 301 67 862 Chi2 =24.4482, p= 0.004
The next highest is in the low social stratified and high social capital communities—7%
households are movers. The finding reveals that both high social capital and high social
stratification have a positive impact on moving out of poverty. However social capital
may have a more positive effect on moving out of poverty because the percentage of
movers is the second highest in low social stratified and high social capital communities.
On the contrary in low social stratified and low social capital communities the percentage
of the chronic poor is higher (12%). In high social stratification and high social capital
communities the rate of the movers is highest because in these communities people have
more access to opportunities and services. And most of these communities have NGO
activities. Therefore the people of these communities have more access to loans for
starting economic activities, which helps them to improve their economic condition.
3.4. Most prevalent type of social capital present
This study examines three types of social capital such as bonding social capital, bridging
social capital and Linking social capital
Bonding social capital includes formal and informal ties among people of similar
backgrounds, such as relatives, friends and neighbors as well as more established
local groups like a burial society or dairy cooperative. Relationships with a
spouse’s family members (i.e. in-laws) would be bonding social capital.

84
Bridging social capital refers generally to ties among people who are unlike each
other. For purposes of this study, we would like this to indicate horizontal ties
among people with differences but who are basically of the same status or level of
socioeconomic well-being. For instance, this might be different livelihood
groups, such as a farmer’s group linking with a watershed management group, or
among people of different religious or ethnic backgrounds but who otherwise have
similar levels of well-being. Additionally, relationships with family members,
relatives and friends far outside the community should be classified as bridging.
Linking social capital refers to vertical ties among people of different status, such
as between a patron and client, a doctor and a patient, or a teacher and a student.
Another example of linking is relationships with NGOs and government officials.
Extent and most prevalent type(s) of social capital which have emerged as important
for movers, the always rich, the chronic poor and fallers
This part of the report will explain whether bonding, bridging and linking social capital
performs a different function in less stratified communities than in the more stratified
ones for movers, the always rich, the chronic poor and fallers. To understand the most
prevalent type of social capital in household level the data of i) the type of social groups
or associations, ii) Source of credit, iii) Interaction of the group members and communal
activities and iv) Source of information have been used.
3.4.1. The type of social groups or associations:
The communitarian perspective equates social capital with such local organizations as
clubs, associations, and civic groups. This study has also examined the groups and
associations to understand the type of social capital which is prevalent and important for
moving out of poverty.

85
Table 3.7: Percentage of household memberships in different groups by four transition groups (individual self-perception OPL, H706)
Mover (%) N=191
Always Rich (%) N=303
Chronic poor (%) N=301
Faller (%) N=67 χ2 test
Financial group 43 34 38 46 P =0.14 Political group 09 18 06 15 P=0.00 Main economic activities
08 07 05 09 P=0.07
Health and education 04 09 03 00 P=0.00 Religion group 03 09 05 06 P=0.14
Total=862
The financial groups are the most common groups in the communities. The main financial
groups are NGO groups and some local samitis. Nearly 90% groups are NGOs groups.
The main NGOs are ASA, Grameen Bank, BRAC, PROSHIKA, RDRS and some small
local NGOs. Some people are members of Krishi Bank, the Government Bank from
where the farmers get loans after forming a group. Among the four transitional groups the
fallers are the highest number (46%) of members of the financial group, because most of
the NGOs disburse loans for the poor people. And the reason may be from the intention
of improve economic situation the fallers group took loan from NGOs more. The next
highest (43%) movers are members of the financial group. These findings have
suggested that after getting access to loans, people can move of chronic poverty. From the
ladder of life and in the individual life stories it has been found that by getting NGO loans
many people move out of poverty. In the Ladder of life Focus Group Discussion in
Dorikhojekhani the participants have mentioned that at each step people could move out
"if they could get any source of loan". That means, to begin any income-generating work
they need some amount of money. Scarcity of capital is one of the common obstacles to
upward movement. In all steps they have also said, "if they can start a business they can
move up”.
In the four transition groups some are also the members of more than one financial group.
Among the movers the highest percentage of people (13%) are members of more than one
financial groups. The next is among the fallers—12% are members of two or more than
two financial groups.
The always rich people are the highest proportion of members of political groups (18%).
The FGDs of LFPDL also reveal that the politically powerful people are the rich. The

86
next largest group is the fallers group. Among them 15% people are members of the
political group. Only 6% of the chronic poor are participants of the political group. The
findings suggest that there is a relation between political and economic condition. The
rich people are over represented in the political group.
Some people belong to the groups which are related to their main economic activities, for
example, farming, fishing, trade etc. The highest percentage of people of the movers
group (8%) are in this group. In Char kumaria, Badalpara and Uttau Guthuma economic
activity group have been reported more than elsewhere.
The members of the health and education group is highest (9%) among the always rich
group. The next is among the movers (4%). Very few people (3%) from among the
chronic poor and none from the faller is in members of health and education group.
Very few households are members of the religious group. Overall, in 16 villages only 6%
people are members of the religious group. Among the four transition groups the always
rich have the highest percentage (9%) of members of religious groups. And the next is the
fallers (6%). Apart from these, members of ethnic and others groups are very rare.
Overall the data suggest that the highest percentage of people in four transition groups are
members of the financial group. It is not that the highest percentage of people are members of the financial group or
association the financial group is also most important as reflected in the table below
(Table 3.8). Table 3.8: Percentage of households currently belonging to the most important
group by four transition groups (individual self-perception OPL, H706),
Mover (%)
Always Rich (%)
Chronic poor (%)
Faller (%)
Financial group 73 53 76 58 Political group 10 22 07 25 Production and trade based group
11 05 04 03
Health and education 02 07 03 06 Religion group 03 11 04 06 Ethnic 00 01 02 03 Others 02 02 03 00 Total 104 167 148 36
N=455, chi2=46.3242, p=0.000
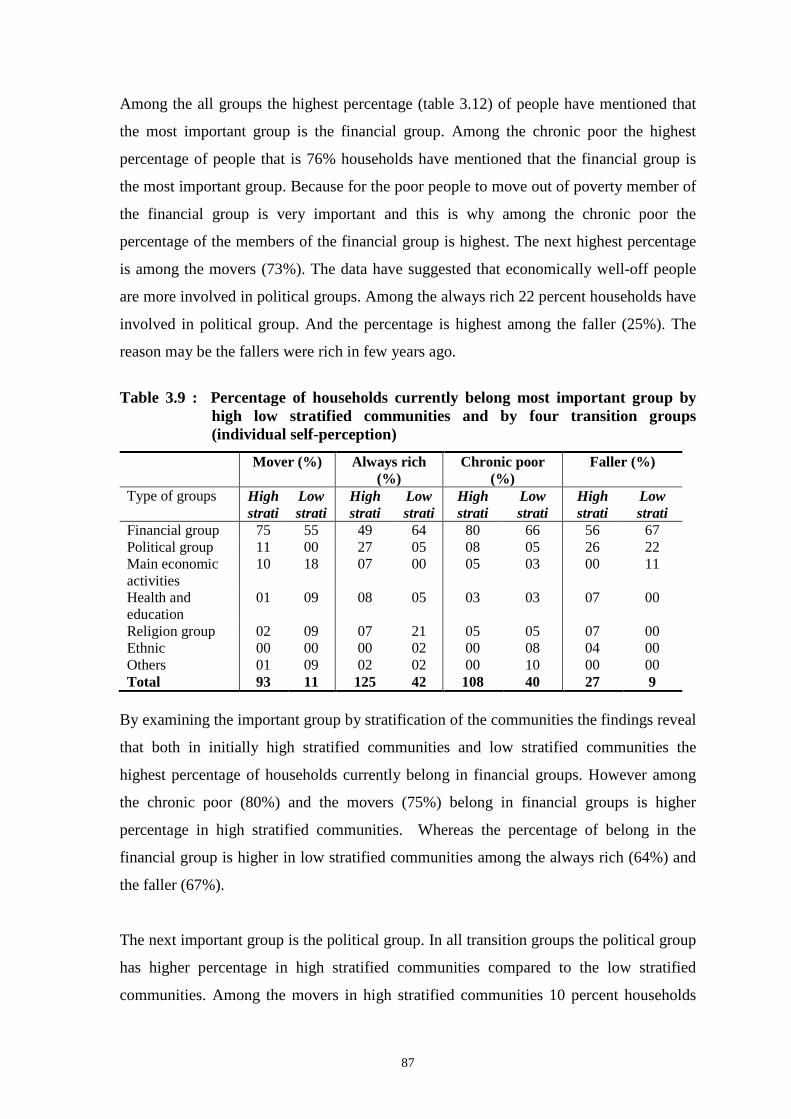
87
Among the all groups the highest percentage (table 3.12) of people have mentioned that
the most important group is the financial group. Among the chronic poor the highest
percentage of people that is 76% households have mentioned that the financial group is
the most important group. Because for the poor people to move out of poverty member of
the financial group is very important and this is why among the chronic poor the
percentage of the members of the financial group is highest. The next highest percentage
is among the movers (73%). The data have suggested that economically well-off people
are more involved in political groups. Among the always rich 22 percent households have
involved in political group. And the percentage is highest among the faller (25%). The
reason may be the fallers were rich in few years ago.
Table 3.9 : Percentage of households currently belong most important group by
high low stratified communities and by four transition groups (individual self-perception)
Mover (%) Always rich (%)
Chronic poor (%)
Faller (%)
Type of groups High strati
Low strati
High strati
Low strati
High strati
Low strati
High strati
Low strati
Financial group 75 55 49 64 80 66 56 67 Political group 11 00 27 05 08 05 26 22 Main economic activities
10 18 07 00 05 03 00 11
Health and education
01 09 08 05 03 03 07 00
Religion group 02 09 07 21 05 05 07 00 Ethnic 00 00 00 02 00 08 04 00 Others 01 09 02 02 00 10 00 00 Total 93 11 125 42 108 40 27 9
By examining the important group by stratification of the communities the findings reveal
that both in initially high stratified communities and low stratified communities the
highest percentage of households currently belong in financial groups. However among
the chronic poor (80%) and the movers (75%) belong in financial groups is higher
percentage in high stratified communities. Whereas the percentage of belong in the
financial group is higher in low stratified communities among the always rich (64%) and
the faller (67%).
The next important group is the political group. In all transition groups the political group
has higher percentage in high stratified communities compared to the low stratified
communities. Among the movers in high stratified communities 10 percent households
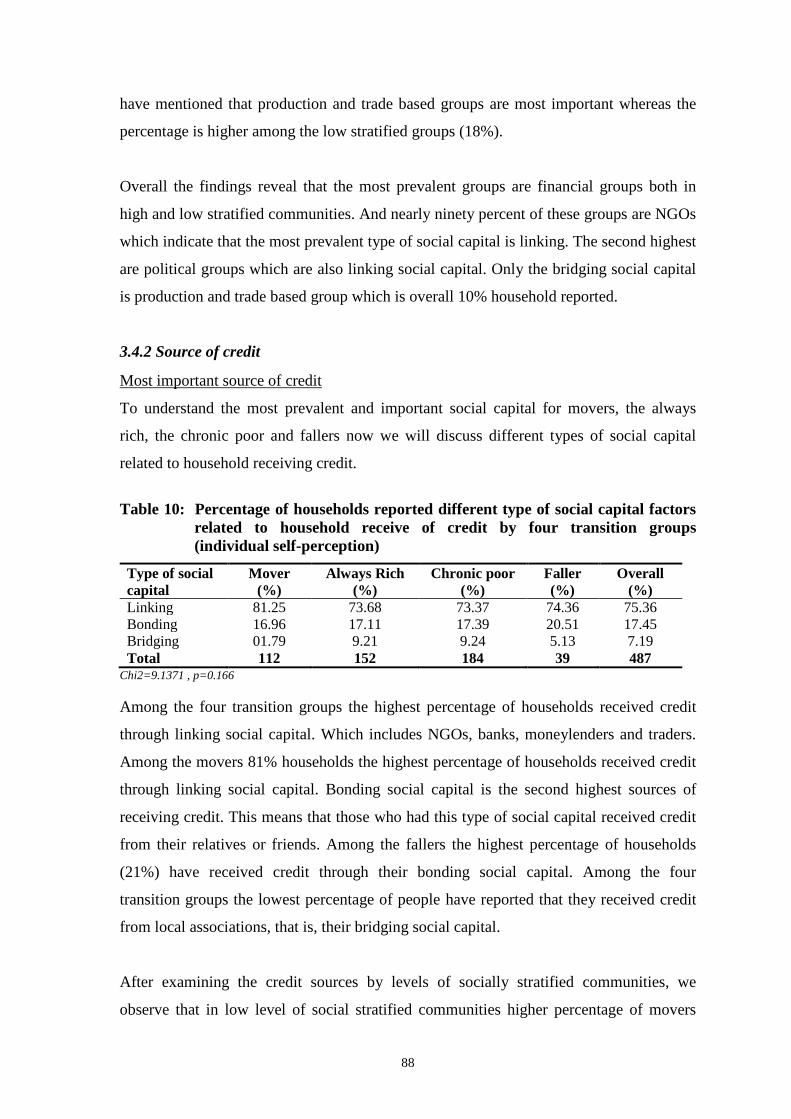
88
have mentioned that production and trade based groups are most important whereas the
percentage is higher among the low stratified groups (18%).
Overall the findings reveal that the most prevalent groups are financial groups both in
high and low stratified communities. And nearly ninety percent of these groups are NGOs
which indicate that the most prevalent type of social capital is linking. The second highest
are political groups which are also linking social capital. Only the bridging social capital
is production and trade based group which is overall 10% household reported.
3.4.2 Source of credit
Most important source of credit
To understand the most prevalent and important social capital for movers, the always
rich, the chronic poor and fallers now we will discuss different types of social capital
related to household receiving credit.
Table 10: Percentage of households reported different type of social capital factors
related to household receive of credit by four transition groups (individual self-perception)
Type of social capital
Mover (%)
Always Rich (%)
Chronic poor (%)
Faller (%)
Overall (%)
Linking 81.25 73.68 73.37 74.36 75.36 Bonding 16.96 17.11 17.39 20.51 17.45 Bridging 01.79 9.21 9.24 5.13 7.19 Total 112 152 184 39 487
Chi2=9.1371 , p=0.166 Among the four transition groups the highest percentage of households received credit
through linking social capital. Which includes NGOs, banks, moneylenders and traders.
Among the movers 81% households the highest percentage of households received credit
through linking social capital. Bonding social capital is the second highest sources of
receiving credit. This means that those who had this type of social capital received credit
from their relatives or friends. Among the fallers the highest percentage of households
(21%) have received credit through their bonding social capital. Among the four
transition groups the lowest percentage of people have reported that they received credit
from local associations, that is, their bridging social capital.
After examining the credit sources by levels of socially stratified communities, we
observe that in low level of social stratified communities higher percentage of movers

89
received credit through linking social capital than in high socially stratified communities
compare 94% in low level of socially stratified communities with 79%in high socially
stratified communities. However among the movers in high stratified communities those
who have received credit though bonding social capital is higher, that is 19%. On the
other hand in low stratified communities the percentage is 13%. Credits received through
bridging social capital is very low both in high and low stratified communities (7% in
high stratified and 6% in low stratified communities).
Overall, in both the communities with high and low level of social capital majority of
people have received credit through linking social capital. However the percentage is
more in low social stratified communities (over all 80% in low stratified communities and
74% in high stratified communities).
Among all the sources linking social capital is the most important one. If we examine the
different source of linking social capital the data show that among the four social capital
sources the percentage of NGO is predominantly high (Table 3.11).
Table 3.11: Percentage of households reporting linking social capital factors related to
households receiving of credit by four transition groups
Mover (%)
Always Rich (%)
Chronic poor (%)
Faller (%)
Overall (%)
NGO 50.00 32.89 52.17 51.28 45.59 Commercial / government bank
20.54 25.66 10.87 12.82 17.86
Moneylender 09.82 13.16 9.78 10.26 10.88 Trader/store 00.89 01.97 00.54 00.00 01.03 N 112 152 184 39 487
Chi2=30.1893, p=0.036 The highest percentage of the chronic poor (52%) have got loans from NGOs. The
percentage is nearly the same for among the fallers 51%. The next largest groups is
movers among them 50% households received credit from NGOs. A lower proportion of
always rich households (32%) have reported to receive credit from NGOs. The reason
may be that only the poor people eligible to access NGO credit. And by using this credit
some people move out of poverty therefore the percentage is also high among the mover
households. There are many Individual Life Stories where it has been shown that by
getting loans people have moved out of poverty. See the example in the box.

90
Hanufa (aged 40, mover, household ID 06334, Person ID 02) In 1995 I became a member of ASA, an NGO and took a loan of Taka 500. I also brought Taka 200 from my father. With a total of Taka 700, I started goat rearing. Over four years the capital increased and with that money I bought some cows. I sold the milk of my cow and made a good profit. By using this money I bought three gondas of land. In 1999 again I became a member of ASA. Now I have taken a Taka 25000 loan from this samiti (co-operative). In 2002 I became a member of a co-operative somiti in Sreepur and I took loans three times each time of about Taka 8000 - 1000. In 2003 I became a member of Grameen Bank and of "Polli Daridro Bimochon Federation (PDBF) in 2004. At present I am president of a somiti. Now I rear cows and sell milk. By selling milk I earn Taka 600 - Taka 1000. I also rear chicken, ducks and goats. Hanufa scored her occupational well-being + 5 from 2002 to 2005.
The highest percentage (25%) of always rich people have stated that they have received
credit from commercial or government banks. The poor people have less access to banks.
It is only from the Krishi Bank (for agricultural support) that they get credit. The farmers
arrange a group and the group get credit together. Among the fallers 13 percent and
among of the chronic poor 11 percent people have mentioned that commercial or
government banks as a source of received credit. Moneylenders are another source of
credit overall 11 percent households have reported this source. Received loan from
traders and storekeepers have reported very rarely.
Table 3.12:Percentage of households reporting linking social capital factors related
to households receiving of credit by high /low stratified communities and by four transition groups
Mover (%) Always rich (%)
Chronic poor (%)
Faller (%)
High strati
Low strati
High strati
Low strati
High strati
Low strati
High strati
Low strati
NGO 46.88 68.75 30.56 38.64 51.20 54.24 53.13 42.86 Commercial / government bank
22.92 06.25 25.00 27.27 11.20 10.17 15.63 0.00
Moneylender 08.33 18.75 11.11 18.18 09.60 10.17 06.25 28.57 Trader/store 01.04 - 02.78 - 00.80 - 00.00 - Total 96 16 108 44 125 59 32 07
In all groups the highest percentage of people have received loan from NGOs. Among the
always rich the percentage of received loan from commercial bank is not varied much
between the high and low stratified communities. Whereas among the movers and fallers
the percentage of received loan from commercial government bank have much differ

91
between high stratified and low stratified communities. Among the movers in high
stratified communities 23 percent household have reported the source of credit is
commercial government bank whereas the percentage is much lower in low stratified
communities which is only 6 percentage. Similarly among the fallers only from high
stratified communities people have access to get loan from government commercial bank.
In all transitional group received loan from moneylender have reported higher proportion
of people in low stratified communities. The findings reveals that in high stratified
communities people have more options to get credit form different sources in other words
in high stratified communities people have different types of linking social capital.
Whereas in low stratified communities apart NGOs and moneylender people have less
access to receive credit from different sources.
Important source of business loan: Table 3.13: Percentage responses of receiving of credit for business by four
transition groups
Mover (%)
Always Rich (%)
Chronic poor (%)
Faller (%)
Overall (%)
Linking 71 78 76 50 74 Bonding 25 19 22 50 24 Bridging 03 03 02 00 03 Total 55 72 59 12 198
The data shows that overall nearly three fourth people have received credit for business
through their linking social capital. And in all transitional groups the percentage is
highest. The most common linking sources are NGOs, government bank and
moneylender. However overall 40% (Appendix ---Table h232) people have taken loan
from NGOs. Among the movers highest percent (47%) people have got loan from NGOs.
The next highest source of business loan is bonding social capital. Among the fallers fifty
percent people have taken credit through bonding social capital, which include relatives
and friends. Very few people reported bridging social capital as source of business loan,
overall only three percent.
Both in high and low stratified communities the pattern is the same. However in low
social stratified communities linking social capital reported more, 80% in the low
stratified communities and 71% in high stratified communities.
Received credit for major event

92
To understand the most prevalent type of social capital in the past 10 years households
borrow credit for a major household event such as a marriage, a sickness or a funeral also
examine.
Table 3.14: Percentage of households reporting receiving of credit for major events
by four transition groups
Type of social capital
Mover (%)
Always Rich (%)
Chronic poor (%)
Faller (%)
Overall (%)
Bonding 62.71 64.86 45.45 30.30 52.01 Linking 33.90 29.73 50.76 51.52 42.28 Bridging 0.00 01.35 1.52 0.00 1.01 Others 3.39 4.05 2.27 18.18 4.70 N 59 74 132 33 298
Chi2=30.433', p=0.000 Majority of movers and always rich people get loan through bonding social capital for
major family event such as a marriage, sickness or funeral. People get loan from bonding
social capital without interest.
The similar findings also mentioned in "The voices of the poor" The experience of the
poor as described in the various PPAs emphasize the importance of the kingship networks
for daily survival as well as for crisis management. In Guatemala the family's response to
crises is to approach relatives and friends with whom they enjoy a reciprocal relationship.
Those individuals give small loans to cover the cost of medicines, doctors' fees, and trans
port to medical facilities, or to provide small amounts of foodstuffs in instances of dire
necessity (Guatemala 1997b, cited in Voices of the poor).
However among the chronic poor and the faller half of the households have reported that
for major family event they received loan through their linking social capital. This
findings reveals that the relatives and friends of the chronic poor and the fallers also
similar economic group. Therefore the access through bonding social capital chronic poor
and the faller is less. For the family they bound to take loan through linking social capital.
And the main linking sources are money- Leander and NGOs. Both the fallers and
chronic poor mainly reported (21%) these two sources. The findings is similar both in
high and low stratified communities.

93
3.4.3. Interaction and communal activities
The findings have shown that the majority of the most important groups work or interact
with groups outside the village. Only 20% groups have no interaction with outside the
village. Both the movers and the chronic poor are the highest percentage (61%) reported
that the group work or interact with groups outside the village frequently. In the high
stratified communities 82% households have reported that the groups they
involved/members are interaction with outside the village whereas the percentage is less
in low social stratified communities 76%. In high stratified communities the distribution
is very similar among the four transition groups. However in socially low level of
stratified communities cent percent movers are members of the groups which interact
with groups outside the village occasionally or frequently. Whereas only 33 percent faller
reported this. This indicates that the interaction of the groups is very important for
moving out of poverty. The finding suggests that the groups which have interaction or
work with outside the village the members of that group have more probability to move
out of poverty. In addition this data also indicate that linking social capital is more
important to move out of poverty.
Contact with leaders: Table 3.15: Percentage of Household reported main sources of market information
by four transition groups (individual self-perception OPL, H706)
Mover (%)
Always Rich (%)
Chronic poor (%)
Faller (%) N χ2 test
Contact with national politician
13.61 21.12 11.63 16.42 862 P=0.01
Contact with local politician
12.57 25.74 7.97 17.91 862 P=0.00
The always rich group have most prevalently reported that in the last 10 years they meet
with a local and politician, call him or sent a letter. Similarly they have also reported most
prevalently highest percentage connections with national level politician.
Among the always rich highest percentage of people have contact with national and local
politician. The second highest percentage is reported by the fallers (16%). Overall the
findings reveals that economically well-off people have more linking type of social
capital within local level and national level.
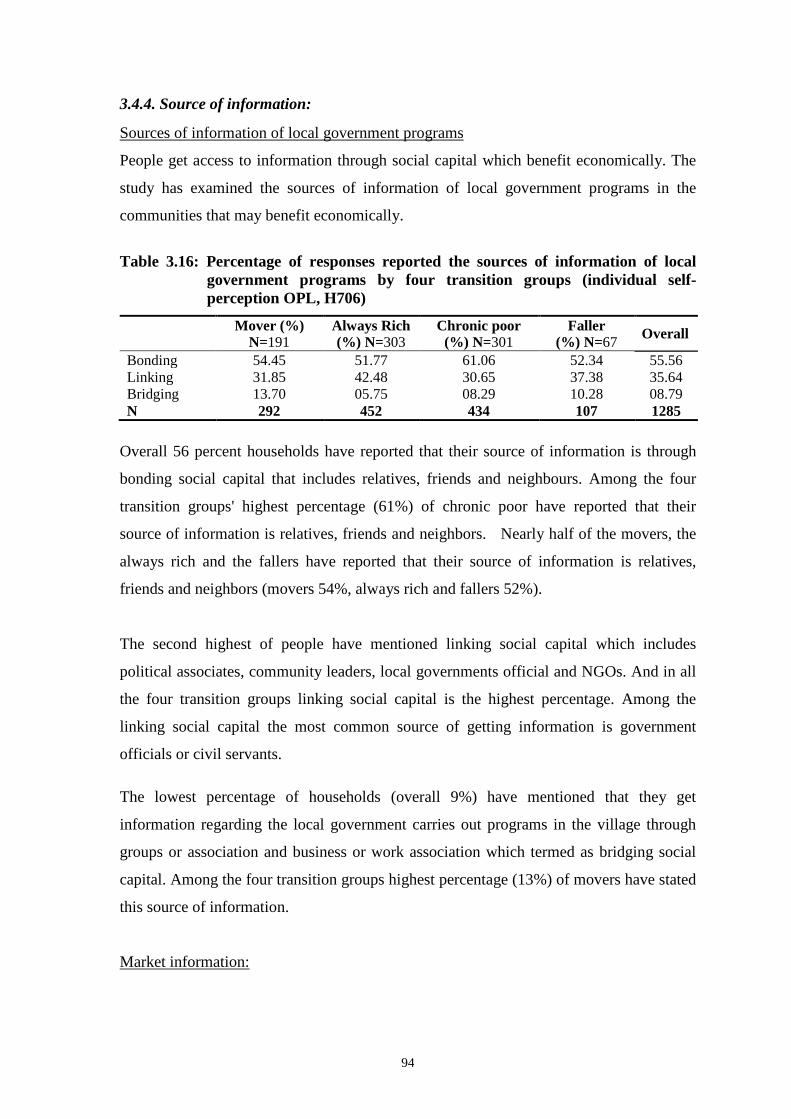
94
3.4.4. Source of information:
Sources of information of local government programs
People get access to information through social capital which benefit economically. The
study has examined the sources of information of local government programs in the
communities that may benefit economically.
Table 3.16: Percentage of responses reported the sources of information of local
government programs by four transition groups (individual self-perception OPL, H706)
Mover (%) N=191
Always Rich (%) N=303
Chronic poor (%) N=301
Faller (%) N=67 Overall
Bonding 54.45 51.77 61.06 52.34 55.56 Linking 31.85 42.48 30.65 37.38 35.64 Bridging 13.70 05.75 08.29 10.28 08.79 N 292 452 434 107 1285
Overall 56 percent households have reported that their source of information is through
bonding social capital that includes relatives, friends and neighbours. Among the four
transition groups' highest percentage (61%) of chronic poor have reported that their
source of information is relatives, friends and neighbors. Nearly half of the movers, the
always rich and the fallers have reported that their source of information is relatives,
friends and neighbors (movers 54%, always rich and fallers 52%).
The second highest of people have mentioned linking social capital which includes
political associates, community leaders, local governments official and NGOs. And in all
the four transition groups linking social capital is the highest percentage. Among the
linking social capital the most common source of getting information is government
officials or civil servants. The lowest percentage of households (overall 9%) have mentioned that they get
information regarding the local government carries out programs in the village through
groups or association and business or work association which termed as bridging social
capital. Among the four transition groups highest percentage (13%) of movers have stated
this source of information.
Market information:

95
Table 3.17: Percentage of responses reported main sources of market information by four transition groups (individual self-perception OPL, H706)
Type of social capital
Mover (%)
Always Rich (%)
Chronic poor (%)
Faller (%) Overall
Bonding 70.72 77.81 78.90 79.45 76.62 Bridging 21.62 17.22 15.90 12.33 17.42 Linking 07.66 04.97 05.20 08.22 5.95 N 222 302 327 73 924
What type of social capital will be used depends on the nature of the purpose. The
findings reveal that the bonding social capital is the most important source of getting
market information such as prices of goods, crops, input etc. Overall more than 75
percent people get the market related information through their friends, relatives (who
live near by) and neighbors. Most of the Focus Group Discussions (FGD) on livelihoods,
freedom, power, democracy and local governance (LFPD) also reveal similar findings.
Among all the transition groups the highest percentage (79%) of fallers and the chronic
poor households have reported that the main source of market information is from the
relatives, friends and neighbors. And the next highest is the always rich group (78%).
However the percentages do not vary much among the four transition groups. The next
highest percentage of people get the market information through their bridging social
capital, which include groups/associations and business or work associates. Among the
four transition groups the movers are the highest percentage (22%) who get market
information by their birding social capital. This type of social capital has been mentioned
by the lowest percentage of faller. Very few people have mentioned the linking type of
social capital as one of the main sources of getting market information. The pattern is
vary similar between high and low social stratified communities.
The findings suggest that there is a significant relation between social capital and the
probability of prosperity. Among the high net prosperity communities all were initially
high social capital communities. There is one community with having low social capital
among the medium net prosperity communities. And among the low net prosperity
communities apart one all were low social capital communities in initial period.
Moreover, in high social capital communities, the percentage of movers is higher. The
percentage of movers in initially high social capital communities was much higher (88%)
that of the initially low social capital communities (12%). And comparing with the
chronic poor the percentage of movers is nearly 10% higher. The findings reveals that

96
social capital thus plays an important role in shaping the economic transition status of
communities.
The discussion of members of social groups or associations, it can be inferred that at the
household level linking social capital is the most prevalent type of social capital both in
high and low stratified communities. Though the general hypothesis is: in communities
which are more socially stratified linking social capital will be more important for
movements out of poverty. In communities, which are less socially stratified bonding and
bridging social capital will be more important. However, in this study the findings have
suggested that in the low socially stratified communities the economic situation of most
of the people are bad. Therefore to improve their economic situation bonding social
capital does not work much. To improve the economic situation linking social capital
plays vital role in low social stratified communities also.
To understand the prevalent type of social capital, which are important for movements out
of poverty at household level the indicators the used are types of social groups or the
association peoples are involve in, source of credit, interaction of the group members and
participation in communal activities; and source of information. In most of the indicators
the findings have suggested that the majority of people use linking social capital both in
initially high and low stratified communities.
Therefore the findings reveal that the most prevalent type of social capital does not vary
on the level of social stratification. Rather than, type of social capital depend on the
purpose of activity. For the economic activity linking social capital is most prevalently
reported (such as received credit for business, member of financial group from where
people get loan for economic activity) whereas people are more dependent on bonding
social capital for the financial support for family matters such as marriage, sickness or a
funeral; and to get information regarding market of goods, crops, inputs etc.

97
SECTION IV: HOW DO POLITICAL FACTORS AFFECT MOBILITY
The main aim of this report is to assess the impacts of local level democracy and
governance on moving out of poverty in rural areas in Bangladesh. Widely, for this
section the study hypothesis is that a well functioning local democracy leads to a better
local government and basic service delivery which impact mobility. Specifically the study
has intended to identify the answer of some questions. These are: What is the relationship
between people and their local representatives and local government? Do they have
influence on or access to local community or political leaders? How? What are the forms
and extent of community organizing for political purposes? Do people view issues like
participation, accountability, community organizing—and democracy more generally―
as important in their lives or for the development of their communities? How do these
issues affect the functioning and performance of local government? In this regard,
democracy and governance at the local level are defined with the help of some specific
indicators.
4.1 Definitions of Local Level Democracy and Governance
4.1.1 Definition of Democracy
It is found that there is no significant difference among the people of the study
communities over the perception or definitions of democracy. It is difficult to stratify
these communities based on these perceptions. Regarding the definitions of democracy
most of the community people have laid emphasis on the rights to vote, and some have
stated that it is politics of people. Some people also consider some rights of freedom (e.g.
freedom of jobs, freedom of work, freedom of movement etc.), some also correlate it with
the power of money, or some consider that democracy means equal opportunity and
living co-operatively. Therefore, findings show that democracy is correlated with
freedom, power and equality.
Therefore, to make the definition specific and appropriate it is important to analyze some
specific indicators of the quantitative findings. Local democracy refers to a combination
of election situations and the situation of voice and participation of the communities.

98
Election and the election process are taken as important factors to explain local level
democracy. Moreover, the election process includes how a politician becomes prominent
and elected. More importantly, fairness in election process or in election campaign is also
is a prominent factor of democracy.
Local democracy refers to voice and participation in different committees or councils
within village and neighboring villages as well as the influence of local community
people. The representation of women, minorities and poor in these village or
neighborhood councils is also important. Besides this, access to different forms of media
like local and national newspaper, TV, radio, public telephone, social bulletin board etc.
is also a measurement of voice and participation. Moreover, the existence and numbers of
political groups or associations are also important to define local level democracy.
Weights or scores are given for each factor here.
4.1.2 Local Level Governance
There are different dimensions by which local governance is defined. Here it is important
to find out the factors of governance. In a study by Ali and Hossain (2005) local
governance is defined with the responsibilities and accountabilities of local government.
The indicators they have taken to analyze local government are: what government is, poor
people’s influence over government, their access to knowledge about government and
how the government forms.
On the other hand, the PPRC study (2007) explained governance by three things:
institutional quality, interface quality and civic quality. Here institutional quality captured
government effectiveness, quality of elected leadership and opportunity. Similarly,
interface quality covered trust and expectations, voice, Hoirani/ harassment and
insecurity. And civic quality referred to attitudes and values, aspirations and optimism.
However, in this study some other indicators are included. These indicators are measured
with different factors such as access to service delivery like electricity, clean water,
quality of educational institutions and health facilities. Moreover, safety of communities,
proportion of corruption of government officials and existence of violence and crime and
access to the facilities like bus terminals, railway station, cultural, community centers,
post offices, availability of public programs and access to credit facilities have been

99
captured to measure local level governance. Moreover, percentages of some
governmental development projects have been analyzed to measure the local governance
of the communities. The availability of bus & train communication and public or private
telephone are also considered in this regard.
4.1.3 Methodology
The total number of community is sixteen, which have been divided into eight districts of
Bangladesh3
. The main characteristic of this study is that communities are classified into
two categories: high and low. In this regard, all of the indicators are scored in the same
way to classify the communities. Total sixteen communities are stratified into two
categories on the basis of local democracy that means election, voice and participation as
well as local governance. To obtain the initial situation the study has analyzed all
indicators on the basis of the situation of ten years ago. Therefore, the study has taken
initiatives to understand the current moving out of poverty situation, on the basis of the
local governance and democracy of ten years ago.
How these indicators are analyzed to stratify the communities as high and low? In this
regard, for each indicator a positive score or 1 has been given. For example if the election
takes place then the community gets 1, when that election is fair it gets another 1 and if
the election takes place both at national and local levels then the community gets 1 for
election at each level.
Similarly, to explain the detailed scoring process of voice and participation, it can be said
that all indicators get score 1 for availability in the community. For example, if any
village or neighborhood council exists in a community it gets 1. Then the community gets
additional 1 for having minority participation. Besides this, in terms of the percentages of
the participation of women and the poor, the scores are given on the basis of range of
percentage (20%> 1, 20-50% = 2 and % < 3). A community gets score 1 for each access
to different forms of media like: local newspaper, national newspaper, availability of
national television, national radio, community bulletin board and public telephone for
constructing stratification of the communities in this regard.
3 For detail explanation see methodology chapter.
100
In the same way, existence of service delivery is scored 1. On the other hand the qualities
of services are given weight. For example if the quality is very good then the weight is 5,
if it is good is 4, okay is 3, bad is 2 and very bad is 1. Similarly regarding law and order
the scores have been placed just reverse the code (for example very safe is 5, safe is not 4,
safe nor dangerous is 3, dangerous is 2 and very dangerous is 1). Corruptions also scored
on the proportion of government officials/civil servants in this village/neighborhood and
country are corrupted. The scoring is like this almost none is 4, a few are 3, most is 2 and
almost all is 1. All scoring on environmental problems are as follows: if the problem is
not serious then the score is 4, if the problem is somewhat serious then the score is 3, if
the problem is very serious problem then the score is 2 and if it is critically serious then
the community will be scored 1. When local level trust is measured then score is like this:
to a very great extent is 5, to a great extent 4, neither great nor small extent 3, to a small
extent 2 and not at all 1. Finally, it is the status of attention of the local government to the
communities and the weight has been given for the answers to these two questions. For
example, if they say the local government does not pay attention at all then they get score
1, if the answer is 'a little' then they get 2 but when the answer is 'a lot' then they get the
score 3. Similarly, if their ability to contact the local government and influence its action
has decreased they get score 1, if it has remained same they get 2 and if it has increased
they score 3.
Here it is needed to mention that the mid value (median) of the sum of all scores or
weight is used to stratify the high and low voice and participation in the communities.
Based on calculation of scores of all indicators the communities which have scored upper
and equal of mid value are high-leveled and low of mid value are low-leveled
communities.
4.2 Local Level Stratification
4.2.1 Community stratification based on election situation
The communities here are stratified on the basis of the election situation of ten years ago.
On the basis of this scoring the communities are distributed as high and low. Considering
the election situation it is found that most of the communities are strong.

101
Table 4.1: Stratification according to election situation
Initial situation of election Strong Char Belabo
Chitain Arairashi Char Kumaria Dorikhujikhani Gilarchalla
Uttar Guthuma Modhupur Ikumaribhati Ranachandi Badalpara Dashpara
Weak Daxin Berabaria Bisharikathi Patnipara Ghutia
If we score all the indicators of the initial condition of election or election process of ten
years ago, it is found that out of sixteen communities twelve are in a strong position.
However, the remaining four communities have stated that they have found no election
either at local level or at national level or have no fair election. Among these four
communities there was no election in Bisharikathi ten years ago. However, among other
three communities, Patnipara, Ghutia Char and Daxin Berabaria people have reported that
they have no experience of free and fair election at local level.
4.2.2 Community stratification based on voice and participation
On the basis of voice and participation in different committees or councils within village
and neighboring villages as well as the influence of local community people on it and
access to different media are referred to voice and participation in this section. To classify
the communities as high and low, whole stratifications are constructed based on the initial
condition that means the situation of ten years ago is basically considered. With this
classification the high and low communities are drawn as follows.
Table 4.2: Stratification of the communities on the basis of voice and participation
Stratification of the communities base on voice and participation
Community
High Daxin Berabaria Char kumaria Arairashi Char Belabo Bisharikathi
Dorikhujikhani Ranachandi Gilarchalla
Low Chitain Ikumaribhati Ghutia Badalpara
Patnipara Dashpara Modhupur Uttar Guthuma

102
It has been found that Char Kumaria has got the highest score on voice and participation.
This community has all sorts of council and participation of women and poor in these
councils is high, on the other hand the number of political and social associations is also
high. Char Belabo has got the second highest score. On the other hand, Modhupur village
is in the weakest position. Therefore, it has been found that initially among the sixteen
villages eight were high and other eight communities are scored low on the basis of voice
and participation. Among the low voice and participation Modhupur and Ghutia are in the
worst situation. They have no any access to any kind of media and they have very few
associations or councils where there is no any participation of poor and women.
4.2.3 Community stratification based on local democracy
Local democracy is measured with the combination of election situation and voice and
participation of all of the communities. With calculating the total scores of election
situation and voice and participation democracy is drawn.
Table 4.3: Stratification of the communities on the basis of Local Democracy
Local democracy Community High Char Kumaria
Arairashi Char Belabo Dashpara Chitain
Dorikhujikhani Badalpara Gilarchalla Uttar Guthuma Ranachandi
Low Daxin Berabaria Bisharikathi Ikumaribhati Ghutia
Patnipara Modhupur
All components of election and voice and participation are scored to construct local level
democracy together. On the basis of these components total sixteen communities have
been stratified into high and low local democracy. Out of these sixteen, nine communities
have been scored as high and remaining seven have been scored low. That means more
than 50% of the communities are high in local level democracy.
4.2.4 Local Level Governance
The communities are also classified as strong or weak on the basis of initial condition or
the situation of local governance ten years ago. This classification has been done based on
quality of service delivery like education and health services, corruption and availability
of safety nets etc. These indicators are measured with different factors such as availability

103
of electricity, clean water, safety of communities, proportion of corrupted of government
officials and existence of violence and crime and access to the facilities like bus
terminals, train stations, post offices. Besides these the availability of public programs
and access to credit facilities are also included in measuring local level governance.
Moreover, percentages of some governmental development projects are also evaluated to
classify the communities.
Table 4.4: Community stratification on the basis of local level governance
Stratification of the communities base on local governance functioning
Community
High Arairashi Char Kumaria Ikumaribhati Uttar Guthuma
Badalpara Char Belabo Patnipara Ranachandi
Low Dashpara Daxin Berabaria Dorikhujikhani Modhupur
Ghutia Bisharikathi Gilarchalla Chitain
On the basis of the analysis of the above-mentioned variables it is found that 50 per cent
the sixteen communities are high at local governance. That means out of sixteen
communities eight become as high local governance. On the other hand, eight
communities have experienced a low level of local governance. Here also Char Kumaria
is in the highest position. On the other hand, Ghutia and Bisharikathi are in the lowest
position considering scores on the basis of the variables of local governance functioning.
That means the communities which are high have better access and better quality of
education and health services, access to bus and train stations, post offices, access to
clean water, electricity. Besides these they have public programs and has access to credit
facilities ten years ago. If we consider Char Kumaria, this community is rich in terms of
all factors except the availability of sources of credit. On the other hand ten years ago
Ghutia had no access to bus or a train station, cultural centers, clean waters, government
programs. The number of corrupted government officials was high and health care
availability was very poor ten years ago.

104
Table 4.5: Local Democracy and Local Governance Local governance Community
Higher level of local democracy Low level of local democracy
High
Badalpara Char Belabo Ranachandi Char Kumaria
Arairashi Uttar Guthuma
Ikumaribhati Patnipara
Low Gilarchalla Dorikhujikhani Dashpara Chitain
Ghutia Bisharikathi Modhupur Daxin Berabaria
From the analysis it is found that there is a correlation to some extent between the
communities stratified with voice and participation and local governance. It is also found
that out of eight communities which are high in terms of local governance, most (six) are
also high in terms of local level democracy. However, among eight low-level
communities in terms of local governance, 50 percent are also low in terms of democracy.
Considering the dissimilarities among the communities it has been found that only two
communities (Ikumaribhati and Patnipara) are high in governance but low in local
democracy.
4.3. Democracy Governance and Moving Out of Poverty
4.3.1. Democracy and prosperity
In this section, the main aim is to understand whether these communities have
experienced overall prosperity over the ten years based on the democracy situation.
Prosperity is defined here with the index captures only upward movement in a village,
irrespective of the household’s position on the ladder of life. If we account for all upward
movement and divide by the total number of households that were sorted, we arrive at a
prosperity index. In this regard it is important to mention that after sorting of prosperity
index the high net prosperity were measured for this study is + 0.62 to + 0.35 rate and
medium is +0.11 to + 0.16 and low <+0.11.
The community with a higher prosperity index has a higher percentage of households
experiencing upward movement. Here it is important to mention that where democracy
means election situation and voice and participation. That means did election take place
and whether these elections were fair or unfair? As well as voice and participation that

105
means representation in different councils and influences over these councils of
community people including women, minorities and poor. Voice and participation also
refers to access to different forms of information like national or local newspaper, TV,
radio, public telephone etc. Existence and number of political groups or associations are
also important to define the voice and participation here. Therefore, it is found from the
data that local democracy has a positive correlation with prosperity.
Table 4. 6: Democracy and prosperity Local Democracy High Prosperity Medium Prosperity Low Prosperity
High democracy Gilarchalla Char Belabo Char Kumaria Chitain Uttar Guthuma
Dorikhujikhani Arairashi Badalpara
Ranachandi Dashpara
Low Democracy Daxin Berabaria Ikumaribhati
Bisharikathi Patnipara Modhupur Ghutia
It is seen in the table that most of the communities which experienced high democracy ten
years ago have become more prosperous now. Among sixteen communities ten
communities were high in local democracy and of these ten, five are showing high
prosperity and three of them are in medium prosperity. Out of ten communities only two
are in the low prosperity group. Reversely, if we consider the communities which
experienced low democracy ten years ago, most of them also are less prosperous now.
And none of them are in the high prosperous group. Therefore, this is clear that there is a
positive correlation between democracy and prosperity. Communities which were less
democratic are less prosperous now and which were high in local democracy are highly
prosperous.
4.3.2 Local Governance and net Prosperity
Here in this section local governance is an important part and it has also important
impacts on prosperity. In this study local governance is defined with the indicators such
as access to clean water, quality of service delivery like education and health, availability
of the post office, bus and train station, safety of the community, proportion of corrupted
government official, crime and violence situation at market & home, street safety or
security, presence of public project mainly agriculture project and three important sources
of credit. Subsequently, prosperity is more or less dependent on the situation of local

106
governance based on these indicators. Here in this section community prosperity will be
analyzed on the basis of the situation of local governance of ten years ago. Data shows
that local governance also has positive correlation with prosperity.
Table 4.7: Local Governance and Prosperity Local Governance High Prosperity Medium Prosperity Low Prosperity
High governance Char Belabo Char Kumaria Uttar Guthuma
Arairashi Badalpara Ikumaribhati
Ranachandi Patnipara
Low governance Gilarchalla Chitain
Daxin Berabaria Dorikhujikhani
Bisharikathi Dashpara Modhupur Ghutia
From the table it is found that whereas 50 % (eight) of the communities are showing high
governance. And out of these eight communities most (six) are fall in high and medium
prosperous communities. Out of eight communities, three are in high prosperity group
and three are in medium prosperity group. Reversely, if we consider low governance
communities, we found that most (four) of the low governance communities fall in low
prosperity group. That means half of the communities of low governance are falling in
low prosperous group. And only two communities are showing less correlation.
4.3.3. Local Level Democracy, Local Governance and Mobility
a) Local democracy and mobility
Table 4.8: Mobility index and democracy
Status of Democracy
Community Higher Mobility Low Mobility
High Democracy Gilarchalla Char Belabo Arairashi Char Kumaria Uttar Guthuma Ranachandi
Badalpara Dorikhujikhani Dashpara Chitain
Low Democracy Bisharikathi Daxin Berabaria
Ikumaribhati Patnipara Ghutia Char Modhupur
One of the main hypothesis of this study was that a well functioning local democracy
leads to a better local government and basic service delivery which impact mobility.
Comparing the communities with high and low mobility with high and low local-level

107
democracy it has been found that there is a significant correlation with the community
which are high in democracy based on election, voice and participation and high mobility.
Amongst ten of the communities which are high in democracy, six belong to the high
mobility group. That means almost all of the communities where the households have
moved upward had experienced better local democracy. On the other hand, only four
communities which have better democracy belong to the low mobility group. Similarly,
when we compare low mobility with low democracy group, then we also find similarities.
Amongst the eight communities which belong to the low mobility group fifty percent
(five) of them have also experienced low democracy.
b) Local level governance and mobility
Similarly, if we review the local governance and mobility measures we find that there is
also a positive correlation between local governance and mobility. That means the
communities which have experienced better governance ten years ago have got better
mobility. For example among the eight communities which experienced high governance
it is found that five of them have moved upward in mobility index.
Table 4.9: Comparison between local governance and mobility
Local Governance High Mobility Low mobility
High governance Char Belabo Char Kumaria Uttar Guthuma Arairashi Ranachandi
Patnipara Badalpara Ikumaribhati
Low governance Gilarchalla Daxin Berabaria Bisharikathi
Dorikhujikhani Dashpara Chitain Modhupur Ghutia
Similarly, if we think that the communities whic did not experience any good governance
have not moved upward. We found from table-9 that out of eight communities, which did
not experience better governance, five have not moved upward. Therefore it can be said
that the communities which experienced good governance ten years ago have now moved
upward.

108
4.3.2. Household Level Analysis
a) Local democracy and prosperity
Table 4.10: Local Level Democracy and prosperity (column %)
Local Level Democracy
High Prosperity Medium Prosperity
Low Prosperity
Total (%)
High Local Level Democracy
100.0 74.1 35.0 81.2
Low Local Level Democracy
- 25.9 65.0 18.8
Total (N) 143 266 453 862
From the table it is clear that there is a correlation in the households between local
democracy and with prosperity. From the table of democracy and prosperity it is also
found that not only voice and participation there is positive correlation also between
election and prosperity or overall local level democracy and prosperity. From the
households level distribution it is found that 100 % households who are high in terms of
prosperity also high in local democracy. Among the households who are low in prosperity,
they are also low in terms of local democracy.
b) Local governance and Prosperity If we consider prosperity based on local level governance ten years ago, we have found
that there is correlation in some extent among these two variables. Among the households
who are high in prosperity most (78.8%) of them are also high in local governance.
Table 4.11: Local Level Governance and prosperity (column %) Local Level Governance
High Prosperity Medium Prosperity
Low Prosperity
Total (%)
High Local Level Governance
78.8 73.3 35.0 69.8
Low Local Level Governance
21.2 26.7 65.0 30.2
Total (N) 143 266 453 862
If we stratify the prosperity within two groups that means only high (including high and
medium) and low prosperity, we also find here that most of the households who are in
combined high prosperous group are as well in high local governance group. Similarly, if
we see the data from low prosperity it is found that the households who experienced low
governance in ten year ago they do not have prosperity now as well. Therefore, it can be

109
stated that the households who had high governance have high prosperity now and
reversely the households who had low governance now they have low prosperity.
4.3.3. Democracy, Governance and Four Transaction Group
It is important to analyze democracy at the household level in four transaction group. In
this section we will see the household distribution among the communities based on
different stratification which we have already constructed in the previous section. On the
basis of these stratifications we will distribute the households here. Moreover, the
households here are distributed in four transition groups (mover, always better off,
chronic poor and faller) according to the perception of respondents based on Official
Poverty Line (OPL) of the individual Ladder of Life (see detain in the methodology
section).
a) Local democracy and four transaction group Here all of the households are stratified considering election and voice and participation
together. Data shows that most of the movers (89 %) fall in high local level democracy.
Movers are in highest position whereas households of always better off (82.5 %) are in
second highest position. That means that where democracy is high the rate of moving out
of poverty is also high. Reversely, most of the low democracy group comes from chronic
poor (25.2 %). And movers (11 %) and always better off (17.5 %) are less here.
Table 4.12: Local Democracy (column %)
Democracy Mover Always better off
Chronic poor
Faller Total
High 89.0 82.5 74.8 82.1 81.2 Low 11.0 17.5 25.2 17.9 18.8 Total (N) 191 303 301 67 862 Pearson chi2 (3) = 16.202 p = 0.002 Highly significant (χ2 test)
b) Local governance and four transaction group In the previous section the communities are stratified based on whether the local
governance is functioning or not, and it is found that out of sixteen communities ten
become higher groups. Distributing the households of these communities in four different
transition groups it is also found that there is significant difference among the
representatives of these communities. Most of the households (78.54 %) represent the
high local governance.

110
Table 4.13: Governance (column %)
Governance Mover Always better off
Chronic poor
Faller Total
High 77.0 65.0 70.1 70.1 69.8 Low 23.0 35.0 29.9 29.9 30.2 Total (N) 191 303 301 67 862 Pearson chi2 (3) = 7.960 p = 0.000 Highly significant (χ2 test)
Here also it is mentionable that movers are representing most (77 %) where governance is
high. However, there is some dissimilarity is here chronic poor and fallers are in second
position and rate for both group are same that is 70.1 percent. Here it can be said that poor
now are growingly involving in different credit groups. And this is also true that because
of some national policy poor are getting more access to different service delivery like
education and health.
4.4. Understanding the Process, Hows and Whys
The section above had perseverance to make understand whether the quality of local
governance and "depth" of democracy make a difference in moving out of poverty? The
findings show that where local governance and democracy is depth the communities as
well as households have received prosperity in some extent. And in this section it will be
highlighted that in what ways do local governments promote and/or inhibit poverty
transitions?
4.4.1 Community Level Analysis
4.4.1.1 Some leading factors which have helped community prosperity Besides the direct factors of local democracy and local governance some other indirect
factors also keep important role in community level moving out of poverty. Moreover,
some factors which have impact of community prosperity are output of some democracy
and governance related factors. Considering the leading factors, which have helped/hinder
community prosperity most of the factors come, are more or less related with the
functioning of local democracy. However some of these factors for community prosperity
are directly related with local democracy. Most of the factors, which help in prosperity of
community, from the analysis of community time line and both male and female ladder of
life, are
• Access to basic infrastructure (water and sanitation, electricity, roads/transport)

111
• Starting of NGO activities,
• Agricultural development or commercialization of agriculture (for example,
introduction of IRRI paddy or introduction of shallow machine/deep tube well
etc.)
• Development in education
• Better service delivery and better safety nets
• Increase of international job or increase of going abroad
However, some other factors come from the discussion with community people in FGD
session that some factors which are directly related with local governance and democracy
have positive or negative impact on community prosperity. From the discussion of FGD
or qualitative findings some examples of democracy and community prosperity are
illustrated here.
1. Berabaria as a low democracy and governance
Berabaria is scored low in democracy because it has got less score from election situation.
That means there was no election at local level and both local and national elections were
unfair. However, the situation of service delivery is still poor. There is no electricity
connection still now. According to men and women FGD the local government pays less
attention to what people like. However, in this village there is no electricity connection
but they are expecting that electricity is on the way and will come soon. Mr. Ameer
Hossain has said, “Compared to earlier ones, the leaders now are more attentive to the
people. Chairman Abul Khair constructed the sluice gate. May be, it was only one of his
10 election promises, he fulfilled. However, present chairman does remain indifferent to
people’s problems. Ex-chairman Kamal used to visit village once or twice a month”.
2. Low democracy and governance in Bisharikathi
From the quantitative findings it has been found that there were no elections either at the
local level or any national level ten years ago. Also well as there was no access to
different media like local or national newspaper, television and national bulletin. On the
other hand, from the discussion with local people it has been found that people at large
have less influence over local government. The local people cannot influence the
decisions of the local government. People have to agree with the decisions given by the
members. They have no other way. It happens because of poverty. The female

112
participants think that there are some changes in the democracy over the ten years, for
example earlier people were not that much aware and concern, but now they become
aware and people react for that if there is any irregularity. Rokeya Khatun said, “Now a
days, people usually know when the government facilities come, what they did not know
earlier. Now they can receive some of those facilities. It is also important that if
democracy works perfectly, then development process can also possible. This we can
believe now”
3. Ghutiarchar is the community of low governance and low democracy
Ten years ago Ghutia had no fair election in local level and it is also seen in the
quantitative data that no participation of any councils and association and had limited
access to different kinds of media. As well as there was no post office, bus or train station
and there was no any government project for helping them in agriculture. According to
both of the men and women groups have stated that there are several changes have
occurred in democracy. They stated that because of increasing of rate of literacy people
have become conscious now. Additionally the community becomes safe now. Mr. Alam
has said, “There has been change. There was no education. Now one or two have been
educated.” Mr. Idris Ali has said, “Previously there was pilferage in the village. The room
could not be kept safe even under lock and key, but at present these will be no stealing if
one sleeps without using cleat. Safety has increased”. Mr. Ziaul Haq said, “The condition
of the people has become a little better. Again to get loan has become easy. NGO society
works. It was not in existence before”. On the other hand female participants think that
the local government people have not changed during last 10 years. Ms. Piara in this
regard opines, “No, compared to 10 years ago, chairman and members do not do
anything. No development works takes place in our village as there are no members or
chairman from this village”.
4. Ikumaribhati as a community of high governance but low democracy
From the findings of the democracy situation it has found that community people had no
any participation in any kind of community association or groups ten years ago. In
addition to access to information they had only radio and they had no access to any local
or national newspaper, television or telephone. From the discussion in FGD the limitation
democracy has been expressed. During the last ten years the condition of democracy are

113
expressed in the male FGD Mobarak have said “There is a development in the village but
democracy is still in the same position. We do not understand any better or worst".
Considering the indicators of governance they had not any limitation except in
government project. They had better service delivery like electricity, clean water, quality
of educational institute and health centers, security of community etc.
5. Patnipara as a community of high governance but low democracy
From the findings from quantitative data it has found that in Patnipara there was no any
fair local level election and there was not any participation in any kind of community
group or association. Similarly, there was no access of this community to different media.
They had only access to radio and television. From the findings from qualitative data it
has found that
6. Gilarchalla as a high local democracy but low governance
From the quantitative findings it has found that there was no any quality of health care,
security of street market or home were very bad, proportion of corrupted government
officials is high, there were no any sources of credit ten years ago. For these reasons
governance is low in this community. When the qualitative data are analyzed it is found
that both male and female FGD respondents have reported that almost all governmental
officials are engaged take bribe. Sharban (50, day labour) says in this regard, “Without
money no work can be done in a government office. Almost all government officials are
engaged in taking bribe.” Lutfa Akter (30, school headmistress) says, “They want 20 or
30 thousand taka bribe for employing teachers. They share money among different
officials. Thana Education Officer takes ten thousand and Associate Thana Education
Officer takes five thousand and the rest of the money goes to the Education Secretaries.
Secretaries take most money of bribe.”
The evaluation of the chairman and members in the village has gone down in the last 10 years as the chairman takes 600 taka as bribe for each VGD
cards. Such practice of bribery was not there 10 years ago. People have lost faith on the chairman and the members and now-a-days the chairman and
members are concerned of their self-interests instead of the village’s. Access or contract with the local government has decreased in the last 10 years as the chairman and members don’t listen to the villagers. 10 years ago the
local government representatives used to listen to people but now they don’t.

114
7. Dorikhujikhani as a high local democracy but low governance
From the findings of quantitative data it has found that there was no availability of public
project, or any government programs for farmers and no any important sources of credit
ten years ago and that’s why this community is leg behind in governance.
4.4.2. Household Level Analysis
4.4.2.1. Local Level Democracy To measure the conditions of local democracy at household level voice and participation
of four transition groups; mover, always rich, chronic poor and faller among the
communities are analyzed. To do this analysis some indicators are measured to measure
this voice and participation and influence on local democracy. These indicators are
covered with participation in residential or neighborhood meetings, communicated with
politician, participated in politically motivated activities and communicated local
problems to media and local police or court
a) Involvement of most important groups or association
It is important that people are very much interested to participate in different important
groups and association. And this involvement at any household members in any types of
groups helps them to move up.
Table 4.14: Involvement of most important groups or association (column %)
Involvement Mover Always Better
Off
Chronic Poor Faller Total
Involve in any types of group 54.5 55.1 49.2 53.7 52.8
Total 191 303 301 67 862
In terms of involvement in most important groups or association it has found that,
participation in any type of important social, economic, political and cultural groups or
associations of all transition groups are not very high. However, among them always rich
and movers are higher in position. And chronic poor is lowest in participating most
important groups and associations.

115
PPRC (2007) has stated that NGO efforts as an alternative dispute resolution mechanisms
for growth in Bangladesh. Similarly when we analyze table 17 it is found that
participation in credit related association has increased for all transition groups specially
movers.
If voice and participation of community people are considered only with participate in
important groups or associations it has seen that maximum of the people from either
mover or always rich in all groups now and also in ten years ago. Compare to four
transition groups chronic poor are mostly leg behind in belonging in any political groups
or association either now (50.8 %) and nor ten years ago (79.1 %). On the other hand
always rich are in better position they involve at least in one political groups or
association now (17.5%) and they were in most better situation ten years ago, as they
were involve in at least one groups (44.6 %) and in two groups also (33.3 %). The groups
of always better off have better position in participation, they are in second best position
in participation in political groups and association (17.5 %).
Table 4.15: Involvement in different important groups or association (column %) Involvement in different important groups or association
Comparison ten years ago and now
Mover Always Better Off
Chronic Poor
Faller Total = N
Production or trade Ten years ago
2.6 3.6 2.0 .3 2.8
Now 7.9 6.9 5.0 9.0 6.6 Finance, credit or saving Ten years
ago 14.1 17.5 12.0 16.4 14.7
Now 42.9 34.3 37.5 46.3 38.3 Health or education Ten years
ago 1.6 5.9 1.3 1.5 3.0
Now 4.2 9.2 2.7 0 5.1 Political Ten years
ago 9.4 16.2 5.3 11.9 10.6
Now 8.9 17.8 6.0 14.9 11.5 Religious Ten years
ago 1.6 7.3 3.7 4.5 4.5
Now 3.1 8.6 4.7 6.0 5.8 Ethnic Ten years
ago 0 1.3 .7 0 .7
Now 0 1 .7 0 .6 Total 191 303 301 67 862
For example movers are involve in production and trade groups the percentage are
maximum (7.9 %). On the other hand, participation of chronic poor in NGOs or finance
credit or savings related association has increased now (37.5%). If we consider the

116
participation in education and health related association, always rich are in better position
now (9.2 %) and also in ten years ago (5.9 %). Here it is mentionable that in participating
in education and health related association movers are in second position now (4.2 %).
Compare to ten years ago the involvement in political groups or association has decreased
for all transition groups now. On the other hand except the participation of chronic poor,
the involvement of all transition groups in religious groups has increased. In terms of
political groups, always rich are in better position both in ten years ago (16.2%) and now
(17.8%). In this political groups fallers are in second better position both in ten years ago
(11.9 %) and now (14.9 %). Always better off are in better position in considering
religious association. Therefore, though the participation in political and other groups are
not that much significant it can be said that movers and always rich are in best position in
this regard.
b) Percentage of household participation in community activities
The factors of participation of households in community activities have keep important
role in moving out of poverty. Ranges have been given for analyzing the data of how
many times did they or anyone in their households participated in any communal
activities during last years, in which people came together to do some work for the benefit
of the village/neighborhood.
Table 4.16: Households participation in any kind of community activity (column %)
In this regard data stated that here also the people who move out of poverty or who being
rich are more participation in any kind of communal activities. Here it is important that
always rich people are in highest (41.3 %) position who participate any kind of communal
Yes
30.9
41.3
17.6
19.4MoverAlways better offChronic PoorFaller
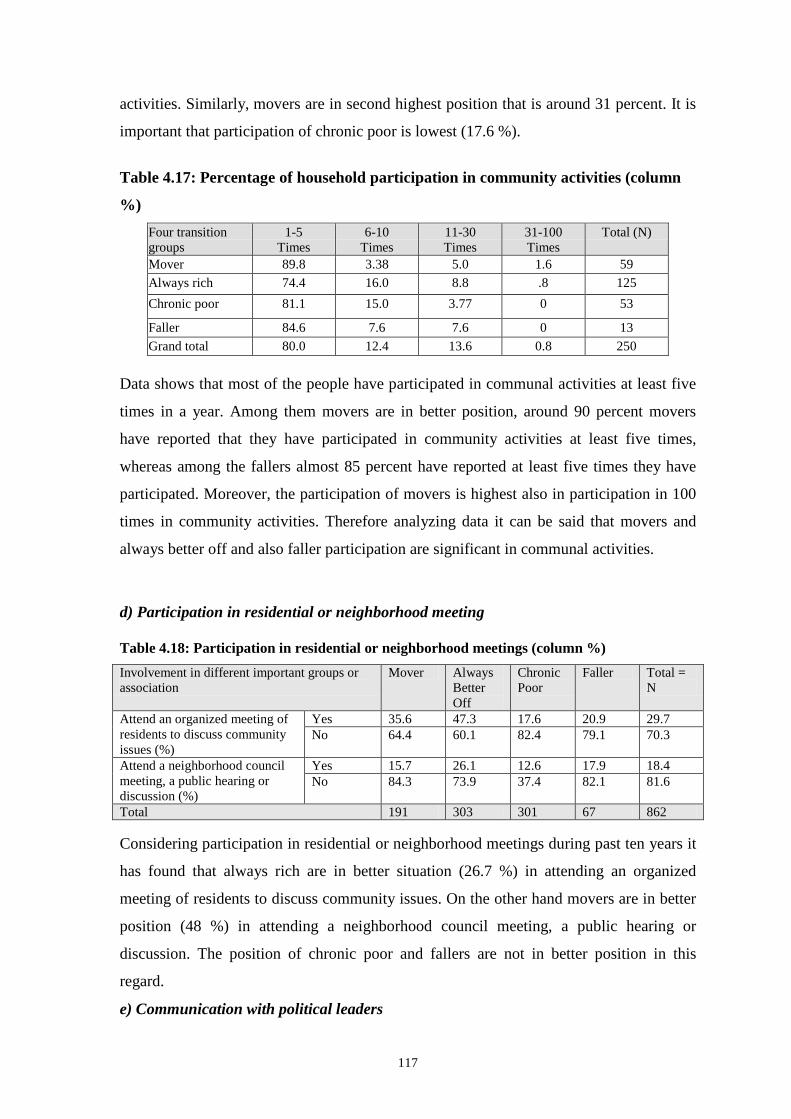
117
activities. Similarly, movers are in second highest position that is around 31 percent. It is
important that participation of chronic poor is lowest (17.6 %).
Table 4.17: Percentage of household participation in community activities (column
%) Four transition groups
1-5 Times
6-10 Times
11-30 Times
31-100 Times
Total (N)
Mover 89.8 3.38 5.0 1.6 59 Always rich 74.4 16.0 8.8 .8 125 Chronic poor 81.1 15.0 3.77 0 53
Faller 84.6 7.6 7.6 0 13 Grand total 80.0 12.4 13.6 0.8 250
Data shows that most of the people have participated in communal activities at least five
times in a year. Among them movers are in better position, around 90 percent movers
have reported that they have participated in community activities at least five times,
whereas among the fallers almost 85 percent have reported at least five times they have
participated. Moreover, the participation of movers is highest also in participation in 100
times in community activities. Therefore analyzing data it can be said that movers and
always better off and also faller participation are significant in communal activities.
d) Participation in residential or neighborhood meeting Table 4.18: Participation in residential or neighborhood meetings (column %) Involvement in different important groups or association
Mover Always Better Off
Chronic Poor
Faller Total = N
Attend an organized meeting of residents to discuss community issues (%)
Yes 35.6 47.3 17.6 20.9 29.7 No 64.4 60.1 82.4 79.1 70.3
Attend a neighborhood council meeting, a public hearing or discussion (%)
Yes 15.7 26.1 12.6 17.9 18.4 No 84.3 73.9 37.4 82.1 81.6
Total 191 303 301 67 862
Considering participation in residential or neighborhood meetings during past ten years it
has found that always rich are in better situation (26.7 %) in attending an organized
meeting of residents to discuss community issues. On the other hand movers are in better
position (48 %) in attending a neighborhood council meeting, a public hearing or
discussion. The position of chronic poor and fallers are not in better position in this
regard.
e) Communication with political leaders

118
To analyze the voice and participation of households in communication with local and
national level political leaders and participation in political activities are analyzed in this
section.
Table 4.19: Communicated with politician (column %)
Communication with political leaders Mover Always Better Off
Chronic Poor
Faller Total = N
Met with a local politician, called him/her, or sent a letter (%)
Personal matter
12.6 25.7 8.0 17.9 16.0
Public issue
87.4 74.3 92.0 82.1 84.0
Met with a state/national politician, called him/her, or sent a letter (%)
Personal matter
13.6 21.1 11.6 16.4 15.8
Public issue
86.4 78.9 88.4 83.6 84.2
Total 191 303 301 67 862
Here it is important to mention that movers are in a better position in terms of
communication with community leaders or politicians. Considering the communication
with local politicians almost 26 percent rich people stated that they have better
communication regarding personal matter, similarly around 21 percent rich people have
stated that they can meet with a national politicians. Here also movers are also in better
position but in terms of public issues position in communication with both in local level
(87.4 %) and in state or national level (86.4%). Therefore here also always rich are in
better position and movers are getting better.
d) Access to information
Access to information more or less refers to access to media. Though most of the people
get information from local market but media like local and national newspaper, radio and
television keep important role in receiving information regarding essentials. Here from
the table 22 it is found that always better off and movers get information mostly from
both radio and television. On the other hand except local market most of the chronic poor
get information from relatives. However, movers and always better off have more access
to radio and television.

119
Table 20: Access to different information (column %)
Access to information regarding essential market information
Mover Always Better Off
Chronic Poor
Faller Total =N
Local Market 46.6 60.7 50.8 44.8 456 Relatives 8.67 9.5 14..3 3.6 310 Local newspaper 1.0 1.3 .3 1.5 8 National newspaper 2.1 2.0 .3 3.0 13 Radio 1.0 2.3 1.3 13 Television 3.7 4.0 4.0 4.5 34 Colleagues 6.8 1.3 1.3 21
Opportunity to inform media about local problems is one of the most important
phenomena in democracy. PPRC (2007) has also mentioned about this opportunity as a
factor for ‘governance’. However, if we consider alerting newspaper, radio, media and
local police and court as a factor it is found that though very little have this kind of
opportunity.
Table 21: Communicated local problems to media and local police or court (column %)
Communicated local problems to media and local police or court
Mover Always Better Off
Chronic Poor
Faller Total
Alerted newspaper, radio or TV to a local problem (%)
4.2 8.6 1.3 6.0 4.9
Notified police or court about a local problem (%)
.5 1.3 1.0 1.5 1.0
Total = N 191 303 301 67 862
But among the households who have the opportunity to provide information to media,
most are faller (6%) and next group is always better off (8.6 %). Moreover, movers
(4.2%) are also in better position. However, chronic poor are very poor in this regard.
Only around 1 percent chronic poor have reported that have alerted newspaper, radio or
TV to a local problem.
4.4.2.2. Local level governance on access to services delivery The main objectives of this study is a well functioning local democracy leads to a better
local government and basic service delivery which impact mobility. The local governance
is also measured with local government functioning with access and influence of local
government and access to services.
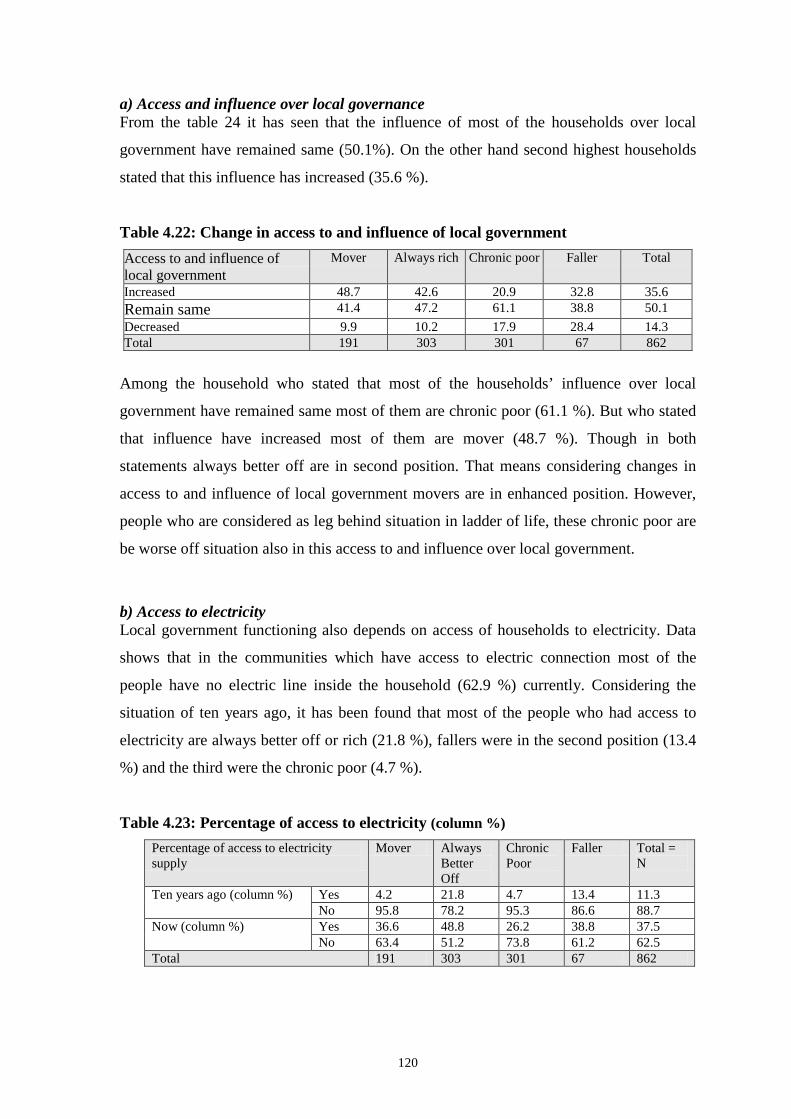
120
a) Access and influence over local governance From the table 24 it has seen that the influence of most of the households over local
government have remained same (50.1%). On the other hand second highest households
stated that this influence has increased (35.6 %).
Table 4.22: Change in access to and influence of local government Access to and influence of local government
Mover Always rich Chronic poor Faller Total
Increased 48.7 42.6 20.9 32.8 35.6 Remain same 41.4 47.2 61.1 38.8 50.1 Decreased 9.9 10.2 17.9 28.4 14.3 Total 191 303 301 67 862
Among the household who stated that most of the households’ influence over local
government have remained same most of them are chronic poor (61.1 %). But who stated
that influence have increased most of them are mover (48.7 %). Though in both
statements always better off are in second position. That means considering changes in
access to and influence of local government movers are in enhanced position. However,
people who are considered as leg behind situation in ladder of life, these chronic poor are
be worse off situation also in this access to and influence over local government.
b) Access to electricity Local government functioning also depends on access of households to electricity. Data
shows that in the communities which have access to electric connection most of the
people have no electric line inside the household (62.9 %) currently. Considering the
situation of ten years ago, it has been found that most of the people who had access to
electricity are always better off or rich (21.8 %), fallers were in the second position (13.4
%) and the third were the chronic poor (4.7 %).
Table 4.23: Percentage of access to electricity (column %) Percentage of access to electricity supply
Mover Always Better Off
Chronic Poor
Faller Total = N
Ten years ago (column %) Yes 4.2 21.8 4.7 13.4 11.3 No 95.8 78.2 95.3 86.6 88.7
Now (column %) Yes 36.6 48.8 26.2 38.8 37.5 No 63.4 51.2 73.8 61.2 62.5
Total 191 303 301 67 862

121
On the contrary considering the current situation of electricity it has also been found that
households which have access to electricity are always rich (48.8 %), second most access
to faller (38.8 %) and movers (36.61 %) are in third position and who have most less
access they are chronic poor (26.2 %). That means the people who have less access to
electricity are the chronic poor.
c) Access to water Quantitative data shows that almost 99 per cent households have access to tube-well for
drinking water. Similarly tube-well is mostly used for all purposes in both rainy and dry
seasons. Around 83 percent people can use tube-well water for cooking purposes in dry
seasons whereas 82 percent in rainy season. Tube-well is also used for dish washing (76.4
% in dry season and 75.8 % in rainy season), as well as, cloth washing (64.7 % in dry
season and 61.9 % in rainy season) and bathing (64.7 % in dry season and 60.3 % in rainy
season).
Table 24: Sources of water in dry season (column %) Use of water
Sources of water Tube well River Pond Cannel Other Total n =
862 Drinking 99.0 .3 .3 0 .2 Cooking 82.5 1.9 15.0 .1 .6 Dish washing
76.5 2.7 18.0 .9 1.3
Cloth washing
64.7 3.9 27.7 1.3 1.0
Bathing 64.2 4.6 28.1 1.7 1.2
It is also found in Modhupur that some people take water from haor for cooking and also
for drinking. But the percentage is very low (.3 % in dry season and .6 % in rainy season).
Table 25: Sources of water in rainy season (column %) Use of water Sources of water
Tube well River Pond Cannel Other Total n = 859 Drinking 98.8 0 .5 0 .7
Cooking 81.0 1.4 15.1 .3 2.2 Dish washing 75.9 2.0 19.3 .9 1.3 Cloth washing 61.9 3.8 30.5 1.4 Bathing 60.2 4.6 31.6 2.2 1.2
Therefore, analyzing household data on the local governance functioning based on access
to different service delivery, it can be said that those who always better off are always in a
better position. And movers are getting into a better position.

122
By examining the community and individual/household level findings on local democracy
it has been found that there is similarity between local level democracy and governance
ten years ago and prosperity, mobility and also moving out of poverty now. That means
where there were better situation of local level democracy and governance now they have
less poverty.

123
SECTION V: INEQUALITY
5.1 Definition of inequality
In all study communities, the FGDs participants (both male and female) have define
inequality in different ways. To define inequality most of the participants give emphasis
on wealth, education, intelligence, power, occupation, gender, age, religion, socio-
political position within society etc. But the commonality among them is that all
participants have defined inequality from the economic point of view. According to them,
wealth creates inequality in society. One of the female participants in Arairashi says,
“Inequality is the discrepancy between the high and the low (uchu nichu bhedabhedtai
asamata)." They explain this discrepancy as economic and social inequalities, meaning
those who have money earn respect. According to Nasima, “Everybody does not have the
same amount of money. Some have more, some less (sokoler ek rokom taka paisa nai,
karo kom, karo beshi)." The FGD participants in Dorikhozikhani hold that dissimilarities
among people in terms of money, wealth and land mean inequality. A male participant of
Gilarchala, Forkan Mian, says, “If I had money I would lead my life in a better way. In
this village there are some people who are in a very poor condition. On the other hand,
some are just moving and doing nothing and they generally consume their fathers’
income.”
The participants in Chitain say that inequality means the difference between rich and
poor. Some people live in the city and some live in the village. The rich people go to the
market by riding motorcycles but the poor people go to market on foot. This is inequality.
In any social event the rich are well treated and offered chairs to sit on but the poor
people are offered seats on the ground.
The understanding about inequality among the female participants in Ikumaribhati is that
it is pervasive and multi-faceted: some have more money, some have less; someone’s
health is good, someone’s bad, some people’s children have education, some people’s
have not.
A female participant, Ohitun of Ghutia, says, “One or two here are rich while the others
are poor. Some are involved in jobs, some pull rickshaws and some are laborers.”

124
According to the participants in Char Kumaria, inequality means the difference between
the poor and the rich, the difference between the educated and uneducated. The female
participants explain the difference thus, “They are rich, wear good clothes and eat good
food. They never go for firewood collection but the poor do. Our tube-well water contains
arsenic. So, we go to their places but they never come to ours. They have good
relationships with the people outside their community and they get much social supports.”
They further mention, “When I go to the doctor, I have to keep waiting buying a ticket
but the rich never have to. They just come and enter into the doctor’s chamber.” In
Badalpara, the consequence of the conflicts between higher and lower classes came up as
a factor when the respondents were discussing inequality and the problems being created
in the community thereof.
Jamaluddin of Doxin Berabaria says, "There is a difference between one who stays in the
country and the one who stays abroad. One builds houses and furnishes them, whereas the
other has not even a piece of land to dwell on. So that is the difference. Also, some are
more educated and the others are less educated." In Uttar Gutuma, the participants explain
that some people are poor, some are rich, some are educated, some are uneducated, some
people lead others while some people are led by others. The male participants have also
reported that some have less property and some have more property; some have thatched
houses and some have large buildings. Some earn very little and some earn a lot of
money. Most of the people in Modhupur point out economic inequality as the most
common form of inequality. Some have also mention political inequality, social
inequality and educational inequality. A female participant Rehana says, "The world has
been uneven since its creation. Some are poor and some rich.”
5.2 Relationship between inequality and community prosperity
Mixed views are found regarding the relationship between the presence of inequality and
community prosperity. Inequality has decreased in some sample communities and has
increased in others. At the same time, access to economic opportunities have increased
because of large-scale NGO intervention as well as increasing access to markets,
diversifications in rural productions etc. In the 16 study communities inequality has
reportedly decreased in Chitani, Arairashmi, Gotia, Patnipara, Madhupur and increased in
the remaining communities. Inequality matters much for community prosperity as

125
decisions on important community affairs are taken mainly by the influentials on people
holding economic and political power in the community. Some examples can be cited
here to make it clearer. In Arairashi inequality has increased in comparison with the past
decade. The rich are getting richer and the poor are gradually going down. Influential and
educated people who control society are using their power to serve their individual
interests. They are creating high and lower classes in society for their self-interest.
Compared with the past decade, economic disparity has increased with the widening gulf
between the rich and the poor. Capital is being concentrated in fewer hands. So poor
people cannot prosper economically even if they want to. Running business ventures has
become more difficult for poorer people there before. Considering everything economic
discrepancy has intensified. In Patnipara the FGDs participants opine that 10 years ago
there was less inequality. It has increased now. In the case of politics, it has been
observed that those who have the same political identity as the local government
representatives receive assistance from them. Ten years ago, political discrination was
less than now. Ten years ago, people used to receive government assistance in a fairer
manner, which is not happening now. People from the government parties are getting
more assistance. Apparently, all the villagers are consulted by the local government
representatives when it comes to the question of taking major decisions on the
development of the village like construction of roads, digging up ponds, sinking tube-
wells and building latrines. However the representatives take the major decisions. As a
result, all benefits go to the followers of the local government representatives or the
political leaders.
An opposite picture is found in some other communities. In Dorikhozikhani, the female
participants have mentioned that more people are now getting access to economic
opportunities. Economic inequity has now decreased. People have improved their
situation. A sweater factory has been established (near the village) and many men and
women are getting jobs there. More people are now involved in business and in some
businesses people are getting more profit. For example, the business of vegetables is more
profitable than it was 10 years ago. People's economic condition has improved. The gap
between the rich and the poor has also been reduced. Moreover, both the male and female
participants have reported that decisions on important community affairs are now made
by the villagers. The male participants have said that in their village the government has
not done any work for the villagers. The local government representatives do not come to

126
this village. The female participants say that in case of any development work the
villagers discuss it in a meeting and then collect money from all families if there is a need
for fund. If the villagers need any advice the union parishad chairman and members
sometimes give such advice to them. The members and chairman do not always help
them. One of the female participants, Amina (aged 40), says, “The member opposed to
the establishment of the village school but the villagers established it by themselves.”
The male and female FGD participants perceive the gap between the rich and the poor in
different ways and data shows some sort of variations in their perceptions about economic
inequality. Both male and female FGDs participants of Ranchandi, Madhupur, Char
Belabo, Arairoshi, and Daxin Berabaria state that the gap between the rich and the poor
has increased over the last 10 years. Both FGDs suggest that the gap has decreased in in
Char Kumaria and Ikumaribhati. Except the above seven communities, the male and
female participants have quite opposite views. For example, the male participants of
Darikhozekhani, Patnipara, Daspara hold that the gap between the rich and the poor has
increased but the female participants believe that it has decreased. In the case of
Gilarchhala, Badalpara, and Ghutia the male participants think that the gap has decreased
whereas the females mention that it has increased. The male participants of Chitain, Uttar
Guthuma believe that the gap has decreased but female participants opine that the
situation has remained the same. In Bisarikathi the male participants mention that the
situation has not changed over the last 10 years but female participants perceive that it has
decreased.
5.3 Inequality and mobility
FGDs on livelihoods suggest that the gap between the rich and the poor has increased in
Darikhozekhani, Patnipara, Ranchandia, Dashpara, Madhupur, Char Belabo, Arairoshi,
Daxin Betabaria over the last 10 years whereas it has decreased in Gilarchhala,
Badalpara, Chitain, Char Kumaria, Ikumaribhat, Ghutia, Uttar Guthuma. The situation is
unchanged or has remained the same in Bisharikathi. In terms of getting access to
economic opportunities data reveals that according to the people of 13 communities a
large number of villagers' access to new economic opportunities has increased over the
last 10 years. The FGD participants of Arairashi and Chitain think that no change has

127
taken place in their communities. The villagers of Modhupur claim that they have less
access to economic opportunities compared to 10 years ago.
The quantitative data shows that 23 per cent of the sample households are movers in those
communities where villagers have more access to economic opportunities while only 12
percent are movers communities with less access to economic opportunities. The numbers
of the rich and the chronic poor are comparatively higher in the communities where
villagers have less access to new economic opportunities.
5.3.1 Distribution of four transition groups according to economic opportunities
Mover Chronic Rich Chronic Poor Faller
High 182 273 272 61 788
23% 35% 35% 8% 100%
Low 9 30 29 6 74
12% 41% 39% 8% 100%
191 303 301 67 862
22% 35% 35% 8 100%
The FGD on LFPDG suggests that socio-political inequality has undergon some change
over the last 10 years. The villagers of Gilarchhala, Ranchandia, Badalpara, Bisarikathi,
Dashpara, Char Kumaria, Ghutia, Daxin Betabaria, Arairoshi, Madhupur report that
inequality has decreased in their villages whereas it has increased in Dorikhozikhani,
Char Belabo and Uttar Gutuma. The FGD participants of Patnipara report that social
inequality has decreased through political inequality has increased there. We find an
opposite picture in Ikumaribhati. In the case of Chitain social inequality has decreased
and the political situation has remained the same over the last 10 years.
The following table shows that 25 per cent are movers in the communities where more
villagers have access to new economic opportunities and 19 percent are movers in
communities with access to economic opportunities. The number of the chronic poor is
the highest (40 percent) in communities where less people have access to economic
opportunities.

128
5.3.2 Access to economic opportunities
Mover Chronic Rich Chronic Poor Faller Total
More access to
economic
opportunities
112 168 133 28 441
25% 38% 30% 6% 100%
Less access to
economic
opportunities
79 135 168 39 421
19% 32% 40% 9% 100%
Total 191 303 301 67 862
22% 35% 35% 8% 100% Pearson Chi-Square = 14.715(a), p = .002
The above table reveals that access to new economic opportunities helps people to move
out of poverty, which is highly significant.
5.4 Reasons of changes in inequality
As mentioned earlier, the FGD on LFPD participants of 13 communities report that
economic inequality has decreased over the last 10 years. For them it means that access to
new economic opportunities has increased in those communities. Nowadays more people
get access to economic opportunities.
The female participants of Badalpara village hold that the gap between the rich and the
poor has been reduced from what it was ten years ago. A female participant, Parveen,
says, "… we do not have to bother the rich anymore. The poor have made progress so
they do not want paddy, rice or money from the rich. They [the poor] themselves can
make chair and sit on them." The statement indicates that the poor people's dependence
on the rich has declined as they are able to earn something for themselves because of
getting access to new economic opportunities. A male participant of Badalpara, Md.
Golam Sarwar, says, “The differences have decreased owing to the expansion of
education. After getting education people have come to realize that it is not good to make
any differences. Muslims are brothers to each other. Those who were sharecroppers had
no value in society. Nobody used to pay any heed to them and their suggestions. But

129
many of their children have become worthy sons of the society by getting education and
taking jobs. Now they can speak up in society. Now everyone presumes that they are
going up, their status is being upgraded; so everyone should listen to him." A male
participant of Daxin Berabari, Mostafa Mian, explains, “There have been changes in the
economic conditions of the people. Earlier, the poor were extremely poor. Now, their
condition has improved doubly which is better than that of the earlier rich people. The
condition of those in the middle class category has improved remarkably. Many of them
have gone abroad with borrowed money and are working. The rich people of earlier times
have advanced by 50 percent in education. Nearly 50 percent have come down the
poverty line. This is because they sat idle at home and did not look for jobs. Thus they
had to sell their lands, or keep it mortgaged to maintain a leisurely life. The differences
between the rich and poor have now narrowed down."
The female participants of Daxin Berabari attribute the reduced inequality to the changing
economic condition of both the rich and the poor in the community. A female participant,
Manikjan, says, “The upper class people are becoming lower class and vice versa. Those
who are in the lower class, they go abroad after selling their land. With remitted money
from abroad, they purchase lands, build houses and thus they eventually become rich."
Another participant Ayesha says, “Just in the way the rich are becoming richer, the poorer
too are improving. They go abroad, and if there are 4/5 sons, they work to earn money.
The condition of the poor families thus improves.”
The villagers of Modhupur think that inequality does not exist as it was 10 years ago. A
male participant, Abdul Khaleque, says, "From the very beginning of the world inequality
persisted. There are differences between the poor and the service holders. The female
participants of Patnipara feel that the poor people have been able to improve their
economic condition due to cooperation among them which is the cause of reduced
inequality. As they point out, women's involvement in different income generating
activities (e.g. poultry, vegetable cultivation, employment at rice mills and boulder
collection) and the improved of their condition with the assistance of NGOs helps them to
make progress. A female participant, Ramisha, cites an example, “Those who previously
came to me for one kilogram of rice, do not do it anymore."

130
5.5 Comparison between bottom and top steps of LoL
The differences between the bottom and top steps of the ladder of life are considerably
high. These steps are characterized by economic condition, social position, age, marital
status, number of earning members, disability, assets and the means of livelihoods. The
characteristics of the bottom step of the ladder are as follows.
People of this step are usually old men or women who do not have any assets or have
very little assets and are mostly settled on other people's land. Women of this step are
often either widowed, or separated and their children do not take care of them. In most of
the cases they either go begging or work at rich people's houses and get some tips. But
they do not work regularly because of chronic illness. They are very resource-poor in the
community, none of them have access to any single capital of livelihoods framework.
People belonging to the top step of ladder are the richest in the community. They have
considerable resources. They have acres of land that vary from community to community.
The quantitative data shows that the average land of the rich is 133 decimals, but the FGD
on LoL suggests that the rich have more land than this. The participants mention that the
minimum land would be more than 200 decimals. They live in either brick-built or tin-
roofed big houses with several structures. Most of the members of their households are
educated, do jobs, run businesses. There are more than one earning member in their
families. In some communities, for example, Gilarchala, and Badalpara, the rich are
mostly absentees and live in the nearby district town and the capital city. They hold a
very prestigious position within the community. They are the key decision-makers in
community matter.
All the 32 matrixes suggest that the number of people belonging to bottom step has been
decreasing over the period. In some cases the bottom step has disappeared over the study
period. The FGD participants of Patnipara, Arairashi, Char Kumaria, Badalpara have
reported that the people of the bottom step are no more where they once were.

131
SECTION VI: ROLE OF FREEDOM, POWER AND INDIVIDUAL AGENCY This chapter will describe how do freedom and power affect mobility? The analysis will
be done both in community level and household level.
6.1 Community level analysis
6.1.1 Freedom
What does freedom mean to people? To define freedom the participants have given various definitions. They have highlighted
different aspects of freedom. Both men and women FGD participants have defined
freedom as living according to one's own wish, peace, self-sufficiency, having enough
money, free from poverty, physical mobility, socially free justice and keep away from any
corruption, not being a subordinate to others. However the female participants have
mentioned that freedom means equality.
In 16 communities in all FGDs the male and female participants have defined freedom as
living according one's own wish.
“Freedom is going about at one's own free will. (Je bhabe khushi chola)". (Selina,
housewife, Arairashi)
“If I can do what my mind wants, that is freedom. Freedom means I do not need to look
up others. Freedom means I can do whatever I wish.” (Aklima, aged 30, housewife,
Dorikhojekhani)
In four communities the participants have mentioned that freedom means wealth or free
from poverty. Such as:
" He who has economic freedom enjoys greater freedom" (female Arairashi) “Money changes everything. There should be food and property. Having nothing, does one have peace?” (Delowara, female participants, Arairashi ) Jinnat Ali says, "I have money. I can spend it freely. I can help someone, and even I may not want to. This is freedom for me." (Jinnat Ali, male, Ranachandi) "Freedom means coming out of poverty. To earn independently to maintain family and bring up children." (Jahanara Begum, female participant, Char Belabo)

132
“To earn money for own expenditure, and to be able to buy one's own desired things, and
provide children’s desired things – are economic freedom. Anybody can start a business
if he has money.” (Ms. Lutfa, Gilarchalla).
The other definitions are as follow: “Freedom is the right to speak freely, no body bothers too much. In fact, freedom is the
ability to live in one’s own way.” (Jahangir Shikder, male, Bisharikathi)
Sadia Begum says, “The ability to earn and spend without any restraint is freedom.”
" Mostafa Hossain says, "We will do our work according to our will, move without
any dependency on others and don't have any debt. This is called freedom." (Mostafa
Hossain, male, CharBelabo
"The equality between the rich and the poor is freedom." (Khodeza, female participants,
Ranachandi)
Different types of freedom
In the FGDs different types of freedom have been reported. In the male FGDs they have
mentioned six types of freedoms; these are:
1) Economic: doing job /business to maintain a good family, economic solvency
2) Social: to be helpful to each other
3) Political: expressing political opinion,
4) Individual/ personal: Right to speak and express one's own desire.
5) Religious: religious liberty, to live in peaceful co-existence and secularism.
In the female FGDs they have reported five types of freedom:
1) Social: ability to speak freely, to live according to one's own will, living all together in
friendly environment.

133
2) Political: Casting vote according to one's own choice and will; to be able to follow the
ideology of any party,
3) Individual /personal: to marry independently, the ability to talk to men without the
permission of husbands, ability to spending one's own income.
4) Physical mobility: to go alone as per one's own wish. To go out without any one's
permission, go to market, roaming at one's free will.
5) Economic: Have full meal, earn money and wealth, wear clothes according to needs
Do men and women experience freedom in the communities in different ways:
In all the communities men and women state that women cannot enjoy the same level of
freedom as is being enjoyed by the men. They have mentioned the difference of freedom
in different aspects such as in the context of physical mobility, decision making, whether
they can work or not etc. Khodeza Aktar says (in Uttar Guthuma), “ The male are more
free. They can move as they like. If a man thinks that he will go to Dhaka, being a male
person, he can go; but the female persons cannot.” "Men can move around freely, they
don’t need anyone’s permission. But the women need permission" (women FGD,
Alkumaribhati). Women's freedom mostly depends on their husband or father. If husband
approve of the freedom of the wife, she cannot enjoy freedom. In Badalpara the female
participants have said, "Men are more free. Besides earning income, they are the head of
everything. You have to take men's permission at every stage. You have to take permission
in daughter's marriage. Even in any argument and dispute, they remain ahead." The male
particpantsof CharBelabo have said, "Women don't have any freedom of rights. They
cannot go out. They are not allowed to go out or to do work for the sake of the religion.
They are not allowed to go out or to do work as it is not socially accepted."
Some men also express that now women enjoy more freedom than before. In Ranachandi
the male participants have said, "Every woman, now goes to NGO. They get different
types of training and learn different slogans. Such as- 'We don't want to stay at a broken
house and don't want to obey every word of the husband'. In Bisharikhati one male
participant Jahingir Shikder has said, “Women are enjoying more freedom than ever
before. Since the Prime Minister is a lady, it helps women to enjoy more freedom.”

134
How do people Acquire freedom?
In all the FGDs male and female the participants have mentioned that to acquire or
increase freedom people need money, wealth, property, education and wisdom.
Out of 16 villages in 12 villages the participants have said that to acquire freedom people
have to be educated. And in 10 villages the participants have mentioned that money
wealth and property are needed for acquiring freedom.
According to the female participants, if a person has more money he can enjoy more
freedom. “If a person has lots of money she can buy anything she wants, if she has not
any money she cannot. It is easy for a person to start a business if she has money.
However, beside money she also should have intelligence and knowledge. But if she has
only intelligence and no money she cannot start a business.” (Sufia, aged 50, housewife;
and Fatima aged 40, tailor).
In women FGD they have also mentioned a different dimension. In Bisharikathi the
women said that when women were living a life only as a housewife, they experienced
less freedom. But since they are working now both inside the house and outside the
house, these have increased responsibilities, consequently, increased their freedom as
well. Of the women of Daxin Betabaria Ameena stated, “Freedom does not increase if
husband does not give it. The wive's whose husbands live abroad are free. They can work
more and go out freely".
Is freedom linked to moving out of poverty?
Among the sixteen villages majority respondents have reported that there is positive
relationship between freedom and wealth. That means increase of economic condition
enriches freedom. However none of them reported that through freedom people could
move out of poverty.

135
6.1.2 Power
What does power means to people
In general, power means having money, possess wealth, land, strength of stick, education,
more son, ability to spell- bound thousands of people, unity and the ability to do
something by oneself.
"If a person has lots of money, lots of wealth, a big area of land, then she/he has more
power". (Fatema, aged 40, female, tailor, Dorikhojekhani)
"Power means the strength of mind, and having money, education and intelligence so that
people with this power can compel others". (Elahi Boks, male, Ranachondi)
" Jor jar mulluk tar, lathi jar mati tar" (He who has physical strength is the owner of
land. Similarly he who has the strength of stick for fighting is the owner of land" (Ms.
Sharban, female, Gilarchalla)
"Kshamata holo nijer atmoshakti. Jar mantri-ministerer sange samparko achhe se
dhamak dite pare. Seye dhamak dite paratai kshamata (Power means one's own power.
Those who have relations with the ministers can intimidate others. Such ability of
intimidation is called power)." (Ashraf Uddin, male, Charkumaria)
Different types of power
In the male FGDs they have mentioned four types of power. Such as :
1) Economical power: having money, having property, having harvesting land and
livestock.
2) Political power : The person who has connection with political parties.
3) Social power: Maintaining relationship with the others. The art of convincing others.
4) Individual power: Having physical strength, knowledge, talent, power of applying law,
and honesty.
According to the females, the type of power is very similar. The power described by
women can be divided into four types. These are as follows:
1) Economic power: Having money, wealth and property and capability to earn money.

136
2) Social power: To work unitedly, can speck in a manner so that the people obey them.
3) Physical mobility: Can move alone, can go to work place.
4) Individual /personal power: Having education, intelligence, physical strength, having
more sons.
How do people acquire more power?
In all the communities both the male and female participants said that it is possible to
become powerful by earning money, by acquiring wealth and properties, by acquiring
education and through politics. It is through politics that they become chairmen or
members.
They have also added that wisdom, intelligence, good behavior, honesty and courage are
required to gain power. If a person's behavior is good people obey him and he is
powerful. He can then influence others.
The women participants have also added when a woman has a husband she has power. A
person who has more male children is powerful. Women can acquire power by taking
loan from NGOs. They can utilize the money and can earn what bring them power.
Is power link to move out poverty?
In all communities both the men and women agreed that there is a link between moving
out poverty and power. However there is a controversy whether is the cause of moving
out of poverty or money brings power.
In six villages men's opinion is that when the poor become rich by earning money, then
power comes in automatically. "With improvement in economic conditions, one’s
economic power increases" (Barku Miah, male, Daxin Betabaris). In Chitain the male
participants have stated that to become powerful one has to improve his financial
condition and that means if financial condition improves one can be powerful. In Gutia
Idris Mia said the same meaning in a different way, “As soon as the rich person becomes
poor his power decreases". Similarly in Patnipara the male respondents have reported that
"the poor do not have power, they don’t have any value in the society and even if they do
right, it becomes wrong".

137
On the contrary the other opinion is: “When one is powerful, his economic conditions
become good” (Ameer Hossain, male Daxin Betabaria). In other words "How can one
have money without power? Power is required to make money." (Majid, male aged, 40,
Dorikhojekhani)
However, the female participants all have mentioned that by becoming a rich person
people gain power. "If one can gradually prosper from a poor condition, he is sure to
become a powerful person". The women of Bisharikhati have said that when a person
becomes solvent people give value to his opinion and his power increases. Others also
have said, "Side by side with the increase of money, power also increases; because by
spending money we can show power and apply power." (Khodeja Aktar, female, Uttar
Guthuma)
6.2 Household level analysis:
Majority of people reported that that they have freedom to say what they want, even it is a
criticism of the government. Over all 67 percent people have responded this. However,
the percentage is highest among the always rich (73%). The next highest percentage is
among the movers 68 percent. The lowest percentage is among the fallers.
However, about the freedom of media nearly fifty percent people think that the media
have freedom. They think that in this country newspapers, radio and TV report the news
freely. The highest percentage (60%) of the chronic poor households have reported that
the media have freedom where as the lowest percentage of fallers (39%) reported this.
Nearly fifty percentage of movers (51%) and always rich (50%) have also mentioned this.
Overall seventy one percent people mentioned that they can talk openly about any
problems that they see in their neighborhood. Among the four transitional groups the
percentage is very similar however the percentage is lowest among the chronic poor
(62%). The finding reveals that the poor people have less freedom to talk openly about
any problem. Whereas the elite people (always rich) have most freedom to talk about any
problem in the village, 77 percent of always rich reported that.
Sixty three percent people have reported that if they wanted to form a group or
association with others in the communities they can do without prior government

138
approval. Highest percentage of always rich (73%) and lowest percentage of chronic poor
(53%) stated this.
Majority of people reported that they have no problem to express their religious belief.
Presently 97 percent households have no problem to express their religious belief. And
virtually there is no variation among the four transitional groups.
About the fair treatment of law few people think that all people in their villages are
treated fairly. Only 36 percent people think that all people in their villages are treated
fairly. However, the situation of the movers and the always rich (movers 73%, always
rich 42%) are better than the chronic poor and fallers (chronic poor 32%, fallers 27%).
Sixty five percent people think that it is not difficult to set up a business now. Highest
percent always rich mentioned that it is not difficult to set up a business now however the
percentage is low among the chronic poor, 57 percent reported this. Thirty five percent
people have reported that it is difficult to set up a business in their villages because the
rules and regulations of the government make it difficult. Among the four transitional
groups highest percentage of chronic poor (14%) have said that it is very difficult to set
up a business in their villages.
Most of the people (77 percent) think that they have all or most control over making
personal decisions (which) affecting everyday activities. Seventeen percent people think
that they have control over some decision. And very few (5 percent) people reported that
they have no control or have control over very few decisions (which) affect every
activity. Among the four transitional groups highest percentage of movers (84%)
mentioned that they have all or most control over making personal decisions (which)
affecting everyday activities. The rest three groups have reported similar percentage.

139
Table 7.1: Percentage of people have reported the steps they belong to in 10-step ladder of power and right (now and 10 years ago)
Steps Movers Always rich Chronic poor Fallers
1 1.05 1.32 14.95 5.97 2 4.19 0.66 22.59 17.91 3 11.52 5.61 24.25 17.91 4 14.14 7.26 15.28 17.91 5 30.89 14.52 12.62 13.43 6 19.90 19.80 6.31 8.96 7 8.90 17.49 1.99 10.45 8 6.28 17.82 0.33 1.49 9 1.05 7.59 1.00 2.99 10 2.09 7.92 0.66 2.99
Total 191 303 301 67 At present highest percent people are in step five in power and right ladder, overall 17
percent people have said that they are now in step five. Among the movers highest (31%)
percent of people are in step five. And the next highest (20%) percent people are in step
six. Among the always rich highest percent (20%) people are in step six and the next are
in step eight (18%). While among the chronic poor highest percent people have stated that
they belong in step three (24%) and the next is step two (23%). Among the fallers most
of the people belong step two to four. The striking finding is among the always rich and
movers majority of people have identified themselves in step five and above in power and
right ladder. Whereas among the chronic poor and the fallers most of the people fall in
step two to step five in power and right ladder.
Majority people have said that the reason of upward movement on power and right ladder
is economic improvement (38%). Among the four transition groups highest percentage of
always rich (41%) have mentioned this reason and the next is movers (39%). However
the percentage is lowest among the fallers, 15 percent. Overall 15% people said that the
reason of upward movement is for starting new business or doing better business. And
among the four transition groups the percentage is very similar. The next highest percent
(12%) of people have reported that more work opportunity or got a job or better job.
Among the four groups highest percentage of fallers have stated this reason (23%).
Majority people (28%) have said that the reason of downward movement is that their
economic situation got worse. Among the mover none of them have mentioned this
reason. Highest percentage of the chronic poor (18%) reported this factor. The next

140
highest percent (11%) of people state that too much debt is the reason of their downward
movement. Some people (7%)also have mentioned that change in government rule is the
reason of downward movement. Among the four groups highest percentage of movers
(18%) have mentioned that change in government rule is the reason of downward
movement.
From the above discussion it can be concluded that the there is positive relationship
between freedom and wealth. That means increase of economic condition enriches
freedom. However none of them reported that through freedom people could move out of
poverty. The quantitative findings have also proved that there is a relation between wealth
and freedom. In different aspect such as: freedom to say what they want, even it is a
criticism of the government; can talk openly about any problems; to form a group or
association with others in the communities they can do without prior government
approval; fair treatment of law; to set up a business is not difficult and control over
making personal decisions in all of these aspects always rich and the movers have
reported higher percentage whereas least reported by the faller and the chronic poor.
In all communities both the men and women agreed that there is a link between moving
out poverty and power. Quantitative finding also evident that among the always rich and
the movers majority of people have identified themselves in step five and above in power
and right ladder. Whereas among the chronic poor and the fallers most of the people fall
in step two to step five in power and right ladder.

141
SECTION VII: INTERACTIONS ACROSS FACTORS 7.1. Ladder of Life Analysis:
In this chapter, the factors for moving up from different steps of ladder of life is identified
and explained based on the FGDs: Ladder of Life as well as the Individual Life Story of
four transition groups. Firstly, all ladders have been distributed in four groups based on a
five steps ladder and a more than five steps ladder. These are: far below the Community
Poverty Line (CPL), far above the CPL, just below the CPL and just above the CPL. For
this stratification we have followed these: – For ladders that have steps less than or equal to 5, one step above/below the
CPL can be taken as “level of well-being just above/just below the CPL”. The
extreme top most and bottom-most steps can be taken as “level of well-being
far above/far below the CPL”.
– For ladders that have more than 5 steps, one step above/below the CPL can be
taken as “level of well-being just above/just below the CPL”. The extreme top
two and bottom two steps can be taken as “level of well-being far above/far
below the CPL”.
Then all factors for moving up from each of these groups were identified. How these
factors works was also identified. Finally, two entire groups of far below and far above,
and on the other hand, groups of just above and just below were compared to measure the
differences.
7.1.1. Factors to move up from far below the CPL
In this section the factors to move up are particularly discussed on the group of people
those who are far below the community poverty line (CPL) among sixteen communities.
According to the most of the respondents, it has been found that the people of these step
one are stagnant. They explain that it is almost impossible for this group to move up since
they are living on the bare edge of survival, having no means to move up. They could not
develop much if no miracle happens. They do not have anything that could help them
pulling out from poverty. On analyzing both the male and the female FGDs ladder of life
of these sixteen communities some important factors have been identified for moving up
of the group of far below the CPL. These are as follow; having land (at least homestead)
land, having better social connection for job or work (better patron) or for homestead,
better opportunity to run their livelihoods, physical strength,

142
Table 1: Factors for far below the CPL Sl. Factors Far below the CPL
(community = N) 1 Entitlement of any kind of land 9 2 Availability of livelihoods 9 3 Physical strength 8 4 Access to NGOs 8 5 Social connection 7 6 Small family size 7 7 Access to education 7 8 Presence of male active family member 6 9 Multiple source of income 6 10 Help from the government 5 11 Access to resource and endowments 4 12 Save money 4 13 Need to do hard work 4 14 Training or develop skill 2 15 Both husband and wife work outside 2 16 Number of daughter for marriage 1 17 Reopening of weaving machine 1 18 Access to service delivery 1 19 No natural disaster 1 20 If luck favors 1
limited numbers of family members and more income earners or more sons, having
education, access to NGOs and opportunity to get work as day labour, or any fixed work,
available work, regular work in the village or in Dhaka. They mentioned some other
factors which are not so significant. For example, good resources or security in food,
savings and investment, multiple sources of income etc. Here the main factors, which
support far below the CPL to move up, are explained.
1) Access to land
On analysing the FGDs LOL it has been found that for moving up from far below the
CPL, the most essential factor is land. Among the sixteen communities, nine communities
have mentioned about land (cultivable or at least homestead land), where they can
cultivate at least some vegetable or can rear hens or goat which help them to increase
their income and moving up from their level.
2) Better social connection
It has also been found that to move up from this level they need better connection with
the person who can provide them job or work (better patron) or shelter at his homestead.

143
Here also nine communities have mentioned these factors. With the support from better
patron they also can run their livelihoods smoothly. On the other hand, they can get some
food from them when they starve. Some also mentioned the help from government.
3) Physical strength
They have also mentioned the factor of physical strength which is mostly common factor
and main factor to move up. Among the sixteen communities eight have mentioned about
this factor for moving up from far below the CPL. As this group mostly depend on the
income from physical labour, good physical strength can help them to move up from their
level.
4) Access to NGOs
They also emphasize on the help of NGOs to move up from the level of far below the
CPL. They can change their condition gradually by taking loan from NGOs. Here also
eight communities have mentioned this factor. From the discussion of ladder of life of
Char Belabo it has been found that those who take loan from NGOs and get involved
either in vegetable cultivation or rickshaw pulling are able to make a bit changes in their
lives. It is also reported that if any big accident occurs in their family, they become ruined
loosing whatever they have saved during their whole life. They do not have any savings.
5) Have more than one income earner
Among the sixteen village six community people have reported of having more than one
income earners which help for moving up from the level of far below the CPL. Most of
the respondents of these ladder of life reported that the people who belong to this
category are widow, aged men or women and sick people – these people can not work
hard. Moreover, they do not have any male income earner. On the other hand, some other
types of households belonging this category have very big family size but only one
income earner. Some of them have more than one daughter need to marry. "How can a
person move up if five people depends on him?" (Maleka, Ikumaribhati)
6) Opportunity to multiple income sources
Out of sixteen communities six communities reported that for survival or for moving up
from far below the CPL people need to search multiple sources of income. They
sometimes get job as day labourer during the harvesting season, sometimes they pull

144
rickshaw during off season of harvesting. Besides women need to do work outside the
home with husbands.
7.1.1.1. Interaction between the factors of far below the CPL Different communities indicate different combinations of factors for far below the CPL
for moving up to next level. In this section we will explain these different interactions on
the basis of community synthesis reports. Among the sixteen villages eleven villages has
these types of interactions. These are as follows:
Most of the people of Dakshin Berabaria have stated that the people of the group of far
below the CPL do not possess any land. They do not find jobs. The majority of these
people are women. Although they have husbands, the latter remain sick and cannot do
any kind of job. These people are dependent on others for aid and assistance. That is the
reason why this class cannot climb up the ladder of life. Therefore, it is difficult for them
to reach to upper level, because, these people do not possess any land, savings or any kind
of resource.
The people from Char Kumaria have stated that there is a possibility of change within the
period of having physical strength. Only the physical strength i.e. their working capability
can bring them to a better position from their present position. Yet, it is very difficult to
go to a upward position from this position. They can develop themselves if they get any
support from the government, such as, training, monetary help, etc, and if they are taught
how to invest the money in a profitable sector. They can change their condition gradually
taking loan from the NGOs. If their children are given the opportunity to study they can
be able to develop their condition. They engage their children for earning rather than
schooling. One of the male participants Babul Talukdar says, “When the children can
manage to control the paddle they are sent to pull the van rickshaw.” It is very difficult
for this class to move upward from their landless situation. Their landlessness is a big
problem. Selina Begum said: “If we have homestead, we can improve our situation by
rearing poultry.” They work as day laborers round the year. This is their only means of
livelihoods. By taking loan from the NGOs they can undertake small business and earn
extra money. They can also earn money by buying van or rickshaw and giving rent out
these. In this way, the situation of the landless can be improved.

145
Similarly the people of Bisharikathi have expressed that it is almost impossible for this
group to move up since they are living on the bare edge of survival, having no means to
move up. They could not develop much if something miracle would not happen. They do
not have anything that could help them to pull out from poverty. It seemed like an endless
process before the NGOs started operating. Now these people can at least eat with the
money they borrow from the NGOs as credit. If they could get the security of essential
needs of human life such as food, housing etc, they might be able to repay the money.
The female participants have mentioned that they do not have any permanent income or
job. Since they are physically weak, they even can not take loan so that they can invest,
work and prosper in life.
The Char Belabo people also think about the role of NGOs that can help them developing
their situation. They stated that if they would have small families and take loan from
NGOs and involve them in either vegetables cultivation or rickshaw pulling, can be able
to make a bit changes in their lives.
The Chitain people also stated that people who are living in this village in a worst
situation are called destitute. Category of these people has no land. They do not have
dwelling houses and live in other peoples' land. They beg from house to house for their
livelihood. They are old though they have children but their children do not look after
them.
Those who are in a better position from the step 'Most destitute' the respondents termed
them as poor. They do not have money and land property, have number of children. Some
of them have little amount of lands. They usually work to other people's house and field.
They live in a thatched house and they have no capacity to provide higher education to
their children. Along with the husbands, women also work outside. Usually they do the
rice husking, do the domestic work in other peoples’ house. They live their livelihood
mostly on doing domestic works at other people's house. In this category some landless
people pull rickshaw or van and sometimes work as laborer in others land.
The people from Ikumaribhati wish to take loan from the NGOs and other samitis. Now
they some kind of businesses, rear ducks and chickens, and some are doing the businesses
of selling Indian sari (womens' dress).
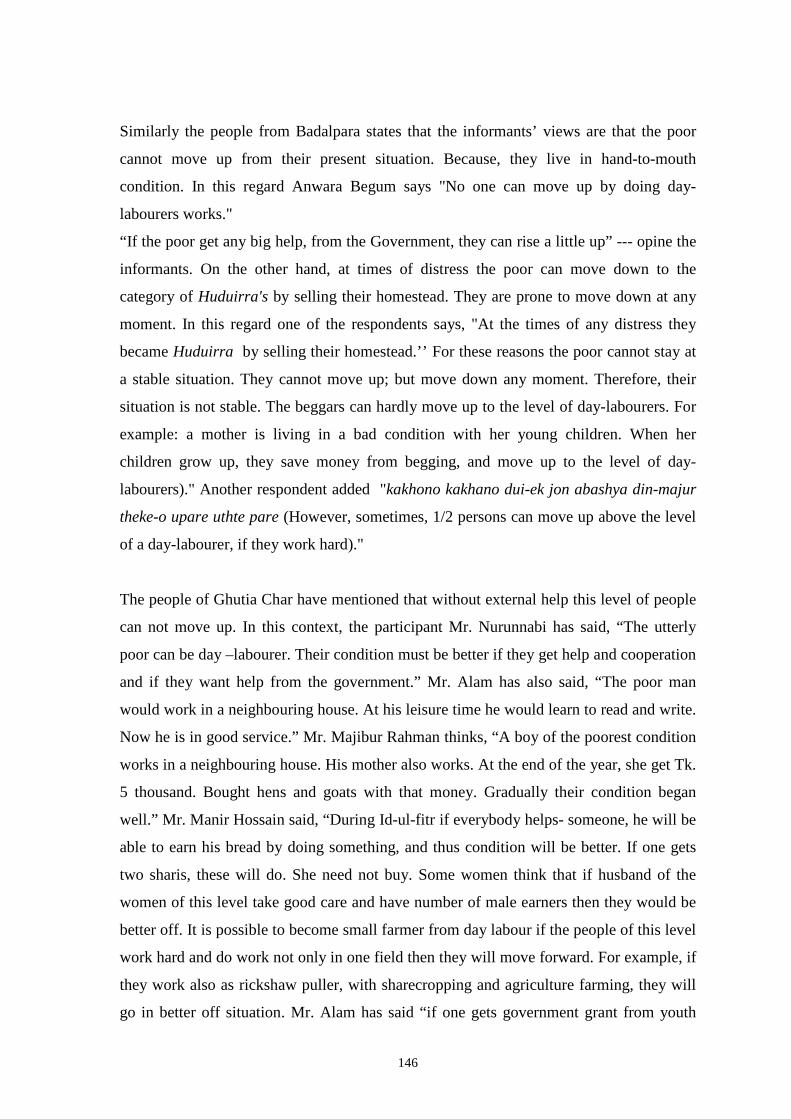
146
Similarly the people from Badalpara states that the informants’ views are that the poor
cannot move up from their present situation. Because, they live in hand-to-mouth
condition. In this regard Anwara Begum says "No one can move up by doing day-
labourers works."
“If the poor get any big help, from the Government, they can rise a little up” --- opine the
informants. On the other hand, at times of distress the poor can move down to the
category of Huduirra's by selling their homestead. They are prone to move down at any
moment. In this regard one of the respondents says, "At the times of any distress they
became Huduirra by selling their homestead.’’ For these reasons the poor cannot stay at
a stable situation. They cannot move up; but move down any moment. Therefore, their
situation is not stable. The beggars can hardly move up to the level of day-labourers. For
example: a mother is living in a bad condition with her young children. When her
children grow up, they save money from begging, and move up to the level of day-
labourers)." Another respondent added "kakhono kakhano dui-ek jon abashya din-majur
theke-o upare uthte pare (However, sometimes, 1/2 persons can move up above the level
of a day-labourer, if they work hard)."
The people of Ghutia Char have mentioned that without external help this level of people
can not move up. In this context, the participant Mr. Nurunnabi has said, “The utterly
poor can be day –labourer. Their condition must be better if they get help and cooperation
and if they want help from the government.” Mr. Alam has also said, “The poor man
would work in a neighbouring house. At his leisure time he would learn to read and write.
Now he is in good service.” Mr. Majibur Rahman thinks, “A boy of the poorest condition
works in a neighbouring house. His mother also works. At the end of the year, she get Tk.
5 thousand. Bought hens and goats with that money. Gradually their condition began
well.” Mr. Manir Hossain said, “During Id-ul-fitr if everybody helps- someone, he will be
able to earn his bread by doing something, and thus condition will be better. If one gets
two sharis, these will do. She need not buy. Some women think that if husband of the
women of this level take good care and have number of male earners then they would be
better off. It is possible to become small farmer from day labour if the people of this level
work hard and do work not only in one field then they will move forward. For example, if
they work also as rickshaw puller, with sharecropping and agriculture farming, they will
go in better off situation. Mr. Alam has said “if one gets government grant from youth

147
development -one takes loan and rearing poultry can improve his condition.” Mr. Majibur
Rahman Sarkar said, “ One must do labour, one must cultivate land.” Mr. Abdus Salam
junior has said, “By taking loan one has to buy rickshaws, horse-drawn carts. Doing work
throughout the day and by pulling rickshaws at night, one has to repay loan.” In this
connection Ms. Moneja has said, “Small peasants are no more called poor because side by
side they rear cattle, poultry. Besides they cultivate as sharecropping in one and a half
pakhi of land with cultivation of their own land. Side by side they pull rickshaw. By
working as labour in other’s land they save money and with that they can mortgage land.
Ms. Monjera says, “From day labourer by using their intellect, rowing cattle, taking share
of other’s land grow paddy, tobacco, chili and thus saving money, they become small
peasant.”
The people from Patnipara have stated that those belonging to the poor class can change
their condition if some of them have some land or small businesses or jobs. They can
borrow money to invest in the land. Thus, through the payment of installments, they can
improve their lots. Those who can provide education for their children can change their
condition. Therefore, there are many types of employment opportunities among this class
and they can improve their condition through the proper use of those opportunities.
It has been found from the data from Modhupur that the day-labourers, if they can harvest
good crops, can easily move up to the middle-income class. They can also do so if
floodwater does not damage their crops. By earning more through hard labour, they can
also upgrade their position to the middle-income group. The orphans can move up to the
level of poor if luck favors them. Being grown up and earning a good amount the children
can go to the level of poor.
7.1.2. Factors for moving up of the group far above the CPL
The situation of these households of this group of far above the CPL is quite settled and
risk free in the society. They have all the possible elements to move up further. They need
not worry for foodstuff for the whole year, usually they have some surplus. Besides, they
earn quite a good amount from multiple sources of income. According to the respondents
of LOL, at least 23 factors works individually or jointly for moving up or keeping them in
the same level of the group of far above the CPL. Here the main factors, which support
far above the CPL to move up, are explained.

148
1). Having land or entitlement of vast land
Having land or entitlement of vast land is the main reason for maintaining the category to
remain in same level. Out of sixteen, people from fifteen communities have mentioned
about this factors. Most of the ladder have reported that this category have at least 1-2
acres of land. The households of this category have vast land and have security of food
for whole around the year. If they are engaged in cultivation of land, there arises no need
to hire laborers. As they have more cultivable land they can cultivate different types of
crops. They have poultry and livestock in their own homestead. This way, money is
saved.
Table 2: Factors for far above the CPL
Sl. Factors Far above the CPL (community = N)
1 Having vast land 15 2 Availability of fixed or salaried job or work 14 3 Access to education/higher education 14 4 Savings 12 5 Access to resource and endowments 11 6 Social status or honors 11 7 Hard work 9 8 Multiple source of income 8 9 Some even send a family member abroad 8 10 Use modern technology in agriculture 7
11 Presence of male active family member 6 12 Multiple or commercial use of land 4 13 Access into NGOs, access to loan 3 14 No natural disaster 3 15 Need help from the government (training, monetary
help etc.) 2
16 Confidences and intelligence 2 17 Less daughter for marriage 1 18 Physical strength 1 19 Both husband and wife work outside 1 20 If no need to pay big amount of dowry 1
21 Engage labour or give share cropping land 1 22 Become rich using unfair ways 1 23 Proper use of resources 1
“They own 4/5 bighas (one bigha is equivalent to 52 decimals in this particular
community) of agricultural land that is why they do not have any scarcity of
food.”(female, Charkumaria). Out of sixteen communities, seven have mentioned that
because of using high technology in cultivating their land, the rich people can maintain

149
their level. Moreover, four communities have mentioned that multiple use of land is also
another important factor. These people use their land commercially with high amount of
varieties of crops. 2) Access to higher education
Out of the sixteen communities fourteen have mentioned that access to higher education
is main factor for moving up from the category of far above the CPL. The family
members of this category are educated. The children of them are service holder. They
have stable income. If they do not get full harvest in any season, their other sources of
income keep them stable in the same category. Because they are educated, they have
knowledge and intelligence, they can use their intellect and money together to move up
from their level. 3). Opportunities of fixed and salaried work
Out of sixteen communities, most of the respondents of ladder of life of fourteen
communities have reported that the secured work, or better opportunity to work or any
fixed and available work can help move up or maintain their level of the people of far
above the CPL. Their children are educated and have job in city or town. 4). Savings or proper investment of money
Out of sixteen communities, twelve communities have mentioned that if the households
of this category can save money and invest intelligently or properly they can remain rich.
The accumulation of capital and proper use of that capital ensure them to remain rich. 5). Great social economic as well as political power and security
The most important factors for remaining better off is earning respect for their wealth thus
establish themselves in the higher class of the society which also help them to become
local government representative. Among sixteen, communities nine have mentioned that
rich people can remain stagnant in their own level through this power. They also
mentioned that social situation of the people of this category is such that they cannot ask
for monetary assistance from other people. They are in risk-free-condition; they have
food stock round the year. These situations keep them free from tension and to help them
to move up. “Generally the solvent people do not go down step, if some one goes down,
he could recover the situation and go up very soon as their children have job or live
abroad.” (Shanu Mia, Char Belabo). Their powers are more and are more solvent
economically. They give leadership in the society and do all types of their work by hiring

150
laborers. The education rate is higher among them and they are much aware. They have
enough money, so they never feel shortage of money. They use modern technology in
cultivation. The female participants opine that they always stay in this step. Unless a big
accident occurs, they never move down from this step. 6). Have to do hard work
It has been found from the data that out of sixteen, about nine community people have
mentioned that people from this category need to do hard work for maintaining their
level. According to the respondents, this category people never typically not all way back
into poverty. Because they have land and more than one sources of income, so if they can
work hard, then they can maintain their level. In this regard, Shanu Member (male, Char
Belabo) says, “Generally the solvent people do not go down step, if some one goes down
then he could recover the situation and go up very soon as their children have job or live
abroad.” 7) Family member send remittance from abroad
Out of sixteen communities, around eight have mentioned that some of them can even
send one or two of family members abroad for doing job there. Therefore, with other
factors this also play important role to stay them in the same level. They send money to
them and that is the main reason they are in this top category. “The families of this step
are much solvent. They have more than one sources of income. As they have more
cultivable land they can cultivate different types of crops. They have poultry and
livestock in their own homestead. Their children either go to schools or do jobs. Some of
the young of this step live abroad and send remittance to the family.” (Male LOL, Char
Kumaria)
7.1.3. Compare the factors far above the CPL and far below the CPL
Though some of the factors are same among both of the groups of far below the CPL and
far above the CPL, there are some differences in terms of extent and depthness of the
factors and also in interactions in the factors.
7.1.3.1 Extent of factors a) Having land
Having land is a factor both for far below and far above the CPL groups. But for far
below the group having land is for survival, however, having vast land keep always better

151
off to maintain their level. Most of the respondents of Ladder of Life have mentioned that
because the people far below the CPL have no land (even no homestead land) they can
not move up. b) Education
The group of far below the CPL need or desire at least minimum level education to get
minimum service or to run small business. But they do not have ability to continue up to
that level, when their children can be able to reach paddle of rickshaw, they start rickshaw
pulling. However, the children of rich people are able to get higher education and they
expect their children will achieve higher education and get high salaried-service in Dhaka
city or any other big city or can go abroad for doing jobs. Then they can be able to
maintain their level.
c) Physical strength and hard work
As physical strength is only means of work for the group of far below the CPL, around
eight communities have mentioned it as a factor for far below the CPL. On the other
hand, the hard work is a factor for the group who are far above the CPL. But they have to
do hard work to increase their existing resource. Besides, they get more profit if they do
hard work on their land and do other business reversely, the people from far below the
CPL group need to work hard with their physical strength for their survival.
d) Having social connection
The group from far below the CPL do not have any social connection but they need social
connection for their livelihoods. However, social connection and social prestige is needed
for far above the CPL groups for social and political power. It has been found that they
sometimes become government representatives when they achieve social power.
7.1.3.2. Differences having some factors
a) Multiple sources of income
The households who belong far above the CPL have multiple sources of income for
maintaining their level. However, the households who belong far below the CPL do not
have more than one income sources. They can not use their land in multiple way,, on the
other hand rich people have education, land and capital – they use it for different sources
for profit.

152
b) Having vast land
The people of far below the CPL have neither homestead land nor cultivable land but
most of the people belonging in far above the CPL have vast land and they get most of
their income from cultivation and using modern technology and use their land cultivating
multiple crops.
c) Income from the remittance
There is far difference in terms of remittance between the groups of far below the CPL
and far above the CPL. Out of sixteen communities, around 50 percent communities have
mentioned that rich people send their one or more sons in abroad and they can do job
there and earn lot. On the other hand, people from far below the CPL can not even
imagine it.
7.1.4. Interaction the factors of far above the CPL
It is difficult to come down from the group of far above the CPL to lower sage. Because,
they have good savings, land and scopes of multiple sources of income. They have two
sons at an average, which can also do jobs. They have sustainable income. So, if floods
affect them, they can recoup it in other ways. "There is no question of falling their status
and economic conditions. They have permanent salary and other income. They have also
informal money lending business. So, it is very difficult for them to go down in any case".
(Moula Mia, Modhupur). “They will never fall down. They have varieties of income
generating activities. Besides, their main strength is their children who are developing
themselves gradually. They used to do the services before but now they are becoming
doctors or engineers. The most beneficial businesses are money lending on interest and
stock businesses. There is no loss in these businesses. Most of them are doing the services
and getting the remuneration at the end of the month. They have land kanis (local
measuring unit of land) after kanis. They sell the paddy.” (Ikumaribhati) “If they are
highly educated, if they become doctors and engineers or magistrates they can be rich”
(Alam, Ghutia Char). “Those who are rich are rich traditionally, their fathers and
grandfathers were rich.”(Mujibur Rahman, Ghutia Char). “Men think that they become
honorable if they get proper education and become people's representatives. If they
behave well with all, do justice, can get honour.”(Nurunnabi, Ghutia Char).

153
7.1.5. Factors for the communities just below the CPL
Most of the people have stated about the households that "it is harder for them to move
upward into the middle category for below the middle categories people because, most of
them do not have stable income source. After fulfillment of daily needs and repaying
credit with their limited income, it is harder to increase capital [to increase capital for
further development] ".(LOL, Arairashi) However, people of Chitain have expressed that
"Era gorer chal pani kheai beche thake" they are solvent. Here the main factors, which
support just below the CPL to move up, are explained.
Table 3: Factors just below the CPL
Sl. Factors just below the CPL (Community =N)
1 Agriculture related activities 12 2 Hard work 11 3 Save money and use properly 9 4 Presence of multiple sources of income and more than one
income earners 7
5 Access to education or higher education 7 6 Family size 6 7 Access to NGOs, access to loan 6 8 Secured work 5 9 Social respect 5 10 No natural disaster 4 11 Confidences and intelligence 4 12 Training or develop skill 3 13 Need support from the government (training and monetary
help) 3
14 Both husband and wife work outside 2 15 Risk-free condition 2 16 Security in food and health 1 17 Re-open the weaving machine 1 18 If luck favors/ favor of God 1 19 Sending a family member abroad 1 20 Multiple use of land 1
1) Entitlement on land or agriculture related activities
The ladder of life of twelve communities have mentioned that for moving up from just
below the CPL, the main factors is having land and agriculture related work. According to
the participants, agricultural activities (independent farming and sharecropping) is one of
the main factors to move up from this category. They have mentioned that they are able to

154
use their land for multiple crops cultivation over the whole years. This is also true if there
is good harvest and crops are not damaged by floods. They have also mentioned that if
they can be able to mortgage land and can extend their agricultural area, their economic
situation will be improved. The findings reveal that this group of people is more
dependent on agricultural activities.
2) Hard work Data reveals that physical strength or hard work is the main factor for moving up for the
group who belong to this group. Among the sixteen communities, eleven have mentioned
that if they can work hard, they can change their situation. They have to struggle for their
livelihood throughout the year for moving up from their steps. They can cultivate their
own land and can also get lease of others' land. People can move up by selling labour
(male, Ranachandi), earn more through hard work and using more labour force.
3) Savings money and accumulate capital
Data reveals that among the sixteen communities, nine have mentioned that if they can
save money and invest intelligently or properly they can change their condition. They
have mentioned that they need to accumulate capital by saving money on a regular basis.
They have said, “If there is more than one earning member in the family then it goes well.
The families of this step can move through saving money.” (Male LOL, Char Belabo). “If
they have fewer members in the family, they could even save some money. With that
saving, they could buy more fishing nets. Their position in the village belongs to the poor
group, but hard work can change their social status”. (LOL, Bisharikathi). Md. Nurul
Islam (Ikumaribhati) has given an example, "Toslim was the owner of only a few area of
land. But later on by taking mortgage, he increased the area of his land. When his income
started increasing from his land he started savings by selling the paddy of his land. After
saving a reasonable amount of money he started the business of cosmetics in the market
of Joymonir hat".
4) Multiple sources of income
Multiple sources of income and multiple income earners are most common factors for
every category. Among the sixteen communities, at least seven communities have
mentioned about this factor for moving up from the category of just below the CPL. This
category can have changed their condition if they have presence of male active one or

155
more than one family members or having four or five sons. Besides, they have to have
multiple sources of income including agriculture work.
5) Access to education or higher education
Data reveals that most of the people of the group of just below the CPL have emphasized
on education, they are adamant to continue children's education. At least seven
communities have mentioned that if their children complete their study and can get good
job or run business, they can move up from poverty level also.
6) Family size
The other condition for this category for moving up is having small family size. Less
children or less dependent members for feeding and/or if they have fewer numbers of
daughters waiting for marriage contribute them to move up to upper steps.
7) Access to NGO or credit
The findings reveal that access to credit also is a very important factor to move up. Out of
sixteen communities, six have mentioned that those who are below the CPL of ladder of
life can change their position very easily if they get sufficient amount of credit for
running businesses. "once they were in good condition and they were involved in
weaving business [so, they are much aware about cost benefit]. Now if they get little bit
of opportunity like credit support, they can upgrade themselves." (male, Arairashi).
7.1.6. Factors for just above the CPL
In this section we will discuss about the factors which support the group of just above the
CPL. According to the FGD: Ladder of life around 27 factors can support this group to
move up individually or jointly. Here the main factors, which support just above the CPL
to move up, are explained.

156
Table 4: Factors for just above the CPL Sl. Factors Just above the
CPL (community = N)
1 Entitlement of land and agriculture related activities 16 2 Secured or fixed work/job or start big business 15 3 Savings money 15 4 Access to education or higher education 14 5 Multiple source of income 12 6 Security in food and health / risk free condition 11 7 Hard work / physical strength 10 8 Access to NGOs, access to loan 10 9 No natural disaster / bumper yield of crops 9 10 Presence of male active family member 8 11 Family size 7 12 Social status or honors 7 13 Confidences and intelligence 5 14 Send one or more than one family member to abroad 5 15 Multiple use of land 4 16 Loss in business 3
17 Get high price from product (vegetable or rice) 3
18 They also need to aspire for further development 2 19 Number of daughter for marriage 2 20 Use modern technology in agriculture 2
21 Need support from the government 1 22 Both husband and wife work outside 1 23 If luck favors/ favor of God 1 24 Passion for gambling 1
25 If do not need to pay big dowry 1
26 They can do all types of work without hesitation 1 27 Establishment of industries 1
1) Entitlement on land or agriculture related activities
All communities out of sixteen, have mentioned that the main factor for moving up from
the category of just above the CPL are entitlement of land (both independent farming and
sharecropping) and agriculture related activities. The people of this category is mainly
dependent on agriculture. However they have multiple use of land as well as they have
small agro-based business. At least four of them have mentioned that they are able to use
their land for multiple crops cultivation over the whole year. On the other hand, at least
two of them have mentioned that they use modern technology in agriculture. This is also
true that if there is good harvest and crops are not damaged by floods. They have also

157
mentioned that if they can be able to mortgage land and can extend their agricultural area
their economic situation will be improved. The findings reveal that this group of people is
more dependent on agricultural activities.
2) Secured work or available livelihoods
Out of sixteen communities, fifteen have mentioned about the factors of moving up for
this category is available of secured work or livelihoods. They have mentioned that
besides the agriculture, one or more than one member of family have started small
business or doing salaried or fixed job which increase their income. They have mentioned
that during off agricultural season, the male members of this village pass their time at
leisure. So, if they can use this leisure time in any non- agricultural activities they could
improve their economic condition. Or, they can start business which is helpful for their
move-up from poverty. They have reported that if a person can start small business his
economic position would be changed. In these villages, most of the people are involved in
agriculture sector. And their main income source is agriculture. However in these
villages, to improve their economic situation people start non-agriculture activities. In
other words this finding suggests that diversity of income generating work is required for
moving-up.
3) Saving money
Among the factors for moving up from the steps just below the CPL doing hard work and
savings money are main factors here. Data reveals that among the sixteen communities
fifteen communities have mentioned about savings of money. They need to do hard work
having two or three earning members in the family and have to struggle to save money
which they can use as capital for small business and they can change their situation.
4) Access to education or higher education
Apart these factors some people move up from this steps because some of their children
are service-holders in the city or work in abroad. Out of sixteen communities, fourteen
have mentioned that they have to obtain higher education to change their situation and
have to do job in town or Dhaka city. Some also have mentioned of going abroad for
doing work there.

158
5) Access to NGOs or loan
Because of NGOs some people have moved up from lower middle class to middle class.
Around ten communities have mentioned that they need access to loan or NGOs to move
up from this category. They have mentioned that if they get access to loan can use it in
different sectors, not only on agriculture but also in several business or rearing cows or
goats. In this situation they do not have to depend only on selling their labour. They can
start any business. Some NGO group members have taken loan and have built houses for
rent. Nazrul Islam (40, businessman, Gilarchalla) says, “Those who had some land as
well as seven dependent household members ten years ago, they were not able to provide
sufficient food. But now because of mills and factories established in this area, they build
houses in a land of one bigha and are able to rent out 8 to 10 rooms. And can earn 10
thousand taka per month. Now they are no longer poor.”
There are some other factors, which help people moving up such as hard work, multiple
sources of income, risk free situation, access to NGOs, no natural disaster etc.
7.1.6.1. Compare to the group of just below the CPL and just above the CPL
Comparing two groups of just below the CPL and just above the CPL it has been found
that there is some differences among them. First of all the people of just above the CPL
are in better condition, at least they are in risk free situation. At least eleven communities
think that this category is in risk free condition. They do not have to think for food for the
whole year, because they can produce their food for the year by themselves. On the other
hand, people say that “their social situation is such that they do not need to ask for
monetary assistance from other people” Another one says “possibility of their situation of
moving down is very little. They always take steps after considering their own situation.
As a result, they live in a risk-free condition”
Secondly, the people live below the CPL need to do much hard work for moving up. Not
only this, they need to struggle with limited resources.

159
7.1.7. Factors what impact OPL, CPL
7.1.7.1. Comparison between OPL and CPL Based on male Ladder Of Life of all communities the status of Community Poverty Line
and Official Poverty Line is shown below.
Table 5: Comparison between OPL and CPL
Sl. Name of Community Status of CPL Status of OPL OPL stands 1. Berabaria Above 6th step Above 5th step Above the CPL 2. Char Belabo Above 3rd step Above 2nd step Above the CPL 3. Bisharikathi Above 3rd step Above 3rd step Same as the CPL 4. Ranachandi Above 3rd step Above 2nd step Below the CPL 5. Chitain Above 3rd step Above 3rd step Same as the CPL 6. Ghutia char Above 2nd step Above 4th step Above the CPL 7. Dashpara Above 2nd step Above 2nd step Same as the CPL 8. Modhupur Above 3rd step Above 4th step Above the CPL 9. Patnipara Above 3rd step Above 3rd step Above the CPL 10. Ikumaribhati Above 2nd step Above 3rd step Above the CPL 11. Char kumaria Above 4th step Above 4th step Same as the CPL 12. Arairashi Above 2nd step Above 3rd step Above the CPL 13. Dorikhujikhani Above 2nd step Above 3rd step Above the CPL 14. Gilarchalla Above 4th step Above 3rd step Below the CPL 15. Guthuma Above 2nd step Above 2nd step Same as the CPL 16. Badalpara Above 4th step Above 3rd step Below the CPL
From the table above it is clear that in most communities the CPL is always below the OPL.
Figure 1. Ladder of Live of Gilarchalla
Shampadshali or Uchhastreni (wealthy or higher class) 8 Matbar (village leader or influential persons) 7 Uchha Madhayabitta (higher middle class) 6
Madhayabitta (middle class)
5
Nimna Madhayabitta (lower middle class) 4
Gorib (poor) 3 Din Majoor (day labourer) 2 Fakir (Beggar 1
Official Poverty Line
Community Poverty Line

160
Figure 2: Male Ladder of Life of Ghutia Char
‘DIN MOJUR" (Day Labour)
"NISSHAW" (The Poorest People)
‘DHONI LOK" (Rich People)
"SHONMANI LOK" (Honorable people)
‘MAJHARI KRISHAK" (Middle class farmer)
‘CHOTO KRISHAK" (Small Farmers)
‘DIN MOJUR" (Day Labour)
"BHUMIHIN" (Meek Poor / Landless)
‘CHOTO KRISHAK" (Small Peasant)
‘MIJHA GRIHASTHA" (Medium Cultivator)
‘BORO GRIHASTHA" (Big Cultivator)
‘BORO LOK" (Rich Man)
Ladder of Life Male Ladder of Life Female
CPL
OPL

161
7.1.7.2. Factors What Make Possible to Move Up From Most Difficult Step In some communities most difficult steps are just below the CPL, the people in this steps
have lack of savings, lack of money for investment and for sending family members to
abroad. In some communities according to some respondents the most difficult categories
to move up are belong middle in the CPL like “small service-holders/small businessmen”.
They identified the same reasons and it is not possible for them to move up to the next
step by saving after defraying the expenses of their families.
On the other hand some respondents have reported that people who belong far below the
CPL are the most difficult steps to move upper steps. Lack of asset is the main factors
what hinders them to move upper steps. Majority of the people in these steps are women,
old and disable. It is difficult for the dinmajur to move up because of lack of savings, lack
of a permanent scope of employment and they have no assets. "Ghor nai,vitey bari jomi
na thakar karoney Gach lagatey parena"- (They have dwelling house, but no homestead
land; so cannot plant trees, unable to raise livestock’s) and they have no (‘kaaj korar lok
nai) income earning members in their families. They live on others land – LOL,
Dorikhujikhani. These people have only one escape route away from their present
situation if they migrate away for searching job. According to FGD participant in some
other communities, the most distressed people like old and disable are belong the step,
which is fare below the CPL, cannot climb up even they have money as they are old and
disable. According to the male FGD move up to 'small farmer' is difficult. In this respect
Mr. Abdus Salam of Ghutia Char said, “It is hard for poor people to move up this step. If
a person doesn't own land, cultivate others' land by sharing. And when the crops damage
due to flood, how will be the condition of the poor person improved?

162
Figure 3: Ladder of Life of Dashpara (male-FGD)
7.1.7.3. The Categories Which Consider a Step as a Middle Class From the findings from all male Ladder Of Life it is clear that all middle class are belong
just above the CPL. That means movers are middle class.
Table 6: Middle class
Sl. Name of communities Step of middle class 1 Modhupur Just above the CPL 2 Dashpara Just above the CPL 3 Patnipara Just above the CPL 4 Guthuma Just above the CPL 5 Ghutia char Just above the CPL 6 Badalpara Just above the CPL 7 Ikumaribhati Just above the CPL 8 Dorikhujikhani Just above the CPL 9 Gilarchalla Just above the CPL 10 Berabaria Just above the CPL 11 Char Belabo Just above the CPL 12 Char Kumaria Upper above the CPL 13 Arairashi Just above the CPL 14 Bisharikathi Just above the CPL 15 Chitain Just above the CPL 16 Ranachandi Just above the CPL
‘Shompodshalee’(Wealthy )
‘Modhhom Sreanee’(Middle class )
‘Khudrobyaboshaee’(small trader )
‘Din mojur’(daily wage laborer )
‘Deen Doriddro’(the poor )

163
7.2. Analysis of individual life stories:
In this section, the factors for moving up from different steps have been identified and
explained based on the Individual Life Stories of four transition groups. Firstly, we shall
identify all these factors that help people move up from each transition groups such as
chronic poor, mover, always better off and faller.
7.2.1. Factors for moving up from the chronic poor
Almost all people of the chronic poor group have mentioned that it is difficult for them to
move up from their steps because they have no endowment of resource, and that some of
them have no earning members, and even they do not have any homestead land.
It has been found from the data of ILS that most of the people who are chronic poor are
involved with the NGOs and take loans from these NGOs and that if they can make the
proper use of the loans they can move up. Of 31 chronic poor people at least eight have
mentioned that because of NGO intervention they have moved up, and two of them have
mentioned that they could use their loans properly. However, most of them have also
mentioned that they have to do hard work with their limited resources for improving their
situation.
Table 7: Factors for moving up from chronic poor
Factors Chronic poor (N) NGO involvement 8 Hard work/and savings 6 Working as a day labor/ swing quilt/catch fish using other’s boat 5 Got salaried jobs/ promotion/ go to Dhaka or other city for better services
4
Agriculture work/have land 4 Start small business / invest money 3 Got training of on agriculture/tailoring or other 2 Can proper use of NGO loan 2 Increase of social/economic/and political honor 1 Multiple sources of income 1 Total (N=31)
Among the chronic poor few have improved their situation by doing hard work. They
either work as day laborers, or collect stones from the rivers, or (some women) do quilt
sewing works. Their situation has improved through doing hard work. Among the chronic

164
poor at least five people have mentioned that as they have done hard work on their own
occupation their condition has improved.
Similarly, from the data of ILS of the chronic poor some other factors that have been
found help them to move up. These are availability of salaried jobs in own village or out
of village or in city, agricultural work e.g. sharecropping, and small business subject to
the ability of investing some money, receiving training on tailoring or on agriculture or
involving multiple sources of income. However, most of the people of chronic poor
groups have mentioned that there are no such factors as can help them move up.
7.2.2. Factors for moving up from Mover
By analyzing all individual life stories of 85 movers it has been found that at least sixteen
factors have helped in moving up. Among these sixteen the most important factors are
explained below.
Table 8: Factors for moving up from Mover
Factors Mover (N) Starting agriculture work/having land 39 Starting big business / investing money 20 Hard work/and savings 18 Getting salaried jobs/ promotion/ going to Dhaka or other city for better services
17
Multiple sources of income 16 Sons stay abroad/ got services 13 Getting good harvest 11 NGO involvement 10 Ability to make proper use of NGO loans 5 Increase in social/economic/and political honor 4 Getting trained on agriculture/tailoring or other 4 Help from in-law's house 2 Getting dowry from in-law 2 Both husband and wife do economic activities 2 Access to big loan (formal) 1 Getting help from government/VGD card 1 Total (N=85)
From the data of ILS it has been found that no mover has improved situation following
only one factor. Rather more than one factor has helped them to move up. It has been
found that among 85 movers at least 39 have mentioned having land or inheritance of

165
land from either their fathers and or their in-laws' houses. Some movers have built houses
on their land, rented them out and make profit from them. Additionally, among them
sixteen have mentioned they have multiple sources of income. Some of them have either
started making big investment or invested money in land cultivation for different crops.
Similarly, some have mentioned they need to do hard work for improving their situation.
It is also important that movers have some social honor and some of them use this for
achieving political power. At least four of them have mentioned social and political
power, which help them move up.
7.2.3. Factors for staying in the same level of Always Better off
Data shows that most of the individuals from the group of always better off can stay in
similar steps or in the same category by undertaking more than one or multiple sources of
income or with the help of more than one income earners and or multiplying their existing
resources. More than one factor works together for their moving up.
Table 9: Factors helped in moving up from Always Better off group
Factors Always Better Off (N) Starting agricultural work/having land 22 Hard work/and savings 22 Starting big business / investing money 15 Getting salaried jobs/ promotion/ going to Dhaka or other city for better services
14
NGO involvement 12 Multiple sources of income 8 Increase in social/economic/and political honor 7 Getting training on agriculture/tailoring or other 5 Getting good harvest 5 Sons stay in abroad/ got services 4 Access to big loan (formal) 3 Ability to make proper use of NGO loan 3 Both husband and wife do economic activities 2 Total (N=43)
The above Table shows that the total number of chronic rich is 43. Among them at least
22 male or female individuals have mentioned having land or starting agricultural work.
Here it is important to mention that most of them own vast land. On the other hand, data
shows that some of them have undertaken mortgaged land and cultivated these on a
commercial basis. Therefore, since the there is good harvest and as no natural disaster has

166
occurred, these have helped them to reach a better situation. Not only these they usually
grow multiple crops. Therefore, they do not have to think about their food round the year.
Additionally, hard work is an important factor for their moving up. Among them at least
22 people have mentioned that they either do hard work for moving up or remain in their
stage. Some of them have mentioned the starting of business has helped them to move up.
At least 15 persons have stated their business has helped them to move up. Similarly,
according to the people of the always better off group, either salaried or fixed job is an
important factor for some people of this category. Either they or any members of their
families go to Dhaka or out of their villages to do services, which are important sources
of their income. They also go abroad for doing jobs. At least four people have mentioned
this factor. Furthermore, some other factors have played roles either individually or
jointly for their movement up. These are increase in social/economic/and political honor,
getting training on agriculture/tailoring or other, good harvest, access to big loan (national
bank loan) or economic activities done together by the husbands and wives.
7.2.4. Factors hinder faller from moving up
There are many reasons why some people fall into poverty. Illness is the main reason,
which is widely mentioned. Out of 21 fallers 12 have mentioned that because of the
illness of either the main earner or any member of the family, they have to sell either their
land and or any valuable property or have to spend their capital of business. Besides this,
some have mentioned that they become disabled due to illness for which they now cannot
work. They have also mentioned that because of loss of capital in business their condition
has fallen. Two of them have mentioned that they gave money to brokers for sending their
sons abroad but they have been cheated. In this way, they have become poor.
It has been found that there is a correlation between the findings from the FGD: Ladder of
Life and Individual Life Story. The group far below the CPL has mentioned that they
need physical strength to do hard work and social connection for getting jobs. Similarly,
we have found that the chronic poor need to do hard work and get better salaried jobs for
moving up.

167
On the other hand, most of the movers have mentioned that as most of their occupation is
agriculture, and they mainly do agro-based activities, and they need entitlement to land.
Similarly, when we have talked about the people just above the CPL we have found that
most them have mentioned their entitlement to land. Other similarities among them are
that the movers save money, start businesses, multiply sources of income, use their land
in multiple ways, and do hard work. The group just above the CPL has also mentioned
these same factors for their moving up.
As well as when we discuss about the group of chronic rich they around 22 of them have
mentioned their entitlement to land and land-related activities or good harvest that helps
them maintain their level. Similarly, the people of the group far above the CPL have
mentioned that having vast land is the most important factor for them. There are other
similarities between these two findings such as the availability of fix salaried job outside
the village or outside the country. At least four chronic rich people have mentioned that
their sons stay abroad and send money. On the other hand, around 14 communities have
mentioned this factor.
Therefore, the findings reveal that there are some similarities amongst the factors that the
LOL and the ILS have mentioned for moving up from different steps.

168
SECTION VIII: ASPIRATION OF YOUTH
Youth are the main work force. The optimum use of this work force is one of the key
elements of overall national productivity. They can contribute to the national growth.
Transformation from childhood to adulthood is an important part of an individual.
Individual of this stage is match optimistic. Individuals are dreamy at this stage. So they
have future ambition about their working lives. Aspiration of the youth may be influenced
by believe on fortune, various capital assets like economic condition, education, other
tangible and intangible assets etc. However, whatever the ambitions of the youth are, the
substance is that involvement of the young generation in economic activities is important
overall development of the nation. But unfortunately nation is unable to utilise this large
work forces. It is evident that about 40 per cent of the young population are unemployed
in the country. The rate is usually lower in the urban areas and higher in the rural areas.
Deference may also find in different regions of the country, even households belonging to
various socio-economic situations.
This report focuses on the youth's aspiration only in the area of their future livelihoods. It
means how the young people do like to think about their future careers. In order to build
their careers what types of problems they face and potentialities they have which help
them to take preparation accordingly.
However, individuals at the age between 15 and 25 years of old are treated as youth. Data
was collected from 16 communities conducting Focus Group Discussions (FGDs) with
both male and female participants. Apart from this, available young individuals are also
interviewed in the survey though small numbers of questions are included in the survey
questionnaire to catch up youths' aspirations. The young man and women express their
aspiration which those will be fulfilled at their age of 30 years.
This article is divided into nine sections including introduction and conclusion. The
second section will outline the analytical framework. Based on the analytical framework,
the third and fourth sections will focus on the youths' current occupation and
intergenerational occupational differences, because youths' aspirations are mostly
influenced and guided by those two things. The next section will deal with the various
factors are important to build their future careers. The sixth section will discuss problems

169
they are facing at different levels, which create difficulties to reach them to their future
target. Considering the prospect and problems youth take different initiatives or
livelihoods strategies for a better livelihoods outcome, which will be treated as youth
aspiration. These two things will be discussed section seventh and eighth respectively.
The paper will be concluded with some suggestions and recommendations.
8.1 Current Livelihoods Scenario of the Youth
About 40 per cent of the young population is unemployment in the country. The study
reveals that it is much severe in the study community. The total number of the youth in
the surveyed households is 22 per cent (1044). Of them only 26 per cent (274) are
employed and rest of the young people (74 per cent) are unemployed which is almost
double of the national rate. Considering the four transition group 20 per cent of the youth
are come from movers households, 36 per cent from chronic rich, 34 per cent from
chronic poor and only 5 per cent from faller households.
Data shows that the highest 39 per cent faller, 32 per cent chronic poor and 29 per cent
movers work as wage labourers to earn their living. Twelve to twenty per cent youth
involve in trading. The young do trade are the highest in the rich households and less in
the chronic poor households. The highest numbers of farmers are found among the faller
and chronic rich households. Some youth of the chronic rich households work in private
sectors. It is found that about 31 per cent youth of the chronic rich households work in
private sectors.

170
Table 8.1 Youth's Current Occupation
Occupation Transition group Mover Chronic rich Chronic poor Faller Grand Total Wage labour 28.99 11.11 32.25 38.46 24.08 Farmer 14.49 19.19 6.45 23.08 13.87 Fisherman 4.35 - 7.53 - 3.65 Manufacturing artisanal - 1.01 1.08 7.69 1.09 Manufacturing industrial 5.80 5.05 5.38 - 5.11 Other service (private sector)/skill work
5.80 18.18 8.60 - 10.95
Other services (private sector)/unskilled work
7.25 13.13 5.38 7.69 8.76
Public sector skill work 2.90 4.04 2.15 - 2.92 Public sector unskilled work
1.45 - - - 0.36
Trade 17.39 20.20 11.83 15.38 16.42 Others 11.59 8.08 19.35 7.69 12.77 Grand total 100.00 100.00 100.00 100.00 100.00
The overall scenario of employment is very poor. More than half of the young population
of the 16 surveyed communities are doing something locally. Those who have some land
or able to manage some capital are doing either farming or running business. But most of
the young people are unable to do so. Therefore, they sell their labour.
8.2 Inter Generation Occupational Differences
There are both similarities and dissimilarities between youth's aspiration and their parents'
occupations. In some cases youth are interested in building their future careers as their
parents and in some cases their want to start their career in a completely different areas. It
depends on the opportunities are available in the communities and the neighbouring areas.
For example, those who are interested in farming, fishing or running small businesses
they live in such a community where they can start in doing those above easily. Some are
interested in salaried jobs, it depends one the scope of education or inspired by the elderly
who are doing salaried jobs in cities.
However, the survey data shown that about 42 per cent parents are involve in farming in
the study communities followed by 17 per cent running businesses and 15 per cent work
as day labourers (both agriculture and non-agriculture). Where as only four per cent youth
are interested in farming/agriculture and about 33 per cent want to run their own business

171
and about 39 per cent are interested in salaried jobs at government sector. It includes both
senior level and low skilled jobs.
The qualitative information will give us clearer ideas about the aspiration of the youth
regarding their future careers. Based on the FGDs it can be said that some of the young
men aspire to do the same as their parents' occupations. However, we find some young
males who are interested in their parents’ occupations and their aspirations vary among
the sample communities. For example, the young men in Chitain mostly want to continue
their parents' occupation. A male participant Rana's father is a government employee and
so the son wants to do a job. He says that he is studying attentively to reach the goal.
Liton is the son of a businessman. While expressing his hope and aspirations he says, 'Our
family has a business. I shall be involved in that.' Like Liton, Moniruzzaman also wants
to continue his father's business. Dulal Mia cultivates land with his father and he wants to
become a big farmer. When asked why he has chosen cultivation, he says, 'I am illiterate.
Who will provide me with a job?' Another male participant of Badalpara village, Rubel,
hopes to be a teacher. His father is a teacher of a semi-government educational institution.
He says, 'After completing my studies I shall be a teacher. I have a dream to be a teacher
of mathematics.' The youth of Modhupur also express their desires to do large agricultural
farming or improve their financial condition by catching fish. Here it is important to
mention that the youth have expressed their aspirations according to their parents’
occupations, as the main livelihoods of this area are agriculture and fishing.
Most of the young men studying at different levels are interested to do jobs, run
businesses, and go abroad. But the less educated are interested in doing something by
cultivating the existing opportunities in their localities. Among the sample villages we
find some villages having limited livelihoods options and the majority of the population
of those communities are depend on those options. For example, people of Modhupur,
Daspara, Bishrikathi, and Ranachandi depend on fishing. The young men in Bisharikathi
want to do fishing or run a business.
8.3 Problem faced by the youth to fulfil their career aspiration
The young people of different communities face various problems in preparing for the
future. It also varies between young men and women. However there are some sort of

172
similarities among the communities and between young men and women. The problems
are mainly lack of parents’ education, financial crisis, early marriage, particularly for the
young women, lack of opportunities, and the overall socio-economic and political
environment of the communities.
Early marriage: The female youths of Gilarchala hold that early marriage is a big
obstacle to their aspirations. According to the FGDs on youth aspiration a female
participant, Helena, who is a student of level ten, says, 'Marriage is a big obstacle to our
future. Parents do not hesitate to arrange weddings for girls if any groom is available.'
The young women of Ranachandi, Ikumaribhati, Bisharikathi, Daxin Berabaria, Uttar
Gutuma also point out early marriage as one of the major obstacles. They mean that
generally parents are more interested in daughters’ marriage than their education as soon
as they can arrange it.
Financial crisis: Another big obstacle they have mentioned is the lack of money. Rajia
says in this regard, 'I want to be a nurse. I want to go to a medical college in Dhaka but I
will need money.' Married youths have also expressed their aspirations several times in
different ways. 'We need money if we are to keep our aspirations alive to educate
children.' Both the male and female participants of Dorikhozikhani say the same as those
of Gilarchala. Some of the young men of Gutia village identify financial crisis is the
number one problem that they are facing. Sabuj says, 'Family or economic problems
might not help me to travel that far. If the family gets separated and I have to earn a
living, if my father and the brothers do not bear the educational expenses, then it might be
problematic.' Ibrahim comments, 'My father is retiring within a month. Therefore, we
would face financial crisis. If my brother refuses to fund my studies, if there are some
family troubles, then my dreams might not be fulfilled.' Mizanur Rahman says, 'I cannot
become a doctor if I cannot continue my studies due to financial constraints. If my luck is
bad, then I can’t do it.' Uzzal says, 'If I cannot continue my education due to financial
constraints and if my parents are unwilling to educate me then I won’t be able to become
a teacher.' Noor Islam says, 'I might not get a job I am expecting due to the paucity of
money. Money is a global problem.' Alamin remarks, 'I might not get a job after
completing my education because of the lack of money.' The young women of Gutia
village mention that even marriage cannot be arranged without money. Feroza opines, 'If
the parents are poor, then it is difficult to spend for the marriage. It needs an amount of

173
Tk.20,000/30,000 as dowry. In addition, Tk. 15,000 is needed for entertaining the guests,
and for the purchase of utensils and other goods.' The youths of Ikumaribhati cannot start
business due to the lack of capital. Some youths are interested in going abroad, but cannot
go because of lack of money. A young male participant of Chitain, Shahajahan Mian,
says, 'Previously one could go abroad with less money, now it takes much more. Five
years ago one could go to Saudi Arabia with Tk. 70,000 and now it takes Tk. 1,30,000. It
is a big problem.' Humayun Munsi of Bisharikathi village says, 'Because of the poor
condition of the family I cannot move forward. If we have had money then I could study
and get a job in future.' A female participant of Char Kumaria village, Ferdousi, says,
'There would have been no problems if we had enough money. That we are poor is our
main obstacle.' Wasim of Badalpara village says, 'My father is a poor man. He has
economic hardships. But still then he gives me money every month at the cost of his
personal comforts with a hope that one day I shall be an engineer. He cannot imagine the
cost involved in engineering study. He undergoes tremendous hardships owing to sending
me money every month. However, if my father stops sending me money I shall have no
alternative but to close down my engineering study.'
Non-cooperation of the parents: The male participants think that parents’ non-
cooperation is one of the biggest obstacles for them. Regarding this a male participant of
Bisharikathi, Sumon Khan, says, 'My parents are the main obstacle for me. I can build my
career if they want. How can I run a business without getting money from my family? I
cannot move forward because of my family.' One of the female participants of Char
Kumaria village, Rabeya, says, 'Our guardians are our big obstacles. If they wish we can
continue our studies and if they do not we cannot prosecute our education. Parents give
no importance to the hopes and aspirations of their daughters – they only think about the
future of their sons.' A female participant of Patnipara village, Kalpana, says, 'Boys earn
through providing tuition or by working but girls cannot do that. Therefore, parents have
to provide financial assistance to the daughters. They also say that parents feed that
education is useless for girls, as they have to provide dowry during their wedding even
after educating a daughter.' The female participants of Chitain village say that non-
cooperation of parents also becomes an obstacle to achieving their future goals.
According to Ruma, if the parents do not help and cooperate it would never be possible to
achieve the future goals.

174
Socio-economic and political environment: As most of the villagers of Ranachandi are
involved in stone-related work, some of them think that the bad relation between the
governments of India and Bangladesh is the biggest obstacle to their livelihoods in future.
Some young people are running grocery business at the Ranachandi bazaar and doing
well thus encouraging others start the same type of business, but there is not enough room
in the bazaar to build a small hut there. Moreover, volume of sale also depends on stone
collection. If the villagers can collect more stone from the river they earn more. Apart
from this mobility of the buyers increase with the increasing supply of stones.
Corruption: The young men of Ikumaribhati mention as the greatest obstacles to the
youth in reaching their goals in future rent-seeking and unfair means. The qualified
youths do not get any job for corruption. Again, it is not possible to work smoothly for
bribery and unfair means. If anybody wants to be a businessman he has to give money
(bribe) to influential people. The young men of Chitain say, “We have no ‘jack’ (back-
door support); if there is no 'jack' it is difficult to get a job.” The youths of Uttar Gutuma
mention that corruption is the greatest problem for realizing their goals. Comparatively
less qualified young men and women get jobs by spending money. The political leaders
sometimes provide the youth of lesser quality with with jobs in exchange for money. The
young male participants of Dorikhuzikhani mention that if they want to start a business
they have to give tolls to the local extortionists. Also for getting jobs they have to give
bribe to the government officials. According to the young men of Chitain village the
biggest obstacles in reaching their future goals are the lack of high-level connections or
the inability to offer bribe and lack of capital. According to them it is impossible to get a
job without one's uncle's backing.
Community level: The female participants of Gilarchala mention that it is difficult for
them to go to school and college because of the long distance. Besides, when they go
school or college the young men slang and tease them. In this regard, Helena says, “If
young men disturb girls while going to school then parents stop sending their daughters to
school.” Men always stand close to them when they wait for a bus and also in the journey
school and college. The female participants of Ranachandi mention that superstition and
the limited scope of employment are the main obstacles to their work in future. The
female participants of Arairashi say that at the village level many people do not like
women's higher education or outside work. This, in their view is an obstacle for the youth.

175
For instance, Lipi says, “Faridpur (the district headquarters) is far from here. Although,
going there for education may be acceptable to family members, those living in the
neighborhoods may not accept it. This is a kind of obstacle. Getting admitted to a good
college and studying there is a kind of freedom.” The female participants of Bisharikathi
village think that social impediments such as restrictions on going outside the house are
the main obstacles for the young women to taking preparations for their future lives. A
male participant of Char Kumaria, Mizan, says, “One cannot tolerate the well-beings of
others. Everyone tries to bring downfall others. For example, it is good for all if
everybody is informed about the help and assistance provided by the government to the
people of a particular locality. But it was seen that only few people could get such
information while the vast majority of the people remain in the dark. Only a few people
want to grab such government facilities.” The participants of Modhupur village mention
that the leaseholders of the water-bodies limit their access to fishing. Moreover, due to the
lack of better communication they do not get access to market properly.
However, various problems faced by the youth in reaching their goals can be summarized
in the following manner:
• Non-cooperation of parents
• Inattentiveness to studies
• Economic problems
• Lack of education and congenial environments in their respective localities
• Chaos, confrontation and rivalry in the communities
• Lack of sincerity; selfishness of community members
• Absence of powerful uncles (maternal or paternal)
• Physical problems (personal)
• Early marriage of girls. For the women, it is the greatest hurdle to realizing their
dreams.
• Conservative social attitude. Respondents have observed that most of the villagers
tend to think that the daughter does not need to go to school as she has grown up.
• Financial constraints.
• Discontinuation of education due to financial constraints.
• Withdrawal of parental support due to the misbehaviour of sons.

176
8.4 Prospects of the youth's future livelihoods
Both male and female young participants some factors those will be helpful for them to
reach their future livelihoods options. Though it differs from community to community,
but the participants of all communities given emphasis on education, money or capital,
supports and encouragement from parents/in-laws, community people as well as
government. Moreover, young people's efforts, confidence, enthusiasm and overall
environment are also important to fulfil youth's aspiration of their working lives. These
can be summarised in following manners.
Education: Education enhance people's awareness about their rights, increase their
productivities and make it easy to be involved in income generation and create
employment opportunities. According to the participants in all communities, education is
one of the key factors that makes their dream truth. Education is the basic element of
success in life. None can move forward without education. The young male participant
Masud of Char Belabo says, "If a man gets educated, he becomes aware of things around
and acquires ability to work better. That man will earn money more than others and be
able to run business. If all these happen together, then that will be very good for us.” All
the respondents in Char Belabo say, nobody can prosper in life without education. On the
other hand finance is very important for attaining education. Mizan of Char Kumaria
says, "I am a student of first year honours at Faridpur Rajedra Mohan College. After
obtaining Masters, I shall be a college teacher. So, my education would help fulfil my
ambition.” Another participant of the same community mention that education will help
him to build his future career. The participant will obtain his bachelors degree and at the
same time take training on livestock, fisheries, agriculture etc. This education and training
skills would help build his future carrier. One of the female participants of Char Kumaria,
Ferdousi says, “The first and foremost thing that is most essential for us to fulfil our
expectation is education.” The young male participants of Uttar Gutuma mention for
those who hopes to be service-holders, the best helping element is that they must have
good education and good results. It will not be possible at all to succeed in competitions
without good results.
Money: Money is another important factor to achieve future target. Even money is more
important than education as education cannot be completed without money. Though
education is free at certain level, particularly for the female student, but there are some
other cost rather than tuition fees. The young people need money to start their career in

177
running business, farming etc., even money is needed sometime to get a job. The male
young Sohel of Daspara says, 'If I have money then I can toil hard and prosper (boro
howa). I will do many other works, will do hard work and earn more. After the
improvement of road communication in the area I will start running a business.' The male
participant Monoj of the same community says, 'If I work then I will have hard cash. With
this money I will start to run my business. Starting small business will help me in
becoming a big businessman. Now I sell ice cream. If I have (accumulate/save) money, I
will buy an ice-cream machine myself and would produce ice myself.' In this connection,
the female respondent Shireen of Betabaria says, 'I want to be a teacher after completion
of my study. In this respect, my parents will pay money, give all stationery items and
finally guidance.' Another female participant of Betabaria Asma adds, 'I want to become a
tailor after learning sewing. In order to learn this, my parents would have to pay for me.'
The participants of Chitain point out that financial support play an important role to
continue study. It becomes difficult to continue study without any financial assistance.
So, according to them, their parents help them to continue their studies, support them
financially. As mention earlier, money is not required only for education. It is also
important to get a job. Nowadays it is difficult to get a salaried job without bribery. The
young male participants of Uttar Gutuma says if one can spend money for a job or
business, it is possible to get it. If a candidate has money, he will get a job, though his
results are not good. Going abroad for service is no problem for him who has money.
Some of the young people want to run business in future. But most of them do not have
capital for business. As the male respondent Mashuk of Modhupur says that he has a
desire to be a big trader and owner of a big grocery shop. But his father has passed. He
has no money. He has a keen desire to deposit money through small savings that he
would income by selling labour. With this money he will start to run a big business.
Parents/in-laws supports and cooperation: Parents' supports are also important factors
to build future career. Traditionally the young people cannot think independently because
of dependency on their parents. In most of the cases young people's desires are directed
by the elders. It is more essential for the young women. For the married young women,
supports from in-laws more significant than single young women. In response to parents
or in-laws supports one of the female participants of Arairashi, Mahfuza says, 'Even in
order to be a good mother, there is the need for cooperation from in-laws. For a girl, to do
a good job, there is the need for support from the in-laws.' Another female participant

178
Rozina of the same community says, 'There is the need for family cooperation for
fulfilling the wishes.' The male participant Rubel of Badalpara says, 'My ambition is to be
a teacher of mathematics. I am good in arithmetic. Still, I have engaged a private tutor to
teach me mathematics. My parents inspired me to take lessons from the private tutors on
math. I cannot do it without his parents supports.' In general, parents are willing to do
something for their children, though it depends on their affordability. The female
participant Rakhi of Badalpara says, 'Suppose, if we inform our parents about our desire,
they will do something for their children…. Our parents are getting us educated to fulfil
their children's desire.' Another female participant of Badalpara Mala says, 'Our parents
ask us to be establish in life. They encourage us. They give us money.' To utter parents
desire their children one remarkable example can be cited here. The female respondents
of Chitain Sheela and Shaheena remembered their mothers with the feelings of gratitude.
They say that their mothers have suffered and sacrificed a lot after the death of their
fathers so that their study would not be stopped. They are working hard day and night so
that their children’s study would not be hampered. And this is the main inspiration of
continuing the study Sheela and Shaheena.
Government Assistance: Government assistance is another important factor to fulfil
youths' desires. Some initiative cannot be done at individual or community level. For
example, universal education would not be succeeded without government assistance. So
government can create some opportunities for the youth. One of the male respondents of
Daspara, Mukun Mia says, 'My dream will become true, if he receive any government
assistance.' Daspara is a flood prone area. It has flash flood every year. Sometimes it
becomes devastating. In 2004, the people of Daspara experienced such a devastating
flood, and more than 95 per cent villagers were effected by that flood. The government
assistance like credit can help effected people like Mukun Mia to overcome the aftermath
of flood. As he says, 'If loan/credit is available, then I can use the money to buy livestock,
can have a good harvest, dream will come true. A good crop would fetch a good income.'
The female participants of Badalpara, also mention about the government help in
fulfilling their future objectives. They say that the government is giving books, waiving
tuition fees, giving stipend. At the college and university levels, government provide
vehicles, which help the students a lot. The scenario is bit different in Ranachandi. Most
of the youth of this community depend on the river Mahananda. It is full of stone and the
community people collect them from the river. The river Mahananda flows inside India.

179
So the relationship between India and Bangladesh is important to collect stone from the
Mahananda. So the youth of Ranachandi say, 'If our government negotiate with Indian
government in this issue then it will be possible to collect stone from the river. Currently
the communication system of this area is better than before. They think if it continues
then it will be easier to fulfil their aspiration.'
Guidance: Guidance, supervision from the elderly or aged people of the family or
community or society are important, because it give direction to the young people to
figure out the options those will be fruitful for them. Sometime it also helps them to find
out their potentialities. As Washim of Badalpara describe about his maternal uncle. His
maternal uncle left invaluable contributions by giving wise suggestions for building
future carrier of Washim. While talking about his maternal uncle, Washim says,
'Originally I used to study in general line. Later I switch over to technical line as
suggested by my maternal uncle. He told me that there is more competition in the general
line. But there is less competition in technical line. So, as per his suggestions I have
come to this line.'
Encouragement: Almost all of the informants' parents, siblings and relatives encourage
them to pursue their future aim in life. The female participant of Badalpara, Nipa, who
cherishes the desire to become a nurse says, 'My father said that if I study well then I can
be a nurse.' About the encouragement of elder brother, another female participant Rakhi
of Badalpara says, 'My elder brother is encouraging me. He asked me not to be worried
about money but try to reach your goal.' The female youth of Chitain, Smriti says, 'It
would not have been possible to come to this stage unless we would have inspiration of
our parents.' According to her, the inspiration of their parents is the supreme in continuing
her study up to this level. It would not have been possible unless her parents inspire her
all the time. Many girls are getting married at their age. Again, many girls are getting
married who are much younger to them. But it has been possible only because of their
parents' inspiration and support that they are still continuing their study.
Scope of vocational training: Scope of vocational training could be one of the factors for
the less educated youth to get better livelihoods outcomes. It is easy for them to take
vocational training, because they think they are not spending time and money without
having any immediate return. They will start earning just after completing the training

180
courses. In some communities those who could not study more, they underwent
vocational training from childhood like electrical works, driving or salesmanship etc.
They could excel in such works and thus from early age they could get themselves
involved in them. For example, one male young Sattar in Arairashi learned driving. Now
he wants to the owner of a car. He wants to drive his own car and earn himself
independently. Slowly, he wants to be the owner of few cars.
Migration: The youth can make their careers through getting jobs in abroad. But it not
easy to go abroad for the youth, because of difficult process. Moreover, it needs huge
amount of money. If one goes abroad after selling or mortgaging some lands, then the
land can be recovered once again with the money earned in abroad. In all communities,
some young people are found who work in abroad which make other youth interested in
going abroad. One of the male participants in Betabaria intends to go abroad. He is
currently involve in cultivation. He says, 'I have two brothers living abroad. That’s why I
want to go abroad. This is my dream, and hope my brother will take me abroad.' Some
other young men in the same community are interested to abroad. As Jamal says, 'My
brother is staying abroad. That’s why I nurture the hope.' Another male participant Provat
of Char Kumaria says, 'The Bangladeshi expatriates arrange visa for the youths of their
locality who want to go abroad for job. Later, after getting job abroad they repay the cost
for visa. There are many such instances in the rural Bangladesh. So, financial assistance is
also helping the youths in translating their dreams into reality. This is true, especially for
those who want to go abroad for jobs.'
Law and order situation: Law and order situation is one of the most important factors
for the future career of the young men and women. Without having good law and order
situation the young women can not continue their education or work outside, none can
run business. In the some context the male participant Dual of Char Belabo says, 'Only
education will not be enough, law and order situation has to be good. But, the education
will help us first.' The female participant Sheuli of Ranachandi says, 'It is possible to
change if there is an effort; terrorism has to be removed, and have to increase literacy
rate.' Most of the female participants of Char Kumaria point out about the law and order
situation and the end of terrorism for brighter future.

181
It can be said from the above discussion that there are numbers of factors effecting the
youths' aspiration. A combination of more than one factors in important to reach their
target for better livelihoods outcomes. Money is one of the vital factors, because it is
needed for either run a business, do study, go abroad, even get a salaried job.
8.5 Youth's preparation to do for earning of living
The high unemployment rates in this country that the career plans of young people do not
always become successful. However, our investigation shows that they are concerned
about their careers and are seriously thinking about what to do in future. It is also true that
the aspirations of the young men and women depend on the overall environment of their
communities, the socio-economic condition of their families, and the existing
opportunities in the localities. In addition to these the youth are also influenced by their
surroundings as well as by parents, friends, neighbours etc.
The aspirations of the youth are very much diversified. Some of the youth are mostly
interested in running small to large-scale businesses like grocery, furniture, tailoring etc.
Some are interested in farming including agriculture, fisheries, poultry and livestock.
Some others are interested in doing jobs in both private and public sectors and some are
also interested in being professionals like doctors, teachers, lawyers, bankers etc.
Aspirations are mostly the same with a few exceptions. For example, the research team
has found a number of young women who have already got married. So their aspirations
differ a bit from those of the young unmarried women. Some examples can be cited here
to get a clearer idea of the youth aspirations of the sample communities.
There are about 12 factories of netting, dying, garments and electronic goods in
Gilarchala village which have created manifold opportunities in the locality such as jobs
in the factories, running small business, renting out houses and so on. So, the aspirations
of the youth in Gilarchala are related to the factories or the scopes available there. As a
result, the youth are mostly interested to work in the factories and run businesses. Even a
few of them want to establish factories. All these future plans are meant to better their
future life. One of the male participants in Gilarchala, Faruque, says, 'Now I am doing a
job. I want to save money and provide education to my sisters and brothers with this
money. I want to take better care of my parents.'

182
The livelihoods of villagers of Ranachandi are activities like the collection, crushing and
selling of stones and agriculture. So a good number of youth are planning to run small
businesses and to be involved in stone-related work. Some of them are interested in
running groceries or furniture businesses. Only one respondent says that he would like to
be an accountant.
The aspirations of young women in Arairashi are mainly to get jobs after the completion
of education and also be good mothers or housewives. For example, the female
participant Rozina says, 'I would like to do a job after finishing studies. I want to be a
teacher.' Lipi says, 'I want to study up to the college and do the job of police.' The young
men of Arairashi generally agree on the point that in whatever sphere of work they
remain in future, each would try his best to go up the scale in his career. For example, the
male participant Munnu now works as an electrician in a [local] spinning mill. It is his
hope that if in the future a spinning mill is established in Faridpur district headquarters, he
would then try to become the head electrician of this mill. This will amount to the
fulfillment of his greatest desire in life. Similarly, Nazrul Islam wants to install a big
tailoring shop of his own. On the other hand, Munir says, 'I am studying now. I shall
finish my honors [graduation] and masters. I want to be an advocate.' The young males of
Ghutia have desired to be service holders. The male participant Sabuj in Gutia says, 'After
finishing my education well, I want to work in a bank or be a teacher. My elder brother is
educated and he looks after my education.' Ibrahim from the same village says, 'My first
wish is to get admitted to a full-fledged university want to be a college teacher. My
family wishes that all of our brothers would work after receiving education.' Another
male participant Zakir Hossain observes, 'I want to be involved in services. I like service.
I want to join whatever type of job I get.” Respondent Uzzal says, “I am studying. I want
to be a school teacher.
One of the female participants in Chitain, Smriti, wishes to be a doctor. Being a doctor
she wants to dedicate her whole life to the services of the people. She says, 'The people of
the village have many sufferings. They don't get proper treatment due to lack of money.
That is why I want to serve them. For this reason I want to be a doctor.' Another female
participant Fatema wants to be a teacher of a college. Majority of the women respondents

183
wish to be teachers. Some of them want to be the teachers in high schools and some in
colleges.
On the other hand, the young men of Chitain mostly want to continue their fathers'
occupations or have a plan to migrate to the middle east. For example, Rana's father is a
government service holder and he wants to do a job. He says that he is studying
attentively to reach the goal. Liton is the son of a businessman. While expressing his
hopes and aspirations he says, 'Our family has a business. I shall be involved in that.'
Most of the people including the children in Bisharikathi do fishing in the river Tentulia.
So the main occupation of the community is also refleted in the aspiration of the youth,
particularly young men. They are interested in running businesses related to fishing. The
male participant Shumon likes to be a businessman in future. He says, 'I would like to run
a business, get married and live in peace.' Humayun Munshi says, 'I want to establish a
fish warehouse in the village and supply fish to the cities in future.' Indeed they want to
lead peaceful lives and be solvent in future. The young women are more ambitious than
young men in Bisharikathi. Most of them want to be professionals like doctors, lawyers,
teachers etc. in future. The female participant Shanjida Akter says, 'My aspiration is to
finish the education first and then to do a job, because better education can ensure job
security.'
In Ikumaribhati the young men are interested in running businesses as they feel that it is
possible to work according to one’s own will and not to be under anybody’s control.
Some others would like to be teachers. Some are interested in farming activities like
poultry and livestock rearing, and doing fish culture.
The young men of Char Kumaria have various types of choice for the future. But most of
them are interested in either agriculture or business. It should be mentioned here that Char
Kumaria is an agricultural village and there are a number of bazaars near the village
including the upazila centre. Moreover, this locality becomes very much crowded during
the annual uras (a religious congregation). It could be the main reason for them to be
interested in agriculture and business. However, one of the young men Mizan likes to be a
teacher and he says, 'I have been carrying out my studies. I have an ambition. I want to
serve the country. I have certain responsibility toward the country and the locality. I want
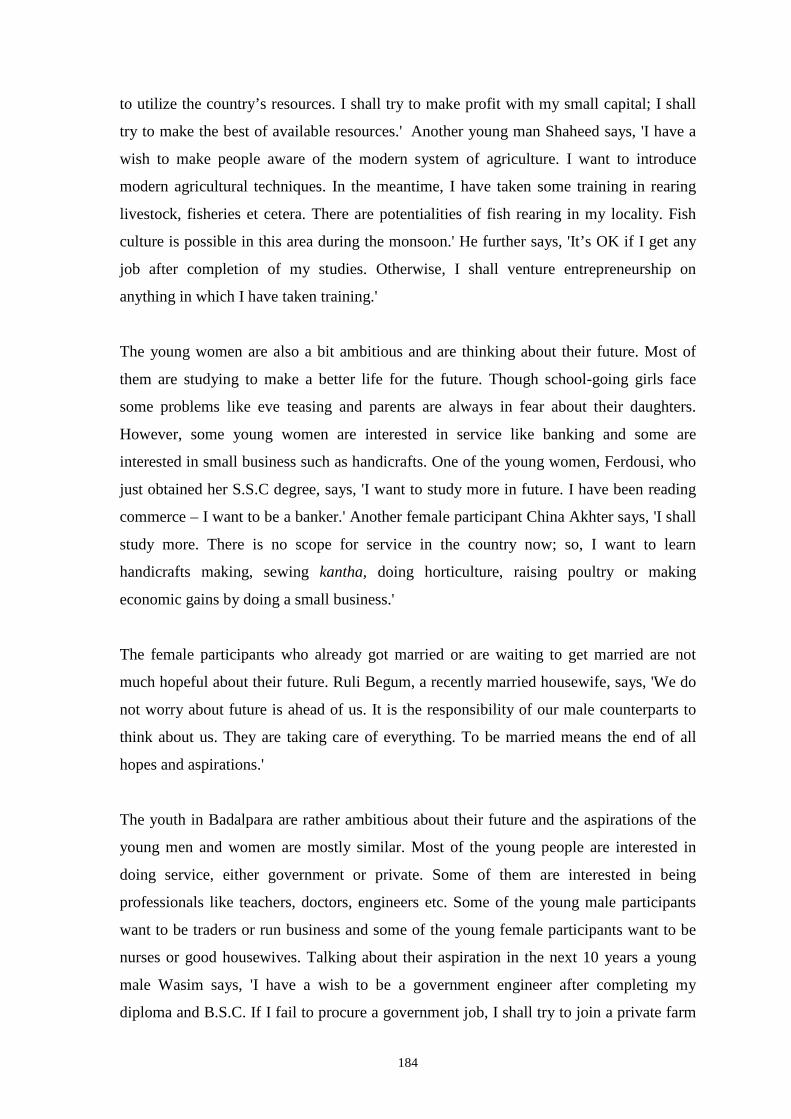
184
to utilize the country’s resources. I shall try to make profit with my small capital; I shall
try to make the best of available resources.' Another young man Shaheed says, 'I have a
wish to make people aware of the modern system of agriculture. I want to introduce
modern agricultural techniques. In the meantime, I have taken some training in rearing
livestock, fisheries et cetera. There are potentialities of fish rearing in my locality. Fish
culture is possible in this area during the monsoon.' He further says, 'It’s OK if I get any
job after completion of my studies. Otherwise, I shall venture entrepreneurship on
anything in which I have taken training.'
The young women are also a bit ambitious and are thinking about their future. Most of
them are studying to make a better life for the future. Though school-going girls face
some problems like eve teasing and parents are always in fear about their daughters.
However, some young women are interested in service like banking and some are
interested in small business such as handicrafts. One of the young women, Ferdousi, who
just obtained her S.S.C degree, says, 'I want to study more in future. I have been reading
commerce – I want to be a banker.' Another female participant China Akhter says, 'I shall
study more. There is no scope for service in the country now; so, I want to learn
handicrafts making, sewing kantha, doing horticulture, raising poultry or making
economic gains by doing a small business.'
The female participants who already got married or are waiting to get married are not
much hopeful about their future. Ruli Begum, a recently married housewife, says, 'We do
not worry about future is ahead of us. It is the responsibility of our male counterparts to
think about us. They are taking care of everything. To be married means the end of all
hopes and aspirations.'
The youth in Badalpara are rather ambitious about their future and the aspirations of the
young men and women are mostly similar. Most of the young people are interested in
doing service, either government or private. Some of them are interested in being
professionals like teachers, doctors, engineers etc. Some of the young male participants
want to be traders or run business and some of the young female participants want to be
nurses or good housewives. Talking about their aspiration in the next 10 years a young
male Wasim says, 'I have a wish to be a government engineer after completing my
diploma and B.S.C. If I fail to procure a government job, I shall try to join a private farm

185
as an engineer.' Another participant Rubel hopes to be a teacher. His father is a teacher of
a semi-government educational institution. He says, 'After completing my studies I shall
be a teacher. I have a dream to be a teacher of mathematics.' Majority of the respondents
want to be government service holders after completing their studies. They aim to be
public servants. Because they think that these types of position hold some sort of dignity
and status.
The young female participants show a strong desire to do something. A female participant
Shahnaz says, 'After I grow up, I will do a job. I will study as far as I can. I want to
complete my MA. After that I will do a government job. I want to be a person of high
status but don't know what happens at the end.' Another female participant Rakhi says, 'I
have many aspirations, which do I mention! Now I have the desire to study. I want to pass
I.A/B.A. I have also the desire to do a job. I want to be a teacher – a primary school
teacher.' Those who have already got married aspire in a different way. One of the
married female participants, Nasima, says, 'I want to give my daughter good education; I
will maintain the family properly.' Some other female participants like Poly will study up
to I.A. and then work for a non-government company. Nipa wants to become a nurse.
Mili explains, 'Since there is no nurse in their village, they are exploring the possibility of
becoming nurses. She will consider herself gratified if someone is cured by her nursing.'
Both the young men and women of Patnipara have expressed their aspirations for the next
10 years based on their status and types of education. Most of them want to be school or
college teachers. Some of the young women aspire to be bankers, doctors and tailors.
While some young men aspire to be lawyers with the view to checking corruption. Some
want to join the police, BDR or become model soldiers of Bangladesh. Some of the
young men who are uneducated or have only a little education want to go abroad or
become mechanics or masons. Among the boys some have lost hope and are unwilling to
talk about aspirations again.
The research team has observed that most of the youths in Char Belabo are unemployed.
A good number of the young men there indulge in idle talk with others and some others
smoke ganja and other drugs. These indicate that a portion of the young men are
frustrated and aimless. Despite all these some of them have dreams and they think about
their future life. They are also taking preparations for the world of work. The youth are

186
mostly interested in inheriting parental occupations. Some are also interested in running
businesses and doing jobs. The aspirations of the female participants are a bit diversified.
Some are interested in doing jobs, being doctors, and other professionals and marrying in
better-off families. It is echoed in the statements made by the female FGD participants.
Reshma Akhter says, 'All hopes that their future should be bright. All want to be higher
class people in future. Who wants to be a pity? I want to study further and get a good
job.' Shiuli Akhter says, 'All girls in our community desire to be married in high families.
They want to live peace and prosperity with their in-laws in their husbands’ houses.'
Jeshmin Akhter says, 'After finishing my education I want to devote myself to social
services. For this reason it would be better if I can be a doctor. In that case I shall be able
to extend medicare to the ailing humanity.'
The female FGD participants identify some future plans of action for attaining their goals.
Such plans are based on the following expectations: i) from guardians achievement of all-
out help, ii) in good results from others examination, iii) necessary financial supports, iv)
assistance from the state and society. The male participants think that good education, a
well-to-do financial condition, and a good law and order situation in the country are
important factors for them to take preparations for the future. In this regard Masud says,
'If a man gets educated, he becomes aware of things around and acquires the ability to
work better. That man will earn more money than others and be able to do business. If all
these happen together, then that will be very good for us.' Some of the youth interested in
doing service are studying. Some others are expecting that they will get support from
their parents in all respect. Some young men in Arairashi, Chitain, Uttar Gutuma,
Berabaria, and Patnipara are interested in going abroad.
As mentioned earlier, the aspirations of married young women are quite different from
those of unmarried young women. Their aspirations are mostly related to their children,
families and husbands. In Gilarchala, most of the young women aged between 18 and 25
are married and some have one to two babies. They are mainly concerned about their
children. They hope that their children will get education, do better jobs and become
independent. They desire that their children will become real men and women. Rita
Yesmin, a female participant of Gilarchala, says, 'We want our children to receive
education, because it is possible to be aware of everything only with education.' Shilpi
says, 'I want my children to get education and become lawyers or barristers or physicians.'

187
The female participant Lily in Arairashi expresses her wish in the following words, 'I
want to build my family with my husband and children in a nice way. I just want to
remain a housewife. I want to fulfill the wishes of my children.'
In Gutia the female participant Farida expresses, 'I would expect my husband to do
business in raw materials. I also hope to work alongside him in order to improve the
conditions of the family. I would like to rear up my children in a decent way.' Shyamoli
says, 'I want rear up my children. I do not want them to do business. After their education,
they would go to Dhaka for jobs. Two of us would work and save money in order to
improve our conditions. My husband and I cut grass together, pluck chili, work as day
laborers, feed cows, cut tobacco leaves to maintain our family. This way we hope to
improve ourselves.'
8.6 Aspiration of Future Occupation of the Youth
Every youth has ambition about their future lives. It is difficult to find that youth do not
have any future plan, but sometime it could happen. As youth face various problems to
build their future desired career, at the same time they have potentialities or scope to do it.
It may not the desired one but could find a way of living. Considering all difficulties and
potentialities, it is found that 94 per cent of the young respondents express their future
aspiration. Of them more than a half (54 per cent) hope to do a job followed 31 per cent
want to run business and about 10 per cent will be happy to either run a business or have
a job in future. It is not clear from survey that six per cent youth are not willing to d
anything in future.
However, youth aspiration regarding their future working lives need to be segregated
more to get a comprehensible picture, particularly who are interested to do job in future.
Survey data reveals that taken as a whole 32 per cent youth want to run businesses as way
of their livelihoods. The young belong to mover households are more interested in
running businesses. About 44 per cent youth of mover households want to run business.
The second 36 per cent youth belong to chronic poor households who are interested in
running business.

188
The second choice for the youth is salaried job senior government level position. Overall
24 per cent youth are concerned about salaried government job at senior level. Along with
the four transition groups, the youth belong to the chronic rich and faller households are
aiming to do salaried government jobs in future. The figure is 32 and 30 per cent
respectively.
Table 8.2 Youth's aspirations for future career
Value Mover Chronic rich Chronic poor Faller Grand Total Agriculture/horticulture 3.75 1.94 5.19 7.41 3.54 Armed forces/police 1.25 1.29 - 3.70 1.18 Informal work - - 3.90 - 0.88 Own business 43.75 25.16 36.36 29.63 32.45 Professional (doctor; engineer; lawyer
3.75 3.87 - - 2.65
Salaried job (government; low skilled
16.25 14.84 12.99 14.81 14.75
Salaried job (government; senior level)
12.50 32.26 15.58 29.63 23.60
Salaried job (private; low skilled
6.25 3.87 7.79 7.41 5.60
Salaried job (private; senior level
5.00 7.74 1.30 3.70 5.31
Other 7.50 9.03 16.88 3.70 10.03 Grand total 100.00 100.00 100.00 100.00 100.00
Nevertheless, the youth aspiration regarding their future livelihoods options are more
diversified than survey data could capture. Moreover, gender dimension of the choice of
occupation are not confined in the survey. Focus group discussion will give more detail
about the youths' interested of their career plans. The young male Munnu in Arairashi
work as assistant electrician at a spinning mill. According to him, 'It is my hope that if a
spinning mill is established in the future in Faridpur, I then would try to become the head
electrician of this mill. This will amount to a fulfillment of my greatest desire in life.'
Similarly, Nazrul Islam in the same community wants to install a big tailoring shop of his
own. All young are not looking for job, especially female. They aspire anything else. As
the female participant Mahfuza of Arairashi says, 'I want to be a mother of a good looking
son. I want to be a good mother.” Another female participant Lipi of Arairashi who
studied up to class VI expresses her desire, “I want to study up to college and do a job -
job of a police.'

189
Kamal Hossain, 18 years old student of Daspara aspire to be a school teacher or lawyer.
As he says, 'I will complete my education and then do salaried job (chakree) – school
teacher or lawyer.' Some other young men of Daspara community want to be farmers,
government school teachers or run businesses. The aspired occupations of the young
women of Daspara differ with their male counterpart. Some of them want to be doctors
and do service or work as nurse. Interestingly, none of the young men of Badalpara want
to be farmer. Most of them hope to be professionals or service holders. The male
participant of Badalpara, 'I wish to be a government engineer after completing diploma
and B.S.C. If I fail to procure a government job, I shall try to join in a private farm as an
engineer.' The female participants of Badalpara aspire the same as the male participants.
One of the female participants of this community Shahnaz says, 'At my adulthood I will
do a job. I will study as far as I can. I want to complete MA. After that will do a
government job. I want to be a person of big status but don't know what happens at the
end.'
As mentioned earlier some of the young do not have any particular choice for their future
livelihood. They want to do whatever they get. Mohiuddin the young male of Berabaria
says, 'At present, I am working with my father in extracting sand. I want to do a job, and
it would be in a garment factory or any other mill/factory. If I do not get a job, I would
opt for going abroad.' Most of the other young men express the same as Mohiuddin. They
will try to get a work here and if unable to manage they will go abroad. The young
women of Berabaria aspire to be either doctor or teacher. Some others are interested in
embroidering or other handcraft related works.
The male participants of Bisharikathi want to do work as per the opportunities are
available around them. This community is situated on the bank of the river Tentulia. The
scope of agricultural practice has been decreased because of river erosion. So most of the
people of the village are fishing in the river Tentulia. As Humayun Munshi, a young man
currently do fishing said that he wants to have a fish reservoir by his own and supply fish
in the cities in future. But the female young women's aspirations are not related with the
local opportunities. It could be because fishing in river is not suitable for women. So they
like to be professionals like doctors, lawyers, teachers etc.

190
Very small numbers of the youth want to do farming in their future lives. But FGDs
suggest that a good number of people are interested in farming. Even some of them like to
introduce modern technology in agriculture. In addition to that they like to receive
training on agriculture to update their knowledge and skills with modern agriculture. As
one of the young man Shaheen of Char Kumaria village expresses his aspiration. He says,
'I have a wish to make people aware of modern system of agriculture. I want to introduce
modern agriculture technique. In the meantime, I have taken some training such as
livestock, fisheries etc. There are potentialities of fish raring in my locality. Fish culture is
possible in this area during the monsoon.'
So it can be said that the young men and women are very much hopeful about their future.
It is true that the employment situation is not satisfactory. Huge number of unemployment
in the rural areas makes the youth frustrated and in some cases level of frustration is much
severe. As mentioned that some youth are not interested to do anything. Even they want
neither to do jobs nor run businesses. With all this youth have lots of dream. The dream
of the young female is highly differ with young male. Some young male want to build
their career as their parents do but the female have mostly separate dream. Though the
youth are dreamy but they are planning their future on the basis of the assets they have
and the opportunities are available around them. So they will be able to convert their
assets from one form to another. They facing lots of problems at family, community and
national levels, but they adapt with these situations. In combining the resources the youth
have, making the strategies and target their future livelihoods. The young men and
women have diversified ambitions and getting preparation to achieve the goals. Those
who interested in salaried jobs or be professionals do study, youth are interested in
running businesses trying to save money or borrow money from formal or informal
sources. Some sorts of supports from others like parents, community people and the
government may help to blossom those dream, the young will find a better livelihoods
option for their future careers.

191
SECTION IX: CONCLUSION We can conclude from the above findings that women's empowerment has a positive
contribution to the household economic mobilty. It is also further confirmed on Logit
analysis of the probability of moving out of poverty that when female members in the
family particiapte in the labor market, the number of working members increases, which
in turn empowers the female members as well contributes to a household’s upward
mobility.
The findings reveal that there is a link between social stratification and high net
prosperity of the communities. Because the level of social stratification is higher in high
net prosperity communities. And among the low net prosperity communities the level of
social stratification is lower. And also the percentage of movers is higher in the
communities which were more stratified in the initial period than in socially less stratified
communities. Because the communities with a high level of social stratification have
more opportunities and access to services.
There is a significant relation between social capital and the probability of prosperity. All
the high net prosperity communities were initially high social capital communities.
Moreover, in high social capital communities, the percentage of movers is higher. The
economic mobility of the households in initially high social capital communities was
much higher (88%) that of the initially low social capital communities (12%). The
findings reveal that social capital thus plays an important role in shaping the economic
transition status of communities.
It can be inferred that at the household level linking social capital is the most prevalent
type of social capital both in high and low stratified communities. Though the general
hypothesis is: in communities which are more socially stratified linking social capital will
be more important to movements out of poverty. And in communities, which are less
socially stratified bonding and bridging social capital will be more important. However,
in this study the findings have suggested that in the low social stratified communities
most of the people are very poor. Therefore, to improve their economic situation bonding
social capital does not work much. To improve the economic situation linking social
capital plays a vital role in low social stratified communities also. Therefore the most

192
prevalent type of social capital does not vary on the level of social stratification. Rather,
what type of social capital will work depends on the purpose of activity. For the economic
activity linking social capital is most prevalently reported whereas people are more
dependent on boding social capital for financial support in family matters such as
marriage, sickness or a funeral, and to get information regarding market of goods, crops,
inputs etc.
In most cases high democracy communities in the initial period have become more
prosperous now. There is a significant correlation between the communities, which are
high in democracy (based on election, voice and participation) and those with a high
mobility. Almost all of the communities where the households have moved upward have
experienced better local democracy.
People's perception of inequality related to the differences among the people in terms of
wealth, education, intelligence, power, occupation, gender, age, religion, socio-political
position within society etc. However, the common view points to the disparity between
the rich and the poor in the society. Whatever the definition of inequality is, it does exist
in the society in various forms and has changed over the years. Increasing access to
micro-credit opens some other opportunities for the poor people, for example, additional
income generation, access to education etc. It has a two-fold impact on inequality.
Inequality has decreased in some sample communities and has increased in others. At the
same time, access to economic opportunities have increased because of large-scale NGO
intervention as well as increasing access to markets, diversifications in rural productions
etc. In this process, social inequality has decreased but economic inequality has increased.
There is a positive relationship between freedom and wealth. That means that the
improvement of the economic condition enriches freedom. However, freedom does not
have any impact on moving out of poverty. The quantitative findings have also proved
that there is a relation between wealth and freedom. In different aspect such as: freedom
to say what they want, even it is a criticism of the government; can talk openly about any
problems; to form a group or association with others in the communities they can do
without prior government approval; fair treatment of law; to set up a business is not
difficult and control over making personal decisions in all of these aspects may have a

193
indirect influence in moving out of poverty. Because the always rich and the movers
have reported higher percentage whereas least reported by the faller and the chronic poor.
Similarly there is a two-way relation between moving out poverty and power. When the
poor become rich by earning money then power comes in automatically. On the contrary
to become powerful one has to improve one's financial conditions meaning if financial
condition improves one can be powerful.
In conclusion it can be said that the young men and women are very much hopeful about
their future. It is true that the employment situation is not satisfactory. Huge
unemployment in the rural areas makes the youth frustrated and in some cases the extent
of frustration is much severe. As already mentioned, that some youth are not interested to
do anything. Even they want neither to do jobs nor run businesses. For all that the youth
have lots of dream. The dreams of the young females highly differ from those of the
young male. Some young males want to build their career as their parents do but the
females have different kinds of dream. Though the youth are dreamy they are planning
their future on the basis of the assets they have and the opportunities available around
them. So they will be able to convert their assets from one form to another. They are
facing lots of problems at family, community and national levels, but they adapt with
these situations. In combining the resources the youth have making the strategies and
target their future livelihoods. The young men and women have diversified ambitions and
are getting prepared to achieve their goals. Those who are interested in salaried jobs or in
being professionals do study. Some youth are interested in running businesses trying to
save money or borrow money from formal or informal sources. Some sorts of supports
from others like parents, community people and the government may help to blossom
those dreams, the young people may then find a better livelihoods option for their future
careers.
Households living in communities endowed with greater social capital and better social
infrastructure enjoy much greater advantage in moving out of poverty. On the other hand,
good governance and access to market may not help upward mobility. At the household
level, increased household income and access to electricity tend to increase the
probability of moving out of poverty. While access to formal credit may not necessarily
help the poor, larger amounts of formal credit turn out to be instrumental. The probability

194
of escape from poverty is lower for the agricultural and non-agricultural laborers in
comparison to other occupational groups. The factors that determine women
enpowerment (as found earlier in regression analysis) do not necessarily influence
upward mobility, except for initial household income. The upshot is that a household that
starts from a higher level of income stands a greater chance of moving out of poverty as
well as empowering its female members over time.
Moving out of poverty is an outcome of a sustainable livelihood course that draws on a
multiple array of strategies covering income and productivity gain, formation of human
and social capital, efficient utilization of natural capital including land, and development
of positive community forces of democracy, social capital, social stratification and
infrastructure. None of these strategies can work alone as a savior of the distressed.
Putting together both the quantitative and the qualitative evidences from the study, we can
conclude that it is a synergy of all or at least some of these factors that is a sine qua non
for upward mobility of the poor.

195
Appendix Table 1: Classification of Communities into High and low level of social capital in initial
period (10 years before)
Community Total (group) Score
Meeting score
Problem resolution
Score
Total social capital score
High /low social capital
Darikhozekhani 5 6 6 17 H Gilarchhala 8 0 9 17 H Patnipara 2 0 8 10 L Ranchandia 14 0 5 19 H Badalpara 10 4 8 22 H Bisarikathi 5 0 9 14 L Daspara 2 4 7 13 L Madhupur 0 0 8 8 L Char Belabo 8 0 9 17 H Chitain 3 7 8 18 H Arairashi 15 5 5 25 H Char Kumaria 64 6 9 79 H Ikumaribhati 10 3 8 21 H Ghutia 1 0 6 7 L Daxin Betabaria 7 0 7 14 L Uttar Guthuma 7 6 8 21 H