Embed Size (px)
Citation preview

Report No. 35618-MD
MOLDOVA: Poverty Update June 12, 2006 Human Development Sector Unit Ukraine, Belarus and Moldova Country Unit Europe and Central Asia Region
Document of the World Bank _________________________

ii
CURRENCY EQUIVALENTS (Exchange Rate Effective June 9, 2006)
Currency Unit = Moldovan Leu MDL 13.3450 = US$1
US$ 1.4879 = SDR 1
FISCAL YEAR January 1 – December 31
ABBREVIATIONS AND ACRONYMS
ECA Europe & Central Asia Region EGPRSP Economic Growth and Poverty Reduction Strategy Paper EU European Union HBS Household Budget Survey IDA International Development Association IMF International Monetary Fund IOM International Organization for Migration MDL Moldovan Lei MEC Ministry of Economy and Commerce PPP Purchasing Power Parity UNDP United Nations Development Program WB World Bank
Vice President: Shigeo Katsu Country Manager/Director: Paul Bermingham
Sector Manager: Arup Banerji Task Team Leader: Menahem Prywes

iii
MOLDOVA: POVERTY UPDATE
TABLE OF CONTENTS
Acknowledgements ...................................................................................................................... v
Executive Summary ..................................................................................................................... vi
Section 1: Recent Developments .................................................................................................... 1
Section 2: Measurement of Poverty Rates ..................................................................................... 2
Section 3: Poverty Profile .............................................................................................................. 5
Section 4: Possible Reasons for the End to the Decline in Rural Poverty ................................... 11
Section 5: Recent Changes in Public and Private Transfers and Their Impact on Poverty ......... 16
Section 6. Conclusions and Future Policy Directions .................................................................. 19
Bibliography ................................................................................................................................ 21
Statistical Annex.......................................................................................................................... 22
LIST OF FIGURERS
Figure 1.1: GDP Growth and the Poverty Rate: 1997-2005 ........................................................... 1 Figure 2.1: MEC (unofficial data) and World Bank Measures of the National Poverty Rate ........ 4 Figure 3.1: Poverty Rates by Region-annual 1997-2001................................................................ 6 Figure 3.2: MEC and World Bank Measures of the Rural Poverty Rate (not seasonally adjusted)6 Figures 3.3a & 3.3b: National Growth Incidence Curves............................................................... 8 Figures 3.4a & 3.4b: Growth Incidence Curves for Large Cities ................................................... 8 Figures 3.5a & 3.5b: Growth Incidence Curves for Small Towns .................................................. 8 Figures 3.6a & 3.6b: Growth Incidence Curves for Rural Areas .................................................... 8 Figure 4.1: Real Monthly Per Capita Income of Households that Depend Mainly on Farm Income........................................................................................................................................... 12 Figure 4.2: Moldova Real Agricultural Producer Price Index...................................................... 12 Figure 4.3: Real Wages in Agriculture and in Other Sectors ....................................................... 13 Figure 4.4: Index of Agricultural Output Prices Relative to Input Prices .................................... 14
LIST OF TABLES
Table 1.1: An Overview of Poverty and Economic Conditions in Moldova .................................. 1 Table 1.2: Inequality of Household Consumption Expenditures .................................................... 2 Table 3.1: Poverty Rate by Region................................................................................................. 5 Table 3.2: Poverty Rate by Main Economic Activity of the Head of Household .......................... 9

iv
Table 3.3: Poverty Rate by the Level of Educatio n of the Head of Household.............................. 9 Table 3.4: Poverty Rate by Age of the Head of Household ............................................................ 9 Table 3.5: Poverty Rates in Rural Areas by Age of the Head of Household ................................ 10 Table 3.6: Poverty Rate by Number of Children in the Household ............................................. 10 Table 3.7: Poverty Rate by Gender of the Head of Household .................................................... 10 Table 4.1: Monthly Wages in Moldova & Wages Paid to Moldovans in Countries of Immigration in 2004. .......................................................................................................................................... 14 Table 4.2: The National and Rural Labor Force over 2002-04..................................................... 14 Table 5.1. Moldova: Composition of Income --1999-2004......................................................... 16 Table 5.2. Moldova: Distribution of Private Transfers 1999-2004 .............................................. 19
ANNEX TABLES Annex Table 1: Decomposition of the National Poverty Rate by Alternative Systems of Classification (in Percentage Points) ............................................................................................ 22 Annex Table 2: Decomposition of the Large City Poverty Rate by Alternative Systems of Classification -1997-2004 & 2005 Q1-Q3.................................................................................... 23 Annex Table 3: Decomposition of the Small Town Poverty Rate by Alternative Systems of Classification -1997-2004 & 2005 Q1-Q3.................................................................................... 24 Annex Table 4: Decomposition of the Rural Poverty Rate by Alternative Systems of Classification -1997-2004 & 2005 Q1-Q3 (in percentage points) ................................................ 25

v
ACKNOWLEDGEMENTS
This Poverty Update was written by Menahem Prywes and Edmundo Murrugarra (Senior Economists) and by Shweta Jain (Junior Professional Associate), all of the Human Development Department of the East Europe and Central Asia Region at the World Bank. We thank Alexei Ionascu (Program Officer) for his help with the statistical research, and we thank Nadejda Mochinova (Senior Program Assistant) for her help in preparing the document.
We thank Franziska Gassman (Consultant) and Mihael Peleah (Programme Associate), both at the United Nations Development Program (UNDP), for reviewing this work at several stages and for their valuable advice. We thank William Sutton (Agricultural Economist) for his research into agricultural markets and land reform in Moldova, which informed this work.
Importantly, we thank Arup Banerji (Sector Manager) for his guidance through all stages
of writing. And we thank Paul Bermingham (Country Director for Moldova), Edward Brown (Country Manager for Moldova), Lawrence Bouton (Senior Country Economist for Moldova), and Hideki Mori (Human Development Coordinator for Moldova) for their overall guidance and advice.
Perhaps most importantly, we thank the management and staff of the National Statistical
Bureau for their hard work and cooperation. In particular, we thank Mr. Oleg Cara, and Madams Laur Elena, Negruta Ala, Elena Orlova, and Garabjiu Aurora.

vi
EXECUTIVE SUMMARY
Moldovan GDP growth rose and the poverty rate fell steeply following the end of the Russian financial crisis in 1999. But since late 2002, GDP has continued to grow vigorously, but there has been little progress in reducing poverty. In short, GDP growth is no longer reducing poverty.
Analysis of the household budget survey finds the source of this phenomenon in the rural region. The poverty rate among rural households stabilized in late 2002 and then began a moderate upward trend. In rural areas, the growth of rural consumption shifted from pro-poor over 2002-03 to broadly neutral over 2003-04. Importantly, f armers suffered a steep increase in their poverty rate in 2004 and the first three quarters of 2005. Moreover, the upward trend in rural poverty is not explained by the poor harvest of wheat in 2004, which post-dates the end-2002 turning point in the rural poverty rate.
The available evidence suggests that a fall in household incomes from farms reversed the
decline in rural poverty. The main reason for the fall in farm incomes is to be found in the evolution of relative prices. Moldovan farmers’ real incomes fell as the prices they receive for their products was flat (or fell) while the prices of their inputs, such as wage labor and diesel fuel, rose. The most significant evidence concerns agricultural output prices.
Prices paid to Moldovan farmers (farm-gate prices) have been far below international
prices. The short -falls in farm-gate prices hint that a relatively small number of purchasers may have relatively strong bargaining power in wholesale markets where many small farmers sell. For several commodities, the price short-falls may also be explained, in part, by differences from European quality norm, and restrictions on exports to Russia. The introduction of new regulatory constraints on exports appears to have reinforced the bargaining power of buyers and exerted downward pressure on the farm-gate prices of several commodities. For example, the Government introduced the requirement to sell wheat, flour, and several other commodities for export through the universal commodity exchange in 2004.
Land policy seems to have contributed to the stagnation of the rural poverty rate. Land
distribution to individual family farms started in the late 1990s and this helped start a recovery of agricultural production. That is because small farmers face incentives to invest, which enhances their efficiency and incomes, helping to drive down the rural poverty rate. Distribution of land to individual family farms slowed in 2002 and 2003, so that the potential growth in agricultural incomes, and the potential reduction in poverty, was not realized.
Both government transfers and private remittances from abroad contributed to the rapid reduction of poverty over 1999-2002, and these flows continued over 2003-05. Analysis of data for 2002-04 shows that relatively small shares of public and private transfers flowed to the poorest groups. The Government budget for social assistance reaches across the entire population, but is not targeted to the poorest groups. Moreover, the recent fast gains in private transfers are not compensating for the decline in other sources of income, notably agricultural incomes.

vii
For all these reasons, the next Economic Growth and Poverty Reduction Strategy Paper (EGPRSP) could most usefully focus on policies to promote rural incomes. The emphasis would be on promoting the competitiveness of agricultural commodity markets, so that farmers can earn better prices. To this end, the Government would eliminate regulations that constrain exports and invest in meeting international quality standards for agricultural exports. A resumption in land distribution would improve incentives for investment, and thus improve efficiency and output. A further important direction for policy would be to target social assistance to the poorest groups. Efforts to reduce rural poverty would form part of a broader strategy to improve incentives for domestic investment, and reduce reliance on the use of social transfers and remittances as means of reducing poverty.

1
SECTION 1: RECENT DEVELOPMENTS The Moldovan poverty rate fell following the end of the Russian financial crisis. In
1999, the Russian financial crisis ended, reopening Moldova’s access to credit and to export markets in the former Soviet Union. Sustained growth in GDP followed (bars in Figure 1.1) as per capita GDP in constant dollars rose by more than a quarter over 1999-2003. A vigorous recovery of the demand for goods and services increased domestic labor demand, and wages inflated faster than consumer prices, leading to large cumulative gains in real wages (Table 1.1). As real wages and workers’ remittances from abroad rose, the national poverty rate, as measured by the Ministry of Economy and Commerce (MEC), fell steeply (line in Figure 1.1). Over 1999-2003, the national poverty rate fell by more than half (Table 1.1).
Figure 1.1: GDP Growth and the Poverty Rate: 1997-2005 (Moldova MEC measure of poverty rate)
Source: National Bureau of Statistics. (Note: 2005 GDP growth is for Q1-Q3).
Table 1.1: An Overview of Poverty and Economic & Social Conditions in Moldova and the Europe & Central Asia Region
(In percentage points, unless labeled otherwise) 1999 2000 2001 2002 2003 2004 2005 ECAd/ National poverty rate, MEC measure a/ 73.0 67.8 54.6 40.4 29.0 26.5 29.0 19.7c/ GDP growth rate -3.4 2.1 6.1 7.8 6.6 7.4 7.1 b/ 7.2 GDP per capita, in US$, in 2000 prices 294 301 320 346 370 398.0 .. 2,442.8 Consumer price index inflation 39.4 31.2 9.6 5.2 11.6 12.5 11.9 .. Employee salary inflation 21.6 33.9 33.3 27.2 28.8 23.8 19.5 ..
a/ Absolute poverty, based on a poverty line of 327 Lei per adult equivalent in 2004; b/ Q1-Q3 figure; c/ Poverty rate at $2 per day (purchasing power parity); d/ Europe & Central Asia Region, latest available year. Sources: World Bank & National Bureau of Statist.
Then, the poverty rate stabilized despite vigorous economic growth. In 2004, GDP
grew by more than 7 percent, but the poverty rate fell by less than 3 percentage points –much
-10
-5
0
5
10
15
20
1997 1998 1999 2000 2001 2002 2003 2004 2005
Rea
l GD
P %
cha
nge
0
10
20
30
40
50
60
70
80
Pov
erty
Rat
e (%
)

2
less than the 11 percentage point decline in 2003. During first three quarters of 2005, GDP grew at a 7 percent annual rate, but the seasonally adjusted poverty rate actually rose by 2.5 percentage points. In short, it seems that rapid economic growth is no longer reducing poverty.
Inequality has been on a slight downward trend since the late 1990s. Inequality can be measured by the Gini coefficient; a lower coefficient means less inequality. On balance, inequality has fallen since 2000, judging by the Gini coefficient (Table 1.2). The Gini coefficient for inequality of consumption expenditures declined from 0.396 in 1999 to a low of 0.356 in 2003, and then rose to 0.375 in 2005 Q1-Q3 (Table 1.2). On balance, inequality has fallen since 2000.
Table 1.2: Inequality of Household Consumption Expenditures 1999 2000 2001 2002 2003 2004 2005
Q1-Q3 Gini by consumption expenditures per capita
0.396 0.380 0.388 0.372 0.356 0.361 0.375
Sources: Gov of Moldova-MEC & Household Budget Survey.
Moldova’s economic indicators are weak relative to the region. The stabilization of the poverty rate is of concern because in 2004, the latest period for which comparable data are available, Moldova was a relatively poor country. In 2004, Moldovan GDP per capita, expressed in prices from 2000, was still under US$400, a sixth of the average for the Europe & Central Asia (ECA) region and below the average for Sub-Saharan Africa (Table 1.1). Comparisons of GDP are more meaningful when goods & services across countries are va lued at the same prices –that is, on a purchasing power-parity (PPP) basis. Moldova’s GDP per capita in 2004 on a PPP basis was US$1,613 in constant, 2000, dollars, four times higher than the conventional measure, but still far below the average of US$7,916 for the ECA region. Moreover, the poverty rate of about 27 percent in 2004 was above the ECA average of about 20 percent.
In summary, the decline in the national poverty rate has ended, leaving Moldova a relatively poor country. This poses the question: why? The next section asks whether poverty is well-measured. Then, the section that follows identifies the segments of the population that have suffered the greatest increases in poverty. The final sections seek to explain the economics that underlay the behavior of the poverty rate.
SECTION 2: MEASUREMENT OF POVERTY RATES
Similar Methods lead to similar movements of the Government of Moldova-MEC and World Bank measures of the poverty rate. The MEC and the World Bank Poverty Assessment (2004) apply similar methods for estimating poverty rates. The two estimates of the national poverty move together over time (Figure 2.1). Moreover, the two measures of poverty by region move together (for example, see Figure 3.2). The assumptions made by both the MEC and the World Bank are reasonable and the resulting measures of poverty behave reasonably. The difference between the measures can be explained by several minor differences in methods (Box 2.1).

3
Box 2.1: Computation of MEC & World Bank Poverty Rates The basic source is the household budget survey . Both measures rely on a nationally representative household survey conducted by the National Bureau of Statistics. This is an annual survey, based on information collected monthly. Through the survey, the National Bureau collects information on expenditures on each good and service and on volumes consumed. It also collects information on the demographic composition of each household and on the education and occupation of heads of household. The survey is conducted separately in the Right Bank and Transnistria. As with other officia l statistics for Moldova, the results presented here refer only to the Right Bank.
First, define and compute consumption. The MEC measure includes all consumer expenditures. The World Bank measure excludes consumer durables, because of a lack of information on how to estimate the annual flow of consumption from consumer durables. Housing is excluded because it’s difficult to impute the rent from owner-occupied housing from a survey with few renters. Utilities are excluded because of changes in subsidie s to heating and electricity (which means that, for example, estimates of kilowatt hours consumed would be inconsistent over time).
Then adjust consumption to a per capita or a per adult equivalent basis. The household budget survey reports consumption by household. To ease interpretation by the general public, the World Bank measure expresses consumption on a per capita basis, that is, by dividing by the number of people per household. But needs may differ across household members. Therefore, the MEC computes consumption per adult equivalent, where household size is adjusted for the level and composition of household size. Sensitivity analysis done by the World Bank showed that the profile of the poor was largely unchanged by using per capita instead of a measure of adult equivalence.
Then, deflate consumption expenditures. Deflation extends across temporal and spatial dimensions. With regard to time, all figures on consumption within a single year are deflated to January prices. The MEC does this using the CPI. The food price component of the CPI, however, is based on urban markets, where prices run above those in rural areas. The World Bank measure adjusts for food price difference between the rural, small town and urban regions, using implicit prices from the survey.
Next, define and compute the food and standard poverty lines. The food poverty line is the cost, per person per month, of purchasing the biologically minimum necessary basket of foodstuffs. The MEC food poverty line is the cost of purchasing enough food to supply 2,282 kilocalories per person per day, compared to the World Bank’s use of 2,100 kilocalories. The standard poverty line is the food poverty line plus expenditures on non-food items (calculated from data on households around the food poverty line). If consumption is adjusted per adult equivalent, then the poverty line must likewise be measure for an equivalent adult (and not per capita).
The poverty rate is then the proportion of the population whose consumption leve l (assigned by per capita or per adult equivalent) falls below the poverty line.
In summary, the rates differ for several technical reasons. Compared to the MEC measure, the World Bank measure:
1. Excludes some expenditures from consumption; 2. Adjusts consumption by region for differences in the price of food; 3. Puts consumption on a per capita rather than a per adult equivalent basis; and 4. Applies a slightly lower assumption for minimum calories.

4
Figure 2.1: MEC (unofficial data) and World Bank Measures of the National Poverty Rate
0.0
10.0
20.0
30.0
40.0
50.0
60.0
70.0
80.0
1997 Q
uarter
2
1997 Q
uarter
4
1998 Q
uarter
2
1998 Q
uarter
4
1999 Q
uarter
2
1999 Q
uarter
4
2000 Q
uarter
2
2000 Q
uarter
4
2001 Q
uarter
2
2001 Q
uarter
4
2002 Q
uarter
2
2002 Q
uarter
4
2003 Q
uarter
2
2003 Q
uarter
4
2004 Q
uarter
2
2004 Q
uarter
4
2005 Q
uarter
2
perc
enta
ge p
oint
s, n
ot s
easo
nally
adj
uste
d
Ministry of Ec & Trade
World Bank
Sources National Bureau of Statistics and World Bank Both measures of poverty are correct. The MEC measure of the poverty rate runs
slightly below the World Bank measure. The main reason is that the MEC poverty line runs below the World Bank poverty line; therefore fewer Moldovan households fall below the MEC poverty line than fall below the Bank line. The difference in poverty lines is unimportant, since there is no single objective definition of the line (Ravallion, 1998). It is important to choose a poverty line that is useful for interpreting trends in poverty, and both measures satisfy that criteria.
In recent years, the Government of Moldova greatly improved it’s measurement of poverty. The Government used to produce several rates; it recently settled on a single national measure of the poverty rate, which is produced by the MEC with the collaboration of the National Statistical Bureau. The MEC is planning to make several improvements in its measure of the poverty rate, starting with the household budget survey for 2006, and these improvements will resolve most of the differences with the World Bank measure. For example, the new MEC measure will exclude durable goods from consumption and make regional price adjustments.
In brief, the Government-MEC measure of poverty is well-constructed and is, for practical purposes, the same as the World Bank measure . Since the MEC is planning changes in its methodology, and for purposes of simplicity and international comparability, the poverty profile below will use the World Bank measure.

5
SECTION 3: POVERTY PROFILE
This Profile is a search for clues about the stabilization of the poverty rate. The Profile describes the evolution of the poverty rate and the characteristics of the poor population in Moldova, focusing on recent developments. The objective is to identify the main statistical components of changes in the poverty rate. The sections that follow seek to explain the economics that underlie changes in the components.
In going about this, the strategy is to decompose the national poverty rate using alternative systems of classification. The Profile decomposes the poverty rate by region, by major economic activity of the head of household, by demographic characteristics such as the age and gender of the head of household, and by yet further criteria.
In the rural region, the poverty rate stabilized and then began to rise. The breakdown by region reveals that poverty continued to decline in urban areas over 2004 and the first three quarters of 2005 (Table 3.1). But the poverty rate in rural areas, where 63 percent of the population lives, increased over 2004 and 2005 Q1-Q3, rising by 6.8 percentage points from 2003 (shaded area of Table 3.1). Rural poverty rose according to the Government of Moldova-MEC measure as well as the World Bank measure of poverty (Figure 3.2). The poverty rate declined in small towns in 2004, although it increased in 2005 Q1-Q3.
Table 3.1: Poverty Rate by Region (in percentage points)
1997 1999 2002 2003 2004 2005 Q1-Q3 Large cities 32.1 50.4 28.6 22.7 17.3 14.7
Small towns 62.5 80.9 62.3 49.4 45.7 48.5 Rural 51.9 76.9 51 35.7 37.1 42.5
Notes: Figures for 2005 Q1 through Q3 are seasonally adjusted. This & all further figures use the ordinary poverty line. Source: World Bank & Household Budget Survey.
Does the poor harvest of wheat in 2004 explain the upward trend in rural poverty?
It seems reasonable to ask whether the stabilization of rural poverty was caused by a transitory shock, or by a passing measurement error. In particular, poor rainfall and snowfall in late 2003 led to an unusually poor harvest of winter wheat in the second quarter of 2004. Therefore, the timing and persistence of the stabilization of poverty in rural areas is important. To address this, the quarterly data are seasonally adjusted using the average quarterly fluctuations of poverty rates over 1997-2004.
The stabilization of the rural poverty rate is a well-established trend and not the result of a poor harvest. The resulting quarterly pattern suggests that the rural poverty rate has been on a modest upward trend since the four th quarter of 2002 (Figure 3.1). This places the point at which the rural and national poverty rates stopped falling and became flat at well before the poor harvest of winter wheat in the second quarter of 2004. Importantly, the rural poverty rate has been stable or rising for 11 quarters –nearly three years. This pattern holds using either the MEC or World Bank measures of the rural poverty rate (Figure 3.2). Given this record, it

6
seems safe to conclude that the stabilization of the rural poverty rate is not the result of the poor harvest of winter wheat in 2002 and is probably not a statistical aberration.
Figure 3.1: Poverty Rates by Region-annual 1997-2001,
quarterly & seasonally adjusted, 2002-05 Q3
0
2 0
4 0
6 0
8 0
100
S m a l l t o w n s
L a r g e c i t i e s
Rural areas
N a t i o n a l
The seasonally adjustment poverty rate in rural areas stabilized in about 2002 Q4.
Sources: World Ba nk and Household Budget Surveys
Figure 3.2: MEC (unofficial data) and World Bank Measures of the Rural Poverty Rate (not
seasonally adjusted)
0.010.020.030.040.0
50.060.070.080.0
90.0
1997 Q
uarter
2
1997 Q
uarter
4
1998 Q
uarter
2
1998 Q
uarter
4
1999 Q
uarter
2
1999 Q
uarter
4
2000 Q
uarter
2
2000 Q
uarter
4
2001 Q
uarter
2
2001 Q
uarter
4
2002 Q
uarter
2
2002 Q
uarter
4
2003 Q
uarter
2
2003 Q
uarter
4
2004 Q
uarter
2
2004 Q
uarter
4
2005 Q
uarter
2
Per
cent
age
poin
ts
GoM-MET
World Bank
Sources: National Statistical Bureau and World Bank

7
The poverty rate in small towns also stabilized, starting in the fourth quarter of 2002, though the rate has been volatile since then. In large cities, the poverty rate continued to fall through 2002 and 2003 and fell again in 2005.
Growth incidence analysis shows a shift away from pro-poor growth of consumption at the national level. A further means of understanding trends in poverty is to analyze the distribution of the growth in consumption expenditures among richer and poorer groups. One way to do this is by charting growth inc idence curves (Box 3.1). At the national level, growth of consumption over 2002-03 favored the poor, but growth over 2003-2004 was broadly neutral with respect to income groups (Figures 3.3a & 3.3b).
In rural areas, the growth of consumption shifted from pro -poor over 2002-03 to
broadly neutral over 2003-04. Growth of consumption expenditures in rural areas over 2002-03 led to a disproportionate gain in expenditures among relatively poor groups and a less than proportional gain for relatively rich groups (Figure 3.6a). In contrast, the poor did not gain any distributive advantage in 2003-04 (Figure 3.6b). This shift, in rural areas, from pro-poor growth to poverty-neutral growth is particularly significant since about 70 percent of the poor live in rural areas.
There were no major redistributive trends in cities and small towns. Growth of expenditures in large cities over 2002-03 modestly benefited the bottom half of the distribution at the expense of the top half (Figure 3.4a). In contrast, there was only a slight distribution of gains from consumption over 2003-04 to the poorest group (Figure 3.4b). In small towns, the poorest and richest groups benefited disproportionately from growth in consumption over 2002-03, while the middle income groups benefited less than proportionately (Figure 3.5a). The poorest 25 percent of households in small towns benefited only slightly more than proportionately from growth of consumption over 2003-04 (Figure 3.5b).
Farmers suffered a steep increase in their poverty rate. The decomposition of the national poverty rate by major economic activity of the head of household reinforces the conclusions from the decomposition by region (Table 3.1). Since 2003, the poverty rate for households which are headed by a farme r increased by 12 percentage points (shaded area in Table 3.2). Poverty rates also increased in 2004 and 2005 Q1-Q3 among households headed by pensioners. In rural areas, the poverty rate among households headed by pensioners by 3.1 percentage points in 2004 and by 4.6 percentage points in 2005 Q1-Q3 (Annex Table 4). At the national level, and in rural areas, households headed by self-employed people had the most modest rates in 2004 and in 2005 Q1-Q3.
Box 3.1: Explanation of Growth Incidence Curves
Growth incidence curves illustrate the relationship between growth and poverty reduction. The flat line in each figure is the average rate of growth of nominal consumer expenditures over the period. The uneven line in each figure is the growth incidence curve. The curve shows the average rate of growth of consumption expenditures (on the vertical axis) of each group of the distribution of expenditure per capita (horizontal axis), running from the poorest to the richest. A group with given consumption per capita benefits disproportionately from growth when the curve lies above the line, and benefits less than proportionally from growth when the curve lies below the line.

8
Figures 3.3a & 3.3b: National Growth Incidence Curves (Sources: World Bank & Household Budget Survey)
Figures 3.4a & 3.4b: Growth Incidence Curves for Large Cities
Figures 3.5a & 3.5b: Growth Incidence Curves for Small Towns
Figures 3.6a & 3.6b: Growth Incidence Curves for Rural Areas
5040
3020
10
0-1
0A
nnua
l Per
cent
age
Cha
nge
0 25 50 75 100Expenditure per capita percentile
Growth Incidence Curve 2003-2004 Large Cities
5040
3020
10
0-1
0A
nnua
l Per
cent
age
Cha
nge
0 25 50 75 100Expenditure per capita percentile
Growth Incidence Curve 2002-2003 Small Towns
5040
30
2010
0-1
0A
nnua
l Per
cent
age
Cha
nge
0 25 50 75 100Expenditure per capita percentile
Growth Incidence Curve 2003-2004 Small Towns
5040
30
2010
0-1
0A
nnua
l Per
cent
age
Cha
nge
0 25 50 75 100Expenditure per capita percentile
Growth Incidence Curve 2002-2003 Large Cities
5040
3020
100
-10
Ann
ual P
erce
ntag
e C
hang
e
0 25 50 75 100Expenditure per capita percentile
Growth Incidence Curve 2002-2003
5040
30
2010
0-1
0A
nnua
l Per
cent
age
Cha
nge
0 25 50 75 100Expenditure per capita percentile
Growth Incidence Curve 2003-2004
5040
3020
100
-10
Ann
ual P
erce
ntag
e C
hang
e
0 25 50 75 100Expenditure per capita percentile
Growth Incidence Curve 2002-2003 Rural
5040
3020
100
-10
Ann
ual P
erce
ntag
e C
hang
e
0 25 50 75 100Expenditure per capita percentile
Growth Incidence Curve 2003-2004 Rural

9
Table 3.2: Poverty Rate by Main Economic Activity of the Head of Household (in percentage points)
1997 1999 2002 2003 2004 2005 Q1-Q3 Farmer 50.4 74.3 53.9 35.7 41.8 47.7
Hired in agriculture 55.1 80.7 66.4 53.2 47.0 50.5 Hired in non-agriculture 43.5 65.6 40.5 31.7 28.3 30.5
Self-employed 35.7 51.7 32.1 21.2 22.5 17.1 Pensioner 47.3 72.8 47.4 32.4 33.0 35.1
Other 41.4 67.9 25.8 34.1 20.4 NA Unemployed 62.5 74.0 64.3 54.3 24.1 NA
Notes: 2005 Q1-Q3 figures are seasonally adjusted. Sources: World Bank and Household Budget Survey.
The probability of being poor also depends on the education and age of the head of
household and on the number of children per household. The poverty rate was relatively low for households headed by people with a higher education, or vocational education (Table 3.3). The highest poverty rate was among households with a head with a primary education (shaded area in Table 3.3). In rural areas, the highest poverty rates in 2003 and 2004 were for households headed by an illiterate person or a person with only a primary education (Annex Table 4).
Table 3.3: Poverty Rate by the Level of Education of the Head of Household (in percentage points)
1997 1999 2002 2003 2004 2005 Q1-Q3 Higher education 30.2 49.7 23.8 17.8 15.2 19.9
Vocational 50.2 69.9 44.3 30.4 25.7 39.8 Secondary regular 52.0 76.2 53.9 39.7 36.6 49.9
Primary 52.7 79.1 54.8 41.0 44.5 43.6 Illiterate 47.5 75.1 52.9 33.8 37.7 34.9
Notes: a/ 2005 Q1-Q3 figures are seasonally adjusted. Sources: World Bank and Household Budget Survey.
In 2003 and 2004, households headed by people 30-39 and 40-49 had the highest rates of
poverty. However, the poverty rate of households headed by elderly people, aged 70 and over increased in 2004, but the increase was not sustained in 2005 Q1-Q3. (Table 3.4).
Table 3.4: Poverty Rate by Age of the Head of Household (in percentage points) 1997 1999 2002 2003 2004 2005 Q1-Q3
<30 years 48.2 72.3 44.3 32.7 26.7 35.4 30-39 years 49.2 77.0 54.6 37.2 36.1 38.0 40-49 years 50.0 71.1 50.5 38.4 36.7 42.0 50-59 years 47.7 66.1 43.7 34.7 34.3 39.0 60-69 years 43.4 68.0 44.1 31.5 30.5 28.7 >=70 years 49.2 73.3 47.9 30.4 33.7 32.8
Notes: 2005 Q1-Q3 figures are seasonally adjusted. Sources: World Bank and Household Budget Survey.

10
In rural areas, poverty rates rose in 2004 and 2005 Q1-Q3 among households headed by people over 50 (shaded area in Table 3.5). This pattern deserves further interpretation. For example, higher poverty rates could reflect deteriorating health, and hence difficulty in cultivating the land or in earning income through wage labor.
Table 3.5: Poverty Rates in Rural Areas by Age of the Head of Household (in percentage points)
1997 1999 2002 2003 2004 2005 Q1-Q3 <30 years 52.3 88.2 65.3 46.5 43.7 52.5
30-39 years 52.2 82.3 63.3 40.9 41.5 43.2 40-49 years 52.9 75.6 52.8 38.6 38.0 43.9 50-59 years 52.7 71.9 42.7 35.6 36.9 43.3 60-69 years 41.7 69.6 42.3 29.3 31.5 31.9 >=70 years 48.5 72.7 47.2 24.5 32.7 34.2
Notes: 2005 Q1-Q3 figures are seasonally adjusted. Sources: World Bank and Household Budget Survey.
Returning to the national level, the poverty rate increases with the number of children,
and this is an enduring pattern over the data period in Tab le 3.6. Since 2003, families with four or more children have experienced an increase in their average poverty rate.
Table 3.6: Poverty Rate by Number of Children in the Household (in percentage points)
1997 1999 2002 2003 2004 2005 Q1-Q3 No children 36.2 60.8 36.0 24.1 24.7 28.9
1 child 47.5 72.6 51.2 38.8 35.2 38.1 2 children 55.4 80.6 61.4 46.3 47.9 48.2 3 children 61.9 88.5 74.8 60.9 55.2 67.1
4+ children 76.6 89.1 84.1 64.5 66.4 72.0 Notes: 2005 Q1-Q3 figures are seasonally adjusted. Sources: World Bank and Household Budget Survey.
Gender, however, does not seem associated with higher poverty rates. The poverty
rate tends to be higher for households headed by men, although the reverse holds in most countries (Table 3.7). This would seem to deserve further investigation. Perhaps many households headed by women receive remittances from family working in other regions or abroad.
Table 3.7: Poverty Rate by Gender of the Head of Household (in percentage points)
1997 1999 2002 2003 2004 2005 Q1-Q3 Male 48.5 73.2 49.7 35.8 35.8 39.5
Female 47.6 67.9 46.1 33.9 31.1 33.3 Notes: 2005 Q1-Q3 figures are seasonally adjusted. Sources: World Bank and Household Budget Survey.

11
In rural areas, households headed by men suffered from poverty rates three to four percentage points higher than households headed by women over 1997-2002 (Annex Table 4). Rates equalized in 2003 and poverty among households head by men was 4.7 percentage points higher in 2004 and 6.2 percentage points higher in 2005 Q1-Q3.
Trends in poverty among farm households, and to a lesser extent, the elderly, statistically explain the stabilization of the poverty rate. Furthermore, the poverty rate appears to be on a moderate upward trend in rural areas and among households headed by farmers. This suggests that an investigation into the determinants of rural incomes could yield insight into the stabilization and recent increase in poverty there. Therefore the next section will investigate whether small farmers’ income from agriculture has declined.
The other areas of concentration of poverty are among the elderly, that is, households headed by people over 70, who often depend on pensions, and also among the least educated. Section 5 will investigate whether this is linked to the evolution of pension payments or remittances.
SECTION 4: POSSIBLE REASONS FOR THE END TO THE DECLINE IN RURAL POVERTY
Rural well-being and poverty depend mainly on incomes from agriculture. By
definition, the rural poverty rate depends on the consumption expenditures of rural households, which in turn depends on their incomes. This section examines the main components of rural incomes to better understand the end to the decline and modest increase in the rural poverty rate. The approach is to explain the increase in the rural poverty rate, while the broad economy grows, by exploring the economics that drive the major components of rural income. These are:
1. Profits from farming owned or rented land; 2. Earned (wage) income from agricultural and non-agricultural labor; and 3. Transfers, both formal transfers from the state and private remittances from abroad.
This section deals with incomes from agriculture (components 1 and 2), which is the
most important source of rural incomes; the next section addresses transfers. In 2004, about 37 percent of the rural population depended mainly on income from their own farms, while a further 16 percent depended mainly on wages earned in agriculture.
Farm incomes are broadly flat or falling. Real monthly per capita incomes of
households that depend mainly on their farms fell in 2004 and 2005 (Figure 4.1). Most probably, the main reason is that farmers are caught between falling prices for their agricultural output and rising prices of inputs. A further possible reason is a slowdown in distribution of land to individual ownership.
Farm commodity prices are flat or declining. The analysis focuses on the evolution of
relative prices: first it examines agricultural commodity prices, and then it examines input prices.

12
The agricultural producer price index fell, in lei terms, over 1999-2002, and has been broadly flat since then (Figure 4.2).
Figure 4.1: Real Monthly Per Capita Income of Households that Depend Mainly on Farm Income
(over Q1-Q3 of each year)
0.0
50.0
100.0
150.0
200.0
250.0
2001 2002 2003 2004 2005
Lei
Source: Gov of Moldova HBS & World Bank
Figure 4.2: Moldova Real Agricultural Producer Price Index
0
20
40
60
80
100
120
1997 1998 1999 2000 2001 2001 2003 2004
(199
9=10
0)
Source: National Bureau of Statistics

13
Figure 4.3: Real Wages in Agriculture and in Other Sectors
0.0
100.0
200.0
300.0
400.0
500.0
600.0
700.0
800.0
900.0
1,000.0
1997 1998 1999 2000 2001 2001 2003 2004 2005
Mon
thly
wag
es in
con
stan
t 199
9 le
i
AgricultureManufacturing
ConstructionState administration
Sources: National Bureau of Statistics & World Bank
The price data hint that a lack of competition among buyers in wholesale markets
depressed farm-gate prices of several crops. For instance, the price of wheat paid to Moldovan farmers (the farm-gate price) was only 2 percent lower than the international price in 2000, but the short-fall reached 44 percent in 2002; and was still 36 percent in 2004. A recent World Bank report on Moldovan Agricultural Markets shows large short- falls in prices of several other traditional agricultural commodities (World Bank, 2005). For fruits and vegetables, difficulty in meeting European Union standards for may explain part of the short-fall. For wine, Russian restrictions on imports from Moldova probably depressed prices. But for other crops, the short- fall may be caused by the bargaining power of a small number of buyers in the wholesale market with a large number of small sellers.
Regulatory constraints exert downward pressure on farm-gate prices and on farm profits. The establishment in 2004 of the Universal Commodity Exchange, where all wheat destined for export must be sold , may reinforce the bargaining power of buyers and help a few such firms realize profits from the differential between farm-gate and international prices. There are similar restrictions on the exports of flour, barley, maize, and sunflower seeds. In a further example, the Government required, informally, that farmers export wheat via rail at a relatively high price per ton. It also required excessive documentation, such as certification from fiscal authorities and the social fund, and documents for conformity assessment. These requirements, also slowed exports and decreased profitability.
Wage and energy costs have been rising. Labor is usually the largest input into agricultural production, besides land. Average monthly wages in Moldovan agriculture have been rising steadily, in lei terms, since 1999 (Figure 4.3). Moldovan farmers face rising wages because workers are attracted to higher wages in cities and abroad. So farmers are obliged to compete for labor with urban and foreign employers.

14
Migration to urban areas is attractive because average monthly wages in current lei have been running higher in economic sectors that are mostly based in cities. Most importantly, the share of construction in GDP rose from 2.9 percent in 2002 and 2003 to 3.5 percent in 2005, and this probably attracted rural laborers. Real wages have been rising in urban-based industries such as construction, manufacturing, and state administration (Figure 4.3).
Table 4.1: Monthly Wages in Moldova & Wages Paid to Moldovans in Countries of
Immigration in 2004. Moldova $90 Russia $372 Portugal $898 Italy $934 Source: IOM, IMF & EU (2004)
Table 4.2: The National and Rural Labor Force over 2002 -04
Total National -11.3% Total Rural -16.6% of which 15-19 yrs -39.2% 20-24 yrs -36.6% 25-29 yrs -36.7% Source: Moldova Labor Force Survey
Moreover, average monthly wages of migrant Moldovan workers in Russia, Portugal, and
Italy run far above average wages for all workers in Moldova, according to a recent study (IOM, IMF & EC, 2004; see Table 4.1). This resulting exodus from Moldova has led to a decline in the national labor force for 2002-04 (Table 4.2). The rural labor force declined even further than the national labor force, as some rural workers migrated to Chisinau and Balti. This decline was concentrated among the young age groups (Table 4.2).
Importantly, the price index of agricultural products fell relative to wages in every year since 1999 (Figure 4.4). The price index for agr iculture also fell steadily relative to the price of gasoline (Figure 4.4), and this was most probably also true relative to diesel fuel and fertilizers prices. The convergence of stable or falling output price, rising input prices and new regulation suggest that profits in agriculture have declined and constrained the income of farmers.
Figure 4.4: Index of Agricultural Output Prices Relative to Input Prices
0
20
40
60
80
100
120
140
160
1997 1998 1999 2000 2001 2002 2003 2004
1999
=100
Agric Price / gasoline
Ag Price / Ag Wages
Souces: National Statistical Bureau & World Bank.

15
While farmers suffered from the rise in agricultural wages, wage earners benefited. The
steady rise in agricultural wages is associated with a steady increase in real monthly per capita income among households that draw their income mainly from agricultural labor (Figure 4.5).
Figure 4.5: Real Monthly Per Capita Income of Households that Depend Mainly on
Agricultural Labor (over Q1-Q3 of each year)
0.0
50.0
100.0
150.0
200.0
250.0
300.0
2001 2002 2003 2004 2005
Lei
Source: Gov of Moldova HBS & World Bank.
Land distribution to family farms slowed at about the same time as the decline in poverty. While the evolution of prices depressed the net incomes of small farmers, the slowdown in land distribution in 2002 and 2003 slowed the growth of small family-run farms. Land distribution started in the late 1990s and this helped start a recovery of agricultural production. This occurred because the small farmers are motivated and face incentives to invest, which enhances their efficiency and incomes. So the slowdown in distribution of land to individual family farms meant that the potential growth in agricultural incomes, and the potential reduction in poverty, was not realized.
Since 2002, the share of land cultivated by individual family farms has remained constant at less than 60 percent. The remaining 40 percent is cultivated by corporate farms or ‘restructured’ collective farms who rent- in most of their land from members at low rental rates. These rental prices are low because corporate farms often cultivate wheat and oilseeds, whose prices are depressed, and because the corporate farms are less efficient. Further influences contributed to the decline in agricultural profits. A better investment climate would have strengthened agricultural profits. Restrictions on agricultural exports to the European Community and Russia, apparently for quality reasons, reduce incentives for foreign investment in Moldovan agriculture. Limited access to financing and underdevelopment of the land market may also constrain investment in agriculture. Deterioration of rural infrastructure, and in particular roads, is a further constrain on productivity and incomes in rural areas.

16
In summary, market and regulatory trends , and a slowdown in land distribution,
increased poverty among farmers. Strong demand for labor in Chisinau and abroad induced migration from rural areas and drove up the real wages of agricultural laborers. Over the same period, the price of energy rose steadily. Moldovan farmers were unable to pass on the increased costs of inputs by increasing the prices of their agricultural commodities. Farm income was also constrained by the introduction of new regulations on exports, and in particular the requirement for sale of wheat and other commodities for export through the Universal Commodity Exchange. Furthermore, the end to land distribution appears linked to the end to the decline in rural poverty. These trends diminished incomes and increased poverty among households that depend mainly on their farms. However, workers in construction and other urban-based sectors benefited from rising wages, and this trend contributed to the continued decline in the poverty rate in urban areas.
Two further flows of income influenced the evolution of poverty: government transfers and remittances from Moldovans working abroad. The next section evaluates their impact.
SECTION 5: RECENT CHANGES IN PUBLIC AND PRIVATE TRANSFERS AND THEIR IMPACT ON POVERTY
The analyses of poverty between 1997 and 2002 emphasized the importance of growth in
providing higher incomes to the population. While part of that growth was driven by increased exports and wages, household incomes improved in the past as pensions and remittances increased. This section examines the evolution of public and private transfers to understand their role in the recent stagnation in poverty levels.
Table 5.1. Moldova: Composition of Income --1999-2004 (percentage point shares in totals)
1999 2000 2001 2002 2003 2004 Wages 49.0% 52.4% 49.5% 46.4% 46.3% 47.9% Self employment 2.3% 2.0% 2.0% 2.1% 3.1% 3.1% Agriculture 9.2% 9.6% 9.6% 11.5% 10.3% 7.6% Government Transfers 0.7% 0.4% 0.6% 1.2% 1.2% 1.3% Pension 10.5% 12.4% 14.1% 15.9% 15.2% 16.0% Private Transfer + remit 6.6% 7.9% 10.3% 10.4% 11.9% 13.8% Credits 11.9% 11.7% 10.6% 9.2% 8.1% 7.4% Nominal Compensation 0.0% 0.5% 0.7% 1.3% 1.1% 0.9% Other 9.7% 3.2% 2.5% 2.1% 2.8% 2.0% Total 100.0% 100.0% 100.0% 100.0% 100.0% 100.0%
Source: World Bank estimates based on HBS 1999-2004. The Moldovan government transfers benefits through many programs. Most public
transfers are pension benefits; these include old age pensions as well as pensions for people of working age, those suffering from disability, state pensions to suffering people and social pensions. Incomes from pensions increased faster than other income sources, at around 31
17
percent per year between 2000 and 2002 and 12 percent between 2002 and 2004. As a result, the share of pension in total household income increased from 10 percent in 1999 to 16 percent between 2002 and 2004 (Table 5.1).
Pension benefits cover broad sections of the population, but their impact on poverty reduction is relatively low in rural areas. About half of households in Moldova benefit from pension incomes and pensions are an important income source for reducing poverty. The existence of the pension system reduces poverty the most in large cities, where the presence of pensions reduced the poverty rate to 11 percent in 2004, compared to 22 percent without pensions. In rural areas, the impact of pensions on poverty is lower, bringing the poverty rate to 29 percent, compared to 35 percent without pens ions.
Social Assistance transfers are fragmented and that limits the ir ability to reach the
poor. In Moldova there are other 15 social assistance benefits with a range of eligibility criteria and processing procedures. This includes specific benefits for children living in difficult conditions and for individuals with specific conditions, such as war veterans and victims of accidents. These benefits are small on average and only represent between 2 and 3 percent of the household income. One of the major benefits is the Nominal Compensation for Energy and other Utility Payments (Nominal Compensation in Table 5.1), created in 2000 to offset the impact of the increased cost of gas and fuel when the Government couldn’t afford the general subsidies to utility companies. Nominal Compensation accounts for almost half of the social assistance budget, but is distributed in a similar way as the other programs.
Figure 5.1 shows how these benefits are distributed across income quintiles, from poorest to richest. Resources are spread rather evenly, rather than concentrated in the poorest quintiles. From an equity perspective, however, public resources assigned to individuals and households that are not in need represents a waste of resources since the poverty reduction impact could be larger if the resources were allocated to poor groups. This is the inefficiency in the allocation of resources that needs to be addressed in the Moldovan system. (Please note that ‘Targeted [nominal] compensations’ and ‘Targeted child benefit’ in Figure 5.1 are targeted by category, not by household income.) The Government is collecting the information necessary to pilot
Figure 5.1: Distribution of Recipient Households by Income Quintile, 2004
Source: MET based on HBS data
0% 20% 40% 60% 80% 100%
Total social transfersTotal social insuranceTotal social protection
Old-age & retirement pensionBenefits for children
Targeted child benefitTargeted compensations Quintile I
Quintile IIQuintile IIIQuintile IVQuintile V

18
targeting through the introduction of “filters” to Nominal Compensation, with support from the Food Security Program of the European Union.
Social Assistance benefits are broadly distributed in the population because they are
not targeted using poverty-related instruments. Eligibility for social assistance benefits is based on categories of people, such as war veterans, orphan children, and people with administratively defined disabilities. These categories are no longer effective in determining the income needs of households because other household income sources are increasingly heterogeneous. For example, the share of private transfers, including remittances, in income doubled over 1999-2004. As a result, people in each category are present across the income distribution, and the benefits from public transfers are also broadly distributed.
In Moldova, the large rural sector and increased emigration complicate targeting by
category and by income. The majority of the Moldovan population lives in rural areas and their income depends on agriculture and processed agricultural products, although some of these are consumed by the producers and not marketed. Agriculture poses several challenges for targeting by income. First, it is hard to observe agricultural production and sales for targeting purposes. Second, it is not possible to measure income net of input costs, since small family run farms supply much of their own labor, and hire labor and buy other inputs on informal markets and without keeping records. Several of these factors also apply in the urban context. For example, in small family businesses, such as restaurants, sales or cost of inputs are not distinctively separate from the household consumption activities. Another element that affects both rural and urban households is the high level of emigration and remittances that is hard to observe. The limitations of categories used in the previous system and the difficulty in measuring income suggest the use of other proxies for income for targeting.
Migration and private transfers (remittances) are a key element of Moldova’s recent growth and poverty reduction. Moldovan households have relied on sending their labor force abroad in the past, and this pattern has been maintained (World Bank, 2004 and CBX AXA, 2004). A recent survey found that about 22 percent of households had a migrant member between 2003 and 2004. These migrants represented about 40 percent of the economically active population. Most of the reported migration was motivated by economic reasons. These migrants, either temporary or permanent, send remittances home , increasing the house hold income and consumption and reducing poverty.
The distribution of migrants, however, poses constraints for the impact of remittances on poverty. The previous poverty assessment (World Bank, 2004) found that households that receive remittances correspond to the two extremes of the geographic distribution: 45 percent of recipients were in large cities, 41 percent in rural areas, and the remainder of 13 percent is in small cities. The evidence for recent years, however, shows an increased pattern of emigration from rural areas and small towns. In 2004, almost 56 percent of the people that benefit from private transfers are in rural areas and about 21 percent in small towns. (CBX AXA, 2004).

19
Table 5.2. Moldova: Distribution of Private Transfers 1999-2004
(Percentage point distribution across quintiles, ordered from poorest to richest)
Quintiles: 1 2 3 4 5 1999 2.0% 5.9% 11.8% 14.5% 65.9% 2000 4.3% 5.7% 8.6% 21.5% 59.8% 2001 2.4% 7.2% 9.1% 18.4% 62.9% 2002 1.8% 5.9% 11.2% 17.1% 64.0% 2003 3.7% 5.7% 13.3% 15.3% 62.1% 2004 3.1% 3.9% 9.1% 19.1% 64.8%
Source: Household Budget Survey and World Bank. The increase in private transfers mainly benefits the mid and upper income groups
and is therefore not reducing the poverty rate. The average househo ld increased its share of income from private transfers, up from about 10 percent in 2002 to 14 percent in 2004. The increased reliance on private transfers, however, does not benefit the poorest households, since more than 60 percent of private transfers end up in the top quintile and less than 4 percent go to the poorest quintile. Still, those households receiving private transfers heavily rely on those, reflecting the high level of dependence on private transfers and the potential vulnerability to unexpected changes in remittances flows.
In summary, growth in public transfers and workers’ remittances is no longer
contributing to poverty reduction. It seems save to conclude that the rapid reduction of poverty between 1999 and 2002 was helped by government transfer and especially pensions. Private remittances have accelerated recently. But neither public transfers nor private remittances are reaching relatively poor groups in amounts sufficient to offset the loss of income from other sources, in particular agriculture.
SECTION 6. CONCLUSIONS AND FUTURE POLICY DIRECTIONS
The national poverty rate is broadly stable while the rural rate is on a modest upward trend. Analysis of data from the household budget surveys shows that the decline in the national poverty rate stopped at the end of 2002 and that the rate has been broadly stable since. The rural poverty rate has been on a modest upward trend; the increase in poverty is concentrated among farmers, and to a lesser extent, among rural pensioners. At the same time, real incomes rose among rural wage earners. Real incomes also rose among urban residents, and their poverty rate continued to decline, as they benefited from the expansion of the construction industry and from rising real wages in construction, manufacturing, and public service.
Trends in agricultural output and input prices increased the rural poverty rate. The prices of Moldova’s agricultural commodities ha ve been flat or have declined, while the prices of farm labor and energy (such as diesel fuel) rose. As a result, the real income per capita of households that depend mainly on farms decreased. In contrast, the real income per capita of households that depend on agricultural wages rose. But on balance, real rural incomes declined and the rural poverty rate rose.

20
Moreover, new regulations probably lowered the prices wholesalers paid to farmers and this also increased the rural poverty rate. The introduction of a regulation requiring the sale of wheat, flour, and other commodities, for export through the Universal Commodity Exchange appears to have helped buyers improve their bargaining power relative to sellers, and to have contributed to the shortfall in the farm gate price paid to farmers, relative to the international price of wheat.
The Government can reduce poverty through policies that improve small farm incomes. Policy measures can reduce rural poverty by enhancing the competitiveness of agricultural wholesale markets. A step in this direction would be to eliminate regula tions that constrain exports. Moreover, the Government can promote exports by investing in meeting European Community agricultural standards. Importantly, an increase in the rate of distribution of land to individual farmers would improve incentives for investment, and hence increase productivity, and probably revenues.
Targeting social assistance would reduce poverty. Social assistance benefits are paid to categories of people, but the categories do not correspond, in general, to the poorest groups. These benefits are broadly distributed across income groups, and not concentrated on the poorest quintile. The major directions in policy are to consolidate social assistance programs to control total payments to each household; and pilot targeting of social assistance using proxies for income.
Only a small share of workers’ remittances flow to the poorest groups. Workers remittances form an increasing share of income of the population, but only about 3% reached the poorest quintile in 2004. The Government could adapt its tax policy to guide remittances to poverty-reducing investments, for example by increasing value-added taxes on consumer durables.

21
BIBLIOGRAPHY
CBS AxA. “Moldova Remittance Study.” A report prepared for the International Organization for Migration, International Monetary Fund, and the European Commission Food Security Program, December, 2004. Nachinkina, D. (2006) “Social Assistance Programs in Moldova,” background paper prepared for the Social Protection Project. Peleah, M. (2006) Moldova - Nominal targeted compensations as a biggest programme of social assistance, mimeo. Background paper prepared for the Poverty Update. Ravallion, Martin (1998). “Poverty Lines in Theory and Practice.” Living Standards Measurement Study Working Paper No. 133. World Bank. Republic of Moldova, Ministry of Economy and Commerce (2005). “Poverty and Policy Impact Report: 2005.” Chisinau. World Bank (2004).“Recession, Recovery, and Poverty in Moldova: Poverty Assessment.” World Bank Country Study, Report No. 28024-MD, November 2004. World Bank (2005). “Moldova – Agricultural Policy Notes: Agricultural Markets.” Draft, August 23.

22
STATISTICAL ANNEX
Annex Table 1: Decomposition of the National Poverty Rate by Alternative Systems of Classification (in Percentage Points)
1997 1999 2002 2003 2004 2005 Q1-Q3
1. By region Large a/ 32.1 50.4 28.6 22.7 17.3 14.7
Small towns a/ 62.5 80.9 62.3 49.4 45.7 48.5 Rural a/ 51.9 76.9 51 35.7 37.1 42.5
2. By age of household head <30 years 48.2 72.3 44.3 32.7 26.7 35.4
30-39 years 49.2 77.0 54.6 37.2 36.1 38.0 40-49 years 50.0 71.1 50.5 38.4 36.7 42.0 50-59 years 47.7 66.1 43.7 34.7 34.3 39.0 60-69 years 43.4 68.0 44.1 31.5 30.5 28.7 >=70 years 49.2 73.3 47.9 30.4 33.7 32.8
3. By educ. of household head Higher education 30.2 49.7 23.8 17.8 15.2 19.9
Vocational 50.2 69.9 44.3 30.4 25.7 39.8 Secondary regular 52.0 76.2 53.9 39.7 36.6 49.9
Primary 52.7 79.1 54.8 41.0 44.5 43.6 Illiterate 47.5 75.1 52.9 33.8 37.7 34.9
4. By sex of head male 48.5 73.2 49.7 35.8 35.8 39.5
female 47.6 67.9 46.1 33.9 31.1 33.3 5. By # of children in household
No children 36.2 60.8 36.0 24.1 24.7 28.9 1 child 47.5 72.6 51.2 38.8 35.2 38.1
2 children 55.4 80.6 61.4 46.3 47.9 48.2 3 children 61.9 88.5 74.8 60.9 55.2 67.1
4+ children 76.6 89.1 84.1 64.5 66.4 72.0 6. By household head’s activity
Farmer 50.4 74.3 53.9 35.7 41.8 47.8 Hired in agriculture 55.1 80.7 66.4 53.2 47.0 51.2
Hired in non-agriculture 43.5 65.6 40.5 31.7 28.3 31.5 Self-employed 35.7 51.7 32.1 21.2 22.5 16.4
Pensioner 47.3 72.8 47.4 32.4 33.0 33.0 Other 41.4 67.9 25.8 34.1 20.4 28.7
Unemployed 62.5 74.0 64.3 54.3 24.1 31.7 7. By household head’s employment status
Employed 48.0 71.5 49.3 36.2 35.2 39.2 Inactive 49.0 72.5 46.1 32.2 32.0 32.7
Unemployed, looking for work 59.0 75.2 63.8 56.4 24.1 31.7 Notes: 2005 Q1-Q3 figures are seasonally adjusted. Source: World Bank and Household Budget Survey.

23
Annex Table 2: Decomposition of the Large City Poverty Rate by Alternative Systems of Classification -1997-2004 & 2005 Q1-Q3
1997 1999 2002 2003 2004 2005 Q1-Q3 Large Cities 31.5 50.4 28.9 22.9 17.6 14.7 1. By age of household head
<30 years 31.4 37.7 21.2 15.7 8.1 14.5 30-39 years 29.2 55.3 22.0 17.9 17.7 17.5 40-49 years 28.9 46.5 30.3 26.2 20.2 23.0 50-59 years 32.9 46.6 34.1 21.9 17.9 13.5 60-69 years 36.6 61.1 34.4 26.6 16.0 10.9 >=70 years 46.1 63.8 36.9 37.6 29.2 17.2
2. By education of hh head Higher education 20.3 36.5 17.1 15.8 9.6 11.6
Vocational 35.9 54.0 32.2 23.5 20.0 22.3 Secondary regular 36.1 53.9 34.4 25.0 20.8 13.4
Primary 43.2 77.5 42.2 38.8 28.9 45.8 Illiterate 53.5 80.8 60.6 59.6 36.0 15.3
3. By sex of head of hh male 28.9 49.8 25.9 22.1 16.7 10.9
female 35.3 51.4 32.6 23.9 18.6 18.7 4. By # of children in hh
No children 28.2 44.1 23.7 19.2 15.0 11.5 1 child 31.0 49.8 29.3 26.5 17.4 15.6
2 children 38.0 59.1 39.2 27.3 24.6 24.2 3 children 38.3 86.5 100.0 15.0 43.4 19.8
4+ children 0.0 30.6 100.0 42.7 100.0 97.3 5. By household head’s activity
Farmer 40.7 0.0 0.0 .. .. .. Hired in agriculture 54.9 100.0 49.2 0.0 0.0 ..
Hired in non-agriculture 27.5 46.5 25.9 19.6 16.1 .. Self-employed 14.0 22.5 28.8 19.0 12.4 0.0
Pensioner 46.9 69.5 43.1 35.1 27.0 15.6 Other 29.9 60.9 17.1 25.1 9.1 13.0
Unemployed 58.3 54.4 30.6 40.8 9.6 42.0 6. By hh head’s emp. status
Employed 26.9 45.6 26.1 19.5 16.0 16.8 Inactive 45.0 65.8 37.9 33.1 22.3 14.7
Unemployed, looking for work 53.0 60.2 30.6 40.8 9.6 42.0 Notes: hh = household; Figures for 2005 Q1-Q3 are not seasonally adjusted. Sources: World Bank and Moldova Houshold Budget Survey.
24
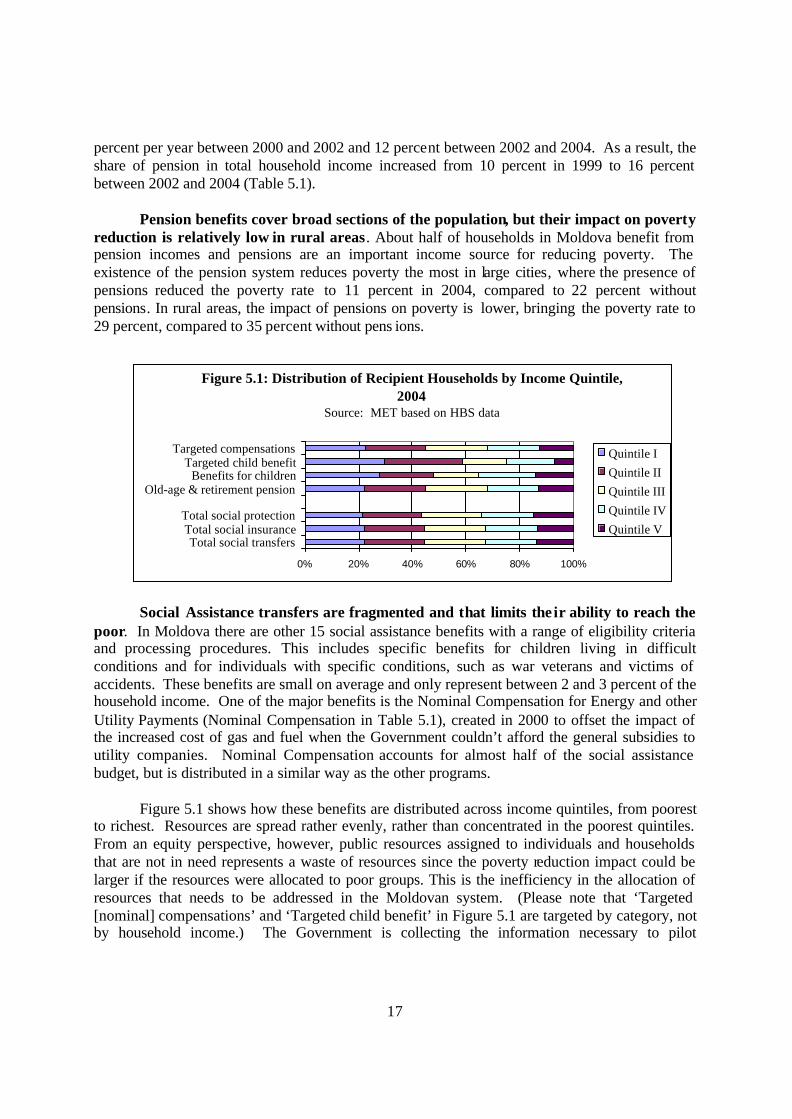
Annex Table 3: Decomposition of the Small Town Poverty Rate by Alternative Systems of Classification -1997-2004 & 2005 Q1-Q3
1997 1999 2002 2003 2004 2005 Q1-Q3 Small towns 61.0 80.6 62.8 49.6 45.9 48.5 1. By age of household head
<30 years 64.1 82.9 54.4 44.7 45.3 61.2 30-39 years 67.8 85.4 62.8 54.3 44.5 50.8
40-49 years 64.1 80.8 64.1 50.2 48.7 52.1 50-59 years 48.8 72.7 58.0 44.4 45.0 49.6 60-69 years 58.7 71.0 70.0 48.4 44.0 38.0 >=70 years 54.2 87.6 66.8 54.8 44.3 49.3
2. By education of hh head
Higher education 49.0 66.8 39.2 27.3 23.5 30.3 Vocational 60.5 83.1 54.5 45.7 37.5 59.0
Secondary regular 68.6 84.0 72.1 56.4 52.6 62.5 Primary 62.0 83.7 66.9 55.8 46.7 60.8
Illiterate 56.0 77.4 77.7 56.9 63.2 59.8 3. By sex of head of hh
male 57.7 80.4 64.4 53.9 43.6 47.6 female 68.9 81.1 59.8 43.5 49.3 49.9
4. By # of children in hh
No children 50.1 73.1 54.9 42.5 37.5 40.9 1 child 65.0 81.0 64.3 50.7 52.7 54.6
2 children 70.7 87.6 71.4 61.8 56.8 62.4 3 children 65.6 94.5 87.9 82.5 87.2 82.1
4+ children 100.0 100.0 100.0 100.0 100.0 93.1 5. By household head’s activity
Farmer 64.8 90.5 67.6 51.3 42.7 52.9
Hired in agriculture 82.3 79.2 61.6 60.3 36.9 74.7
Hired in non-agriculture 60.9 81.0 61.3 49.6 47.6 55.0
Self-employed 56.9 65.3 44.2 33.6 39.5 29.1
Pensioner 55.9 78.8 67.4 49.6 44.7 42.5
Other 76.0 96.7 61.7 58.9 54.0 32.0
Unemployed 69.6 90.6 84.2 64.2 33.7 24.3
6. By hh head’s emp. status
Employed 62.0 80.0 60.9 49.3 46.2 53.3 Inactive 58.7 81.5 66.4 49.6 45.8 41.7
Unemp., looking for work 62.3 91.9 84.3 68.6 33.7 24.3
Notes: hh = household; Figures for 2005 Q1-Q3 are not seasonally adjusted. Sources: World Bank and Moldova Houshold Budget Survey.

25
Annex Table 4: Decomposition of the Rural Poverty Rate by Alternative Systems of Classification -1997-2004 & 2005 Q1-Q3 (in percentage points)
1997 1999 2002 2003 2004 2005 Q1-Q3 Rural 50.6 76.7 51.5 35.7 37.1 42.5
1. By age of household head <30 years 52.3 88.2 65.3 46.5 43.7 35.4
30-39 years 52.2 82.3 63.3 40.9 41.5 38.0 40-49 years 52.9 75.6 52.8 38.6 38.0 42.0 50-59 years 52.7 71.9 42.7 35.6 36.9 39.0 60-69 years 41.7 69.6 42.3 29.3 31.5 28.7 >=70 years 48.5 72.7 47.2 24.5 32.7 32.8
2. By education of household head Higher education 38.1 61.9 28.8 15.7 22.8 19.9
Vocational 54.4 74.6 48.0 26.3 23.9 39.8 Secondary regular 51.9 79.3 54.0 39.8 37.4 49.9
Primary 52.2 78.7 54.4 39.7 44.9 43.6 Illiterate 46.3 74.7 49.6 30.0 34.5 34.9
3. By sex of head of head of household male 51.4 77.5 52.4 35.6 39.1 39.5
female 47.8 73.6 49.2 36.0 32.0 33.3 4. By # of children in household
No children 35.3 64.5 36.1 20.8 24.8 28.9 1 child 50.5 79.4 55.9 41.1 38.6 38.1
2 children 56.0 84.3 64.5 47.0 50.9 48.2 3 children 63.5 88.1 72.8 62.2 53.9 67.1
4+ children 76.8 90.2 79.0 68.1 65.2 72.0 5. By household head’s activity
Farmer 49.9 73.5 53.7 35.3 41.8 47.8 Hired in agriculture 54.3 80.8 66.6 53.0 47.4 51.2
Hired in non-agriculture 51.5 77.0 41.5 32.3 29.4 31.5 Self-employed 31.9 65.7 26.4 14.2 11.7 16.4
Pensioner 45.4 72.5 44.8 28.8 31.9 33.0
Other 32.7 71.0 25.4 30.4 18.8 28.7 Unemployed 55.3 88.2 34.7 .. .. 31.7
6. By hh head’s employment status Employed 51.9 78.4 54.7 38.7 39.3 39.2
Inactive 47.7 72.7 44.4 28.6 31.8 32.7 Unemp., looking for work 65.9 81.3 34.7 .. .. 31.7
Notes: hh = household; Figures for 2005 Q1-Q3 are not seasonally adjusted. Sources: World Bank and Moldova Houshold Budget Survey.


![Universitatea Tehnica de Constructii Bucuresti · 2020. 7. 30. · DIASPORA Rom,/ Rep Moldova Albania Rep Moldova Rep. Moldova Rep. Moldova Rep Moldova DIASPORA Rom] lordania Rep](https://img.dokumen.tips/doc/110x75/60ac185ef0835e610377952c/universitatea-tehnica-de-constructii-bucuresti-2020-7-30-diaspora-rom-rep.jpg)