Embed Size (px)
Citation preview

Moving Forward: A decade of tolling
TOLL DIVISION ANNUAL REPORT FY 2017 JULY 1, 2016 - JUNE 30, 2017

A Message from WSDOT
I am pleased to present Washington State Department of Transportation’s Toll Division Annual Report for fiscal year 2017 (July 1, 2016 - June 30, 2017). During this fiscal year (FY), the Toll Division achieved many milestones, including opening the first major toll-funded improvement to I-405 and a six-mile extension of the SR 167 HOT lanes.
We have three overarching business plan goals outlined below with our highlights for the past year.
High quality customer serviceDemand for Good To Go! accounts has grown significantly since the opening of the I-405 express toll lanes in FY 2016. The Good To Go! system now serves over 763,000 customers and processed over 50 million transactions during FY 2017. Due to the growth and demand for our programs, we have efforts on continuing to foster a customer-focused culture through continuous improvement.
In order to better serve our customers, we developed an updated, mobile-friendly website which allows customers to access their accounts and pay bills online more easily.
The Toll Division is also preparing for the next generation of our toll billing system. We have awarded a contract for a new toll back office system vendor and accepting proposals for a new customer service program vendor.
Outstanding program delivery and operationIn their two years of operation, the I-405 express toll lanes have generated $28.8 million for improvements on I-405. WSDOT invested $11.5 million of this revenue into a new peak-use shoulder lane in the northbound direction between SR 527 and I-5. In April 2017, the peak-use shoulder lane opened to the public and has already improved travel times and reduced toll rates during the afternoon peak period.
WSDOT also completed a six-mile southbound extension of the SR 167 HOT lanes which opened to the public in December 2016. SR 167 drivers can now travel from Renton to Pacific on the HOT lanes, which have been operating for nine years. The additional miles improve travel times in the corridor by allowing drivers to pass through the often-congested SR 18 interchange in the HOT lanes.
The Tacoma Narrows Bridge marked its 10th year in operation in FY 2017. More than 147 million trips have been taken on the bridge since it opened to the public in June 2007. On average, 44,000 paid trips are taken on the bridge every weekday and the facility is on track to meet its bond repayment commitments by 2032.

WSDOT Toll Division Annual Report Fiscal Year 2017
iii
December 2017
Proactive, transparent communicationThroughout Toll Division offices you’ll see signs that read, “Our goal is to treat every call, every complaint, like it’s coming from a friend or family member.” The phrase demonstrates our approach to each customer interaction. Customer service is one our business goals, and we work continuously to improve our service to all of the travelers who depend on toll facilities for more reliable trips for home, work, and play.
The Toll Division is tasked with regularly communicating with hundreds of thousands of customers on a variety of subjects. In order to better serve the increasing Good To Go! customer base, this year we focused on educating customers on how to prevent billing issues and how to properly use toll facilities. The Toll Division utilized a number of strategies to better communicate with Good To Go! customers, including consistent social media engagement to educate and assist. In July 2016, WSDOT began notifying Good To Go! customers by email and/or phone if they would be receiving a civil penalty in the next 10 days for unpaid toll bills. We’ve discovered that this proactive outreach helped many customers avoid a civil penalty.
We also updated the WSDOT tolling website to make information easier to find for customers.
At the WSDOT Toll Division, we work daily to improve the service we provide to our customers and communities. Thank you for reading this report!
Sincerely,
Ed Barry Director, WSDOT Toll Division

iv
Washington State Department of Transportation
17-05-0195
405
5
5
5
5
405
90
520
522
202
599
518
509
509
516
167
410
512
99
99
16
18
2
SeattleBellevue
Issaquah
Kent
Lynnwood
Everett
Tacoma
Puget Sound
LakeWashington
© 2010 by Tele Atlas B.V. All rights reserved.
SR 520 Bridgeopened 2011
I-405 Express Toll LanesBellevue to Lynnwoodopened 2015
I-405 Express Toll LanesRenton to Bellevue
SR 99 Tunnel
Puget Sound Gateway Project
Puget Sound Gateway Project
SR 167HOT Lanesextensionopened 2016
SR 167 HOT Lanes opened 2008
Tacoma Narrows Bridgeopened 2007
Full Tolling
Intended Toll Projects (Express Toll Lanes)
Intended Toll Projects (Full Tolling)
Express Toll Lanes
LEGEND

1
WSDOT Toll Division Annual Report Fiscal Year 2017
50.1 milliontoll transactions
540,000 Calls
$191.9 milliontolling revenue
$82 million Tacoma Narrows Bridge
$83.8 million SR 520 Bridge
$23.3 million I-405 express toll lanes
$2.8 million SR 167 HOT Lanes
1.3 million different vehicles
763,000
12 minutes average time saved using I-405 express toll lanes
11minutes
southbound
$4.1 million collected in FY 2017 from unpaid tolls through customer relief program
23.9 million SR 520 Bridge
15 million Tacoma Narrows Bridge
9.6 million I-405 express toll lanes
1.5million SR 167 HOT Lanes
have used the I-405 express toll lanes
14 minutes
northbound
Good To Go! accounts 90,000 NEW
in FY 2017
to Good To Go! Customer Service Centers last year
2 million Twitter impressions & 10 blogs in FY 2017
Highlights from fiscal year 2017
Tolling in Washington state For the last decade, Washington state has used tolling as a strategic tool to help manage congestion, enhance mobility, fund public improvement projects, and generate revenue required for ongoing operation and maintenance costs of existing facilities. Toll facilities are authorized by the Washington State Legislature, and the Transportation Commission establishes the toll rates and related fees. The facilities noted in this report are either already authorized for tolling or are in various stages of planning:
Fiscal Year (FY) 2017 current toll facilities:• State Route (SR) 16 Tacoma Narrows Bridge
• SR 167 HOT Lanes
• SR 520 Bridge
• I-405 express toll lanes from Bellevue to Lynnwood
Future facilities:• SR 99 tunnel intended toll project, (under construction)
• I-405 express toll lanes expansion from Renton to Bellevue (intended toll project, in design phase)
• Gateway Project completion of SR 167 and SR 509 (intended toll project, in design phase)

2
Washington State Department of Transportation
The cost to tollIn FY 2017, the average toll collected was $3.56. A fraction of the toll collected per transaction goes toward toll collection. As the table demonstrates, the largest factor in this average is payment method. A small portion of this cost goes to the following vendors: Kapsch USA (McLean, VA), Electronic Transaction Consultants (Richardson, TX), and TransCore (Nashville, TN). The vendors employ approximately 160 employees in the Puget Sound region and their compensation is independent of traffic or toll rate levels. All revenue above the cost to collect the toll is reinvested into overall roadway operations, maintenance, and project construction as appropriate.
While both toll revenue and overall traffic increased in FY 2017, the cost per transaction increased as well. The biggest reason for this increase was due to the first full year of operations for I-405 express toll lanes in FY 2017 – compared to the partial year of operations paid in FY 2016. The I-405 capital program funded the ramp-up and initial months of customer service operations in FY 2016. In addition, the toll equipment vendor did not begin receiving operational payments for I-405 until after they completed final system acceptance. Costs also increased for credit card processing fees and salaries and benefits as a result of filling of vacant state positions, combined with the increase need for Pay By Mail activities resulted in higher per transaction costs in FY 2017.
Payment Method All facilities
Good To Go! Pass $0.53
Pay By Plate $0.60
Short Term Account $0.59
Pay By Mail $1.22
Toll booth Cash $1.06
Source: WSDOT Toll Division
Cost to collect toll per transaction

3
WSDOT Toll Division Annual Report Fiscal Year 2017
The Toll Division’s Business Goals
High quality Good To Go! Customer Service Good To Go! is Washington’s electronic tolling system serving over 763,000 customers accounts and processing over 50 million toll transactions a year. Throughout FY 2017, the Good To Go! customer base has continued to grow, driven in large part by new customers opening accounts to use the I-405 express toll lanes.
Good To Go! offers different options for our customers to get assistance, including three walk-in centers, customer hotline, website, and Twitter and Facebook. Incoming email and walk-in numbers have decreased since FY 2016, likely due to more widespread understanding of how to correctly use toll facilities in the region. WSDOT continues to strive to provide excellent service to its customers, whether it is on the phone, via email, or in person. Offering a variety of toll payment methods allows customers to choose the way they travel and pay their tolls. Most customers use a pre-paid Good To Go! account which can save customers time and money. For further savings, many customers choose to use a Good To Go! pass to avoid the $0.25 processing fee used for Pay By Plate.
Toll transactions have increased over a decade of tolling (July 2007-June 2017)
❝Our goal is to treat every call, every complaint, like it’s coming from a friend or family member.❞
2017201620152014201320122011201020092008
14.5M 14.3M 14.8M 14.7M
24.5M
35.1M 36.1M 37.6M
46.7M 50.1M
TNB opens July 2007SR 167 HOT lanes open May 2008
SR 520 Bridge begins tolling Dec. 2011
I-405 express toll lanes opens Sept. 2015
Fiscal Years

4
Washington State Department of Transportation
Source: WSDOT Toll Operations
Finally got my Good To Go! pass - Here’s to a cheaper toll and quicker commute.
– Kelsey R., customer
Just had the best experience picking up a flex pass...Super friendly informative FUN staff!
– Ali S., customer
Majority of tolls are paid through accounts WSDOT collected 79 percent of FY 2017 toll transactions through Good To Go! passes or Pay By Plate accounts. At 98 percent, WSDOT’s total collection rate is among the nation’s best. This is due in part to the success of the customer relief program.
In order to ensure that those who use the facility pay for that use, WSDOT designed a toll enforcement program. After 80 days, customers with an unpaid toll receive a $40 notice of civil penalty for each unpaid toll transaction. If the customer does not pay this fee or request a hearing by the due date, a hold is placed on the vehicle registration. Of all tolls, 2.4 percent result in a civil penalty, which is one of the lowest rates in the nation.
On July 1, 2016, WSDOT began notifying Good To Go! customers by email and/or phone if they would be receiving a civil penalty within the next 10 days and asking them to contact Good To Go! customer service. WSDOT notified more than 24,700 customers of impending civil penalty assessment. Of these, 48 percent responded and paid $960,000 in tolls and fees.
New Accounts Active Passes
Total New in FY17 Total New in FY17
Total Good To Go! Accounts
763,000 90,000 Total Passes 1.35 million 114,000
Registered Passes 680,000 78,000 Stickers 868,000 41,500
Pay By Plate 70,000 11,000 Flex Pass 290,000 70,000
Other 13,000 1,000 Motorcycles 17,000 2,500
Good To Go! Pass57%Good To Go!
Pay By Plate11%
Toll Booths24%
Pay By Mail8%
Good To Go! Pass 63%
Good To Go!Pay By Plate
22%
Pay By Mail15%
Good To Go! Pass 66%
Good To Go!Pay By Plate
17%
Pay By Mail17%
Tacoma Narrow Bridge SR 520 Bridge I-405 Express Toll Lanes
Toll transactions by payment method (FY 2017)

WSDOT Toll Division Annual Report Fiscal Year 2017
5
Customer relief program continues to be a successIn July 2015, WSDOT introduced a new Customer Program for Resolution making it easier to resolve a toll bill and offering first-time forgiveness of late fees and penalties. As long as a customer agrees to pay the toll they owe, WSDOT will dismiss civil penalties and late fees. The goal is to educate drivers so they learn how to avoid incurring penalties in the future.
Since July 2015, the customer relief program has waived $56 million in fees and penalities. Over 155,000 customers have had penalties forgiven. WSDOT has doubled the collection rate of unpaid tolls, totaling $6.7 million.
WSDOT is now resolving more Department of Licensing vehicle registration holds than the Toll Division are submitting.
Good To Go! website updatesThe original Good To Go! website was launched in 2011. In spring 2017, WSDOT launched a new version of the Good To Go! website. The new website features an updated user interface design, a different overall look and a host of improvements to help customers better navigate the Good To Go! system. The new site makes it easier for customers to make changes to their account or pay a negative balance.
Unlike the old website, the new Good To Go! website is mobile-friendly so customers can access their accounts and pay tolls from their smartphones. Making the website mobile-friendly is essential for providing quality customer service, as a growing number of people primarily access the internet through their phone.
New website looks great! Much cleaner aesthetic
– Taylor O., customer
6
Washington State Department of Transportation
Outstanding Program Delivery and Operation
Good To Go! Back Office System vendor update WSDOT released a request for proposals (RFP) for a vendor to design and implement a new back office toll system for its statewide Good To Go! program in December 2016.
How will the new system help customers?• Paying for tolls will be easier by allowing customers to manage their Good To Go! account and
any Pay By Mail toll bills within a single account. Currently, Pay By Mail and pre-paid Good To Go! transactions are tracked on separate systems, creating confusion for customers.
• Customers will be able to perform more self-service tasks on our website, which will have new features such as a live-chat option.
• Good To Go! will become an alternate payment method for ferry trips, and potentially for future parking and transit systems, and will be compatible with toll agencies in other states.
• Modern technology will allow WSDOT the ability to make customer-driven changes to the system when necessary.
Final proposals were due in April 2017. WSDOT will award a toll back office system contract in FY 2018 and issue a separate request for proposals to operate its statewide Good To Go! customer service program. This contract will include staffing for the call center and walk-in centers, pass fulfillment, image review, adjudication support and mail processing.
Josh in CustSupport was super helpful! He called back when we got disconnected, and made sure I was all the way through. Thanks!
– Jacob L., customer
We will pass this on! Thanks for the shout out.
– WSDOT
3
Source: WSDOT Toll Operations
Customer Service Centers 114,000 visits
Bellevue: 48,000
Gig Harbor: 51,000
University District: 15,000
The Good To Go! customer service center provides a direct connection between WSDOT and its customers.
Proactive, transparent communicationIn FY 2017, the Toll Division received over 2 million Twitter impressions, had over 216 news clips covering tolling, and reached 763,000 customers through our Good To Go! listserv. Due to modifications to various tolling facilities, such as rate changes on SR 520 and the southbound extension on SR 167, the Toll Division continues to focus on customer education. The Toll Division published 10 blogs and corresponded with hundreds of customers. The Toll Division participated in community outreach events and hearings. Additionally, the Toll Division answered many media inquiries and facilitated interviews with print, radio and video journalists.
WSDOT Toll Division Annual Report Fiscal Year 2017
7
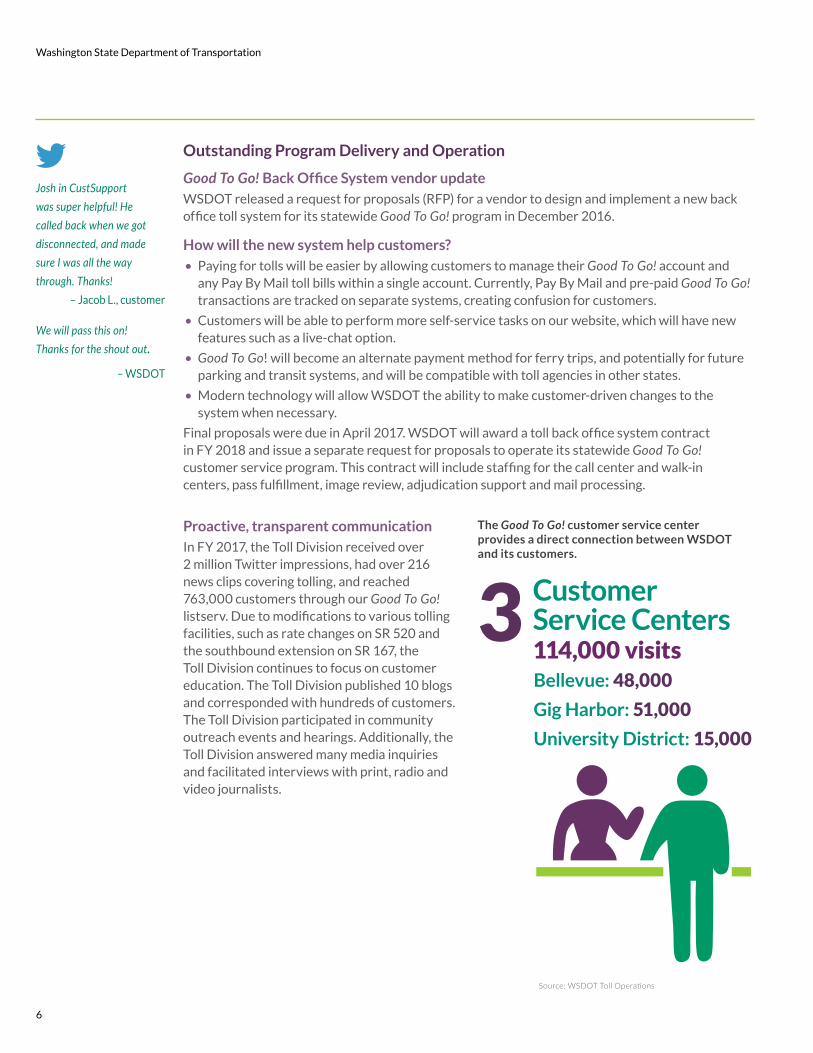
Source: 2017 ETCC Customer Survey
WSDOT utilizes input from customer surveys and other forms of feedback to guide updates to the Good To Go! website and automated phone system. Good To Go! will continue to improve the toll collection system and the corresponding customer service experience.
Customer surveys from fiscal year 2017Was your issue resolved in one call?
YES NO
18%82%
YES NO
13%87%
YES NO
7%93%
YES NO
10%90%
Representatives provided respectful service in a friendly manner?
Representatives spent a sufficient amount of time helping me resolve my issue?
Representatives were knowledgable and able to answer my questions?

8
Washington State Department of Transportation
Every Good To Go! representative I’ve talked to has been absolutely wonderful and helpful. Keep it up!
– Andrew S., customer
Thanks for the quick turnaround.
– Nick G., customer
Embracing continuous improvementWSDOT is continually working to improve the way we do business in order to add value for our customers. We made several improvements to our to customer service in FY 2017:
Vehicle registration holds: If a customer receives a civil penalty and does not pay or dispute it within 20 days, the Department of Licensing (DOL) places a hold on their vehicle registration. Customers cannot renew their vehicle registration until the civil penalties are resolved. For customers with 11 or more civil penalties, the approval process took 21-24 days to release vehicle registration holds. DOL can only process these in batches, and WSDOT was only sending batches once a week. WSDOT worked with DOL, our vendor, and our financial services to agree to send batches twice a week. This has reduced registration hold processing times by 10 days, to 10-14 days so customers can renew their vehicle registrations with less wait time.
Pass inventory: WSDOT and vendor staff developed a robust tracking tool to forecast demand, worked with the vendor to coordinate partial shipments of orders, switched to testing a statistically significant sample instead of all passes, and streamlined the method of loading the passes into inventory. Since these changes, standard orders have been fulfilled within 24 hours.
Automation of toll bill report: WSDOT’s toll bill report helps identify potential issues with processing a customer's trips on tolled facilities. Previously, a WSDOT data analyst would spend up to 40 hours per month completing the data analysis portion of the toll bill report. We automated this process, creating an application to perform the data analysis overnight instead of during work hours. This reduced the number of WSDOT data analyst hours to 8-12 per month as well as human error.

WSDOT Toll Division Annual Report Fiscal Year 2017
9

Washington State Department of Transportation
10
Tolled Bridges
Generating revenue to fund facility constructionThere are currently two types of tolled facilities in Washington state: tolled bridges and managed lanes.
For the SR 520 Bridge, tolling generates revenue to help finance the replacement bridge and manage congestion on SR 520. Tolling is projected to generate $1.2 billion towards the funded portion of the SR 520 Bridge Replacement and HOV Program.
The summer of 2017 marked 10 years since the eastbound span of the Tacoma Narrows Bridge opened to traffic. The primary goal of tolling the Tacoma Narrows Bridge is to repay the debt for constructing the bridge which opened in 2007. Project investors purchased bonds backed by tolls which are paid from future revenue. Toll revenues are also used for operations, maintenance, repair, and rehabilitation.
The Toll Division interviewed two people who have worked at the Tacoma Narrows bridge since it opened to see what they think about last 10 years.
Paul WestPaul West has been a toll collector for Good To Go! since the new eastbound Tacoma Narrows Bridge opened in July 2007. West has lived in Gig Harbor for 16 years with his wife where they raised their two daughters.
West works the morning shift starting at 4:15 a.m. ‘I love working early, I’m a morning person it’s my favorite shift that
I’ve worked,’ said West. It’s a tough job, but West is up for the challenge. “I’m the only toll collector at that time which means everyone goes through my lane. Everyone is headed to work and there’s a steady stream of cars. You need to be fast but you also need to have a smile on your face.”
According to West, his job is more than just collecting tolls, a big part is talking with people. “People like to interact with you. They may not always like paying a toll, but I try to make it as pleasant of an experience as possible.” West’s proudest achievement is the relationship he’s forged with some customers. “Even though it’s a short amount of time you may see someone each day, with regular customers you begin to develop a friendship with them.”
Before the eastbound span opened in 2007, West commuted to Tacoma to work at the saw mill in Commencement Bay. “Traffic was a nightmare. It was a struggle to get home every day and it used to take up to two hours.” The new bridge has alleviated that traffic and stress.
When he’s not working, West likes to go hiking and is an avid runner. You may even see him running along one of his favorite routes – the Tacoma Narrows Bridge.
WSDOT Toll Division Annual Report Fiscal Year 2017
11
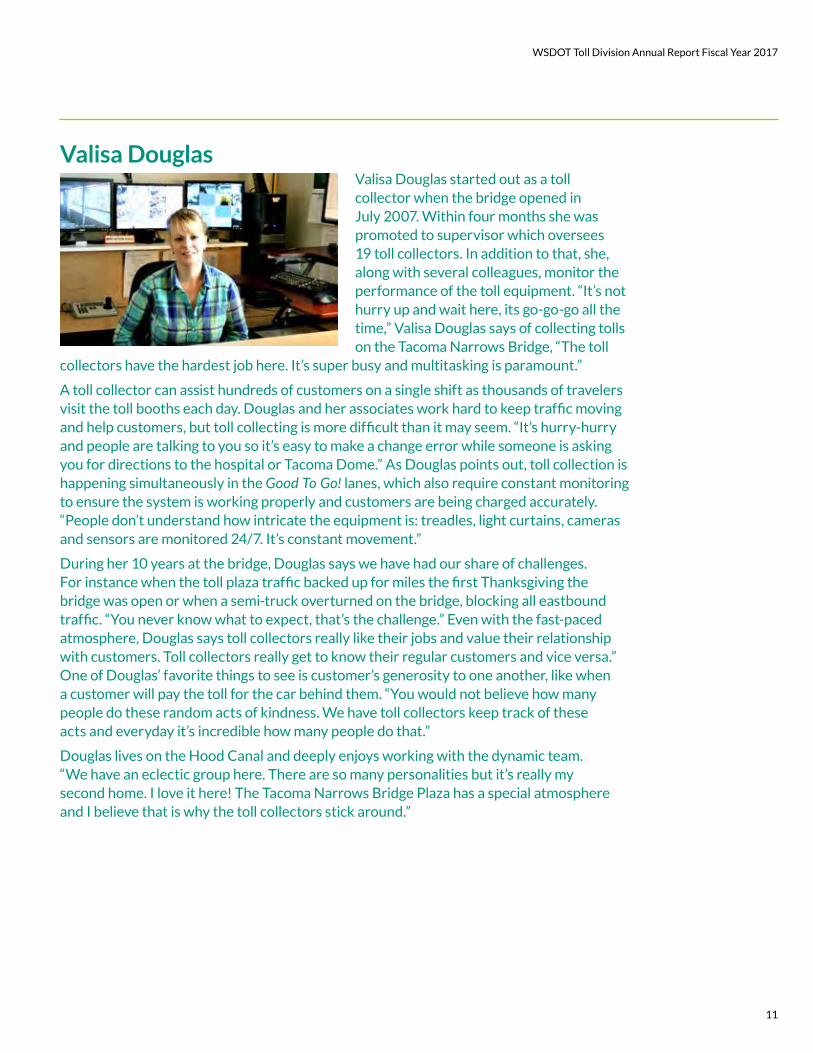
Valisa DouglasValisa Douglas started out as a toll collector when the bridge opened in July 2007. Within four months she was promoted to supervisor which oversees 19 toll collectors. In addition to that, she, along with several colleagues, monitor the performance of the toll equipment. “It’s not hurry up and wait here, its go-go-go all the time,” Valisa Douglas says of collecting tolls on the Tacoma Narrows Bridge, “The toll
collectors have the hardest job here. It’s super busy and multitasking is paramount.”
A toll collector can assist hundreds of customers on a single shift as thousands of travelers visit the toll booths each day. Douglas and her associates work hard to keep traffic moving and help customers, but toll collecting is more difficult than it may seem. “It’s hurry-hurry and people are talking to you so it’s easy to make a change error while someone is asking you for directions to the hospital or Tacoma Dome.” As Douglas points out, toll collection is happening simultaneously in the Good To Go! lanes, which also require constant monitoring to ensure the system is working properly and customers are being charged accurately. “People don’t understand how intricate the equipment is: treadles, light curtains, cameras and sensors are monitored 24/7. It’s constant movement.”
During her 10 years at the bridge, Douglas says we have had our share of challenges. For instance when the toll plaza traffic backed up for miles the first Thanksgiving the bridge was open or when a semi-truck overturned on the bridge, blocking all eastbound traffic. “You never know what to expect, that’s the challenge.” Even with the fast-paced atmosphere, Douglas says toll collectors really like their jobs and value their relationship with customers. Toll collectors really get to know their regular customers and vice versa.” One of Douglas’ favorite things to see is customer’s generosity to one another, like when a customer will pay the toll for the car behind them. “You would not believe how many people do these random acts of kindness. We have toll collectors keep track of these acts and everyday it’s incredible how many people do that.”
Douglas lives on the Hood Canal and deeply enjoys working with the dynamic team. “We have an eclectic group here. There are so many personalities but it’s really my second home. I love it here! The Tacoma Narrows Bridge Plaza has a special atmosphere and I believe that is why the toll collectors stick around.”

Washington State Department of Transportation
12
SR 16 Tacoma Narrows Bridge
1 November 2016 Forecasted Revenue and December 2016 Projected Expenses
2 Expenses exclude Preservation, Civil Penalty, and Transponder costs3 Includes tolling revenue and rebilling feesSource: WSDOT Toll Finance
Toll Revenue3Expenses2
Actual Projected1
$79,454,937 $79,836,000
$11,953,000$12,116,790
Outstanding program delivery The Tacoma Narrows Bridge has served the south Puget Sound region for 10 years. Traffic on the Tacoma Narrows Bridge increased to approximately 15 million transactions in FY 2017 from 14.8 million transactions in FY 2016. On average 44,000 vehicles crossed the bridge each weekday, with approximately 68 percent of transactions being paid using a Good To Go! account. WSDOT generated approximately $79.5 million in gross toll revenue and $408,000 in reprocessing fees. Revenue met the projected totals, and expenses were slightly above forecast.
The primary goal of tolling the Tacoma Narrows Bridge is debt repayment for bridge construction and currently this facility is on track to meet the debt repayment goal in the early 2030s.
Total Transactions: 15 million
Average weekday transactions: 44,000
Tacoma Narrows Bridge expenses are less than projected (FY 2017)
2017 toll rate increase repealed after annual review of traffic and revenueThe scheduled increases in debt service payments for the Tacoma Narrows Bridge require the Washington State Transportation Commission to regularly review traffic volumes and revenue collections. These reviews ensure tolls generate adequate revenue to make debt service payments, and to maintain and operate the facility. Debt service payments increased by 16 percent in FY 2016 and 15 percent in FY 2017. The Commission, in consultation with the Tacoma Narrows Bridge Citizen Advisory Committee, deemed a rate increase in FY 2017 unnecessary to meet debt payment obligations. A $2.5 million appropriation from the Legislature funded by gas tax, and higher than forecasted bridge traffic, allowed current toll levels to remain in place to meet debt obligations.

WSDOT Toll Division Annual Report Fiscal Year 2017
13
Tacoma Narrows Bridge toll rates for FY 2017
24
FY 14 FY 15 FY 16
6
24
7
24
10
6 7 8
64 62 58
24
FY 17
11
8
57
%
%
%
%
PAY BY PLATE
PAY BY MAIL
TOLL BOOTHS
GOOD TO GO! PASS
Growing numbers of customers are using photo tolling rather than the Good To Go! passPayment patterns seen on the Tacoma Narrows Bridge highlight a trend across all toll facilities. The percentage of Pay By Plate transactions and Pay By Mail have increased since FY 2016 despite the additional fees of 25 cents for Pay By Plate and $2 for Pay By Mail. On the other hand, payments through the Good To Go! pass have decreased.
10 years of operationsThe number of trips taken annually on the Tacoma Narrows Bridge have changed over its ten years of operations. When the Tacoma Narrows Bridge was opened, regional growth had plateaued due to the Great Recession so the ramp up of annual transactions was initially lower than expected. Since 2013, transactions of the bridge have increased every year. In FY 2017, the number of annual transactions exceeded 15 million.
CASHCREDIT
TOLL BRIDGE16
Good To Go!
2 AXLES
ADDED TOLL PER AXLE
PAY BYMAIL
$5.00 $6.00 $7.00
TNB transaction type by percentage
12,000,000
13,000,000
14,000,000
15,000,000
16,000,000
FY 2017FY 2016FY 2015FY 2014FY 2013FY 2012FY 2011FY 2010FY 2009FY 2008
total transactions
Source: WSDOT Toll Operations

14
Washington State Department of Transportation
Next Steps• Upgrading credit
card processing system to read chips.
Revenue availablefor debt payment:$67,346,883
Operations &Maintenance:$ 14,616,882
Tacoma Narrows Bridge Total Revenue = $81,963,766
Source: Tacoma Narrow Bridge Account WSDOT Financial Satements for FY 2018
82%18%
Improving tolling efficiency on Tacoma Narrows BridgeIn FY 2017, WSDOT installed shoulder cameras to the tolling plaza of the Tacoma Narrows Bridge to improve image capture and insure that all vehicles, regardless of location on the road, are tolled for their trip. Additionally, WSDOT upgraded the facility’s credit card processing system to maintain compliance with changing security standards.
Where your Tacoma Narrows Bridge toll dollar goesThe majority of every toll dollar goes to repaying the construction debt.
Source: Tacoma Narrows Bridge Account WSDOT Financial Statements for FY 2017

WSDOT Toll Division Annual Report Fiscal Year 2017
15
Washington State Department of Transportation
16
SR 520 Bridge
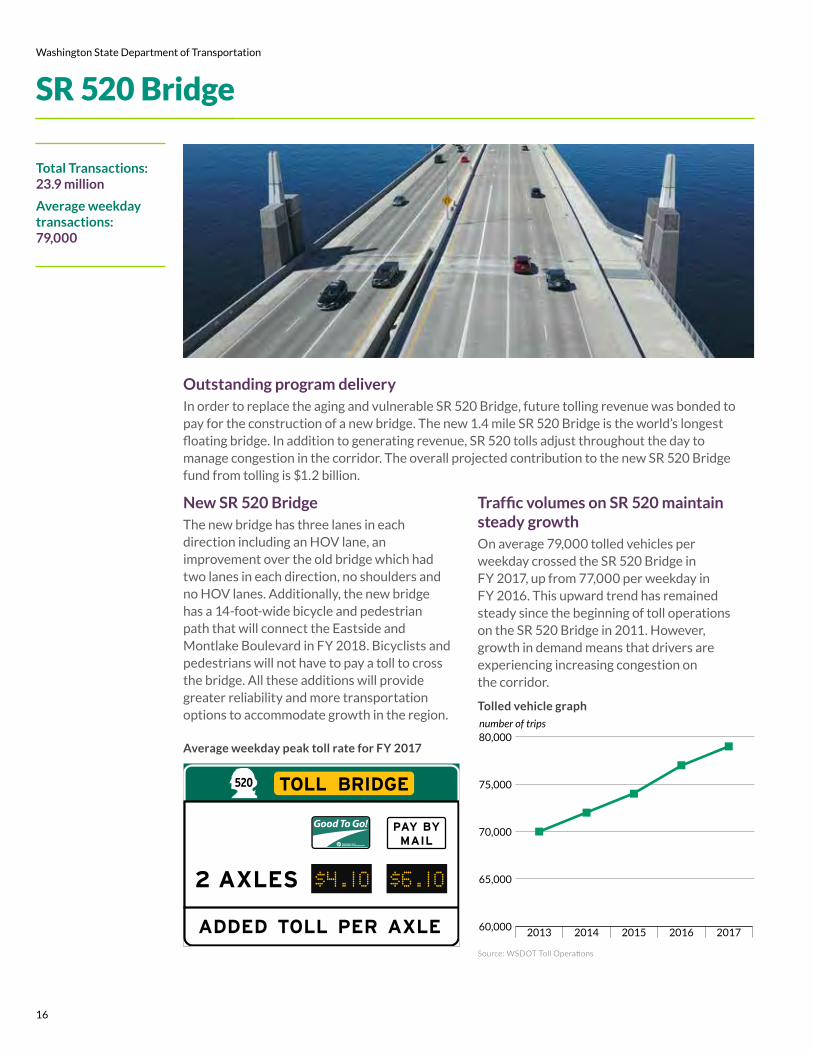
Outstanding program delivery In order to replace the aging and vulnerable SR 520 Bridge, future tolling revenue was bonded to pay for the construction of a new bridge. The new 1.4 mile SR 520 Bridge is the world’s longest floating bridge. In addition to generating revenue, SR 520 tolls adjust throughout the day to manage congestion in the corridor. The overall projected contribution to the new SR 520 Bridge fund from tolling is $1.2 billion.
Source: WSDOT Toll Operations
Total Transactions: 23.9 million
Average weekday transactions: 79,000
60,000
65,000
70,000
75,000
80,000
20172016201520142013
number of trips
PAY BYMAIL
TOLL BRIDGE520
Good To Go!
2 AXLES
ADDED TOLL PER AXLE
$4.10 $6.10
Average weekday peak toll rate for FY 2017
Traffic volumes on SR 520 maintain steady growthOn average 79,000 tolled vehicles per weekday crossed the SR 520 Bridge in FY 2017, up from 77,000 per weekday in FY 2016. This upward trend has remained steady since the beginning of toll operations on the SR 520 Bridge in 2011. However, growth in demand means that drivers are experiencing increasing congestion on the corridor.
New SR 520 Bridge The new bridge has three lanes in each direction including an HOV lane, an improvement over the old bridge which had two lanes in each direction, no shoulders and no HOV lanes. Additionally, the new bridge has a 14-foot-wide bicycle and pedestrian path that will connect the Eastside and Montlake Boulevard in FY 2018. Bicyclists and pedestrians will not have to pay a toll to cross the bridge. All these additions will provide greater reliability and more transportation options to accommodate growth in the region.
Tolled vehicle graph

WSDOT Toll Division Annual Report Fiscal Year 2017
17
Generated revenue aligns with planned $1.2 billion of funding towards the new SR 520 BridgeIn FY 2017 tolling on SR 520 generated $75 million in gross toll revenue and $1.1 million in reprocessing fees. The revenue and fees count toward the goal of $1.2 billion dollars in funding contribution to the new SR 520 Bridge construction.
Rate increase and nighttime tolls for SR 520In May 2016, the Washington State Transportation Commission (WSTC) adopted rates changes for the SR 520 Bridge that took effect July 1, 2016 and July 1, 2017. Each rate change increases all toll rates by approximately 5 percent. This rise in toll rates is needed for operations and maintenance costs and to make debt payments on the bonds that are financing the SR 520 program construction. The toll increases affect all rate levels. The WSTC also authorized nighttime tolling to take effect on July 1, 2017.
1 Consistent with the November 2016 Net Revenue forecast. The revenue forecast only includes tolling revenue. The expense forecast includes toll collection O&M costs, Roadway O&M costs, Credit Card Fees, and Bridge Insurance Premiums, less transponder inventory costs.
2 Consistent with the values reported in the WSDOT financial statements for the facility. The revenue only includes toll revenue. The expenses exclude transponder-related costs and toll collection and facility periodic repir and replacement costs.
Source: WSDOT Toll Finance
SR 520 Bridge transaction type by percentageSR 520 revenue: actual expenses lower than projected (FY 2017)
16
FY 14 FY 15 FY 16
16
68
16
19
65
16
21
63
%
%
%
GOOD TO GO! PASS
PAY BY PLATE
PAY BY MAIL
FY 17
22
15
63Toll RevenueExpenses
Actual2 Projected1
$75,468,550$74,979,046
$17,354,262 $18,683,506
Source: WSDOT Toll Operations

18
Washington State Department of Transportation
✔ Increased Transit and Vanpool Ridership
✔ Vanpool ridership has increased 22% since FY 2016, with 398 vans per day.
✔ Bus ridership remains strong for King County Metro and Metro-operated Sound Transit with over 23,000 riders a day.
Continued growth for vanpools and transit The number of vanpools on the SR 520 Bridge rose 22 percent from FY 2016, to 398 in FY 2017. Weekday transit ridership remained steady at 23,000 riders, similar to FY 2016.
For information on travel times on the SR 520 Bridge and corresponding cross-lake routes, please refer to the Gray Notebook, WSDOT’s quarterly performance and accountability report.
Toll collection point moved The permanent toll location collection, near Evergreen Point Road, began collecting tolls on February 4, 2017. Previously, to accommodate construction schedules, crews working on the SR 520 Floating Bridge moved the toll collection point on SR 520 to an interim location near the 84th Avenue Northeast overpass in 2016. This temporary move allowed crews to finalize construction activities around the new bridge while continuing to collect tolls.
Cozy Cove
Fairweather Bay
Eve
rgre
en P
oint
Rd
84th
Ave
NE
NE 24th St
NE 28th St
HUNTS POINT
MEDINA
CLYDE HILL
92nd
Ave
NE
Points
Dr NE520
temporary tolling location
permanent tolling location
NE 30th St
H
un
ts Point Circle

WSDOT Toll Division Annual Report Fiscal Year 2017
19
Next Steps• Analyze measures
for cost efficiency
• Bicycle and pedestrian path to open to the public
Where your SR 520 toll dollar goes The majority of every toll dollar spent on the SR 520 Bridge goes to paying directly for construction or repaying construction debt. In addition to toll revenue, the Bridge also generates revenue from other sources, such as transponder sales, reprocessing fees and interest.
Revenue availablefor debt payment:$61,740,604
Operations &Maintenance:$22,013,438
SR 520 Total Revenue = $83,754,042
Source: WSDOT Financial Statements for FY 2017
74%26%

20
Washington State Department of Transportation

21
WSDOT Toll Division Annual Report Fiscal Year 2017
Managed lanes
The I-405 express toll lanes and SR 167 HOT lanes use dynamic price tolling to provide faster, more predictable trips to transit, carpoolers and toll-paying vehicles. An algorithm responds to changing vehicle volumes in the managed lanes to maximize speed performance. Toll rates increase as congestion increases, and drop accordingly with reduced congestion to boost efficient traffic movement throughout the corridor.
Toll revenue that is generated by the facility is used to cover operations and maintenance costs. All additional revenue is used to fund improvements to the corridor in which they are collected.
WSDOT conducts annual customer surveys to determine public opinion of the SR 167 HOT lanes and I-405 express toll lanes. The majority of customers surveyed support extending the express toll lanes through Renton to connect to the SR 167 HOT lanes
Pending direction from the Legislature, WSDOT will build a 40-mile express toll lane corridor, which ultimately connect the existing SR 167 HOT lanes to the I-405 express toll lanes.
Do you support connecting SR 167 HOT lanes to the I-405 express toll lanes?
Lynnwood
Bothell
Kirkland
BellevueSeattle
TukwilaRenton
Kent
Auburn
Tacoma
Puyallup
Fife
2015Bellevueto LynnwoodExpressToll Lanes
Tolling NotAuthorized:Rentonto BellevueExpressToll Lanes
2008SR 167HOTLanes(existing)
SR 167 HOT Lanesnorthbound extension (not funded)
2016SR 167 HOT Lanessouthbound extension
1 ExpressToll Lane
167 DirectConnector
2 ExpressToll Lanes
2 ExpressToll Lanes
1 ExpressToll Lane
FUNDED
UNFUNDED
405
5
5
520
167
167
18
522
90
15%13%72%
Support Neutral Oppose
28%15%55%
Agree Neutral Disagree
Source: 2017 SR 167 HOT lanes Customer Survey
I support extending the express toll lanes to connect to the SR 167 HOT lanes in Renton. (All respondents traveled between Renton and Bellevue in the last month)
Source: 2017 I-405 Customer Survey

Washington State Department of Transportation
22
SR 167 HOT Lanes Pilot Project
Outstanding program deliveryThe SR 167 HOT lanes were opened in May 2008 to reduce congestion and travel times for all drivers on the SR 167 corridor. In December 2016, WSDOT opened an additional six miles of HOT lanes in the southbound direction. This extension has helped reduce traffic at the often congested SR 18 interchange.
Nine years after the project launched, the number of cars on the road in the region has increased. Despite this increase, during FY 2017, the HOT lanes provided faster, reliable trips for 5,300 paying customers each weekday. The lanes also provided more reliable trips each weekday for over 2,000 bus riders. Drivers choosing to use the HOT lanes saved an average of 7 minutes during peak commute times compared to the general purpose traffic, for an average toll of $3.
Total Transactions: 1.5 million
Average weekday transactions: 5,300
Good To Go!
$ 3.00
Northbound AM (5-9 a.m.)Southbound PM (3-7 p.m.)
2+
KING
PIERCE
5
5
405
99
16118
164
167
169
900
516
17-05-0196
Des Moines
Kent
Sea Tac
Federal Way
Pacific
Algona
Auburn
Normandy Park
Renton
Tukwila
S 212 St
84th Ave S
SW 41st St
S 277 St
15th St SW
15th St NW
SR 167 average peak period toll rates for FY 2017

WSDOT Toll Division Annual Report Fiscal Year 2017
23
HOT lanes use and revenue updateDuring the 2017 legislative session, the Washington State Legislature extended authorization of the SR 167 HOT lanes through FY 2018.
The HOT lanes generated $2,686,652 in FY 2017, a significant increase from $1,387,376 in FY 2016. This difference is largely due to the failure of a toll collection server in February 2016 that led to a lower revenue than projected. This issue led to a reported revenue $365,000 below the projected value, and approximately 80,000 fewer transactions less than forecasted. The aging toll collection system was replaced in May 2016. Since replacing the system with a more advanced toll collection system, WSDOT has not experienced significant tolling issues on SR 167.
SR 167 monthly tolled trips
Actual Projected1
Toll Revenue3Expenses2
$2,686,652
$2,000,000
$1,553,000
$984,659
0
20,000
40,000
60,000
80,000
100,000
120,000
140,000
160,000
JuneMay*Apr*Mar*FebJanDecNovOctSepAugJuly
transactions
FY 15 FY 16
*WSDOT does not have accurate data on trips taken between March and May 2016 due to the failure of the toll collection server in February 2016.
HOT lanes expenses are down (FY 2017)
1 November 2016 Forecasted Revenue and Budgeted Expenses2 Total expenses less Preservation and Transponder costs3 Only includes toll revenue Source: WSDOT Toll Finance
Source: WSDOT Toll Operations

24
Washington State Department of Transportation
HOT lanes benefit transit users Transit ridership remains steady on SR 167, with over 2,000 bus riders per weekday. The HOT lanes may benefit transit ridership, though given other factors such as bus frequency and gas prices, it is difficult to quantify the HOT lanes’ impact.
Safety remains a priority in the HOT lanes. Although there are multiple factors that impact safety on any given roadway, WSDOT is confident that there is no adverse impact to safety caused by the HOT lanes.
HOT lanes are saving people timeWSDOT uses a dynamically priced toll system to maintain speeds in the HOT lanes. The toll rates change during the day based on traffic demand in order to maintain higher speeds than the general purpose lanes during periods of congestion. These dynamically adjusted rates range from $0.50 to $9 to accommodate varying traffic demands.
Another goal of the HOT lanes is to keep the target speed of 45 mph at least 90 percent of the time during peak periods. HOT lane speeds in the northbound direction remained above 45 mph 74 percent of the time, and 84 percent of the time in the southbound direction during peak periods. The decrease of overall performance since FY 2016 is mainly due to the northbound chokepoint between 15th Street NW and S 277th Street and southbound toward the end of HOT lane. WSDOT will closely monitor these locations during FY 2018 and make necessary adjustments to traffic operations to ensure reliability of the HOT lanes.
SR 167 HOT lanes performance
Northbound
Southbound
33 MPH
35 MPH
49 MPH
52 MPHGeneral purpose lanes HOT lanes
7TRAVEL TIME SAVINGS
MINUTESsouthbound | northbound
during FY 2017
in HOT LANES
7
NOTE: In order to provide consistent reporting between SR 167 and I-405, SR 167 peak periods considered for FY 2017 are Monday thru Friday, 5am-9am (Northbound direction) and 3pm-7pm (Southbound direction)
10%
30%
50%
70%
90%
0%
20%
40%
60%
80%
100%
Jan-June2017
July-Dec2016
Jan-June2016
FY 2016 FY 2017
July-Dec2015
Percent of peak period when speeds are greater than 45 mph
WSDOT Toll Division Annual Report Fiscal Year 2017
25
Extending the southbound HOT lanesIn December 2016, WSDOT opened the six mile southbound extension of the SR 167 HOT lanes from 37th St in Auburn to Eighth Street East in Pacific. The extension will allow HOT lane drivers to travel through the congested SR 18 interchange.
The southbound SR 167 HOT lane was extended as part of the I-405/SR 167 Master Plan vision of completing a 40-mile system of HOT and express toll lanes to provide a reliable trip on the I-405/SR 167 corridor. The southbound extension is longer than the northbound HOT lane and provides a reliable trip for commuters, particularly in the afternoon rush hours.
The HOT lanes extension included safety modifications to the corridor, including a new guardrail, pavement striping, drainage improvements, noise walls, and upgraded lighting and signage. Additionally, WSDOT built new stormwater facilities and a floodplain storage site to collect and filter roadway runoff before it is released into area streams and wetlands, improving water quality for salmon and other wildlife. WSDOT also upgraded the Jovita Creek culvert in the project area to improve fish passage.
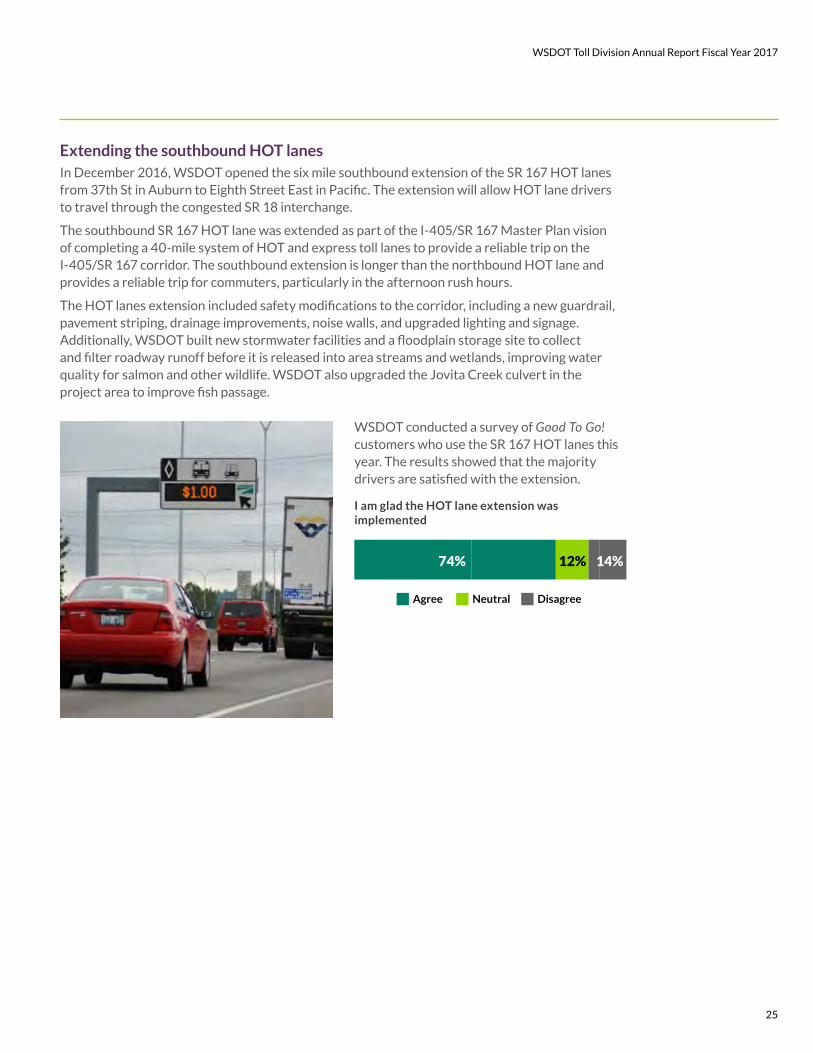
74% 12% 14%
Agree Neutral Disagree
WSDOT conducted a survey of Good To Go! customers who use the SR 167 HOT lanes this year. The results showed that the majority drivers are satisfied with the extension.
I am glad the HOT lane extension was implemented

26
Washington State Department of Transportation
Customer survey shows continued high satisfaction
WSDOT conducts an annual survey of the users of the SR 167 HOT lanes. The 2017 survey included responses from over 8,200 Good To Go! customers who had paid to use the HOT lanes within the past year. The survey showed that an overwhelming majority of drivers, 90 percent, like having the option to use the HOT lanes. Satisfaction with the lanes has remained steady over the last three years with the majority of customers reporting that the HOT lanes have provided a faster trip than general purpose lanes when they use them. Additionally, most customers reported that their trips in the HOT lanes were worth the toll they paid.
“Love them and would like to see all express lanes be open for Good To Go! customers with just one driver who is willing to pay.”
– Good To Go! customer survey response
“I could not conduct my business as far north of my location as I do without it!”
– Good To Go! customer survey response
Source: SR 167 HOT Lanes Pilot Project – 2017 Online User Survey
The money I spend for the HOT lanes is worth it
When the general purpose lanes are congested, HOT lanes always allow me to travel faster
10%90%
Yes No
Do you like having the option to use the HOT lanes?
54% 23% 23%
Agree Neutral Disagree
62% 22% 17%
Agree Neutral Disagree

WSDOT Toll Division Annual Report Fiscal Year 2017
27
Where your SR 167 toll dollar goesThe SR 167 HOT lanes are able to generate enough revenue to cover all operations and maintenance costs, as well as generate funds for future improvements to the corridor. In addition to toll revenue, the lanes also generate revenue from other sources, such as transponder sales, reprocessing fees and interest.
Revenue forreinvestment
in corridor:$1,768,181
Operations &Maintenance:$1,045,568
SR 167 Total Revenue = $2,813,748
Source: WSDOT Financial Satements for FY 2017
63%37%
Source: WSDOT Financial Statements FY 2017

28
Washington State Department of Transportation

29
WSDOT Toll Division Annual Report Fiscal Year 2017
I-405 Express Toll Lanes
Outstanding project deliveryThe I-405 express toll lanes, opened on September 27, 2015, provide an option for a faster, more predictable trip on one of the state’s more congested corridors. Toll rates adjust between $0.75 and $10 depending on traffic, and drivers pay the rate they see upon entering the lanes.
Total Transactions: 9.6 million
Average weekday transactions: 37,000
General purpose lanes Express toll lanes
Northbound
Southbound
30 MPH
30 MPH
52 MPH
49 MPH
11TRAVEL TIME SAVINGS
MINUTESsouthbound | northbound
for the period July 2016 - June 2017
in EXPRESS TOLL LANES
14
5%RIDERSHIP INCREASE
TIME SAVINGS
UP TO
A faster, more predictable tripDrivers have taken 24.9 million trips on the express toll lanes since it opened.
During their first 21 months of operation, the I-405 express toll lanes provided 52,000 faster, more reliable trips each weekday for 37,000 toll paying customers and 15,000 toll exempt carpools. The lanes also provided more reliable trips each weekday for over 8,200 bus riders.
In FY 2017, drivers choosing to use the express toll lanes saved an average of 11 minutes southbound and 14 minutes northbound during peak commute times compared to the general purpose traffic. The average toll paid for a peak period trip was $2.15.
11MINUTES
Drivers using the express toll lanes are saving time

30
Washington State Department of Transportation
Funding improvements: peak-use shoulder laneAverage traffic volumes moving through the corridor have increased up to 20 percent (depending on location) during the peak commute in the two years since the facility opened. Northbound trips in all lanes between SR 522 and SR 527 initially experienced slower speeds when the express toll lanes opened. This slowing was caused both by the merge at SR 527 and by the transition of northbound lanes from five to three after SR 522.
The Legislature authorized WSDOT to use $11.5 million in toll revenue to build a peak-use shoulder lane between the SR 527 and I-5 interchanges. Since opening in April 2017, the peak-use shoulder has improved northbound travel times and helped reduce average tolls paid for afternoon peak period trips.
Express toll lanes meet agency goalsWSDOT established three primary goals for the express toll lanes:
• Improve speed and reliability in the HOV lanes – Drivers are saving time in the express toll lanes during peak periods. Vehicles in the express toll lanes consistently maintain higher average speeds than general purpose lanes during peak periods.
• Offer more choices to drivers – During the first 21 months of operations, the express toll lanes provided drivers 52,000 faster, more reliable trips each weekday for 37,000 toll paying customers and 15,000 toll exempt carpools and motorcycles.
• Fund future corridor improvements – The express toll lanes generated enough revenue in the first 21 months of operations to cover operating costs and to fund construction of a peak-use shoulder lane on northbound I-405 between SR 527 and I-5.
“I love the express toll lanes. They have made the commute much more manageable when I need to use 405 and I’m in a hurry.”
– 2017 Customer Survey
“It’s a bit expensive, but comes in really handy when I’m in a hurry. I believe it is much more effective than carpool lanes at minimizing your travel time. Because lots of people just aren’t willing to pay the price, so it stays pretty open most of the time.”
– 2017 Customer Survey
Kirkland
Bothell
Lynnwood
Bellevue
Woodinville
405
405
5
520
522
527
peak-use shoulder lane
1 express toll lane(single lane)2 express toll lanes(dual lanes)

WSDOT Toll Division Annual Report Fiscal Year 2017
31
Two year milestoneThe statute authorizing the express toll lanes on I-405 includes two performance metrics for the facility:
1. Generate sufficient revenue to cover all operations and maintenance of the facility.
2. Maintain speeds of 45 mph or greater during 90 percent of peak periods.
The express toll lanes reached the two year milestone on September 27, 2017, during FY 2018. After 21 months of operations, the express toll lanes generated more than sufficient revenue to fund all operation and maintenance of the facility. However, due to the dramatic increase in vehicle volumes in the corridor, reaching the 90 percent metric has proven more difficult. Despite this, WSDOT has observed a significant improvement in express toll lane speed performance compared to the previous HOV lanes on I-405.
Speed performanceThe dual-lane section of the express toll lanes, between Bellevue and Bothell, have succeeded in maintaining speeds of 45 mph or faster for more than 90% of peak periods, however the single-lanes struggle to reach the metric. The single-lane section, between Bothell and Lynnwood, lacks sufficient capacity to meet the demand for faster, more predictable trips in that area.
WSDOT is looking into alternatives to address the limited capacity in the southbound single-lane section and increase performance in the I-5 to SR 522 portion of I-405.
I-405 Express toll lanes performance
Next Steps• Evaluate options
for improvements to Bothell to Lynnwood section
• Plan for construction of Renton to Bellevue extension
0%
10%
20%
30%
40%
50%
60%
70%
80%
90%
100%
Jan-June2017
July-Dec2016
Jan-June2015
July-Dec2014
Percent of peak period when speeds are greater than 45 mph
Before Tolling (FY 2015) FY 2017

32
Washington State Department of Transportation
"The express lanes work great, but then traffic is terrible starting southbound from Bellevue to Renton, when the lane ends, it would be incredible if the lane continued to get through Bellevue".
– 2017 Customer Survey
My commute was 20 minutes faster and the toll lane was $4.00 Bellevue to I5.
– KayTee, I-405 driver
405 toll worth every penny this morning.
– Julie S., I-405 driver
Surveys shows high satisfaction WSDOT conducted two surveys of I-405 users in 2017. In May 2017, WSDOT conducted an online survey of Good To Go! customers who had used the I-405 express toll lanes. 98 percent of respondents had used the express toll lanes in the preceding month.
In June 2017, WSDOT contracted with a third-party to survey I-405 users, including drivers who had never used the I-405 express toll lanes.
The results of both surveys found that 60 percent of I-405 users like having the option of a faster, more predictable trip in the express toll lanes.
How satisfied are you with the option to use the express toll lanes for a faster, more predictable trip?
Customer Survey: How satisfied are you with the following during your trips on the I-405
express toll lanes?
Customer Survey
I-405 Drivers Survey
59% 23% 18%
40%60%
Satisfied Neutral Disagree
Speed of travel
Value of time saved relative to tolls paid
68% 17% 9%15%
28%49% 23%
Satisfied Neutral Unsatisfied
Revenue and expendituresThe I-405 express toll lanes generated over $20 million in tolling revenue in FY 2017. Of this revenue, only 38 percent was needed to cover all operations and maintenance costs, leaving almost $13 million available for reinvestment in the corridor.
Actual Projected1
Revenue3Expenses2
$23,154,000$20,923,032
$7,075,913$7,878,000
1 Projected Revenue: November 2016 TRFC Forecast. Projected Expenses: 2015-2017 Biennium Adopted Operation Budget, minus FY 2016 actual expenses to get the expenditure estimates for FY 2017.
2 Expenses exclude civil Penalty, capital improvements, and transponder costs.3 Only includes toll revenue Source: WSDOT Toll Finance

WSDOT Toll Division Annual Report Fiscal Year 2017
33
Where your I-405 toll dollar goesThe I-405 express toll lanes have generated sufficient revenue to cover all operations and maintenance costs for the facility, the net revenue after these costs is reserved for reinvestment in the corridor. In addition to toll revenue, the express toll lanes also generate revenue from other sources, such as transponder sales, reprocessing fees and interest.
Revenue availablefor reinvestment
in corridor:$15,302,643
Operations &maintenanceexpenditures:$7,945,550
I-405 Express Toll Lanes Total Revenue = $23,248,193
Source: WSDOT Financial Satements
34%
66%
Source: WSDOT Financial Statements

Washington State Department of Transportation
34
Future toll facilities
Two new toll facilities and an expansion of the express toll lanes between Renton to Bellevue were identified by the 2015 Connecting Washington package. These facilities are in various stages of planning or construction. The Washington State Transportation Commission (WSTC) will establish toll rates and exemptions for these facilities. The WSTC will engage in the rate setting process for the SR 99 tunnel in FY 2018.
I-405 Renton To Bellevue ProjectPeak period congestion on I-405 between Renton and Bellevue is the worst in the state. In order to provide relief to this chronically congested corridor, the 2015 Connecting Washington transportation package provided funding for preliminary engineering, right of way acquisition, and construction of an extension of the express toll lanes from Bellevue to Renton. Construction is expected to start in 2019.
The I-405 Renton to Bellevue Widening and Express Toll Lanes project will add highway capacity and offer more reliable travel choices to keep drivers and transit riders moving. The project will connect the express toll lane system between Bellevue and Lynnwood, as well as the SR 167 HOT lanes, completing a 40-mile system of express toll lanes that will improve speeds and trip reliability for all travelers. Benefits of this project are:
• Congestion relief: the addition of the northbound and southbound express toll lanes between SR 167 in Renton and NE 6th Street in Bellevue will reduce congestion will reduce congestion by moving higher volumes during peak periods.
• Safety: widening the corridor reduces the likelihood of sideswipes and congestion-related collisions.

35
WSDOT Toll Division Annual Report Fiscal Year 2017
SR 99 Tunnel
The Alaskan Way Viaduct Replacement Program is made up of 30 projects that work together to reshape the SR 99 corridor. As of fall 2017, 24 of the 30 projects are complete.
The remaining section of the viaduct along the downtown Seattle waterfront will be replaced with an approximately two-mile-long tunnel underneath downtown. In 2017 tunneling was completed. Crews continue to work on building the roadway inside the tunnel and installing mechanical, electrical and plumbing systems. The tunnel is anticipated to open to drivers in early 2019.
Funding for the $3.2 billion viaduct replacement program comes from state, federal and local sources as well as the Port of Seattle and future toll revenue. The Legislature included $200 million in toll revenue in the total program budget. Tolling of the SR 99 tunnel is anticipated to begin after the tunnel opens to drivers.
WSDOT has commissioned Stantec, an independent traffic analysis firm, to conduct a traffic and revenue study that will inform the Washington State Transportation Commission’s toll rate setting process. This study will help predict how much revenue could be raised and how traffic will likely adjust to a variety of potential toll rates. In FY 2017, WSDOT shared the preliminary traffic and revenue data on a few base scenarios with partner agencies. When the rate-setting process begins in FY 2018, multiple scenarios will be modeled in order to ensure the Transportation Commission has the detailed information necessary to establish toll rates.
Building the roadway inside the tunnelFinal lift during disassembly

Washington State Department of Transportation
36
Puget Sound Gateway Program
King County
Pierce County
PugetSound
Seattle
Tacoma
Kent
Puyallup
Burien
16
509
509
99
516
5
5
405
90
5167
167
161
Sea-TacAirport
Port ofTacoma
Port ofSeattle
What is the Puget Sound Gateway Program?The Puget Sound Gateway Program is comprised of two projects: completion of State Route (SR) 509 in King County, and completion of State Route (SR) 167 in Pierce County. These projects provide essential connections to the ports of Seattle and Tacoma and will help ensure people and goods move more reliably through the Puget Sound region.
Funding for the total Puget Sound Gateway Program will come from the state gas tax, tolls, local contributions, and potential federal grants. Total funding for the project is $1.87 billion; $1.565 billion from the Connecting Washington Revenue package, $180 million from tolls, and $130 million from local contributions. WSDOT is also seeking a federal grant.
What do the first phases of the Gateway projects do?WSDOT will add six miles of new highway for SR 167 and two miles of new highway for SR 509. Based on the funding plan under Connecting Washington, major construction for a first stage would likely occur in 2019, with a second phase beginning in 2025. As part of the project WSDOT will build several new interchanges, including connections to Interstate 5 from SR 509 and SR 167. WSDOT will closely coordinate with Sound Transit on the first stage of construction, as Sound Transit’s Federal Way Link Extension project is scheduled to open by 2024.
What is the timeline for these projects? The Puget Sound Gateway projects are funded over 16 years, scheduled for completion in 2030.

37
WSDOT Toll Division Annual Report Fiscal Year 2017
Technology and Interoperability
Toll interoperability is the effort to make toll passes from every state compatible with one another. This flexibility will allow travelers to use a single toll pass at facilities across multiple states. WSDOT is working hard to ensure that Good To Go! passes work at toll facilities across the U.S., working actively with our toll partners to achieve regional and national interoperability. Highlights of interoperability efforts include:
• Working with California Toll Operators (CTOC) to make toll payments seamless for Good To Go! customers using California toll facilities.
• Assisting California with adoption of the same transponder technology (6C protocol) used by Good To Go! to make roadside technologies more seamless.
• Working to ensure California’s FasTrak pass customers can use Good To Go! toll facilities, which will result in much less time and effort for WSDOT to collect these tolls.
• Active participation in national interoperability efforts, including pass protocol testing, user surveys, and oversight.
WSDOT’s back office toll system upgrades underway will enable electronic toll collection interoperability with out of state toll facilities.
WSDOT is using toll pass technology (6C protocol) that is under consideration to become one of the national standards. It is open-source, flexible, and cost-effective so our toll systems will continue to work no matter what national standards are chosen. In addition, all WSDOT toll facilities are equipped to read multiple toll pass technologies which provides WSDOT flexibility to become interoperable in the future with other regions using compatible technologies.
Protocols and interoperability nationwide
Texas
Louisiana
Nevada
California
Arizona
Oregon
Iowa
Kansas
NewMexico
Missouri
Nebraska
Florida
Oklahoma
Alabama
Maine
Arkansas
Virginia
Michigan
NorthDakota
Mississippi
Kentucky
TennesseeNorth Carolina
SouthCarolina
WestVirginia
Vermont
Maryland
NewJersey
NewHampshire
ConnecticutRhode Island
Delaware
Montana
Idaho
Wyoming
OhioIllinois Indiana
Wisconsin
Washington
AlaskaHawaii
SouthDakota New York
Pennsylvania
Massachusetts
Minnesota
UtahColorado
Georgia
TDMTDM/C6TDM/SeGo/6C
SeGo6C6C/SeGo
SeGo/ATATitle-216C/Title-21
Transponder technology used

Washington State Department of Transportation
38
COMBINING BALANCE SHEET WASHINGTON STATE DEPARTMENT OF TRANSPORTATION
WASHINGTON TOLLING SYSTEM STATE FISCAL YEAR 2017, QUARTER ENDED JUNE 30, 2017
1
The notes to the financial statements are an integral part of this statement
HOT 520 520 CIVIL CENTRALTNB LANES BRIDGE PENALTY 405 TOLL
NOTES ACCOUNT ACCOUNT ACCOUNT ACCOUNT ACCOUNT ACCOUNT TOTALASSETS
Cash and cash equivalents 20,423,001$ 4,555,549$ 95,773,118$ 5,234,193$ 21,473,853$ 18,164,484$ 165,624,198$ Cash held with escrow agents - - - - - - - Accounts receivable, net 1 1,424,978 2,720 2,390,657 - 906,614 (5) 4,724,965Notice of civil penalties, net 2 7,373,946 - - 7,461,336 3,489,078 79 18,324,439Due from other governments - - - - - 61,095 61,095 Due from other funds/agencies 704,928 57,440 1,416,708 19,711 508,510 3,949,491 6,656,787Due from toll vendor 3 142,145 13,047 270,971 569 1,330 12,997 441,058Consumable inventories 4 - - - - - 256,566 256,566
TOTAL ASSETS 30,068,997 4,628,756 99,851,454 12,715,809 26,379,386 22,444,707 196,089,108 LIABILITIES, DEFERRED INFLOWS OF RESOURCES,
AND FUND BALANCESLiabilities
Accounts payable 1,157,357 77,577 9,899,952 65,887 1,073,531 226,637 12,500,940 Retained percentages payable 43,970 28,474 445,819 77,830 12,500 - 608,593 Obligations under Security Lending 348,149 77,658 1,633,239 89,227 366,062 283,364 2,797,698 Due to other governments 676 - 35,104 344 180 - 36,304 Due to other funds/agencies 1,119,728 56,917 15,463,639 494,624 2,291,558 2,748,985 22,175,452Due to department of revenue - taxes - - - - 7 12,627 12,633Unearned revenue 5 2,152,925 - 889,606 1,342,979 887,351 19,116,619 24,389,480Unclaimed property refund liabil ity - - - - - - - Liability for cancelled warrants 6 2,731 - - - - 56,475 59,206
Total Liabilities 4,825,535 240,626 28,367,359 2,070,891 4,631,189 22,444,707 62,580,307 Deferred Inflows of Resources
Unavailable revenue-$5 fee, NOCPs, Real Estate 7 5,531,746 - 243,934 5,610,805 2,845,295 - 14,231,780 Unavailable revenue-toll vendor (103) - - - - - (103)
Total Deferred Inflows of Resources 5,531,642 - 243,934 5,610,805 2,845,295 - 14,231,677 Fund Balances
Nonspendable consumable inventories - - - - - (256,566) (256,566) Restricted for unspent bond proceeds - - - - - - - Restricted for operations and maintenance - - 9,204,853 - - - 9,204,853 Restricted for repair and replacement - - 14,673,386 - - - 14,673,386 Restricted for transportation 19,711,820 - 18,556,964 - - - 38,268,783 Restricted for revenue stabilization - - 28,804,958 - - - 28,804,958 Committed for transportation - 4,388,130 - 5,034,113 18,902,902 256,566 28,581,711 Unassigned - - - - - - -
Total Fund Balances 19,711,820 4,388,130 71,240,161 5,034,113 18,902,902 - 119,277,125 TOTAL LIABILITIES, DEFERRED INFLOWS OF RESOURCES, AND FUND BALANCES 30,068,997$ 4,628,756$ 99,851,454$ 12,715,809$ 26,379,386$ 22,444,707$ 196,089,108$
Financial Reports

WSDOT Toll Division Annual Report Fiscal Year 2017
39
NOTES TO THE COMBINING BALANCE SHEET WASHINGTON STATE DEPARTMENT OF TRANSPORTATION
WASHINGTON TOLLING SYSTEM STATE FISCAL YEAR 2017, QUARTER ENDED JUNE 30, 2017
2
Detailed Notes 1. Accounts Receivable, net:
(a) TNB, 520 Bridge and 405 accounts consist primarily of: (1) Crossings where a Toll Bill has been sent to the customer via Pay-by-Mail, (2) Customer payments made by credit card which had yet to settle, (3) Crossings that are in the image review process and toll fees have yet to be transferred from customer accounts, (4) Crossings that are not viable and are awaiting dismissal, (5) and the Accounts allocated share of NSF fee, transponder sales and $5 reprocessing fee receivables
(b) HOT Lanes Account consists of: HOT Lanes allocated share of NSF fee and transponder sales receivables. 2. Notice of Civil Penalties, net - The TNB balance consists of all outstanding amounts due related to TNB notices of civil penalties
and the 520 Civil Penalty balance consists of all outstanding amounts due related to 520 Bridge notices of civil penalties. 3. Due from Toll Vendor – For TNB, HOT Lanes, 520 Bridge, and 405 Account, the Due from Toll Vendor consists primarily of
amounts due from the CSC operations vendor (ETCC) due to renegotiation of the CSC operations contract. For the Central Toll Account amounts are due from the CSC operations vendor ETCC due to operational and system errors that have required manual corrections and have resulted in amounts due to WSDOT.
4. Consumable Inventory – Toll transponders valued at cost using the first in, first out (FIFO) method. 5. Unearned Revenue:
(a) TNB Account - Notice of civil penalty amounts not yet recognized because the adjudication process has not been completed. Also included are amounts associated with deferrals for toll bill amounts not estimated to be collected until they become NOCP receivables, as well as amounts directly attributable to items (a) (3) and (4) described above in Note 1.
(b) 520 Bridge Account - amounts associated with deferrals for toll bill amounts not estimated to be collected until they become NOCP receivables, as well as amounts directly attributable to items (a) (3) and (4) described above in Note 1.
(c) 520 Civil Penalty Account – Notice of civil penalty amounts not yet recognized because the adjudication process has not been completed.
(d) 405 Account - amounts associated with deferrals for toll bill amounts not estimated to be collected until they become NOCP receivables, as well as amounts directly attributable to items (a) (3) and (4) described above in Note 1.
(e) Central Toll Account - amounts from customers on deposit for prepaid Good To Go! accounts. No revenue is recognized in the Central Toll Account. Funds from the prepaid accounts, held in the Central Toll Account, are transferred to the applicable toll facility when a transponder is “read” as the customers’ vehicle crosses one of the toll facilities. Until this event, the prepaid toll account balance represents a liability to the state and is owed to the customer.
6. Cancelled Warrants – When a vendor cannot be located, such as when the vendor changes addresses without notification, the original warrant (check) must be cancelled and reissued once the vendor is located.
7. Unavailable Revenue: (a) TNB Account - amount associated with TNBs long-term portion of the toll vendor receivable and a real estate contract
receivable. Also included are deferrals for NOCP and $5 fee receivable amounts estimated to take over 12 months to collect. (b) HOT Lanes Account - amount associated with the accounts long-term portion of the toll vendor receivable. (c) 520 Bridge Account - amount associated with 520s long-term portion of the toll vendor receivable. Also included are deferrals
for $5 fee receivable amounts estimated to take over 12 months to collect. (d) 520 Civil Penalty Account – amounts associated with deferral for NOCP receivable amounts estimated to take over 12 months
to collect. (e) 405 Account – amounts associated with long-term portion of the toll vendor receivable. Also included are deferrals for NOCP
and $5 fee receivable amounts estimated to take over 12 months to collect.

40
Washington State Department of Transportation
STATEMENT OF REVENUES, EXPENDITURES, AND CHANGES IN FUND BALANCE WASHINGTON STATE DEPARTMENT OF TRANSPORTATION
TACOMA NARROWS BRIDGE ACCOUNT STATE FISCAL YEAR 2017, QUARTER ENDED JUNE 30, 2017
1
The notes to the financial statements are an integral part of this statement
JUL OCT JAN APR THROUGH THROUGH THROUGH THROUGH
NOTES SEP DEC MAR JUN YEAR-TO-DATE REVENUES
Toll revenue 1 21,095,313$ 19,134,521$ 18,533,674$ 20,691,428$ 79,454,937$ Civil penalty 2 328,647 526,375 382,290 (5,181) 1,232,131 Transponder sales 3 136,276 116,380 110,948 118,748 482,352 Toll vendor contractual damages 4 35,773 33,790 34,845 35,554 139,961 Toll bil l reprocessing fee 5 102,433 96,780 107,654 101,079 407,946 Interest income 31,303 42,149 50,831 84,568 208,852 Miscellaneous 6 9,205 8,186 8,344 11,853 37,588
TOTAL REVENUES 21,738,950 19,958,182 19,228,585 21,038,049 81,963,766
EXPENDITURESGoods and Services
Toll CSC operations vendor contract 7 592,960 609,875 646,976 609,783 2,459,593 Toll booth and lane vendor contract 807,390 807,531 852,667 829,732 3,297,319 Insurance 8 1,134,456 10,710 5,496 11,274 1,161,936 Credit card and bank fees 444,607 392,837 349,847 454,223 1,641,515 Transponder cost of goods sold 9 97,581 81,569 77,540 78,908 335,598 Pay-by-mail 130,529 109,603 121,973 130,365 492,471 Other 10 100,485 91,286 139,397 111,275 442,444
Total Goods and Services 3,308,008 2,103,411 2,193,897 2,225,560 9,830,875
Personal service contracts 11 215,201 300,086 161,815 150,937 828,039 Salaries and benefits 232,034 230,614 280,820 280,382 1,023,850 Civil penalty adjudication costs 12 350,599 479,900 585,522 133,673 1,549,694 Maintenance and preservation 13 84,494 134,325 858,922 306,682 1,384,424
TOTAL EXPENDITURES 4,190,335 3,248,337 4,080,975 3,097,235 14,616,882
EXCESS / (DEFICIENCY) OF REVENUES OVER EXPENDITURES 17,548,615 16,709,844 15,147,610 17,940,814 67,346,883
OTHER FINANCING USESOperating transfers out 14 (15,741,330) (12,566,995) (22,894,330) (17,308,995) (68,511,650)
TOTAL OTHER FINANCING USES (15,741,330) (12,566,995) (22,894,330) (17,308,995) (68,511,650)
NET CHANGE IN FUND BALANCE 1,807,285 4,142,849 (7,746,720) 631,819 (1,164,767)
FUND BALANCE - BEGINNING 20,876,586 22,683,871 26,826,720 19,080,001 20,876,586
FUND BALANCE - ENDING 22,683,871$ 26,826,720$ 19,080,001$ 19,711,820$ 19,711,820$

WSDOT Toll Division Annual Report Fiscal Year 2017
41
NOTES TO THE STATEMENT OF REVENUES, EXPENDITURES, AND CHANGES IN FUND BALANCE WASHINGTON STATE DEPARTMENT OF TRANSPORTATION
TACOMA NARROWS BRIDGE ACCOUNT STATE FISCAL YEAR 2017, QUARTER ENDED JUNE 30, 2017
2
. Motor Vehicle Account (MVA) Obligation – In 2005-07, as tolling began on the Tacoma Narrows Bridge (TNB), an operating loan of $5,288,000 was made from the Motor Vehicle Account to capitalize the Tacoma Narrows Bridge Account (Chapter 518, Laws of 2007, Section 1005(15)). RCW 46.63.160 requires that net civil penalties deposited in the Tacoma Narrows Bridge Account must first be allocated toward repayment of the operating loan. In order to transfer the funds, the State Treasurer’s Office must be provided administrative transfer authority. For the 2015-17 biennium, the Legislature provided authority in Chapter 10, Laws of 2015 PV (2ESHB 1299, Section 403(6)) to transfer $950,000. The current obligation at the beginning of 2015-17 biennium is $4,338,000. Detailed Notes 1. Toll Revenue – Revenue earned, net of any adjustments, from tolls on vehicles traveling in the eastbound direction over
the TNB, which are collected at toll booths, as electronic toll accounts, or pay-by-mail.
2. Civil Penalty Revenue – Revenue earned when any of the following conditions exist: (a) Payment of Notice of Civil Penalty is received, or (b) Notice of Civil Penalty payment due date passes without receiving a request for an administrative hearing, or (c) an Administrative Law Judge upholds the Notice of Civil Penalty.
3. Transponder Sales – Sales of transponder devices to potential and existing Good to Go! electronic toll account customers.
4. Toll Vendor Contractual Damages – Charges to ETCC for not meeting Key Performance Indicators (KPIs).
5. Toll Bill Reprocessing Fee Revenue – The allocated portion of fees associated with the issuance of second toll billings.
6. Miscellaneous Revenue – This can include revenue for administrative and statement fees, NSF check fees, cash over, payments related to sale of surplus property, and prior period recoveries.
7. Toll CSC Operations Vendor Contract – Payment for monthly Customer Service Center (CSC) operations costs.
8. Insurance – Annual premium for insuring the facility and monthly insurance brokerage fee paid to the Department of Enterprise Services (DES).
9. Transponder Cost of Goods Sold – Cost of purchasing, packaging, and shipping transponders. Transponder Cost of Goods Sold is directly related to Transponder Sales Revenue.
10. Other Goods and Services – Expenditures for supplies, communications, rents, repairs, outside vendor services, printing, and registered owner look up costs.
11. Personal Service Contracts – Expenditures incurred for traffic and revenue forecast consulting and CSC operations consulting. Increase in services provided by Jacobs, new contract with Stantec.
12. Civil Penalty Adjudication Costs – TNB’s share of the adjudication system vendor contract with ETCC for the adjudication system module, as well as its share of supplies, communications, credit card fees, Office of Administrative Hearings costs, and salaries and benefits of WSDOT staff.
13. Maintenance and Preservation – Cost of maintenance and bridge preservation activities on the new TNB. Maintenance totaled $769,624 and Preservation totaled $614,800.
14. Operating Transfers Out – Amount transferred to MVA for debt service pursuant to RCW 47.46.140. Also includes transfer resulting from the Moore V HCA settlement. See 2ESHB 2376 section 708.

42
Washington State Department of Transportation
STATEMENT OF REVENUES, EXPENDITURES, AND CHANGES IN FUND BALANCE WASHINGTON STATE DEPARTMENT OF TRANSPORTATION
HIGH OCCUPANCY TOLL OPERATIONS ACCOUNT STATE FISCAL YEAR 2017, QUARTER ENDED JUNE 30, 2017
1
The notes to the financial statements are an integral part of this statement.
JUL OCT JAN APR THROUGH THROUGH THROUGH THROUGH
NOTES SEP DEC MAR JUN YEAR-TO-DATE REVENUES
Toll revenue 1 490,727$ 611,158$ 736,983$ 847,784$ 2,686,652$ Transponder sales 2 21,383 20,201 19,390 21,299 82,273 Toll vendor contractual damages 3 3,280 3,060 3,191 3,307 12,838 Interest income 3,563 4,978 5,814 13,899 28,255 Miscellaneous 4 843 937 1,024 926 3,730
TOTAL REVENUES 519,796 640,334 766,403 887,215 2,813,748
EXPENDITURESGoods and Services
Toll CSC operations vendor contract 5 73,098 75,197 81,526 83,684 313,505 Toll lane vendor contract 6 - - - - - Credit card and bank fees 8,793 8,376 (13) 13,728 30,884 Transponder cost of goods sold 7 15,302 16,304 14,473 14,829 60,909 Washington state patrol 8 27,973 24,941 27,170 50,117 130,201 Other 9 12,489 9,611 13,096 44,423 79,619
Total Goods and Services 137,656 134,429 136,251 206,782 615,117
Personal service contracts 10 26,880 35,101 21,083 20,257 103,320 Salaries and benefits 74,841 76,494 88,317 86,432 326,084 Maintenance and preservation 11 6,185 229,494 236,521 (152) 472,048
TOTAL EXPENDITURES 245,562 475,518 482,172 313,319 1,516,570 EXCESS / (DEFICIENCY) OF REVENUES OVER EXPENDITURES 274,235 164,816 284,232 573,896 1,297,179
OTHER FINANCING USESOperating transfers out 12 (1,000) - - - (1,000)
TOTAL OTHER FINANCING USES (1,000) - - - (1,000) NET CHANGE IN FUND BALANCE 273,235 164,816 284,232 573,896 1,296,179 FUND BALANCE - BEGINNING 3,091,951 3,365,186 3,530,002 3,814,233 3,091,951 FUND BALANCE - ENDING 3,365,186$ 3,530,002$ 3,814,233$ 4,388,130$ 4,388,130$

WSDOT Toll Division Annual Report Fiscal Year 2017
43
NOTES TO THE STATEMENT OF REVENUES, EXPENDITURES, AND CHANGES IN FUND BALANCE WASHINGTON STATE DEPARTMENT OF TRANSPORTATION
HIGH OCCUPANCY TOLL OPERATIONS ACCOUNT STATE FISCAL YEAR 2017, QUARTER ENDED JUNE 30, 2017
2
Detailed Notes 1. Toll Revenue – Revenue earned from single occupancy vehicles traveling in the High Occupancy Vehicle (HOV) Lanes
on SR167 with a Good To Go! transponder account. A variable fee, based on traffic volumes, is automatically charged to their account.
2. Transponder Sales – Sales of transponder devices to potential and existing Good To Go! electronic toll account customers.
3. Toll Vendor Contractual Damages – Charges to ETCC for not meeting Key Performance Indicators (KPIs).
4. Miscellaneous Revenue – This can include revenue for administrative and statement fees, NSF check fees, cash over, and prior period recoveries.
5. Toll CSC Operations Vendor Contract – Payment for monthly CSC operations costs.
6. Toll Lane Vendor Contract – The cost of capturing traffic activity in tolled lanes.
7. Transponder Cost of Goods Sold – Cost of purchasing, packaging, and shipping transponders. Transponder Cost of Goods Sold is directly related to Transponder Sales Revenue.
8. The Washington State Patrol – Support for the enforcement of the laws governing the use of the HOT Lanes by issuing citations to HOT Lane violators.
9. Other Goods and Services – Expenditures for supplies, communications, rents, repairs, services provided by outside vendors, etc.
10. Personal Service Contracts – Expenditures incurred for traffic and revenue forecast consulting and CSC operations consulting.
11. Maintenance and Preservation – Cost of maintenance and preservation activities on the HOT Lanes.
12. Operating transfers out – Amount of transfer resulting from the Moore V HCA settlement. See 2ESHB 2376 section 708.

44
Washington State Department of Transportation
STATEMENT OF REVENUES, EXPENDITURES, AND CHANGES IN FUND BALANCE WASHINGTON STATE DEPARTMENT OF TRANSPORTATION
THE STATE ROUTE NUMBER 520 CORRIDOR ACCOUNT STATE FISCAL YEAR 2017, QUARTER ENDED JUNE 30, 2017
1
The notes to the financial statements are an integral part of this statement.
JUL OCT JAN APR THROUGH THROUGH THROUGH THROUGH
NOTES SEP DEC MAR JUN YEAR-TO-DATE REVENUES
Toll revenue 1 19,073,826$ 18,031,557$ 18,130,217$ 19,743,447$ 74,979,046$ Debt service reimbursement (FHWA) 2 83,706,338 - 16,364,588 - 100,070,925 Transponder sales 3 238,679 206,897 191,433 214,687 851,696 Toll vendor contractual damages 4 68,924 65,228 66,903 68,356 269,412 Toll bil l reprocessing fee 5 282,747 272,335 270,884 258,154 1,084,120 Interest income 89,029 226,621 247,975 387,217 950,842 Miscellaneous 6 14,140 31,588 (5,772) 2,863,884 2,903,841
TOTAL REVENUES 103,473,683 18,834,226 35,266,228 23,535,746 181,109,882
EXPENDITURESGoods and Services
Toll CSC operations vendor contract 7 1,383,041 1,374,434 1,366,505 1,481,981 5,605,961 Toll lane vendor contract 135,502 150,541 143,021 (47,674) 381,390 Insurance 8 2,196,374 17,973 9,223 18,918 2,242,488 Credit card and bank fees 413,734 394,806 324,114 425,406 1,558,060 Transponder cost of goods sold 9 170,939 145,011 133,931 142,502 592,383 Pay-by-mail 357,893 302,663 291,240 332,356 1,284,152 Other 10 175,119 163,259 260,329 204,770 803,476
Total Goods and Services 4,832,602 2,548,687 2,528,362 2,558,260 12,467,910
Personal service contracts 11 450,322 705,904 337,383 479,461 1,973,070 Salaries and benefits 368,722 386,550 449,634 472,532 1,677,438 Cost of financing 12 129,229 - - 133,123 262,352 Maintenance and preservation 13 314,085 554,843 421,796 1,283,326 2,574,050 Capital outlay 14 2,488,115 39,171,480 31,820,586 53,983,301 127,463,482
TOTAL EXPENDITURES 8,583,076 43,367,463 35,557,762 58,910,003 146,418,303
EXCESS / (DEFICIENCY) OF REVENUES OVER EXPENDITURES 94,890,607 (24,533,237) (291,534) (35,374,256) 34,691,579
OTHER FINANCING SOURCES (USES)Bonds issued 15 111,012,060 - - - 111,012,060 Operating Transfer In 16 1,184,579 - - 815,000 1,999,579 Operating transfers out - debt service 17 (9,214,995) (9,341,434) (16,039,069) (12,268,309) (46,863,807) Operating transfers out - GARVEE debt service (83,706,338) - (16,364,588) - (100,070,925) Operating transfers out 18 (19,000) - - - (19,000)
TOTAL OTHER FINANCING USES 19,256,306 (9,341,434) (32,403,657) (11,453,309) (33,942,093)
NET CHANGE IN FUND BALANCE 114,146,913 (33,874,671) (32,695,191) (46,827,565) 749,485
FUND BALANCE - BEGINNING 70,490,675 184,637,588 150,762,917 118,067,726 70,490,675
FUND BALANCE - ENDING 184,637,588$ 150,762,917$ 118,067,726$ 71,240,161$ 71,240,161$

WSDOT Toll Division Annual Report Fiscal Year 2017
45
NOTES TO THE STATEMENT OF REVENUES, EXPENDITURES, AND CHANGES IN FUND BALANCE WASHINGTON STATE DEPARTMENT OF TRANSPORTATION
THE STATE ROUTE NUMBER 520 CORRIDOR ACCOUNT STATE FISCAL YEAR 2017, QUARTER ENDED JUNE 30, 2017
2
. Detailed Notes 1. Toll Revenue – Revenue earned, net of any adjustments, from tolls on vehicles traveling over the 520 Bridge, which are
collected by either Good To Go! electronic toll accounts or pay-by-mail.
2. Debt Service Reimbursement (FHWA) – Federal Highway Administration Revenue provided for debt service on GARVEE bonds (Series 2012F & Series 2014C). These revenues are received every six months and the associated operating transfers out occur at the same time.
3. Transponder Sales – Sales of transponder devices to potential and existing Good To Go! electronic toll account customers.
4. Toll Vendor Contractual Damages – Charges to ETCC for not meeting Key Performance Indicators (KPIs).
5. Toll Bill Reprocessing Fee Revenue – The allocated portion of fees associated with the issuance of second toll billings.
6. Miscellaneous Revenue – This can include revenue for administrative and statement fees, NSF check fees, cash over, payments related to sale of surplus property, and prior period recoveries. Q4 increase due to sale of Medina property for $2.85 million.
7. Toll CSC Operations Vendor Contract – Payment for monthly CSC operations costs.
8. Insurance – Annual premium for insuring the facility and monthly insurance brokerage fee paid to the Department of Enterprise Services (DES).
9. Transponder Cost of Goods Sold – Cost of purchasing, packaging, and shipping transponders. Transponder Cost of Goods Sold is directly related to Transponder Sales Revenue.
10. Other Goods and Services – Expenditures for supplies, communications, rents, repairs, service provided by outside vendors, printing, and registered owner look up costs.
11. Personal Service Contracts – Expenditures incurred for traffic and revenue forecast consulting and CSC operations consulting. Increase in services provided by Jacobs.
12. Cost of Financing – Costs representing the underwriter’s discount and cost of issuance charged by OST for the issuance of the second Triple Pledge bond sale (2017C) in September 2016.
13. Maintenance and Preservation – Cost of maintenance and preservation activities on the SR520 corridor. Maintenance totaled $2,345,848 and Preservation totaled $210,649.
14. Capital Outlay – Costs associated with construction of the new replacement 520 Floating Bridge.
15. Bond Issued – Triple pledge bonds were issued in September 2016.
16. Operating Transfer In – The transfer amount in Q1 represents amounts transferred back to 16J due to withholding more than required for the TIFIA loan. The transfer amount in Q4 represents toll revenue transferred from NOCP account per transfer authority in 2016 Session Laws Chapter 14 Section 408.
17. Operating Transfers Out – debt service – Transfers of cash to the Toll Facility Bond Retirement Account to facilitate the payment of debt service on the Series 2012C, 2012F, 2014C and 2017C bonds. The GARVEE transfer out for the Series 2012F & 2014C bonds is paid by a reimbursement from FHWA (Note 2).
18. Operating transfers out – Amount of transfer resulting from the Moore V HCA settlement. See 2ESHB 2376 section 708.

46
Washington State Department of Transportation
STATEMENT OF REVENUES, EXPENDITURES, AND CHANGES IN FUND BALANCE WASHINGTON STATE DEPARTMENT OF TRANSPORTATION
THE 520 CIVIL PENALTY ACCOUNT STATE FISCAL YEAR 2017, QUARTER ENDED JUNE 30, 2017
1
The notes to the financial statements are an integral part of this statement.
JUL OCT JAN APR THROUGH THROUGH THROUGH THROUGH
NOTES SEP DEC MAR JUN YEAR-TO-DATE REVENUES
Civil penalty 1 774,763$ 935,102$ 932,547$ 19,483$ 2,661,894$ Interest income 10,622 11,628 10,859 20,082 53,191
TOTAL REVENUES 785,385 946,730 943,405 39,564 2,715,085
EXPENDITURESGoods and Services
Adjudication system vendor contract 2 141,084 128,066 152,652 130,018 551,820 Administrative hearing 3 49,947 33,776 9,701 1,933 95,356 Credit card and bank fees 10,847 10,346 21,187 20,302 62,682 Other 4 353,581 656,674 840,378 809,785 2,660,418
Total Goods and Services 555,458 828,862 1,023,918 962,038 3,370,275
Salaries and benefits 47,975 41,599 39,184 32,584 161,343
Capital Outlay 5 725,455 2,004,958 332,003 612,752 3,675,169
TOTAL EXPENDITURES 1,328,889 2,875,419 1,395,105 1,607,374 7,206,787
EXCESS / (DEFICIENCY) OF REVENUES OVER EXPENDITURES (543,503) (1,928,689) (451,700) (1,567,810) (4,491,702)
OTHER FINANCING SOURCES (USES)
Operating transfers out - - - (815,000) (815,000)
TOTAL OTHER FINANCING USES - - - (815,000) (815,000)
NET CHANGE IN FUND BALANCE (543,503) (1,928,689) (451,700) (2,382,810) (5,306,702)
FUND BALANCE - BEGINNING 10,340,815 9,797,312 7,868,623 7,416,923 10,340,815
FUND BALANCE - ENDING 9,797,312$ 7,868,623$ 7,416,923$ 5,034,113$ 5,034,113$

WSDOT Toll Division Annual Report Fiscal Year 2017
47
NOTES TO THE STATEMENT OF REVENUES, EXPENDITURES, AND CHANGES IN FUND BALANCE WASHINGTON STATE DEPARTMENT OF TRANSPORTATION
THE 520 CIVIL PENALTY ACCOUNT STATE FISCAL YEAR 2017, QUARTER ENDED JUNE 30, 2017
2
Detailed Notes 1. Civil Penalty Revenue – Revenue earned when any of the following conditions exist: (a) Payment of Notice of Civil
Penalty is received, or (b) Notice of Civil Penalty payment due date passes without receiving a request for an administrative hearing, or (c) an Administrative Law Judge upholds the Notice of Civil Penalty.
2. The Adjudication System Vendor Contract – 520 Bridge share of the adjudication system vendor contract with ETCC for the adjudication system module.
3. Administrative hearing – The Office of Administrative Hearings (OAH) has the necessary expertise to provide fair and impartial Administrative Law Judges (ALJs) to preside over the toll violation dispute processes. OAH provides ALJs to preside over and/or decide the toll violation disputes. These costs include labor hours for the ALJs for their services performed for toll adjudication, training and administration.
4. Other Goods and Services – Expenditures for the 520 Bridge’s share of adjudication costs. These costs include supplies, communications, services provided by outside vendors, printing, and settlement costs. There was a settlement for $900,000 in 4th qtr.
5. Capital Outlay – Funding for Connecting Washington was authorized for use in the 2015-2017 biennium. Funding is being spent according to scope of work requirements.

48
Washington State Department of Transportation
STATEMENT OF REVENUES, EXPENDITURES, AND CHANGES IN FUND BALANCE WASHINGTON STATE DEPARTMENT OF TRANSPORTATION
INTERTSTATE 405 ACCOUNT STATE FISCAL YEAR 2017, QUARTER ENDED JUNE 30, 2017
1
The notes to the financial statements are an integral part of this statement.
JUL OCT JAN APR THROUGH THROUGH THROUGH THROUGH
NOTES SEP DEC MAR JUN YEAR-TO-DATE REVENUES
Toll revenue 1 5,196,257$ 5,071,101$ 5,199,769$ 5,455,905 20,923,032$ Civil penalty 2 326,066 489,396 392,451 61,294 1,269,207 Transponder sales 3 100,910 87,558 73,300 90,946 352,714 Toll vendor contractual damages 4 2,032 491 1,177 1,874 5,574 Toll bil l reprocessing fee 5 136,150 130,170 127,024 123,946 517,291 Interest income 15,621 25,189 34,485 84,372 159,667 Miscellaneous 6 5,523 4,852 5,086 5,247 20,708
TOTAL REVENUES 5,782,560 5,808,757 5,833,292 5,823,584 23,248,193
EXPENDITURESGoods and Services Toll CSC operations vendor contract 7 511,527 534,838 484,256 525,600 2,056,222 Toll Lane Vendor 281,947 281,947 281,947 352,949 1,198,789
Credit card and bank fees 111,473 117,322 85,847 123,734 438,376 Transponder cost of goods sold 8 75,452 72,821 56,394 66,335 271,002 Washington State Patrol 9 318,473 32,396 100,660 238,415 689,943
Pay-by-mail 174,589 144,477 135,855 160,821 615,742 Other 10 84,066 59,680 115,091 72,514 331,352
Total Goods and Services 1,557,528 1,243,480 1,260,051 1,540,367 5,601,426
Personal service contracts 11 97,091 236,330 141,368 278,288 753,077 Salaries and benefits 246,655 223,819 259,002 262,935 992,411 Civil penalty adjudication cost 12 177,396 163,363 150,468 107,408 598,635 Capital outlay 8,327,490 8,327,490
TOTAL EXPENDITURES 2,078,670 1,866,992 1,810,889 10,516,489 16,273,040
EXCESS / (DEFICIENCY) OF REVENUES OVER EXPENDITURES 3,703,890 3,941,765 4,022,403 (4,692,905) 6,975,153
OTHER FINANCING SOURCES (USES) - - - - -
TOTAL OTHER FINANCING USES - - - - -
NET CHANGE IN FUND BALANCE 3,703,890 3,941,765 4,022,403 (4,692,905) 6,975,153
FUND BALANCE - BEGINNING 11,927,748 15,631,638 19,573,403 23,595,807 11,927,748
FUND BALANCE - ENDING 15,631,638$ 19,573,403$ 23,595,807$ 18,902,902$ 18,902,902$

WSDOT Toll Division Annual Report Fiscal Year 2017
49
NOTES TO THE STATEMENT OF REVENUES, EXPENDITURES, AND CHANGES IN FUND BALANCE WASHINGTON STATE DEPARTMENT OF TRANSPORTATION
INTERSTATE 405 ACCOUNT STATE FISCAL YEAR 2017, QUARTER ENDED JUNE 30, 2017
2
Detailed Notes 1. Toll Revenue – Revenue earned, net of any adjustments, from tolls on vehicles traveling in the I 405 express toll lanes,
which are collected by either Good To Go! electronic toll accounts or pay-by-mail.
2. Civil Penalty- Revenue earned when any of the following conditions exist: (a) Payment of Notice of Civil Penalty is received, or (b) Notice of Civil Penalty payment due date passes without receiving a request for an administrative hearing, or (c) an Administrative Law Judge upholds the Notice of Civil Penalty.
3. Transponder Sales – Sales of transponder devices to potential and existing Good To Go! electronic toll account customers.
4. Toll Vendor Contractual Damages – Charges to ETCC for not meeting Key Performance Indicators (KPIs).
5. Toll Bill Reprocessing Fee Revenue – The allocated portion of fees associated with the issuance of second toll billings.
6. Miscellaneous Revenue – This can include revenue for administrative and statement fees, NSF check fees, cash over, payments related to sale of surplus property, and prior period recoveries.
7. Toll CSC Operations Vendor Contract – Payment for monthly CSC operations costs.
8. Transponder Cost of Goods Sold – Cost of purchasing, packaging, and shipping transponders. Transponder Cost of Goods Sold is directly related to Transponder Sales Revenue.
9. The Washington State Patrol – Support for the enforcement of the laws governing the use of 405 Express Toll Lanes by issuing citations to 405 violators.
10. Other Goods and Services – Expenditures for supplies, communications, rents, repairs, services provided by outside vendors, printing, and registered owner look up costs.
11. Personal Service Contracts – Expenditures incurred for traffic and revenue forecast consulting and CSC operations consulting.
12. Civil Penalty Adjudication Costs – I-405’s share of the adjudication system vendor contract with ETCC for the adjudication system module, as well as its share of supplies, communications, credit card fees, Office of Administrative Hearings costs, and salaries and benefits of WSDOT staff.
50
Washington State Department of Transportation

For more information
Title VI Notice to Public It is the Washington State Department of Transportation’s (WSDOT) policy to assure that no person shall, on the grounds of race, color, national origin or sex, as provided by Title VI of the Civil Rights Act of 1964, be excluded from participation in, be denied the benefits of, or be otherwise discriminated against under any of its federally funded programs and activities. Any person who believes his/her Title VI protection has been violated, may file a complaint with WSDOT’s Office of Equal Opportunity (OEO). For additional information regarding Title VI complaint procedures and/or information regarding our non-discrimination obligations, please contact OEO’s Title VI Coordinator at (360) 705-7090.
Americans with Disabilities Act (ADA) Information This material can be made available in an alternate format by emailing the WSDOT Diversity/ADA Affairs team at [email protected] or by calling toll free, 855-362-4ADA(4232). Persons who are deaf or hard of hearing may make a request by calling the Washington State Relay at 711.
17-10-0398
Good To Go!www.GoodToGo.com
Ed Barry Director, Toll Division

Get home faster. Express Toll Lanes
GoodToGo405.org


![TOLLING POWER PURCHASE AGREEMENT · tolling power purchase agreement between pacific gas and electric company (as “buyer”) and [_____] (as “seller”) pro forma tolling agreement](https://img.dokumen.tips/doc/110x75/600f7ba3bb2c0b530608eb45/tolling-power-purchase-agreement-tolling-power-purchase-agreement-between-pacific.jpg)