Embed Size (px)
Citation preview
Interstate 80 Tolling Feasibility Study
Phase 2
Final Report DRAFT
Prepared by:
Parsons Brinckerhoff
September 25, 2009
Prepared For:
Wyoming Department of Transportation
Wyoming Department of Transportation
Phase 2 I-80 Tolling Feasibility Study
i
Table of Contents
Executive Summary ........................................................................................... 1
Introduction ....................................................................................................... 6
1.1 Consulting Engagement ........................................................................................................... 6
1.2 Phase 2 Methodology .............................................................................................................. 7
1.3 Corridor Description ................................................................................................................ 7
2 The Roadway Concept ................................................................................ 12
2.1 Costing Methodology ............................................................................................................. 12
2.2 Capital Cost Estimate ............................................................................................................ 14
3 The Tolling Concept .................................................................................... 16
3.1 Tolling Point Locations........................................................................................................... 16
3.2 Tolling Technology ................................................................................................................ 17
3.3 Emerging Tolling Technologies ............................................................................................... 21
3.4 Interoperability ..................................................................................................................... 23
4 Refinement of Traffic and Revenue Analysis ............................................. 25
4.1 Fuel Price Revision ................................................................................................................ 25
4.2 Major Diversion Route Assumption Revisions .......................................................................... 26
4.3 Revised I-80 Traffic Forecasts ................................................................................................ 27
4.4 Updated Base Case Revenue Forecast .................................................................................... 30
4.5 Alternate Tolling Scenarios .................................................................................................... 33
4.6 Sensitivity Analysis ................................................................................................................ 36
5 Multi-State Corridor Coalitions .................................................................. 40
6 Fiscal and Other Impacts Analysis ............................................................. 43
6.1 State Revenue Impacts ......................................................................................................... 43
6.2 Local Revenue Impacts ......................................................................................................... 46
6.3 Federal Funding Impacts ....................................................................................................... 47
6.4 Roadway Maintenance Outlays............................................................................................... 48
6.5 Local Business Impacts ......................................................................................................... 49
6.6 Construction Impacts ............................................................................................................ 52
6.7 Total Fiscal Impacts by Year .................................................................................................. 55
7 Construction Business Cycles ..................................................................... 56
7.1 US Construction Economy ...................................................................................................... 56
Drivers of Recent Growth in U.S. Construction Costs ............................................................... 56
7.2 Construction Escalation and Business Cycles ........................................................................... 58
7.3 Project Specific Cost Drivers .................................................................................................. 60
Wyoming Department of Transportation
Phase 2 I-80 Tolling Feasibility Study
ii
7.4 Construction Cycle Conclusions .............................................................................................. 62
8 Federal Funding Programs ......................................................................... 63
8.1 FHWA Tolling Pilot Programs ................................................................................................. 65
9 Financial Feasibility and Scenarios ............................................................ 67
9.1 Financial Market Changes ...................................................................................................... 67
9.2 Financial Scenarios ................................................................................................................ 67
9.3 Financial Conclusions ............................................................................................................ 70
10 Public Outreach .......................................................................................... 72
Appendix A: Public Comments
Appendix B: Financial Sensitivities
Wyoming Department of Transportation
Phase 2 I-80 Tolling Feasibility Study
1
Executive Summary
Interstate tolling is restricted by FHWA except under certain programs which are generally competitive and otherwise limiting in the number and types of projects that qualify. Solving congestion issues is
usually the reason tolling is implemented, but in the case of I-80 in Wyoming, tolling is being studied as a means to pay for roadway maintenance and possible expansion.
Due to the high proportion of cross-State trucking operations, and the severe roadway wear caused by these trucks, the Wyoming Department of Transportation (WYDOT) is falling behind in maintaining the
condition of the roadway. Federal funding and unsustainable supplements from other State sources are
simply inadequate to pay for the maintenance of I-80.
This feasibility study builds off the previous (Phase 1) study completed in October 2008, and includes a
more detailed overview of the capital needs of the corridor, various tolling technologies and revenue collection processes, financial scenarios, and the results of a public information effort. A brief summary
of the key findings and conclusions of the full study are presented below.
Traffic Growth Will Resume with Trucks Representing More than Half of Total Traffic
Traffic on I-80 has increased steadily over the past 30 years, but declined slightly in 2008 and 2009,
presumably due to the economic downturn being experienced nationally. Average traffic counts from the most recent month available (April) showed an 8.2 percent decrease between 2007 and 2008 and an
additional 5.5 percent decrease between 2008 and 2009. Average daily traffic (ADT) is expected to total
about 12,000 vehicles in 2009, down from 13,400 in 2007.
Traffic growth is expected to return in 2010 and a growth rate averaging 2 percent per year is expected
between 2010 and 2030, resulting in an ADT level of 18,400 in 2030. The distribution of traffic between cars and trucks is expected to be maintained at approximately 50/50 with a slightly higher truck growth
rate, especially after 2020. This traffic growth trend will increase the need for maintenance funding to rehabilitate the I-80 corridor.
The Tolling Concept Focuses on a Single Tolling Point Along I-80
There are several scenarios that vary the tolling approach and the time when tolling would actually begin (i.e. before or after construction). The Base Case assumption is that the roadway would be built in five
segments which would be financed individually at the time construction of each respective segment begins. Tolling (and debt repayment) would begin at the time each individual segment is completed but
at lower initial toll rates that
reflect only the portion of work that has been
completed. In 2025, when the project is completed, the
full toll rate would be collected and full revenue
potential of the facility would
be realized.
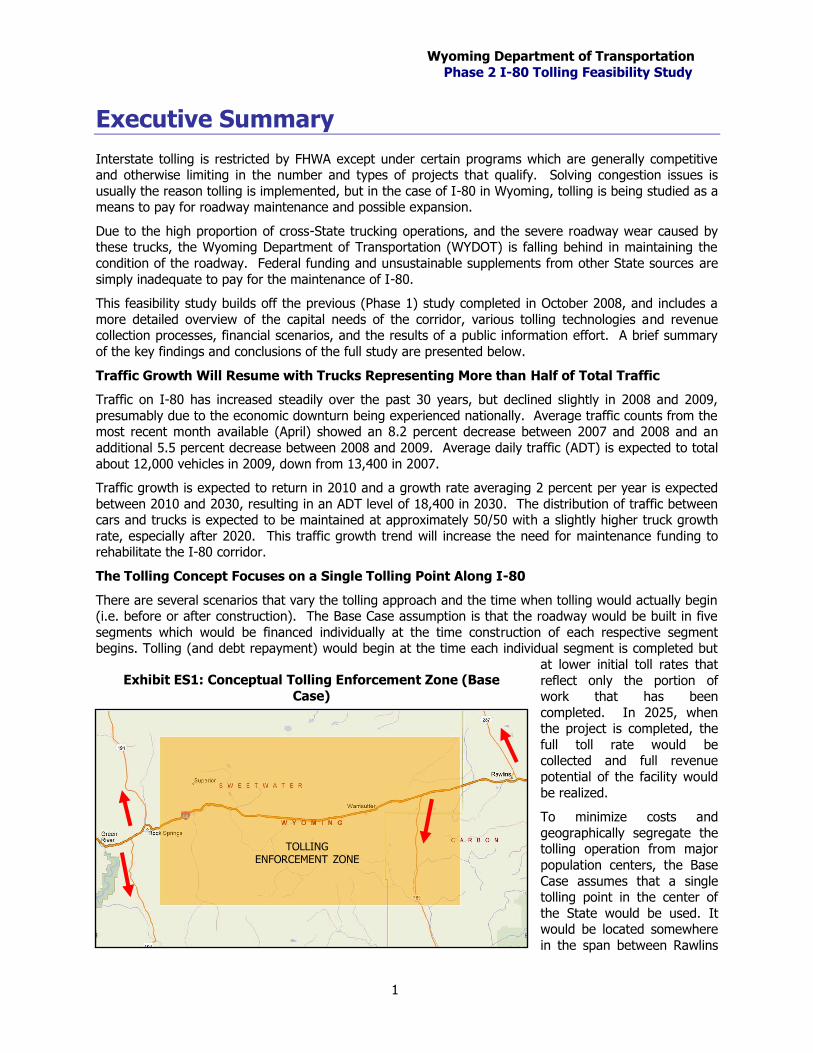
To minimize costs and
geographically segregate the tolling operation from major
population centers, the Base
Case assumes that a single tolling point in the center of
the State would be used. It would be located somewhere
in the span between Rawlins
TOLLING ENFORCEMENT ZONE
Exhibit ES1: Conceptual Tolling Enforcement Zone (Base
Case)
Wyoming Department of Transportation
Phase 2 I-80 Tolling Feasibility Study
2
and Rock Springs, which is largely unpopulated. The Base Case incorporates a tolling enforcement zone
to reduce or eliminate truck diversion around the tolling point using local roads.
Within this zone, denoted by the orange shaded area in Exhibit ES1, trucks would be restricted to
Interstates, US Highways, or certain Wyoming State Routes. These limitations could be imposed by weight restrictions on local roads. While the option will exist, these diversion routes are not likely to be
considered cost effective by truckers versus paying the toll.
Electronic tolling is assumed to be used on the I-80 facility without manual cash collections at toll booths. This approach is now commonly deployed on new toll facilities, and the technology options are expected
to be further advanced by the time the I-80 toll facility could be implemented. Current technologies include transponders, license plate photography, character recognition, vehicle class recognition, and the
use of flexible payment options (payment by toll system account, internet, cell phone, rest stop kiosk, or mail). An all-electronic system will reduce the operating cost of the facility by eliminating the need for
manned toll booths. It will improve the efficiency of the tolling point by keeping traffic moving at
highway speeds and improve safety at the tolling point by eliminating the need to slow down and change lanes as drivers approach the tolling point.
Local, State, and Federal Funding Impacts1
An analysis of impacts to other Federal funding that would likely result from tolling revealed that Federal
funding levels, due to certain provisions in the current Federal highway bill (SAFETEA-LU), would remain
largely unchanged. Federal funding received by Wyoming for interstate maintenance would no longer be available for use on I-80, but these funds could be used on other interstates in Wyoming or transferred
to other roadway funding programs.
State gasoline taxes would be negatively impacted by lower fuel sales resulting from toll diversion, and
due to the trickle down of these revenues to counties and cities, local budgets would also be impacted. The State would most likely attempt to make local governments whole by supplementing their revenues
by the estimated amount lost due to tolling.
PB’s analysis of gas tax impacts indicates that, statewide, about $1 million in gasoline and vehicle fees would be lost in the first year of tolling due to diversion of vehicles to out-of-state routes. This annual
loss would grow to $6.3 million by 2025, equating to a drop of between 4 and 5 percent. In total, the 23 Wyoming counties share 27.5 percent of State gasoline and 20 percent of diesel tax receipts, while
municipalities receive 5 percent of diesel and 15 percent of State gasoline taxes. Therefore, county and
city allocations would be reduced by approximately $1.1 and $0.5 million annually, respectively, in 2025.
State sales tax would decline by $0.8 million in the first year of tolling operations due to diversion to out-
of-state routes. This loss to the State would expand to $5.2 million in 2025, equating to a 1.2 percent decline. Local general purpose, local specific, and local lodging taxes would also see some declines.
Certain long-term job gains would be dampened due to toll diversion limiting economic growth in the
corridor. Over time, 1,700 jobs would be foregone, mainly in industries serving traffic on I-80, including convenience stores, restaurants, vehicle parts suppliers, vehicle repair shops, hotels, trailer parks, and
other lodging businesses.
During construction, the State could be expected to gain over 4,100 new workers, mainly in the
construction and engineering sectors, but also in many other industries, resulting from induced spending by the people working directly on the project. These represent temporary jobs directly related to the
expansion project.
Public Outreach
A public information dissemination and collection campaign was held as part of the analysis to provide
the public with accurate information about the Study and gather public comments on the tolling concepts.
1 Economic impacts discussed in this section reflect diversion at the revenue maximizing toll rate (Base Case) described below.
Wyoming Department of Transportation
Phase 2 I-80 Tolling Feasibility Study
3
Five public meetings were held in cities and towns across the I-80 corridor in June of 2009, including
Cheyenne, Laramie, Rawlins, Rock Springs, and Evanston. Responding to sentiment that northern residents of the State were not easily able to attend the meetings held in the I-80 corridor, two additional
meetings were held in July in Casper and Gillette.
The meetings generally consisted of a short presentation on the Study’s background and the tolling
concepts being evaluated, followed by a question and answer session between WYDOT and Study staff
and the meeting attendees. Survey forms and other feedback tools were presented to attendees to maximize the avenues through which people could provide comments and access project information.
The majority of the comments and letters expressed concern over the concept of tolling I-80, the effects tolling would have on local economies, and the well-being of Wyoming residents. The most common
reasons people cited for being opposed to the tolling concept were:
o The public is already charged a fuel tax to pay for transportation infrastructure. Charging a toll on
I-80 in addition to a fuel tax amounts to double taxation.
o Interstate maintenance needs should be funded by the Federal government, not by the states.
o Trucks that use I-80 will not be able to afford a toll and thus will divert to alternate routes.
o Wyoming residents who use I-80 to travel to work would face undue hardship by paying a toll. This cost should not be borne by individual passenger vehicles, since trucks cause 99 percent of
the damage on I-80.
o Trucks should pay the toll (not passenger vehicles) since they cause most of the roadway damage.
o The cost of tolls will be passed onto consumers through rising costs of consumer products, imposing an additional cost to Wyoming residents above the cost of the highway itself.
o Tourism to Wyoming will be severely impacted if a toll is levied on passenger vehicles.
Expansion Concept Cost
The cost to maintain the roadway could easily be covered by toll revenues on a pay-as-you-go basis,
though an expansion concept where the roadway would be expanded to three lanes in each direction is also being considered. This expansion would necessitate the issuance of toll revenue bonds to pay for
initial construction of the facility.
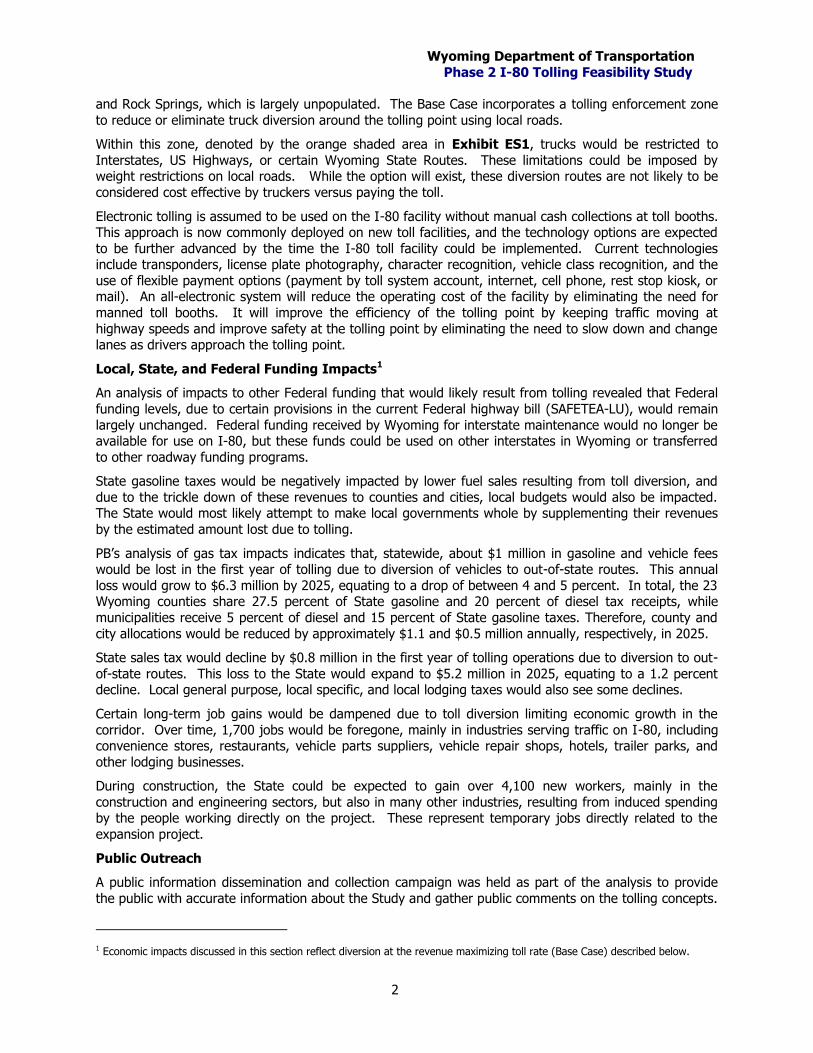
A revised cost estimate was calculated as part of the current phase of study, improving an initial cost
estimate that was part of the Phase 1 Study. At that time, a very cursory estimate, totaling $2.1 billion,
was made using unit cost inputs from WYDOT for the average costs of highway
construction. A more detailed analysis of the corridor was conducted for the current phase
of study, using video of the corridor to
estimate needs for pavement replacement, earthwork, right of way acquisition, and
structures replacement. This more detailed analysis yielded a total project cost of $3.54
billion as illustrated in Exhibit ES2. The project concept contemplated assumes that
construction would take place between 2015
and 2025. Escalating this current year cost to the construction period contemplated
increases the year of expenditure cost to $5.96 billion.
Exhibit ES2: Current Year (2009) Project Cost
Estimate
Wyoming Department of Transportation
Phase 2 I-80 Tolling Feasibility Study
4
Traffic and Revenue
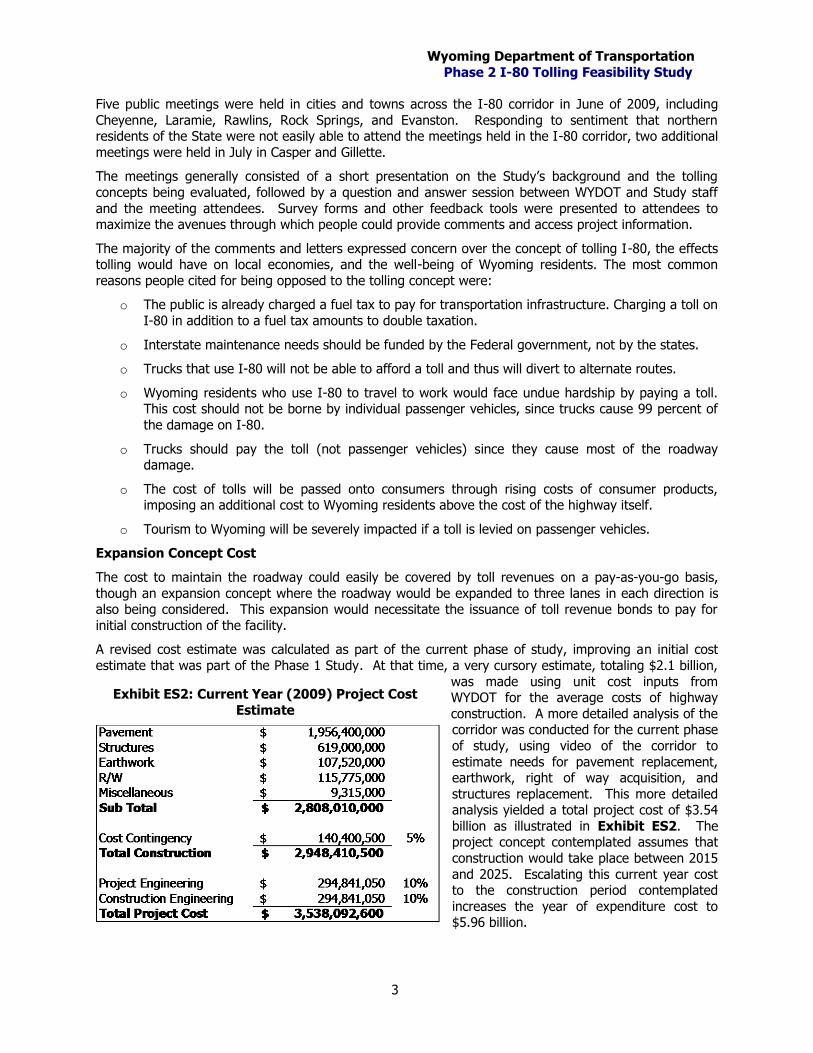
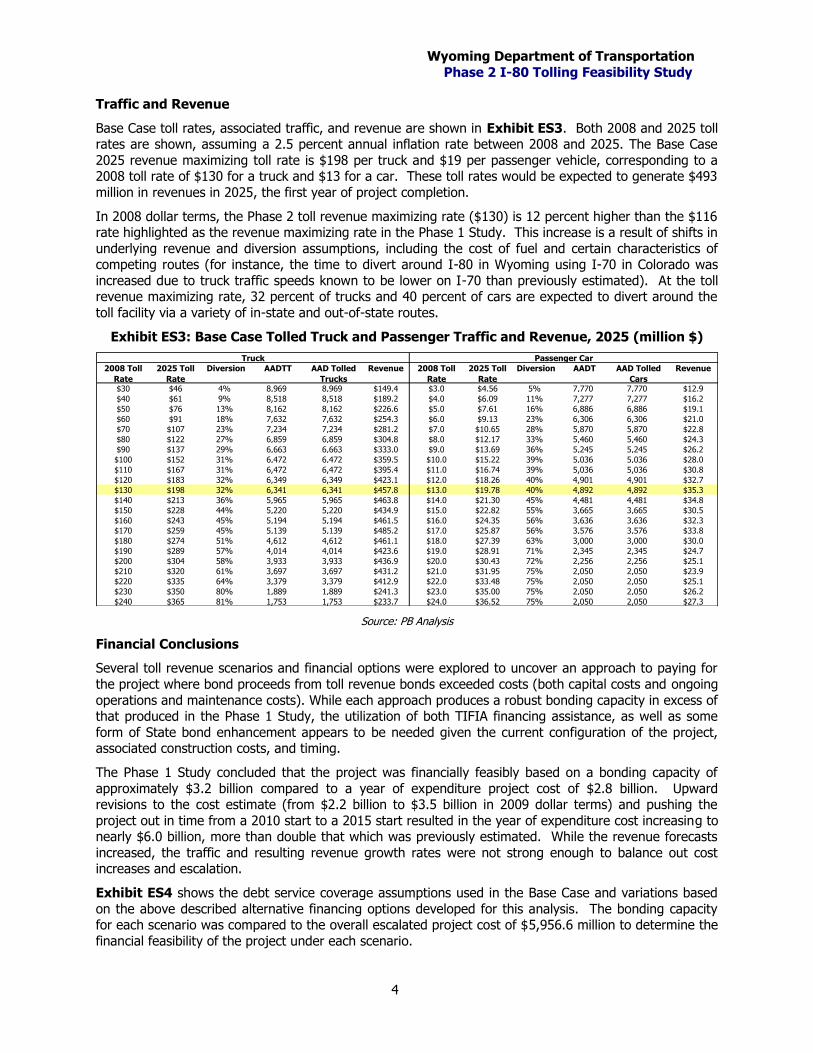
Base Case toll rates, associated traffic, and revenue are shown in Exhibit ES3. Both 2008 and 2025 toll rates are shown, assuming a 2.5 percent annual inflation rate between 2008 and 2025. The Base Case
2025 revenue maximizing toll rate is $198 per truck and $19 per passenger vehicle, corresponding to a 2008 toll rate of $130 for a truck and $13 for a car. These toll rates would be expected to generate $493
million in revenues in 2025, the first year of project completion.
In 2008 dollar terms, the Phase 2 toll revenue maximizing rate ($130) is 12 percent higher than the $116 rate highlighted as the revenue maximizing rate in the Phase 1 Study. This increase is a result of shifts in
underlying revenue and diversion assumptions, including the cost of fuel and certain characteristics of competing routes (for instance, the time to divert around I-80 in Wyoming using I-70 in Colorado was
increased due to truck traffic speeds known to be lower on I-70 than previously estimated). At the toll revenue maximizing rate, 32 percent of trucks and 40 percent of cars are expected to divert around the
toll facility via a variety of in-state and out-of-state routes.
Exhibit ES3: Base Case Tolled Truck and Passenger Traffic and Revenue, 2025 (million $)
2008 Toll
Rate
2025 Toll
Rate
Diversion AADTT AAD Tolled
Trucks
Revenue 2008 Toll
Rate
2025 Toll
Rate
Diversion AADT AAD Tolled
Cars
Revenue
$30 $46 4% 8,969 8,969 $149.4 $3.0 $4.56 5% 7,770 7,770 $12.9
$40 $61 9% 8,518 8,518 $189.2 $4.0 $6.09 11% 7,277 7,277 $16.2
$50 $76 13% 8,162 8,162 $226.6 $5.0 $7.61 16% 6,886 6,886 $19.1
$60 $91 18% 7,632 7,632 $254.3 $6.0 $9.13 23% 6,306 6,306 $21.0
$70 $107 23% 7,234 7,234 $281.2 $7.0 $10.65 28% 5,870 5,870 $22.8
$80 $122 27% 6,859 6,859 $304.8 $8.0 $12.17 33% 5,460 5,460 $24.3
$90 $137 29% 6,663 6,663 $333.0 $9.0 $13.69 36% 5,245 5,245 $26.2
$100 $152 31% 6,472 6,472 $359.5 $10.0 $15.22 39% 5,036 5,036 $28.0
$110 $167 31% 6,472 6,472 $395.4 $11.0 $16.74 39% 5,036 5,036 $30.8
$120 $183 32% 6,349 6,349 $423.1 $12.0 $18.26 40% 4,901 4,901 $32.7
$130 $198 32% 6,341 6,341 $457.8 $13.0 $19.78 40% 4,892 4,892 $35.3
$140 $213 36% 5,965 5,965 $463.8 $14.0 $21.30 45% 4,481 4,481 $34.8
$150 $228 44% 5,220 5,220 $434.9 $15.0 $22.82 55% 3,665 3,665 $30.5
$160 $243 45% 5,194 5,194 $461.5 $16.0 $24.35 56% 3,636 3,636 $32.3
$170 $259 45% 5,139 5,139 $485.2 $17.0 $25.87 56% 3,576 3,576 $33.8
$180 $274 51% 4,612 4,612 $461.1 $18.0 $27.39 63% 3,000 3,000 $30.0
$190 $289 57% 4,014 4,014 $423.6 $19.0 $28.91 71% 2,345 2,345 $24.7
$200 $304 58% 3,933 3,933 $436.9 $20.0 $30.43 72% 2,256 2,256 $25.1
$210 $320 61% 3,697 3,697 $431.2 $21.0 $31.95 75% 2,050 2,050 $23.9
$220 $335 64% 3,379 3,379 $412.9 $22.0 $33.48 75% 2,050 2,050 $25.1
$230 $350 80% 1,889 1,889 $241.3 $23.0 $35.00 75% 2,050 2,050 $26.2
$240 $365 81% 1,753 1,753 $233.7 $24.0 $36.52 75% 2,050 2,050 $27.3
Truck Passenger Car
Source: PB Analysis
Financial Conclusions
Several toll revenue scenarios and financial options were explored to uncover an approach to paying for
the project where bond proceeds from toll revenue bonds exceeded costs (both capital costs and ongoing
operations and maintenance costs). While each approach produces a robust bonding capacity in excess of that produced in the Phase 1 Study, the utilization of both TIFIA financing assistance, as well as some
form of State bond enhancement appears to be needed given the current configuration of the project, associated construction costs, and timing.
The Phase 1 Study concluded that the project was financially feasibly based on a bonding capacity of
approximately $3.2 billion compared to a year of expenditure project cost of $2.8 billion. Upward revisions to the cost estimate (from $2.2 billion to $3.5 billion in 2009 dollar terms) and pushing the
project out in time from a 2010 start to a 2015 start resulted in the year of expenditure cost increasing to nearly $6.0 billion, more than double that which was previously estimated. While the revenue forecasts
increased, the traffic and resulting revenue growth rates were not strong enough to balance out cost increases and escalation.
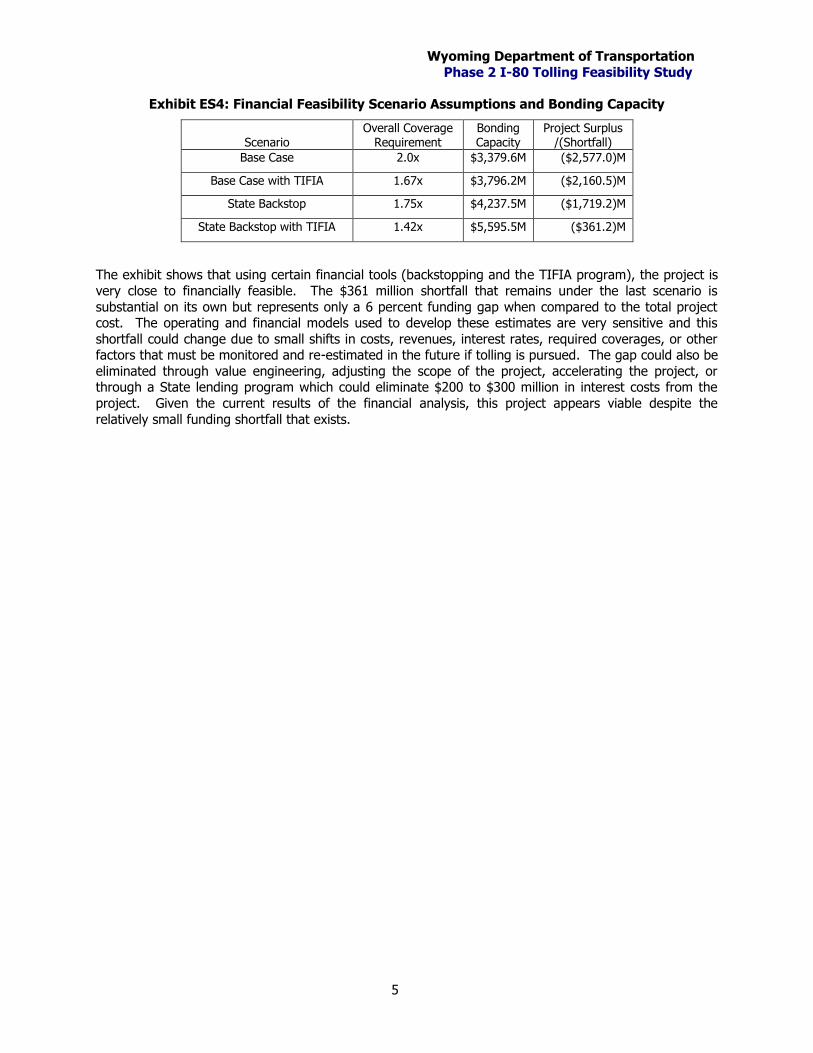
Exhibit ES4 shows the debt service coverage assumptions used in the Base Case and variations based
on the above described alternative financing options developed for this analysis. The bonding capacity for each scenario was compared to the overall escalated project cost of $5,956.6 million to determine the
financial feasibility of the project under each scenario.
Wyoming Department of Transportation
Phase 2 I-80 Tolling Feasibility Study
5
Exhibit ES4: Financial Feasibility Scenario Assumptions and Bonding Capacity
Scenario Overall Coverage
Requirement Bonding Capacity
Project Surplus /(Shortfall)
Base Case 2.0x $3,379.6M ($2,577.0)M
Base Case with TIFIA 1.67x $3,796.2M ($2,160.5)M
State Backstop 1.75x $4,237.5M ($1,719.2)M
State Backstop with TIFIA 1.42x $5,595.5M ($361.2)M
The exhibit shows that using certain financial tools (backstopping and the TIFIA program), the project is
very close to financially feasible. The $361 million shortfall that remains under the last scenario is
substantial on its own but represents only a 6 percent funding gap when compared to the total project cost. The operating and financial models used to develop these estimates are very sensitive and this
shortfall could change due to small shifts in costs, revenues, interest rates, required coverages, or other factors that must be monitored and re-estimated in the future if tolling is pursued. The gap could also be
eliminated through value engineering, adjusting the scope of the project, accelerating the project, or through a State lending program which could eliminate $200 to $300 million in interest costs from the
project. Given the current results of the financial analysis, this project appears viable despite the
relatively small funding shortfall that exists.
Wyoming Department of Transportation
Phase 2 I-80 Tolling Feasibility Study
6
Introduction
1.1 Consulting Engagement
In the fall of 2008, PB completed a Phase 1 tolling study for WYDOT, examining the feasibility of tolling I-
80. This study looked at the functional and financial aspects of the facility within a conceptual framework
and provided an overview of organizational issues including public-private partnership approaches and common structures of public organizations that operate toll roads in the U.S. The study results and
conclusions were captured in a report titled “Interstate-80 Tolling Feasibility Study,” dated October 1, 2008, which was presented to the Joint Interim Transportation, Highways and Military Affairs Committee
of the Wyoming State Legislature at its October 2008 meeting. The main findings from the Phase 1 study were:
1. Tolling of cars and trucks on I-80 appears to generate enough revenue to repay approximately
$3.0 billion in bonds that could be issued to make improvements to the roadway, including widening the road to 3 lanes and maintaining the roadway in perpetuity without Federal
assistance.
2. In order to impose tolls on I-80, WYDOT would need to apply for Federal approval to toll on an
existing, free interstate under one of the Federal interstate tolling pilot programs. The two
programs most likely to accommodate the proposed tolling approach are the Interstate Reconstruction and Rehabilitation Pilot and the Express Lanes Pilot.
3. The State of Wyoming currently does not have laws to guide the creation of a tolling authority or the operation of a facility. Legislation would need to be drafted and put into law prior to any
tolling approach being implemented on I-80.
4. Additional analysis of the project concept is required to better understand the potential cost of the roadway improvements and ongoing operation, the revenue potential and financial feasibility
of the project, and the potential impacts to the State from imposing tolls on I-80.
This Phase 2 study was requested by the Wyoming Legislature as a continuation of the Phase 1 work.
The goal of Phase 2 is to refine portions of the analysis performed in Phase 1, conduct scenario analysis, present the project to the public, and provide additional information on tolling technology that could be
used to implement the project. The specific scope items of the Phase 2 study and abridged descriptions
for each are listed in the following bullets:
1. Refine the roadway concept: Improve the description and cost estimate of the roadway
improvement (specifically the addition of one lane in each direction) and identify safety improvements that expansion and tolling may provide.
2. Refine the tolling concept: Analyze staging for tolling implementation and review the number
and location of tolling points needed to optimize revenue while minimizing operations costs and inconvenience to the public.
3. Fiscal and other impacts analysis: Assess the impacts to Federal and State tax revenues and costs that could arise from tolling.
4. Federal funding impacts: Quantify and outline changes to Federal interstate maintenance funding received by the State and potential impacts to other Federal highway funding allocations
under a tolling scenario.
5. Refine financing scenarios: Review all financing assumptions in light of the current economic downturn and revisions to credit criteria that will impact the project if financed.
6. Public outreach: Present tolling concepts, including information gathered in the first phase of study, to the public through outreach and educational meetings.
Wyoming Department of Transportation
Phase 2 I-80 Tolling Feasibility Study
7
7. Review of tolling technology: Provide information on the most recent developments in tolling
technology and potential implementation strategies for using these technologies on I-80, especially as they pertain to trucks, through-traffic, and possible interfacing with ports of entry
and gasoline use tracking systems.
This Final Report contains information and analysis pertaining to several of the tasks but additional
analysis is required before the report is finalized in October of 2009. The study team will present its
findings at the October 2009 meeting of the Joint Interim Transportation, Highways and Military Affairs Committee meeting.
1.2 Phase 2 Methodology
The Phase 2 study is being carried out by the same team that performed Phase 1, with some additional
support from technical experts in highway design, construction economics and tolling technology. The team has solicited input and validation from WYDOT, FHWA, and other PB technical experts whenever
possible to maintain reasonableness in all assumptions despite some inferences and estimates being unavoidable.
1.3 Corridor Description
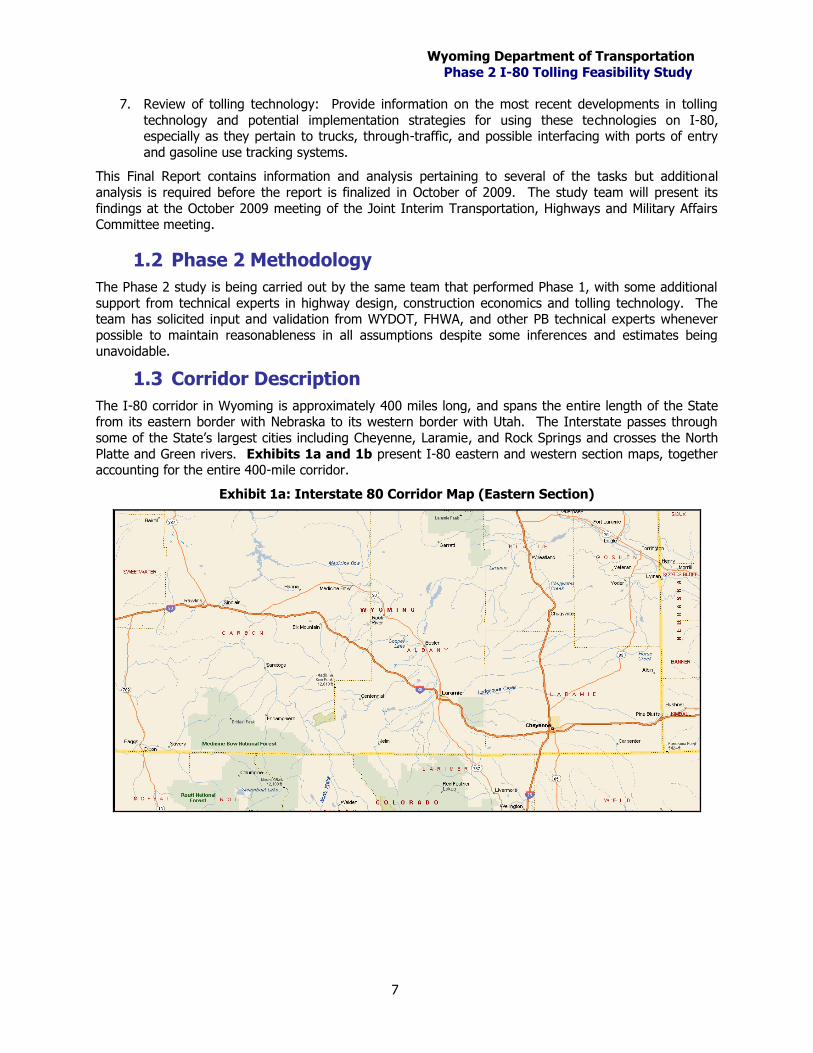
The I-80 corridor in Wyoming is approximately 400 miles long, and spans the entire length of the State from its eastern border with Nebraska to its western border with Utah. The Interstate passes through
some of the State’s largest cities including Cheyenne, Laramie, and Rock Springs and crosses the North
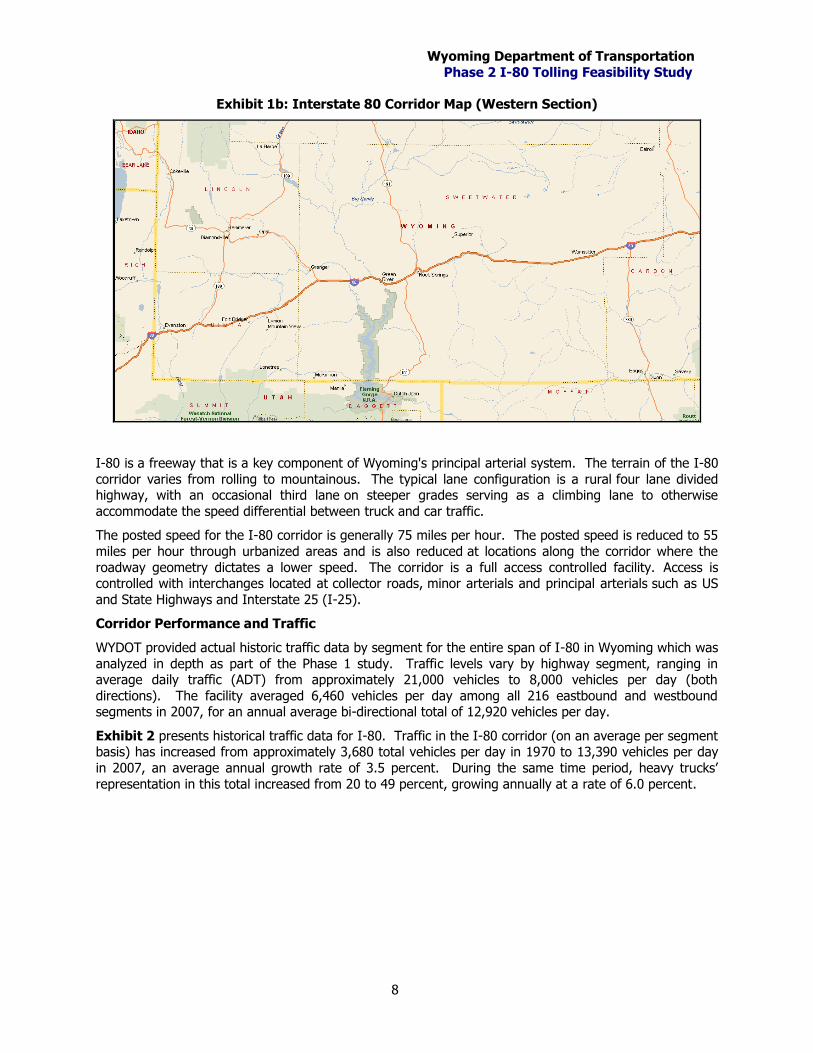
Platte and Green rivers. Exhibits 1a and 1b present I-80 eastern and western section maps, together accounting for the entire 400-mile corridor.
Exhibit 1a: Interstate 80 Corridor Map (Eastern Section)
Wyoming Department of Transportation
Phase 2 I-80 Tolling Feasibility Study
8
Exhibit 1b: Interstate 80 Corridor Map (Western Section)
I-80 is a freeway that is a key component of Wyoming's principal arterial system. The terrain of the I-80
corridor varies from rolling to mountainous. The typical lane configuration is a rural four lane divided highway, with an occasional third lane on steeper grades serving as a climbing lane to otherwise
accommodate the speed differential between truck and car traffic.
The posted speed for the I-80 corridor is generally 75 miles per hour. The posted speed is reduced to 55
miles per hour through urbanized areas and is also reduced at locations along the corridor where the
roadway geometry dictates a lower speed. The corridor is a full access controlled facility. Access is controlled with interchanges located at collector roads, minor arterials and principal arterials such as US
and State Highways and Interstate 25 (I-25).
Corridor Performance and Traffic
WYDOT provided actual historic traffic data by segment for the entire span of I-80 in Wyoming which was
analyzed in depth as part of the Phase 1 study. Traffic levels vary by highway segment, ranging in average daily traffic (ADT) from approximately 21,000 vehicles to 8,000 vehicles per day (both
directions). The facility averaged 6,460 vehicles per day among all 216 eastbound and westbound segments in 2007, for an annual average bi-directional total of 12,920 vehicles per day.
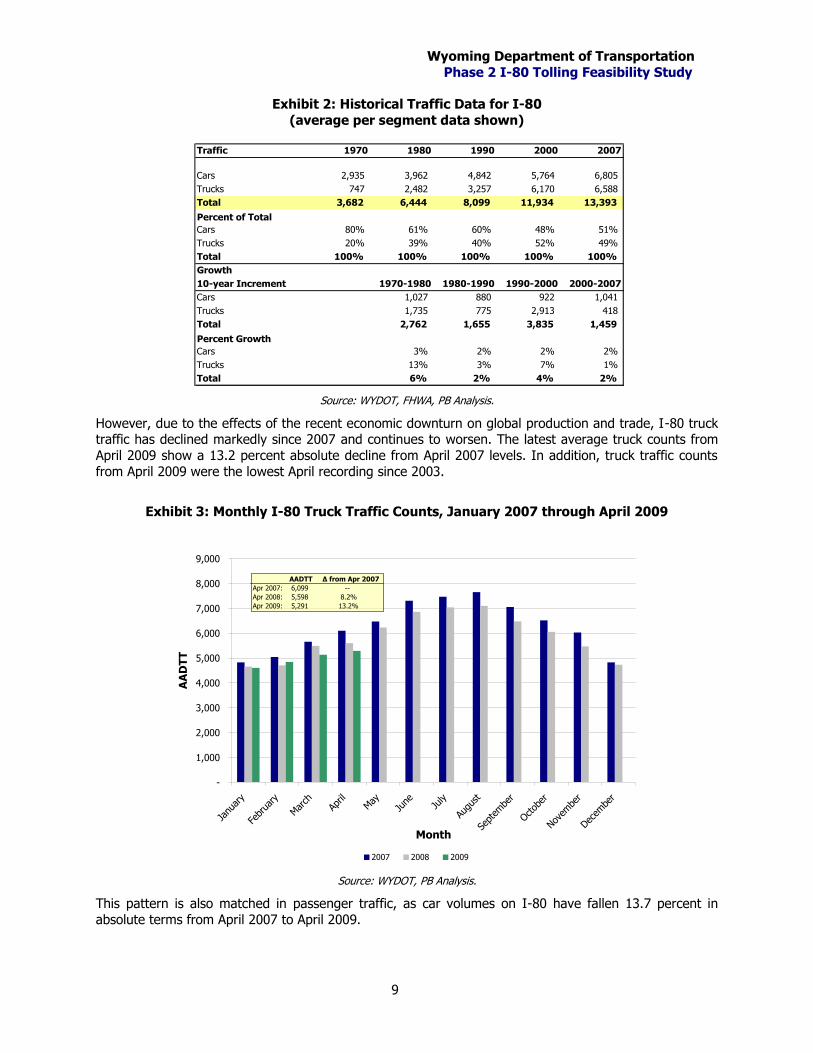
Exhibit 2 presents historical traffic data for I-80. Traffic in the I-80 corridor (on an average per segment basis) has increased from approximately 3,680 total vehicles per day in 1970 to 13,390 vehicles per day
in 2007, an average annual growth rate of 3.5 percent. During the same time period, heavy trucks’
representation in this total increased from 20 to 49 percent, growing annually at a rate of 6.0 percent.
Wyoming Department of Transportation
Phase 2 I-80 Tolling Feasibility Study
9
Exhibit 2: Historical Traffic Data for I-80
(average per segment data shown)
Traffic 1970 1980 1990 2000 2007
Cars 2,935 3,962 4,842 5,764 6,805
Trucks 747 2,482 3,257 6,170 6,588
Total 3,682 6,444 8,099 11,934 13,393
Percent of Total
Cars 80% 61% 60% 48% 51%
Trucks 20% 39% 40% 52% 49%
Total 100% 100% 100% 100% 100%
Growth
10-year Increment 1970-1980 1980-1990 1990-2000 2000-2007
Cars 1,027 880 922 1,041
Trucks 1,735 775 2,913 418
Total 2,762 1,655 3,835 1,459
Percent Growth
Cars 3% 2% 2% 2%
Trucks 13% 3% 7% 1%
Total 6% 2% 4% 2%
Source: WYDOT, FHWA, PB Analysis.
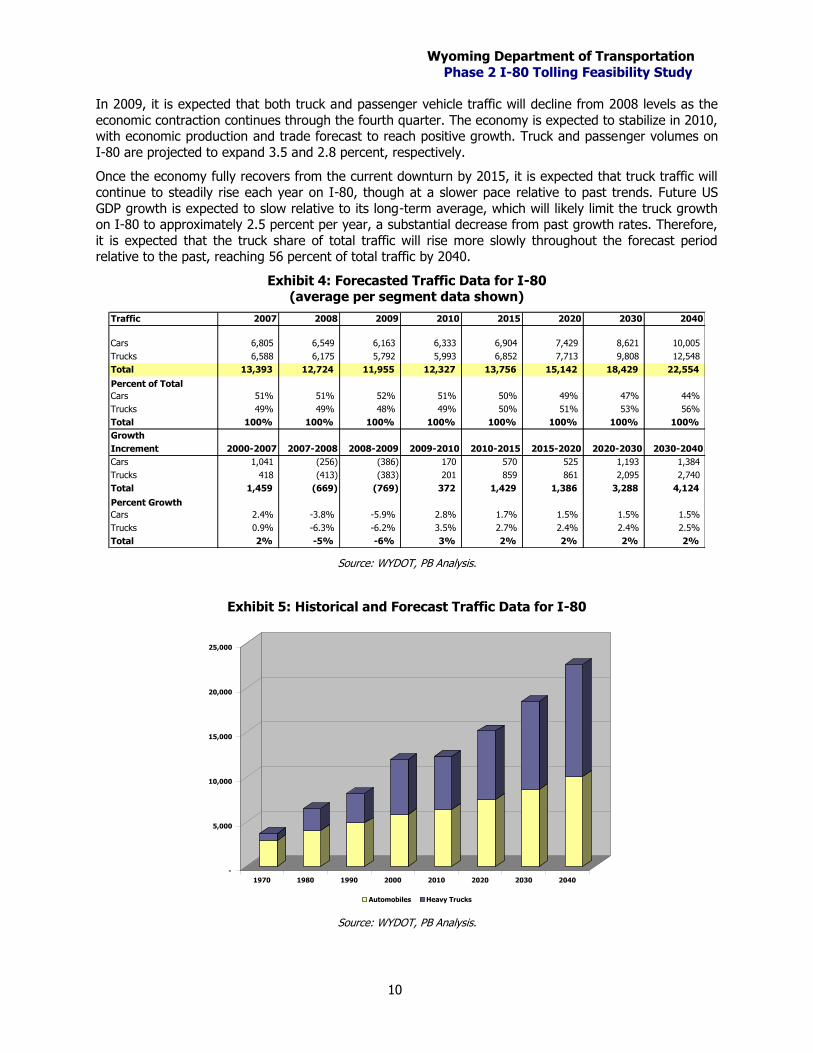
However, due to the effects of the recent economic downturn on global production and trade, I-80 truck traffic has declined markedly since 2007 and continues to worsen. The latest average truck counts from
April 2009 show a 13.2 percent absolute decline from April 2007 levels. In addition, truck traffic counts
from April 2009 were the lowest April recording since 2003.
Exhibit 3: Monthly I-80 Truck Traffic Counts, January 2007 through April 2009
-
1,000
2,000
3,000
4,000
5,000
6,000
7,000
8,000
9,000
Janu
ary
Febr
uary
Mar
chAp
rilMay
June Ju
ly
Augu
st
Sept
embe
r
Octob
er
Novem
ber
Decem
ber
Month
AA
DT
T
2007 2008 2009
AADTT Δ from Apr 2007
Apr 2007: 6,099 --
Apr 2008: 5,598 8.2%
Apr 2009: 5,291 13.2%
Source: WYDOT, PB Analysis.
This pattern is also matched in passenger traffic, as car volumes on I-80 have fallen 13.7 percent in
absolute terms from April 2007 to April 2009.
Wyoming Department of Transportation
Phase 2 I-80 Tolling Feasibility Study
10
In 2009, it is expected that both truck and passenger vehicle traffic will decline from 2008 levels as the
economic contraction continues through the fourth quarter. The economy is expected to stabilize in 2010, with economic production and trade forecast to reach positive growth. Truck and passenger volumes on
I-80 are projected to expand 3.5 and 2.8 percent, respectively.
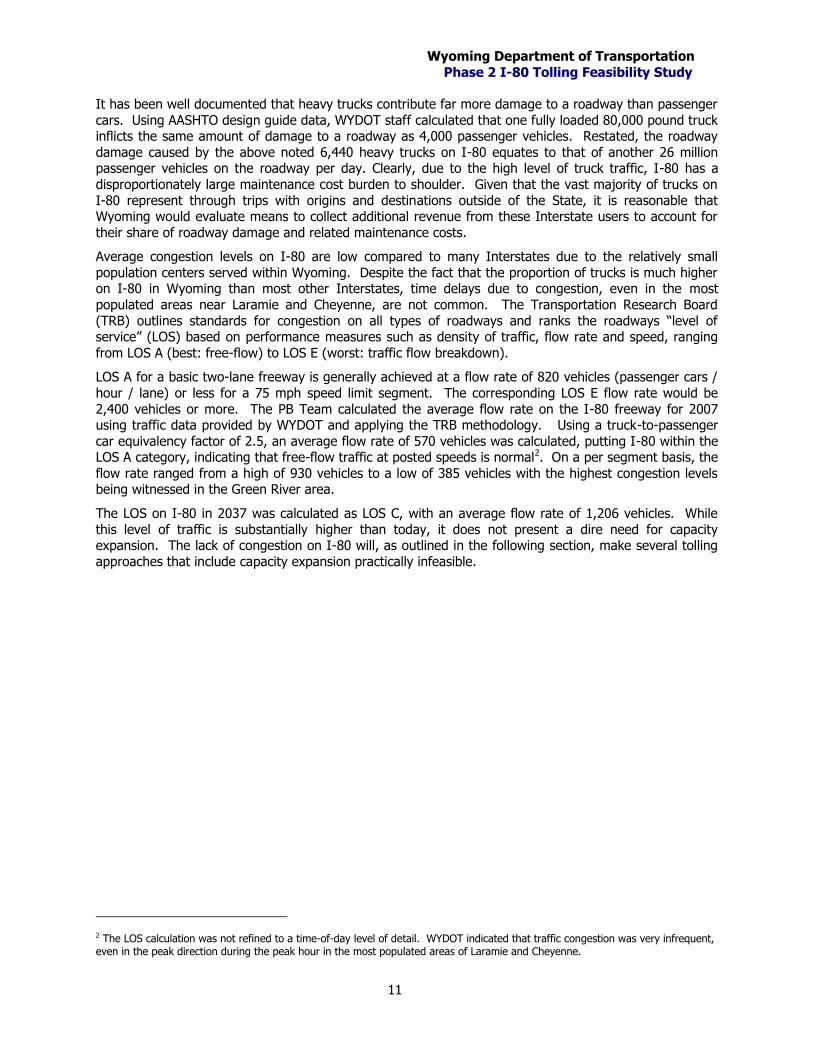
Once the economy fully recovers from the current downturn by 2015, it is expected that truck traffic will
continue to steadily rise each year on I-80, though at a slower pace relative to past trends. Future US
GDP growth is expected to slow relative to its long-term average, which will likely limit the truck growth on I-80 to approximately 2.5 percent per year, a substantial decrease from past growth rates. Therefore,
it is expected that the truck share of total traffic will rise more slowly throughout the forecast period relative to the past, reaching 56 percent of total traffic by 2040.
Exhibit 4: Forecasted Traffic Data for I-80 (average per segment data shown)
Traffic 2007 2008 2009 2010 2015 2020 2030 2040
Cars 6,805 6,549 6,163 6,333 6,904 7,429 8,621 10,005
Trucks 6,588 6,175 5,792 5,993 6,852 7,713 9,808 12,548
Total 13,393 12,724 11,955 12,327 13,756 15,142 18,429 22,554
Percent of Total
Cars 51% 51% 52% 51% 50% 49% 47% 44%
Trucks 49% 49% 48% 49% 50% 51% 53% 56%
Total 100% 100% 100% 100% 100% 100% 100% 100%
Growth
Increment 2000-2007 2007-2008 2008-2009 2009-2010 2010-2015 2015-2020 2020-2030 2030-2040
Cars 1,041 (256) (386) 170 570 525 1,193 1,384
Trucks 418 (413) (383) 201 859 861 2,095 2,740
Total 1,459 (669) (769) 372 1,429 1,386 3,288 4,124
Percent Growth
Cars 2.4% -3.8% -5.9% 2.8% 1.7% 1.5% 1.5% 1.5%
Trucks 0.9% -6.3% -6.2% 3.5% 2.7% 2.4% 2.4% 2.5%
Total 2% -5% -6% 3% 2% 2% 2% 2%
Source: WYDOT, PB Analysis.
Exhibit 5: Historical and Forecast Traffic Data for I-80
-
5,000
10,000
15,000
20,000
25,000
1970 1980 1990 2000 2010 2020 2030 2040
Automobiles Heavy Trucks
Source: WYDOT, PB Analysis.
Wyoming Department of Transportation
Phase 2 I-80 Tolling Feasibility Study
11
It has been well documented that heavy trucks contribute far more damage to a roadway than passenger
cars. Using AASHTO design guide data, WYDOT staff calculated that one fully loaded 80,000 pound truck inflicts the same amount of damage to a roadway as 4,000 passenger vehicles. Restated, the roadway
damage caused by the above noted 6,440 heavy trucks on I-80 equates to that of another 26 million passenger vehicles on the roadway per day. Clearly, due to the high level of truck traffic, I-80 has a
disproportionately large maintenance cost burden to shoulder. Given that the vast majority of trucks on
I-80 represent through trips with origins and destinations outside of the State, it is reasonable that Wyoming would evaluate means to collect additional revenue from these Interstate users to account for
their share of roadway damage and related maintenance costs.
Average congestion levels on I-80 are low compared to many Interstates due to the relatively small
population centers served within Wyoming. Despite the fact that the proportion of trucks is much higher on I-80 in Wyoming than most other Interstates, time delays due to congestion, even in the most
populated areas near Laramie and Cheyenne, are not common. The Transportation Research Board
(TRB) outlines standards for congestion on all types of roadways and ranks the roadways “level of service” (LOS) based on performance measures such as density of traffic, flow rate and speed, ranging
from LOS A (best: free-flow) to LOS E (worst: traffic flow breakdown).
LOS A for a basic two-lane freeway is generally achieved at a flow rate of 820 vehicles (passenger cars /
hour / lane) or less for a 75 mph speed limit segment. The corresponding LOS E flow rate would be
2,400 vehicles or more. The PB Team calculated the average flow rate on the I-80 freeway for 2007 using traffic data provided by WYDOT and applying the TRB methodology. Using a truck-to-passenger
car equivalency factor of 2.5, an average flow rate of 570 vehicles was calculated, putting I-80 within the LOS A category, indicating that free-flow traffic at posted speeds is normal2. On a per segment basis, the
flow rate ranged from a high of 930 vehicles to a low of 385 vehicles with the highest congestion levels being witnessed in the Green River area.
The LOS on I-80 in 2037 was calculated as LOS C, with an average flow rate of 1,206 vehicles. While
this level of traffic is substantially higher than today, it does not present a dire need for capacity expansion. The lack of congestion on I-80 will, as outlined in the following section, make several tolling
approaches that include capacity expansion practically infeasible.
2 The LOS calculation was not refined to a time-of-day level of detail. WYDOT indicated that traffic congestion was very infrequent, even in the peak direction during the peak hour in the most populated areas of Laramie and Cheyenne.
Wyoming Department of Transportation
Phase 2 I-80 Tolling Feasibility Study
12
2 The Roadway Concept The Phase 1 Study looked only briefly at the roadway capital costs, providing a very high level estimate of the Project’s cost under various scenarios. The Phase 1 Study suggested that expanding the roadway to
three lanes in each direction would cost approximately $2.1 billion in 2009 dollars, with a total estimated year of expenditure cost of $2.8 billion assuming a 10-year build beginning in 2010 and 5 percent
escalation per annum.
As part of the Phase 2 Study, a more detailed cost analysis was performed. Actual road conditions were
examined using video data recorded by WYDOT in August and September of 2008 for the entire length of
I-80 in Wyoming, both east and west-bound. In conjunction with additional data provided by WYDOT, including pavement age, material, lane configurations, and median widths, the corridor was organized
into discreet segments to refine the construction costs. A Base Case scenario cost estimate was then developed, consisting of expanding the roadway to three lanes in each direction and rebuilding portions
of the existing roadway that will be in need of rehabilitation.
2.1 Costing Methodology
This analysis was performed by, first, dividing the roadway into segments. The segments vary in length,
from as short as 3 miles to as long as 75 miles, and were formed primarily based on by major changes in
the roadway material and/or condition, the existing right-of-way width, or the need for large amounts of cut or fill material.
WYDOT provided initial per-mile construction costs for six different proposed typical sections. The six typical sections offered were alternatives for improvements; ranging from simple overlays and/or
widening for existing pavement in good condition, to full-depth / full-width reconstruction for existing
pavement in need of replacement. The initial cost estimates ranged from $1.7 million per mile of roadway to $3.8 million per mile of roadway.
Using the collection of segments from the visual analysis, a cost for pavement reconstruction / rehabilitation per mile for each segment was developed based on the condition of the existing roadway
and the typical section expected to be used for the pavement in that given segment. In the analysis, PB used the per-mile cost estimates from WYDOT, applied appropriately to the differing levels of existing
pavement conditions.
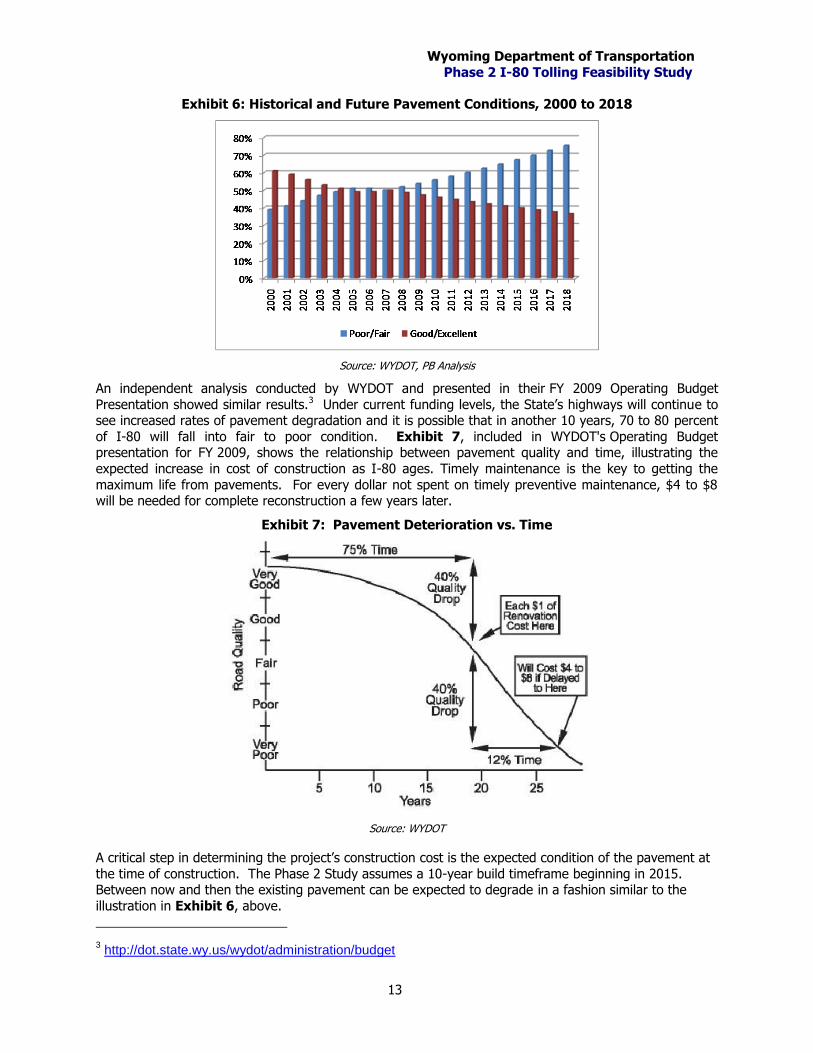
Exhibit 6 shows the breakdown of historical pavement conditions along the corridor based WYDOT analysis of good / excellent vs. poor / fair pavement. The exhibit shows that currently, about half of the
pavement is in good or excellent condition. Upon extending the trends that occurred between 2000 and 2008, the exhibit shows that a significant majority of the roadway falls in the poor / fair category within
ten years.
Wyoming Department of Transportation
Phase 2 I-80 Tolling Feasibility Study
13
Exhibit 6: Historical and Future Pavement Conditions, 2000 to 2018
Source: WYDOT, PB Analysis
An independent analysis conducted by WYDOT and presented in their FY 2009 Operating Budget
Presentation showed similar results.3 Under current funding levels, the State’s highways will continue to see increased rates of pavement degradation and it is possible that in another 10 years, 70 to 80 percent
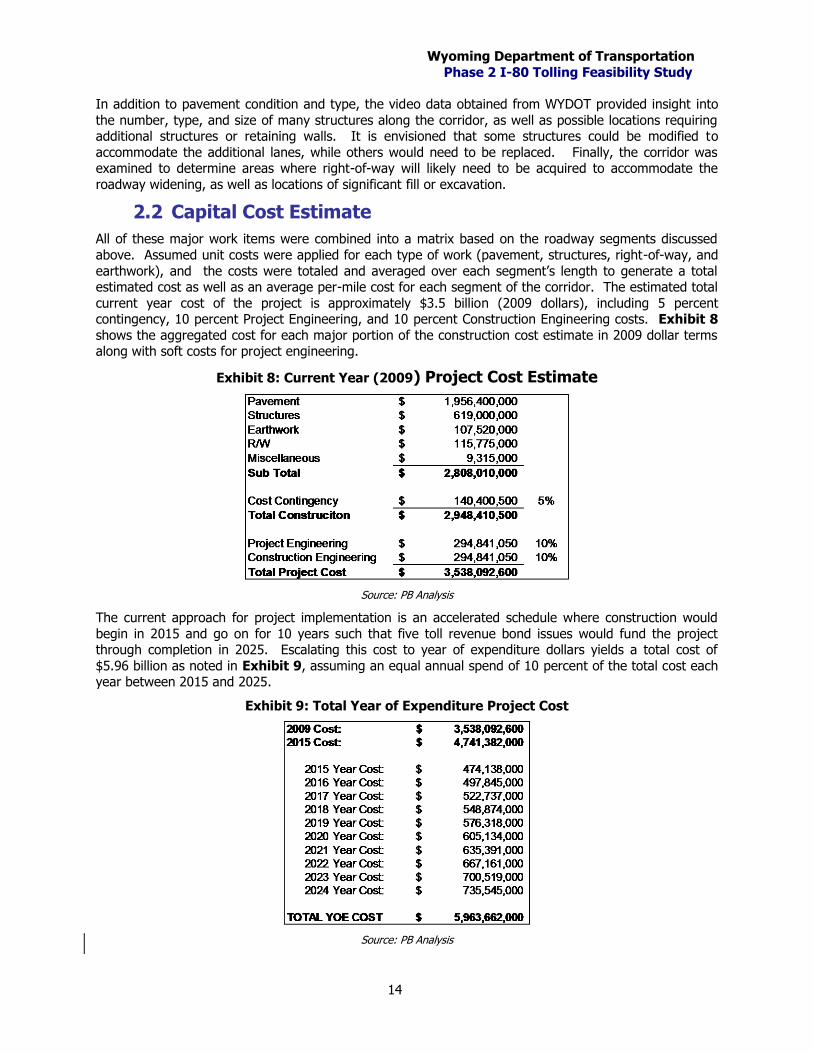
of I-80 will fall into fair to poor condition. Exhibit 7, included in WYDOT's Operating Budget presentation for FY 2009, shows the relationship between pavement quality and time, illustrating the
expected increase in cost of construction as I-80 ages. Timely maintenance is the key to getting the
maximum life from pavements. For every dollar not spent on timely preventive maintenance, $4 to $8 will be needed for complete reconstruction a few years later.
Exhibit 7: Pavement Deterioration vs. Time
Source: WYDOT
A critical step in determining the project’s construction cost is the expected condition of the pavement at
the time of construction. The Phase 2 Study assumes a 10-year build timeframe beginning in 2015. Between now and then the existing pavement can be expected to degrade in a fashion similar to the
illustration in Exhibit 6, above.
3 http://dot.state.wy.us/wydot/administration/budget
Wyoming Department of Transportation
Phase 2 I-80 Tolling Feasibility Study
14
In addition to pavement condition and type, the video data obtained from WYDOT provided insight into
the number, type, and size of many structures along the corridor, as well as possible locations requiring additional structures or retaining walls. It is envisioned that some structures could be modified to
accommodate the additional lanes, while others would need to be replaced. Finally, the corridor was examined to determine areas where right-of-way will likely need to be acquired to accommodate the
roadway widening, as well as locations of significant fill or excavation.
2.2 Capital Cost Estimate
All of these major work items were combined into a matrix based on the roadway segments discussed
above. Assumed unit costs were applied for each type of work (pavement, structures, right-of-way, and
earthwork), and the costs were totaled and averaged over each segment’s length to generate a total estimated cost as well as an average per-mile cost for each segment of the corridor. The estimated total
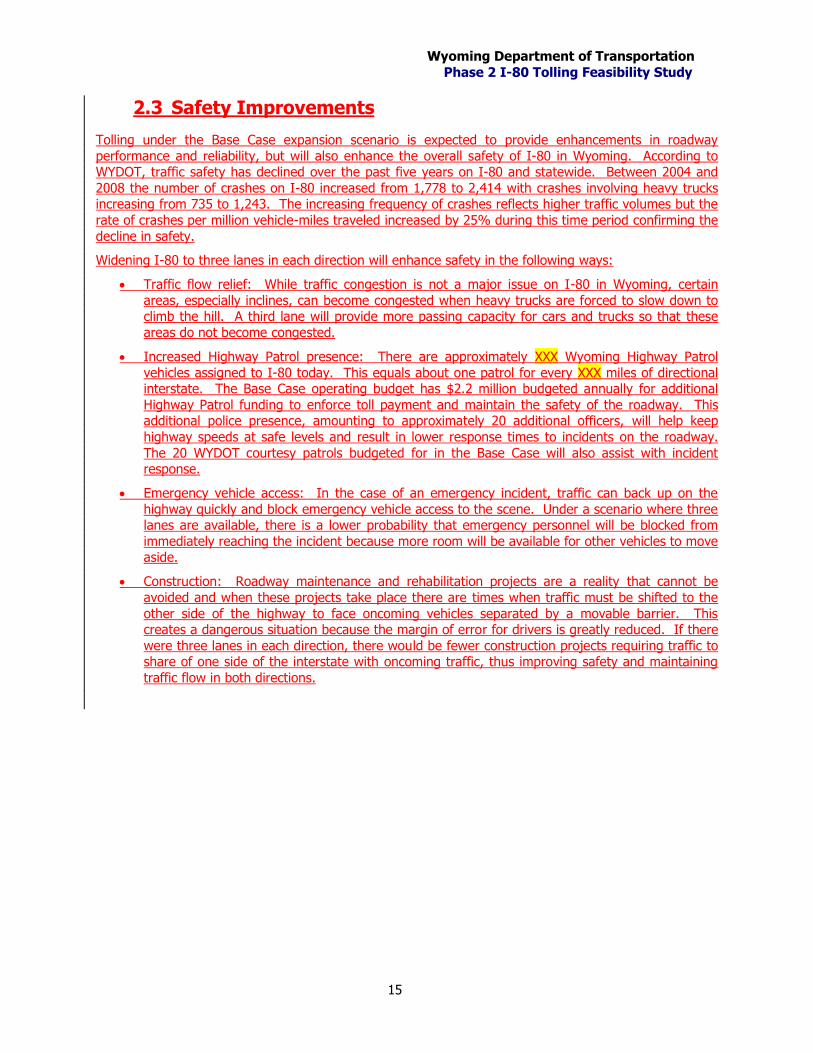
current year cost of the project is approximately $3.5 billion (2009 dollars), including 5 percent contingency, 10 percent Project Engineering, and 10 percent Construction Engineering costs. Exhibit 8
shows the aggregated cost for each major portion of the construction cost estimate in 2009 dollar terms along with soft costs for project engineering.
Exhibit 8: Current Year (2009) Project Cost Estimate
Source: PB Analysis
The current approach for project implementation is an accelerated schedule where construction would
begin in 2015 and go on for 10 years such that five toll revenue bond issues would fund the project through completion in 2025. Escalating this cost to year of expenditure dollars yields a total cost of
$5.96 billion as noted in Exhibit 9, assuming an equal annual spend of 10 percent of the total cost each year between 2015 and 2025.
Exhibit 9: Total Year of Expenditure Project Cost
Source: PB Analysis
Wyoming Department of Transportation
Phase 2 I-80 Tolling Feasibility Study
15
2.3 Safety Improvements
Tolling under the Base Case expansion scenario is expected to provide enhancements in roadway
performance and reliability, but will also enhance the overall safety of I-80 in Wyoming. According to WYDOT, traffic safety has declined over the past five years on I-80 and statewide. Between 2004 and
2008 the number of crashes on I-80 increased from 1,778 to 2,414 with crashes involving heavy trucks increasing from 735 to 1,243. The increasing frequency of crashes reflects higher traffic volumes but the
rate of crashes per million vehicle-miles traveled increased by 25% during this time period confirming the
decline in safety.
Widening I-80 to three lanes in each direction will enhance safety in the following ways:
Traffic flow relief: While traffic congestion is not a major issue on I-80 in Wyoming, certain
areas, especially inclines, can become congested when heavy trucks are forced to slow down to climb the hill. A third lane will provide more passing capacity for cars and trucks so that these
areas do not become congested.
Increased Highway Patrol presence: There are approximately XXX Wyoming Highway Patrol
vehicles assigned to I-80 today. This equals about one patrol for every XXX miles of directional interstate. The Base Case operating budget has $2.2 million budgeted annually for additional
Highway Patrol funding to enforce toll payment and maintain the safety of the roadway. This additional police presence, amounting to approximately 20 additional officers, will help keep
highway speeds at safe levels and result in lower response times to incidents on the roadway.
The 20 WYDOT courtesy patrols budgeted for in the Base Case will also assist with incident response.
Emergency vehicle access: In the case of an emergency incident, traffic can back up on the
highway quickly and block emergency vehicle access to the scene. Under a scenario where three lanes are available, there is a lower probability that emergency personnel will be blocked from
immediately reaching the incident because more room will be available for other vehicles to move aside.
Construction: Roadway maintenance and rehabilitation projects are a reality that cannot be
avoided and when these projects take place there are times when traffic must be shifted to the
other side of the highway to face oncoming vehicles separated by a movable barrier. This creates a dangerous situation because the margin of error for drivers is greatly reduced. If there
were three lanes in each direction, there would be fewer construction projects requiring traffic to share of one side of the interstate with oncoming traffic, thus improving safety and maintaining
traffic flow in both directions.
Wyoming Department of Transportation
Phase 2 I-80 Tolling Feasibility Study
16
3 The Tolling Concept Despite its 400-mile length, I-80 in Wyoming is a somewhat simple roadway from a traffic analysis perspective due to the relatively few access points and small local populations being served. On a
national scale, Wyoming and neighboring states form a ‘bridge’ allowing truck traffic to flow between
west coast port cities and the Midwest. I-80 provides access to other perpendicular highways in Wyoming including I-25, US 287, US 191, and US 189 which lead to northern and central parts of the
State, but the majority of truck traffic on I-80 is part of a larger east-west trip.
On a local level, I-80 provides connections between several more heavily populated areas, including
Evanston, Green River, Rock Springs, Rawlins, Laramie, and Cheyenne. Despite being spread out along the Corridor, daily commutes do occur between these places. Current passenger traffic is generally light
and is not expected to grow to congested levels in the foreseeable future. Due to the high proportion of
truck traffic on I-80 and the rolling terrain, instances of temporarily slowed traffic commonly occur when trucks occupy both lanes going up an incline. This does not constitute congestion in the traditional
sense, but does have a light impact on the flow of traffic in certain portions of the Corridor.
Given the relatively light level of traffic and high proportion of through truck traffic, there are several
tolling approaches that could be tested on I-80 to maximize revenue or target specific vehicle classes or
trip types. Generally, the more tolling points there are along the roadway, the more trips there are to collect tolls from, though at a higher cost of operations and up-front capital investment in tolling
equipment. Approaches that target a certain segment of vehicles traveling on the roadway can be achieved by varying the locations of tolling points or toll rates.
The intent of this report section is to suggest cost-effective and efficient tolling technology and
approaches that can be deployed to focus on the I-80 user groups that cause most of the roadway damage, mainly cross-state trucking operations.
3.1 Tolling Point Locations
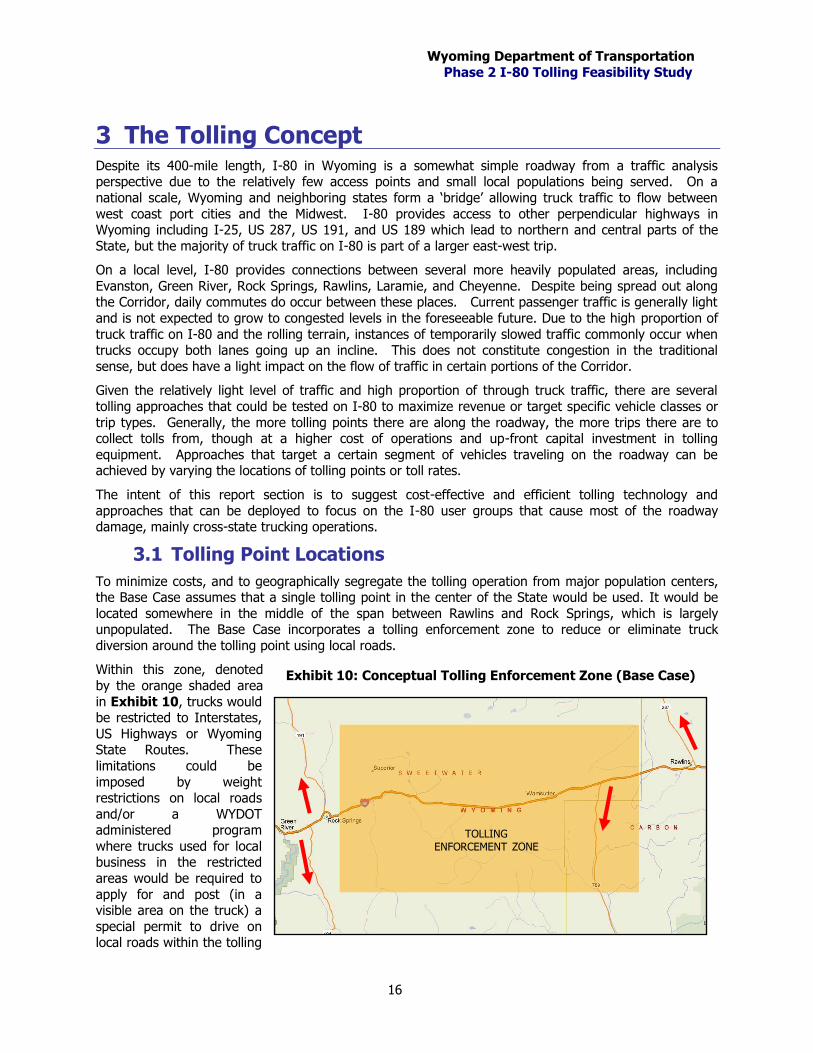
To minimize costs, and to geographically segregate the tolling operation from major population centers, the Base Case assumes that a single tolling point in the center of the State would be used. It would be
located somewhere in the middle of the span between Rawlins and Rock Springs, which is largely unpopulated. The Base Case incorporates a tolling enforcement zone to reduce or eliminate truck
diversion around the tolling point using local roads.
Within this zone, denoted
by the orange shaded area
in Exhibit 10, trucks would be restricted to Interstates,
US Highways or Wyoming State Routes. These
limitations could be
imposed by weight restrictions on local roads
and/or a WYDOT administered program
where trucks used for local business in the restricted
areas would be required to
apply for and post (in a visible area on the truck) a
special permit to drive on local roads within the tolling
TOLLING ENFORCEMENT ZONE
Exhibit 10: Conceptual Tolling Enforcement Zone (Base Case)
Wyoming Department of Transportation
Phase 2 I-80 Tolling Feasibility Study
17
enforcement zone.
Such a program would allow trucks to divert around the tolling point using either US 191 if coming from the west or either US 287 or WY 789 if coming from the east (red arrows). These diversion options are
not likely to be considered cost effective by truckers, especially in winter months when these roads could be much more treacherous than I-80. However, this option would be available for truck drivers who
preferred not to pay the toll, and this approach would keep truckers from diverting around the tolling
point by using local roads.
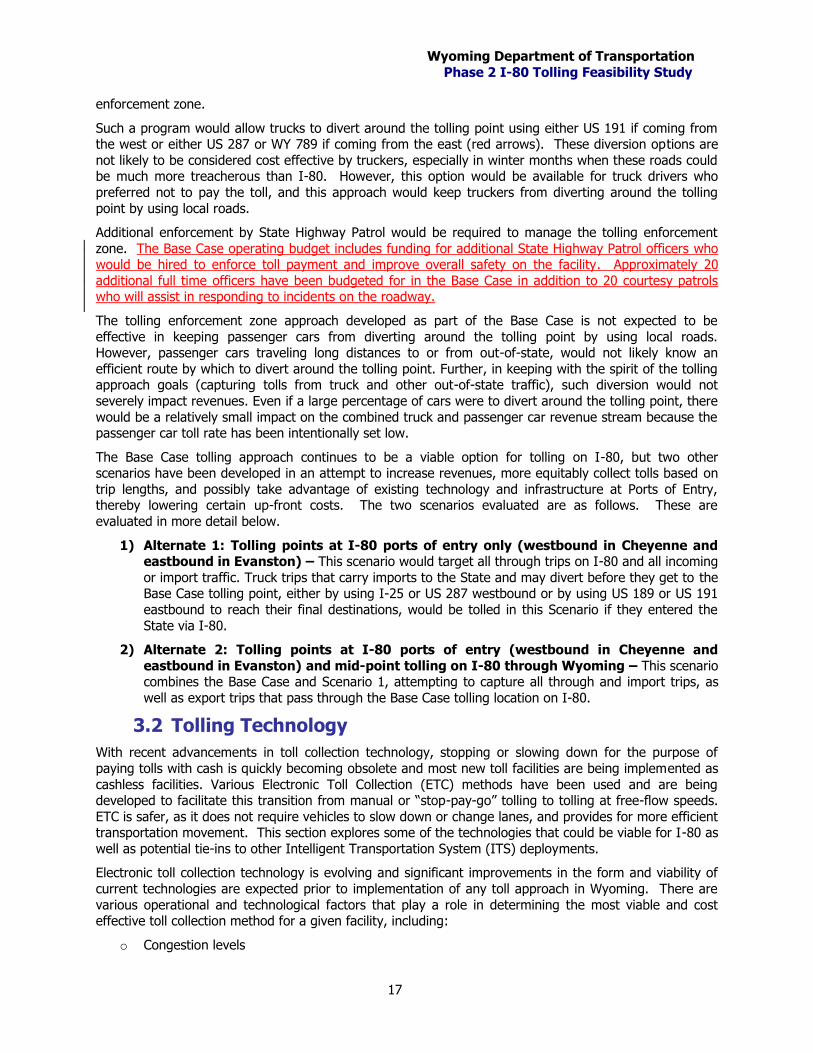
Additional enforcement by State Highway Patrol would be required to manage the tolling enforcement
zone. The Base Case operating budget includes funding for additional State Highway Patrol officers who would be hired to enforce toll payment and improve overall safety on the facility. Approximately 20
additional full time officers have been budgeted for in the Base Case in addition to 20 courtesy patrols who will assist in responding to incidents on the roadway.
The tolling enforcement zone approach developed as part of the Base Case is not expected to be
effective in keeping passenger cars from diverting around the tolling point by using local roads. However, passenger cars traveling long distances to or from out-of-state, would not likely know an
efficient route by which to divert around the tolling point. Further, in keeping with the spirit of the tolling approach goals (capturing tolls from truck and other out-of-state traffic), such diversion would not
severely impact revenues. Even if a large percentage of cars were to divert around the tolling point, there
would be a relatively small impact on the combined truck and passenger car revenue stream because the passenger car toll rate has been intentionally set low.
The Base Case tolling approach continues to be a viable option for tolling on I-80, but two other scenarios have been developed in an attempt to increase revenues, more equitably collect tolls based on
trip lengths, and possibly take advantage of existing technology and infrastructure at Ports of Entry, thereby lowering certain up-front costs. The two scenarios evaluated are as follows. These are
evaluated in more detail below.
1) Alternate 1: Tolling points at I-80 ports of entry only (westbound in Cheyenne and eastbound in Evanston) – This scenario would target all through trips on I-80 and all incoming
or import traffic. Truck trips that carry imports to the State and may divert before they get to the Base Case tolling point, either by using I-25 or US 287 westbound or by using US 189 or US 191
eastbound to reach their final destinations, would be tolled in this Scenario if they entered the
State via I-80.
2) Alternate 2: Tolling points at I-80 ports of entry (westbound in Cheyenne and
eastbound in Evanston) and mid-point tolling on I-80 through Wyoming – This scenario combines the Base Case and Scenario 1, attempting to capture all through and import trips, as
well as export trips that pass through the Base Case tolling location on I-80.
3.2 Tolling Technology
With recent advancements in toll collection technology, stopping or slowing down for the purpose of
paying tolls with cash is quickly becoming obsolete and most new toll facilities are being implemented as
cashless facilities. Various Electronic Toll Collection (ETC) methods have been used and are being developed to facilitate this transition from manual or “stop-pay-go” tolling to tolling at free-flow speeds.
ETC is safer, as it does not require vehicles to slow down or change lanes, and provides for more efficient transportation movement. This section explores some of the technologies that could be viable for I-80 as
well as potential tie-ins to other Intelligent Transportation System (ITS) deployments.
Electronic toll collection technology is evolving and significant improvements in the form and viability of
current technologies are expected prior to implementation of any toll approach in Wyoming. There are
various operational and technological factors that play a role in determining the most viable and cost effective toll collection method for a given facility, including:
o Congestion levels
Wyoming Department of Transportation
Phase 2 I-80 Tolling Feasibility Study
18
o Peak versus non-peak toll rate variability
o Vehicle class toll rate differentiation
o Availability of infrastructure
The following sections explore some existing and emerging toll technologies that were reviewed in order to determine the most suitable option for toll implementation on I-80.
Electronic Toll Collection Technologies in Practice
Electronic toll collection has many advantages over manual collection systems in terms of better traffic flow, increased time savings, higher fuel economy, less congestion and related environmental damage,
and driver safety. In addition, a significant portion of the initial and ongoing costs associated with the electronic systems are offset by the reduced manpower requirement as compared to a manual cash
collection system.
There are three main components of electronic toll systems. These components can meet the goals of
most tolling approaches but the combination depends on the required flexibility and other factors listed
above. The three components are:
o Automatic Vehicle Identification (AVI) can be accomplished through vehicle-to-roadside
communication (transponders), or through license plate recognition.
o Automatic Vehicle Classification (AVC) is part of vehicle recognition. AVC technologies
installed on the roadway can determine a vehicle’s class by its physical attributes (number of
axles, number of trailers, etc.). Typically, overhead sensors, treadles, or loops are used to determine the vehicle class4.
o Video Tolling / Enforcement Systems (VES) can be used in combination with AVI and AVC as a means for enforcing violation protection or as an alternative “pay-by-plate” option for drivers
not purchasing transponders. It can also be used as a standalone system or in conjunction with a self-reporting system where drivers self-report by paying the toll charges by phoning into the toll
service center, paying via the internet, or paying by cash or credit at kiosks located at roadway
rest stops.
A discussion on some of the mature tolling technologies that fall into these broad groups follows.
Vehicle to Roadside Communication (Transponders): Transponders have become one of the most common forms of toll collection technology. A Radio-Frequency Identification (RFID) chip is embedded in
a unit called the electronic tag (transponder), which is typically mounted on the windshield of the vehicle.
This tag communicates with the roadside reader, usually mounted on a gantry, to identify vehicle ownership. Upon establishing ownership, toll cost can be deducted from the corresponding account. The
system also has the capability of alerting for tag mis-reads and violations, however, for violations enforcement (beyond billing though the mail) automatic license plate recognition technology or highway
patrol would be needed.
Transponders are generally classified according to power source. At the ends of the continuum of transponder types, there are active and passive transponders with semi-active and semi-passive
transponders combining features of each.
o Active tags usually have “read” as well as “write” capabilities, i.e. they can transmit as well as
store information (such as the last time the transponder was read etc.). They are, however, more expensive and physically larger, as they need circuitry and a battery to operate.
4 Treadles and Loops are vehicle detecting / classifying devices embedded in the toll lane. Loops are used to detect an approaching vehicle to alert the collection system of an impending transaction while treadles count axles of vehicles passing over them, hence assisting with vehicle classification.
Wyoming Department of Transportation
Phase 2 I-80 Tolling Feasibility Study
19
o Passive tags do not use an internal power source, are less expensive, and more compact, but
can store only a small amount of data. They are also available in the form of windshield sticker tags, often used in tolling pilot programs to test concepts prior to full deployment.
In certain states, policy considerations have suggested that vehicles that generate reduced emissions
should pay reduced tolls. The identification of “green” vehicles can be accomplished through the use of
RFID transponders. Similarly, certain segments of toll road users, such as senior citizens, students, or local residents to the area where a tolling point is located could be provided with transponders that
charge variable (lower) rates to help address inequity issues that can occur when tolling roads that do not have viable alternative routes.
If a driver passes under a tolling point without a valid transponder read, then one of the following could
occur:
o A “Pay-by-Plate” transaction is initiated based on license plate recognition (use of video tolling is
explained further below), or
o The registered owner of the vehicle is identified using license plate recognition from their license
plate and sent a bill by mail for the toll plus collection charges, or
o Police waiting after the tolling point could be notified electronically of the mis-read and manually
enforce toll collection by pulling vehicles over, or
o No further action is taken due to an illegible license plate image and inability to enforce the toll.
In situations where a license plate is recognized but the customer does not initiate payment on their own,
additional collection costs are usually incurred to cover the costs of sending invoices, sending notices of infraction, and handling the appeal processes, among other transactional expenses. These additional
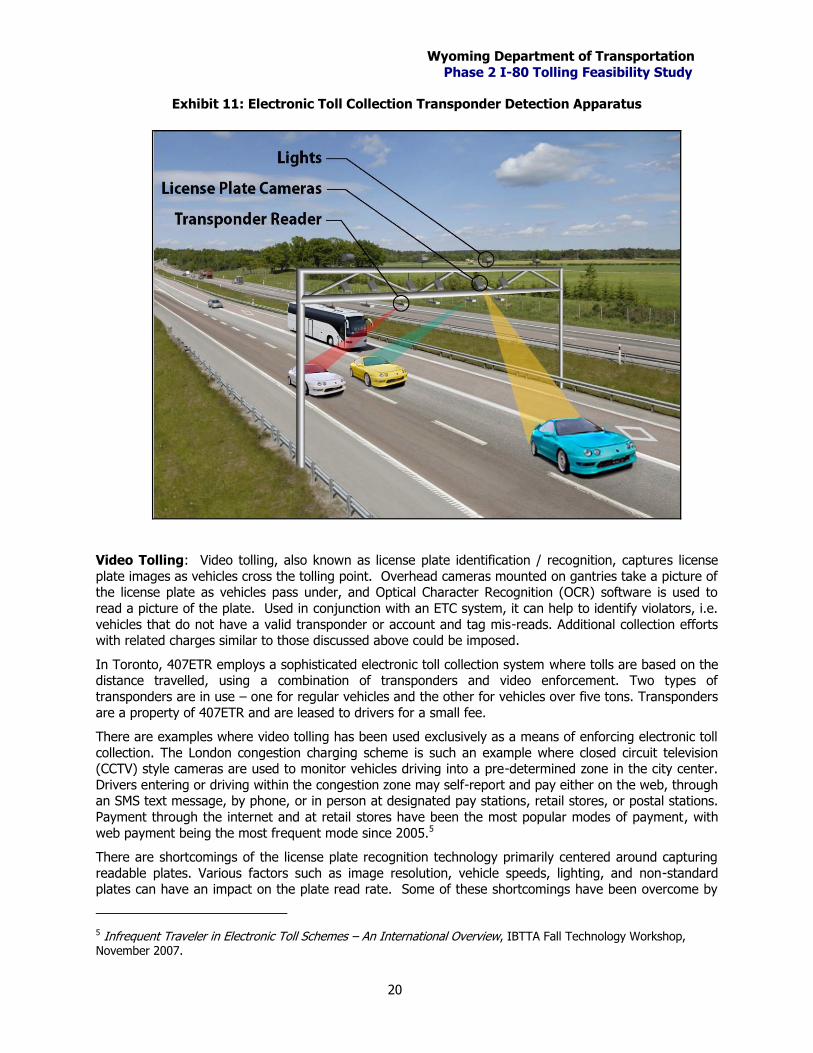
costs are usually passed on to the violator in the form of fees. A typical gantry system containing
transponder and video collection technologies is illustrated in Exhibit 11.
Wyoming Department of Transportation
Phase 2 I-80 Tolling Feasibility Study
20
Exhibit 11: Electronic Toll Collection Transponder Detection Apparatus
Video Tolling: Video tolling, also known as license plate identification / recognition, captures license
plate images as vehicles cross the tolling point. Overhead cameras mounted on gantries take a picture of the license plate as vehicles pass under, and Optical Character Recognition (OCR) software is used to
read a picture of the plate. Used in conjunction with an ETC system, it can help to identify violators, i.e.
vehicles that do not have a valid transponder or account and tag mis-reads. Additional collection efforts with related charges similar to those discussed above could be imposed.
In Toronto, 407ETR employs a sophisticated electronic toll collection system where tolls are based on the distance travelled, using a combination of transponders and video enforcement. Two types of
transponders are in use – one for regular vehicles and the other for vehicles over five tons. Transponders
are a property of 407ETR and are leased to drivers for a small fee.
There are examples where video tolling has been used exclusively as a means of enforcing electronic toll
collection. The London congestion charging scheme is such an example where closed circuit television (CCTV) style cameras are used to monitor vehicles driving into a pre-determined zone in the city center.
Drivers entering or driving within the congestion zone may self-report and pay either on the web, through an SMS text message, by phone, or in person at designated pay stations, retail stores, or postal stations.
Payment through the internet and at retail stores have been the most popular modes of payment, with
web payment being the most frequent mode since 2005.5
There are shortcomings of the license plate recognition technology primarily centered around capturing
readable plates. Various factors such as image resolution, vehicle speeds, lighting, and non-standard plates can have an impact on the plate read rate. Some of these shortcomings have been overcome by
5 Infrequent Traveler in Electronic Toll Schemes – An International Overview, IBTTA Fall Technology Workshop, November 2007.
Wyoming Department of Transportation
Phase 2 I-80 Tolling Feasibility Study
21
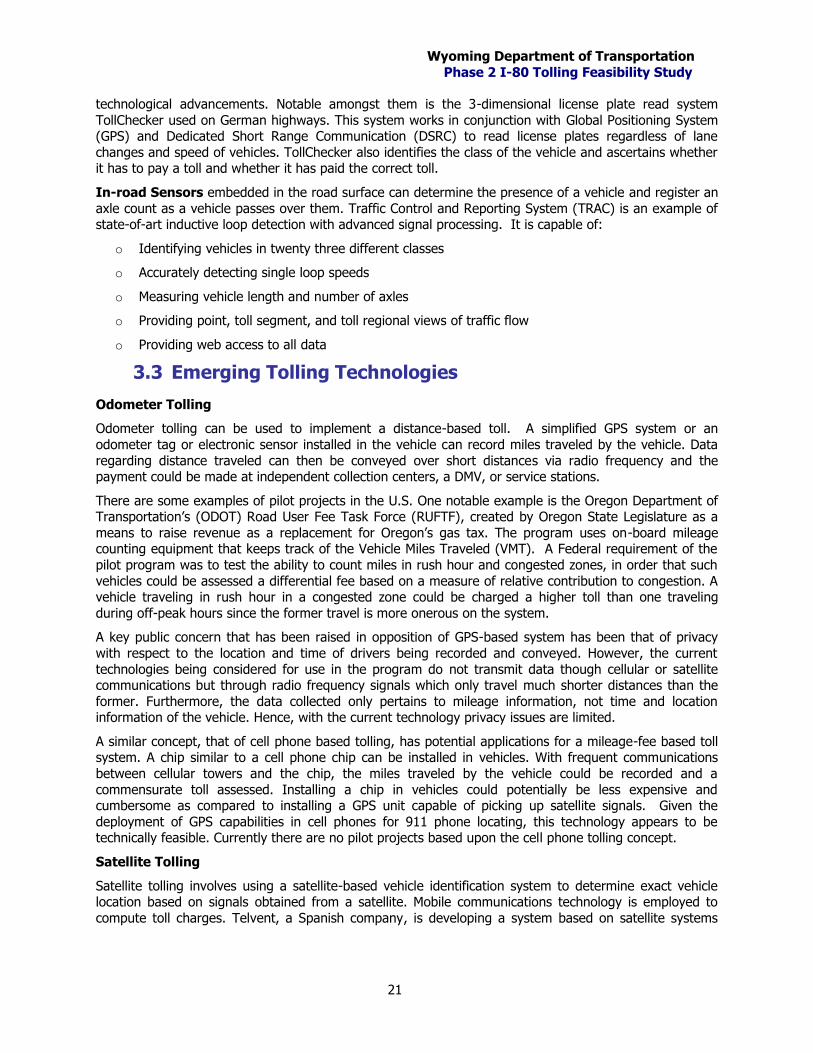
technological advancements. Notable amongst them is the 3-dimensional license plate read system
TollChecker used on German highways. This system works in conjunction with Global Positioning System (GPS) and Dedicated Short Range Communication (DSRC) to read license plates regardless of lane
changes and speed of vehicles. TollChecker also identifies the class of the vehicle and ascertains whether it has to pay a toll and whether it has paid the correct toll.
In-road Sensors embedded in the road surface can determine the presence of a vehicle and register an
axle count as a vehicle passes over them. Traffic Control and Reporting System (TRAC) is an example of state-of-art inductive loop detection with advanced signal processing. It is capable of:
o Identifying vehicles in twenty three different classes
o Accurately detecting single loop speeds
o Measuring vehicle length and number of axles
o Providing point, toll segment, and toll regional views of traffic flow
o Providing web access to all data
3.3 Emerging Tolling Technologies
Odometer Tolling
Odometer tolling can be used to implement a distance-based toll. A simplified GPS system or an
odometer tag or electronic sensor installed in the vehicle can record miles traveled by the vehicle. Data
regarding distance traveled can then be conveyed over short distances via radio frequency and the payment could be made at independent collection centers, a DMV, or service stations.
There are some examples of pilot projects in the U.S. One notable example is the Oregon Department of Transportation’s (ODOT) Road User Fee Task Force (RUFTF), created by Oregon State Legislature as a
means to raise revenue as a replacement for Oregon’s gas tax. The program uses on-board mileage counting equipment that keeps track of the Vehicle Miles Traveled (VMT). A Federal requirement of the
pilot program was to test the ability to count miles in rush hour and congested zones, in order that such
vehicles could be assessed a differential fee based on a measure of relative contribution to congestion. A vehicle traveling in rush hour in a congested zone could be charged a higher toll than one traveling
during off-peak hours since the former travel is more onerous on the system.
A key public concern that has been raised in opposition of GPS-based system has been that of privacy
with respect to the location and time of drivers being recorded and conveyed. However, the current
technologies being considered for use in the program do not transmit data though cellular or satellite communications but through radio frequency signals which only travel much shorter distances than the
former. Furthermore, the data collected only pertains to mileage information, not time and location information of the vehicle. Hence, with the current technology privacy issues are limited.
A similar concept, that of cell phone based tolling, has potential applications for a mileage-fee based toll system. A chip similar to a cell phone chip can be installed in vehicles. With frequent communications
between cellular towers and the chip, the miles traveled by the vehicle could be recorded and a
commensurate toll assessed. Installing a chip in vehicles could potentially be less expensive and cumbersome as compared to installing a GPS unit capable of picking up satellite signals. Given the
deployment of GPS capabilities in cell phones for 911 phone locating, this technology appears to be technically feasible. Currently there are no pilot projects based upon the cell phone tolling concept.
Satellite Tolling
Satellite tolling involves using a satellite-based vehicle identification system to determine exact vehicle location based on signals obtained from a satellite. Mobile communications technology is employed to
compute toll charges. Telvent, a Spanish company, is developing a system based on satellite systems
Wyoming Department of Transportation
Phase 2 I-80 Tolling Feasibility Study
22
such as GPS. This is one of the most advanced forms of tolling in the world, and although no toll roads
offer this system yet, it is being tested on trucks using highways in Germany.
While satellite tolling would be the most accurate technology for implementing distance-based tolling,
there are potential hurdles to its implementation. Most importantly there will be a significant phase-in period as all vehicles on the road today do not come equipped with on-board GPS units. By an estimate,
it would take another 10 to 15 years for this technology to become ubiquitous. Until that time, and
possibly even beyond it, a parallel option of manual payment will have to be maintained. Also, the public perception with regard to maintenance of privacy associated with any distance based tolling system is a
potential hurdle to the implementation of GPS tolling.
Semi-Autonomous Toll systems with Minimal Infrastructure (Pre-Pass)
PrePass is an Automated Vehicle Identification system that is used to pre-screen commercial vehicles at designated weigh stations, port-of-entry facilities, or agricultural interdiction facilities. It is generally
accompanied by a weigh-in-motion detector to ascertain that the truck’s configuration, axle and gross
vehicle weights are within acceptable limits. Cleared vehicles are allowed to “bypass” a weighing facility while traveling at highway speed as the transponder emits a green light and an audible signal to indicate
clearance. A red light emitting from the transponder signals the driver to pull into the weigh station for regular processing.
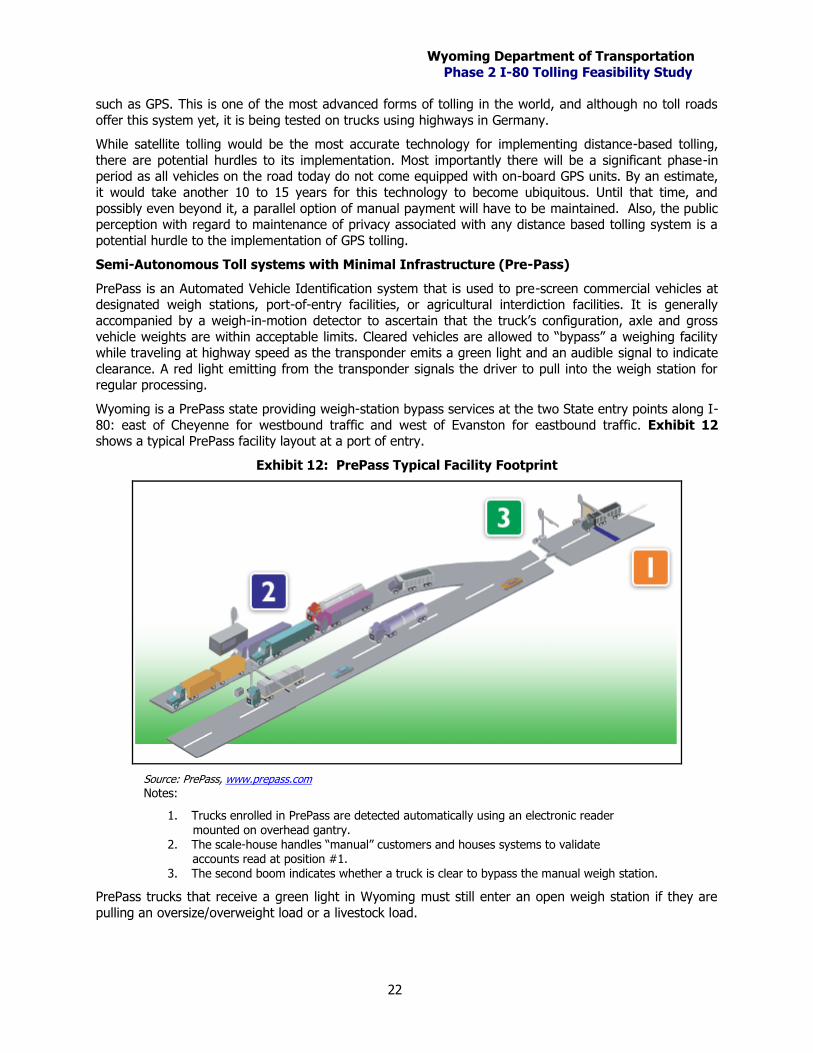
Wyoming is a PrePass state providing weigh-station bypass services at the two State entry points along I-
80: east of Cheyenne for westbound traffic and west of Evanston for eastbound traffic. Exhibit 12 shows a typical PrePass facility layout at a port of entry.
Exhibit 12: PrePass Typical Facility Footprint
Source: PrePass, www.prepass.com Notes:
1. Trucks enrolled in PrePass are detected automatically using an electronic reader mounted on overhead gantry.
2. The scale-house handles “manual” customers and houses systems to validate accounts read at position #1.
3. The second boom indicates whether a truck is clear to bypass the manual weigh station.
PrePass trucks that receive a green light in Wyoming must still enter an open weigh station if they are
pulling an oversize/overweight load or a livestock load.
Wyoming Department of Transportation
Phase 2 I-80 Tolling Feasibility Study
23
PrePass can also be integrated with toll collection technology, currently known as PrePass Plus. PrePass
Plus has been implemented in conjunction with the E-ZPass system in the Northeast and enables vehicles to carry just one transponder that works at both PrePass and E-ZPass (toll) sites. Each PrePass Plus
transponder is connected to a PrePass Plus account from which the appropriate toll amount is automatically debited when the vehicle passes the tolling point. PrePass later sends a post-paid invoice
for the sum of the total charges incurred by the vehicle.
Since this tolling technology is integrated with existing PrePass equipment and software, the costs for implementing are less than other transponder systems that would involve setting up independent
gantries, zone controllers and other equipment. Additionally, using PrePass also helps address problems of interoperability as vehicles are not required to carry separate tags for toll as well as PrePass.
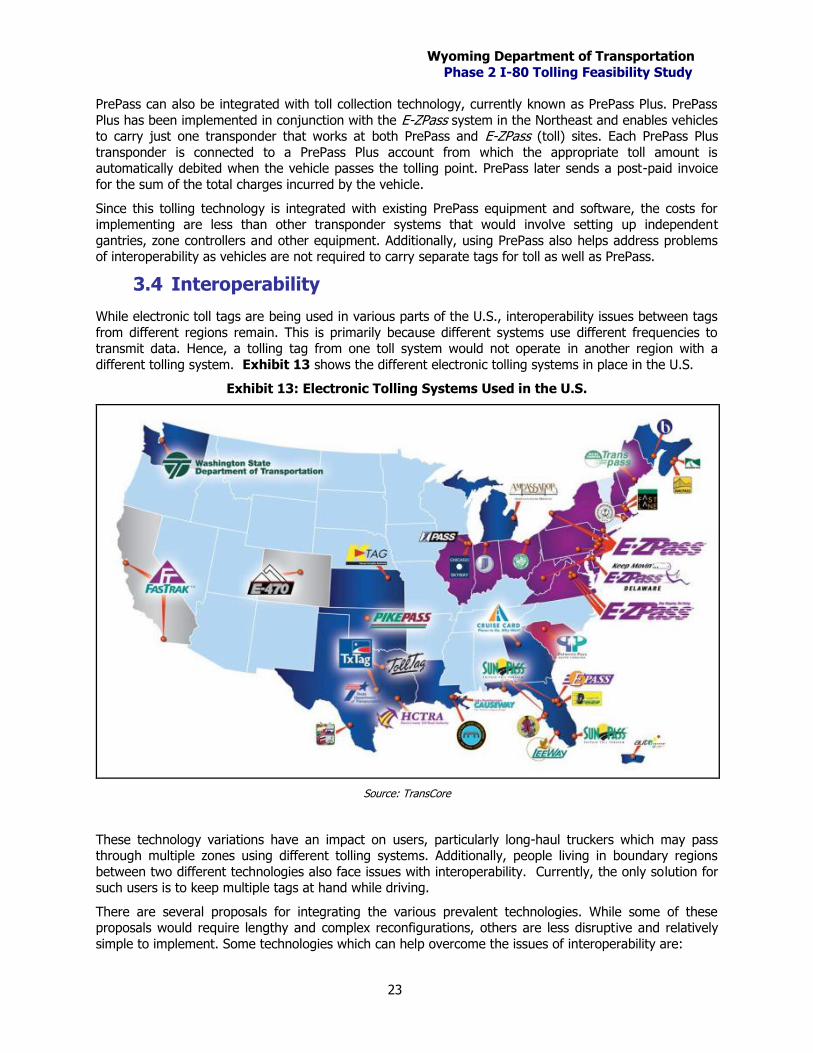
3.4 Interoperability
While electronic toll tags are being used in various parts of the U.S., interoperability issues between tags
from different regions remain. This is primarily because different systems use different frequencies to transmit data. Hence, a tolling tag from one toll system would not operate in another region with a
different tolling system. Exhibit 13 shows the different electronic tolling systems in place in the U.S.
Exhibit 13: Electronic Tolling Systems Used in the U.S.
Source: TransCore
These technology variations have an impact on users, particularly long-haul truckers which may pass through multiple zones using different tolling systems. Additionally, people living in boundary regions
between two different technologies also face issues with interoperability. Currently, the only solution for such users is to keep multiple tags at hand while driving.
There are several proposals for integrating the various prevalent technologies. While some of these proposals would require lengthy and complex reconfigurations, others are less disruptive and relatively
simple to implement. Some technologies which can help overcome the issues of interoperability are:
Wyoming Department of Transportation
Phase 2 I-80 Tolling Feasibility Study
24
o Replace existing array of disparate technologies with a new technology (currently
known as 5.9-GHz DSRC). This replacement would involve changing tolling hardware in a large number of existing systems as well as replacement of all tolling tags in operation that are not
compatible with the new technology. The use of this technology for tolling operations, however, will require further development and would need to be phased-in over a period of time as systems
and drivers get accustomed to this change.
o Multiprotocol systems. Various integrators have designed Multi-protocol systems which have the capacity to read tags from different systems. There are also multiprotocol tags that have the
capability of passing through different toll systems. Since such a system could be implemented in a relatively short term until a more permanent solution such as a common technology is
implemented.
o Sticker-based systems are easy to switch to at a relatively low cost and offer a viable option to
support interoperability. Most recently Kansas and Oklahoma migrated to using sticker tags.
o Integration of toll collection system with existing ITS infrastructure (such as PrePass). As discussed above, integration of toll collection with PrePass systems offers the
possibility to preclude the need to introduce another technology or build new infrastructure from scratch for toll collection purposes. PrePass currently has a near nation-wide network of weigh-
station bypass intercepts and commercial vehicles that carry a PrePass tag on board typically
bypass the weigh stations at highway speeds.
As presented in the above sections, several different tolling technologies are either currently available or
are evolving rapidly. Some of the upcoming toll technologies such as Odometer and GPS-based tolling, also have significantly different system requirements and features as compared to the more-prevalent
technologies. It is quite likely that some of these new technologies will develop into more viable options that could be used on I-80 if tolling is implemented.
Wyoming Department of Transportation
Phase 2 I-80 Tolling Feasibility Study
25
4 Refinement of Traffic and Revenue Analysis
The estimate of truck diversion resulting from tolling on I-80 was refined and updated since the Phase 1
analysis completed in the fall of 2008. The major focus of the Phase 2 tolling scenario analysis was refining the oil price assumptions due to the economic downturn and improving the assumptions
surrounding the major diversion routes from the previous analysis.
4.1 Fuel Price Revision
In the Phase 1 analysis, the price of diesel fuel in 2009 was assumed to average $4.18, which was roughly equivalent to the average diesel fuel price from the first eight months of 2008, and prices were
assumed to grow at 1 percent annually throughout the forecast period. At that time, projections from the Energy Information Administration (EIA), the International Monetary Fund (IMF), Global Insight, and
others were predicated on the assumption that oil prices would continue to remain high for the
foreseeable future. Since that time, however, global economic production has slowed much faster and deeper than expected, and in 2009 the IMF expects world economic growth to contract 1.3 percent – the
first annual decrease in global GDP since World War II.
Because of the global downturn in economic production, prices for all major commodities, including oil
and its derivatives, have decreased substantially. As a result, the updated EIA forecast from June 2009 predicts that US diesel fuel prices will average $2.37 per gallon in 2009, a marked decrease from the
Phase 1 forecast of $4.18/gallon. The updated EIA forecast also expects diesel prices to remain below $4
per gallon until 2014, once the economy fully recovers from the effects of the current downturn.
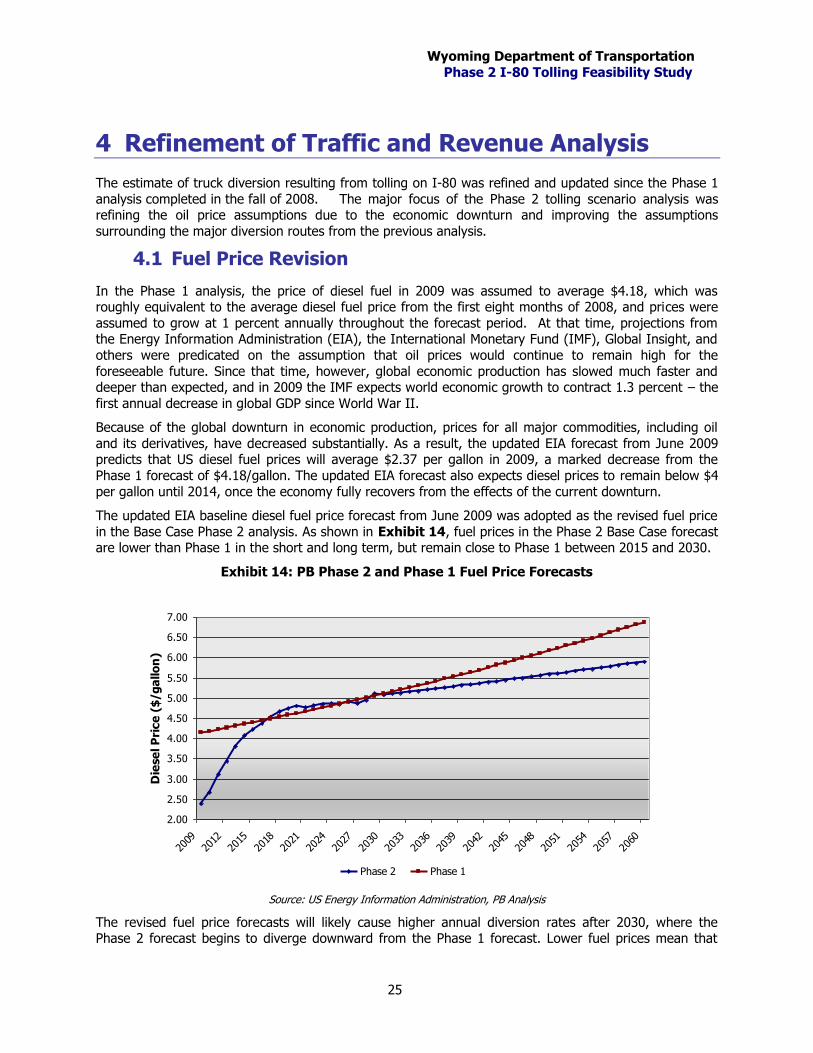
The updated EIA baseline diesel fuel price forecast from June 2009 was adopted as the revised fuel price
in the Base Case Phase 2 analysis. As shown in Exhibit 14, fuel prices in the Phase 2 Base Case forecast are lower than Phase 1 in the short and long term, but remain close to Phase 1 between 2015 and 2030.
Exhibit 14: PB Phase 2 and Phase 1 Fuel Price Forecasts
2.00
2.50
3.00
3.50
4.00
4.50
5.00
5.50
6.00
6.50
7.00
2009
2012
2015
2018
2021
2024
2027
2030
2033
2036
2039
2042
2045
2048
2051
2054
2057
2060
Die
se
l P
rice
($
/g
allo
n)
Phase 2 Phase 1
Source: US Energy Information Administration, PB Analysis
The revised fuel price forecasts will likely cause higher annual diversion rates after 2030, where the Phase 2 forecast begins to diverge downward from the Phase 1 forecast. Lower fuel prices mean that
Wyoming Department of Transportation
Phase 2 I-80 Tolling Feasibility Study
26
truck drivers will find longer alternate routes to I-80 less costly, and will therefore have a higher incentive
to divert from I-80 if the facility is tolled.
The downward revision to near-term fuel prices will not impact truck diversion and I-80 toll revenues
because tolling under the Base Case is not expected to begin until 2017. Additionally, truck diversion rates in the Phase 2 analysis between 2017 and 2030 should remain the same as those in Phase 1 due to
the similar forecasts in this period.
4.2 Major Diversion Route Assumption Revisions
In Phase 1, a truck diversion rate of 46 percent was estimated for 2010 based on a toll rate of $116. For the Phase 2 study, the major alternate routes driving the previously estimated diversion rate were
analyzed in more detail, and the assumptions surrounding the major alternate corridors were improved.
The major diversion routes from the Phase 1 study are shown in Exhibit 15 below. Nearly 40 percent of
the daily truck diversion was found to occur on the US-6 to I-70 route from/to Salt Lake City through
Denver to/from points east. Thus, the assumptions underlying this trade route were analyzed first.
Exhibit 15: Major Diversion Routes from I-80 in Wyoming
Diversion Route # Diverted
Trucks Per Day
% of Total Truck
Diversion
US-6 to I-70 782 39%
I-94 to I-90 332 17%
I-5 to I-40 144 7%
I-15 to I-70 144 7%
I-5 to I-10 127 6%
I-25 to I-90 89 4%
I-15 to I-94 44 2%
Others 330 17%
TOTAL 1992 100%
Source: PB analysis
Two major travel time assumptions were revised surrounding the US-6 to I-70 route upon further analysis:
First, the estimate of average travel speeds for trucks on the 165 mile stretch of the I-15/US-6
corridor from Salt Lake City to I-70 was revised downward to take into account certain characteristics of the corridor. The previous analysis assumed that trucks could average close to
the 55 mph speed limit on the entire stretch of US-6. However, because much of the corridor is one lane in each direction, the FHWA Freight Analysis Framework (FAF) highway link database
estimated that truck speeds were actually averaging close to 40 miles per hour on the corridor in
2002 due to frequent congestion. This translates into over 60 minutes of additional travel time on the alternate route than previously estimated, which was factored into the revised analysis.
Second, the estimate of travel speeds on I-70 from the Utah border to Denver were also found to
be too high in the previous analysis, which assumed truckers could maintain a 65 mph pace on the entire segment. However, much of I-70 through central Colorado features steep grades, tight
turns, and high elevations, making it very difficult for trucks to maintain speeds above 60 mph.
The FAF highway link database indicated that speeds averaged just above 50 mph for much of the I-70 corridor east of Grand Junction. Thus, average truck speeds on I-70 were reduced
roughly 20 percent below those used in the 2008 study to 50 mph, adding an additional 60 minutes of travel time to this alternate corridor.
With these two adjustments in place, the US-6 to I-70 and I-15 to I-70 diversion routes become much less attractive, and the overall diversion rate decreases throughout the forecast period.
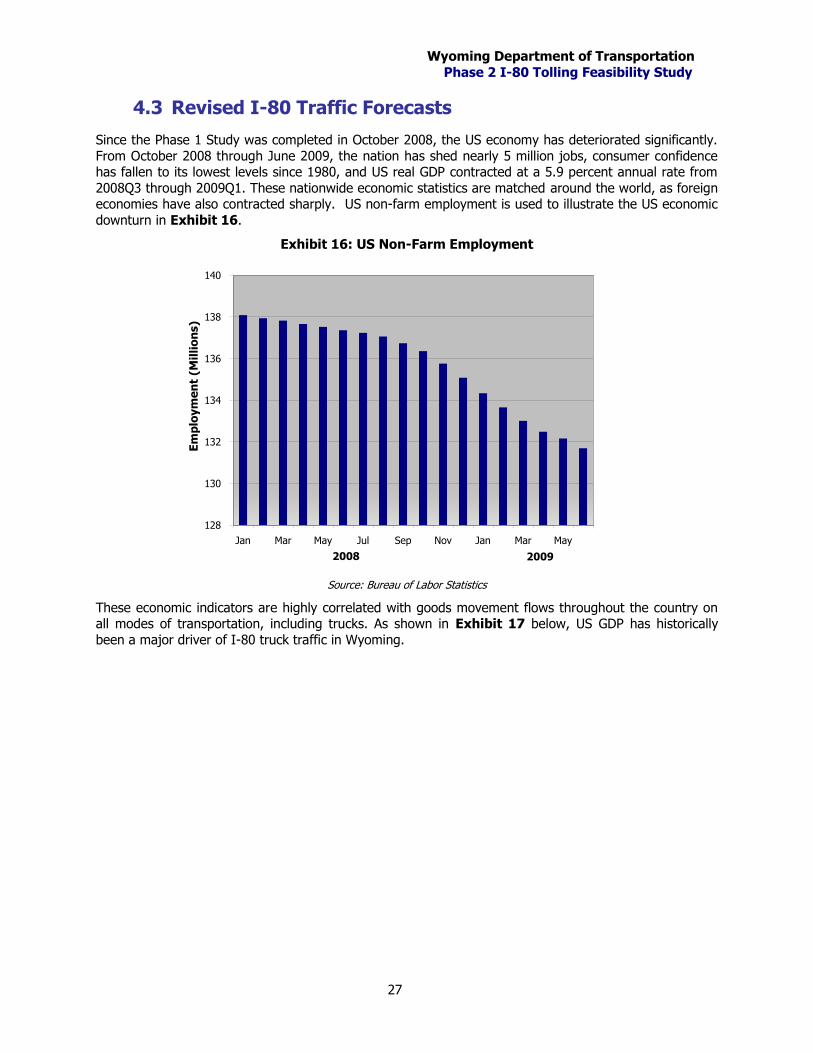
Wyoming Department of Transportation
Phase 2 I-80 Tolling Feasibility Study
27
4.3 Revised I-80 Traffic Forecasts
Since the Phase 1 Study was completed in October 2008, the US economy has deteriorated significantly.
From October 2008 through June 2009, the nation has shed nearly 5 million jobs, consumer confidence has fallen to its lowest levels since 1980, and US real GDP contracted at a 5.9 percent annual rate from
2008Q3 through 2009Q1. These nationwide economic statistics are matched around the world, as foreign economies have also contracted sharply. US non-farm employment is used to illustrate the US economic
downturn in Exhibit 16.
Exhibit 16: US Non-Farm Employment
128
130
132
134
136
138
140
Jan Mar May Jul Sep Nov Jan Mar May
Em
plo
ym
en
t (M
illi
on
s)
2008 2009
Source: Bureau of Labor Statistics
These economic indicators are highly correlated with goods movement flows throughout the country on all modes of transportation, including trucks. As shown in Exhibit 17 below, US GDP has historically
been a major driver of I-80 truck traffic in Wyoming.
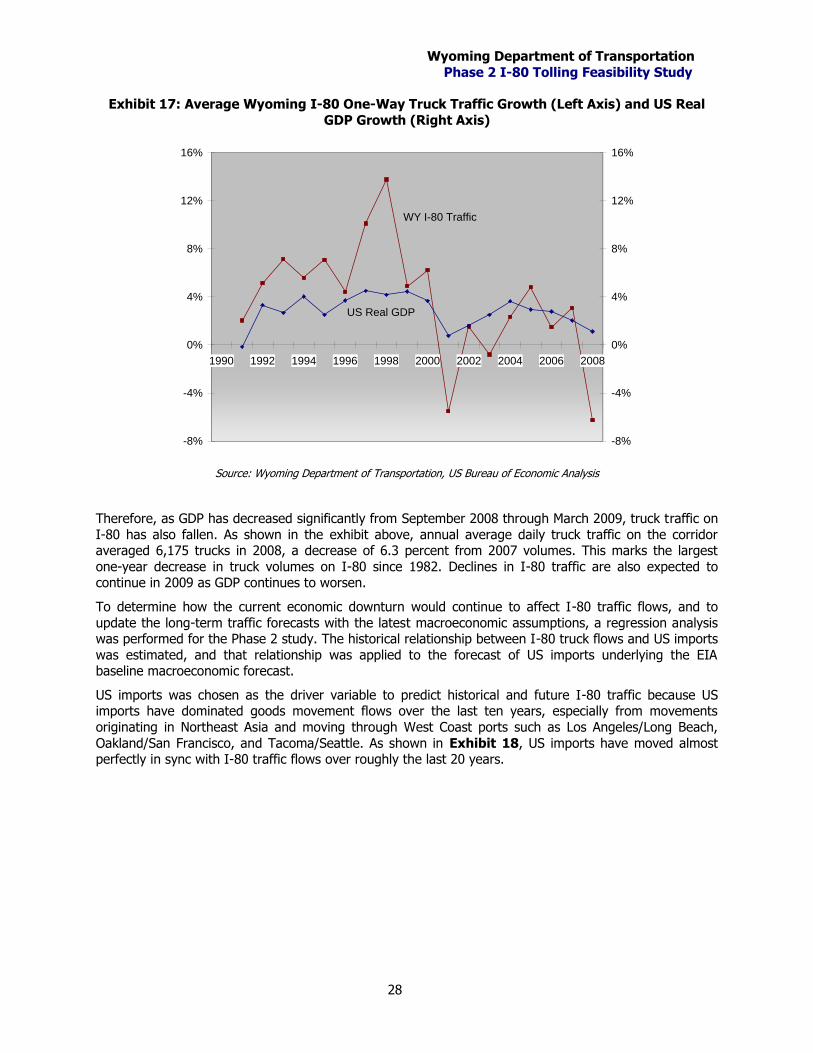
Wyoming Department of Transportation
Phase 2 I-80 Tolling Feasibility Study
28
Exhibit 17: Average Wyoming I-80 One-Way Truck Traffic Growth (Left Axis) and US Real
GDP Growth (Right Axis)
-8%
-4%
0%
4%
8%
12%
16%
1990 1992 1994 1996 1998 2000 2002 2004 2006 2008
-8%
-4%
0%
4%
8%
12%
16%
US Real GDP
WY I-80 Traffic
Source: Wyoming Department of Transportation, US Bureau of Economic Analysis
Therefore, as GDP has decreased significantly from September 2008 through March 2009, truck traffic on
I-80 has also fallen. As shown in the exhibit above, annual average daily truck traffic on the corridor averaged 6,175 trucks in 2008, a decrease of 6.3 percent from 2007 volumes. This marks the largest
one-year decrease in truck volumes on I-80 since 1982. Declines in I-80 traffic are also expected to continue in 2009 as GDP continues to worsen.
To determine how the current economic downturn would continue to affect I-80 traffic flows, and to
update the long-term traffic forecasts with the latest macroeconomic assumptions, a regression analysis was performed for the Phase 2 study. The historical relationship between I-80 truck flows and US imports
was estimated, and that relationship was applied to the forecast of US imports underlying the EIA baseline macroeconomic forecast.
US imports was chosen as the driver variable to predict historical and future I-80 traffic because US imports have dominated goods movement flows over the last ten years, especially from movements
originating in Northeast Asia and moving through West Coast ports such as Los Angeles/Long Beach,
Oakland/San Francisco, and Tacoma/Seattle. As shown in Exhibit 18, US imports have moved almost perfectly in sync with I-80 traffic flows over roughly the last 20 years.
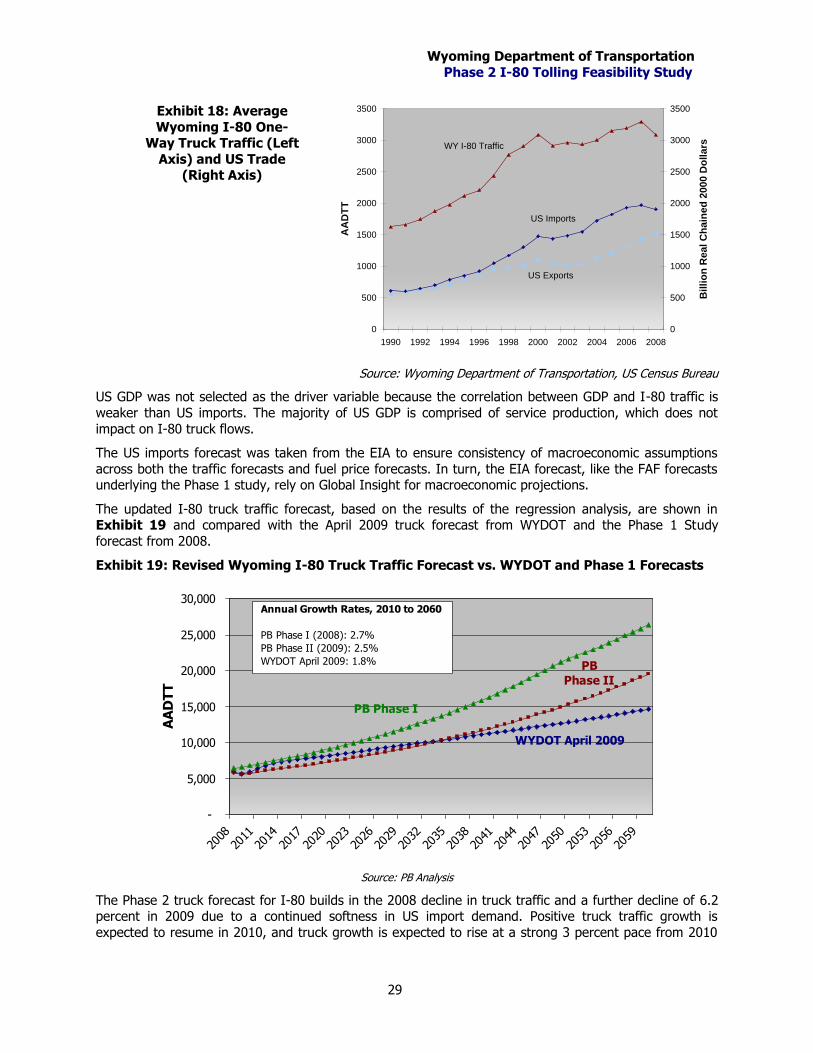
Wyoming Department of Transportation
Phase 2 I-80 Tolling Feasibility Study
29
0
500
1000
1500
2000
2500
3000
3500
1990 1992 1994 1996 1998 2000 2002 2004 2006 2008A
AD
TT
0
500
1000
1500
2000
2500
3000
3500
Bil
lio
n R
ea
l C
ha
ine
d 2
00
0 D
oll
ars
US Exports
US Imports
WY I-80 Traffic
Source: Wyoming Department of Transportation, US Census Bureau
US GDP was not selected as the driver variable because the correlation between GDP and I-80 traffic is
weaker than US imports. The majority of US GDP is comprised of service production, which does not
impact on I-80 truck flows.
The US imports forecast was taken from the EIA to ensure consistency of macroeconomic assumptions
across both the traffic forecasts and fuel price forecasts. In turn, the EIA forecast, like the FAF forecasts underlying the Phase 1 study, rely on Global Insight for macroeconomic projections.
The updated I-80 truck traffic forecast, based on the results of the regression analysis, are shown in Exhibit 19 and compared with the April 2009 truck forecast from WYDOT and the Phase 1 Study
forecast from 2008.
Exhibit 19: Revised Wyoming I-80 Truck Traffic Forecast vs. WYDOT and Phase 1 Forecasts
-
5,000
10,000
15,000
20,000
25,000
30,000
2008
2011
2014
2017
2020
2023
2026
2029
2032
2035
2038
2041
2044
2047
2050
2053
2056
2059
AA
DT
T
Annual Growth Rates, 2010 to 2060
PB Phase I (2008): 2.7%
PB Phase II (2009): 2.5%
WYDOT April 2009: 1.8%
PB Phase I
PB
Phase II
WYDOT April 2009
Source: PB Analysis
The Phase 2 truck forecast for I-80 builds in the 2008 decline in truck traffic and a further decline of 6.2 percent in 2009 due to a continued softness in US import demand. Positive truck traffic growth is
expected to resume in 2010, and truck growth is expected to rise at a strong 3 percent pace from 2010
Exhibit 18: Average
Wyoming I-80 One-Way Truck Traffic (Left
Axis) and US Trade (Right Axis)
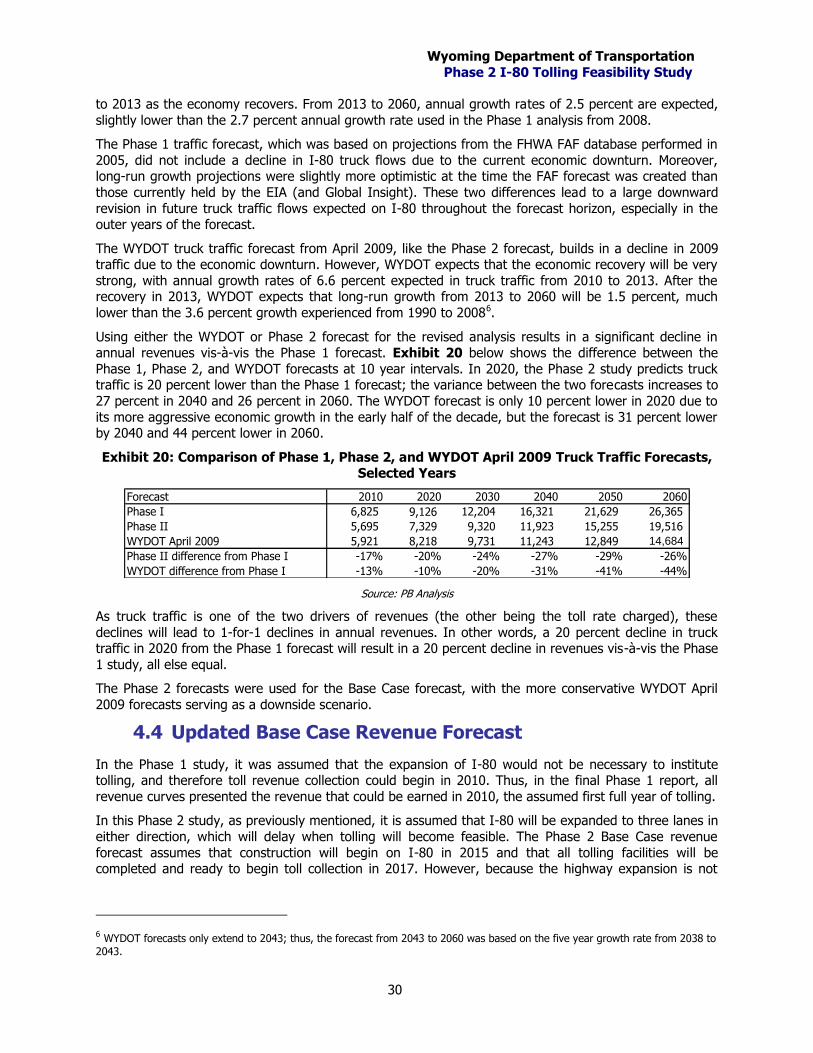
Wyoming Department of Transportation
Phase 2 I-80 Tolling Feasibility Study
30
to 2013 as the economy recovers. From 2013 to 2060, annual growth rates of 2.5 percent are expected,
slightly lower than the 2.7 percent annual growth rate used in the Phase 1 analysis from 2008.
The Phase 1 traffic forecast, which was based on projections from the FHWA FAF database performed in
2005, did not include a decline in I-80 truck flows due to the current economic downturn. Moreover, long-run growth projections were slightly more optimistic at the time the FAF forecast was created than
those currently held by the EIA (and Global Insight). These two differences lead to a large downward
revision in future truck traffic flows expected on I-80 throughout the forecast horizon, especially in the outer years of the forecast.
The WYDOT truck traffic forecast from April 2009, like the Phase 2 forecast, builds in a decline in 2009 traffic due to the economic downturn. However, WYDOT expects that the economic recovery will be very
strong, with annual growth rates of 6.6 percent expected in truck traffic from 2010 to 2013. After the recovery in 2013, WYDOT expects that long-run growth from 2013 to 2060 will be 1.5 percent, much
lower than the 3.6 percent growth experienced from 1990 to 20086.
Using either the WYDOT or Phase 2 forecast for the revised analysis results in a significant decline in annual revenues vis-à-vis the Phase 1 forecast. Exhibit 20 below shows the difference between the
Phase 1, Phase 2, and WYDOT forecasts at 10 year intervals. In 2020, the Phase 2 study predicts truck traffic is 20 percent lower than the Phase 1 forecast; the variance between the two forecasts increases to
27 percent in 2040 and 26 percent in 2060. The WYDOT forecast is only 10 percent lower in 2020 due to
its more aggressive economic growth in the early half of the decade, but the forecast is 31 percent lower by 2040 and 44 percent lower in 2060.
Exhibit 20: Comparison of Phase 1, Phase 2, and WYDOT April 2009 Truck Traffic Forecasts, Selected Years
Forecast 2010 2020 2030 2040 2050 2060
Phase I 6,825 9,126 12,204 16,321 21,629 26,365
Phase II 5,695 7,329 9,320 11,923 15,255 19,516
WYDOT April 2009 5,921 8,218 9,731 11,243 12,849 14,684
Phase II difference from Phase I -17% -20% -24% -27% -29% -26%
WYDOT difference from Phase I -13% -10% -20% -31% -41% -44%
Source: PB Analysis
As truck traffic is one of the two drivers of revenues (the other being the toll rate charged), these
declines will lead to 1-for-1 declines in annual revenues. In other words, a 20 percent decline in truck traffic in 2020 from the Phase 1 forecast will result in a 20 percent decline in revenues vis-à-vis the Phase
1 study, all else equal.
The Phase 2 forecasts were used for the Base Case forecast, with the more conservative WYDOT April
2009 forecasts serving as a downside scenario.
4.4 Updated Base Case Revenue Forecast
In the Phase 1 study, it was assumed that the expansion of I-80 would not be necessary to institute tolling, and therefore toll revenue collection could begin in 2010. Thus, in the final Phase 1 report, all
revenue curves presented the revenue that could be earned in 2010, the assumed first full year of tolling.
In this Phase 2 study, as previously mentioned, it is assumed that I-80 will be expanded to three lanes in
either direction, which will delay when tolling will become feasible. The Phase 2 Base Case revenue
forecast assumes that construction will begin on I-80 in 2015 and that all tolling facilities will be completed and ready to begin toll collection in 2017. However, because the highway expansion is not
6 WYDOT forecasts only extend to 2043; thus, the forecast from 2043 to 2060 was based on the five year growth rate from 2038 to
2043.
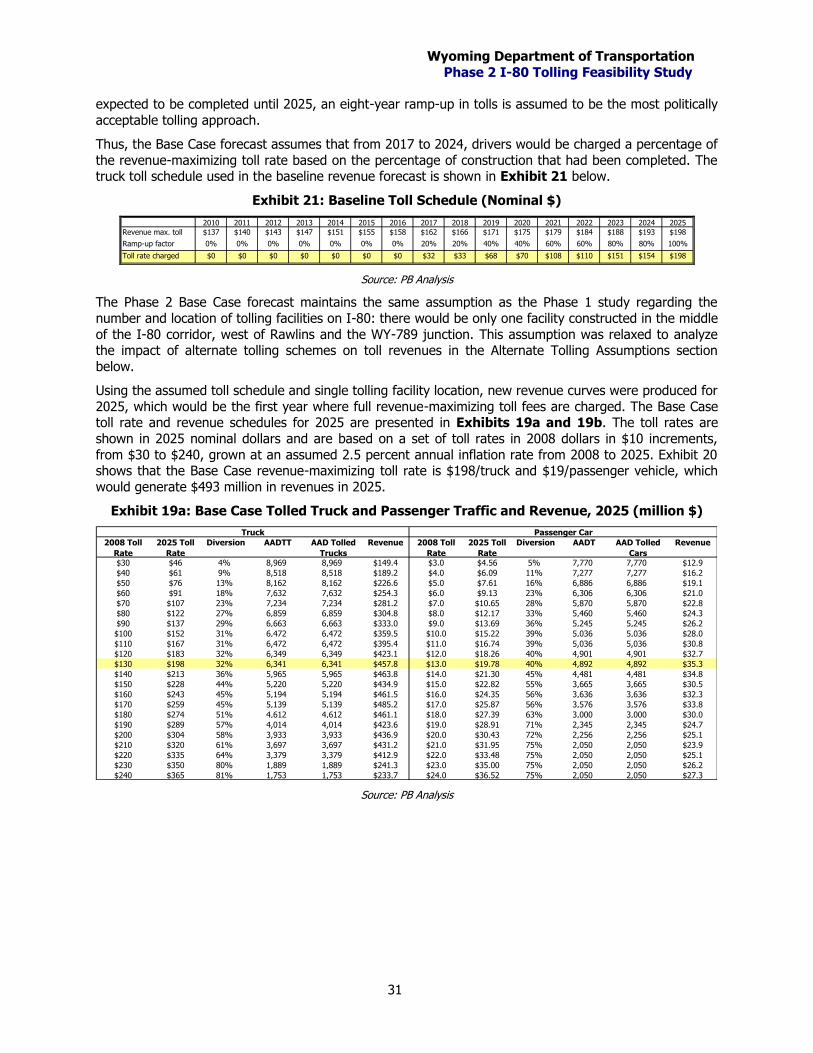
Wyoming Department of Transportation
Phase 2 I-80 Tolling Feasibility Study
31
expected to be completed until 2025, an eight-year ramp-up in tolls is assumed to be the most politically
acceptable tolling approach.
Thus, the Base Case forecast assumes that from 2017 to 2024, drivers would be charged a percentage of
the revenue-maximizing toll rate based on the percentage of construction that had been completed. The truck toll schedule used in the baseline revenue forecast is shown in Exhibit 21 below.
Exhibit 21: Baseline Toll Schedule (Nominal $)
2010 2011 2012 2013 2014 2015 2016 2017 2018 2019 2020 2021 2022 2023 2024 2025
Revenue max. toll $137 $140 $143 $147 $151 $155 $158 $162 $166 $171 $175 $179 $184 $188 $193 $198
Ramp-up factor 0% 0% 0% 0% 0% 0% 0% 20% 20% 40% 40% 60% 60% 80% 80% 100%
Toll rate charged $0 $0 $0 $0 $0 $0 $0 $32 $33 $68 $70 $108 $110 $151 $154 $198
Source: PB Analysis
The Phase 2 Base Case forecast maintains the same assumption as the Phase 1 study regarding the
number and location of tolling facilities on I-80: there would be only one facility constructed in the middle
of the I-80 corridor, west of Rawlins and the WY-789 junction. This assumption was relaxed to analyze the impact of alternate tolling schemes on toll revenues in the Alternate Tolling Assumptions section
below.
Using the assumed toll schedule and single tolling facility location, new revenue curves were produced for
2025, which would be the first year where full revenue-maximizing toll fees are charged. The Base Case toll rate and revenue schedules for 2025 are presented in Exhibits 19a and 19b. The toll rates are
shown in 2025 nominal dollars and are based on a set of toll rates in 2008 dollars in $10 increments,
from $30 to $240, grown at an assumed 2.5 percent annual inflation rate from 2008 to 2025. Exhibit 20 shows that the Base Case revenue-maximizing toll rate is $198/truck and $19/passenger vehicle, which
would generate $493 million in revenues in 2025.
Exhibit 19a: Base Case Tolled Truck and Passenger Traffic and Revenue, 2025 (million $)
2008 Toll
Rate
2025 Toll
Rate
Diversion AADTT AAD Tolled
Trucks
Revenue 2008 Toll
Rate
2025 Toll
Rate
Diversion AADT AAD Tolled
Cars
Revenue
$30 $46 4% 8,969 8,969 $149.4 $3.0 $4.56 5% 7,770 7,770 $12.9
$40 $61 9% 8,518 8,518 $189.2 $4.0 $6.09 11% 7,277 7,277 $16.2
$50 $76 13% 8,162 8,162 $226.6 $5.0 $7.61 16% 6,886 6,886 $19.1
$60 $91 18% 7,632 7,632 $254.3 $6.0 $9.13 23% 6,306 6,306 $21.0
$70 $107 23% 7,234 7,234 $281.2 $7.0 $10.65 28% 5,870 5,870 $22.8
$80 $122 27% 6,859 6,859 $304.8 $8.0 $12.17 33% 5,460 5,460 $24.3
$90 $137 29% 6,663 6,663 $333.0 $9.0 $13.69 36% 5,245 5,245 $26.2
$100 $152 31% 6,472 6,472 $359.5 $10.0 $15.22 39% 5,036 5,036 $28.0
$110 $167 31% 6,472 6,472 $395.4 $11.0 $16.74 39% 5,036 5,036 $30.8
$120 $183 32% 6,349 6,349 $423.1 $12.0 $18.26 40% 4,901 4,901 $32.7
$130 $198 32% 6,341 6,341 $457.8 $13.0 $19.78 40% 4,892 4,892 $35.3
$140 $213 36% 5,965 5,965 $463.8 $14.0 $21.30 45% 4,481 4,481 $34.8
$150 $228 44% 5,220 5,220 $434.9 $15.0 $22.82 55% 3,665 3,665 $30.5
$160 $243 45% 5,194 5,194 $461.5 $16.0 $24.35 56% 3,636 3,636 $32.3
$170 $259 45% 5,139 5,139 $485.2 $17.0 $25.87 56% 3,576 3,576 $33.8
$180 $274 51% 4,612 4,612 $461.1 $18.0 $27.39 63% 3,000 3,000 $30.0
$190 $289 57% 4,014 4,014 $423.6 $19.0 $28.91 71% 2,345 2,345 $24.7
$200 $304 58% 3,933 3,933 $436.9 $20.0 $30.43 72% 2,256 2,256 $25.1
$210 $320 61% 3,697 3,697 $431.2 $21.0 $31.95 75% 2,050 2,050 $23.9
$220 $335 64% 3,379 3,379 $412.9 $22.0 $33.48 75% 2,050 2,050 $25.1
$230 $350 80% 1,889 1,889 $241.3 $23.0 $35.00 75% 2,050 2,050 $26.2
$240 $365 81% 1,753 1,753 $233.7 $24.0 $36.52 75% 2,050 2,050 $27.3
Truck Passenger Car
Source: PB Analysis
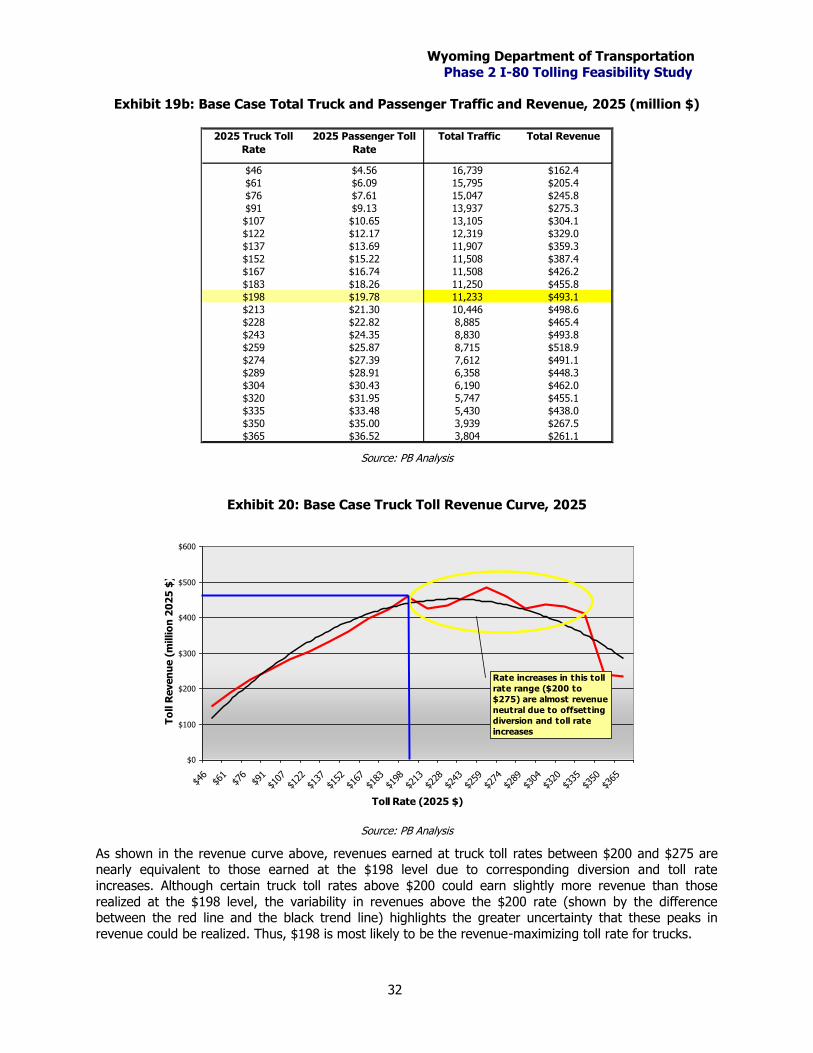
Wyoming Department of Transportation
Phase 2 I-80 Tolling Feasibility Study
32
Exhibit 19b: Base Case Total Truck and Passenger Traffic and Revenue, 2025 (million $)
2025 Truck Toll
Rate
2025 Passenger Toll
Rate
Total Traffic Total Revenue
$46 $4.56 16,739 $162.4
$61 $6.09 15,795 $205.4
$76 $7.61 15,047 $245.8
$91 $9.13 13,937 $275.3
$107 $10.65 13,105 $304.1
$122 $12.17 12,319 $329.0
$137 $13.69 11,907 $359.3
$152 $15.22 11,508 $387.4
$167 $16.74 11,508 $426.2
$183 $18.26 11,250 $455.8
$198 $19.78 11,233 $493.1
$213 $21.30 10,446 $498.6
$228 $22.82 8,885 $465.4
$243 $24.35 8,830 $493.8
$259 $25.87 8,715 $518.9
$274 $27.39 7,612 $491.1
$289 $28.91 6,358 $448.3
$304 $30.43 6,190 $462.0
$320 $31.95 5,747 $455.1
$335 $33.48 5,430 $438.0
$350 $35.00 3,939 $267.5
$365 $36.52 3,804 $261.1
Source: PB Analysis
Exhibit 20: Base Case Truck Toll Revenue Curve, 2025
$0
$100
$200
$300
$400
$500
$600
$46
$61
$76
$91
$107
$122
$137
$152
$167
$183
$198
$213
$228
$243
$259
$274
$289
$304
$320
$335
$350
$365
Toll Rate (2025 $)
To
ll R
even
ue (
millio
n 2
02
5 $
)
Rate increases in this toll
rate range ($200 to
$275) are almost revenue
neutral due to offsetting
diversion and toll rate
increases
Source: PB Analysis
As shown in the revenue curve above, revenues earned at truck toll rates between $200 and $275 are nearly equivalent to those earned at the $198 level due to corresponding diversion and toll rate
increases. Although certain truck toll rates above $200 could earn slightly more revenue than those
realized at the $198 level, the variability in revenues above the $200 rate (shown by the difference between the red line and the black trend line) highlights the greater uncertainty that these peaks in
revenue could be realized. Thus, $198 is most likely to be the revenue-maximizing toll rate for trucks.
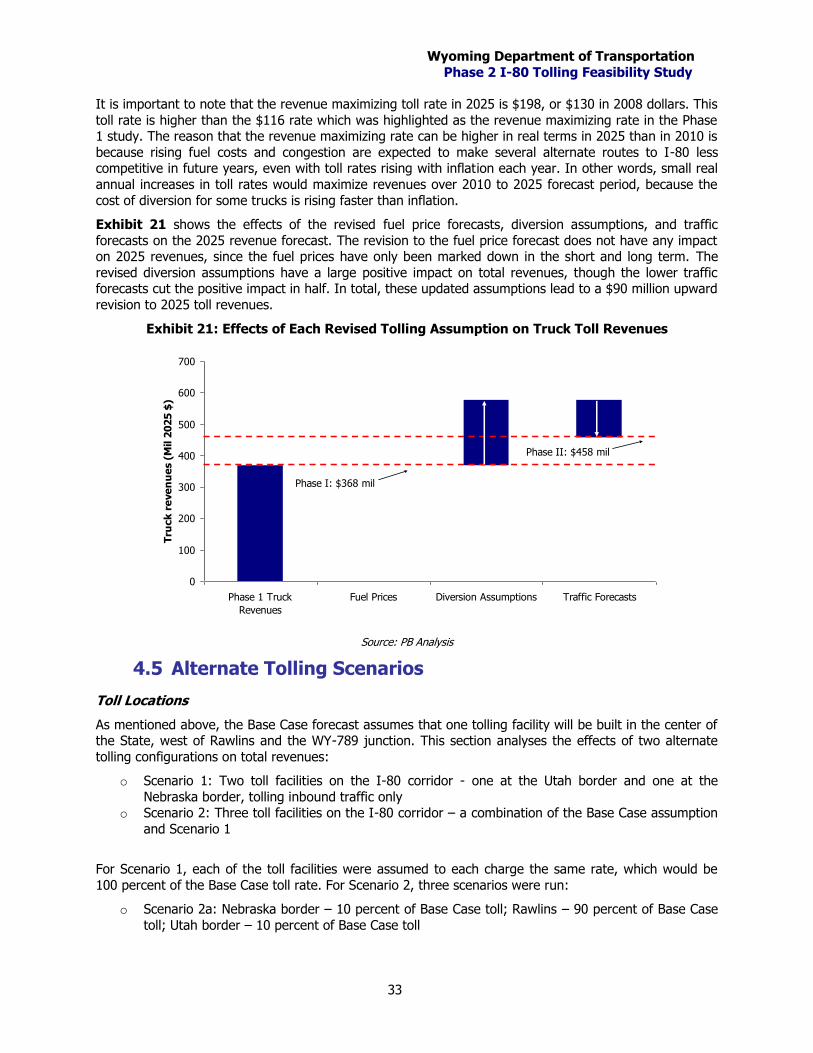
Wyoming Department of Transportation
Phase 2 I-80 Tolling Feasibility Study
33
It is important to note that the revenue maximizing toll rate in 2025 is $198, or $130 in 2008 dollars. This
toll rate is higher than the $116 rate which was highlighted as the revenue maximizing rate in the Phase 1 study. The reason that the revenue maximizing rate can be higher in real terms in 2025 than in 2010 is
because rising fuel costs and congestion are expected to make several alternate routes to I-80 less competitive in future years, even with toll rates rising with inflation each year. In other words, small real
annual increases in toll rates would maximize revenues over 2010 to 2025 forecast period, because the
cost of diversion for some trucks is rising faster than inflation.
Exhibit 21 shows the effects of the revised fuel price forecasts, diversion assumptions, and traffic
forecasts on the 2025 revenue forecast. The revision to the fuel price forecast does not have any impact on 2025 revenues, since the fuel prices have only been marked down in the short and long term. The
revised diversion assumptions have a large positive impact on total revenues, though the lower traffic forecasts cut the positive impact in half. In total, these updated assumptions lead to a $90 million upward
revision to 2025 toll revenues.
Exhibit 21: Effects of Each Revised Tolling Assumption on Truck Toll Revenues
0
100
200
300
400
500
600
700
Phase 1 Truck
Revenues
Fuel Prices Diversion Assumptions Traffic Forecasts
Tru
ck
re
ve
nu
es (
Mil 2
02
5 $
)
Phase I: $368 mil
Phase II: $458 mil
Source: PB Analysis
4.5 Alternate Tolling Scenarios
Toll Locations
As mentioned above, the Base Case forecast assumes that one tolling facility will be built in the center of the State, west of Rawlins and the WY-789 junction. This section analyses the effects of two alternate
tolling configurations on total revenues:
o Scenario 1: Two toll facilities on the I-80 corridor - one at the Utah border and one at the
Nebraska border, tolling inbound traffic only o Scenario 2: Three toll facilities on the I-80 corridor – a combination of the Base Case assumption
and Scenario 1
For Scenario 1, each of the toll facilities were assumed to each charge the same rate, which would be
100 percent of the Base Case toll rate. For Scenario 2, three scenarios were run:
o Scenario 2a: Nebraska border – 10 percent of Base Case toll; Rawlins – 90 percent of Base Case
toll; Utah border – 10 percent of Base Case toll
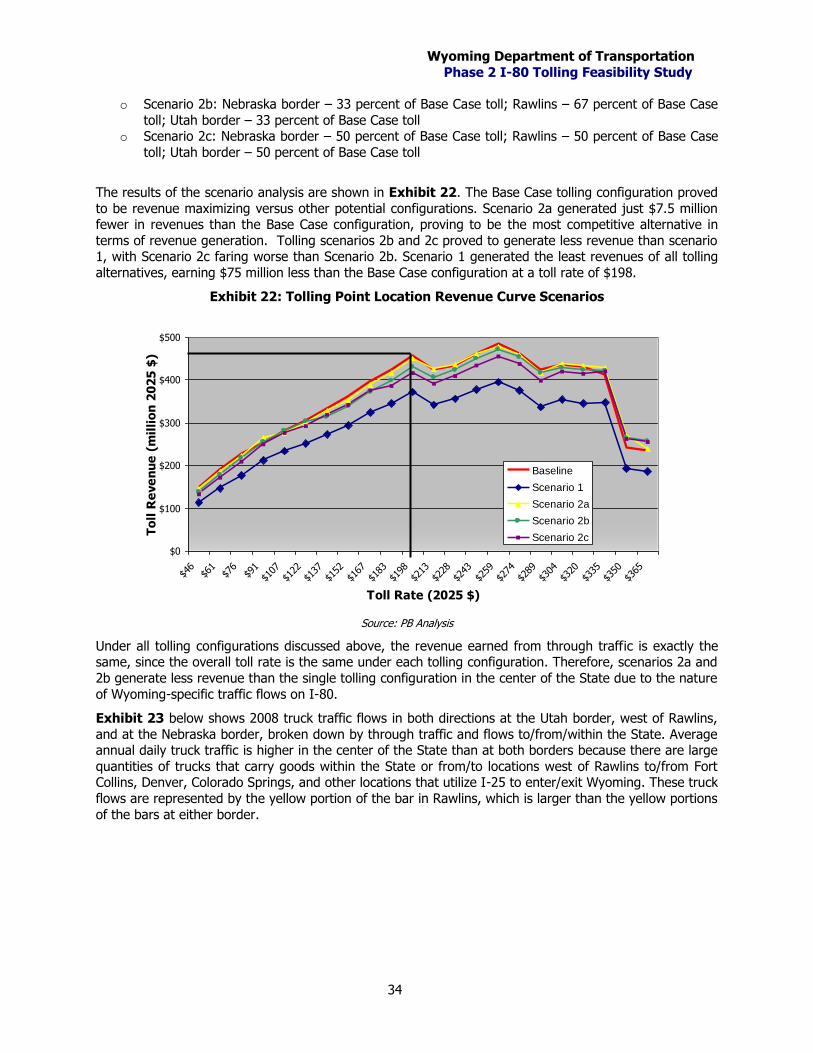
Wyoming Department of Transportation
Phase 2 I-80 Tolling Feasibility Study
34
o Scenario 2b: Nebraska border – 33 percent of Base Case toll; Rawlins – 67 percent of Base Case
toll; Utah border – 33 percent of Base Case toll o Scenario 2c: Nebraska border – 50 percent of Base Case toll; Rawlins – 50 percent of Base Case
toll; Utah border – 50 percent of Base Case toll
The results of the scenario analysis are shown in Exhibit 22. The Base Case tolling configuration proved
to be revenue maximizing versus other potential configurations. Scenario 2a generated just $7.5 million fewer in revenues than the Base Case configuration, proving to be the most competitive alternative in
terms of revenue generation. Tolling scenarios 2b and 2c proved to generate less revenue than scenario 1, with Scenario 2c faring worse than Scenario 2b. Scenario 1 generated the least revenues of all tolling
alternatives, earning $75 million less than the Base Case configuration at a toll rate of $198.
Exhibit 22: Tolling Point Location Revenue Curve Scenarios
$0
$100
$200
$300
$400
$500
$46
$61
$76
$91
$107
$122
$137
$152
$167
$183
$198
$213
$228
$243
$259
$274
$289
$304
$320
$335
$350
$365
Toll Rate (2025 $)
To
ll R
eve
nu
e (
mil
lio
n 2
02
5 $
)
Baseline
Scenario 1
Scenario 2a
Scenario 2b
Scenario 2c
Source: PB Analysis
Under all tolling configurations discussed above, the revenue earned from through traffic is exactly the same, since the overall toll rate is the same under each tolling configuration. Therefore, scenarios 2a and
2b generate less revenue than the single tolling configuration in the center of the State due to the nature
of Wyoming-specific traffic flows on I-80.
Exhibit 23 below shows 2008 truck traffic flows in both directions at the Utah border, west of Rawlins,
and at the Nebraska border, broken down by through traffic and flows to/from/within the State. Average annual daily truck traffic is higher in the center of the State than at both borders because there are large
quantities of trucks that carry goods within the State or from/to locations west of Rawlins to/from Fort Collins, Denver, Colorado Springs, and other locations that utilize I-25 to enter/exit Wyoming. These truck
flows are represented by the yellow portion of the bar in Rawlins, which is larger than the yellow portions
of the bars at either border.
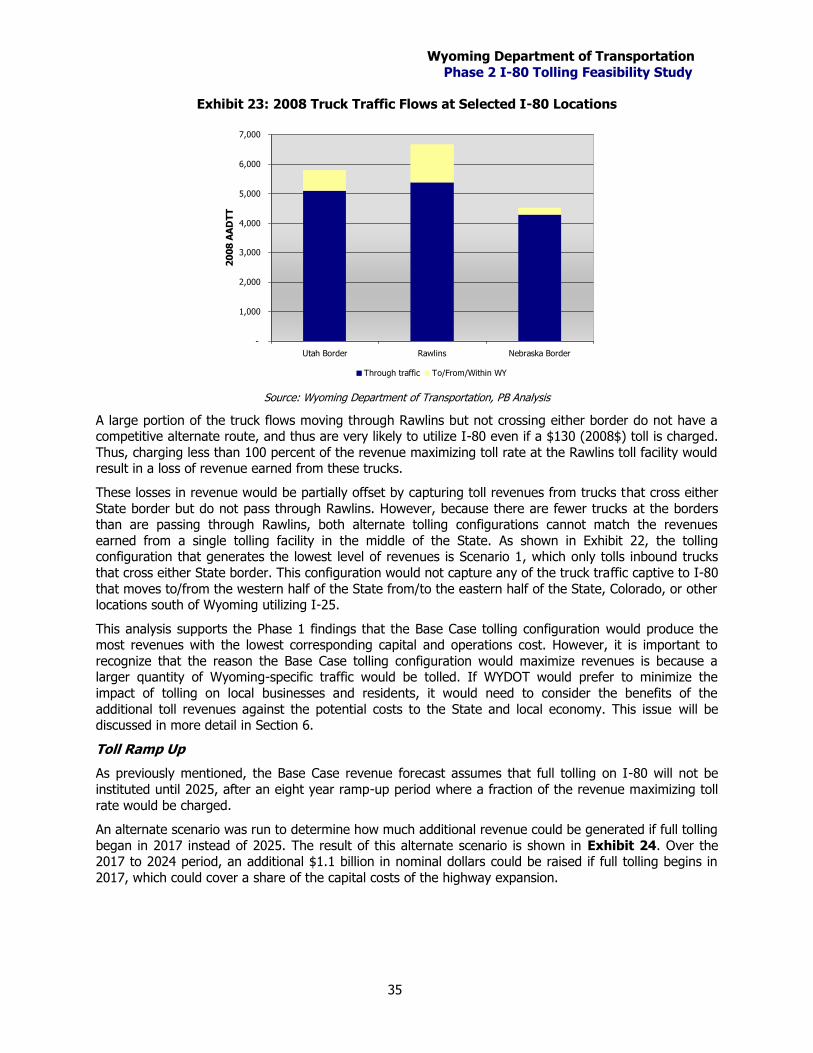
Wyoming Department of Transportation
Phase 2 I-80 Tolling Feasibility Study
35
Exhibit 23: 2008 Truck Traffic Flows at Selected I-80 Locations
-
1,000
2,000
3,000
4,000
5,000
6,000
7,000
Utah Border Rawlins Nebraska Border
20
08
AA
DT
T
Through traffic To/From/Within WY
Source: Wyoming Department of Transportation, PB Analysis
A large portion of the truck flows moving through Rawlins but not crossing either border do not have a competitive alternate route, and thus are very likely to utilize I-80 even if a $130 (2008$) toll is charged.
Thus, charging less than 100 percent of the revenue maximizing toll rate at the Rawlins toll facility would result in a loss of revenue earned from these trucks.
These losses in revenue would be partially offset by capturing toll revenues from trucks that cross either
State border but do not pass through Rawlins. However, because there are fewer trucks at the borders than are passing through Rawlins, both alternate tolling configurations cannot match the revenues
earned from a single tolling facility in the middle of the State. As shown in Exhibit 22, the tolling configuration that generates the lowest level of revenues is Scenario 1, which only tolls inbound trucks
that cross either State border. This configuration would not capture any of the truck traffic captive to I-80
that moves to/from the western half of the State from/to the eastern half of the State, Colorado, or other locations south of Wyoming utilizing I-25.
This analysis supports the Phase 1 findings that the Base Case tolling configuration would produce the most revenues with the lowest corresponding capital and operations cost. However, it is important to
recognize that the reason the Base Case tolling configuration would maximize revenues is because a larger quantity of Wyoming-specific traffic would be tolled. If WYDOT would prefer to minimize the
impact of tolling on local businesses and residents, it would need to consider the benefits of the
additional toll revenues against the potential costs to the State and local economy. This issue will be discussed in more detail in Section 6.
Toll Ramp Up
As previously mentioned, the Base Case revenue forecast assumes that full tolling on I-80 will not be
instituted until 2025, after an eight year ramp-up period where a fraction of the revenue maximizing toll
rate would be charged.
An alternate scenario was run to determine how much additional revenue could be generated if full tolling
began in 2017 instead of 2025. The result of this alternate scenario is shown in Exhibit 24. Over the 2017 to 2024 period, an additional $1.1 billion in nominal dollars could be raised if full tolling begins in
2017, which could cover a share of the capital costs of the highway expansion.
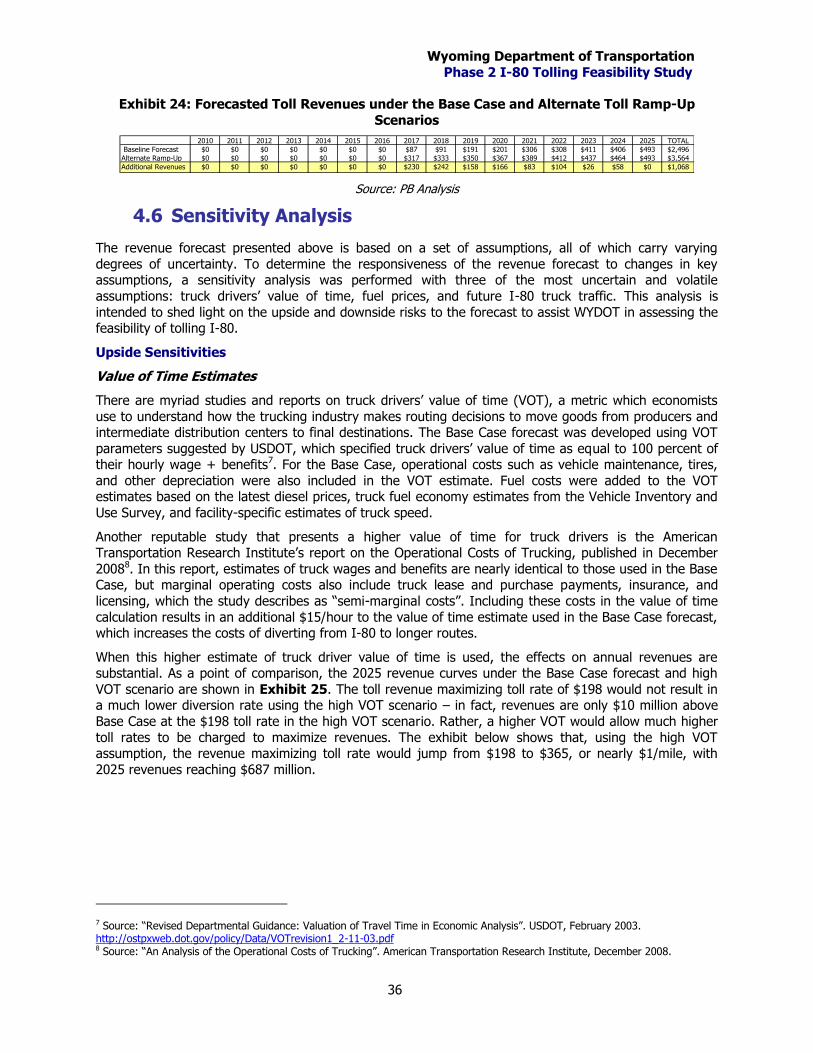
Wyoming Department of Transportation
Phase 2 I-80 Tolling Feasibility Study
36
Exhibit 24: Forecasted Toll Revenues under the Base Case and Alternate Toll Ramp-Up
Scenarios
2010 2011 2012 2013 2014 2015 2016 2017 2018 2019 2020 2021 2022 2023 2024 2025 TOTAL
Baseline Forecast $0 $0 $0 $0 $0 $0 $0 $87 $91 $191 $201 $306 $308 $411 $406 $493 $2,496
Alternate Ramp-Up $0 $0 $0 $0 $0 $0 $0 $317 $333 $350 $367 $389 $412 $437 $464 $493 $3,564
Additional Revenues $0 $0 $0 $0 $0 $0 $0 $230 $242 $158 $166 $83 $104 $26 $58 $0 $1,068
Source: PB Analysis
4.6 Sensitivity Analysis
The revenue forecast presented above is based on a set of assumptions, all of which carry varying
degrees of uncertainty. To determine the responsiveness of the revenue forecast to changes in key assumptions, a sensitivity analysis was performed with three of the most uncertain and volatile
assumptions: truck drivers’ value of time, fuel prices, and future I-80 truck traffic. This analysis is
intended to shed light on the upside and downside risks to the forecast to assist WYDOT in assessing the feasibility of tolling I-80.
Upside Sensitivities
Value of Time Estimates
There are myriad studies and reports on truck drivers’ value of time (VOT), a metric which economists
use to understand how the trucking industry makes routing decisions to move goods from producers and intermediate distribution centers to final destinations. The Base Case forecast was developed using VOT
parameters suggested by USDOT, which specified truck drivers’ value of time as equal to 100 percent of their hourly wage + benefits7. For the Base Case, operational costs such as vehicle maintenance, tires,
and other depreciation were also included in the VOT estimate. Fuel costs were added to the VOT estimates based on the latest diesel prices, truck fuel economy estimates from the Vehicle Inventory and
Use Survey, and facility-specific estimates of truck speed.
Another reputable study that presents a higher value of time for truck drivers is the American Transportation Research Institute’s report on the Operational Costs of Trucking, published in December
20088. In this report, estimates of truck wages and benefits are nearly identical to those used in the Base Case, but marginal operating costs also include truck lease and purchase payments, insurance, and
licensing, which the study describes as “semi-marginal costs”. Including these costs in the value of time
calculation results in an additional $15/hour to the value of time estimate used in the Base Case forecast, which increases the costs of diverting from I-80 to longer routes.
When this higher estimate of truck driver value of time is used, the effects on annual revenues are substantial. As a point of comparison, the 2025 revenue curves under the Base Case forecast and high
VOT scenario are shown in Exhibit 25. The toll revenue maximizing toll rate of $198 would not result in a much lower diversion rate using the high VOT scenario – in fact, revenues are only $10 million above
Base Case at the $198 toll rate in the high VOT scenario. Rather, a higher VOT would allow much higher
toll rates to be charged to maximize revenues. The exhibit below shows that, using the high VOT assumption, the revenue maximizing toll rate would jump from $198 to $365, or nearly $1/mile, with
2025 revenues reaching $687 million.
7 Source: “Revised Departmental Guidance: Valuation of Travel Time in Economic Analysis”. USDOT, February 2003. http://ostpxweb.dot.gov/policy/Data/VOTrevision1_2-11-03.pdf 8 Source: “An Analysis of the Operational Costs of Trucking”. American Transportation Research Institute, December 2008.
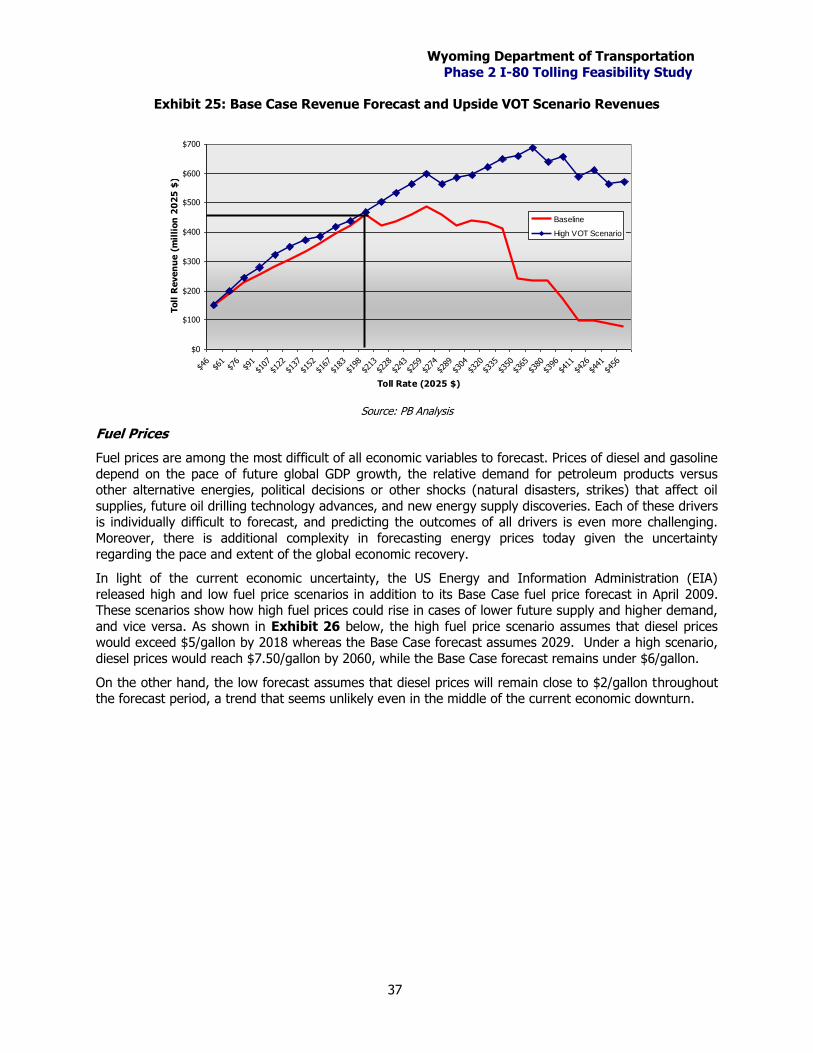
Wyoming Department of Transportation
Phase 2 I-80 Tolling Feasibility Study
37
Exhibit 25: Base Case Revenue Forecast and Upside VOT Scenario Revenues
$0
$100
$200
$300
$400
$500
$600
$700
$46
$61
$76
$91
$107
$122
$137
$152
$167
$183
$198
$213
$228
$243
$259
$274
$289
$304
$320
$335
$350
$365
$380
$396
$411
$426
$441
$456
Toll Rate (2025 $)
Toll
Reven
ue (
mil
lion
20
25
$)
Baseline
High VOT Scenario
Source: PB Analysis
Fuel Prices
Fuel prices are among the most difficult of all economic variables to forecast. Prices of diesel and gasoline
depend on the pace of future global GDP growth, the relative demand for petroleum products versus other alternative energies, political decisions or other shocks (natural disasters, strikes) that affect oil
supplies, future oil drilling technology advances, and new energy supply discoveries. Each of these drivers is individually difficult to forecast, and predicting the outcomes of all drivers is even more challenging.
Moreover, there is additional complexity in forecasting energy prices today given the uncertainty
regarding the pace and extent of the global economic recovery.
In light of the current economic uncertainty, the US Energy and Information Administration (EIA)
released high and low fuel price scenarios in addition to its Base Case fuel price forecast in April 2009. These scenarios show how high fuel prices could rise in cases of lower future supply and higher demand,
and vice versa. As shown in Exhibit 26 below, the high fuel price scenario assumes that diesel prices would exceed $5/gallon by 2018 whereas the Base Case forecast assumes 2029. Under a high scenario,
diesel prices would reach $7.50/gallon by 2060, while the Base Case forecast remains under $6/gallon.
On the other hand, the low forecast assumes that diesel prices will remain close to $2/gallon throughout the forecast period, a trend that seems unlikely even in the middle of the current economic downturn.
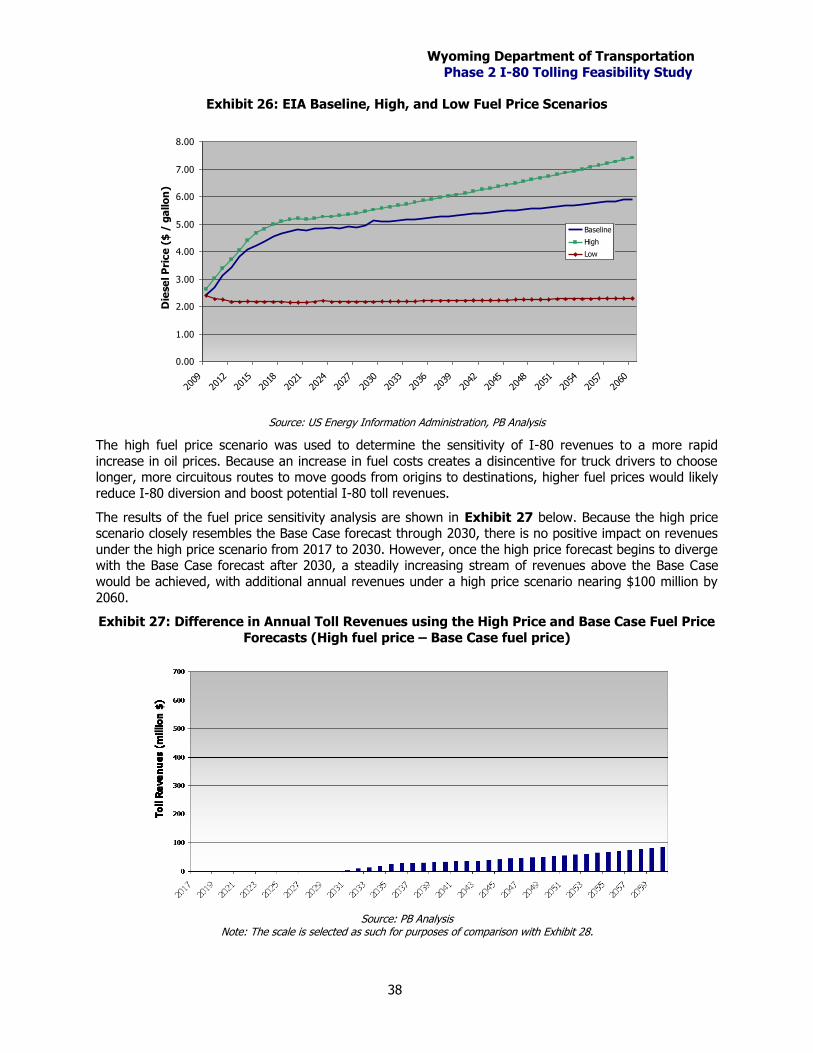
Wyoming Department of Transportation
Phase 2 I-80 Tolling Feasibility Study
38
Exhibit 26: EIA Baseline, High, and Low Fuel Price Scenarios
0.00
1.00
2.00
3.00
4.00
5.00
6.00
7.00
8.00
2009
2012
2015
2018
2021
2024
2027
2030
2033
2036
2039
2042
2045
2048
2051
2054
2057
2060
Die
se
l P
rice
($
/ g
allo
n)
Baseline
High
Low
Source: US Energy Information Administration, PB Analysis
The high fuel price scenario was used to determine the sensitivity of I-80 revenues to a more rapid
increase in oil prices. Because an increase in fuel costs creates a disincentive for truck drivers to choose longer, more circuitous routes to move goods from origins to destinations, higher fuel prices would likely
reduce I-80 diversion and boost potential I-80 toll revenues.
The results of the fuel price sensitivity analysis are shown in Exhibit 27 below. Because the high price scenario closely resembles the Base Case forecast through 2030, there is no positive impact on revenues
under the high price scenario from 2017 to 2030. However, once the high price forecast begins to diverge with the Base Case forecast after 2030, a steadily increasing stream of revenues above the Base Case
would be achieved, with additional annual revenues under a high price scenario nearing $100 million by
2060.
Exhibit 27: Difference in Annual Toll Revenues using the High Price and Base Case Fuel Price
Forecasts (High fuel price – Base Case fuel price)
Source: PB Analysis Note: The scale is selected as such for purposes of comparison with Exhibit 28.
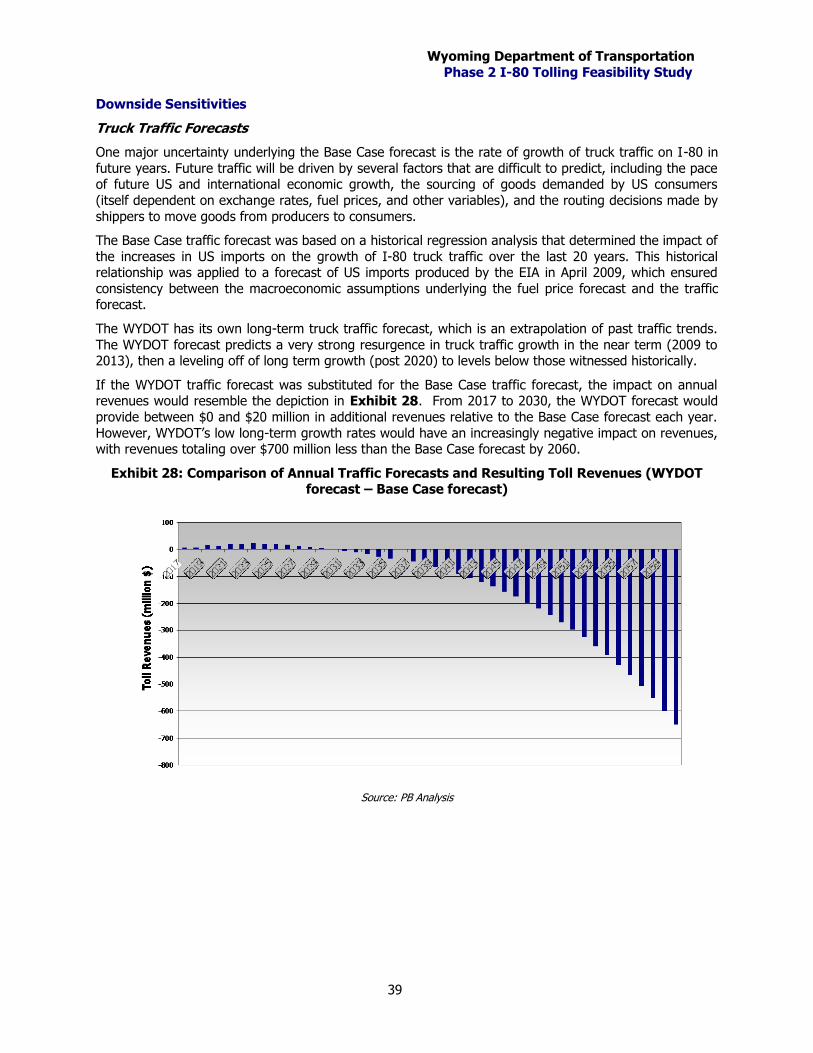
Wyoming Department of Transportation
Phase 2 I-80 Tolling Feasibility Study
39
Downside Sensitivities
Truck Traffic Forecasts
One major uncertainty underlying the Base Case forecast is the rate of growth of truck traffic on I-80 in
future years. Future traffic will be driven by several factors that are difficult to predict, including the pace of future US and international economic growth, the sourcing of goods demanded by US consumers
(itself dependent on exchange rates, fuel prices, and other variables), and the routing decisions made by
shippers to move goods from producers to consumers.
The Base Case traffic forecast was based on a historical regression analysis that determined the impact of
the increases in US imports on the growth of I-80 truck traffic over the last 20 years. This historical relationship was applied to a forecast of US imports produced by the EIA in April 2009, which ensured
consistency between the macroeconomic assumptions underlying the fuel price forecast and the traffic forecast.
The WYDOT has its own long-term truck traffic forecast, which is an extrapolation of past traffic trends.
The WYDOT forecast predicts a very strong resurgence in truck traffic growth in the near term (2009 to 2013), then a leveling off of long term growth (post 2020) to levels below those witnessed historically.
If the WYDOT traffic forecast was substituted for the Base Case traffic forecast, the impact on annual revenues would resemble the depiction in Exhibit 28. From 2017 to 2030, the WYDOT forecast would
provide between $0 and $20 million in additional revenues relative to the Base Case forecast each year.
However, WYDOT’s low long-term growth rates would have an increasingly negative impact on revenues, with revenues totaling over $700 million less than the Base Case forecast by 2060.
Exhibit 28: Comparison of Annual Traffic Forecasts and Resulting Toll Revenues (WYDOT forecast – Base Case forecast)
Source: PB Analysis
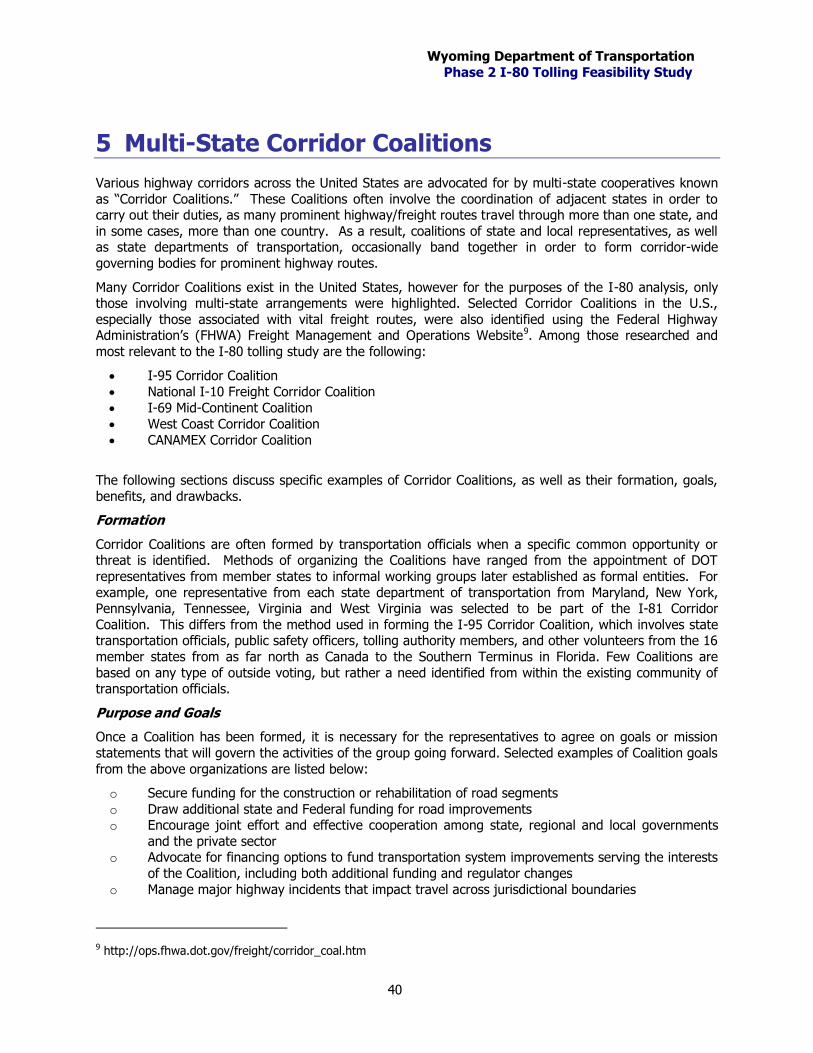
Wyoming Department of Transportation
Phase 2 I-80 Tolling Feasibility Study
40
5 Multi-State Corridor Coalitions
Various highway corridors across the United States are advocated for by multi-state cooperatives known
as “Corridor Coalitions.” These Coalitions often involve the coordination of adjacent states in order to carry out their duties, as many prominent highway/freight routes travel through more than one state, and
in some cases, more than one country. As a result, coalitions of state and local representatives, as well as state departments of transportation, occasionally band together in order to form corridor-wide
governing bodies for prominent highway routes.
Many Corridor Coalitions exist in the United States, however for the purposes of the I-80 analysis, only those involving multi-state arrangements were highlighted. Selected Corridor Coalitions in the U.S.,
especially those associated with vital freight routes, were also identified using the Federal Highway Administration’s (FHWA) Freight Management and Operations Website9. Among those researched and
most relevant to the I-80 tolling study are the following:
I-95 Corridor Coalition
National I-10 Freight Corridor Coalition
I-69 Mid-Continent Coalition
West Coast Corridor Coalition
CANAMEX Corridor Coalition
The following sections discuss specific examples of Corridor Coalitions, as well as their formation, goals,
benefits, and drawbacks.
Formation
Corridor Coalitions are often formed by transportation officials when a specific common opportunity or threat is identified. Methods of organizing the Coalitions have ranged from the appointment of DOT
representatives from member states to informal working groups later established as formal entities. For
example, one representative from each state department of transportation from Maryland, New York, Pennsylvania, Tennessee, Virginia and West Virginia was selected to be part of the I-81 Corridor
Coalition. This differs from the method used in forming the I-95 Corridor Coalition, which involves state transportation officials, public safety officers, tolling authority members, and other volunteers from the 16
member states from as far north as Canada to the Southern Terminus in Florida. Few Coalitions are
based on any type of outside voting, but rather a need identified from within the existing community of transportation officials.
Purpose and Goals
Once a Coalition has been formed, it is necessary for the representatives to agree on goals or mission
statements that will govern the activities of the group going forward. Selected examples of Coalition goals
from the above organizations are listed below:
o Secure funding for the construction or rehabilitation of road segments
o Draw additional state and Federal funding for road improvements o Encourage joint effort and effective cooperation among state, regional and local governments
and the private sector o Advocate for financing options to fund transportation system improvements serving the interests
of the Coalition, including both additional funding and regulator changes
o Manage major highway incidents that impact travel across jurisdictional boundaries
9 http://ops.fhwa.dot.gov/freight/corridor_coal.htm
Wyoming Department of Transportation
Phase 2 I-80 Tolling Feasibility Study
41
A major impetus to form many of the above Coalitions has been the perceived need to lobby the Federal
government on behalf of a corridor or a significant project taking place within a corridor. Since Federal transportation funding is partially released on a competitive basis, or earmarked for specific projects, it is
necessary for organizations to make sure their needs are identified and advocated for when funding is being divided among the list of all possible recipients.
Another major source of funding identified and examined by Corridor Coalitions has been the securing of
private investment along important highway corridors. The West Coast Corridor Coalition, for example, lists one of its goals as, “[to] encourage joint effort and effective cooperation among west coast state,
regional and local governments and the private sector.” While Federal funding is a vital part of the funding picture, it is also necessary for many projects to have an organization in place to leverage private
investment for future work.
In certain instances, a regional Coalition is formed in order to meet the needs of a specific highway
project. This is the case for the Continental One Trade Corridor, which was formed with the express
purpose of completing a 1,500 mile trade route between Toronto and Miami. The Continental One Trade Corridor is an alliance of business, community, and government leaders dedicated to the oversight of the
initial project’s completion, as well as its continued success. The group has been responsible for activities ranging from raising money from the private sector, to hiring lobbyists in Washington D.C. to make sure
the project is well represented. Another Corridor Coalition formed to carry out a specific project was
CANAMEX, a joint project of Arizona, Nevada, Idaho, Utah and Montana. While Arizona is the leader of this effort, the Coalition involves representatives from the United States, Mexico, and Canada. The goal
of this organization is to complete a continuous four-lane highway from Canada to Mexico.
Most relevant to the I-80 study is a Coalition that was formed, at least partially, to regulate policy or
lobby in favor of tolling on a road segment. The I-95 Corridor Coalition includes tolling authorities among its leadership, and has been active in shaping tolling projects along the I-95 corridor. One example of this
is the push by the I-95 Coalition for more interoperability among the states in terms of tolling collection.
Related to this is the group’s interest in moving the corridor toward electronic tolling collection. The group has been active in carrying out pilot programs and other studies in order to advance their tolling
policies for I-95.
Costs and Benefits
Corridor Coalitions can be beneficial in that they allow the coordination of resources among all
states/regions adjacent to a corridor, rather than disjointed policymaking in each jurisdiction. The forming of Coalitions also makes lobbying more effective, as the collective voice of multiple corridor
supporters is more likely to be heard than that of an individual lobbyist. Furthermore, the setting of unified goals for an entire corridor helps ensure a unified approach to policymaking and project delivery.
While Coalitions can be beneficial as seen above, they can be unwieldy for many of the same reasons.
Individual representatives from each state or region along the corridor most likely will not have the same policy goals, making coordination and the initial setting of a work plan difficult. This is a serious
detriment if one or more decisions to be made about the corridor plan are of a time-sensitive nature.
Application for I-80 Project
In order to better more effectively address funding issues execute tolling along on the I-80 corridor, it is feasible that aWyoming and neighboring states sharing the same I-80 challenges may benefit from
forming a multi-state Corridor Coalition. The coalition could be formed with the goals of coordinating
tolling policy, implementation in a unified tolling approach, and requesting Federal approvals to toll jointly. If tolling is not pursued, Anothera goal of the cCoalition could simply be lobbying for increased
Federal funding to be directed toward the improvement of I-80, as has been the case of many ofdone in many of the cCoalitions discussed earlier. The national significance of I-80 as a freight corridor could be
highlighted in a bid for special funding, earmarks, or other financial support.
In brief discussions with both Nebraska and Iowa department of transportation personnel regarding the I-80 toll study being performed by WYDOT, enthusiasm was shown for continued communication on I-80
Wyoming Department of Transportation
Phase 2 I-80 Tolling Feasibility Study
42
traffic and funding issues. Nebraska and Iowa share Wyoming’s challenges in that much of the freight
traffic that converges in Salt Lake City (heading east) and Chicago (heading west) travels through these states on I-80. While they clearly understand that a need exists, it does not appear that Nebraska or
Iowa have developed specific plans that can be deployed to address I-80 roadway degradation.
Nebraska - Over the past 15 years, Nebraska has focused on improving the section of I-80 between
Lincoln and Omaha, as this is the most congested I-80 segment in the state. Nebraska reconstructed this
60-mile stretch to a 6-lane cross section to accommodate traffic demand and replaced the old, worn out interstate with a completely new roadway (base and surface) that can be maintained over the next 20 to
30 years. Nebraska’s next challenge is addressing the outdated 400-mile section of the roadway between Lincoln and the Wyoming border. This section meets traffic capacity demands but is in need of major
rehabilitation or replacement, similar to I-80 in Wyoming. Very preliminary estimates by Nebraska DOT indicate that replacing this stretch of I-80 will cost approximately $1 billion.
Nebraska officials have not held major discussions on the specific mechanism that will be used to fund
the remaining improvements to I-80. While it will certainly be a major undertaking, the DOT will undertake the reconstruction incrementally over several years. Nebraska maintains a highway trust fund
that combines Federal and state funding and was used to pay for much of the recent I-80 improvements.
Iowa - Iowa has taken approaches similar to those of Nebraska in rehabilitating and widening portions of
I-80 in the major metropolitan areas where congestion issues exist. Iowa has also been studying its
system needs in anticipation of major investments in its roadway infrastructure. In 2006 Iowa performed a roadway system analysis to estimate what deficiencies existed both on and off the interstates and the
related costs of addressing these items. It concluded that several billion dollars in investments were needed on I-80 to upgrade the pavement and replace sections that do not meet standards.
A portion of the analysis performed by the Iowa Department of Transportation dealt with funding mechanisms for the roadway work being contemplated. The department inventoried current funding
mechanisms and surveyed other states to list mechanisms the legislature could consider to fill the
potential funding gap. Tolling was discussed but the department determined that it would be difficult to implement because there are so many parallel routes that traffic could easily divert to. The study
resulted in Iowa changing their registration fee structure in 2008 to generate more funding for roadways, though this will not suffice to pay for needed I-80 improvements. Gasoline tax increases were also
discussed but the governor decided that such increases would be inappropriate during an economic
recession. Gasoline tax increases may be revisited in the future.
In brief discussions with both Nebraska and Iowa department of transportation personnel regarding the
I-80 toll study being performed by WYDOT, enthusiasm was shown for continued communication on I-80 traffic and funding issues, though tolling was not under consideration by either state. Under a non-tolled
approach, both states expressed support of the idea that a formal corridor coalition could The Coalition
would help to create a unified voice highlighting the states’ needs on I-80 due to its national importance as a freight corridor. Lobbying efforts targeted at the Federal government to get more funding for the
upkeep of I-80 under a non-tolled approach could be more productive if coordinated among several states.
create a unified voice for public outreach at the outset of the new project’s implementation in order to
ensure increased acceptance of the I-80 tolling project.
Part of the Phase 2 Study is to reach out to neighboring states and gauge their interest in tolling on I-80 and the formation of a multi-state Corridor Coalition to further tolling or other funding initiatives.
Through the sharing of information and ideas, the I-80 corridor states will put themselves in better positions to be heard in Washington and identify solutions to their shared maintenance funding issues.
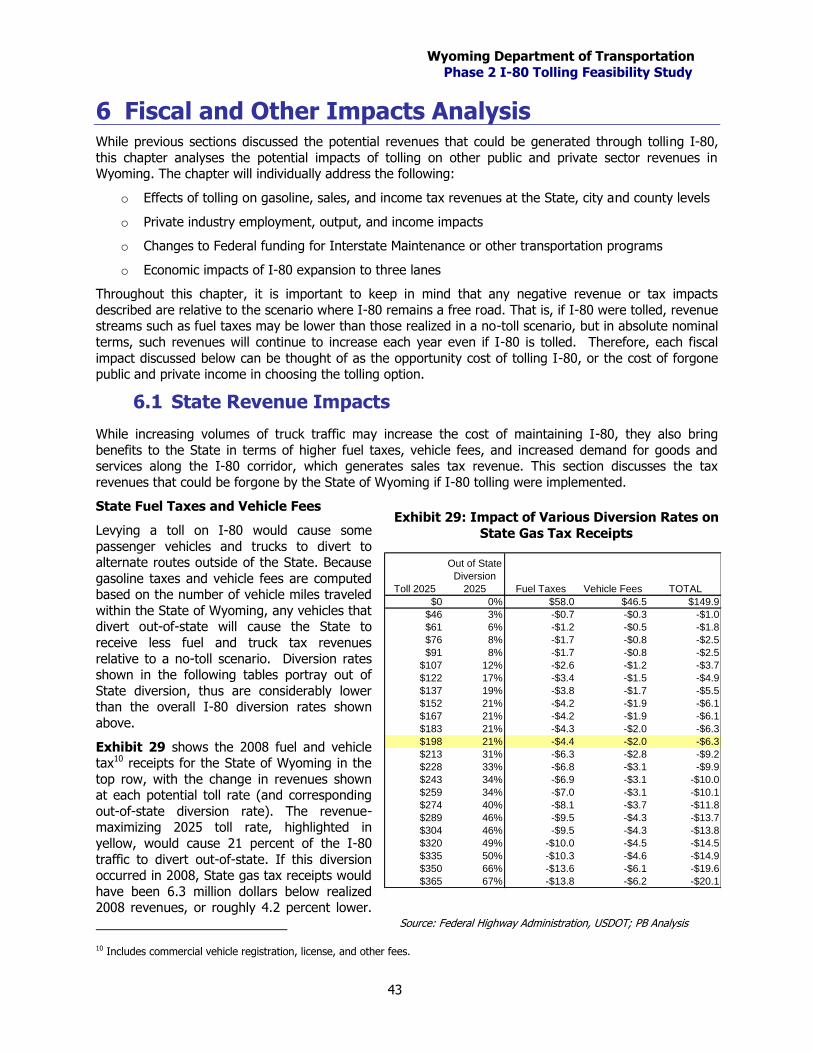
Wyoming Department of Transportation
Phase 2 I-80 Tolling Feasibility Study
43
6 Fiscal and Other Impacts Analysis While previous sections discussed the potential revenues that could be generated through tolling I-80,
this chapter analyses the potential impacts of tolling on other public and private sector revenues in Wyoming. The chapter will individually address the following:
o Effects of tolling on gasoline, sales, and income tax revenues at the State, city and county levels
o Private industry employment, output, and income impacts
o Changes to Federal funding for Interstate Maintenance or other transportation programs
o Economic impacts of I-80 expansion to three lanes
Throughout this chapter, it is important to keep in mind that any negative revenue or tax impacts
described are relative to the scenario where I-80 remains a free road. That is, if I-80 were tolled, revenue streams such as fuel taxes may be lower than those realized in a no-toll scenario, but in absolute nominal
terms, such revenues will continue to increase each year even if I-80 is tolled. Therefore, each fiscal
impact discussed below can be thought of as the opportunity cost of tolling I-80, or the cost of forgone public and private income in choosing the tolling option.
6.1 State Revenue Impacts
While increasing volumes of truck traffic may increase the cost of maintaining I-80, they also bring
benefits to the State in terms of higher fuel taxes, vehicle fees, and increased demand for goods and services along the I-80 corridor, which generates sales tax revenue. This section discusses the tax
revenues that could be forgone by the State of Wyoming if I-80 tolling were implemented.
State Fuel Taxes and Vehicle Fees
Levying a toll on I-80 would cause some
passenger vehicles and trucks to divert to alternate routes outside of the State. Because
gasoline taxes and vehicle fees are computed based on the number of vehicle miles traveled
within the State of Wyoming, any vehicles that divert out-of-state will cause the State to
receive less fuel and truck tax revenues
relative to a no-toll scenario. Diversion rates shown in the following tables portray out of
State diversion, thus are considerably lower than the overall I-80 diversion rates shown
above.
Exhibit 29 shows the 2008 fuel and vehicle tax10 receipts for the State of Wyoming in the
top row, with the change in revenues shown at each potential toll rate (and corresponding
out-of-state diversion rate). The revenue-maximizing 2025 toll rate, highlighted in
yellow, would cause 21 percent of the I-80
traffic to divert out-of-state. If this diversion occurred in 2008, State gas tax receipts would
have been 6.3 million dollars below realized 2008 revenues, or roughly 4.2 percent lower.
10 Includes commercial vehicle registration, license, and other fees.
Exhibit 29: Impact of Various Diversion Rates on
State Gas Tax Receipts
Toll 2025
Out of State
Diversion
2025 Fuel Taxes Vehicle Fees TOTAL
$0 0% $58.0 $46.5 $149.9
$46 3% -$0.7 -$0.3 -$1.0
$61 6% -$1.2 -$0.5 -$1.8
$76 8% -$1.7 -$0.8 -$2.5
$91 8% -$1.7 -$0.8 -$2.5
$107 12% -$2.6 -$1.2 -$3.7
$122 17% -$3.4 -$1.5 -$4.9
$137 19% -$3.8 -$1.7 -$5.5
$152 21% -$4.2 -$1.9 -$6.1
$167 21% -$4.2 -$1.9 -$6.1
$183 21% -$4.3 -$2.0 -$6.3
$198 21% -$4.4 -$2.0 -$6.3
$213 31% -$6.3 -$2.8 -$9.2
$228 33% -$6.8 -$3.1 -$9.9
$243 34% -$6.9 -$3.1 -$10.0
$259 34% -$7.0 -$3.1 -$10.1
$274 40% -$8.1 -$3.7 -$11.8
$289 46% -$9.5 -$4.3 -$13.7
$304 46% -$9.5 -$4.3 -$13.8
$320 49% -$10.0 -$4.5 -$14.5
$335 50% -$10.3 -$4.6 -$14.9
$350 66% -$13.6 -$6.1 -$19.6
$365 67% -$13.8 -$6.2 -$20.1
Source: Federal Highway Administration, USDOT; PB Analysis
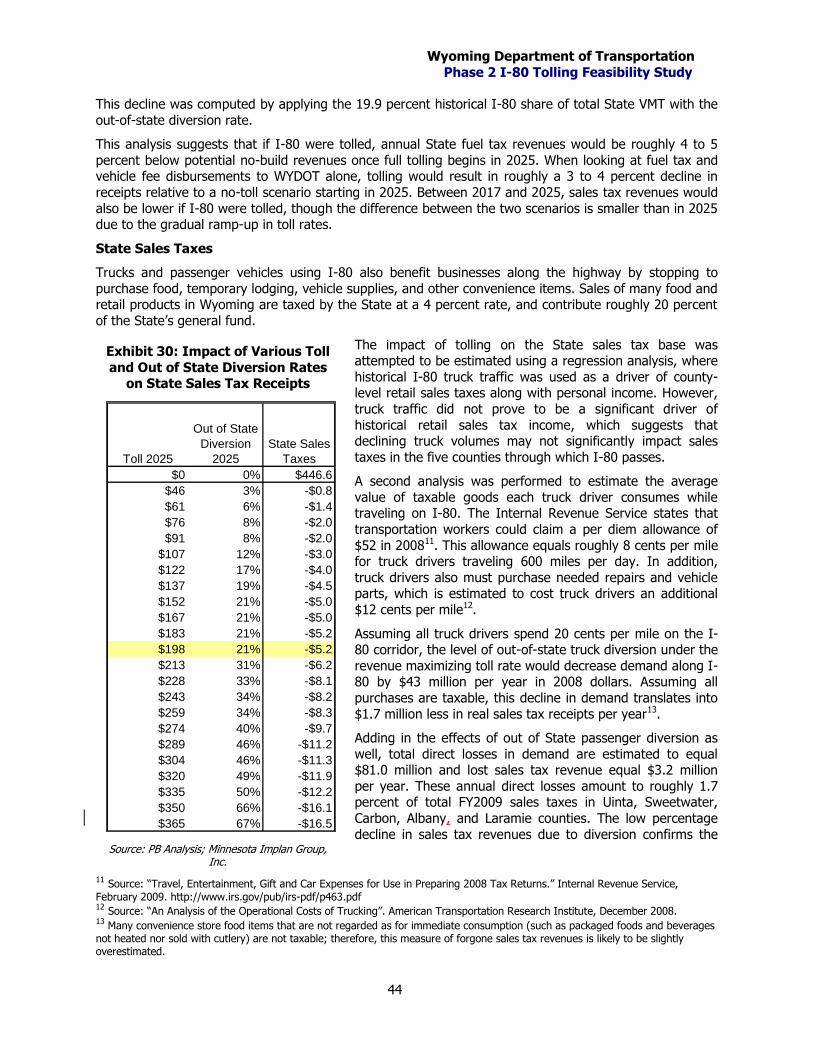
Wyoming Department of Transportation
Phase 2 I-80 Tolling Feasibility Study
44
This decline was computed by applying the 19.9 percent historical I-80 share of total State VMT with the
out-of-state diversion rate.
This analysis suggests that if I-80 were tolled, annual State fuel tax revenues would be roughly 4 to 5
percent below potential no-build revenues once full tolling begins in 2025. When looking at fuel tax and vehicle fee disbursements to WYDOT alone, tolling would result in roughly a 3 to 4 percent decline in
receipts relative to a no-toll scenario starting in 2025. Between 2017 and 2025, sales tax revenues would
also be lower if I-80 were tolled, though the difference between the two scenarios is smaller than in 2025 due to the gradual ramp-up in toll rates.
State Sales Taxes
Trucks and passenger vehicles using I-80 also benefit businesses along the highway by stopping to
purchase food, temporary lodging, vehicle supplies, and other convenience items. Sales of many food and retail products in Wyoming are taxed by the State at a 4 percent rate, and contribute roughly 20 percent
of the State’s general fund.
The impact of tolling on the State sales tax base was attempted to be estimated using a regression analysis, where
historical I-80 truck traffic was used as a driver of county-level retail sales taxes along with personal income. However,
truck traffic did not prove to be a significant driver of
historical retail sales tax income, which suggests that declining truck volumes may not significantly impact sales
taxes in the five counties through which I-80 passes.
A second analysis was performed to estimate the average
value of taxable goods each truck driver consumes while traveling on I-80. The Internal Revenue Service states that
transportation workers could claim a per diem allowance of
$52 in 200811. This allowance equals roughly 8 cents per mile for truck drivers traveling 600 miles per day. In addition,
truck drivers also must purchase needed repairs and vehicle parts, which is estimated to cost truck drivers an additional
$12 cents per mile12.
Assuming all truck drivers spend 20 cents per mile on the I-80 corridor, the level of out-of-state truck diversion under the
revenue maximizing toll rate would decrease demand along I-80 by $43 million per year in 2008 dollars. Assuming all
purchases are taxable, this decline in demand translates into
$1.7 million less in real sales tax receipts per year13.
Adding in the effects of out of State passenger diversion as
well, total direct losses in demand are estimated to equal $81.0 million and lost sales tax revenue equal $3.2 million
per year. These annual direct losses amount to roughly 1.7 percent of total FY2009 sales taxes in Uinta, Sweetwater,
Carbon, Albany, and Laramie counties. The low percentage
decline in sales tax revenues due to diversion confirms the
11 Source: “Travel, Entertainment, Gift and Car Expenses for Use in Preparing 2008 Tax Returns.” Internal Revenue Service,
February 2009. http://www.irs.gov/pub/irs-pdf/p463.pdf 12 Source: “An Analysis of the Operational Costs of Trucking”. American Transportation Research Institute, December 2008. 13
Many convenience store food items that are not regarded as for immediate consumption (such as packaged foods and beverages not heated nor sold with cutlery) are not taxable; therefore, this measure of forgone sales tax revenues is likely to be slightly overestimated.
Exhibit 30: Impact of Various Toll
and Out of State Diversion Rates on State Sales Tax Receipts
Toll 2025
Out of State
Diversion
2025
State Sales
Taxes
$0 0% $446.6
$46 3% -$0.8
$61 6% -$1.4
$76 8% -$2.0
$91 8% -$2.0
$107 12% -$3.0
$122 17% -$4.0
$137 19% -$4.5
$152 21% -$5.0
$167 21% -$5.0
$183 21% -$5.2
$198 21% -$5.2
$213 31% -$6.2
$228 33% -$8.1
$243 34% -$8.2
$259 34% -$8.3
$274 40% -$9.7
$289 46% -$11.2
$304 46% -$11.3
$320 49% -$11.9
$335 50% -$12.2
$350 66% -$16.1
$365 67% -$16.5
Source: PB Analysis; Minnesota Implan Group, Inc.
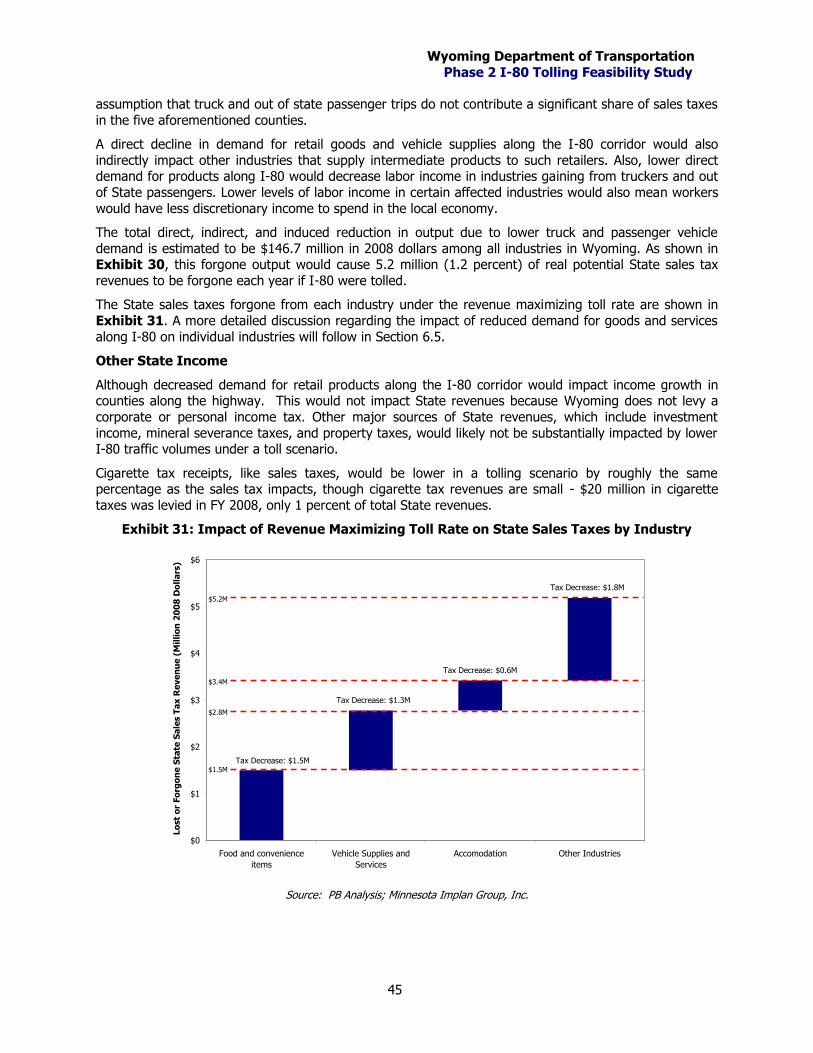
Wyoming Department of Transportation
Phase 2 I-80 Tolling Feasibility Study
45
assumption that truck and out of state passenger trips do not contribute a significant share of sales taxes
in the five aforementioned counties.
A direct decline in demand for retail goods and vehicle supplies along the I-80 corridor would also
indirectly impact other industries that supply intermediate products to such retailers. Also, lower direct demand for products along I-80 would decrease labor income in industries gaining from truckers and out
of State passengers. Lower levels of labor income in certain affected industries would also mean workers
would have less discretionary income to spend in the local economy.
The total direct, indirect, and induced reduction in output due to lower truck and passenger vehicle
demand is estimated to be $146.7 million in 2008 dollars among all industries in Wyoming. As shown in Exhibit 30, this forgone output would cause 5.2 million (1.2 percent) of real potential State sales tax
revenues to be forgone each year if I-80 were tolled.
The State sales taxes forgone from each industry under the revenue maximizing toll rate are shown in
Exhibit 31. A more detailed discussion regarding the impact of reduced demand for goods and services
along I-80 on individual industries will follow in Section 6.5.
Other State Income
Although decreased demand for retail products along the I-80 corridor would impact income growth in counties along the highway. This would not impact State revenues because Wyoming does not levy a
corporate or personal income tax. Other major sources of State revenues, which include investment
income, mineral severance taxes, and property taxes, would likely not be substantially impacted by lower I-80 traffic volumes under a toll scenario.
Cigarette tax receipts, like sales taxes, would be lower in a tolling scenario by roughly the same percentage as the sales tax impacts, though cigarette tax revenues are small - $20 million in cigarette
taxes was levied in FY 2008, only 1 percent of total State revenues.
Exhibit 31: Impact of Revenue Maximizing Toll Rate on State Sales Taxes by Industry
$0
$1
$2
$3
$4
$5
$6
Food and convenience
items
Vehicle Supplies and
Services
Accomodation Other Industries
Lo
st
or
Fo
rgo
ne
Sta
te S
ale
s T
ax
Re
ve
nu
e (
Mil
lio
n 2
00
8 D
oll
ars
)
Tax Decrease: $1.5M
Tax Decrease: $1.3M
Tax Decrease: $0.6M
Tax Decrease: $1.8M
$1.5M
$2.8M
$3.4M
$5.2M
Source: PB Analysis; Minnesota Implan Group, Inc.
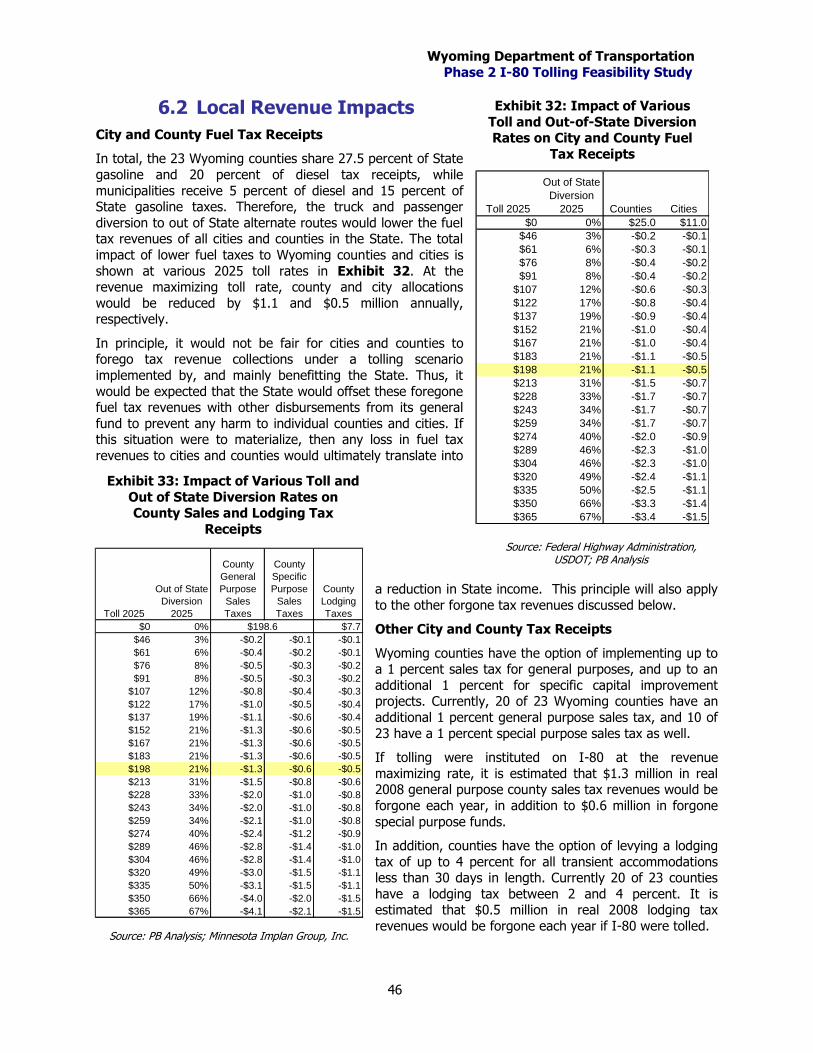
Wyoming Department of Transportation
Phase 2 I-80 Tolling Feasibility Study
46
6.2 Local Revenue Impacts
City and County Fuel Tax Receipts
In total, the 23 Wyoming counties share 27.5 percent of State
gasoline and 20 percent of diesel tax receipts, while
municipalities receive 5 percent of diesel and 15 percent of State gasoline taxes. Therefore, the truck and passenger
diversion to out of State alternate routes would lower the fuel tax revenues of all cities and counties in the State. The total
impact of lower fuel taxes to Wyoming counties and cities is
shown at various 2025 toll rates in Exhibit 32. At the revenue maximizing toll rate, county and city allocations
would be reduced by $1.1 and $0.5 million annually, respectively.
In principle, it would not be fair for cities and counties to forego tax revenue collections under a tolling scenario
implemented by, and mainly benefitting the State. Thus, it
would be expected that the State would offset these foregone fuel tax revenues with other disbursements from its general
fund to prevent any harm to individual counties and cities. If this situation were to materialize, then any loss in fuel tax
revenues to cities and counties would ultimately translate into
a reduction in State income. This principle will also apply
to the other forgone tax revenues discussed below.
Other City and County Tax Receipts
Wyoming counties have the option of implementing up to a 1 percent sales tax for general purposes, and up to an
additional 1 percent for specific capital improvement projects. Currently, 20 of 23 Wyoming counties have an
additional 1 percent general purpose sales tax, and 10 of
23 have a 1 percent special purpose sales tax as well.
If tolling were instituted on I-80 at the revenue
maximizing rate, it is estimated that $1.3 million in real 2008 general purpose county sales tax revenues would be
forgone each year, in addition to $0.6 million in forgone
special purpose funds.
In addition, counties have the option of levying a lodging
tax of up to 4 percent for all transient accommodations less than 30 days in length. Currently 20 of 23 counties
have a lodging tax between 2 and 4 percent. It is estimated that $0.5 million in real 2008 lodging tax
revenues would be forgone each year if I-80 were tolled.
Exhibit 32: Impact of Various
Toll and Out-of-State Diversion Rates on City and County Fuel
Tax Receipts
Source: PB Analysis; Minnesota Implan Group, Inc.
Source: Federal Highway Administration, USDOT; PB Analysis
Toll 2025
Out of State
Diversion
2025 Counties Cities
$0 0% $25.0 $11.0
$46 3% -$0.2 -$0.1
$61 6% -$0.3 -$0.1
$76 8% -$0.4 -$0.2
$91 8% -$0.4 -$0.2
$107 12% -$0.6 -$0.3
$122 17% -$0.8 -$0.4
$137 19% -$0.9 -$0.4
$152 21% -$1.0 -$0.4
$167 21% -$1.0 -$0.4
$183 21% -$1.1 -$0.5
$198 21% -$1.1 -$0.5
$213 31% -$1.5 -$0.7
$228 33% -$1.7 -$0.7
$243 34% -$1.7 -$0.7
$259 34% -$1.7 -$0.7
$274 40% -$2.0 -$0.9
$289 46% -$2.3 -$1.0
$304 46% -$2.3 -$1.0
$320 49% -$2.4 -$1.1
$335 50% -$2.5 -$1.1
$350 66% -$3.3 -$1.4
$365 67% -$3.4 -$1.5
Exhibit 33: Impact of Various Toll and
Out of State Diversion Rates on County Sales and Lodging Tax
Receipts
Toll 2025
Out of State
Diversion
2025
County
General
Purpose
Sales
Taxes
County
Specific
Purpose
Sales
Taxes
County
Lodging
Taxes
$0 0% $7.7
$46 3% -$0.2 -$0.1 -$0.1
$61 6% -$0.4 -$0.2 -$0.1
$76 8% -$0.5 -$0.3 -$0.2
$91 8% -$0.5 -$0.3 -$0.2
$107 12% -$0.8 -$0.4 -$0.3
$122 17% -$1.0 -$0.5 -$0.4
$137 19% -$1.1 -$0.6 -$0.4
$152 21% -$1.3 -$0.6 -$0.5
$167 21% -$1.3 -$0.6 -$0.5
$183 21% -$1.3 -$0.6 -$0.5
$198 21% -$1.3 -$0.6 -$0.5
$213 31% -$1.5 -$0.8 -$0.6
$228 33% -$2.0 -$1.0 -$0.8
$243 34% -$2.0 -$1.0 -$0.8
$259 34% -$2.1 -$1.0 -$0.8
$274 40% -$2.4 -$1.2 -$0.9
$289 46% -$2.8 -$1.4 -$1.0
$304 46% -$2.8 -$1.4 -$1.0
$320 49% -$3.0 -$1.5 -$1.1
$335 50% -$3.1 -$1.5 -$1.1
$350 66% -$4.0 -$2.0 -$1.5
$365 67% -$4.1 -$2.1 -$1.5
$198.6
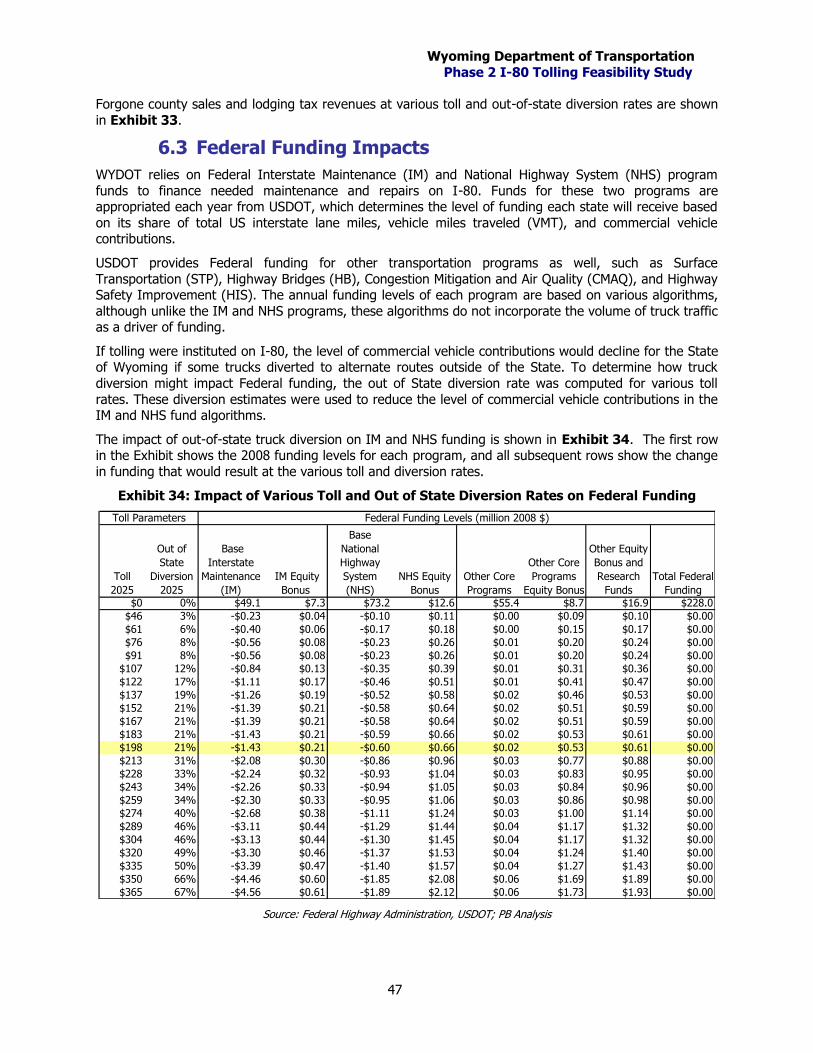
Wyoming Department of Transportation
Phase 2 I-80 Tolling Feasibility Study
47
Forgone county sales and lodging tax revenues at various toll and out-of-state diversion rates are shown
in Exhibit 33.
6.3 Federal Funding Impacts
WYDOT relies on Federal Interstate Maintenance (IM) and National Highway System (NHS) program
funds to finance needed maintenance and repairs on I-80. Funds for these two programs are appropriated each year from USDOT, which determines the level of funding each state will receive based
on its share of total US interstate lane miles, vehicle miles traveled (VMT), and commercial vehicle contributions.
USDOT provides Federal funding for other transportation programs as well, such as Surface
Transportation (STP), Highway Bridges (HB), Congestion Mitigation and Air Quality (CMAQ), and Highway Safety Improvement (HIS). The annual funding levels of each program are based on various algorithms,
although unlike the IM and NHS programs, these algorithms do not incorporate the volume of truck traffic as a driver of funding.
If tolling were instituted on I-80, the level of commercial vehicle contributions would decline for the State of Wyoming if some trucks diverted to alternate routes outside of the State. To determine how truck
diversion might impact Federal funding, the out of State diversion rate was computed for various toll
rates. These diversion estimates were used to reduce the level of commercial vehicle contributions in the IM and NHS fund algorithms.
The impact of out-of-state truck diversion on IM and NHS funding is shown in Exhibit 34. The first row in the Exhibit shows the 2008 funding levels for each program, and all subsequent rows show the change
in funding that would result at the various toll and diversion rates.
Exhibit 34: Impact of Various Toll and Out of State Diversion Rates on Federal Funding
Toll
2025
Out of
State
Diversion
2025
Base
Interstate
Maintenance
(IM)
IM Equity
Bonus
Base
National
Highway
System
(NHS)
NHS Equity
Bonus
Other Core
Programs
Other Core
Programs
Equity Bonus
Other Equity
Bonus and
Research
Funds
Total Federal
Funding$0 0% $49.1 $7.3 $73.2 $12.6 $55.4 $8.7 $16.9 $228.0
$46 3% -$0.23 $0.04 -$0.10 $0.11 $0.00 $0.09 $0.10 $0.00
$61 6% -$0.40 $0.06 -$0.17 $0.18 $0.00 $0.15 $0.17 $0.00
$76 8% -$0.56 $0.08 -$0.23 $0.26 $0.01 $0.20 $0.24 $0.00
$91 8% -$0.56 $0.08 -$0.23 $0.26 $0.01 $0.20 $0.24 $0.00
$107 12% -$0.84 $0.13 -$0.35 $0.39 $0.01 $0.31 $0.36 $0.00
$122 17% -$1.11 $0.17 -$0.46 $0.51 $0.01 $0.41 $0.47 $0.00
$137 19% -$1.26 $0.19 -$0.52 $0.58 $0.02 $0.46 $0.53 $0.00
$152 21% -$1.39 $0.21 -$0.58 $0.64 $0.02 $0.51 $0.59 $0.00
$167 21% -$1.39 $0.21 -$0.58 $0.64 $0.02 $0.51 $0.59 $0.00
$183 21% -$1.43 $0.21 -$0.59 $0.66 $0.02 $0.53 $0.61 $0.00
$198 21% -$1.43 $0.21 -$0.60 $0.66 $0.02 $0.53 $0.61 $0.00
$213 31% -$2.08 $0.30 -$0.86 $0.96 $0.03 $0.77 $0.88 $0.00
$228 33% -$2.24 $0.32 -$0.93 $1.04 $0.03 $0.83 $0.95 $0.00
$243 34% -$2.26 $0.33 -$0.94 $1.05 $0.03 $0.84 $0.96 $0.00
$259 34% -$2.30 $0.33 -$0.95 $1.06 $0.03 $0.86 $0.98 $0.00
$274 40% -$2.68 $0.38 -$1.11 $1.24 $0.03 $1.00 $1.14 $0.00
$289 46% -$3.11 $0.44 -$1.29 $1.44 $0.04 $1.17 $1.32 $0.00
$304 46% -$3.13 $0.44 -$1.30 $1.45 $0.04 $1.17 $1.32 $0.00
$320 49% -$3.30 $0.46 -$1.37 $1.53 $0.04 $1.24 $1.40 $0.00
$335 50% -$3.39 $0.47 -$1.40 $1.57 $0.04 $1.27 $1.43 $0.00
$350 66% -$4.46 $0.60 -$1.85 $2.08 $0.06 $1.69 $1.89 $0.00
$365 67% -$4.56 $0.61 -$1.89 $2.12 $0.06 $1.73 $1.93 $0.00
Toll Parameters Federal Funding Levels (million 2008 $)
Source: Federal Highway Administration, USDOT; PB Analysis
Wyoming Department of Transportation
Phase 2 I-80 Tolling Feasibility Study
48
If the revenue maximizing toll rate, highlighted in yellow, were instituted in 2008, base IM and NHS
funding would have declined $1.43 million and $0.60 million, or 2.9 and 0.8 percent, respectively. However, the increase in Equity Bonus program funding would have offset some of the losses in funding
for these programs – IM Equity Bonus funding would have increased $0.21 million, and NHS funding would have increased by $0.66 million. Moreover, the funds lost in the IM program would be shifted to
other core programs, such as Surface Transportation and Highway Bridges, through increased Equity
Bonus funding. Due to the Equity Bonus program, total Federal funding levels would remain constant at all levels of tolling.
The Equity Bonus program, created as part of SAFETEA-LU, is designed to ensure that states receive a minimum level of Federal funding as determined by USDOT. Under the program, additional funds are
allocated to each state so that its total Federal funding equals the greater of the two “hold harmless” provisions:
92 percent of the state’s contribution to the highway portion of the Highway Trust Fund
The state’s share of total average annual apportionments during the six years of TEA-21,
provided states meet certain criteria14
Under SAFETEA-LU, Wyoming currently receives Equity Bonus funds based on the second provision, which guarantees that total Federal funding for the state must equal 0.69 percent of the total target
Federal funding program size, not including penalties. In 2008, total funding apportioned to all 50 states was $34.7 billion, of which 0.69 percent is $238 million; with penalties, the total 2008 apportionment for
Wyoming equaled $228 million. Thus, based on the hold harmless provisions of the Equity Bonus
program under SAFETEA-LU, Wyoming would be guaranteed to receive its 0.69 share of total Federal funding across all states.
Equity Funds are allocated to each of the six “core” programs, which include IM, NHS, STP, HB, CMAQ, and HSI, according to each program’s share of total core funding. Therefore, if IM and NHS funding
decreased due to lower I-80 VMT, the shares of these two programs would decrease, and a larger share of the Equity Bonus funds would shift to the other four core programs. This explains why funding
increases for the other core programs in Exhibit 34 above.
The bottom line regarding the impact of tolling on Federal funding is that, if the Equity Bonus program is included in future Federal transportation funding legislation, Wyoming will not face an overall decline in
Federal funding. A small share of IM and NHS funds would be shifted to other programs if tolling were implemented, but for the most part funding for these two programs would remain constant. However, if
the rules of the Equity Bonus program are changed in the future, or the program is eliminated, Wyoming
could lose a significant percentage of IM and NHS funding.
6.4 Roadway Maintenance Outlays
If trucks diverted from I-80 in future years due to tolling, WYDOT would realize one major benefit – a
reduction in annual I-80 maintenance expenses due to less wear on the highway.
Exhibit 35 shows an estimate of the decrease in pavement maintenance costs per year due to lower
truck and passenger traffic relative to a no-toll scenario. The decline in maintenance outlays was based on the conservative assumption that every 1 percent reduction in traffic would result in a 0.5 percent
reduction in pavement maintenance costs. Under the revenue maximizing toll rate, 2025 pavement maintenance costs would be roughly $25 million, $5 million (16 percent) below the $30 million cost
incurred under a no-toll scenario.
14 States must meet a minimum of one of the following criteria: 1) population density < 40 persons per square mile; 2) federal land ownership > 1.25 percent; 3) population < 1 million persons; 4) median household income < $35,000; 5) 2002 fatalities per VMT > 1; 6) indexed state motor fuel tax > 150 percent of federal fuel excise tax.
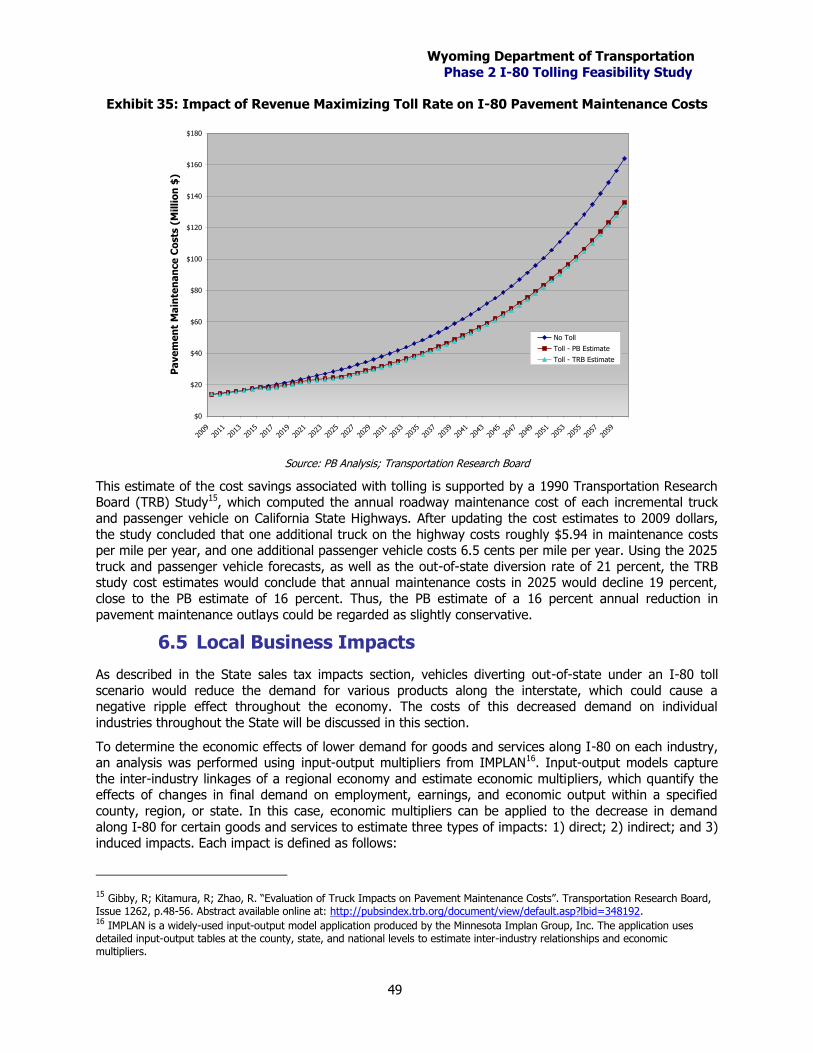
Wyoming Department of Transportation
Phase 2 I-80 Tolling Feasibility Study
49
Exhibit 35: Impact of Revenue Maximizing Toll Rate on I-80 Pavement Maintenance Costs
$0
$20
$40
$60
$80
$100
$120
$140
$160
$180
2009
2011
2013
2015
2017
2019
2021
2023
2025
2027
2029
2031
2033
2035
2037
2039
2041
2043
2045
2047
2049
2051
2053
2055
2057
2059
Pa
ve
me
nt
Ma
inte
na
nce
Co
sts
(M
illi
on
$)
No Toll
Toll - PB Estimate
Toll - TRB Estimate
Source: PB Analysis; Transportation Research Board
This estimate of the cost savings associated with tolling is supported by a 1990 Transportation Research Board (TRB) Study15, which computed the annual roadway maintenance cost of each incremental truck
and passenger vehicle on California State Highways. After updating the cost estimates to 2009 dollars,
the study concluded that one additional truck on the highway costs roughly $5.94 in maintenance costs per mile per year, and one additional passenger vehicle costs 6.5 cents per mile per year. Using the 2025
truck and passenger vehicle forecasts, as well as the out-of-state diversion rate of 21 percent, the TRB study cost estimates would conclude that annual maintenance costs in 2025 would decline 19 percent,
close to the PB estimate of 16 percent. Thus, the PB estimate of a 16 percent annual reduction in
pavement maintenance outlays could be regarded as slightly conservative.
6.5 Local Business Impacts
As described in the State sales tax impacts section, vehicles diverting out-of-state under an I-80 toll
scenario would reduce the demand for various products along the interstate, which could cause a negative ripple effect throughout the economy. The costs of this decreased demand on individual
industries throughout the State will be discussed in this section.
To determine the economic effects of lower demand for goods and services along I-80 on each industry, an analysis was performed using input-output multipliers from IMPLAN16. Input-output models capture
the inter-industry linkages of a regional economy and estimate economic multipliers, which quantify the effects of changes in final demand on employment, earnings, and economic output within a specified
county, region, or state. In this case, economic multipliers can be applied to the decrease in demand
along I-80 for certain goods and services to estimate three types of impacts: 1) direct; 2) indirect; and 3) induced impacts. Each impact is defined as follows:
15 Gibby, R; Kitamura, R; Zhao, R. “Evaluation of Truck Impacts on Pavement Maintenance Costs”. Transportation Research Board, Issue 1262, p.48-56. Abstract available online at: http://pubsindex.trb.org/document/view/default.asp?lbid=348192. 16 IMPLAN is a widely-used input-output model application produced by the Minnesota Implan Group, Inc. The application uses detailed input-output tables at the county, state, and national levels to estimate inter-industry relationships and economic multipliers.
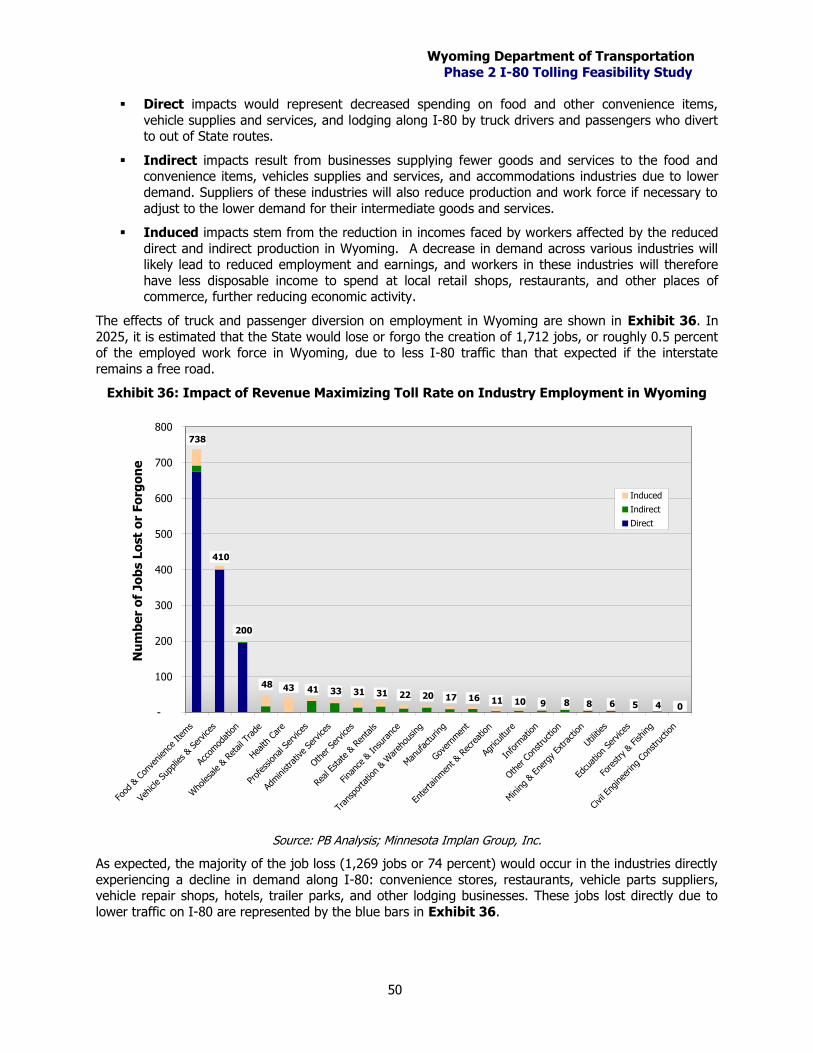
Wyoming Department of Transportation
Phase 2 I-80 Tolling Feasibility Study
50
Direct impacts would represent decreased spending on food and other convenience items,
vehicle supplies and services, and lodging along I-80 by truck drivers and passengers who divert to out of State routes.
Indirect impacts result from businesses supplying fewer goods and services to the food and convenience items, vehicles supplies and services, and accommodations industries due to lower
demand. Suppliers of these industries will also reduce production and work force if necessary to
adjust to the lower demand for their intermediate goods and services.
Induced impacts stem from the reduction in incomes faced by workers affected by the reduced
direct and indirect production in Wyoming. A decrease in demand across various industries will likely lead to reduced employment and earnings, and workers in these industries will therefore
have less disposable income to spend at local retail shops, restaurants, and other places of commerce, further reducing economic activity.
The effects of truck and passenger diversion on employment in Wyoming are shown in Exhibit 36. In
2025, it is estimated that the State would lose or forgo the creation of 1,712 jobs, or roughly 0.5 percent of the employed work force in Wyoming, due to less I-80 traffic than that expected if the interstate
remains a free road.
Exhibit 36: Impact of Revenue Maximizing Toll Rate on Industry Employment in Wyoming
0 4 5 6 8 8 9 10 11 16 17 20 22 31 31 33 41 43 48
200
410
738
-
100
200
300
400
500
600
700
800
Food
& C
onve
nien
ce It
ems
Vehicle Su
pplie
s & S
ervice
s
Acco
mod
ation
Who
lesa
le &
Retail T
rade
Health
Car
e
Profes
siona
l Ser
vice
s
Administ
rativ
e Se
rvice
s
Oth
er Service
s
Real Estate & R
entals
Fina
nce & In
suranc
e
Tran
spor
tatio
n & W
areh
ousin
g
Man
ufac
turin
g
Gove
rnmen
t
Entertainm
ent &
Rec
reation
Agric
ultu
re
Inform
ation
Oth
er C
onstru
ction
Mining & E
nerg
y Ex
trac
tion
Utilit
ies
Edcu
ation Se
rvice
s
Fore
stry &
Fish
ing
Civil E
nginee
ring Co
nstru
ction
Nu
mb
er
of
Jo
bs L
ost
or
Fo
rgo
ne
Induced
Indirect
Direct
Source: PB Analysis; Minnesota Implan Group, Inc.
As expected, the majority of the job loss (1,269 jobs or 74 percent) would occur in the industries directly
experiencing a decline in demand along I-80: convenience stores, restaurants, vehicle parts suppliers, vehicle repair shops, hotels, trailer parks, and other lodging businesses. These jobs lost directly due to
lower traffic on I-80 are represented by the blue bars in Exhibit 36.
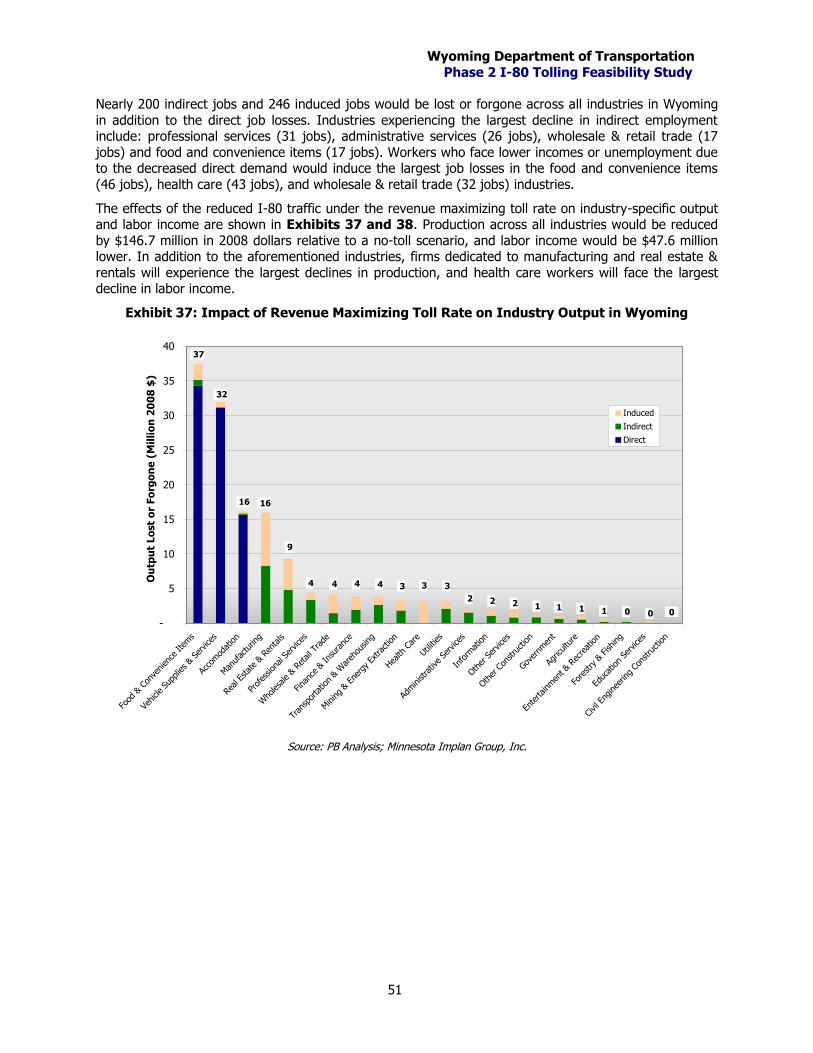
Wyoming Department of Transportation
Phase 2 I-80 Tolling Feasibility Study
51
Nearly 200 indirect jobs and 246 induced jobs would be lost or forgone across all industries in Wyoming
in addition to the direct job losses. Industries experiencing the largest decline in indirect employment include: professional services (31 jobs), administrative services (26 jobs), wholesale & retail trade (17
jobs) and food and convenience items (17 jobs). Workers who face lower incomes or unemployment due to the decreased direct demand would induce the largest job losses in the food and convenience items
(46 jobs), health care (43 jobs), and wholesale & retail trade (32 jobs) industries.
The effects of the reduced I-80 traffic under the revenue maximizing toll rate on industry-specific output and labor income are shown in Exhibits 37 and 38. Production across all industries would be reduced
by $146.7 million in 2008 dollars relative to a no-toll scenario, and labor income would be $47.6 million lower. In addition to the aforementioned industries, firms dedicated to manufacturing and real estate &
rentals will experience the largest declines in production, and health care workers will face the largest decline in labor income.
Exhibit 37: Impact of Revenue Maximizing Toll Rate on Industry Output in Wyoming
0 0 0 1 1 1 1 2 2 2
3 3 3 4 4 4 4
9
16 16
32
37
-
5
10
15
20
25
30
35
40
Food
& C
onve
nien
ce It
ems
Vehicle Su
pplie
s & S
ervice
s
Acco
mod
ation
Man
ufac
turin
g
Real Estate & R
entals
Profes
siona
l Ser
vice
s
Who
lesa
le &
Retail T
rade
Fina
nce & In
suranc
e
Tran
spor
tatio
n & W
areh
ousin
g
Mining & E
nerg
y Ex
trac
tion
Health
Car
e
Utilit
ies
Administ
rativ
e Se
rvice
s
Inform
ation
Oth
er Service
s
Oth
er C
onstru
ction
Gove
rnmen
t
Agric
ultu
re
Entertainm
ent &
Rec
reation
Fore
stry &
Fish
ing
Educ
ation Se
rvice
s
Civil E
nginee
ring Co
nstru
ction
Ou
tpu
t Lo
st
or
Fo
rgo
ne
(M
illi
on
20
08
$)
Induced
Indirect
Direct
Source: PB Analysis; Minnesota Implan Group, Inc.
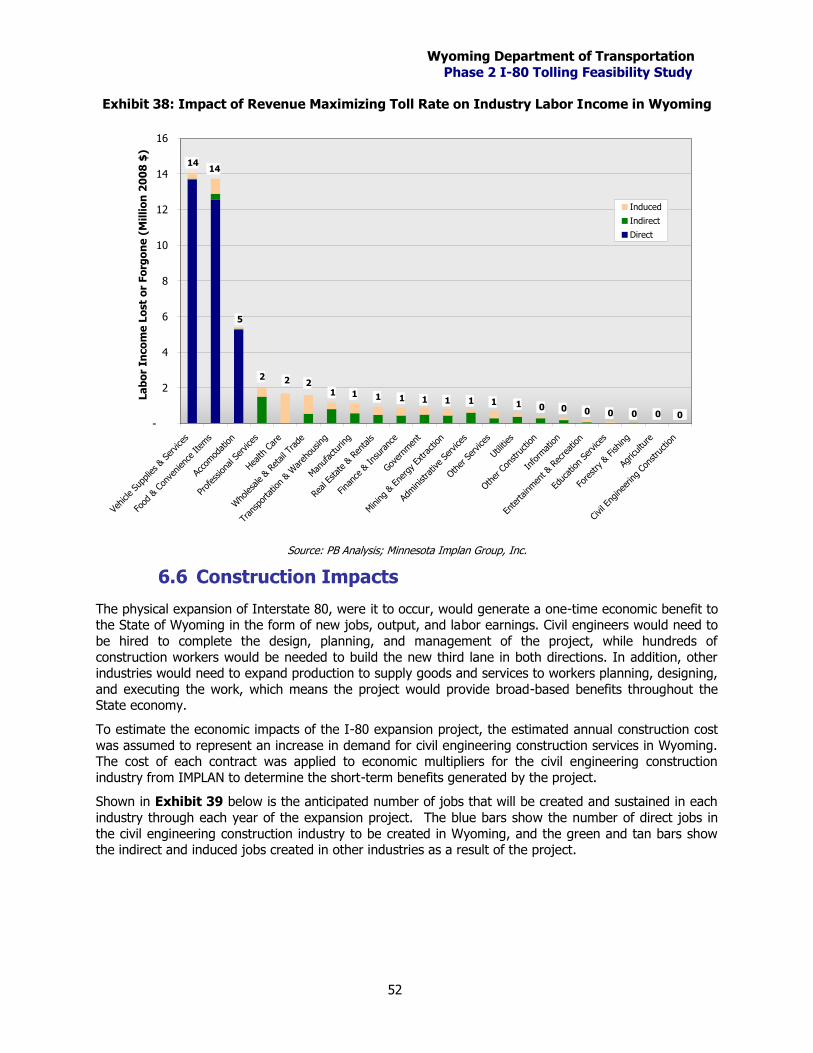
Wyoming Department of Transportation
Phase 2 I-80 Tolling Feasibility Study
52
Exhibit 38: Impact of Revenue Maximizing Toll Rate on Industry Labor Income in Wyoming
0 0 0 0 0 0 0 1 1 1 1 1 1 1 1 1 2 2 2
5
14 14
-
2
4
6
8
10
12
14
16
Vehicle Su
pplie
s & S
ervice
s
Food
& C
onve
nien
ce It
ems
Acco
mod
ation
Profes
siona
l Ser
vice
s
Health
Car
e
Who
lesa
le &
Retail T
rade
Tran
spor
tatio
n & W
areh
ousin
g
Man
ufac
turin
g
Real Estate & R
entals
Fina
nce & In
suranc
e
Gove
rnmen
t
Mining & E
nerg
y Ex
trac
tion
Administ
rativ
e Se
rvice
s
Oth
er Service
s
Utilit
ies
Oth
er C
onstru
ction
Inform
ation
Entertainm
ent &
Rec
reation
Educ
ation Se
rvice
s
Fore
stry &
Fish
ing
Agric
ultu
re
Civil E
nginee
ring Co
nstru
ction
La
bo
r In
co
me
Lo
st
or
Fo
rgo
ne
(M
illi
on
20
08
$)
Induced
Indirect
Direct
Source: PB Analysis; Minnesota Implan Group, Inc.
6.6 Construction Impacts
The physical expansion of Interstate 80, were it to occur, would generate a one-time economic benefit to the State of Wyoming in the form of new jobs, output, and labor earnings. Civil engineers would need to
be hired to complete the design, planning, and management of the project, while hundreds of
construction workers would be needed to build the new third lane in both directions. In addition, other industries would need to expand production to supply goods and services to workers planning, designing,
and executing the work, which means the project would provide broad-based benefits throughout the State economy.
To estimate the economic impacts of the I-80 expansion project, the estimated annual construction cost
was assumed to represent an increase in demand for civil engineering construction services in Wyoming. The cost of each contract was applied to economic multipliers for the civil engineering construction
industry from IMPLAN to determine the short-term benefits generated by the project.
Shown in Exhibit 39 below is the anticipated number of jobs that will be created and sustained in each
industry through each year of the expansion project. The blue bars show the number of direct jobs in
the civil engineering construction industry to be created in Wyoming, and the green and tan bars show the indirect and induced jobs created in other industries as a result of the project.
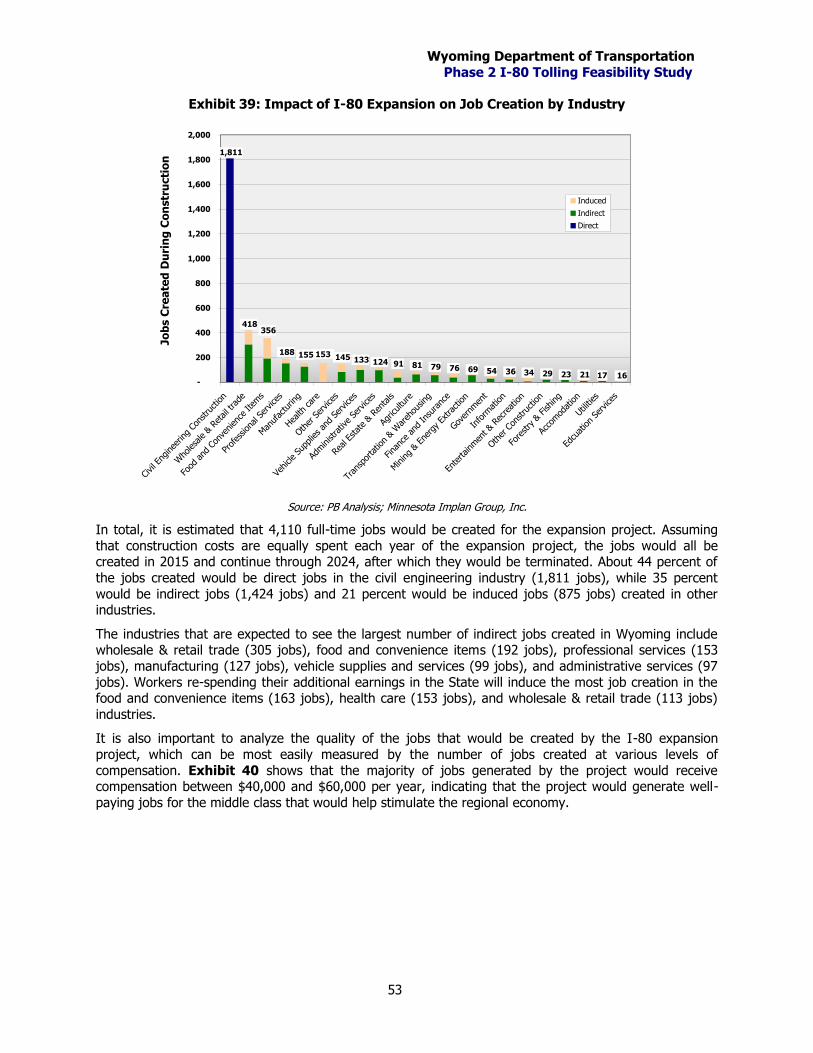
Wyoming Department of Transportation
Phase 2 I-80 Tolling Feasibility Study
53
Exhibit 39: Impact of I-80 Expansion on Job Creation by Industry
16 17 21 23 29 34 36 54 69 76 79 81 91 124 133 145 153 155 188
356 418
1,811
-
200
400
600
800
1,000
1,200
1,400
1,600
1,800
2,000
Civil E
nginee
ring Co
nstruc
tion
Who
lesa
le &
Retail tra
de
Food
and
Con
venien
ce Items
Profes
siona
l Ser
vice
s
Man
ufac
turin
g
Health
car
e
Oth
er Service
s
Vehicle
Sup
plies an
d Se
rvice
s
Administ
rativ
e Se
rvices
Real Estate & R
entals
Agric
ultu
re
Tran
spor
tatio
n & W
areh
ousin
g
Fina
nce an
d In
suranc
e
Mining & E
nerg
y Ex
trac
tion
Gove
rnmen
t
Inform
ation
Entertainm
ent &
Rec
reation
Oth
er C
onstru
ction
Fore
stry &
Fish
ing
Acco
mod
ation
Utilit
ies
Edcu
ation Se
rvice
s
Jo
bs C
rea
ted
Du
rin
g C
on
str
ucti
on
Induced
Indirect
Direct
Source: PB Analysis; Minnesota Implan Group, Inc.
In total, it is estimated that 4,110 full-time jobs would be created for the expansion project. Assuming
that construction costs are equally spent each year of the expansion project, the jobs would all be created in 2015 and continue through 2024, after which they would be terminated. About 44 percent of
the jobs created would be direct jobs in the civil engineering industry (1,811 jobs), while 35 percent
would be indirect jobs (1,424 jobs) and 21 percent would be induced jobs (875 jobs) created in other industries.
The industries that are expected to see the largest number of indirect jobs created in Wyoming include wholesale & retail trade (305 jobs), food and convenience items (192 jobs), professional services (153
jobs), manufacturing (127 jobs), vehicle supplies and services (99 jobs), and administrative services (97
jobs). Workers re-spending their additional earnings in the State will induce the most job creation in the food and convenience items (163 jobs), health care (153 jobs), and wholesale & retail trade (113 jobs)
industries.
It is also important to analyze the quality of the jobs that would be created by the I-80 expansion
project, which can be most easily measured by the number of jobs created at various levels of
compensation. Exhibit 40 shows that the majority of jobs generated by the project would receive compensation between $40,000 and $60,000 per year, indicating that the project would generate well-
paying jobs for the middle class that would help stimulate the regional economy.
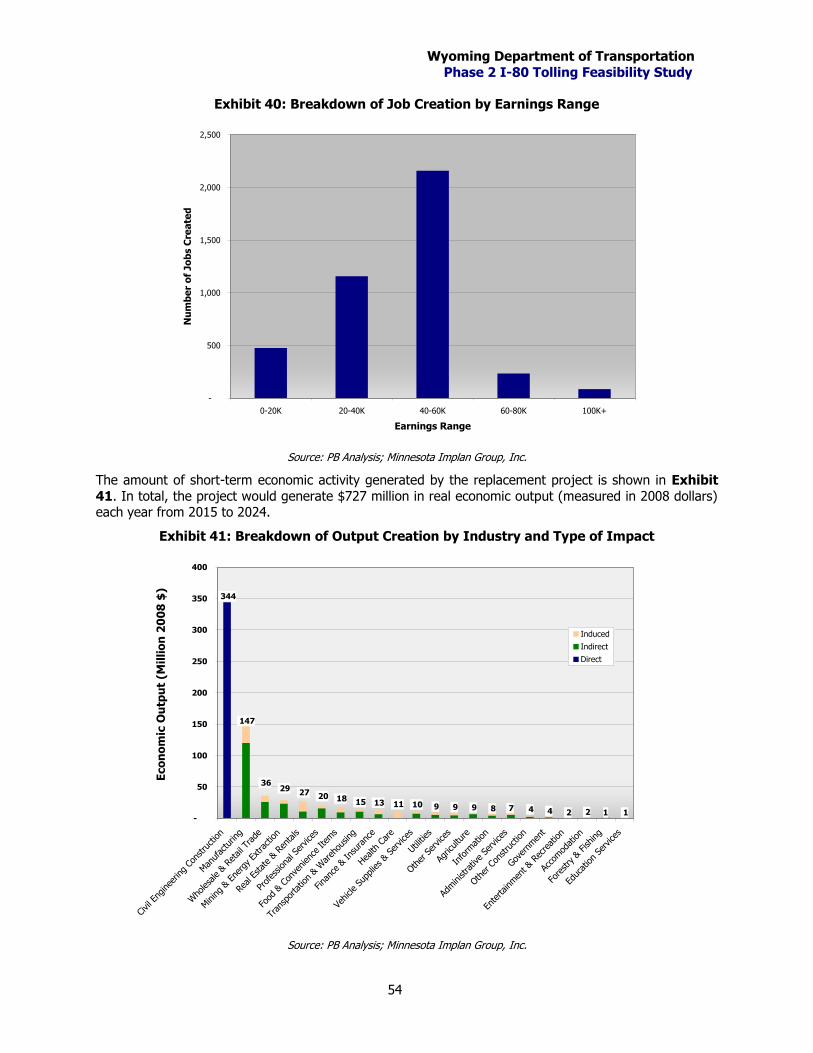
Wyoming Department of Transportation
Phase 2 I-80 Tolling Feasibility Study
54
Exhibit 40: Breakdown of Job Creation by Earnings Range
-
500
1,000
1,500
2,000
2,500
0-20K 20-40K 40-60K 60-80K 100K+
Earnings Range
Nu
mb
er
of
Jo
bs C
rea
ted
Source: PB Analysis; Minnesota Implan Group, Inc.
The amount of short-term economic activity generated by the replacement project is shown in Exhibit
41. In total, the project would generate $727 million in real economic output (measured in 2008 dollars) each year from 2015 to 2024.
Exhibit 41: Breakdown of Output Creation by Industry and Type of Impact
1 1 2 2 4 4 7 8 9 9 9 10 11 13 15 18 20 27 29
36
147
344
-
50
100
150
200
250
300
350
400
Civil E
nginee
ring Co
nstruc
tion
Man
ufac
turin
g
Who
lesa
le &
Retail T
rade
Mining & E
nerg
y Ex
trac
tion
Real Estate & R
entals
Profes
siona
l Ser
vice
s
Food
& C
onve
nien
ce It
ems
Tran
spor
tatio
n & W
areh
ousin
g
Fina
nce & In
sura
nce
Health
Care
Vehicle
Sup
plies & S
ervice
s
Utilit
ies
Oth
er Service
s
Agric
ultu
re
Inform
ation
Administ
rativ
e Se
rvices
Oth
er C
onstru
ction
Gove
rnmen
t
Entertainm
ent &
Rec
reation
Acco
mod
ation
Fore
stry &
Fish
ing
Educ
ation Se
rvice
s
Eco
no
mic
Ou
tpu
t (M
illi
on
20
08
$)
Induced
Indirect
Direct
Source: PB Analysis; Minnesota Implan Group, Inc.
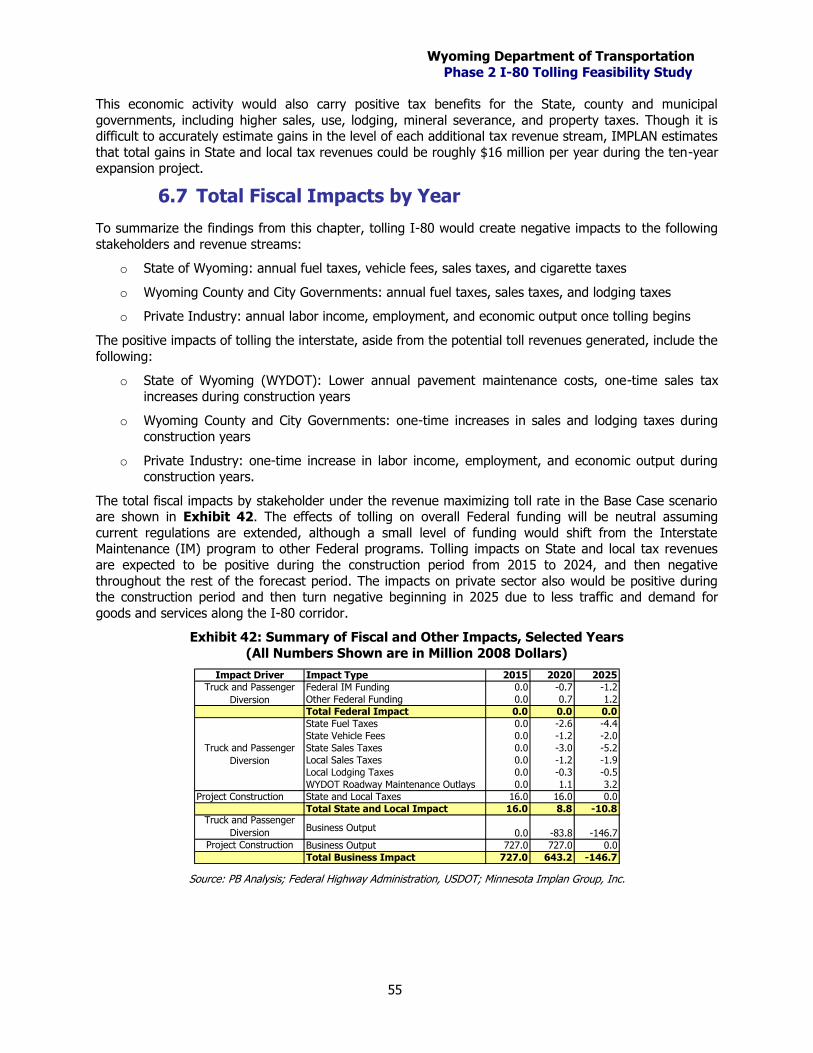
Wyoming Department of Transportation
Phase 2 I-80 Tolling Feasibility Study
55
This economic activity would also carry positive tax benefits for the State, county and municipal
governments, including higher sales, use, lodging, mineral severance, and property taxes. Though it is difficult to accurately estimate gains in the level of each additional tax revenue stream, IMPLAN estimates
that total gains in State and local tax revenues could be roughly $16 million per year during the ten-year expansion project.
6.7 Total Fiscal Impacts by Year
To summarize the findings from this chapter, tolling I-80 would create negative impacts to the following
stakeholders and revenue streams:
o State of Wyoming: annual fuel taxes, vehicle fees, sales taxes, and cigarette taxes
o Wyoming County and City Governments: annual fuel taxes, sales taxes, and lodging taxes
o Private Industry: annual labor income, employment, and economic output once tolling begins
The positive impacts of tolling the interstate, aside from the potential toll revenues generated, include the
following:
o State of Wyoming (WYDOT): Lower annual pavement maintenance costs, one-time sales tax
increases during construction years
o Wyoming County and City Governments: one-time increases in sales and lodging taxes during
construction years
o Private Industry: one-time increase in labor income, employment, and economic output during construction years.
The total fiscal impacts by stakeholder under the revenue maximizing toll rate in the Base Case scenario are shown in Exhibit 42. The effects of tolling on overall Federal funding will be neutral assuming
current regulations are extended, although a small level of funding would shift from the Interstate Maintenance (IM) program to other Federal programs. Tolling impacts on State and local tax revenues
are expected to be positive during the construction period from 2015 to 2024, and then negative
throughout the rest of the forecast period. The impacts on private sector also would be positive during the construction period and then turn negative beginning in 2025 due to less traffic and demand for
goods and services along the I-80 corridor.
Exhibit 42: Summary of Fiscal and Other Impacts, Selected Years
(All Numbers Shown are in Million 2008 Dollars)
Impact Driver Impact Type 2015 2020 2025
Federal IM Funding 0.0 -0.7 -1.2
Other Federal Funding 0.0 0.7 1.2
Total Federal Impact 0.0 0.0 0.0
State Fuel Taxes 0.0 -2.6 -4.4
State Vehicle Fees 0.0 -1.2 -2.0
State Sales Taxes 0.0 -3.0 -5.2
Local Sales Taxes 0.0 -1.2 -1.9
Local Lodging Taxes 0.0 -0.3 -0.5
WYDOT Roadway Maintenance Outlays 0.0 1.1 3.2
Project Construction State and Local Taxes 16.0 16.0 0.0
Total State and Local Impact 16.0 8.8 -10.8Truck and Passenger
DiversionBusiness Output
0.0 -83.8 -146.7Project Construction Business Output 727.0 727.0 0.0
Total Business Impact 727.0 643.2 -146.7
Truck and Passenger
Diversion
Truck and Passenger
Diversion
Source: PB Analysis; Federal Highway Administration, USDOT; Minnesota Implan Group, Inc.
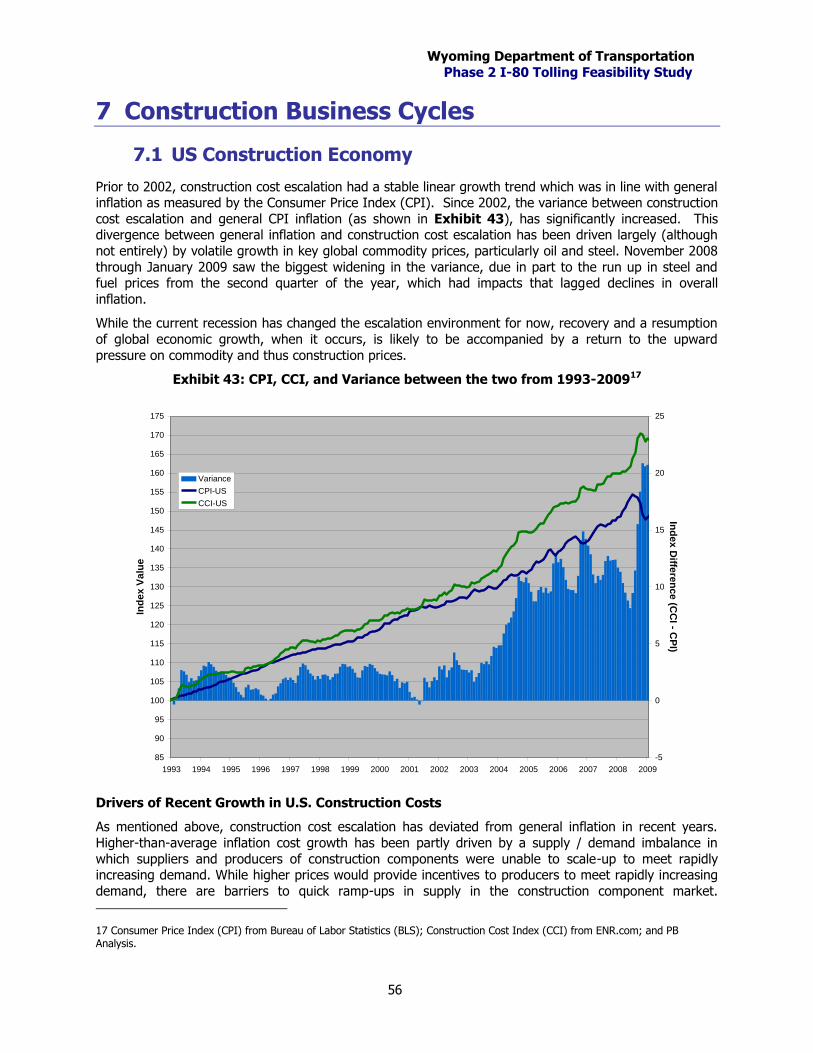
Wyoming Department of Transportation
Phase 2 I-80 Tolling Feasibility Study
56
7 Construction Business Cycles
7.1 US Construction Economy
Prior to 2002, construction cost escalation had a stable linear growth trend which was in line with general inflation as measured by the Consumer Price Index (CPI). Since 2002, the variance between construction
cost escalation and general CPI inflation (as shown in Exhibit 43), has significantly increased. This divergence between general inflation and construction cost escalation has been driven largely (although
not entirely) by volatile growth in key global commodity prices, particularly oil and steel. November 2008
through January 2009 saw the biggest widening in the variance, due in part to the run up in steel and fuel prices from the second quarter of the year, which had impacts that lagged declines in overall
inflation.
While the current recession has changed the escalation environment for now, recovery and a resumption
of global economic growth, when it occurs, is likely to be accompanied by a return to the upward
pressure on commodity and thus construction prices.
Exhibit 43: CPI, CCI, and Variance between the two from 1993-200917
85
90
95
100
105
110
115
120
125
130
135
140
145
150
155
160
165
170
175
1993 1994 1995 1996 1997 1998 1999 2000 2001 2002 2003 2004 2005 2006 2007 2008 2009
Ind
ex
Va
lue
-5
0
5
10
15
20
25
Ind
ex
Diffe
ren
ce
(CC
I - CP
I)
Variance
CPI-US
CCI-US
Drivers of Recent Growth in U.S. Construction Costs
As mentioned above, construction cost escalation has deviated from general inflation in recent years.
Higher-than-average inflation cost growth has been partly driven by a supply / demand imbalance in
which suppliers and producers of construction components were unable to scale-up to meet rapidly increasing demand. While higher prices would provide incentives to producers to meet rapidly increasing
demand, there are barriers to quick ramp-ups in supply in the construction component market.
17 Consumer Price Index (CPI) from Bureau of Labor Statistics (BLS); Construction Cost Index (CCI) from ENR.com; and PB Analysis.
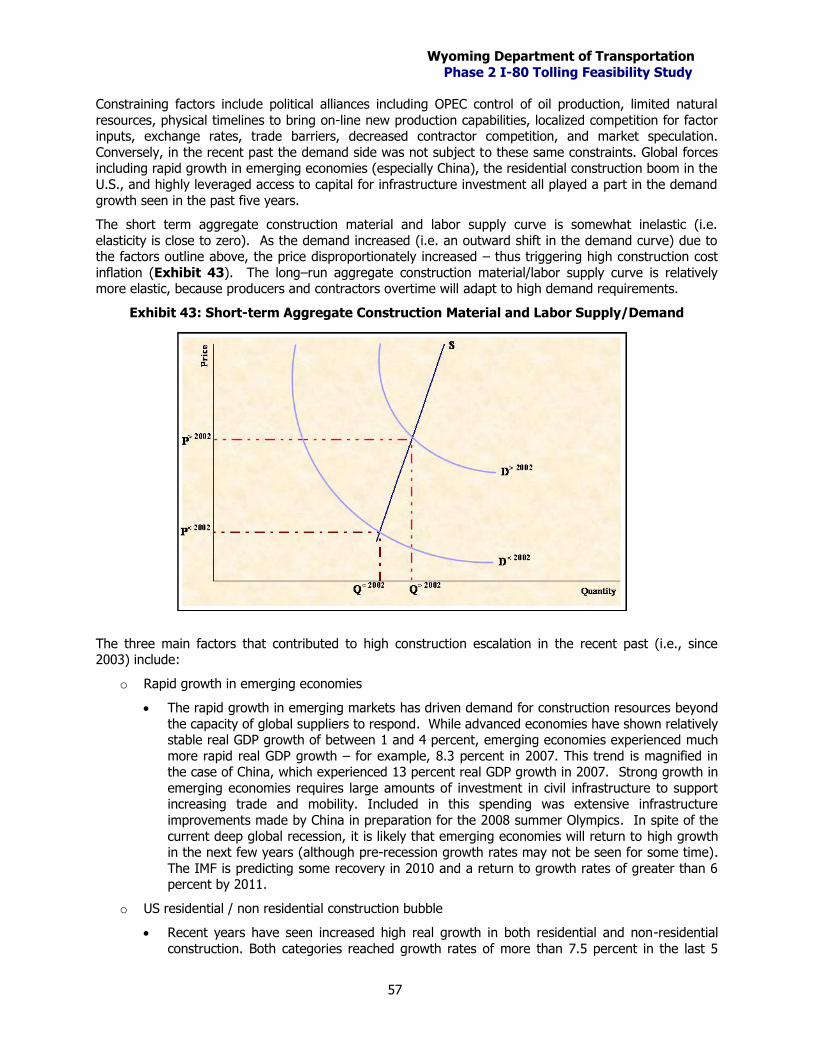
Wyoming Department of Transportation
Phase 2 I-80 Tolling Feasibility Study
57
Constraining factors include political alliances including OPEC control of oil production, limited natural
resources, physical timelines to bring on-line new production capabilities, localized competition for factor inputs, exchange rates, trade barriers, decreased contractor competition, and market speculation.
Conversely, in the recent past the demand side was not subject to these same constraints. Global forces including rapid growth in emerging economies (especially China), the residential construction boom in the
U.S., and highly leveraged access to capital for infrastructure investment all played a part in the demand
growth seen in the past five years.
The short term aggregate construction material and labor supply curve is somewhat inelastic (i.e.
elasticity is close to zero). As the demand increased (i.e. an outward shift in the demand curve) due to the factors outline above, the price disproportionately increased – thus triggering high construction cost
inflation (Exhibit 43). The long–run aggregate construction material/labor supply curve is relatively more elastic, because producers and contractors overtime will adapt to high demand requirements.
Exhibit 43: Short-term Aggregate Construction Material and Labor Supply/Demand
The three main factors that contributed to high construction escalation in the recent past (i.e., since 2003) include:
o Rapid growth in emerging economies
The rapid growth in emerging markets has driven demand for construction resources beyond
the capacity of global suppliers to respond. While advanced economies have shown relatively stable real GDP growth of between 1 and 4 percent, emerging economies experienced much
more rapid real GDP growth – for example, 8.3 percent in 2007. This trend is magnified in the case of China, which experienced 13 percent real GDP growth in 2007. Strong growth in
emerging economies requires large amounts of investment in civil infrastructure to support increasing trade and mobility. Included in this spending was extensive infrastructure
improvements made by China in preparation for the 2008 summer Olympics. In spite of the
current deep global recession, it is likely that emerging economies will return to high growth in the next few years (although pre-recession growth rates may not be seen for some time).
The IMF is predicting some recovery in 2010 and a return to growth rates of greater than 6 percent by 2011.
o US residential / non residential construction bubble
Recent years have seen increased high real growth in both residential and non-residential
construction. Both categories reached growth rates of more than 7.5 percent in the last 5
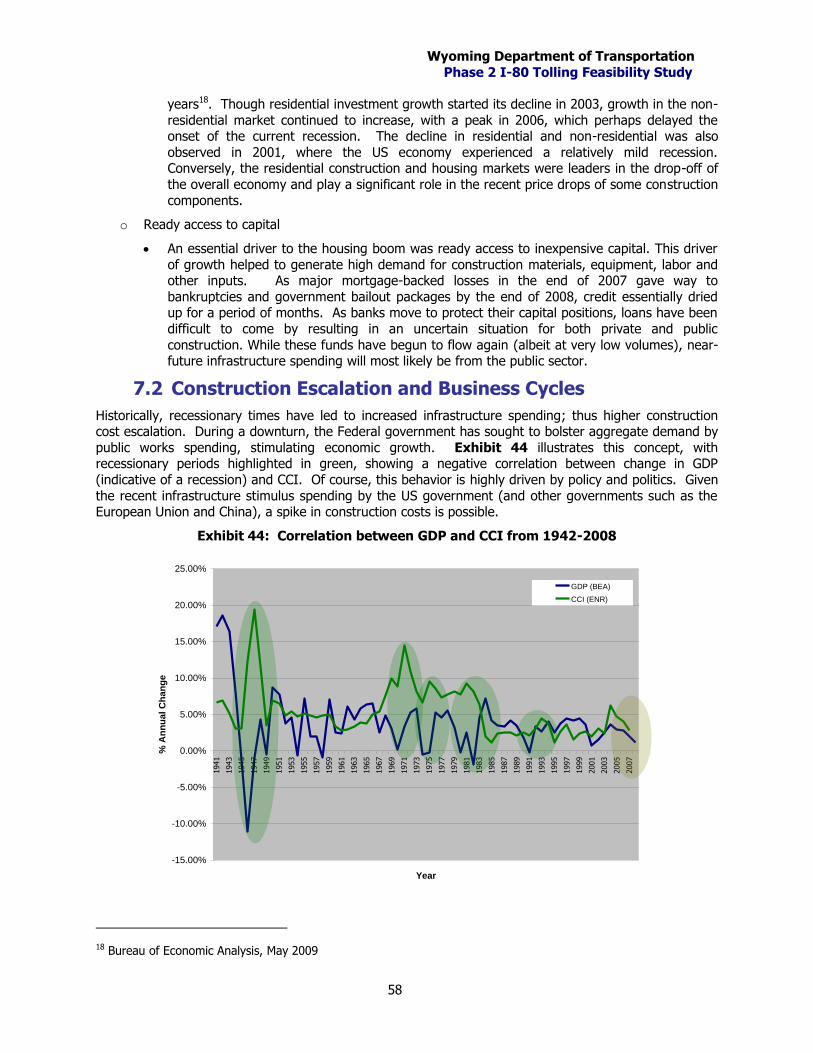
Wyoming Department of Transportation
Phase 2 I-80 Tolling Feasibility Study
58
years18. Though residential investment growth started its decline in 2003, growth in the non-
residential market continued to increase, with a peak in 2006, which perhaps delayed the onset of the current recession. The decline in residential and non-residential was also
observed in 2001, where the US economy experienced a relatively mild recession. Conversely, the residential construction and housing markets were leaders in the drop-off of
the overall economy and play a significant role in the recent price drops of some construction
components.
o Ready access to capital
An essential driver to the housing boom was ready access to inexpensive capital. This driver
of growth helped to generate high demand for construction materials, equipment, labor and other inputs. As major mortgage-backed losses in the end of 2007 gave way to
bankruptcies and government bailout packages by the end of 2008, credit essentially dried up for a period of months. As banks move to protect their capital positions, loans have been
difficult to come by resulting in an uncertain situation for both private and public
construction. While these funds have begun to flow again (albeit at very low volumes), near-future infrastructure spending will most likely be from the public sector.
7.2 Construction Escalation and Business Cycles
Historically, recessionary times have led to increased infrastructure spending; thus higher construction cost escalation. During a downturn, the Federal government has sought to bolster aggregate demand by
public works spending, stimulating economic growth. Exhibit 44 illustrates this concept, with recessionary periods highlighted in green, showing a negative correlation between change in GDP
(indicative of a recession) and CCI. Of course, this behavior is highly driven by policy and politics. Given
the recent infrastructure stimulus spending by the US government (and other governments such as the European Union and China), a spike in construction costs is possible.
Exhibit 44: Correlation between GDP and CCI from 1942-2008
18 Bureau of Economic Analysis, May 2009
-15.00%
-10.00%
-5.00%
0.00%
5.00%
10.00%
15.00%
20.00%
25.00%
1941
1943
1945
1947
1949
1951
1953
1955
1957
1959
1961
1963
1965
1967
1969
1971
1973
1975
1977
1979
1981
1983
1985
1987
1989
1991
1993
1995
1997
1999
2001
2003
2005
2007
Year
% A
nn
ual
Ch
an
ge
GDP (BEA)
CCI (ENR)
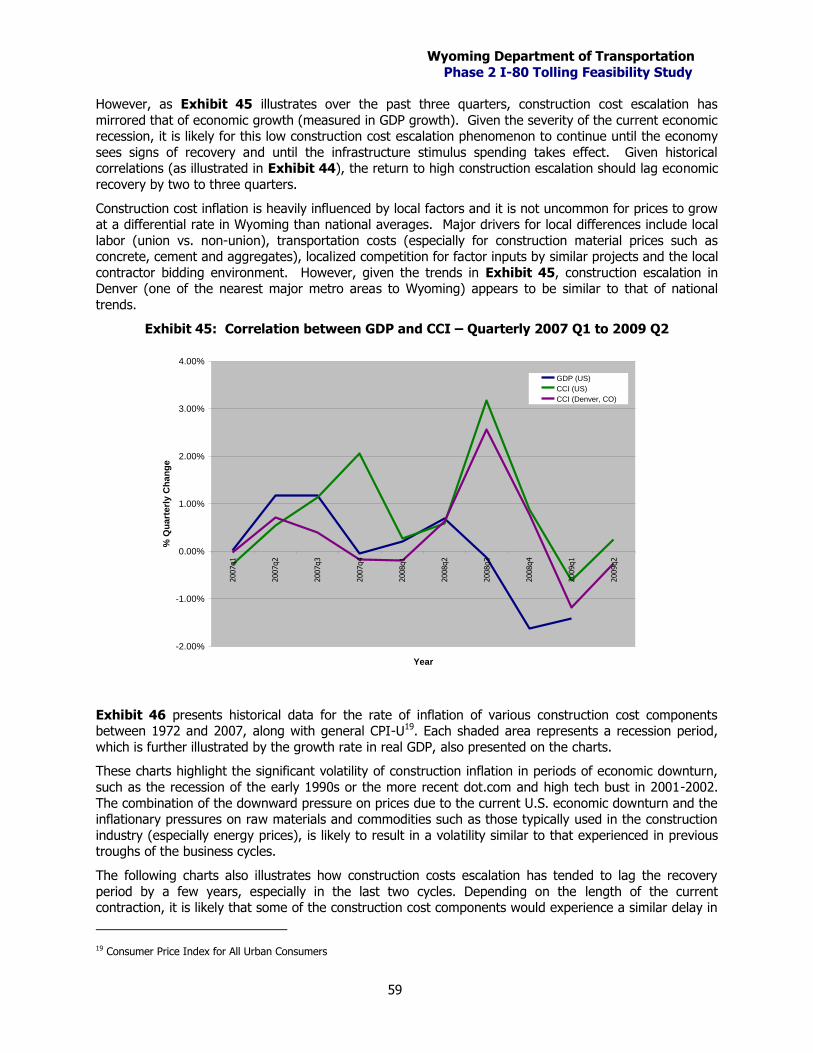
Wyoming Department of Transportation
Phase 2 I-80 Tolling Feasibility Study
59
However, as Exhibit 45 illustrates over the past three quarters, construction cost escalation has
mirrored that of economic growth (measured in GDP growth). Given the severity of the current economic recession, it is likely for this low construction cost escalation phenomenon to continue until the economy
sees signs of recovery and until the infrastructure stimulus spending takes effect. Given historical correlations (as illustrated in Exhibit 44), the return to high construction escalation should lag economic
recovery by two to three quarters.
Construction cost inflation is heavily influenced by local factors and it is not uncommon for prices to grow at a differential rate in Wyoming than national averages. Major drivers for local differences include local
labor (union vs. non-union), transportation costs (especially for construction material prices such as concrete, cement and aggregates), localized competition for factor inputs by similar projects and the local
contractor bidding environment. However, given the trends in Exhibit 45, construction escalation in Denver (one of the nearest major metro areas to Wyoming) appears to be similar to that of national
trends.
Exhibit 45: Correlation between GDP and CCI – Quarterly 2007 Q1 to 2009 Q2
-2.00%
-1.00%
0.00%
1.00%
2.00%
3.00%
4.00%
2007q1
2007q2
2007q3
2007q4
2008q1
2008q2
2008q3
2008q4
2009q1
2009q2
Year
% Q
ua
rte
rly
Ch
an
ge
GDP (US)
CCI (US)
CCI (Denver, CO)
Exhibit 46 presents historical data for the rate of inflation of various construction cost components between 1972 and 2007, along with general CPI-U19. Each shaded area represents a recession period,
which is further illustrated by the growth rate in real GDP, also presented on the charts.
These charts highlight the significant volatility of construction inflation in periods of economic downturn,
such as the recession of the early 1990s or the more recent dot.com and high tech bust in 2001-2002.
The combination of the downward pressure on prices due to the current U.S. economic downturn and the inflationary pressures on raw materials and commodities such as those typically used in the construction
industry (especially energy prices), is likely to result in a volatility similar to that experienced in previous troughs of the business cycles.
The following charts also illustrates how construction costs escalation has tended to lag the recovery
period by a few years, especially in the last two cycles. Depending on the length of the current contraction, it is likely that some of the construction cost components would experience a similar delay in
19 Consumer Price Index for All Urban Consumers
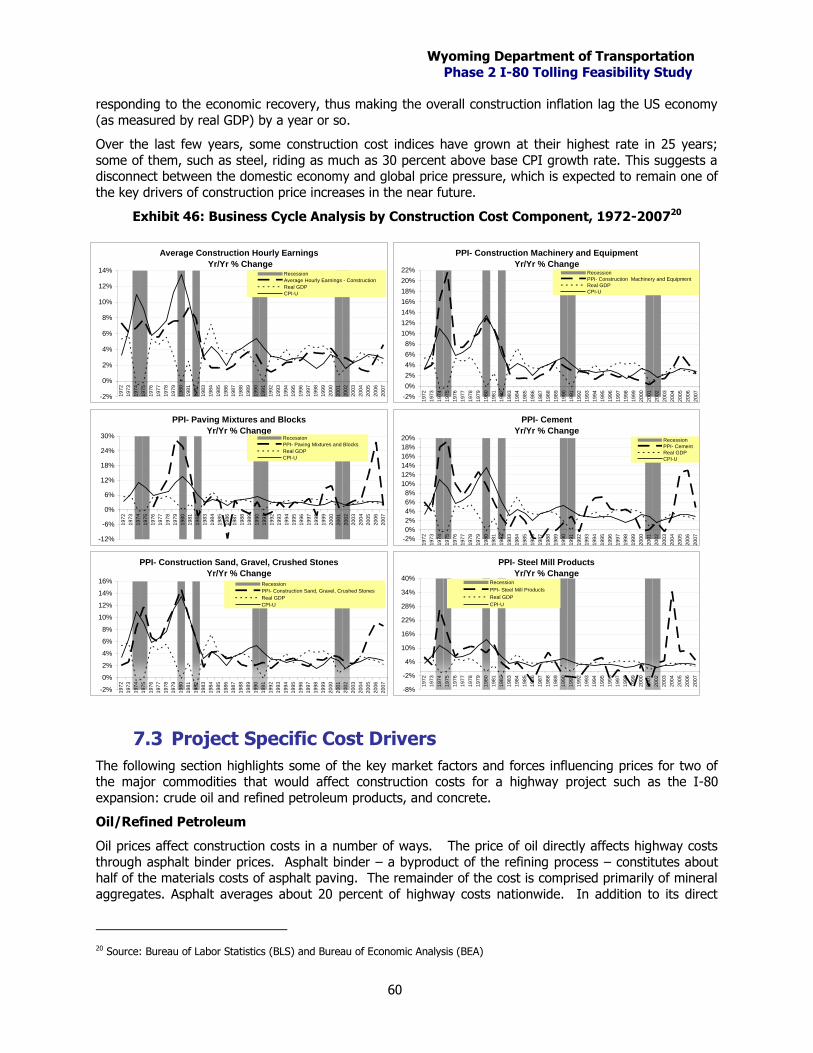
Wyoming Department of Transportation
Phase 2 I-80 Tolling Feasibility Study
60
responding to the economic recovery, thus making the overall construction inflation lag the US economy
(as measured by real GDP) by a year or so.
Over the last few years, some construction cost indices have grown at their highest rate in 25 years;
some of them, such as steel, riding as much as 30 percent above base CPI growth rate. This suggests a disconnect between the domestic economy and global price pressure, which is expected to remain one of
the key drivers of construction price increases in the near future.
Exhibit 46: Business Cycle Analysis by Construction Cost Component, 1972-200720
7.3 Project Specific Cost Drivers
The following section highlights some of the key market factors and forces influencing prices for two of the major commodities that would affect construction costs for a highway project such as the I-80
expansion: crude oil and refined petroleum products, and concrete.
Oil/Refined Petroleum
Oil prices affect construction costs in a number of ways. The price of oil directly affects highway costs
through asphalt binder prices. Asphalt binder – a byproduct of the refining process – constitutes about half of the materials costs of asphalt paving. The remainder of the cost is comprised primarily of mineral
aggregates. Asphalt averages about 20 percent of highway costs nationwide. In addition to its direct
20 Source: Bureau of Labor Statistics (BLS) and Bureau of Economic Analysis (BEA)
PPI- Construction Machinery and Equipment
Yr/Yr % Change
-2%
0%
2%
4%
6%
8%
10%
12%
14%
16%
18%
20%
22%
19
72
19
73
19
74
19
75
19
76
19
77
19
78
19
79
19
80
19
81
19
82
19
83
19
84
19
85
19
86
19
87
19
88
19
89
19
90
19
91
19
92
19
93
19
94
19
95
19
96
19
97
19
98
19
99
20
00
20
01
20
02
20
03
20
04
20
05
20
06
20
07
Recession
PPI- Construction Machinery and Equipment
Real GDP
CPI-U
PPI- Paving Mixtures and Blocks
Yr/Yr % Change
-12%
-6%
0%
6%
12%
18%
24%
30%
19
72
19
73
19
74
19
75
19
76
19
77
19
78
19
79
19
80
19
81
19
82
19
83
19
84
19
85
19
86
19
87
19
88
19
89
19
90
19
91
19
92
19
93
19
94
19
95
19
96
19
97
19
98
19
99
20
00
20
01
20
02
20
03
20
04
20
05
20
06
20
07
Recession
PPI- Paving Mixtures and Blocks
Real GDP
CPI-U
PPI- Cement
Yr/Yr % Change
-2%
0%
2%
4%
6%
8%
10%
12%
14%
16%
18%
20%
19
72
19
73
19
74
19
75
19
76
19
77
19
78
19
79
19
80
19
81
19
82
19
83
19
84
19
85
19
86
19
87
19
88
19
89
19
90
19
91
19
92
19
93
19
94
19
95
19
96
19
97
19
98
19
99
20
00
20
01
20
02
20
03
20
04
20
05
20
06
20
07
Recession
PPI- Cement
Real GDP
CPI-U
PPI- Construction Sand, Gravel, Crushed Stones
Yr/Yr % Change
-2%
0%
2%
4%
6%
8%
10%
12%
14%
16%
19
72
19
73
19
74
19
75
19
76
19
77
19
78
19
79
19
80
19
81
19
82
19
83
19
84
19
85
19
86
19
87
19
88
19
89
19
90
19
91
19
92
19
93
19
94
19
95
19
96
19
97
19
98
19
99
20
00
20
01
20
02
20
03
20
04
20
05
20
06
20
07
Recession
PPI- Construction Sand, Gravel, Crushed Stones
Real GDP
CPI-U
PPI- Steel Mill Products
Yr/Yr % Change
-8%
-2%
4%
10%
16%
22%
28%
34%
40%
19
72
19
73
19
74
19
75
19
76
19
77
19
78
19
79
19
80
19
81
19
82
19
83
19
84
19
85
19
86
19
87
19
88
19
89
19
90
19
91
19
92
19
93
19
94
19
95
19
96
19
97
19
98
19
99
20
00
20
01
20
02
20
03
20
04
20
05
20
06
20
07
Recession
PPI- Steel Mill Products
Real GDP
CPI-U
Average Construction Hourly Earnings
Yr/Yr % Change
-2%
0%
2%
4%
6%
8%
10%
12%
14%
19
72
19
73
19
74
19
75
19
76
19
77
19
78
19
79
19
80
19
81
19
82
19
83
19
84
19
85
19
86
19
87
19
88
19
89
19
90
19
91
19
92
19
93
19
94
19
95
19
96
19
97
19
98
19
99
20
00
20
01
20
02
20
03
20
04
20
05
20
06
20
07
Recession
Average Hourly Earnings - Construction
Real GDP
CPI-U
Wyoming Department of Transportation
Phase 2 I-80 Tolling Feasibility Study
61
impact on asphalt prices, the price of oil effects construction costs via transportation costs, as well as
through generalized impacts on overall inflation, as energy prices drive up costs throughout the economy.
Oil prices are driven first and foremost by overall world demand. Limited supply is the second major
driver, both due to OPEC controls, as well as limitations in refining capacity.
Because of high fixed costs, US refining capacity does not provide sufficient excess margin when demand
spikes, or when refineries are put out of commission, such as after Hurricanes Katrina and Rita. As a
result, refined petroleum product prices can fall independently of oil prices on spot markets. Additional observations:
Of all global commodities, crude oil prices are by far the most sensitive to international political
relations and conflicts. Political disruptions are always possible, and can result in shortages and price increases at any time.
Because crude oil is commoditized – that is, it is sold primarily on spot markets, rather than
directly from country to country – bilateral exchange rate differentials are less important than the overall status of the U.S. dollar against a market basket of currencies.
Economic growth in China, India, and the rest of the rapidly developing world, once it resumes,
will continue to place strong upward pressure on prices, particularly as world oil supplies reach
their theoretical “tipping point” and as new fields prove more expensive to tap.
Asphalt prices, as noted, are closely correlated with crude oil and refined petroleum prices, but there can
be a lag in the effect. Engineering News Record (April 6, 2009) indicates that asphalt paving prices have fallen in response to the precipitous drop in oil prices, but with a lag of 3 to 6 months.
As refined petroleum products resume their upward price trend after recovery, refiners will focus on
producing more gasoline and less asphalt binder, exerting more pressure on asphalt prices.
Cement/Concrete
Because of its weight and bulk, which make transporting expensive, and also because most of the non-energy inputs can be procured locally, concrete (either ready mix concrete, Portland Cement, or pre-
fabricated concrete) is not generally shipped over very long distances. Cement is the basic input to concrete, and is typically less closely linked to local supply constraints as other concrete components.
Sand and aggregate prices can be highly localized due to high transportation prices of these heavy
materials. Cement is, therefore, easiest to analyze on a national level.
The price of cement is largely determined by the transportation costs involved in delivering the cement,
as well as energy prices used in production. Because of the relatively high cost of shipping cement, competition is generally maintained on a regional level. Average transportation costs reported by U.S.
producers for shipments within 50 miles of the plant were $5.79 per ton. Average shipping costs
increased to $9.86 for shipments within 51 to 100 miles, to $14.53 for 101 to 200 miles, and to $18.86 for 201 to 300 miles. The majority of cement produced in the U.S. is sold within 200 miles of the plant or
terminal of origin.
While cement is produced close to where it is used, cement production in the U.S. is dominated by
foreign owned conglomerates; CEMEX, a Mexican producer, has the largest market share in the United States, operating many plants throughout the United States. Because of a gap between U.S. domestic
production capacity and demand, over 20 percent of US cement is imported, from Mexico, Canada,
Thailand, and China. Because of the lower costs of production, and the less restrictive air quality regulations in Mexico, the southern tier states of the US in particular have relied fairly heavily on cement
imports from Mexico.
Cement prices, as noted, are closely tied to transportation costs and energy costs in general.
Engineering News Record indicates that cement prices (Portland Cement) have fallen rapidly since
December.
Wyoming Department of Transportation
Phase 2 I-80 Tolling Feasibility Study
62
7.4 Construction Cycle Conclusions
While history can explain some of causes of cost variability, no two business cycles are the same and
policy decisions that can severely impact oil prices cannot easily be predicted. This said, predicting construction price trends can make a substantial difference in the cost of highway development,
especially if there is some latitude in the types of materials and timing of implementation. Since WYDOT may be afforded such latitude, both in the initial construction phase and in later rehabilitation phases,
and due to the very high cost of the proposed project, construction cycle analysis should be performed
on an ongoing basis to help minimize the overall project cost.
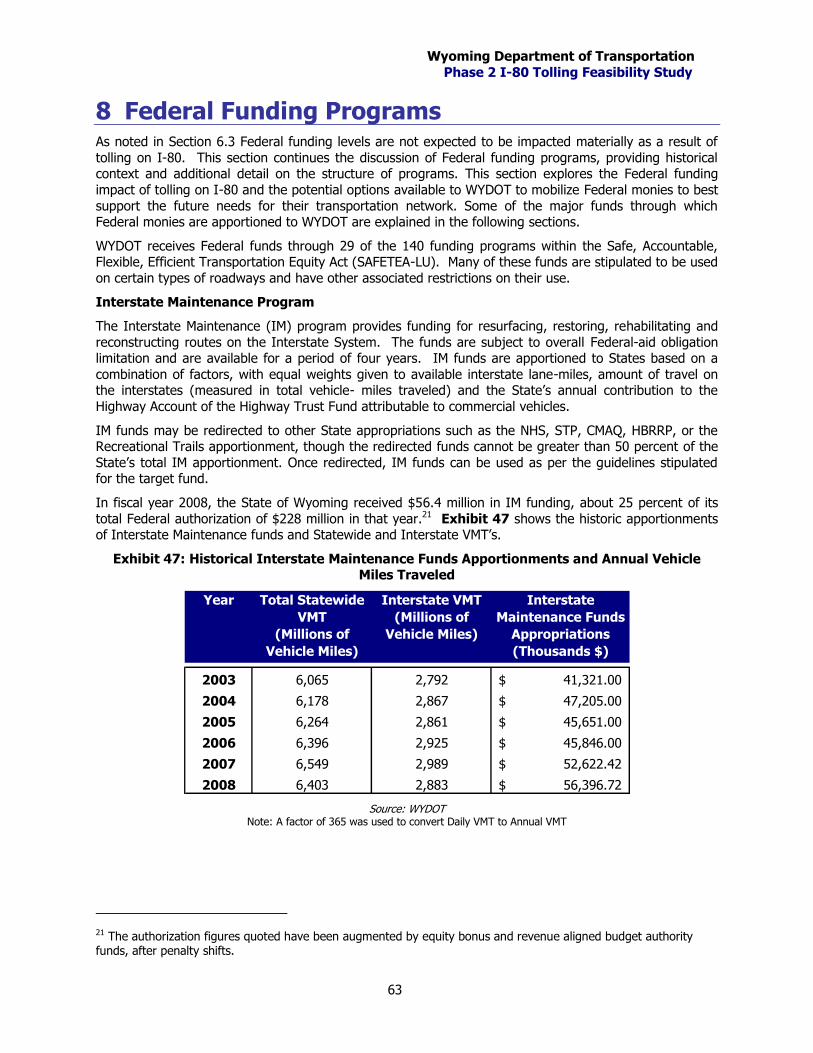
Wyoming Department of Transportation
Phase 2 I-80 Tolling Feasibility Study
63
8 Federal Funding Programs As noted in Section 6.3 Federal funding levels are not expected to be impacted materially as a result of
tolling on I-80. This section continues the discussion of Federal funding programs, providing historical context and additional detail on the structure of programs. This section explores the Federal funding
impact of tolling on I-80 and the potential options available to WYDOT to mobilize Federal monies to best
support the future needs for their transportation network. Some of the major funds through which Federal monies are apportioned to WYDOT are explained in the following sections.
WYDOT receives Federal funds through 29 of the 140 funding programs within the Safe, Accountable, Flexible, Efficient Transportation Equity Act (SAFETEA-LU). Many of these funds are stipulated to be used
on certain types of roadways and have other associated restrictions on their use.
Interstate Maintenance Program
The Interstate Maintenance (IM) program provides funding for resurfacing, restoring, rehabilitating and
reconstructing routes on the Interstate System. The funds are subject to overall Federal-aid obligation limitation and are available for a period of four years. IM funds are apportioned to States based on a
combination of factors, with equal weights given to available interstate lane-miles, amount of travel on the interstates (measured in total vehicle- miles traveled) and the State’s annual contribution to the
Highway Account of the Highway Trust Fund attributable to commercial vehicles.
IM funds may be redirected to other State appropriations such as the NHS, STP, CMAQ, HBRRP, or the Recreational Trails apportionment, though the redirected funds cannot be greater than 50 percent of the
State’s total IM apportionment. Once redirected, IM funds can be used as per the guidelines stipulated for the target fund.
In fiscal year 2008, the State of Wyoming received $56.4 million in IM funding, about 25 percent of its
total Federal authorization of $228 million in that year.21 Exhibit 47 shows the historic apportionments of Interstate Maintenance funds and Statewide and Interstate VMT’s.
Exhibit 47: Historical Interstate Maintenance Funds Apportionments and Annual Vehicle Miles Traveled
Year Total Statewide
VMT
(Millions of
Vehicle Miles)
Interstate VMT
(Millions of
Vehicle Miles)
Interstate
Maintenance Funds
Appropriations
(Thousands $)
2003 6,065 2,792 41,321.00$
2004 6,178 2,867 47,205.00$
2005 6,264 2,861 45,651.00$
2006 6,396 2,925 45,846.00$
2007 6,549 2,989 52,622.42$
2008 6,403 2,883 56,396.72$
Source: WYDOT Note: A factor of 365 was used to convert Daily VMT to Annual VMT
21 The authorization figures quoted have been augmented by equity bonus and revenue aligned budget authority funds, after penalty shifts.
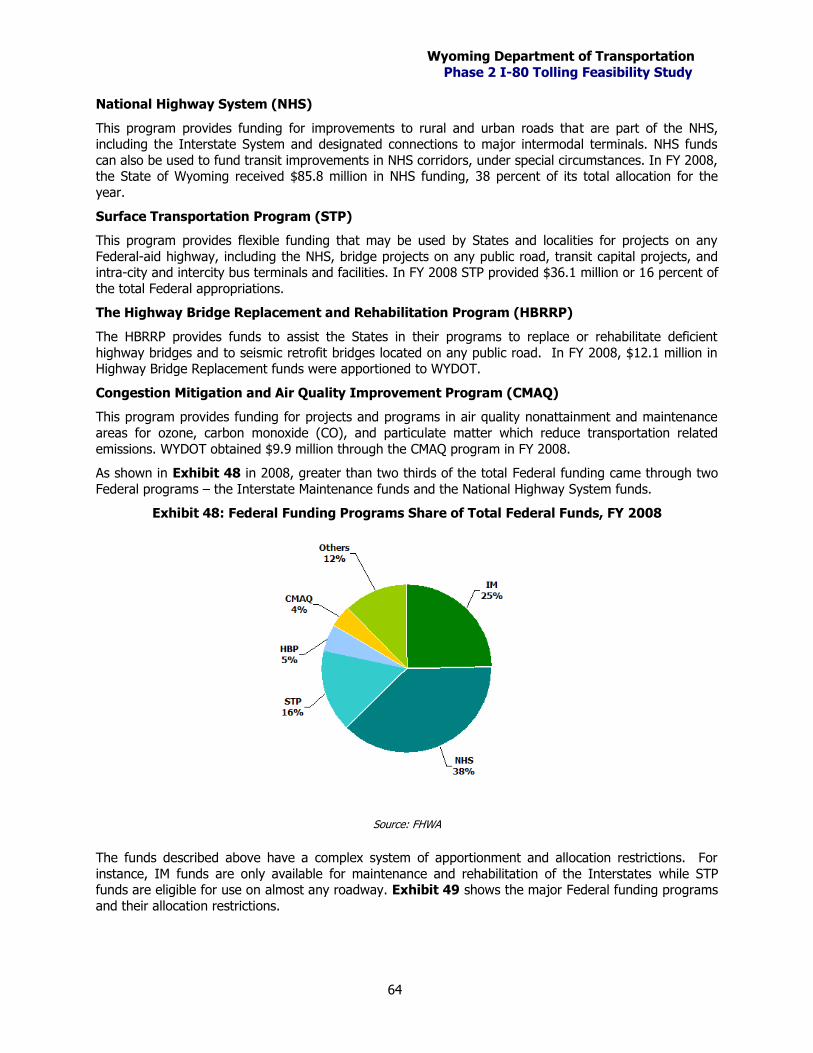
Wyoming Department of Transportation
Phase 2 I-80 Tolling Feasibility Study
64
National Highway System (NHS)
This program provides funding for improvements to rural and urban roads that are part of the NHS, including the Interstate System and designated connections to major intermodal terminals. NHS funds
can also be used to fund transit improvements in NHS corridors, under special circumstances. In FY 2008, the State of Wyoming received $85.8 million in NHS funding, 38 percent of its total allocation for the
year.
Surface Transportation Program (STP)
This program provides flexible funding that may be used by States and localities for projects on any
Federal-aid highway, including the NHS, bridge projects on any public road, transit capital projects, and intra-city and intercity bus terminals and facilities. In FY 2008 STP provided $36.1 million or 16 percent of
the total Federal appropriations.
The Highway Bridge Replacement and Rehabilitation Program (HBRRP)
The HBRRP provides funds to assist the States in their programs to replace or rehabilitate deficient
highway bridges and to seismic retrofit bridges located on any public road. In FY 2008, $12.1 million in Highway Bridge Replacement funds were apportioned to WYDOT.
Congestion Mitigation and Air Quality Improvement Program (CMAQ)
This program provides funding for projects and programs in air quality nonattainment and maintenance
areas for ozone, carbon monoxide (CO), and particulate matter which reduce transportation related
emissions. WYDOT obtained $9.9 million through the CMAQ program in FY 2008.
As shown in Exhibit 48 in 2008, greater than two thirds of the total Federal funding came through two
Federal programs – the Interstate Maintenance funds and the National Highway System funds.
Exhibit 48: Federal Funding Programs Share of Total Federal Funds, FY 2008
Source: FHWA
The funds described above have a complex system of apportionment and allocation restrictions. For
instance, IM funds are only available for maintenance and rehabilitation of the Interstates while STP funds are eligible for use on almost any roadway. Exhibit 49 shows the major Federal funding programs
and their allocation restrictions.
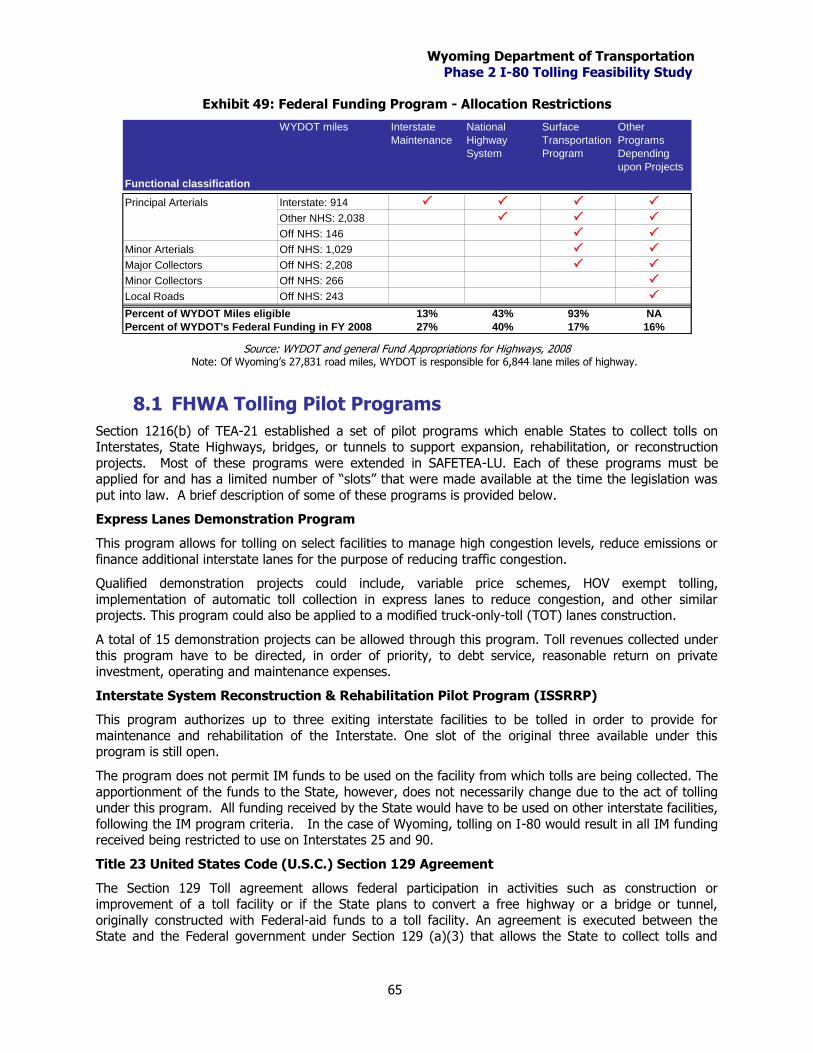
Wyoming Department of Transportation
Phase 2 I-80 Tolling Feasibility Study
65
Exhibit 49: Federal Funding Program - Allocation Restrictions
Functional classification
WYDOT miles Interstate
Maintenance
National
Highway
System
Surface
Transportation
Program
Other
Programs
Depending
upon Projects
Principal Arterials Interstate: 914 P P P P
Other NHS: 2,038 P P P
Off NHS: 146 P P
Minor Arterials Off NHS: 1,029 P P
Major Collectors Off NHS: 2,208 P P
Minor Collectors Off NHS: 266 P
Local Roads Off NHS: 243 P
Percent of WYDOT Miles eligible 13% 43% 93% NA
Percent of WYDOT's Federal Funding in FY 2008 27% 40% 17% 16% Source: WYDOT and general Fund Appropriations for Highways, 2008
Note: Of Wyoming’s 27,831 road miles, WYDOT is responsible for 6,844 lane miles of highway.
8.1 FHWA Tolling Pilot Programs
Section 1216(b) of TEA-21 established a set of pilot programs which enable States to collect tolls on Interstates, State Highways, bridges, or tunnels to support expansion, rehabilitation, or reconstruction
projects. Most of these programs were extended in SAFETEA-LU. Each of these programs must be applied for and has a limited number of “slots” that were made available at the time the legislation was
put into law. A brief description of some of these programs is provided below.
Express Lanes Demonstration Program
This program allows for tolling on select facilities to manage high congestion levels, reduce emissions or
finance additional interstate lanes for the purpose of reducing traffic congestion.
Qualified demonstration projects could include, variable price schemes, HOV exempt tolling,
implementation of automatic toll collection in express lanes to reduce congestion, and other similar projects. This program could also be applied to a modified truck-only-toll (TOT) lanes construction.
A total of 15 demonstration projects can be allowed through this program. Toll revenues collected under
this program have to be directed, in order of priority, to debt service, reasonable return on private investment, operating and maintenance expenses.
Interstate System Reconstruction & Rehabilitation Pilot Program (ISSRRP)
This program authorizes up to three exiting interstate facilities to be tolled in order to provide for
maintenance and rehabilitation of the Interstate. One slot of the original three available under this program is still open.
The program does not permit IM funds to be used on the facility from which tolls are being collected. The
apportionment of the funds to the State, however, does not necessarily change due to the act of tolling under this program. All funding received by the State would have to be used on other interstate facilities,
following the IM program criteria. In the case of Wyoming, tolling on I-80 would result in all IM funding received being restricted to use on Interstates 25 and 90.
Title 23 United States Code (U.S.C.) Section 129 Agreement
The Section 129 Toll agreement allows federal participation in activities such as construction or improvement of a toll facility or if the State plans to convert a free highway or a bridge or tunnel,
originally constructed with Federal-aid funds to a toll facility. An agreement is executed between the State and the Federal government under Section 129 (a)(3) that allows the State to collect tolls and
Wyoming Department of Transportation
Phase 2 I-80 Tolling Feasibility Study
66
requires that all toll revenues be directed in order of priority to, debt service, reasonable return on private
investment, operation and maintenance including reconstruction, resurfacing, restoring and rehabilitation work.
This program essentially allows for five types of tolling:
o Initial construction (except on Interstate System) for toll highways, bridges and tunnels, including
their approaches;
o Reconstruction, resurfacing, rehabilitation and restoration of any existing toll facility;
o Reconstruction or replacement of free bridges or tunnels and conversion to toll facilities;
o Reconstruction of a Federal-aid highway system (except on an Interstate System) and conversion to a toll facility;
o Preliminary studies to determine the feasibility of the above toll construction activities;
While the program does not specifically include provisions the tolling of existing Interstates, FHWA
representatives suggested that negotiating a Section 129 agreement for I-80 in Wyoming may be a viable
alternative to the pilot programs as they are one the most flexible of the available tolling alternatives.
Wyoming Department of Transportation
Phase 2 I-80 Tolling Feasibility Study
67
9 Financial Feasibility and Scenarios Since the summer of 2008, problems in the financial markets have reverberated throughout the economy
and created many new challenges for infrastructure development. Most large highway projects rely on financing of some type and this project has been initially proposed as a fully financed project with non-
recourse toll revenue bonds. While the proposed project is an expansion of an existing roadway with a
long history of traffic, there are still significant risks that must be borne by bond holders and other partners in the project. Some of these risks can be mitigated by WYDOT while others are can be
transferred to the parties who are best able to provide mitigation. This section discusses certain assumptions used in the Base Case conceptual finance plan that have changed over the past 12 months
and suggests potential options for improving the project’s financial position during implementation and operation.
9.1 Financial Market Changes
Between 2000 and 2007, the housing sector grew at unprecedented rates, both in terms of sales volume and home prices. This growth was experienced nationwide (and internationally), but was focused in
certain markets including southern California, Nevada, Florida, and many major metropolitan areas.
Some lending practices that were employed during this time were unsound and resulted in negative equity situations for many home-owners. In 2007, as some home-owners began to default on their
loans, it became apparent that the economy was heading towards a recession. In a short period of time between 2007 and 2008, home foreclosures grew to record levels followed by growth of the inventory of
new and existing homes for sale. As inventories grew, prices fell making it more difficult for struggling
home-owners to find financial relief. Behind the scenes, the institutions that invested heavily in mortgage backed securities found themselves over-leveraged and began to default on their obligations, creating a
global financial crisis that made itself apparent to the world with the major U.S. stock market crash in October of 2008.
Since the fall of 2008, lending markets in the US and abroad have been in general disarray. Funds are
generally not available to lend, and for several months in the beginning of 2009, virtually no municipal bonds were being sold. Interest rates grew and bond insurance, once commonly used to improve the
credit ratings of toll revenue bond issues, was no longer available. These conditions are expected to continue until the economy emerges from the recession, but the future of lending terms to fund toll road
development is very uncertain.
It is assumed that markets will stabilize over time, certainly by the time a transaction for the proposed I-
80 project is contemplated. This said, there are several ways that project sponsors can improve the
marketability of their projects by reducing the risk transferred to investors and being active partners in the project’s development and implementation. Some of these options and approaches are explored in
this section.
9.2 Financial Scenarios
The Phase 1 Report outlined a basic financial structure where a single bond issue was sold, consisting of
Current Interest Bonds (CIBs) and Capital Appreciation Bonds (CABs). CIBs are standard mortgage style bonds which have regular annual or semi-annual principal and interest payments. Payments on CABs are
deferred to a later date, and, as such, accrue more interest. CABs commonly play a part in toll revenue
bond structures because of the inherent growth of toll revenue streams that limits the number of CIBs that can be issued at the project’s outset.
A basic financial structure, as was outlined in Phase 1, is useful in judging the initial financial feasibility of a project, though there are other options and enhancements that can increase the value of the toll
revenue stream in a financing. While we do not expect the current, historically tight credit markets to be maintained in perpetuity, some recent changes to credit criteria for toll roads will live on well after the
economy rebounds from the recession. These include:
Wyoming Department of Transportation
Phase 2 I-80 Tolling Feasibility Study
68
1) CIB / CAB Split – CABs are an inherently more risky type of financing instrument than CIBs due
to the fact that CAB principal and interest payments are deferred to the end of the repayment period. As such, the ‘market’ has established a cap on the proportion of CABs that a bond issue
could make up and be successfully sold to investors. Clearly this is not a hard and fast rule, and many variables play into the marketability of a bond issue, but generally a toll road bond issue
should not have more than 35 percent of the debt in CABs. Having more than 35 percent could
cause the bonds to be considered overly risky or unfavorable and underwriters may be unable to sell all of the bonds, thus terminating the entire transaction.
The Phase 1 financial feasibility included over 40 percent of the debt in CABs. Reducing the proportion of CABs in the financing will have a negative impact on the overall bond proceed from
toll revenues. The transactions modeled as part of the Phase 2 work have a CAB proportion ceiling of 35 percent.
2) Series of Bond Issues – The longer the duration of time between when a bond transaction
closes and the toll road opens for service (and revenue generation) the more risk is involved for investors. It is beneficial to reduce the amount of time that a project is under construction, not
only because interest must be capitalized and paid later, but the risks inherent to construction (delays due to unexpected circumstances) can cause the overall cost of borrowing to increase.
Phase 1 assumed only one bond issue at the outset of construction and that pre-completion
tolling would begin soon after in order to begin repayment of debt prior to the roadway’s construction being completed. In the Phase 2 financial scenarios, a similar pre-completion tolling
approach will be used, but the approach will be modified to finance, construct, open, and toll five individual sections of the roadway in succession. This is a less risky overall approach, which
should be better received by the market than the single debt issuance approach modeled in Phase 1.
3) 40 Year Debt Maturity – Long-term tax exempt (municipal) debt generally ranges in maturity
from 20 to 40 years. The longer the maturity, the more up front funds can be generated, though longer maturity debt usually has a higher interest rate. 40 year debt is not uncommon, but some
programs (including the USDOT TIFIA program) limit debt maturities to 35 years. Some of the Phase 2 financing scenarios take advantage of loan programs such as TIFIA (discussed below) in
an attempt to reduce the project’s overall weighted average cost of capital. As such, all Phase 2
financing scenarios use a 35 year debt maturity. Holding all else constant, lowering the maturity of the debt will decrease the bond proceeds from a given revenue stream, though if TIFIA is
used, the reduction in the overall cost of capital should make up for any negative impact from shortening the maturity.
These three updates to the I-80 toll revenue financial model reflect changes to the financial markets and
credit criteria that we expect to extend into the future past the time when the economy rises out of the current recession. With these changes to the general assumptions of the financial model, the financial
capacity of the Base Case project outlined in the Phase 1 report increases by approximately 12 percent from $3.21 billion to $3.38 billion.22
Section 4 of this report discusses adjustments made to the diversion and traffic model, resulting in revised toll revenue projections for the Base Case toll configuration and two other toll configurations (toll
scenarios 1 and 2). The gross toll revenue forecast and operating cost of each of these scenarios varies,
resulting in a range of net revenues that were used to calculate bonding capacity.
While the assumptions used to develop the estimates of the Base Case (described above) are considered
reasonable and representative of the most likely scenario given current information, a financial sensitivity analysis was conducted to show what the impacts of using other financing and credit enhancement
mechanisms would be on the project’s bonding capacity. Two variations to the financing assumptions
22 There are many variables at play impacting the revenue and financial outcomes, such that the Base Case financial capacities from Phase 1 and Phase 2 analyses are not directly comparable.
Wyoming Department of Transportation
Phase 2 I-80 Tolling Feasibility Study
69
were explored. Both are upside scenarios that are meant to improve the financial capacity of the toll
revenue streams. The first involves using the USDOT TIFIA program to lower the cost of capital and the second discusses ways that the State of Wyoming could reduce the borrowing costs for the project.
1) Subordinate Debt & TIFIA – The Transportation Infrastructure Finance and Innovation Act of 1998 (TIFIA) established a Federal credit program for eligible transportation projects of national
or regional significance under which the U.S. Department of Transportation may provide three
forms of credit assistance – secured (direct) loans, loan guarantees, and standby lines of credit. The program's fundamental goal is to leverage Federal funds by attracting substantial private and
other non-Federal co-investment in critical improvements to the nation's surface transportation system. The USDOT awards credit assistance to eligible applicants, which include state
departments of transportation and special authorities. Projects must meet certain criteria to qualify for a TIFIA credit, including;
o Must be large surface transportation projects (over $50 million)
o Senior project debt must be rated “investment grade”
o Dedicated revenues must be pledged to repay the TIFIA loan
The rules of TIFIA limit its contribution to the overall project to 33 percent of eligible project costs. There are two major benefits of incorporating a TIFIA loan into the financing structure.
First, the rate at which TIFIA funds are lent is considerably lower than typical subordinate debt
rates. Second, the TIFIA program allows lower debt service coverage ratios to be used in sizing the debt.
2) Wyoming State Credit Enhancement – Traffic on new toll roads is very difficult to predict. Economic, engineering, and financial consultants typically spend years researching a toll facility to
understand the variables that will impact traffic before working with rating agencies to secure favorable credit ratings so that toll revenue-backed debt can be issued for the project. Having
witnessed many US toll roads fall into financial distress soon after the initial financing, rating
agencies have continually revised their criteria for awarding “investment grade” ratings to toll roads with more stringent terms, particularly for greenfield toll roads. The fact that I-80 has a
long traffic history would benefit the bonds’ potential credit rating if a transaction was pursued.
Rating agencies examine the risks inherent in a project to see if there is any uncommon exposure
to the issuer, which is passed on to the bond investors. The issuer, on the other hand, presents
the rating agency with information on risk mitigation strategies to temper the perceived project risk and potentially relax some of the credit terms that can reduce the funds that can be raised in
a financing.
3) Backstopping: One common approach to reducing the debt’s risk is for a government entity
with other more diverse revenues to provide a full or partial revenue backstop. This means that
the government entity would pledge its resources to pay some or all of the project’s debt service if project revenues are unable to cover the payments. The government entity in this case would
most likely be the State of Wyoming and the backstop could come from a specific source or from general revenues. A State backstop would clearly shift some risk from the bond holders to the
State. The benefit of the State assuming this risk could be a decrease in the required coverage ratio and / or more favorable interest rates.
The conceptual State backstop financial sensitivity modeled assumes that the State would pay a
maximum of 1/3 of the project’s debt service on an annual basis if project revenue is insufficient. In exchange for this pledge, the debt service coverage ratio on senior bonds is reduced from
2.0X to 1.75X.
4) State Lending: Another way the State could assist in reducing the project debt’s risk would be
to provide cash flow for the project’s construction up-front with the expectation of full repayment
of this investment once the project toll revenue bonds are issued. This concept has been used
Wyoming Department of Transportation
Phase 2 I-80 Tolling Feasibility Study
70
by many states that have State Infrastructure Banks, though in most cases, these banks were
capitalized with Federal funding.
In this case, the State would lend construction funds to WYDOT in amounts necessary to fund
construction phases on a biannual basis.23 At the end of each phase, tolling on that portion of the roadway would begin, bonds would be issued for that portion of the roadway, and the bond
proceeds would repay the State. This process would be repeated for each successive phase until
the project is completed, all debt has been issued, and the State has been completely repaid.
Delaying the issuance of debt until the roadway phases are open for use would create
opportunities for reducing the overall project cost, including;
o Lowering accrued interest costs (capitalized interest) during construction
o Lowering long-term interest rates due to the elimination of construction risk
o Achieving more favorable credit ratings due to higher certainty of traffic volumes, as
the analysis will be updated just prior to or perhaps after the roadway is opened
The conceptual State lending financial sensitivity modeled assumes that the State would pay for the construction of each phase and debt would be issued after the phase was completed (as
opposed to before construction start). Under this scenario, it is expected that the long-term interest rate on the debt could be reduced by 50 basis points. Additionally, capitalized interest
costs would be eliminated, saving the project about $270 million over the five phases of
construction.
9.3 Financial Conclusions
The bonding capacity of each scenario varies based on the financing enhancements that are employed.
While each produces a robust bonding capacity with at least $3.4B in proceeds that can be used for construction, the utilization of both TIFIA financing, as well as some form of State bond enhancement will
be needed given the current configuration of the project, associated construction costs, and timing. As the project continues to move forward, the financial analysis will need to be refined in light of existing
market conditions and updated construction cost and staging assumptions.
The Phase 1 Study concluded that the project was financially feasibly based on a bonding capacity of
approximately $3.2 billion compared to a year of expenditure project cost of $2.8 billion. Upward
revisions to the cost estimate (from current year $2.1 billion to $3.5 billion) and pushing the project out in time from a 2010 start to a 2015 start resulted in a year of expenditure cost increase to nearly $6.0
billion, more than double that which was previously estimated.
Exhibit 50 shows the debt service coverage assumptions used in the Base Case and variations based on
the above described alternative financing options developed for this analysis. The bonding capacity for
each scenario was compared to the overall escalated project cost of $5,956.6 million to determine the financial feasibility of the project under each scenario.
23 The amount lent to WYDOT would vary by construction phasing, but could generally be sized to discrete portions of the project that could be completed in one to three years and opened for use. The phasing schedule assumed in this analysis is five concurrent two year phases with one bond issue of approximately $600 million for each phase.

Wyoming Department of Transportation
Phase 2 I-80 Tolling Feasibility Study
71
Exhibit 50: Financial Feasibility Scenario Assumptions and Bonding Capacity24
Scenario Overall Coverage
Requirement Bonding Capacity
Project Surplus /(Shortfall)
Base Case 2.0x $3,379.6M ($2,577.0)M
Base Case with TIFIA 1.67x $3,796.2M ($2,160.5)M
State Backstop 1.75x $4,237.5M ($1,719.2)M
State Backstop with TIFIA 1.42x $5,595.5M ($361.2)M
The exhibit shows that using certain financial tools (backstopping and the TIFIA program), the project is
very close to financially feasible. The $361 million shortfall that remains under the last scenario is
substantial on its own but represents only a 6 percent funding gap when compared to the total project cost. The operating and financial models used to develop these estimates are very sensitive and this
shortfall could change due to small shifts in costs, revenues, interest rates, required coverage, or other factors that must be monitored and re-estimated in the future if tolling is pursued. The gap could also be
eliminated through value engineering, adjusting the scope of the project, accelerating the project, or through a State lending program which could eliminate $200 to $300 million in interest costs from the
project. Given the current results of the financial analysis, this project appears viable despite the
relatively small funding shortfall that exists.
24 Complete sources and uses tables and debt service tables are presented in Appendix B for each scenario.
Wyoming Department of Transportation
Phase 2 I-80 Tolling Feasibility Study
72
10 Public Outreach Public outreach is a critical element of any major change in transportation infrastructure or policy.
Generally public outreach is done as part of the environmental stage of project development and while this is largely a technical study, a public information dissemination and opinion gathering campaign was
conducted. Five public meetings were held in cities and towns across the I-80 corridor in June of 2009,
including Cheyenne, Laramie, Rawlins, Rock Springs, and Evanston. Responding to the sentiment that northern residents of the State were not easily able to attend the meetings, two additional meetings were
held later in July in Casper and Gillette.
The meetings generally consisted of a short presentation on the Study’s background and tolling concepts
being evaluated, followed by a question and answer session between WYDOT and Study staff and the meeting attendees. Survey forms and other feedback tools were presented to attendees to maximize the
avenues through which people could provide comments and access project information. The meetings
were covered in local newspaper, radio, and television.
Appendix A contains all of the comments received from the public at each of the public meetings, as well
as the letters received by WYDOT from individuals before and after the meetings were held. The majority of the comments and letters expressed concern over the concept of tolling I-80, the effects tolling would
have on local economies, and the well-being of the residents of Wyoming. The most common reasons
residents cited for being opposed to the tolling concept were:
o The public is already charged a fuel tax to pay for transportation infrastructure. Charging a toll on
I-80 in addition to a fuel tax amounts to double taxation.
Many residents suggested that the government should raise fuel taxes instead of charging a toll.
According to these residents, such an increase is merited since Wyoming’s fuel tax is one of the
lowest in the country and is substantially lower than that of its neighbors.
o Interstate maintenance needs should be funded by the Federal government, not by the states.
o Trucks that use I-80 will not be able to afford a toll of 30 cents per mile, and thus will divert to alternate routes.
o Wyoming residents who use I-80 to travel to work would face undue hardship by paying a toll. This cost should not be borne by individual passenger vehicles, since trucks cause 99 percent of
the damage on I-80. Trucks should pay the tolls if they cause the damage.
o The cost of tolls will be passed onto consumers through rising costs of consumer products, imposing an additional cost to Wyoming residents above the cost of the highway itself.
o Tourism to Wyoming will be severely impacted if a toll is levied on passenger vehicles.
There was generally little support for the tolling concepts from the people who attended the public
meetings. The most staunch opposition was from independent truck operators, local businesses
(especially those related to the trucking industry such as diesel mechanics and other support services), and citizens concerned about the current Federal administration’s approaches to dealing with the
recession (mainly the Federal stimulus and bailout packages).
A short survey that asked questions related to peoples’ use of I-80 was circulated at each of the meetings
and collected to obtain additional feedback. Five questions were used to obtain the respondents county of residence, frequency of use of I-80, purpose of the trip, and destination. The survey was distributed
at public meetings and was available electronically on the tolling study website25. The results of the
survey given below include all responses received prior to September 24, 2009. Explanations below the tables reference the adjusted relative frequency, as this is the most accurate way to gauge the responses
of those respondents who completed the survey.
25 http://dot.state.wy.us/wydot/site/wydot/I-80_tolling_study
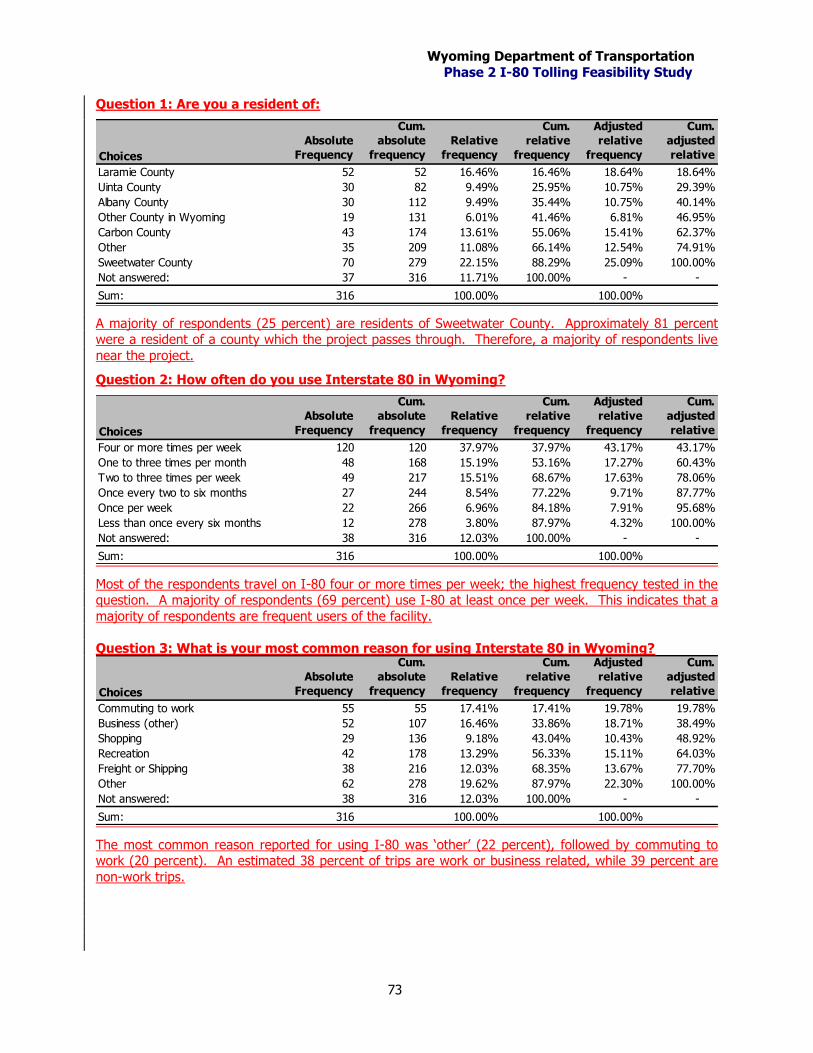
Wyoming Department of Transportation
Phase 2 I-80 Tolling Feasibility Study
73
Question 1: Are you a resident of:
Choices
Absolute
Frequency
Cum.
absolute
frequency
Relative
frequency
Cum.
relative
frequency
Adjusted
relative
frequency
Cum.
adjusted
relative
Laramie County 52 52 16.46% 16.46% 18.64% 18.64%
Uinta County 30 82 9.49% 25.95% 10.75% 29.39%
Albany County 30 112 9.49% 35.44% 10.75% 40.14%
Other County in Wyoming 19 131 6.01% 41.46% 6.81% 46.95%
Carbon County 43 174 13.61% 55.06% 15.41% 62.37%
Other 35 209 11.08% 66.14% 12.54% 74.91%
Sweetwater County 70 279 22.15% 88.29% 25.09% 100.00%
Not answered: 37 316 11.71% 100.00% - -
Sum: 316 100.00% 100.00%
A majority of respondents (25 percent) are residents of Sweetwater County. Approximately 81 percent were a resident of a county which the project passes through. Therefore, a majority of respondents live
near the project.
Question 2: How often do you use Interstate 80 in Wyoming?
Choices
Absolute
Frequency
Cum.
absolute
frequency
Relative
frequency
Cum.
relative
frequency
Adjusted
relative
frequency
Cum.
adjusted
relative
Four or more times per week 120 120 37.97% 37.97% 43.17% 43.17%
One to three times per month 48 168 15.19% 53.16% 17.27% 60.43%
Two to three times per week 49 217 15.51% 68.67% 17.63% 78.06%
Once every two to six months 27 244 8.54% 77.22% 9.71% 87.77%
Once per week 22 266 6.96% 84.18% 7.91% 95.68%
Less than once every six months 12 278 3.80% 87.97% 4.32% 100.00%
Not answered: 38 316 12.03% 100.00% - -
Sum: 316 100.00% 100.00%
Most of the respondents travel on I-80 four or more times per week; the highest frequency tested in the question. A majority of respondents (69 percent) use I-80 at least once per week. This indicates that a
majority of respondents are frequent users of the facility.
Question 3: What is your most common reason for using Interstate 80 in Wyoming?
Choices
Absolute
Frequency
Cum.
absolute
frequency
Relative
frequency
Cum.
relative
frequency
Adjusted
relative
frequency
Cum.
adjusted
relative
Commuting to work 55 55 17.41% 17.41% 19.78% 19.78%
Business (other) 52 107 16.46% 33.86% 18.71% 38.49%
Shopping 29 136 9.18% 43.04% 10.43% 48.92%
Recreation 42 178 13.29% 56.33% 15.11% 64.03%
Freight or Shipping 38 216 12.03% 68.35% 13.67% 77.70%
Other 62 278 19.62% 87.97% 22.30% 100.00%
Not answered: 38 316 12.03% 100.00% - -
Sum: 316 100.00% 100.00%
The most common reason reported for using I-80 was ‘other’ (22 percent), followed by commuting to work (20 percent). An estimated 38 percent of trips are work or business related, while 39 percent are
non-work trips.
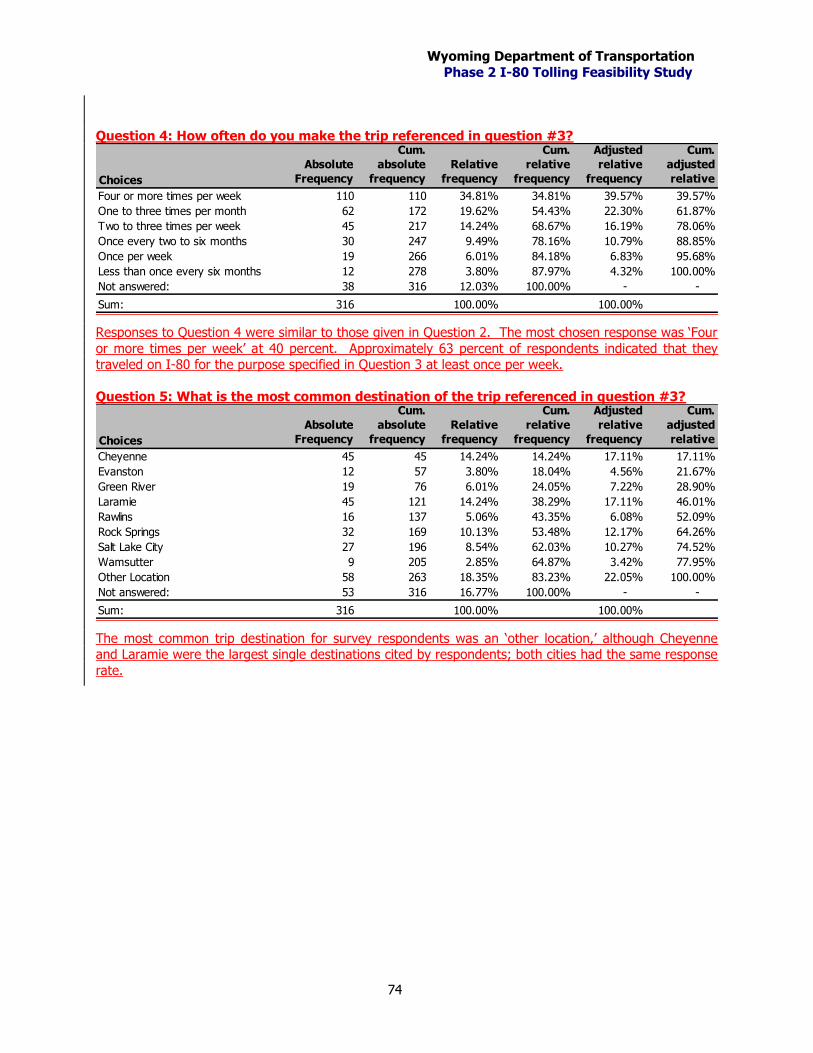
Wyoming Department of Transportation
Phase 2 I-80 Tolling Feasibility Study
74
Question 4: How often do you make the trip referenced in question #3?
Choices
Absolute
Frequency
Cum.
absolute
frequency
Relative
frequency
Cum.
relative
frequency
Adjusted
relative
frequency
Cum.
adjusted
relative
Four or more times per week 110 110 34.81% 34.81% 39.57% 39.57%
One to three times per month 62 172 19.62% 54.43% 22.30% 61.87%
Two to three times per week 45 217 14.24% 68.67% 16.19% 78.06%
Once every two to six months 30 247 9.49% 78.16% 10.79% 88.85%
Once per week 19 266 6.01% 84.18% 6.83% 95.68%
Less than once every six months 12 278 3.80% 87.97% 4.32% 100.00%
Not answered: 38 316 12.03% 100.00% - -
Sum: 316 100.00% 100.00%
Responses to Question 4 were similar to those given in Question 2. The most chosen response was ‘Four
or more times per week’ at 40 percent. Approximately 63 percent of respondents indicated that they traveled on I-80 for the purpose specified in Question 3 at least once per week.
Question 5: What is the most common destination of the trip referenced in question #3?
Choices
Absolute
Frequency
Cum.
absolute
frequency
Relative
frequency
Cum.
relative
frequency
Adjusted
relative
frequency
Cum.
adjusted
relative
Cheyenne 45 45 14.24% 14.24% 17.11% 17.11%
Evanston 12 57 3.80% 18.04% 4.56% 21.67%
Green River 19 76 6.01% 24.05% 7.22% 28.90%
Laramie 45 121 14.24% 38.29% 17.11% 46.01%
Rawlins 16 137 5.06% 43.35% 6.08% 52.09%
Rock Springs 32 169 10.13% 53.48% 12.17% 64.26%
Salt Lake City 27 196 8.54% 62.03% 10.27% 74.52%
Wamsutter 9 205 2.85% 64.87% 3.42% 77.95%
Other Location 58 263 18.35% 83.23% 22.05% 100.00%
Not answered: 53 316 16.77% 100.00% - -
Sum: 316 100.00% 100.00%
The most common trip destination for survey respondents was an ‘other location,’ although Cheyenne and Laramie were the largest single destinations cited by respondents; both cities had the same response
rate.

Wyoming Department of Transportation
Phase 2 I-80 Tolling Feasibility Study
Appendix A: Public Comments

Wyoming Department of Transportation
Phase 2 I-80 Tolling Feasibility Study
Appendix B: Financial Scenarios
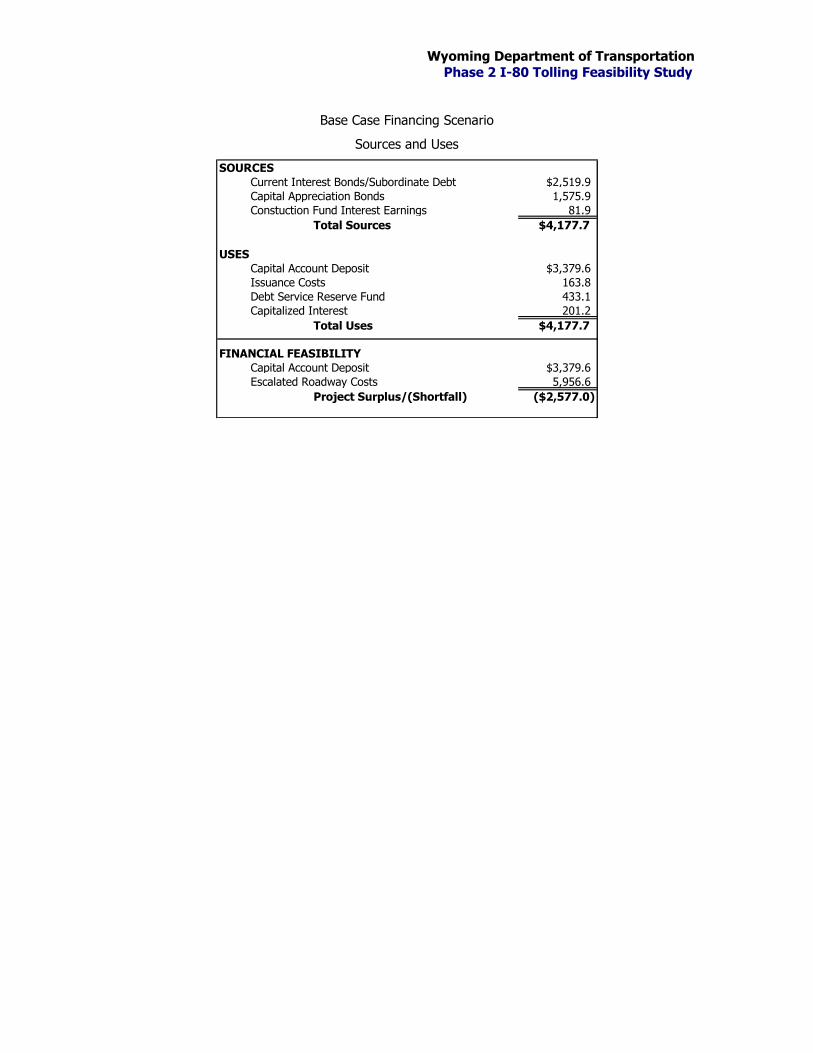
Wyoming Department of Transportation
Phase 2 I-80 Tolling Feasibility Study
Base Case Financing Scenario
Sources and Uses
SOURCES
Current Interest Bonds/Subordinate Debt $2,519.9
Capital Appreciation Bonds 1,575.9
Constuction Fund Interest Earnings 81.9
Total Sources $4,177.7
USES
Capital Account Deposit $3,379.6
Issuance Costs 163.8
Debt Service Reserve Fund 433.1
Capitalized Interest 201.2
Total Uses $4,177.7
FINANCIAL FEASIBILITY
Capital Account Deposit $3,379.6
Escalated Roadway Costs 5,956.6
Project Surplus/(Shortfall) ($2,577.0)
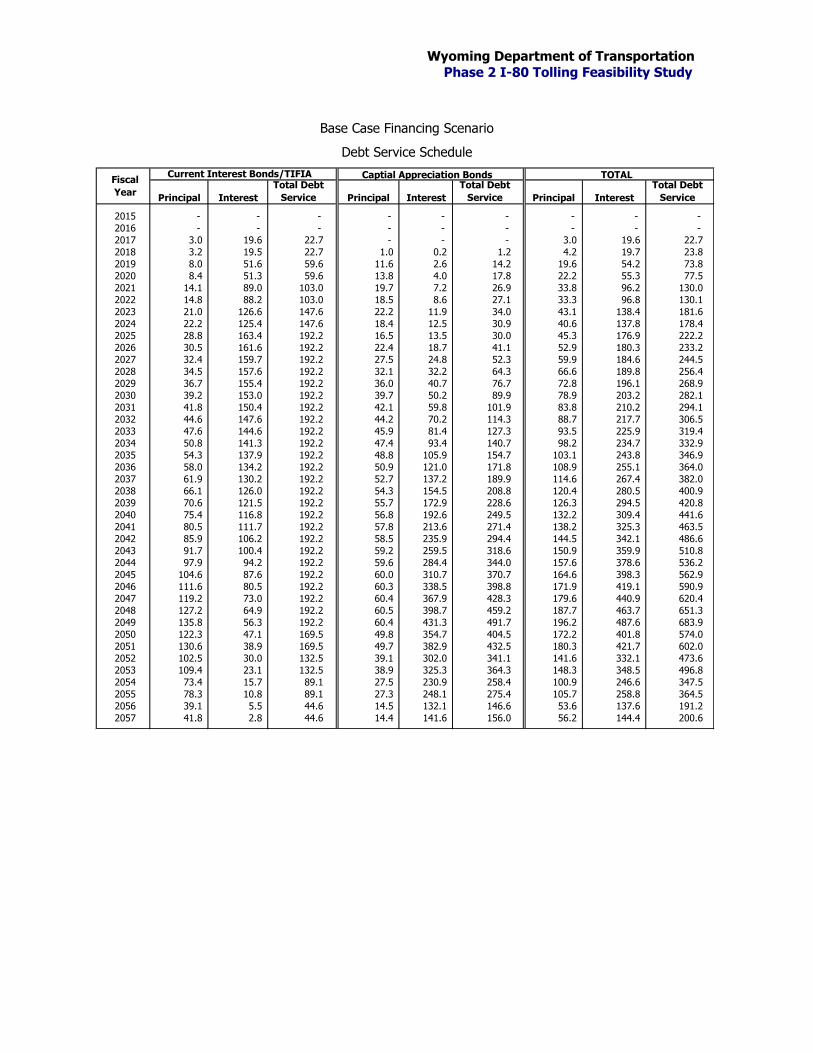
Wyoming Department of Transportation
Phase 2 I-80 Tolling Feasibility Study
Base Case Financing Scenario
Debt Service Schedule
Current Interest Bonds/TIFIA TOTAL
Principal Interest
Total Debt
Service Principal Interest
Total Debt
Service Principal Interest
Total Debt
Service
2015 - - - - - - - - -
2016 - - - - - - - - -
2017 3.0 19.6 22.7 - - - 3.0 19.6 22.7
2018 3.2 19.5 22.7 1.0 0.2 1.2 4.2 19.7 23.8
2019 8.0 51.6 59.6 11.6 2.6 14.2 19.6 54.2 73.8
2020 8.4 51.3 59.6 13.8 4.0 17.8 22.2 55.3 77.5
2021 14.1 89.0 103.0 19.7 7.2 26.9 33.8 96.2 130.0
2022 14.8 88.2 103.0 18.5 8.6 27.1 33.3 96.8 130.1
2023 21.0 126.6 147.6 22.2 11.9 34.0 43.1 138.4 181.6
2024 22.2 125.4 147.6 18.4 12.5 30.9 40.6 137.8 178.4
2025 28.8 163.4 192.2 16.5 13.5 30.0 45.3 176.9 222.2
2026 30.5 161.6 192.2 22.4 18.7 41.1 52.9 180.3 233.2
2027 32.4 159.7 192.2 27.5 24.8 52.3 59.9 184.6 244.5
2028 34.5 157.6 192.2 32.1 32.2 64.3 66.6 189.8 256.4
2029 36.7 155.4 192.2 36.0 40.7 76.7 72.8 196.1 268.9
2030 39.2 153.0 192.2 39.7 50.2 89.9 78.9 203.2 282.1
2031 41.8 150.4 192.2 42.1 59.8 101.9 83.8 210.2 294.1
2032 44.6 147.6 192.2 44.2 70.2 114.3 88.7 217.7 306.5
2033 47.6 144.6 192.2 45.9 81.4 127.3 93.5 225.9 319.4
2034 50.8 141.3 192.2 47.4 93.4 140.7 98.2 234.7 332.9
2035 54.3 137.9 192.2 48.8 105.9 154.7 103.1 243.8 346.9
2036 58.0 134.2 192.2 50.9 121.0 171.8 108.9 255.1 364.0
2037 61.9 130.2 192.2 52.7 137.2 189.9 114.6 267.4 382.0
2038 66.1 126.0 192.2 54.3 154.5 208.8 120.4 280.5 400.9
2039 70.6 121.5 192.2 55.7 172.9 228.6 126.3 294.5 420.8
2040 75.4 116.8 192.2 56.8 192.6 249.5 132.2 309.4 441.6
2041 80.5 111.7 192.2 57.8 213.6 271.4 138.2 325.3 463.5
2042 85.9 106.2 192.2 58.5 235.9 294.4 144.5 342.1 486.6
2043 91.7 100.4 192.2 59.2 259.5 318.6 150.9 359.9 510.8
2044 97.9 94.2 192.2 59.6 284.4 344.0 157.6 378.6 536.2
2045 104.6 87.6 192.2 60.0 310.7 370.7 164.6 398.3 562.9
2046 111.6 80.5 192.2 60.3 338.5 398.8 171.9 419.1 590.9
2047 119.2 73.0 192.2 60.4 367.9 428.3 179.6 440.9 620.4
2048 127.2 64.9 192.2 60.5 398.7 459.2 187.7 463.7 651.3
2049 135.8 56.3 192.2 60.4 431.3 491.7 196.2 487.6 683.9
2050 122.3 47.1 169.5 49.8 354.7 404.5 172.2 401.8 574.0
2051 130.6 38.9 169.5 49.7 382.9 432.5 180.3 421.7 602.0
2052 102.5 30.0 132.5 39.1 302.0 341.1 141.6 332.1 473.6
2053 109.4 23.1 132.5 38.9 325.3 364.3 148.3 348.5 496.8
2054 73.4 15.7 89.1 27.5 230.9 258.4 100.9 246.6 347.5
2055 78.3 10.8 89.1 27.3 248.1 275.4 105.7 258.8 364.5
2056 39.1 5.5 44.6 14.5 132.1 146.6 53.6 137.6 191.2
2057 41.8 2.8 44.6 14.4 141.6 156.0 56.2 144.4 200.6
Fiscal
Year
Captial Appreciation Bonds

Wyoming Department of Transportation
Phase 2 I-80 Tolling Feasibility Study
Base Case with TIFIA Financing Scenario
Sources and Uses
SOURCES
Current Interest Bonds/Subordinate Debt $2,712.6
Capital Appreciation Bonds 1,797.1
Constuction Fund Interest Earnings 90.2
Total Sources $4,599.8
USES
Capital Account Deposit $3,796.2
Issuance Costs 180.4
Debt Service Reserve Fund 433.1
Capitalized Interest 190.2
Total Uses $4,599.8
FINANCIAL FEASIBILITY
Capital Account Deposit $3,796.2
Escalated Roadway Costs 5,956.6
Project Surplus/(Shortfall) ($2,160.5)
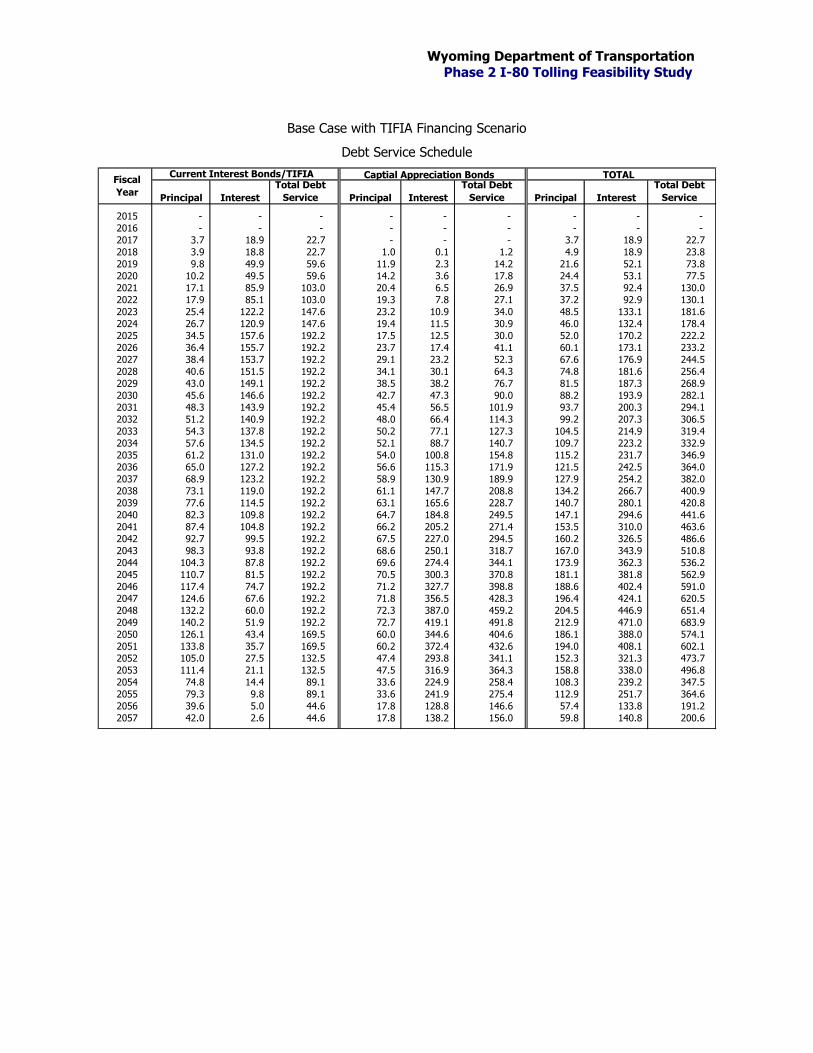
Wyoming Department of Transportation
Phase 2 I-80 Tolling Feasibility Study
Base Case with TIFIA Financing Scenario
Debt Service Schedule
Current Interest Bonds/TIFIA TOTAL
Principal Interest
Total Debt
Service Principal Interest
Total Debt
Service Principal Interest
Total Debt
Service
2015 - - - - - - - - -
2016 - - - - - - - - -
2017 3.7 18.9 22.7 - - - 3.7 18.9 22.7
2018 3.9 18.8 22.7 1.0 0.1 1.2 4.9 18.9 23.8
2019 9.8 49.9 59.6 11.9 2.3 14.2 21.6 52.1 73.8
2020 10.2 49.5 59.6 14.2 3.6 17.8 24.4 53.1 77.5
2021 17.1 85.9 103.0 20.4 6.5 26.9 37.5 92.4 130.0
2022 17.9 85.1 103.0 19.3 7.8 27.1 37.2 92.9 130.1
2023 25.4 122.2 147.6 23.2 10.9 34.0 48.5 133.1 181.6
2024 26.7 120.9 147.6 19.4 11.5 30.9 46.0 132.4 178.4
2025 34.5 157.6 192.2 17.5 12.5 30.0 52.0 170.2 222.2
2026 36.4 155.7 192.2 23.7 17.4 41.1 60.1 173.1 233.2
2027 38.4 153.7 192.2 29.1 23.2 52.3 67.6 176.9 244.5
2028 40.6 151.5 192.2 34.1 30.1 64.3 74.8 181.6 256.4
2029 43.0 149.1 192.2 38.5 38.2 76.7 81.5 187.3 268.9
2030 45.6 146.6 192.2 42.7 47.3 90.0 88.2 193.9 282.1
2031 48.3 143.9 192.2 45.4 56.5 101.9 93.7 200.3 294.1
2032 51.2 140.9 192.2 48.0 66.4 114.3 99.2 207.3 306.5
2033 54.3 137.8 192.2 50.2 77.1 127.3 104.5 214.9 319.4
2034 57.6 134.5 192.2 52.1 88.7 140.7 109.7 223.2 332.9
2035 61.2 131.0 192.2 54.0 100.8 154.8 115.2 231.7 346.9
2036 65.0 127.2 192.2 56.6 115.3 171.9 121.5 242.5 364.0
2037 68.9 123.2 192.2 58.9 130.9 189.9 127.9 254.2 382.0
2038 73.1 119.0 192.2 61.1 147.7 208.8 134.2 266.7 400.9
2039 77.6 114.5 192.2 63.1 165.6 228.7 140.7 280.1 420.8
2040 82.3 109.8 192.2 64.7 184.8 249.5 147.1 294.6 441.6
2041 87.4 104.8 192.2 66.2 205.2 271.4 153.5 310.0 463.6
2042 92.7 99.5 192.2 67.5 227.0 294.5 160.2 326.5 486.6
2043 98.3 93.8 192.2 68.6 250.1 318.7 167.0 343.9 510.8
2044 104.3 87.8 192.2 69.6 274.4 344.1 173.9 362.3 536.2
2045 110.7 81.5 192.2 70.5 300.3 370.8 181.1 381.8 562.9
2046 117.4 74.7 192.2 71.2 327.7 398.8 188.6 402.4 591.0
2047 124.6 67.6 192.2 71.8 356.5 428.3 196.4 424.1 620.5
2048 132.2 60.0 192.2 72.3 387.0 459.2 204.5 446.9 651.4
2049 140.2 51.9 192.2 72.7 419.1 491.8 212.9 471.0 683.9
2050 126.1 43.4 169.5 60.0 344.6 404.6 186.1 388.0 574.1
2051 133.8 35.7 169.5 60.2 372.4 432.6 194.0 408.1 602.1
2052 105.0 27.5 132.5 47.4 293.8 341.1 152.3 321.3 473.7
2053 111.4 21.1 132.5 47.5 316.9 364.3 158.8 338.0 496.8
2054 74.8 14.4 89.1 33.6 224.9 258.4 108.3 239.2 347.5
2055 79.3 9.8 89.1 33.6 241.9 275.4 112.9 251.7 364.6
2056 39.6 5.0 44.6 17.8 128.8 146.6 57.4 133.8 191.2
2057 42.0 2.6 44.6 17.8 138.2 156.0 59.8 140.8 200.6
Fiscal
Year
Captial Appreciation Bonds
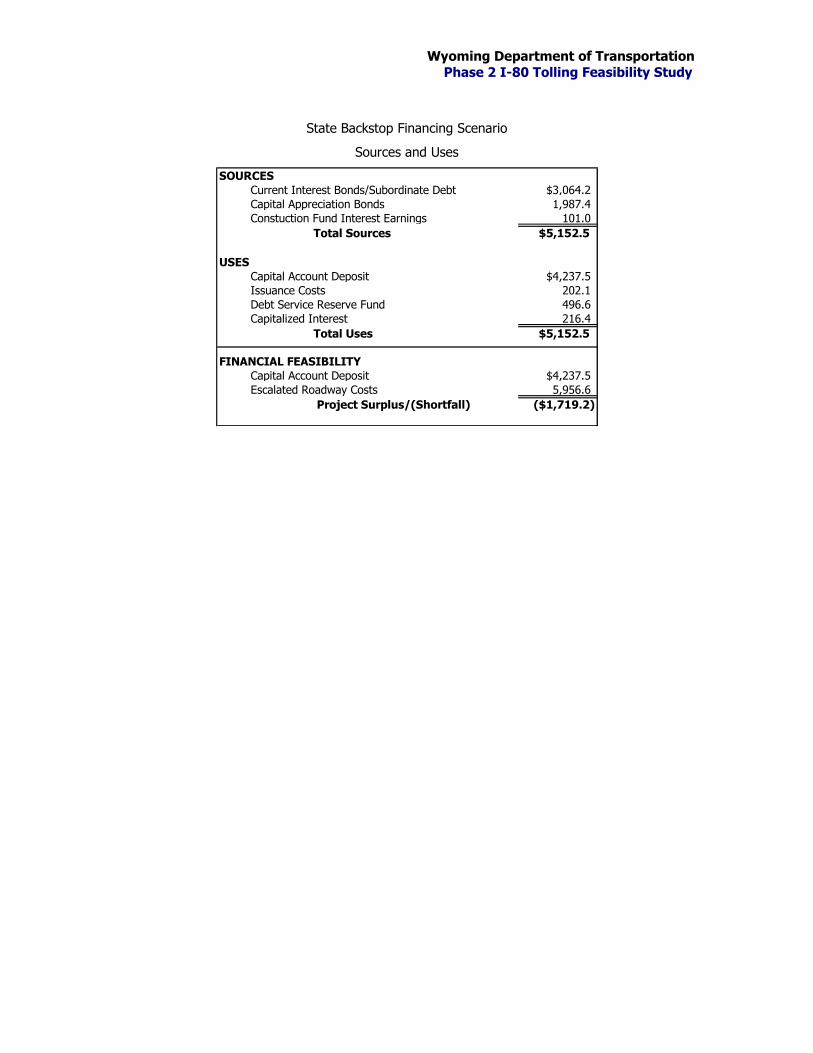
Wyoming Department of Transportation
Phase 2 I-80 Tolling Feasibility Study
State Backstop Financing Scenario
Sources and Uses
SOURCES
Current Interest Bonds/Subordinate Debt $3,064.2
Capital Appreciation Bonds 1,987.4
Constuction Fund Interest Earnings 101.0
Total Sources $5,152.5
USES
Capital Account Deposit $4,237.5
Issuance Costs 202.1
Debt Service Reserve Fund 496.6
Capitalized Interest 216.4
Total Uses $5,152.5
FINANCIAL FEASIBILITY
Capital Account Deposit $4,237.5
Escalated Roadway Costs 5,956.6
Project Surplus/(Shortfall) ($1,719.2)

Wyoming Department of Transportation
Phase 2 I-80 Tolling Feasibility Study
State Backstop Financing Scenario
Debt Service Schedule
Current Interest Bonds/TIFIA TOTAL
Principal Interest
Total Debt
Service Principal Interest
Total Debt
Service Principal Interest
Total Debt
Service
2015 - - - - - - - - -
2016 - - - - - - - - -
2017 4.2 22.0 26.2 - - - 4.2 22.0 26.2
2018 4.3 21.9 26.2 1.2 0.2 1.3 5.5 22.0 27.6
2019 10.9 57.8 68.8 13.6 2.6 16.2 24.5 60.5 85.0
2020 11.4 57.4 68.8 16.3 4.1 20.4 27.6 61.5 89.2
2021 19.1 99.6 118.7 23.3 7.4 30.8 42.5 107.0 149.5
2022 20.0 98.7 118.7 22.0 9.0 31.0 42.0 107.7 149.7
2023 28.3 141.7 170.0 26.5 12.4 38.9 54.7 154.2 208.9
2024 29.7 140.3 170.0 22.1 13.2 35.3 51.8 153.4 205.2
2025 38.4 182.9 221.3 20.0 14.4 34.3 58.4 197.3 255.6
2026 40.5 180.8 221.3 27.0 20.0 46.9 67.5 200.7 268.2
2027 42.8 178.5 221.3 33.2 26.6 59.8 76.0 205.1 281.1
2028 45.2 176.1 221.3 38.9 34.5 73.4 84.2 210.6 294.7
2029 47.9 173.4 221.3 44.0 43.7 87.7 91.9 217.1 309.0
2030 50.7 170.6 221.3 48.7 54.1 102.8 99.5 224.6 324.1
2031 53.8 167.5 221.3 51.9 64.6 116.5 105.7 232.1 337.8
2032 57.0 164.3 221.3 54.7 76.0 130.7 111.7 240.2 352.0
2033 60.5 160.8 221.3 57.1 88.4 145.5 117.6 249.2 366.8
2034 64.2 157.1 221.3 59.0 101.8 160.9 123.2 258.9 382.1
2035 68.2 153.1 221.3 60.9 115.9 176.9 129.2 269.0 398.2
2036 72.5 148.8 221.3 63.5 132.9 196.4 136.0 281.7 417.7
2037 77.0 144.3 221.3 65.8 151.2 217.0 142.8 295.5 438.3
2038 81.8 139.5 221.3 67.9 170.7 238.6 149.7 310.2 459.9
2039 86.9 134.4 221.3 69.6 191.7 261.3 156.5 326.1 482.6
2040 92.4 128.9 221.3 71.3 213.9 285.1 163.7 342.8 506.4
2041 98.2 123.1 221.3 72.7 237.5 310.2 170.9 360.6 531.5
2042 104.4 116.9 221.3 74.0 262.5 336.5 178.3 379.5 557.8
2043 110.9 110.4 221.3 75.0 289.1 364.2 186.0 399.5 585.5
2044 117.9 103.4 221.3 75.9 317.3 393.2 193.8 420.6 614.5
2045 125.3 96.0 221.3 76.7 347.0 423.7 202.1 443.0 645.0
2046 133.2 88.1 221.3 77.4 378.4 455.8 210.6 466.5 677.1
2047 141.6 79.7 221.3 77.9 411.6 489.5 219.5 491.3 710.8
2048 150.5 70.8 221.3 78.3 446.5 524.8 228.8 517.3 746.1
2049 160.0 61.3 221.3 78.6 483.4 562.0 238.6 544.8 783.3
2050 143.8 51.2 195.1 64.8 397.5 462.4 208.7 448.8 657.4
2051 152.9 42.2 195.1 64.9 429.4 494.4 217.8 471.6 689.4
2052 119.9 32.6 152.5 51.1 338.8 389.9 171.0 371.3 542.4
2053 127.5 25.0 152.5 51.1 365.2 416.3 178.6 390.3 568.9
2054 85.6 17.0 102.6 36.1 259.2 295.3 121.7 276.2 397.9
2055 90.9 11.6 102.6 36.1 278.7 314.8 127.0 290.3 417.3
2056 45.4 5.9 51.3 19.2 148.4 167.6 64.6 154.3 218.9
2057 48.3 3.0 51.3 19.1 159.2 178.3 67.4 162.3 229.6
Fiscal
Year
Captial Appreciation Bonds
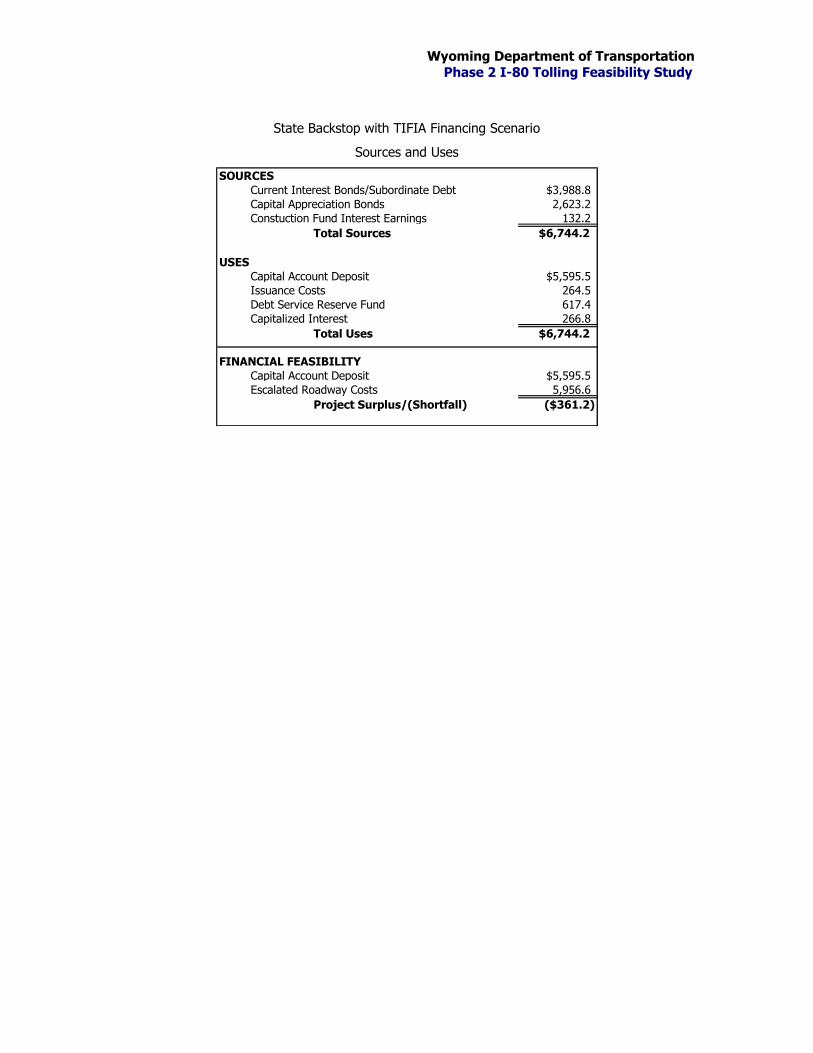
Wyoming Department of Transportation
Phase 2 I-80 Tolling Feasibility Study
State Backstop with TIFIA Financing Scenario
Sources and Uses
SOURCES
Current Interest Bonds/Subordinate Debt $3,988.8
Capital Appreciation Bonds 2,623.2
Constuction Fund Interest Earnings 132.2
Total Sources $6,744.2
USES
Capital Account Deposit $5,595.5
Issuance Costs 264.5
Debt Service Reserve Fund 617.4
Capitalized Interest 266.8
Total Uses $6,744.2
FINANCIAL FEASIBILITY
Capital Account Deposit $5,595.5
Escalated Roadway Costs 5,956.6
Project Surplus/(Shortfall) ($361.2)
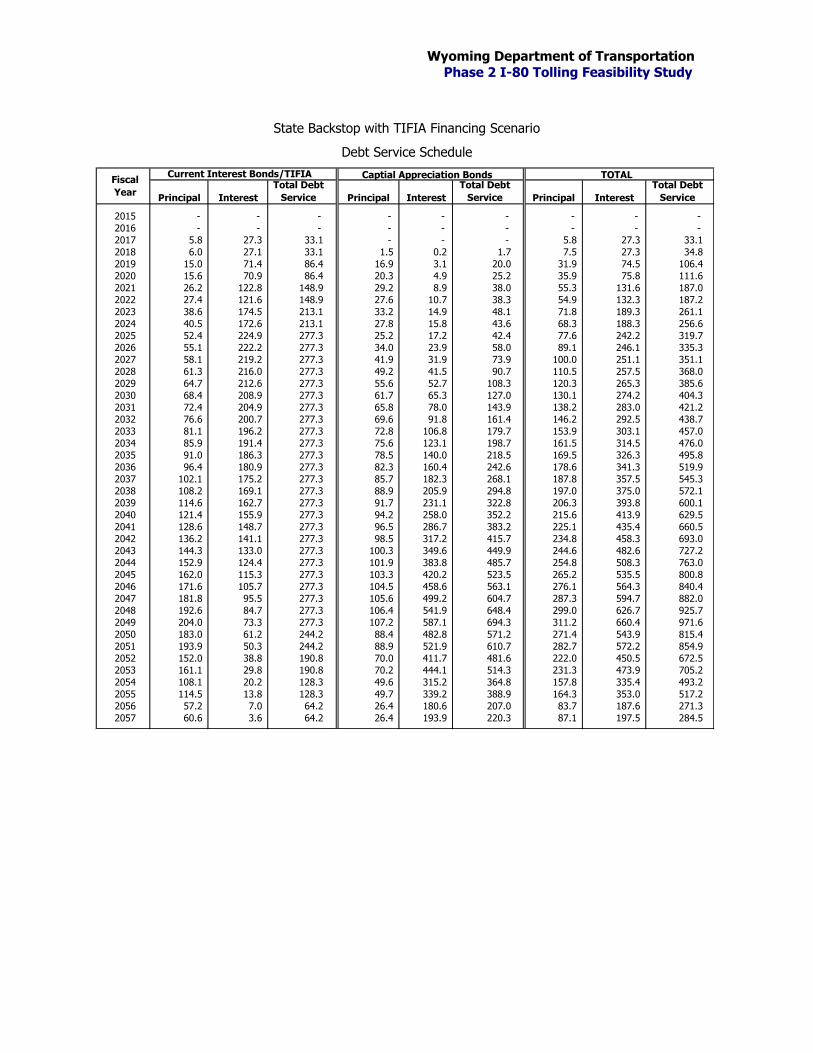
Wyoming Department of Transportation
Phase 2 I-80 Tolling Feasibility Study
State Backstop with TIFIA Financing Scenario
Debt Service Schedule
Current Interest Bonds/TIFIA TOTAL
Principal Interest
Total Debt
Service Principal Interest
Total Debt
Service Principal Interest
Total Debt
Service
2015 - - - - - - - - -
2016 - - - - - - - - -
2017 5.8 27.3 33.1 - - - 5.8 27.3 33.1
2018 6.0 27.1 33.1 1.5 0.2 1.7 7.5 27.3 34.8
2019 15.0 71.4 86.4 16.9 3.1 20.0 31.9 74.5 106.4
2020 15.6 70.9 86.4 20.3 4.9 25.2 35.9 75.8 111.6
2021 26.2 122.8 148.9 29.2 8.9 38.0 55.3 131.6 187.0
2022 27.4 121.6 148.9 27.6 10.7 38.3 54.9 132.3 187.2
2023 38.6 174.5 213.1 33.2 14.9 48.1 71.8 189.3 261.1
2024 40.5 172.6 213.1 27.8 15.8 43.6 68.3 188.3 256.6
2025 52.4 224.9 277.3 25.2 17.2 42.4 77.6 242.2 319.7
2026 55.1 222.2 277.3 34.0 23.9 58.0 89.1 246.1 335.3
2027 58.1 219.2 277.3 41.9 31.9 73.9 100.0 251.1 351.1
2028 61.3 216.0 277.3 49.2 41.5 90.7 110.5 257.5 368.0
2029 64.7 212.6 277.3 55.6 52.7 108.3 120.3 265.3 385.6
2030 68.4 208.9 277.3 61.7 65.3 127.0 130.1 274.2 404.3
2031 72.4 204.9 277.3 65.8 78.0 143.9 138.2 283.0 421.2
2032 76.6 200.7 277.3 69.6 91.8 161.4 146.2 292.5 438.7
2033 81.1 196.2 277.3 72.8 106.8 179.7 153.9 303.1 457.0
2034 85.9 191.4 277.3 75.6 123.1 198.7 161.5 314.5 476.0
2035 91.0 186.3 277.3 78.5 140.0 218.5 169.5 326.3 495.8
2036 96.4 180.9 277.3 82.3 160.4 242.6 178.6 341.3 519.9
2037 102.1 175.2 277.3 85.7 182.3 268.1 187.8 357.5 545.3
2038 108.2 169.1 277.3 88.9 205.9 294.8 197.0 375.0 572.1
2039 114.6 162.7 277.3 91.7 231.1 322.8 206.3 393.8 600.1
2040 121.4 155.9 277.3 94.2 258.0 352.2 215.6 413.9 629.5
2041 128.6 148.7 277.3 96.5 286.7 383.2 225.1 435.4 660.5
2042 136.2 141.1 277.3 98.5 317.2 415.7 234.8 458.3 693.0
2043 144.3 133.0 277.3 100.3 349.6 449.9 244.6 482.6 727.2
2044 152.9 124.4 277.3 101.9 383.8 485.7 254.8 508.3 763.0
2045 162.0 115.3 277.3 103.3 420.2 523.5 265.2 535.5 800.8
2046 171.6 105.7 277.3 104.5 458.6 563.1 276.1 564.3 840.4
2047 181.8 95.5 277.3 105.6 499.2 604.7 287.3 594.7 882.0
2048 192.6 84.7 277.3 106.4 541.9 648.4 299.0 626.7 925.7
2049 204.0 73.3 277.3 107.2 587.1 694.3 311.2 660.4 971.6
2050 183.0 61.2 244.2 88.4 482.8 571.2 271.4 543.9 815.4
2051 193.9 50.3 244.2 88.9 521.9 610.7 282.7 572.2 854.9
2052 152.0 38.8 190.8 70.0 411.7 481.6 222.0 450.5 672.5
2053 161.1 29.8 190.8 70.2 444.1 514.3 231.3 473.9 705.2
2054 108.1 20.2 128.3 49.6 315.2 364.8 157.8 335.4 493.2
2055 114.5 13.8 128.3 49.7 339.2 388.9 164.3 353.0 517.2
2056 57.2 7.0 64.2 26.4 180.6 207.0 83.7 187.6 271.3
2057 60.6 3.6 64.2 26.4 193.9 220.3 87.1 197.5 284.5
Fiscal
Year
Captial Appreciation Bonds