Embed Size (px)
Citation preview
Integrated High-rise BuSupply ChaiAnalyses anSupply LogisAASSuuuppp
Modular Integrated Construction for High-rise Buildings in Hong Kong: Supply Chain Identification, Analyses and Establishment
Reference Materials on Market Analysis
i
Modular Integrated Construction for High-rise Buildings in Hong Kong: Supply Chain Identification, Analyses and
Establishment
Reference Materials on Market Analysis
Authors Ir Prof Wei PAN; Ir Prof Thomas NG; Ir Prof George HUANG;
Ir Prof Sam CHAN; Ir Prof Francis AU; Ir KL TAM; Dr Louis CHU; Dr Yi YANG; Mr Zhenjie ZHENG; Dr Mi PAN
The University of Hong Kong
Disclaimer The content given in the report is solely the responsibility of the Project Team and does not necessarily represent the official views of the Construction Industry Council (CIC). Readers are encouraged to seek independent advice from professional advisors where required and should not treat or rely on this report as a substitute for such professional advice for taking any relevant action.
Enquiries Any enquiries may be made to the CIC Secretariat at: CIC Headquarters 38/F, COS Centre, 56 Tsun Yip Street, Kwun Tong, Kowloon, Hong Kong Tel: (852) 2100 9000 Fax: (852) 2100 9090 Email: [email protected] Website: www.cic.hk © 2021 Construction Industry Council
ii
Executive Summary Modular Integrated Construction (MiC) is a new policy initiative stated in the Chief Executive’s 2017 and 2018 Policy Address for enhancing construction productivity and competitiveness, offering great potential to deliver tall buildings with high efficiency, quality, safety and sustainability. Besides, in the Chief Executive’s 2020 Policy Address, the importance of MiC amid the Covid-19 Pandemic has been highlighted in the speedy completion of quarantine centres. To underpin the sustained growth and successful take-up of MiC for buildings in Hong Kong, there is a need to understand the market preference and to establish proactive strategies. This report aims to evaluate the suitability of different types of buildings for MiC, e.g. hostels, housing, and commercial in Hong Kong. The aim was fulfilled through building sectors analysis and typical floor plan modularisation and an industry-wide MiC market survey. To enrich the discussion and alert the government and industry to get well prepared for potential MiC developments, we further conducted market scenario analysis as value-added activities for this project. The report comprises three main parts. The first part of the report reviews the current status and future development of the main building sectors in Hong Kong, namely, private residential, public housing, hotels, student hostels, staff quarters, hospitals, transitional housing and quarantine centres. MiC modular layouts are provided using typical or reference building floor plans of relevant building types. The building sector analysis preliminarily demonstrated the suitability of different types of buildings for MiC, and provided an empirical foundation for the follow-up market demand estimation. The second part of the report provides the results and analysis of the MiC market questionnaire survey with the wide-ranging stakeholders and practitioners in the Hong Kong building construction industry and community. Out of the 1385 invited participants, 326 effective responses were received, yielding a response rate of 23.54% which well aligns with most construction research surveys. This survey first examines the stakeholders’ perspectives on the suitability of adopting MiC in different building sectors. The survey then examines the significance of various drivers that promote, constraints that prohibit, and mitigation strategies that help to overcome the constraints in the MiC adoption in Hong Kong. The third part of the report estimates MiC market demand using a scenario analysis approach. We developed less- and more- aggressive scenarios considering the development of key influencing factors and a set of general conditions, assumptions. MiC market demand was estimated to predict the demand in the building sectors including public housing, private residential, hotels, student hostels, staff quarters, and hospitals within the 1-year (by 2020), 3- year (by 2022), 5-year (by 2024) and 10-year (by 2029) time frames, from the baseline year of 2019.
iii
The main findings of the report are:
• An industry-wide questionnaire survey was conducted, the findings of which were found consistent among all effective respondents, respondents with good knowledge of MiC and residents with modular building project experience. The survey revealed the top three suitable building types to adopt MiC to be (in descending order of suitability perceived by all effective respondents): (1) Student/staff hostels (2) Budget hotels (3) High-rise public residential buildings
MiC was perceived more suitable for the public, residential and low-end building sectors than for the private, functional and high-end ones. This result suggests a need to raise awareness of the industry of the benefits of adopting MiC in various building sectors in Hong Kong.
• All effective respondents and respondents with good knowledge of MiC prefer “the hybrid
steel frame plus concrete floor and wall” MiC system the most for their real-life projects, while respondents with modular building project experience prefer “precast concrete” MiC system the most. All the three groups considered “steel-framed” MiC system as the least preferable. The results reflect the market preference on concrete modules.
• The top five most important drivers for adopting MiC were identified to be (in descending
order of importance perceived by all effective respondents): (1) faster construction and shortened project duration; (2) GFA concession or bonus; (3) better quality control of products due to standardisation; (4) MiC policy initiative and promotion; and (5) improved health, safety and welfare for workers.
These drivers are directly or indirectly related to the commercial merits of MiC.
• The top five most significant constraints to MiC adoption were revealed to be (in descending order of significance perceived by all effective respondents): (1) limited available codes and standards; (2) limited choice of capable suppliers and contractors in the market; (3) over-stringent regulations; (4) challenges in logistics due to safety, traffic condition and storage issues; and (5) loss of saleable areas owing to the double wall/floor issues.
These constraints were more or less related to the regulatory aspect of innovation building.
• The top five most important strategies for promoting MiC in Hong Kong were found to be (in descending order of importance by all effective respondents):
iv
(1) providing GFA concession for MiC adoption in private projects; (2) improving current MiC standards and codes to guide regulatory compliance
checking and achievement; (3) exploring technical solutions to save GFA, e.g. using open-sided modules; (4) modifying current transport regulations (e.g. width limit) to support MiC logistics; (5) mandating MiC adoption in public housing.
• Under the less aggressive scenarios, the overall MiC market demand in the studied building
sectors is estimated to reach: (1) 18,300 modules by the end of 2022, with about 209,700 m2 of CFA by MiC; (2) 50,300 modules by the end of 2024, with about 596,000 m2 of CFA by MiC; and (3) 241,100 modules by the end of 2029, with about 2,821,600 m2 of CFA by MiC.
• Under the more aggressive scenarios, the MiC market demand in the studied building
sectors is estimated to reach: (1) 25,100 modules by the end of 2022, with about 294,800 m2 of CFA by MiC; (2) 69,000 modules by the end of 2024, with about 824,300 m2 of CFA by MiC; and (3) 342,800 modules by the end of 2029, with about 4,039,900 m2 of CFA by MiC.
• The results of the market estimation and industry questionnaire survey together unveil the
significant opportunities and an urgent need to nurture the MiC market in Hong Kong. Thus, strategic actions should be taken to best meet the market demand and realise the opportunities. The recommended actions for critical stakeholders are summarised below: o Government departments should provide support in terms of policy, regulation, land,
funding and techniques to the MiC industry for supply chain enhancement. o Clients should be open-minded to innovative technologies and team up with eligible
MiC professionals for MiC project planning, transportation feasibility, implementation, monitoring and control.
o Contractors should collaborate with MiC professionals from early-stage and transfer the merits of MiC into tangible benefits.
o Consultants should integrate market preferences (e.g. preference for concrete) and user behaviour (e.g. possible alteration) into module design。
o MiC manufacturers and suppliers should ensure quality control at the project level and seek ways to increase market awareness at the industry level.
o Institutions and universities should enhance MiC related research and development, and be involved by the government and the practitioners in streamlining MiC project delivery.
The findings of this report should help the stakeholders of the Hong Kong construction industry to gain a better understanding of the market potential of MiC and to de-risk their business planning and decision-making in relation to MiC adoption for their projects. The reported estimates of the MiC market potential should also help the Government to better formulate and implement the MiC promotion policy and support the strategic planning of the industry for establishing MiC supply chains for Hong Kong.
v
Acknowledgements This report was made possible by the funding support from the Construction Industry Council (CIC). Its contents are solely the responsibility of the Project Team and do not necessarily represent the official views of CIC. The Project Team would like to express their sincere gratitude for the collaboration with, and support from, the many organisations and individuals who contributed their time, knowledge and access to information to this project. The market report could not have been completed without their collaboration and support for the Project Team to conduct various study activities. The Project Team appreciate the collaboration with, and support from, all of the organisations and individuals throughout this study, but remain responsible for the results and any mistakes in the report.
vi
Contents
Executive Summary ................................................................................................................ ii Acknowledgements .................................................................................................................. v Contents ................................................................................................................................... vi List of Tables ......................................................................................................................... viii List of Figures ......................................................................................................................... ix 1. Introduction ...................................................................................................................... 1
1.1. Background ............................................................................................................................. 1 1.2. Research objectives ................................................................................................................. 1 1.3. Project team ............................................................................................................................. 2 1.4. Structure of the report .............................................................................................................. 2
2. Methodology ..................................................................................................................... 4 2.1. Building sector analysis ........................................................................................................... 4 2.2. Market questionnaire survey ................................................................................................... 5 2.3. Market scenario analysis ......................................................................................................... 7 2.4. Research validation ................................................................................................................. 9
3. Building Sector Analysis ................................................................................................ 10 3.1. Public residential housing ..................................................................................................... 10
3.1.1. Current development .................................................................................................. 10 3.1.2. Typical floor plan modularisation ............................................................................. 10 3.1.3. Future development .................................................................................................... 11
3.2. Private residential buildings .................................................................................................. 12 3.2.1. Current development .................................................................................................. 12 3.2.2. Typical floor plan modularisation ............................................................................. 14 3.2.3. Future development .................................................................................................... 15
3.3. Hotel ...................................................................................................................................... 16 3.3.1. Current development .................................................................................................. 16 3.3.2. Typical floor plan modularisation ............................................................................. 16 3.3.3. Future development .................................................................................................... 16
3.4. Student hostel and staff quarter ............................................................................................. 18 3.4.1. Current development .................................................................................................. 18 3.4.2. Typical floor plan modularisation ............................................................................. 18 3.4.3. Future development .................................................................................................... 19
3.5. Hospital ................................................................................................................................. 22 3.5.1. Current development .................................................................................................. 22 3.5.2. Typical floor plan modularisation ............................................................................. 22 3.5.3. Future development .................................................................................................... 22
3.6. Transitional housing and quarantine centres ......................................................................... 22 3.6.1. Current development .................................................................................................. 22 3.6.2. Typical floor plan modularisation ............................................................................. 23 3.6.3. Future development .................................................................................................... 24
4. Results and Analysis of Market Questionnaire Survey .............................................. 25 4.1. Profile of survey participants ................................................................................................ 25 4.2. Market acceptance of MiC .................................................................................................... 28 4.3. Drivers, constraints and mitigation strategies about adopting MiC ...................................... 30
vii
4.3.1. Drivers .......................................................................................................................... 30 4.3.2. Constraints ................................................................................................................... 33 4.3.3. Strategies ...................................................................................................................... 36
5. MiC Market Scenario Analysis ..................................................................................... 40 5.1. Key influencing factors of market demand for MiC ............................................................. 40 5.2. MiC market demand analysis ................................................................................................ 41
5.2.1. Public housing .............................................................................................................. 41 5.2.2. Private residential buildings ....................................................................................... 42 5.2.3. Hotel .............................................................................................................................. 42 5.2.4. Student hostel and staff quarter ................................................................................. 43 5.2.5. Hospital......................................................................................................................... 43 5.2.6. Transitional housing and quarantine centres ........................................................... 44
5.3. Scenario development ........................................................................................................... 44 5.4. MiC market estimation under scenarios ................................................................................ 46
5.4.1. Public housing .............................................................................................................. 46 5.4.2. Private residential ........................................................................................................ 47 5.4.3. Hotel .............................................................................................................................. 48 5.4.4. Student hostel and staff quarter ................................................................................. 49 5.4.5. Hospital......................................................................................................................... 50 5.4.6. Summary ...................................................................................................................... 51
6. Discussion and recommendations ................................................................................. 54 7. Conclusions ..................................................................................................................... 57 References .............................................................................................................................. 60 Appendix I: Market demand estimation formulas and variables..................................... 62
viii
List of Tables Table 1-1 Project team ............................................................................................................... 2 Table 3-1 List of proposed student hostel projects under Hostel Development Fund (HDF) . 20 Table 3-2 List of YHS projects under planning/construction .................................................. 21 Table 4-1 Respondents’ views on the suitability of MiC to different building types .............. 28 Table 4-2 Respondents’ views on the suitability of MiC to different building types .............. 30 Table 4-3 Respondents’ views on the drivers for promoting MiC in Hong Kong ................... 31 Table 4-4 Respondents’ views on the constraints for promoting MiC in Hong Kong ............. 34 Table 4-5 Respondents’ views on the strategies for promoting MiC in Hong Kong ............... 37 Table 5-1 Total public housing units supply baseline in the next 10 years (2020-2029) ........ 41 Table 5-2 Total private housing units supply in the next 10 years (2020-2029) ..................... 42 Table 5-3 Total hotel units supply in the next 10 years (2020-2029) ...................................... 43 Table 5-4 Total hostel units supply in the next 10 year (2020-2029) ...................................... 43 Table 5-5 MiC market demand baseline in the hospital sector ................................................ 44 Table 5-6 MiC market demand of transitional housing and quarantine centres ...................... 44 Table 5-7 Projected MiC demand by different building sectors in 1-, 3-, 5-, and 10-year time frames under less and more aggressive scenarios .................................................................... 46 Table 5-8 Summary of MiC market estimation under less- and more- aggressive scenarios .. 51
ix
List of Figures Figure 2-1 Outline of the research process ................................................................................ 4 Figure 2-2 The diffusion of innovations according to Rogers (2010) ....................................... 7 Figure 3-1 Applications for public residential housing as of March 2019 .............................. 10 Figure 3-2 CFAs of typical flat types of public residential buildings ..................................... 11 Figure 3-3 Modularisation of typical unit types of public residential buildings ..................... 11 Figure 3-4 High-rise private residential buildings by number of storeys (n=12,730) ............. 12 Figure 3-5 Distribution of the number of units per floor in high-rise private residential buildings in Hong Kong (n=12,730) ........................................................................................................ 12 Figure 3-6 Completions of private residential units by Classes (1985-2019); data retrieved from the Rating and Valuation Department’ statistics ....................................................................... 13 Figure 3-7 Completions of private residential units by Classes (up to July 31 2019)............. 13 Figure 3-8 Class A units: typical studio (left) and one-bedroom (right) unit plan (Qin 2015) 14 Figure 3-9 Class B units: Typical two to three-bedroom unit plan (Qin 2015) ....................... 14 Figure 3-10 Modularisation of a typical studio (left) and one-bedroom (right) unit plan ....... 15 Figure 3-11 Modularisation of typical two to three-bedroom unit floor plans ........................ 15 Figure 3-12 Distribution of the number of rooms provided by hotels in Hong Kong ............. 16 Figure 3-13 Number of hotels in Hong Kong by type since 2000 .......................................... 17 Figure 3-14 Number of hotel rooms in Hong Kong by type since 2000 ................................. 17 Figure 3-15 Number of existing and approved staff quarters in Hong Kong by year ............. 18 Figure 3-16 Modularisation of the floor layout of a reference student hostel ......................... 19 Figure 3-17 Modularisation of the floor layout of a reference staff quarter............................ 19 Figure 3-18 Modularisation of the floor layout of transitional housing ................................. 23 Figure 4-1 Stakeholders groups of questionnaire survey participants ..................................... 25 Figure 4-2 Specialities of questionnaire survey participants (n=326) ..................................... 25 Figure 4-3 Primary building sectors of questionnaire survey participants (n=326) ............... 26 Figure 4-4 The most familiar business models by questionnaire survey participants (n=319) .................................................................................................................................................. 26 Figure 4-5 Profile of survey respondents by working experience in construction and prefabrication (n=326).............................................................................................................. 27 Figure 4-6 Profile of all effective survey respondents by the level of knowledge (left) and project experience (right) in MiC (n=326) ............................................................................... 27 Figure 4-7 Rankings of the suitability of MiC to different building types (by all effective respondents, n=279) ................................................................................................................. 28 Figure 4-8 Respondents’ ranking of preferred MiC systems for real-life projects (n=279) .... 29 Figure 4-9 Perceived significance level of six-fold drivers for MiC adoption in Hong Kong 30 Figure 4-10 Top five significant drivers for promoting MiC in Hong Kong (n=279)............. 31 Figure 4-11 Perceived significance level of drivers for MiC adoption in Hong Kong (N= 279) .................................................................................................................................................. 33 Figure 4-12 Perceived significance level of five-fold constraints for MiC adoption in Hong Kong ......................................................................................................................................... 33 Figure 4-13 Top five significant constraints for promoting MiC in Hong Kong (n=279) ...... 34 Figure 4-14 Perceived significance level of constraints for MiC adoption by different

x
stakeholders (N= 279) .............................................................................................................. 36 Figure 4-15 Top five significant strategies for promoting MiC in Hong Kong (n=279) ........ 37 Figure 4-16 Perceived significance level of strategies for MiC adoption by different stakeholders (n= 279) ............................................................................................................... 38 Figure 5-1 Estimation of the ratios of different public housing units ..................................... 41 Figure 5-2 MiC market demand estimation for the public housing sector .............................. 47 Figure 5-3 MiC market demand estimation for the private residential sector ......................... 48 Figure 5-4 MiC market demand estimation for the hospital sector ......................................... 49 Figure 5-5 MiC market demand estimation for the student hostel and staff quarter sector .... 50 Figure 5-6 MiC market demand estimation for the hospital sector ......................................... 51
1
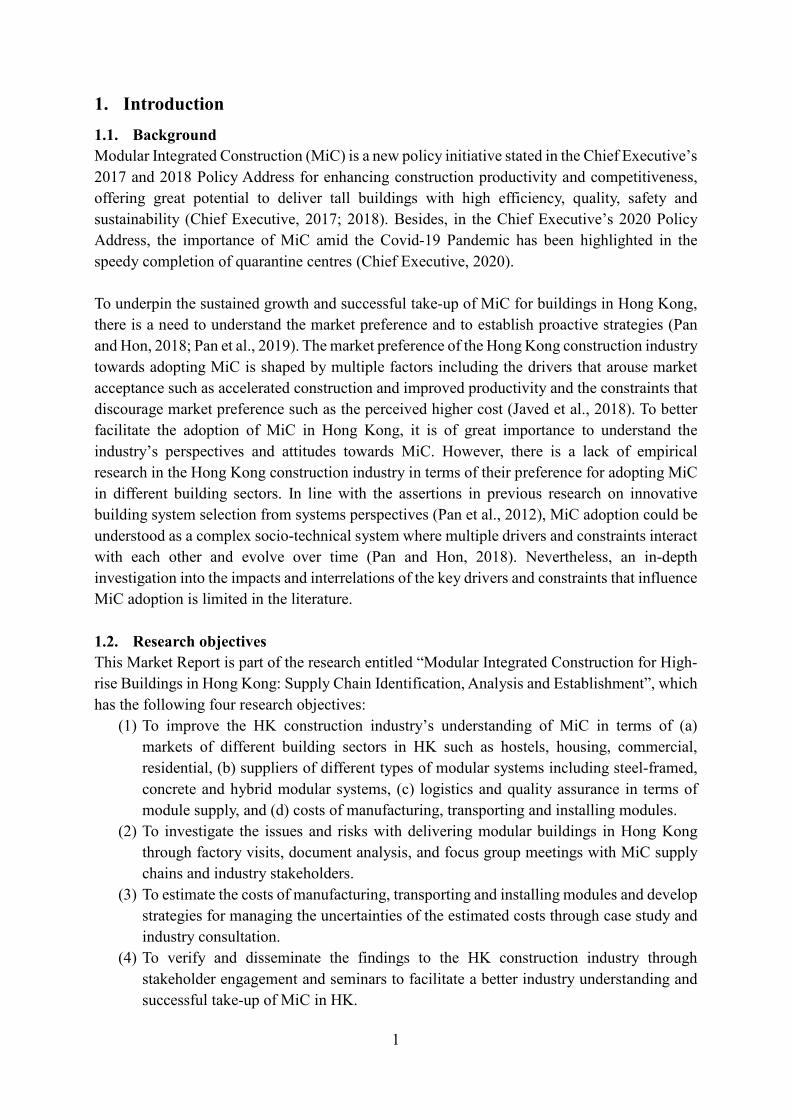
1. Introduction 1.1. Background Modular Integrated Construction (MiC) is a new policy initiative stated in the Chief Executive’s 2017 and 2018 Policy Address for enhancing construction productivity and competitiveness, offering great potential to deliver tall buildings with high efficiency, quality, safety and sustainability (Chief Executive, 2017; 2018). Besides, in the Chief Executive’s 2020 Policy Address, the importance of MiC amid the Covid-19 Pandemic has been highlighted in the speedy completion of quarantine centres (Chief Executive, 2020). To underpin the sustained growth and successful take-up of MiC for buildings in Hong Kong, there is a need to understand the market preference and to establish proactive strategies (Pan and Hon, 2018; Pan et al., 2019). The market preference of the Hong Kong construction industry towards adopting MiC is shaped by multiple factors including the drivers that arouse market acceptance such as accelerated construction and improved productivity and the constraints that discourage market preference such as the perceived higher cost (Javed et al., 2018). To better facilitate the adoption of MiC in Hong Kong, it is of great importance to understand the industry’s perspectives and attitudes towards MiC. However, there is a lack of empirical research in the Hong Kong construction industry in terms of their preference for adopting MiC in different building sectors. In line with the assertions in previous research on innovative building system selection from systems perspectives (Pan et al., 2012), MiC adoption could be understood as a complex socio-technical system where multiple drivers and constraints interact with each other and evolve over time (Pan and Hon, 2018). Nevertheless, an in-depth investigation into the impacts and interrelations of the key drivers and constraints that influence MiC adoption is limited in the literature. 1.2. Research objectives This Market Report is part of the research entitled “Modular Integrated Construction for High-rise Buildings in Hong Kong: Supply Chain Identification, Analysis and Establishment”, which has the following four research objectives:
(1) To improve the HK construction industry’s understanding of MiC in terms of (a) markets of different building sectors in HK such as hostels, housing, commercial, residential, (b) suppliers of different types of modular systems including steel-framed, concrete and hybrid modular systems, (c) logistics and quality assurance in terms of module supply, and (d) costs of manufacturing, transporting and installing modules.
(2) To investigate the issues and risks with delivering modular buildings in Hong Kong through factory visits, document analysis, and focus group meetings with MiC supply chains and industry stakeholders.
(3) To estimate the costs of manufacturing, transporting and installing modules and develop strategies for managing the uncertainties of the estimated costs through case study and industry consultation.
(4) To verify and disseminate the findings to the HK construction industry through stakeholder engagement and seminars to facilitate a better industry understanding and successful take-up of MiC in HK.
2
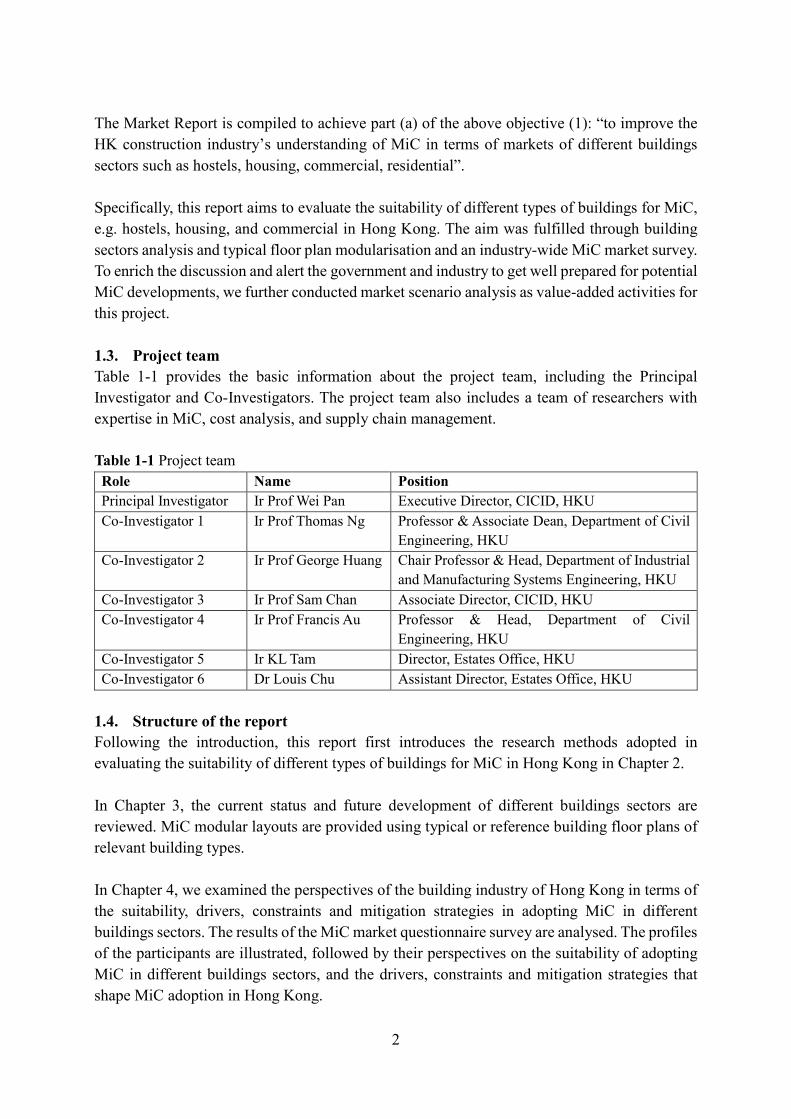
The Market Report is compiled to achieve part (a) of the above objective (1): “to improve the HK construction industry’s understanding of MiC in terms of markets of different buildings sectors such as hostels, housing, commercial, residential”. Specifically, this report aims to evaluate the suitability of different types of buildings for MiC, e.g. hostels, housing, and commercial in Hong Kong. The aim was fulfilled through building sectors analysis and typical floor plan modularisation and an industry-wide MiC market survey. To enrich the discussion and alert the government and industry to get well prepared for potential MiC developments, we further conducted market scenario analysis as value-added activities for this project. 1.3. Project team Table 1-1 provides the basic information about the project team, including the Principal Investigator and Co-Investigators. The project team also includes a team of researchers with expertise in MiC, cost analysis, and supply chain management. Table 1-1 Project team Role Name Position Principal Investigator Ir Prof Wei Pan Executive Director, CICID, HKU Co-Investigator 1 Ir Prof Thomas Ng Professor & Associate Dean, Department of Civil
Engineering, HKU Co-Investigator 2 Ir Prof George Huang Chair Professor & Head, Department of Industrial
and Manufacturing Systems Engineering, HKU Co-Investigator 3 Ir Prof Sam Chan Associate Director, CICID, HKU Co-Investigator 4 Ir Prof Francis Au Professor & Head, Department of Civil
Engineering, HKU Co-Investigator 5 Ir KL Tam Director, Estates Office, HKU Co-Investigator 6 Dr Louis Chu Assistant Director, Estates Office, HKU
1.4. Structure of the report Following the introduction, this report first introduces the research methods adopted in evaluating the suitability of different types of buildings for MiC in Hong Kong in Chapter 2. In Chapter 3, the current status and future development of different buildings sectors are reviewed. MiC modular layouts are provided using typical or reference building floor plans of relevant building types. In Chapter 4, we examined the perspectives of the building industry of Hong Kong in terms of the suitability, drivers, constraints and mitigation strategies in adopting MiC in different buildings sectors. The results of the MiC market questionnaire survey are analysed. The profiles of the participants are illustrated, followed by their perspectives on the suitability of adopting MiC in different buildings sectors, and the drivers, constraints and mitigation strategies that shape MiC adoption in Hong Kong.

3
In Chapter 5, we estimated the prospective short-term and long-term demand of MiC in Hong Kong in different buildings sectors, including private residential, public housing, hotel, student hostel, staff quarter and hospital. The matrix of MiC market demand scenario is determined based on a set of conditions and assumptions. Sectoral specific and overall market demands for MiC in the 3-, 5- and 10-year frames are estimated using three indicators, i.e. quantity of residential units, quantity of modules and CFA, to provide a comprehensive understanding. In Chapter 6, we discussed the findings and provided recommendations for critical stakeholders on their strategic actions to promote MiC adoption in Hong Kong. The report finally draws its conclusions in Chapter 7.
4
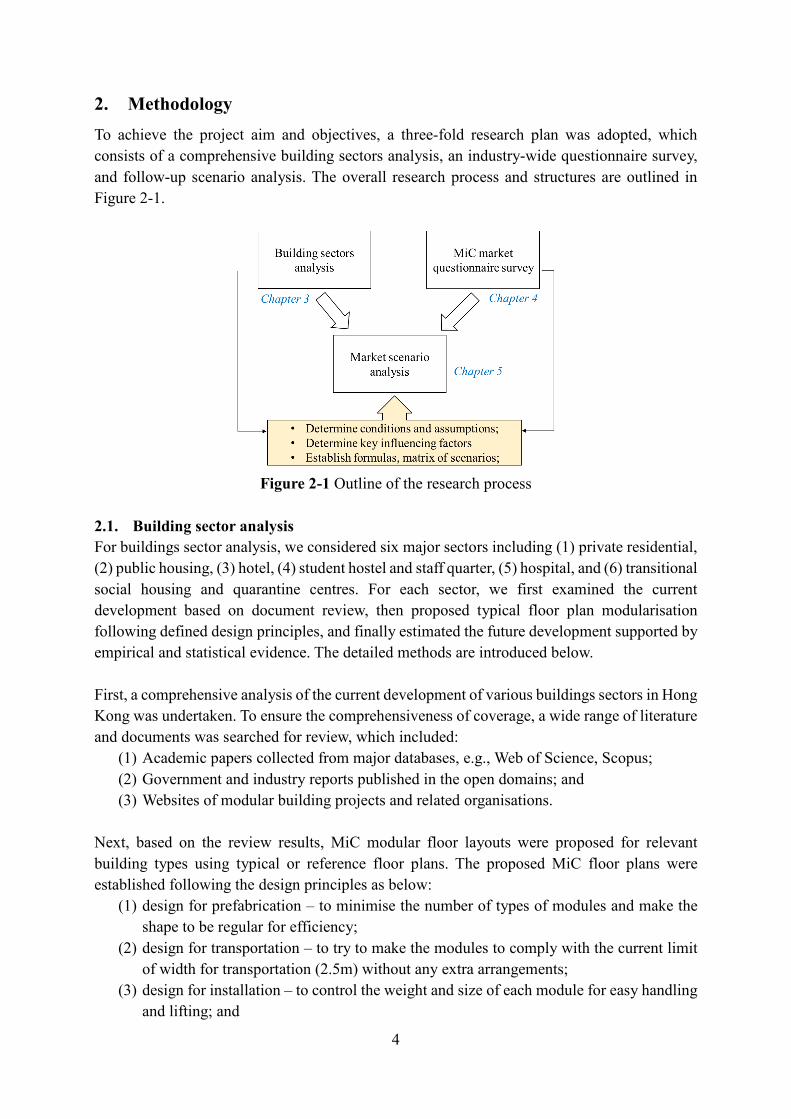
2. Methodology To achieve the project aim and objectives, a three-fold research plan was adopted, which consists of a comprehensive building sectors analysis, an industry-wide questionnaire survey, and follow-up scenario analysis. The overall research process and structures are outlined in Figure 2-1.
Figure 2-1 Outline of the research process
2.1. Building sector analysis For buildings sector analysis, we considered six major sectors including (1) private residential, (2) public housing, (3) hotel, (4) student hostel and staff quarter, (5) hospital, and (6) transitional social housing and quarantine centres. For each sector, we first examined the current development based on document review, then proposed typical floor plan modularisation following defined design principles, and finally estimated the future development supported by empirical and statistical evidence. The detailed methods are introduced below. First, a comprehensive analysis of the current development of various buildings sectors in Hong Kong was undertaken. To ensure the comprehensiveness of coverage, a wide range of literature and documents was searched for review, which included:
(1) Academic papers collected from major databases, e.g., Web of Science, Scopus; (2) Government and industry reports published in the open domains; and (3) Websites of modular building projects and related organisations.
Next, based on the review results, MiC modular floor layouts were proposed for relevant building types using typical or reference floor plans. The proposed MiC floor plans were established following the design principles as below:
(1) design for prefabrication – to minimise the number of types of modules and make the shape to be regular for efficiency;
(2) design for transportation – to try to make the modules to comply with the current limit of width for transportation (2.5m) without any extra arrangements;
(3) design for installation – to control the weight and size of each module for easy handling and lifting; and
5
(4) design for function – to ensure to meet the requirements for ventilation and lighting.
Where no typical or reference floor plan is available, assumptions were made. Then, the annual demand scales in each of the studied building sectors were estimated with the 1-, 3-, 5- and 10-year timeframe from the baseline year of 2019. 1-, 3- and 5-year estimates could support short-to-medium term decision-making (SHADAC, 2012), while mapping a 5-10 year trend is often used to inform long-term strategies (McKinsey, 2020). The estimation was conducted based on two methods as follows:
(1) by reviewing the latest long-term development plans proposed by relevant government departments or institutions; and
(2) by conducting linear regression using available statistical data. 2.2. Market questionnaire survey 2.2.1. Question design A questionnaire survey was conducted to explore the industry stakeholders’ perspectives of MiC adoption in the various building sectors, with regard to suitability, market preference, drivers, constraints and strategies. The questionnaire was designed to include the following three parts:
(1) Part 1 to collect the participants’ background information, in order to profile their specialities, working experience, knowledge and experience level in MiC.
(2) Part 2 to examine the suitability of MiC to different building sectors, and the preferences of the participants to different MiC systems.
(3) Part 3 to explore the participants’ perspectives of the drivers, constraints, and strategies that will shape MiC adoption in Hong Kong.
In Part 3 of the questionnaire survey, a five-point Likert scale was employed to assess the participants’ perceptions. Space was provided in the questionnaire to allow the provision of any additional comments in relation to the questions. The questionnaire was verified through a pilot study with relevant academics and researchers before being sent to the targeted participants. 2.2.2. Participants sampling The questionnaire survey participants were selected through a process of classification, identification and selection. The participants were first classified using two-stage stratified sampling (Pan and Pan, 2019) in order to obtain a representative sample of the population in relation to the adoption of MiC in Hong Kong. In doing so, stakeholders and professionals were targeted from five key stakeholder groups.
(1) Government/clients, including government agencies (e.g. the Buildings Department), public sector clients (e.g. the Housing Authority), private sector clients and developers (critical to market uptake of MiC);
(2) Consultants, including architects, structural engineers, electrical and mechanical engineers, quantity surveyors (critical to MiC design and innovation);
(3) Contractors, including main contractors and specialist contractors (critical to the delivery of MiC projects);
(4) Suppliers and manufacturers, including general suppliers, precast suppliers and MiC
6
suppliers (critical to module manufacturing and supply); and (5) Institutions, including professional institutions (e.g. Hong Kong Institution of
Engineers), and educational institutions (critical to professional development and training).
Next, potential participants were identified under the key stakeholder groups, using the databases available in the public domains and the databases developed by the researchers and its affiliated organisations (Pan and Pan, 2019). Examples of the public databases used include: the list of directors and committee members of the Real Estate Developer Association of Hong Kong (REDA, 2016) for clients and developers; the list of approved contractors for buildings by the Development Bureau (DEVB, 2020) for contractors; the list of approved MiC systems and suppliers by the Buildings Department (BD, 2020) for suppliers and manufacturers; the directories by the Hong Kong Institute of Surveyors (HKIS, 2020) for consultants; and the telephone directory by the Hong Kong Government for government participants. The last step was to randomly select survey participants from each stakeholder group to minimise bias in the sampling process. Consequently, this research had a sample of 1385 invited participants for the questionnaire survey. 2.2.3. Data collection and analysis The questionnaire survey was carried out over the period from May to June 2019. The questionnaire was distributed using the combination of an online version and an editable PDF file attached to emails, which ensured the most extensive reach to the industry and market of buildings in Hong Kong. The data collected were logged onto a Microsoft Excel Spreadsheet. The quantitative data were then converted using SPSS software for descriptive and statistical analysis. The participants were asked to rate the suitability of MiC to the identified building sectors, and the significance of the identified factors in drivers, constraints and success strategies using a five-point Likert scale with weighing from 1 to 5. Cronbach’s alpha coefficient (α) was applied to test the reliability of the questionnaire (Pan and Pan, 2019). The ranking of the suitability, drivers, constraints and strategies was based on the calculation of means. A higher mean was considered to be with a higher level of importance or significance. The standard deviation was calculated to illustrate the degree of difference among the respondents (i.e., 1 = very unsuitable/not significant, 2 = unsuitable/less significant, 3 = not sure/somewhat significant, 4 = suitable/significant, 5 = very suitable/very significant). The standard deviation of each factor was calculated to illustrate the degree of difference among the respondents. Considering the infancy nature of MiC in Hong Kong, we specifically examined the perspectives of MiC professionals and practitioners, and compared them with the perspectives of all effective respondents. In doing so, we considered three groups of respondents as follows:
(1) All effective respondents. (2) All respondents with good knowledge of MiC (3) All respondents with modular building project experience
We adopted the one-way analyses of variance (ANOVA) tests (Pan and Pan, 2020) to
7
statistically check the differences between the different groups of respondents. If the significance value is no greater than 0.05, the differences between some of the groups are statistically significant. To identify whose opinions were significantly different, Turkey Post Hoc tests (Kucuk et al., 2016) were adopted. For a more in-depth discussion, we further analysed the top five significant drivers, constraints and strategies, by comparing the perspectives of different stakeholder groups. 2.3. Market scenario analysis Scenario approaches are widely applied to predict and understand the potential outcomes of technological changes such as directions, rate, characteristics, and impacts, incorporating the uncertainties of complex long-term development for investment and policy strategising (Gausemeier et al., 1998). In this research, a scenario is defined as a plausible combination of alternative developments in critical dimensions (Pan et al., 2020). The inherent benefit of the scenario approach is the consideration of a range of possible future alternatives, thereby allowing stakeholders and practitioners to have alternative views of the future to properly define the requirements and reduce the risks of making the wrong decisions (Pan et al., 2020; Yang and Pan, 2020). This is preferable for this study, which could provide better awareness of the potential market demand for MiC in the various building sectors, thereby alerting the government and industry to get well prepared for potential MiC developments. Specifically, the scenario analysis was used to estimate the market demand for MiC in six key building sectors (i.e., private residential, public housing, hotel, student hostel, staff quarter, hospital, and special sectors), within a time window of 10 years (2020 - 2029) from the baseline year of 2019 (i.e. 2019 as year 0).
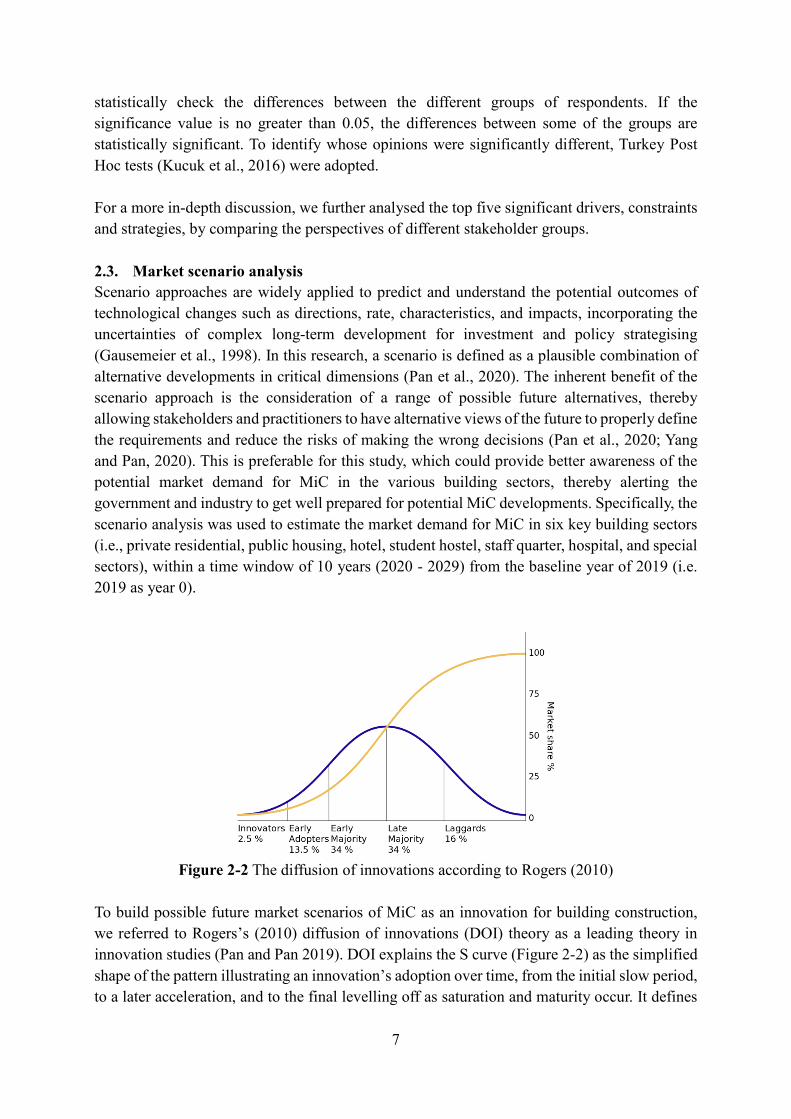
Figure 2-2 The diffusion of innovations according to Rogers (2010)
To build possible future market scenarios of MiC as an innovation for building construction, we referred to Rogers’s (2010) diffusion of innovations (DOI) theory as a leading theory in innovation studies (Pan and Pan 2019). DOI explains the S curve (Figure 2-2) as the simplified shape of the pattern illustrating an innovation’s adoption over time, from the initial slow period, to a later acceleration, and to the final levelling off as saturation and maturity occur. It defines
8
different stages of the diffusion process with an adopter category, including innovators, early adopters, early majority adopters, late majority adopters and laggards (Rogers, 2010). At any point, there may be a step-change in the technology – a radical innovation – resulting in a new S-curve. The S-curve can also be used to depict the diffusion of innovations in a culture over time. Based on DOI, we can analyse possible scenarios of MiC for different building sectors by considering the different rate of adoption, with learning from historical data and international counterparts. 2.3.1. Scenario preparation and creation In the scenario preparation and creation stage, we developed scenarios based on the following general considerations:
(1) Quantity of units: the quantity of units was defined to meet the future market demands of different building sectors in the 1-, 3-, 5- and 10-year time frames, drawing on the comprehensive literature review and desk analysis reported in Chapter 3 of the market report. The term ‘market demand’ in this research refers to the MiC demand of the projects to be committed within the time frame of concerns. The term ‘adoption rate’ refers to the ratio between the market demand for MiC and the overall market demand.
(2) Percentage and quantity of units using MiC: the percentage of units constructed by MiC was determined by blending the findings of the MiC market questionnaire survey with the anecdotal experience of industry stakeholders as well as the professional judgements of the research team, considering the S curve in the DOI (Rogers,2010). Quantity of units using MiC was calculated based on the quantity of units and percentage.
(3) CFA constructed by MiC (m2) and quantity of modules: the typical floor plan modularisation proposed in each of the six building sectors is adopted to define CFA and Quantity of modules. In particular, CFA constructed by MiC is calculated using estimated areas of modules, rather than the CFA of the building.
(4) All predictions of MiC demand cover projects under planning, design, procurement and delivery.
(5) Based on the assumption (1) to (4) above, two formulas were developed (Appendix I) to define the pertinent variables for the predictions of MiC demand.
(6) The MiC market scenario analysis has gone beyond the level of details scoped in the research plan in order to provide the industry with a reference point for the future demand for MiC in Hong Kong. The analysis should be validated or further explored with input from relevant government and industry sources in a future effort of study.
Based on the above considerations, a matrix of scenarios was developed to provide the basis for scenario analysis. The matrix of scenarios considers a group of key factors influencing the MiC adoption, which lead to less aggressive and more aggressive cases for each examined building sector. Key influencing factors were identified from the literature review, findings of the MiC market questionnaire survey, and expert consultation. The market demands for MiC in each building sector were calculated, using two formulas provided in Appendix I, the pertinent variables derived from building sectors analysis, and the developed matrix of scenarios.
9
2.3.2. Scenario transfer In the scenario transfer stage, we further identified contextual opportunities and challenges to generate strategic recommendations for different stakeholders and building sectors under each scenario. 2.4. Research validation The Market Analysis Report has gone through an intensive process of discussing with and commenting by CIC. In doing so, a number of meetings between CIC and HKU have been conducted, which enabled in-depth discussion on the contents of and issues addressed in the Market Analysis Report. These consultation meetings mainly included the following agenda items:
(1) Briefing by the project team on the project progress, and main findings for the market analysis.
(2) Discussion on the contents of the Market Analysis Report and its implications for MiC stakeholders and practitioners.
(3) Discussion on the recommendations for improving the Market Analysis Report for better practicability and usefulness.
(4) Debriefing and summary session. The Market Analysis Report has also been presented and circulated to relevant government departments and industry organisations for views and input, including the Joint Working Group on MiC, relevant Departments of the HKSAR government and parties (e.g., Architectural Services Department, Buildings Department, and Housing Authority), and CIC Committee on Productivity. Their comments have been addressed and integrated into the revised Market Analysis Report.
10
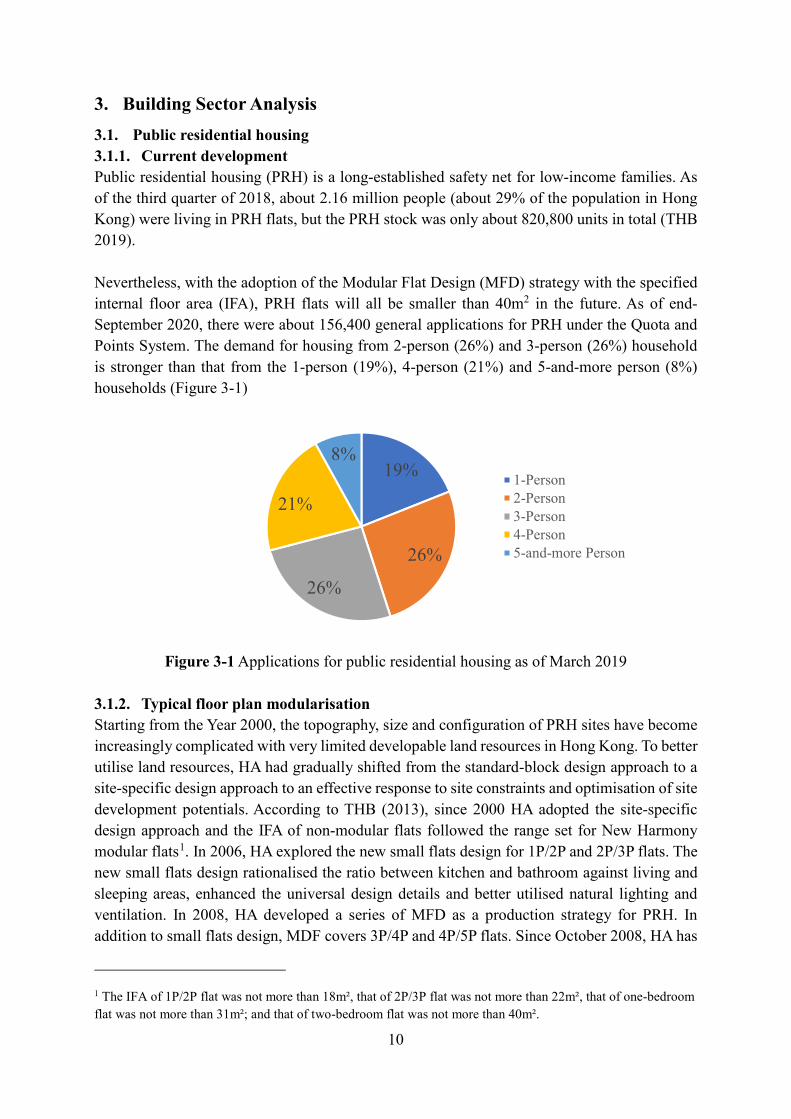
3. Building Sector Analysis 3.1. Public residential housing 3.1.1. Current development Public residential housing (PRH) is a long-established safety net for low-income families. As of the third quarter of 2018, about 2.16 million people (about 29% of the population in Hong Kong) were living in PRH flats, but the PRH stock was only about 820,800 units in total (THB 2019). Nevertheless, with the adoption of the Modular Flat Design (MFD) strategy with the specified internal floor area (IFA), PRH flats will all be smaller than 40m2 in the future. As of end-September 2020, there were about 156,400 general applications for PRH under the Quota and Points System. The demand for housing from 2-person (26%) and 3-person (26%) household is stronger than that from the 1-person (19%), 4-person (21%) and 5-and-more person (8%) households (Figure 3-1)
Figure 3-1 Applications for public residential housing as of March 2019
3.1.2. Typical floor plan modularisation Starting from the Year 2000, the topography, size and configuration of PRH sites have become increasingly complicated with very limited developable land resources in Hong Kong. To better utilise land resources, HA had gradually shifted from the standard-block design approach to a site-specific design approach to an effective response to site constraints and optimisation of site development potentials. According to THB (2013), since 2000 HA adopted the site-specific design approach and the IFA of non-modular flats followed the range set for New Harmony modular flats1. In 2006, HA explored the new small flats design for 1P/2P and 2P/3P flats. The new small flats design rationalised the ratio between kitchen and bathroom against living and sleeping areas, enhanced the universal design details and better utilised natural lighting and ventilation. In 2008, HA developed a series of MFD as a production strategy for PRH. In addition to small flats design, MDF covers 3P/4P and 4P/5P flats. Since October 2008, HA has
1 The IFA of 1P/2P flat was not more than 18m², that of 2P/3P flat was not more than 22m², that of one-bedroom flat was not more than 31m²; and that of two-bedroom flat was not more than 40m².
19%
26%
26%
21%
8%1-Person2-Person3-Person4-Person5-and-more Person

11
applied MFD to all domestic blocks in public housing developments. There are currently four types of MFD, including 1P/2P flat with an IFA of 14.1 to 14.5m2 (average 14.3 m2), 2P/3P flat with an IFA of 21.4 to 22.0m2 (average 21.7 m2), 3P/4P flat with an FIA of 30.2 to 31.0m2
(average 30.6 m2), and 4P/5P flat with an IFA of 35.0 to 36.1m2 (average 35.6 m2)(Figure 3-2).
Figure 3-2 CFAs of typical flat types of public residential buildings2
The modularisation of each flat type (illustrated in Figure 3.3) reveals that: (1) Each flat is divided into 2 to 4 modules and there are mainly 6 types of modules. (2) Some of the proposed modules are 5-sided concrete modules (6-sided for those wet areas
engaging kitchens and bathrooms). The 5-sided modules are of “n-shape” with ceiling but no floor slab. The 5-sided modules could also be of “U-shape” with floor slab but no ceiling (with a temporary ceiling for protection and transportation purposes).
(3) The width of all the modules is controlled within 2.45m, which complies with the current transportation regulation.
Figure 3-3 Modularisation of typical unit types of public residential buildings3
3.1.3. Future development The Long Term Housing Strategy Annual Progress Report (THB, 2020) indicated that 70% of housing units would be allocated to public housing development on the Government’s newly developed land. This Annual Progress Report further set out the supply target of 301,000 new public housing units for the ten-year period from 2021 to 2031, taking into account the units provided by the Hong Kong Housing Authority (HA) and the Hong Kong Housing Society (HS). 2 Figure source: Legislative Council Panel on Housing Design of the New Public Housing Flats by the Hong Kong Housing Authority (Ref. CB(1)1037/14-15(01)) 3 Figure source: https://www.legco.gov.hk/yr12-13/english/panels/hg/papers/hg0702cb1-1391-1-e.pdf
12
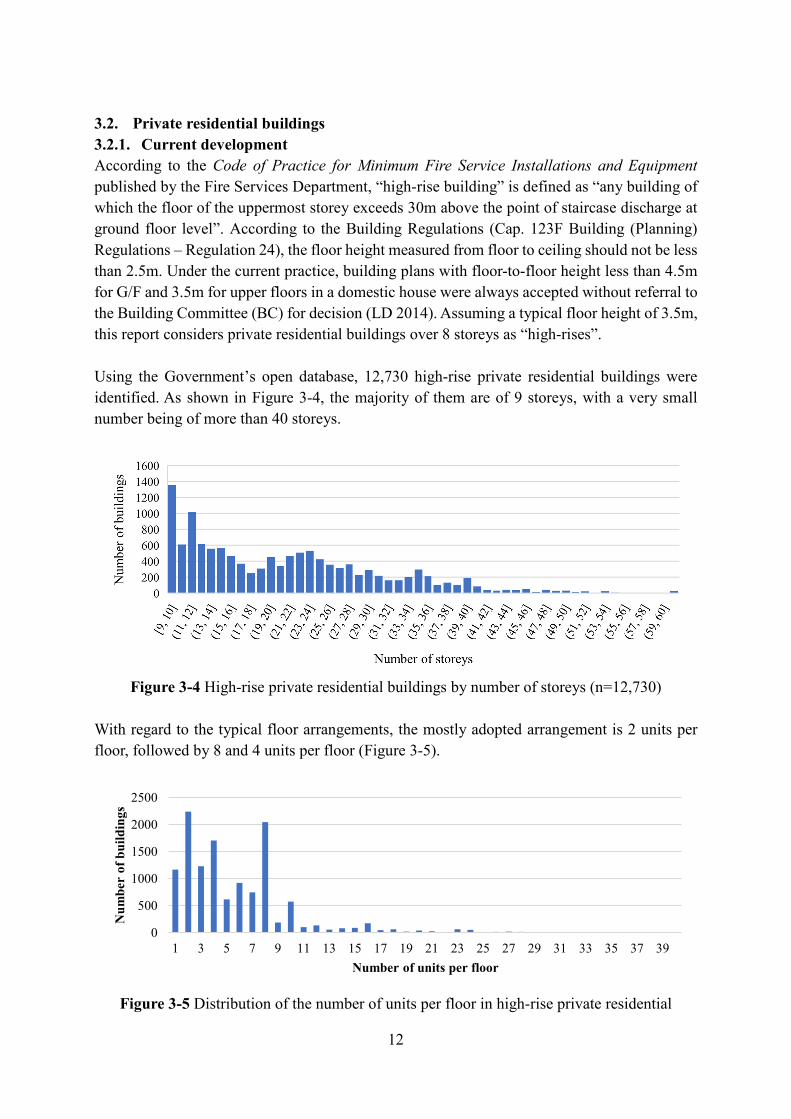
3.2. Private residential buildings 3.2.1. Current development According to the Code of Practice for Minimum Fire Service Installations and Equipment published by the Fire Services Department, “high-rise building” is defined as “any building of which the floor of the uppermost storey exceeds 30m above the point of staircase discharge at ground floor level”. According to the Building Regulations (Cap. 123F Building (Planning) Regulations – Regulation 24), the floor height measured from floor to ceiling should not be less than 2.5m. Under the current practice, building plans with floor-to-floor height less than 4.5m for G/F and 3.5m for upper floors in a domestic house were always accepted without referral to the Building Committee (BC) for decision (LD 2014). Assuming a typical floor height of 3.5m, this report considers private residential buildings over 8 storeys as “high-rises”. Using the Government’s open database, 12,730 high-rise private residential buildings were identified. As shown in Figure 3-4, the majority of them are of 9 storeys, with a very small number being of more than 40 storeys.
Figure 3-4 High-rise private residential buildings by number of storeys (n=12,730)
With regard to the typical floor arrangements, the mostly adopted arrangement is 2 units per floor, followed by 8 and 4 units per floor (Figure 3-5).
Figure 3-5 Distribution of the number of units per floor in high-rise private residential
0
500
1000
1500
2000
2500
1 3 5 7 9 11 13 15 17 19 21 23 25 27 29 31 33 35 37 39
Num
ber
of b
uild
ings
Number of units per floor
13
buildings in Hong Kong (n=12,730)
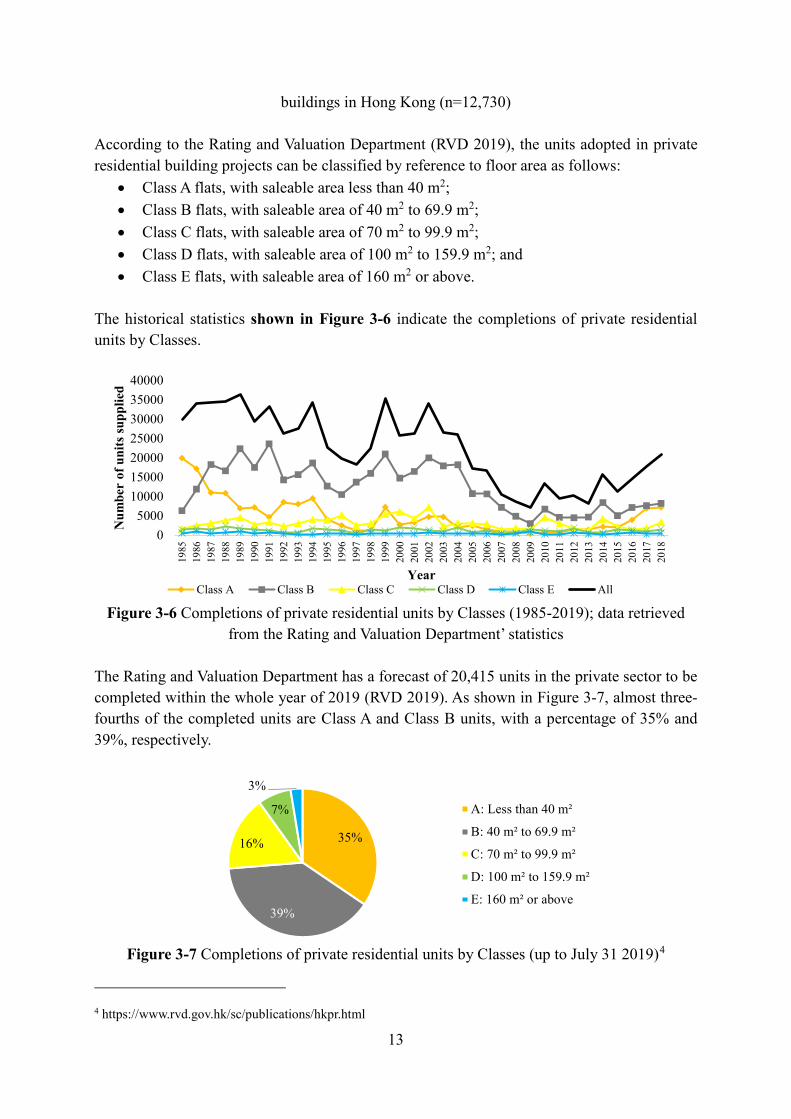
According to the Rating and Valuation Department (RVD 2019), the units adopted in private residential building projects can be classified by reference to floor area as follows:
• Class A flats, with saleable area less than 40 m2; • Class B flats, with saleable area of 40 m2 to 69.9 m2; • Class C flats, with saleable area of 70 m2 to 99.9 m2; • Class D flats, with saleable area of 100 m2 to 159.9 m2; and • Class E flats, with saleable area of 160 m2 or above.
The historical statistics shown in Figure 3-6 indicate the completions of private residential units by Classes.
Figure 3-6 Completions of private residential units by Classes (1985-2019); data retrieved
from the Rating and Valuation Department’ statistics The Rating and Valuation Department has a forecast of 20,415 units in the private sector to be completed within the whole year of 2019 (RVD 2019). As shown in Figure 3-7, almost three-fourths of the completed units are Class A and Class B units, with a percentage of 35% and 39%, respectively.
Figure 3-7 Completions of private residential units by Classes (up to July 31 2019)4
4 https://www.rvd.gov.hk/sc/publications/hkpr.html
05000
10000150002000025000300003500040000
1985
1986
1987
1988
1989
1990
1991
1992
1993
1994
1995
1996
1997
1998
1999
2000
2001
2002
2003
2004
2005
2006
2007
2008
2009
2010
2011
2012
2013
2014
2015
2016
2017
2018
Num
ber
of u
nits
supp
lied
YearClass A Class B Class C Class D Class E All
35%
39%
16%
7%
3%
A: Less than 40 m²
B: 40 m² to 69.9 m²
C: 70 m² to 99.9 m²
D: 100 m² to 159.9 m²
E: 160 m² or above
14
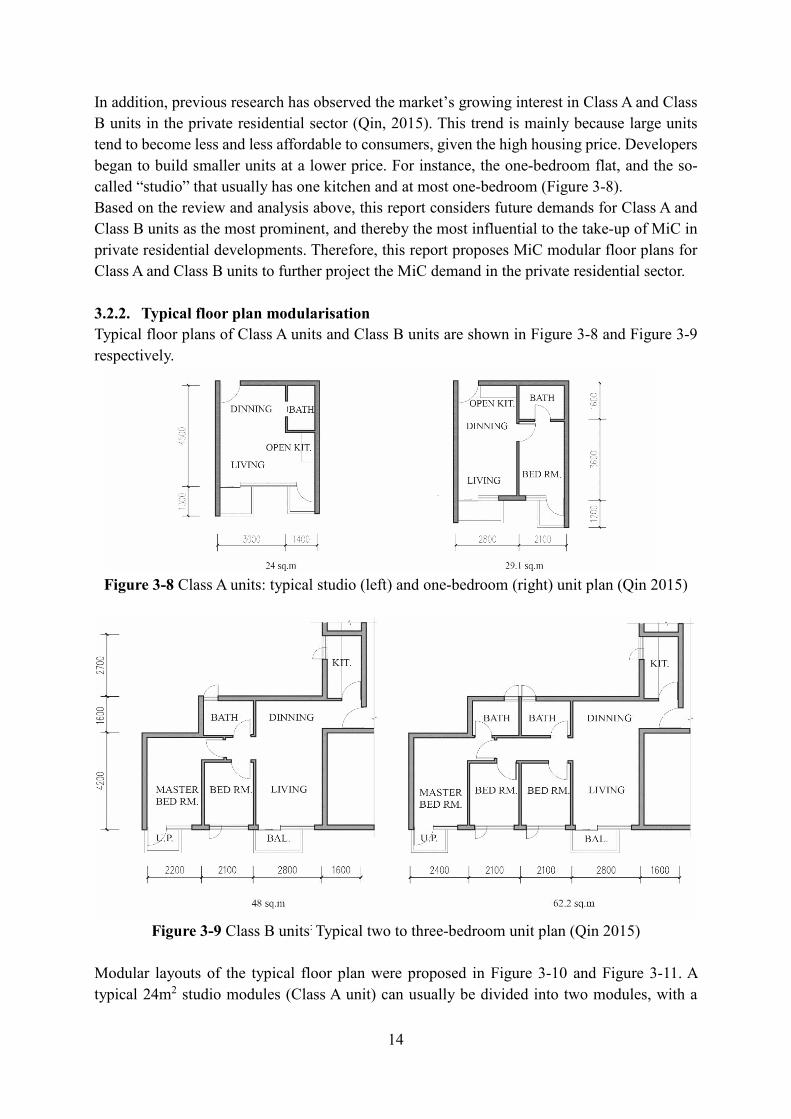
In addition, previous research has observed the market’s growing interest in Class A and Class B units in the private residential sector (Qin, 2015). This trend is mainly because large units tend to become less and less affordable to consumers, given the high housing price. Developers began to build smaller units at a lower price. For instance, the one-bedroom flat, and the so-called “studio” that usually has one kitchen and at most one-bedroom (Figure 3-8). Based on the review and analysis above, this report considers future demands for Class A and Class B units as the most prominent, and thereby the most influential to the take-up of MiC in private residential developments. Therefore, this report proposes MiC modular floor plans for Class A and Class B units to further project the MiC demand in the private residential sector. 3.2.2. Typical floor plan modularisation Typical floor plans of Class A units and Class B units are shown in Figure 3-8 and Figure 3-9 respectively.
Figure 3-8 Class A units: typical studio (left) and one-bedroom (right) unit plan (Qin 2015)
Figure 3-9 Class B units: Typical two to three-bedroom unit plan (Qin 2015)
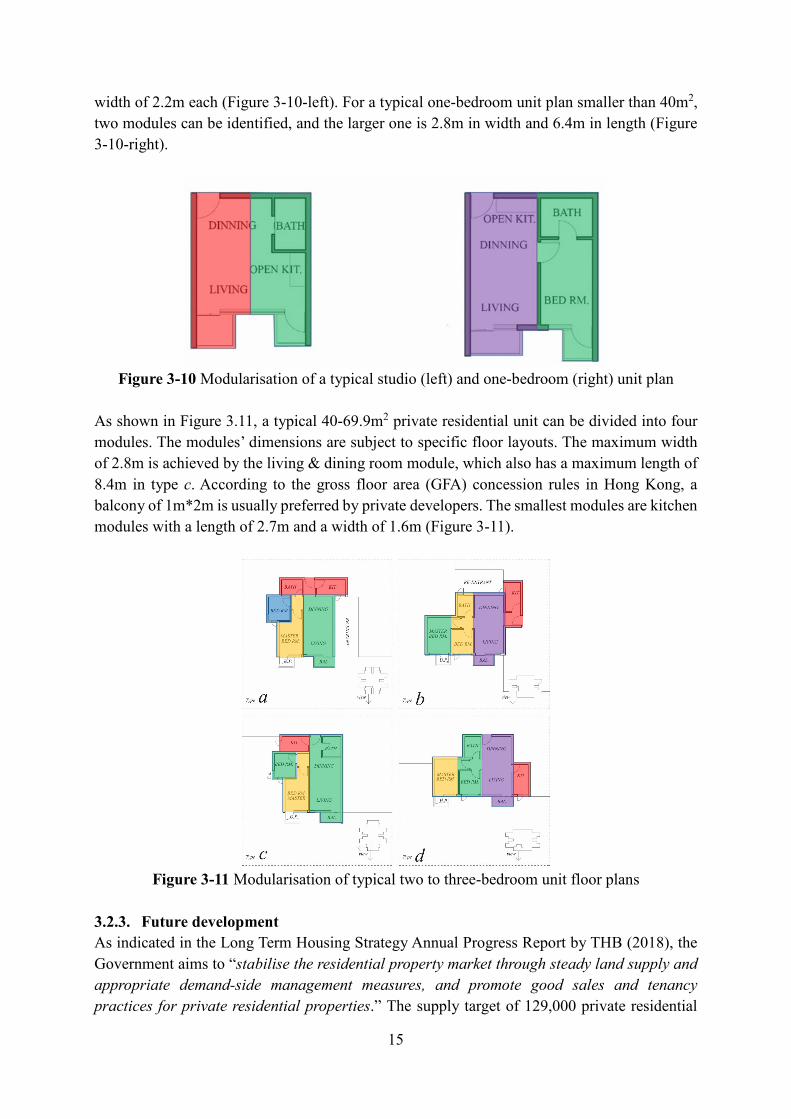
Modular layouts of the typical floor plan were proposed in Figure 3-10 and Figure 3-11. A typical 24m2 studio modules (Class A unit) can usually be divided into two modules, with a
15
width of 2.2m each (Figure 3-10-left). For a typical one-bedroom unit plan smaller than 40m2, two modules can be identified, and the larger one is 2.8m in width and 6.4m in length (Figure 3-10-right).
Figure 3-10 Modularisation of a typical studio (left) and one-bedroom (right) unit plan
As shown in Figure 3.11, a typical 40-69.9m2 private residential unit can be divided into four modules. The modules’ dimensions are subject to specific floor layouts. The maximum width of 2.8m is achieved by the living & dining room module, which also has a maximum length of 8.4m in type c. According to the gross floor area (GFA) concession rules in Hong Kong, a balcony of 1m*2m is usually preferred by private developers. The smallest modules are kitchen modules with a length of 2.7m and a width of 1.6m (Figure 3-11).
Figure 3-11 Modularisation of typical two to three-bedroom unit floor plans
3.2.3. Future development As indicated in the Long Term Housing Strategy Annual Progress Report by THB (2018), the Government aims to “stabilise the residential property market through steady land supply and appropriate demand-side management measures, and promote good sales and tenancy practices for private residential properties.” The supply target of 129,000 private residential
16
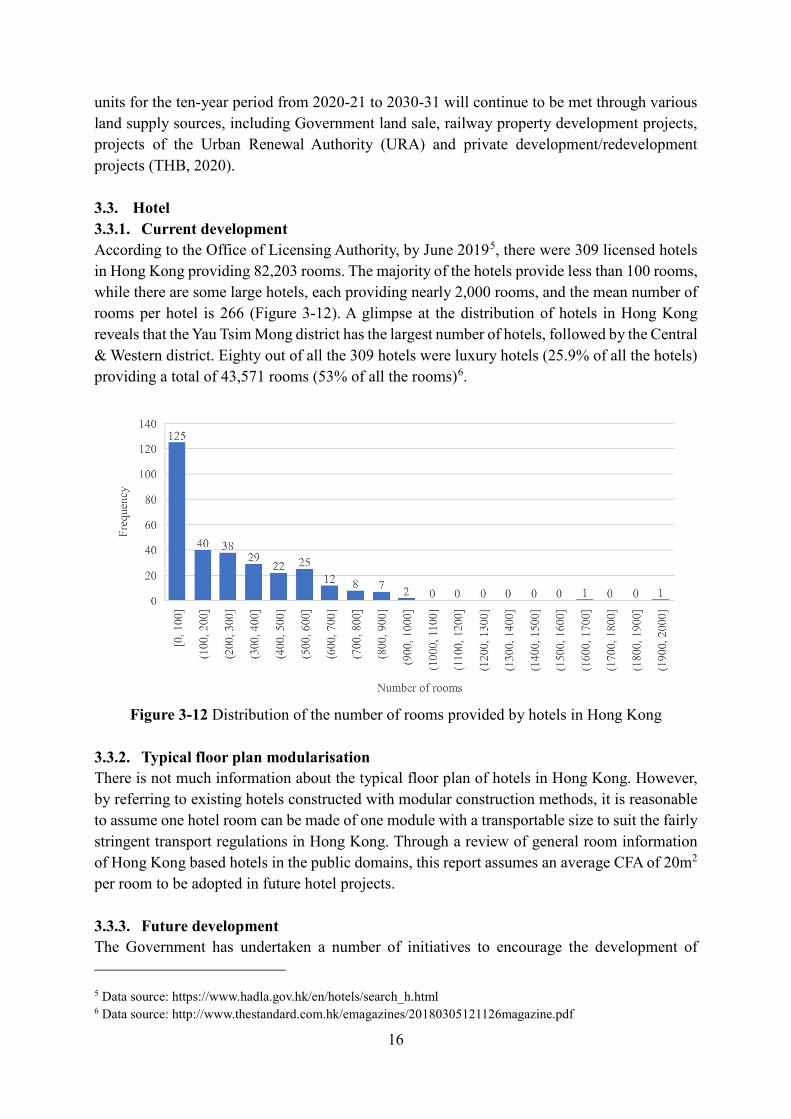
units for the ten-year period from 2020-21 to 2030-31 will continue to be met through various land supply sources, including Government land sale, railway property development projects, projects of the Urban Renewal Authority (URA) and private development/redevelopment projects (THB, 2020). 3.3. Hotel 3.3.1. Current development According to the Office of Licensing Authority, by June 20195, there were 309 licensed hotels in Hong Kong providing 82,203 rooms. The majority of the hotels provide less than 100 rooms, while there are some large hotels, each providing nearly 2,000 rooms, and the mean number of rooms per hotel is 266 (Figure 3-12). A glimpse at the distribution of hotels in Hong Kong reveals that the Yau Tsim Mong district has the largest number of hotels, followed by the Central & Western district. Eighty out of all the 309 hotels were luxury hotels (25.9% of all the hotels) providing a total of 43,571 rooms (53% of all the rooms)6.
Figure 3-12 Distribution of the number of rooms provided by hotels in Hong Kong
3.3.2. Typical floor plan modularisation There is not much information about the typical floor plan of hotels in Hong Kong. However, by referring to existing hotels constructed with modular construction methods, it is reasonable to assume one hotel room can be made of one module with a transportable size to suit the fairly stringent transport regulations in Hong Kong. Through a review of general room information of Hong Kong based hotels in the public domains, this report assumes an average CFA of 20m2 per room to be adopted in future hotel projects. 3.3.3. Future development The Government has undertaken a number of initiatives to encourage the development of 5 Data source: https://www.hadla.gov.hk/en/hotels/search_h.html 6 Data source: http://www.thestandard.com.hk/emagazines/20180305121126magazine.pdf
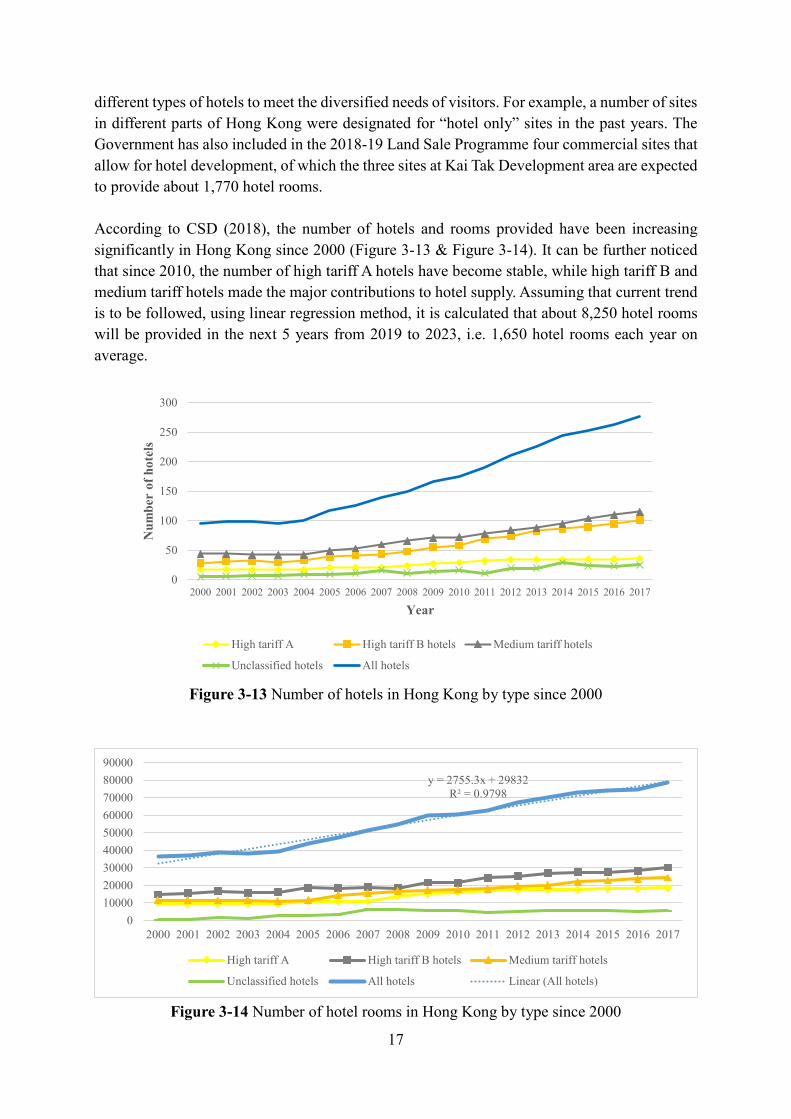
17
different types of hotels to meet the diversified needs of visitors. For example, a number of sites in different parts of Hong Kong were designated for “hotel only” sites in the past years. The Government has also included in the 2018-19 Land Sale Programme four commercial sites that allow for hotel development, of which the three sites at Kai Tak Development area are expected to provide about 1,770 hotel rooms. According to CSD (2018), the number of hotels and rooms provided have been increasing significantly in Hong Kong since 2000 (Figure 3-13 & Figure 3-14). It can be further noticed that since 2010, the number of high tariff A hotels have become stable, while high tariff B and medium tariff hotels made the major contributions to hotel supply. Assuming that current trend is to be followed, using linear regression method, it is calculated that about 8,250 hotel rooms will be provided in the next 5 years from 2019 to 2023, i.e. 1,650 hotel rooms each year on average.
Figure 3-13 Number of hotels in Hong Kong by type since 2000
Figure 3-14 Number of hotel rooms in Hong Kong by type since 2000
0
50
100
150
200
250
300
2000 2001 2002 2003 2004 2005 2006 2007 2008 2009 2010 2011 2012 2013 2014 2015 2016 2017
Num
ber
of h
otel
s
Year
High tariff A High tariff B hotels Medium tariff hotels
Unclassified hotels All hotels
y = 2755.3x + 29832R² = 0.9798
0100002000030000400005000060000700008000090000
2000 2001 2002 2003 2004 2005 2006 2007 2008 2009 2010 2011 2012 2013 2014 2015 2016 2017
High tariff A High tariff B hotels Medium tariff hotels
Unclassified hotels All hotels Linear (All hotels)
18
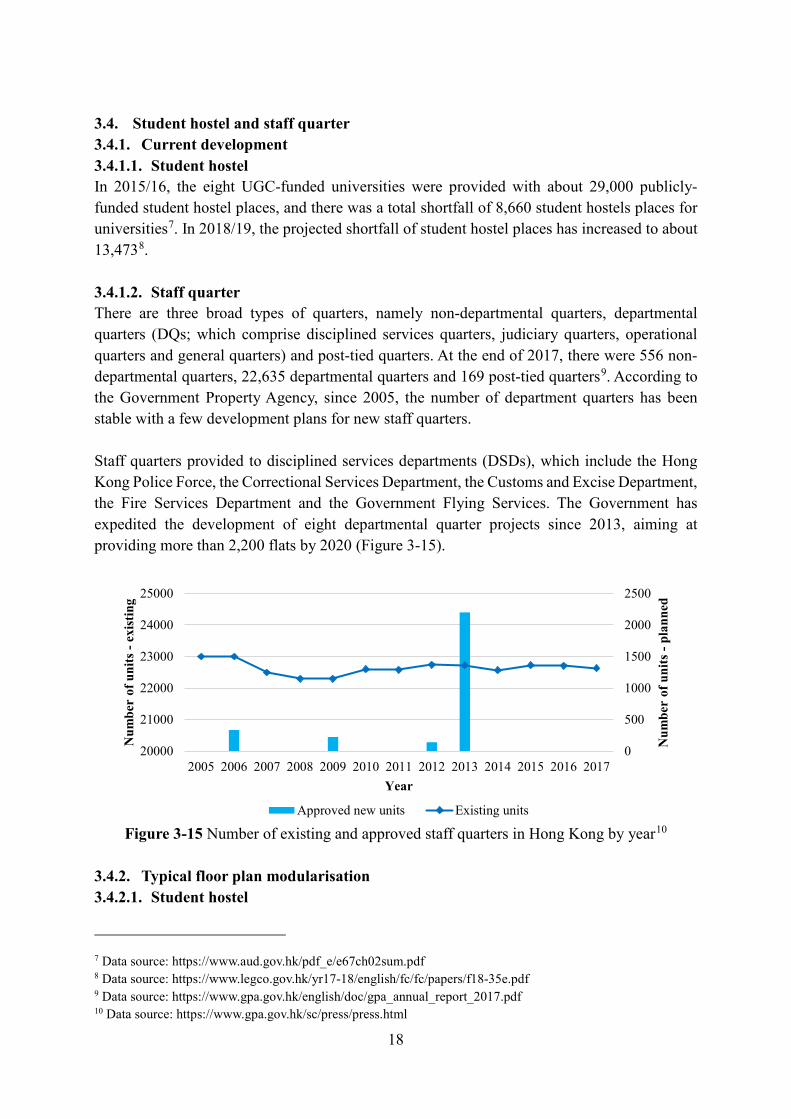
3.4. Student hostel and staff quarter 3.4.1. Current development 3.4.1.1. Student hostel In 2015/16, the eight UGC-funded universities were provided with about 29,000 publicly-funded student hostel places, and there was a total shortfall of 8,660 student hostels places for universities7. In 2018/19, the projected shortfall of student hostel places has increased to about 13,4738. 3.4.1.2. Staff quarter There are three broad types of quarters, namely non-departmental quarters, departmental quarters (DQs; which comprise disciplined services quarters, judiciary quarters, operational quarters and general quarters) and post-tied quarters. At the end of 2017, there were 556 non-departmental quarters, 22,635 departmental quarters and 169 post-tied quarters9. According to the Government Property Agency, since 2005, the number of department quarters has been stable with a few development plans for new staff quarters. Staff quarters provided to disciplined services departments (DSDs), which include the Hong Kong Police Force, the Correctional Services Department, the Customs and Excise Department, the Fire Services Department and the Government Flying Services. The Government has expedited the development of eight departmental quarter projects since 2013, aiming at providing more than 2,200 flats by 2020 (Figure 3-15).
Figure 3-15 Number of existing and approved staff quarters in Hong Kong by year10
3.4.2. Typical floor plan modularisation 3.4.2.1. Student hostel
7 Data source: https://www.aud.gov.hk/pdf_e/e67ch02sum.pdf 8 Data source: https://www.legco.gov.hk/yr17-18/english/fc/fc/papers/f18-35e.pdf 9 Data source: https://www.gpa.gov.hk/english/doc/gpa_annual_report_2017.pdf 10 Data source: https://www.gpa.gov.hk/sc/press/press.html
0
500
1000
1500
2000
2500
20000
21000
22000
23000
24000
25000
2005 2006 2007 2008 2009 2010 2011 2012 2013 2014 2015 2016 2017
Num
ber
of u
nits
-pl
anne
d
Num
ber
of u
nits
-ex
istin
g
Year
Approved new units Existing units
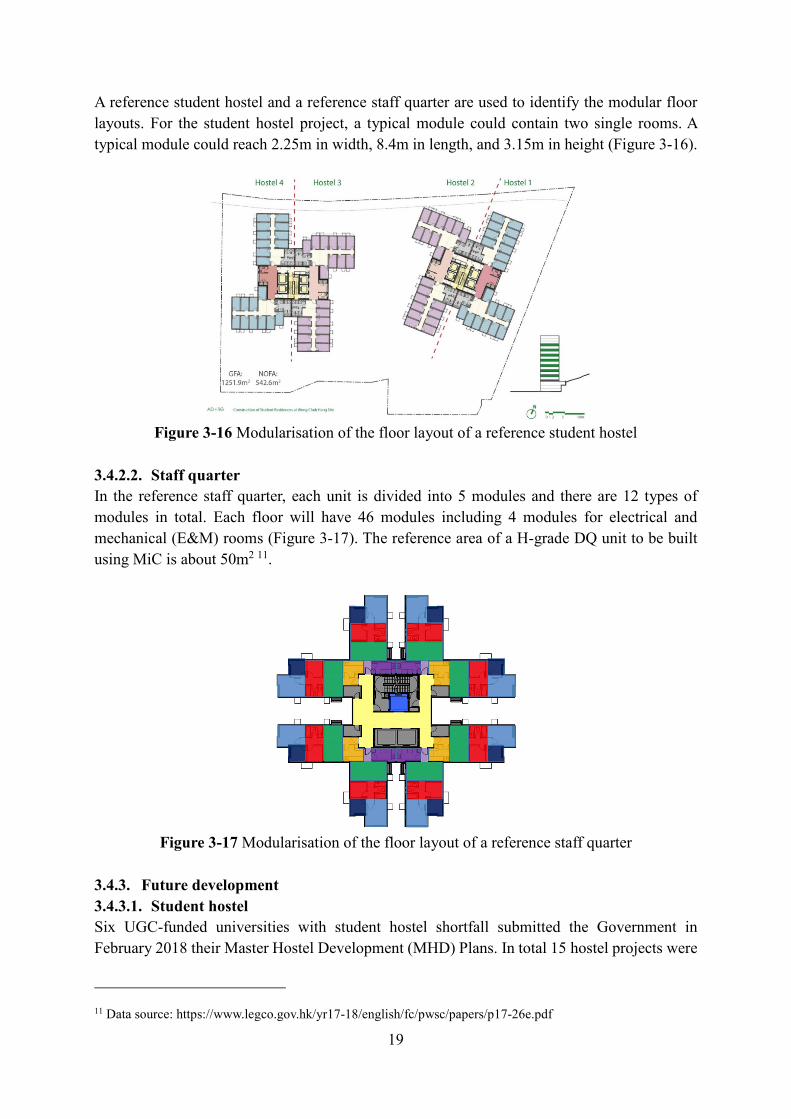
19
A reference student hostel and a reference staff quarter are used to identify the modular floor layouts. For the student hostel project, a typical module could contain two single rooms. A typical module could reach 2.25m in width, 8.4m in length, and 3.15m in height (Figure 3-16).
Figure 3-16 Modularisation of the floor layout of a reference student hostel
3.4.2.2. Staff quarter In the reference staff quarter, each unit is divided into 5 modules and there are 12 types of modules in total. Each floor will have 46 modules including 4 modules for electrical and mechanical (E&M) rooms (Figure 3-17). The reference area of a H-grade DQ unit to be built using MiC is about 50m2 11.
Figure 3-17 Modularisation of the floor layout of a reference staff quarter
3.4.3. Future development 3.4.3.1. Student hostel Six UGC-funded universities with student hostel shortfall submitted the Government in February 2018 their Master Hostel Development (MHD) Plans. In total 15 hostel projects were
11 Data source: https://www.legco.gov.hk/yr17-18/english/fc/pwsc/papers/p17-26e.pdf
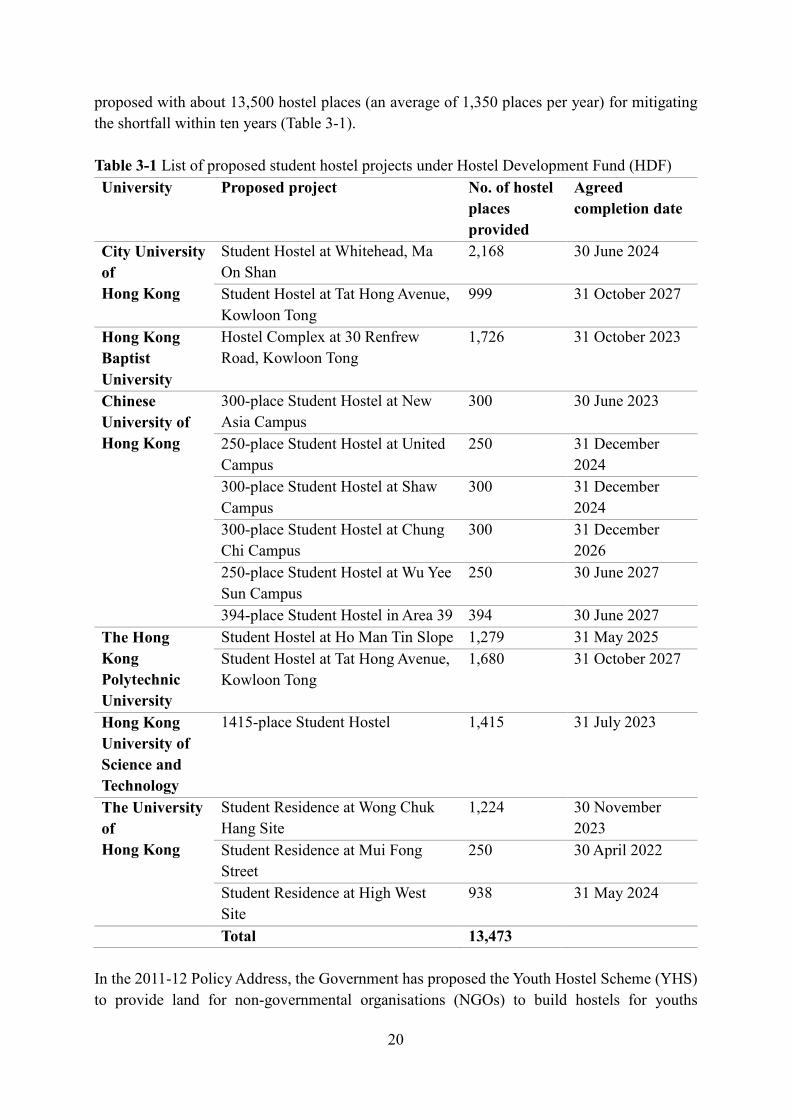
20
proposed with about 13,500 hostel places (an average of 1,350 places per year) for mitigating the shortfall within ten years (Table 3-1). Table 3-1 List of proposed student hostel projects under Hostel Development Fund (HDF) University Proposed project No. of hostel
places provided
Agreed completion date
City University of Hong Kong
Student Hostel at Whitehead, Ma On Shan
2,168 30 June 2024
Student Hostel at Tat Hong Avenue, Kowloon Tong
999 31 October 2027
Hong Kong Baptist University
Hostel Complex at 30 Renfrew Road, Kowloon Tong
1,726 31 October 2023
Chinese University of Hong Kong
300-place Student Hostel at New Asia Campus
300 30 June 2023
250-place Student Hostel at United Campus
250 31 December 2024
300-place Student Hostel at Shaw Campus
300 31 December 2024
300-place Student Hostel at Chung Chi Campus
300 31 December 2026
250-place Student Hostel at Wu Yee Sun Campus
250 30 June 2027
394-place Student Hostel in Area 39 394 30 June 2027 The Hong Kong Polytechnic University
Student Hostel at Ho Man Tin Slope 1,279 31 May 2025 Student Hostel at Tat Hong Avenue, Kowloon Tong
1,680 31 October 2027
Hong Kong University of Science and Technology
1415-place Student Hostel 1,415 31 July 2023
The University of Hong Kong
Student Residence at Wong Chuk Hang Site
1,224 30 November 2023
Student Residence at Mui Fong Street
250 30 April 2022
Student Residence at High West Site
938 31 May 2024
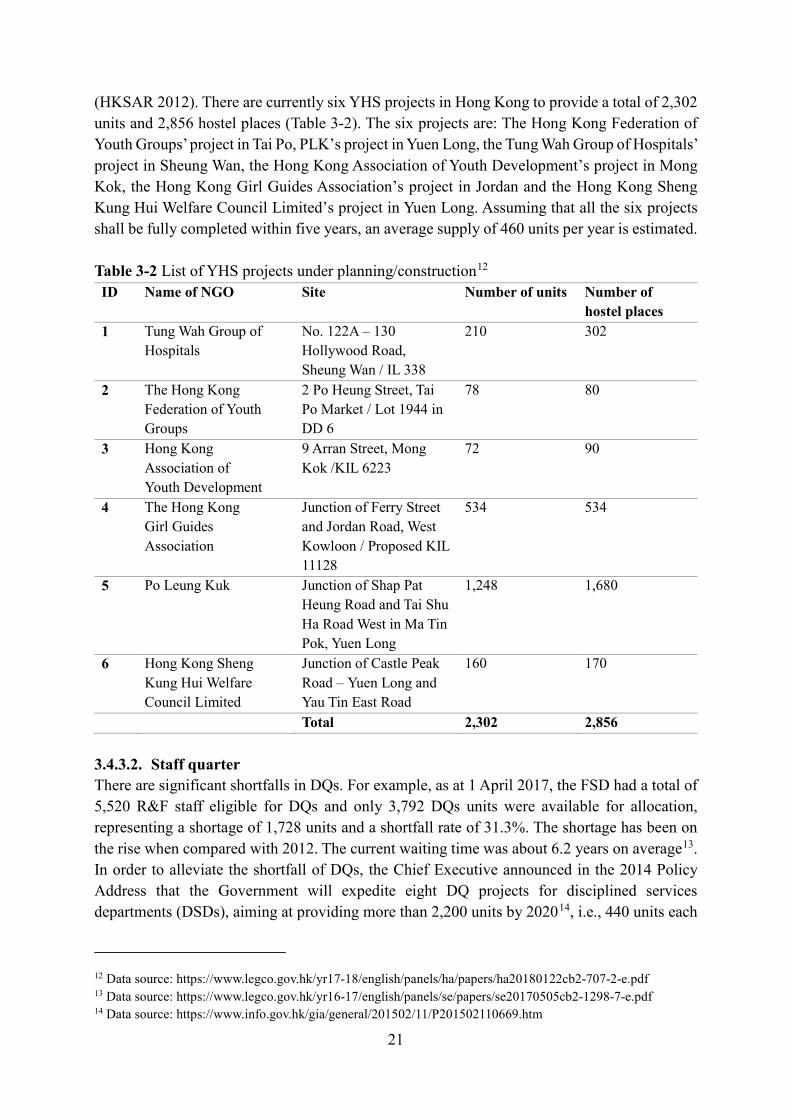
Total 13,473 In the 2011-12 Policy Address, the Government has proposed the Youth Hostel Scheme (YHS) to provide land for non-governmental organisations (NGOs) to build hostels for youths
21
(HKSAR 2012). There are currently six YHS projects in Hong Kong to provide a total of 2,302 units and 2,856 hostel places (Table 3-2). The six projects are: The Hong Kong Federation of Youth Groups’ project in Tai Po, PLK’s project in Yuen Long, the Tung Wah Group of Hospitals’ project in Sheung Wan, the Hong Kong Association of Youth Development’s project in Mong Kok, the Hong Kong Girl Guides Association’s project in Jordan and the Hong Kong Sheng Kung Hui Welfare Council Limited’s project in Yuen Long. Assuming that all the six projects shall be fully completed within five years, an average supply of 460 units per year is estimated. Table 3-2 List of YHS projects under planning/construction12 ID Name of NGO Site Number of units Number of
hostel places 1 Tung Wah Group of
Hospitals No. 122A – 130 Hollywood Road, Sheung Wan / IL 338
210 302
2 The Hong Kong Federation of Youth Groups
2 Po Heung Street, Tai Po Market / Lot 1944 in DD 6
78 80
3 Hong Kong Association of Youth Development
9 Arran Street, Mong Kok /KIL 6223
72 90
4 The Hong Kong Girl Guides Association
Junction of Ferry Street and Jordan Road, West Kowloon / Proposed KIL 11128
534 534
5 Po Leung Kuk Junction of Shap Pat Heung Road and Tai Shu Ha Road West in Ma Tin Pok, Yuen Long
1,248 1,680
6 Hong Kong Sheng Kung Hui Welfare Council Limited
Junction of Castle Peak Road – Yuen Long and Yau Tin East Road
160 170
Total 2,302 2,856 3.4.3.2. Staff quarter There are significant shortfalls in DQs. For example, as at 1 April 2017, the FSD had a total of 5,520 R&F staff eligible for DQs and only 3,792 DQs units were available for allocation, representing a shortage of 1,728 units and a shortfall rate of 31.3%. The shortage has been on the rise when compared with 2012. The current waiting time was about 6.2 years on average13. In order to alleviate the shortfall of DQs, the Chief Executive announced in the 2014 Policy Address that the Government will expedite eight DQ projects for disciplined services departments (DSDs), aiming at providing more than 2,200 units by 202014, i.e., 440 units each
12 Data source: https://www.legco.gov.hk/yr17-18/english/panels/ha/papers/ha20180122cb2-707-2-e.pdf 13 Data source: https://www.legco.gov.hk/yr16-17/english/panels/se/papers/se20170505cb2-1298-7-e.pdf 14 Data source: https://www.info.gov.hk/gia/general/201502/11/P201502110669.htm
22
year on average. 3.5. Hospital 3.5.1. Current development The Hospital Authority currently manages 43 public hospitals and institutions, 49 specialist out-patient clinics, and 73 general out-patient clinics. These are organised into seven hospital clusters based on locations15. 40 registered private hospitals are managed by 12 institutions16. 3.5.2. Typical floor plan modularisation Since there is no available typical floor plan data for the hospitals in Hong Kong, the estimation carried out in this report was referred to the data from a nursing home project using PPVC in Singapore (i.e. the Woodlands Care Home17). The details of this PPVC project are as follows:
• GFA: 9,000 m2 • 9 floors, 243 beds in total • The number of modules: 34318 • The average floor area of a typical module: 21 m2
Referring to this PPVC project, it was assumed that on average one-bed place (including relevant facilities and functional areas) needs 1-2 modules (with arithmetic average of 1.41), with an estimation CFA of 21 m2 per module. 3.5.3. Future development The Hospital Authority has set out two 10-year development plans of hospital projects in Hong Kong. As stated in the development plan, 6,126 and 9,320 additional hospital bed places will be provided respectively in the first ten-year plan (2016~2026) and the second ten-year plan (2026-2036)19. 3.6. Transitional housing and quarantine centres 3.6.1. Current development The discussion above demonstrated the suitability of MiC for traditional sectors for permanent building development. Indeed, MiC is also deemed effective for special sectors, e.g. transitional housing and quarantine centres, as it enables the speedy provision of short-term accommodation and facilities. 3.6.1.1. Transitional housing Transitional housing generally refers to the provision of short-term accommodation to help vulnerable individuals/households transition into longer-term housing (LegCO, 2019). Since 2017, the Government has supported the implementation of various community initiatives on
15 Data source: http://www.ha.org.hk/visitor/ha_visitor_index.asp?Content_ID=10084&Lang=ENG&Dimension =100&Parent_ID=10042 16 Data source: https://www.dh.gov.hk/english/main/main_orphf/list_ph.html 17 Data source: https://www.carehome.com.sg/woodlands/faq.html 18 Data source: http://dragages.com.sg/news-post/award-of-the-woodlands-crescent-nursing-home-project/ 19 https://www.legco.gov.hk/yr18-19/english/panels/hs/papers/hs20190415cb2-1167-7-e.pdf

23
transitional housing to alleviate the hardship faced by the applicants. Currently, the Task Force on transitional housing has been set up under the Transport and Housing Bureau and is providing coordinated support for more than 10 transitional housing projects advocated by NGOs. The Government has provided HK$36 million through the Community Care Fund for the Modular Social Housing Scheme on Nam Cheong Street in Sham Shui Po. Besides, a Modular Social Housing Scheme has been taken forward on Yen Chow Street in the same district. The two modular housing projects together are expected to deliver around 300 units of transitional housing (LegCO, 2019). 3.6.1.2. Quarantine centres Since the onset of the outbreak of Covid-19, the government has taken proactive measures to identify suitable sites to construct quarantine centres within a short time using MiC to meet the demands arising from the epidemic. As of December 2020, four MiC-based quarantine centres have been completed or under planning, which included20
• 352 units at the Lei Yue Mun Park and Holiday Village in Chai Wan (completed) • 99 units at the Sai Kung Outdoor Recreation Centre (completed) • 208 units at the Junior Police Call Permanent Activity Centre in Pat Heung (completed) • 3500 units at the Penny’s Bay (800 completed, 700 ongoing, and 2000 under planning).
3.6.2. Typical floor plan modularisation 3.6.2.1. Transitional housing The transitional housing project in Nam Cheong Street, Sham Shui Po is the first-of-its-kind MiC transitional housing. We refer to this typical project for modularisation (Figure 3-18).
Figure 3-18 Modularisation of the floor layout of transitional housing21
3.6.2.2. Quarantine centres Generally, a quarantine unit is constructed as a stand-alone module. The Lei Yue Mun
20 Date source: https://www.devb.gov.hk/en/home/my_blog/index_id_400.html; Together we fight Covid-19 by the Development Bureau, the Architectural Services Department, and the Civil Engineering and Development Department of the HKSAR Government. 21 Data source:http://www.tungwahcsd.org/upload/service_project/youth/pamphlet_0427.pdf
24
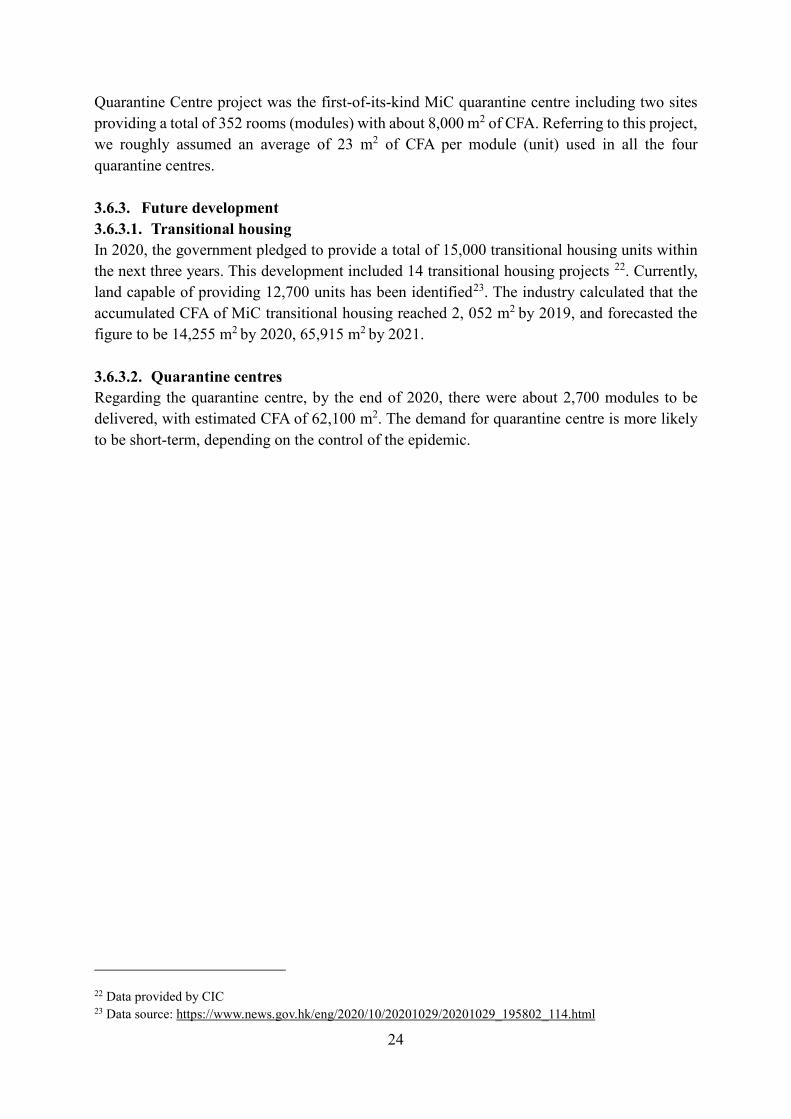
Quarantine Centre project was the first-of-its-kind MiC quarantine centre including two sites providing a total of 352 rooms (modules) with about 8,000 m2 of CFA. Referring to this project, we roughly assumed an average of 23 m2 of CFA per module (unit) used in all the four quarantine centres. 3.6.3. Future development 3.6.3.1. Transitional housing In 2020, the government pledged to provide a total of 15,000 transitional housing units within the next three years. This development included 14 transitional housing projects 22. Currently, land capable of providing 12,700 units has been identified23. The industry calculated that the accumulated CFA of MiC transitional housing reached 2, 052 m2 by 2019, and forecasted the figure to be 14,255 m2 by 2020, 65,915 m2 by 2021. 3.6.3.2. Quarantine centres Regarding the quarantine centre, by the end of 2020, there were about 2,700 modules to be delivered, with estimated CFA of 62,100 m2. The demand for quarantine centre is more likely to be short-term, depending on the control of the epidemic.
22 Data provided by CIC 23 Data source: https://www.news.gov.hk/eng/2020/10/20201029/20201029_195802_114.html

25
4. Results and Analysis of Market Questionnaire Survey This chapter reports the results and analysis of the MiC market questionnaire survey, which was conducted during the period from May to June 2019. In total 1,385 stakeholders and practitioners in the Hong Kong building construction industry and community were invited to participate in the survey, and 326 effective responses were received, yielding a response rate of 23.54%. This response rate well aligns with that of many other professional questionnaire surveys conducted in construction research disciplines (Pan and Pan, 2019), and thus is considered acceptable. 4.1. Profile of survey participants The participants in the survey covered five main stakeholder groups, i.e., government/client, consultants, contractor, supplier/manufacturers, and institutions. The largest group of participants was from the government/clients (38.0%), followed by contractors (22.2%), consultants (21.9%) and institutions (12.0%), with suppliers and manufacturers (5.9%) being the smallest (Figure 4-1).
Figure 4-1 Stakeholders groups of questionnaire survey participants
The five main groups were divided into 15 sub-groups based on their specialities. The largest group of participants were from main contractors (19.33%), followed by government agencies (18.71%), private sector clients (10.74%), educational institutions (8.90%), public sector clients (8.59%) and structural engineers (8.28%), with MiC suppliers being the smallest (Figure 4-2).
Figure 4-2 Specialities of questionnaire survey participants (n=326)
19.33%18.71%
10.74%8.90%
8.59%8.28%
5.52%3.37%
3.07%3.07%3.07%
2.76%2.15%
1.23%0.92%
0.31%
Main contractorsGovernment agenciesPrivate sector clients
Educational professionalsPublic sector clientsStructural engineers
Other consultantsGeneral supplier
Professional institutionsSpecialist contractors
Building services engineeringArchitect
Quantity surveyorPrecast supplier
Electrical and mechanical supplierMiC suppliers
26
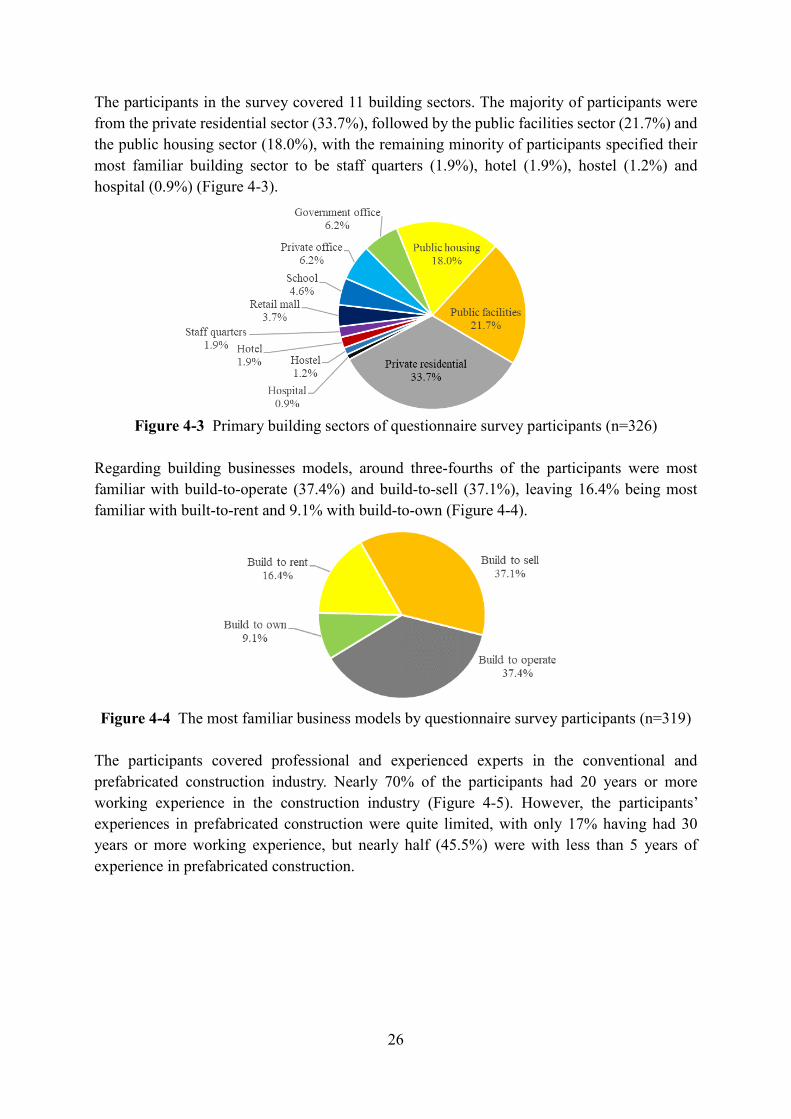
The participants in the survey covered 11 building sectors. The majority of participants were from the private residential sector (33.7%), followed by the public facilities sector (21.7%) and the public housing sector (18.0%), with the remaining minority of participants specified their most familiar building sector to be staff quarters (1.9%), hotel (1.9%), hostel (1.2%) and hospital (0.9%) (Figure 4-3).
Figure 4-3 Primary building sectors of questionnaire survey participants (n=326)
Regarding building businesses models, around three-fourths of the participants were most familiar with build-to-operate (37.4%) and build-to-sell (37.1%), leaving 16.4% being most familiar with built-to-rent and 9.1% with build-to-own (Figure 4-4).
Figure 4-4 The most familiar business models by questionnaire survey participants (n=319)
The participants covered professional and experienced experts in the conventional and prefabricated construction industry. Nearly 70% of the participants had 20 years or more working experience in the construction industry (Figure 4-5). However, the participants’ experiences in prefabricated construction were quite limited, with only 17% having had 30 years or more working experience, but nearly half (45.5%) were with less than 5 years of experience in prefabricated construction.
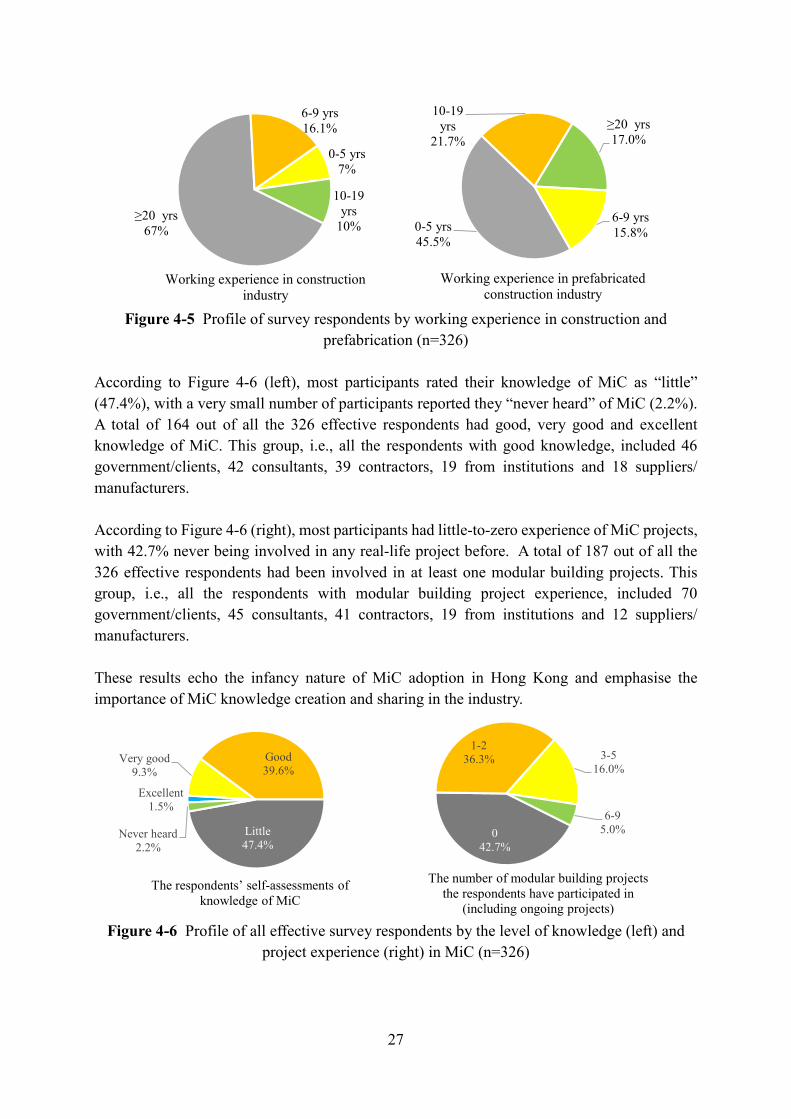
27
Figure 4-5 Profile of survey respondents by working experience in construction and
prefabrication (n=326) According to Figure 4-6 (left), most participants rated their knowledge of MiC as “little” (47.4%), with a very small number of participants reported they “never heard” of MiC (2.2%). A total of 164 out of all the 326 effective respondents had good, very good and excellent knowledge of MiC. This group, i.e., all the respondents with good knowledge, included 46 government/clients, 42 consultants, 39 contractors, 19 from institutions and 18 suppliers/ manufacturers. According to Figure 4-6 (right), most participants had little-to-zero experience of MiC projects, with 42.7% never being involved in any real-life project before. A total of 187 out of all the 326 effective respondents had been involved in at least one modular building projects. This group, i.e., all the respondents with modular building project experience, included 70 government/clients, 45 consultants, 41 contractors, 19 from institutions and 12 suppliers/ manufacturers. These results echo the infancy nature of MiC adoption in Hong Kong and emphasise the importance of MiC knowledge creation and sharing in the industry.
Figure 4-6 Profile of all effective survey respondents by the level of knowledge (left) and
project experience (right) in MiC (n=326)
0-5 yrs7%
10-19 yrs
10%≥20 yrs
67%
6-9 yrs16.1%
Working experience in construction industry
0-5 yrs45.5%
10-19 yrs
21.7%≥20 yrs17.0%
6-9 yrs15.8%
Working experience in prefabricated construction industry
Excellent1.5%
Very good9.3%
Good39.6%
Little47.4%
Never heard2.2%
The respondents’ self-assessments of knowledge of MiC
042.7%
1-236.3% 3-5
16.0%
6-95.0%
The number of modular building projects the respondents have participated in
(including ongoing projects)
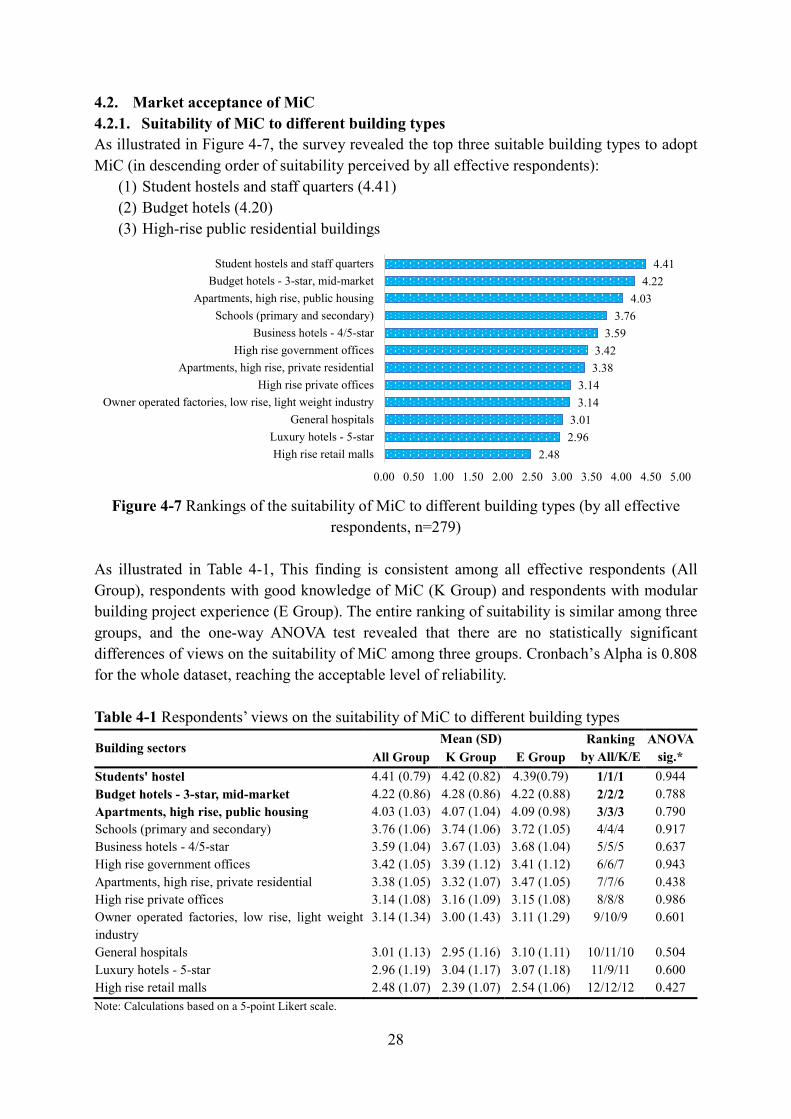
28
4.2. Market acceptance of MiC 4.2.1. Suitability of MiC to different building types As illustrated in Figure 4-7, the survey revealed the top three suitable building types to adopt MiC (in descending order of suitability perceived by all effective respondents):
(1) Student hostels and staff quarters (4.41) (2) Budget hotels (4.20) (3) High-rise public residential buildings
Figure 4-7 Rankings of the suitability of MiC to different building types (by all effective
respondents, n=279) As illustrated in Table 4-1, This finding is consistent among all effective respondents (All Group), respondents with good knowledge of MiC (K Group) and respondents with modular building project experience (E Group). The entire ranking of suitability is similar among three groups, and the one-way ANOVA test revealed that there are no statistically significant differences of views on the suitability of MiC among three groups. Cronbach’s Alpha is 0.808 for the whole dataset, reaching the acceptable level of reliability. Table 4-1 Respondents’ views on the suitability of MiC to different building types
Building sectors Mean (SD) Ranking
by All/K/E ANOVA
sig.* All Group K Group E Group Students' hostel 4.41 (0.79) 4.42 (0.82) 4.39(0.79) 1/1/1 0.944 Budget hotels - 3-star, mid-market 4.22 (0.86) 4.28 (0.86) 4.22 (0.88) 2/2/2 0.788 Apartments, high rise, public housing 4.03 (1.03) 4.07 (1.04) 4.09 (0.98) 3/3/3 0.790 Schools (primary and secondary) 3.76 (1.06) 3.74 (1.06) 3.72 (1.05) 4/4/4 0.917 Business hotels - 4/5-star 3.59 (1.04) 3.67 (1.03) 3.68 (1.04) 5/5/5 0.637 High rise government offices 3.42 (1.05) 3.39 (1.12) 3.41 (1.12) 6/6/7 0.943 Apartments, high rise, private residential 3.38 (1.05) 3.32 (1.07) 3.47 (1.05) 7/7/6 0.438 High rise private offices 3.14 (1.08) 3.16 (1.09) 3.15 (1.08) 8/8/8 0.986 Owner operated factories, low rise, light weight industry
3.14 (1.34) 3.00 (1.43) 3.11 (1.29) 9/10/9 0.601
General hospitals 3.01 (1.13) 2.95 (1.16) 3.10 (1.11) 10/11/10 0.504 Luxury hotels - 5-star 2.96 (1.19) 3.04 (1.17) 3.07 (1.18) 11/9/11 0.600 High rise retail malls 2.48 (1.07) 2.39 (1.07) 2.54 (1.06) 12/12/12 0.427 Note: Calculations based on a 5-point Likert scale.
2.482.963.01
3.143.14
3.383.42
3.593.76
4.034.22
4.41
0.00 0.50 1.00 1.50 2.00 2.50 3.00 3.50 4.00 4.50 5.00
High rise retail mallsLuxury hotels - 5-star
General hospitalsOwner operated factories, low rise, light weight industry
High rise private officesApartments, high rise, private residential
High rise government officesBusiness hotels - 4/5-star
Schools (primary and secondary)Apartments, high rise, public housing
Budget hotels - 3-star, mid-marketStudent hostels and staff quarters
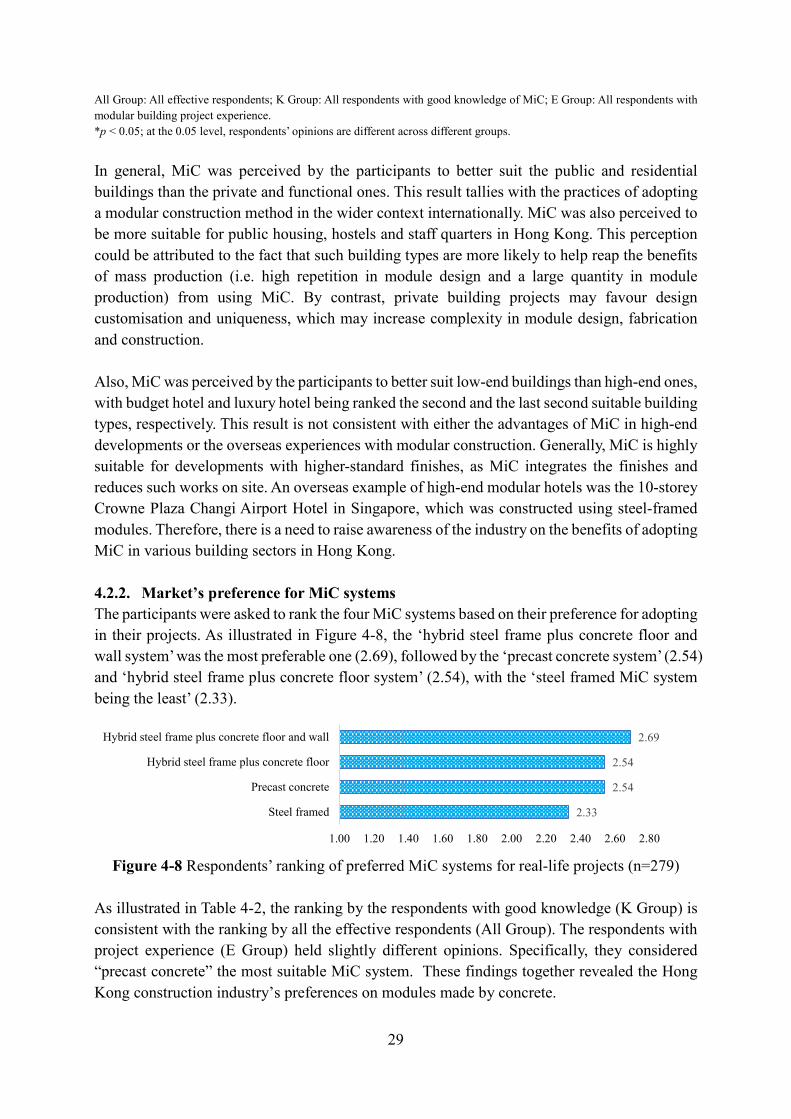
29
All Group: All effective respondents; K Group: All respondents with good knowledge of MiC; E Group: All respondents with modular building project experience. *p < 0.05; at the 0.05 level, respondents’ opinions are different across different groups. In general, MiC was perceived by the participants to better suit the public and residential buildings than the private and functional ones. This result tallies with the practices of adopting a modular construction method in the wider context internationally. MiC was also perceived to be more suitable for public housing, hostels and staff quarters in Hong Kong. This perception could be attributed to the fact that such building types are more likely to help reap the benefits of mass production (i.e. high repetition in module design and a large quantity in module production) from using MiC. By contrast, private building projects may favour design customisation and uniqueness, which may increase complexity in module design, fabrication and construction. Also, MiC was perceived by the participants to better suit low-end buildings than high-end ones, with budget hotel and luxury hotel being ranked the second and the last second suitable building types, respectively. This result is not consistent with either the advantages of MiC in high-end developments or the overseas experiences with modular construction. Generally, MiC is highly suitable for developments with higher-standard finishes, as MiC integrates the finishes and reduces such works on site. An overseas example of high-end modular hotels was the 10-storey Crowne Plaza Changi Airport Hotel in Singapore, which was constructed using steel-framed modules. Therefore, there is a need to raise awareness of the industry on the benefits of adopting MiC in various building sectors in Hong Kong. 4.2.2. Market’s preference for MiC systems The participants were asked to rank the four MiC systems based on their preference for adopting in their projects. As illustrated in Figure 4-8, the ‘hybrid steel frame plus concrete floor and wall system’ was the most preferable one (2.69), followed by the ‘precast concrete system’ (2.54) and ‘hybrid steel frame plus concrete floor system’ (2.54), with the ‘steel framed MiC system being the least’ (2.33).
Figure 4-8 Respondents’ ranking of preferred MiC systems for real-life projects (n=279)
As illustrated in Table 4-2, the ranking by the respondents with good knowledge (K Group) is consistent with the ranking by all the effective respondents (All Group). The respondents with project experience (E Group) held slightly different opinions. Specifically, they considered “precast concrete” the most suitable MiC system. These findings together revealed the Hong Kong construction industry’s preferences on modules made by concrete.
2.33
2.54
2.54
2.69
1.00 1.20 1.40 1.60 1.80 2.00 2.20 2.40 2.60 2.80
Steel framed
Precast concrete
Hybrid steel frame plus concrete floor
Hybrid steel frame plus concrete floor and wall
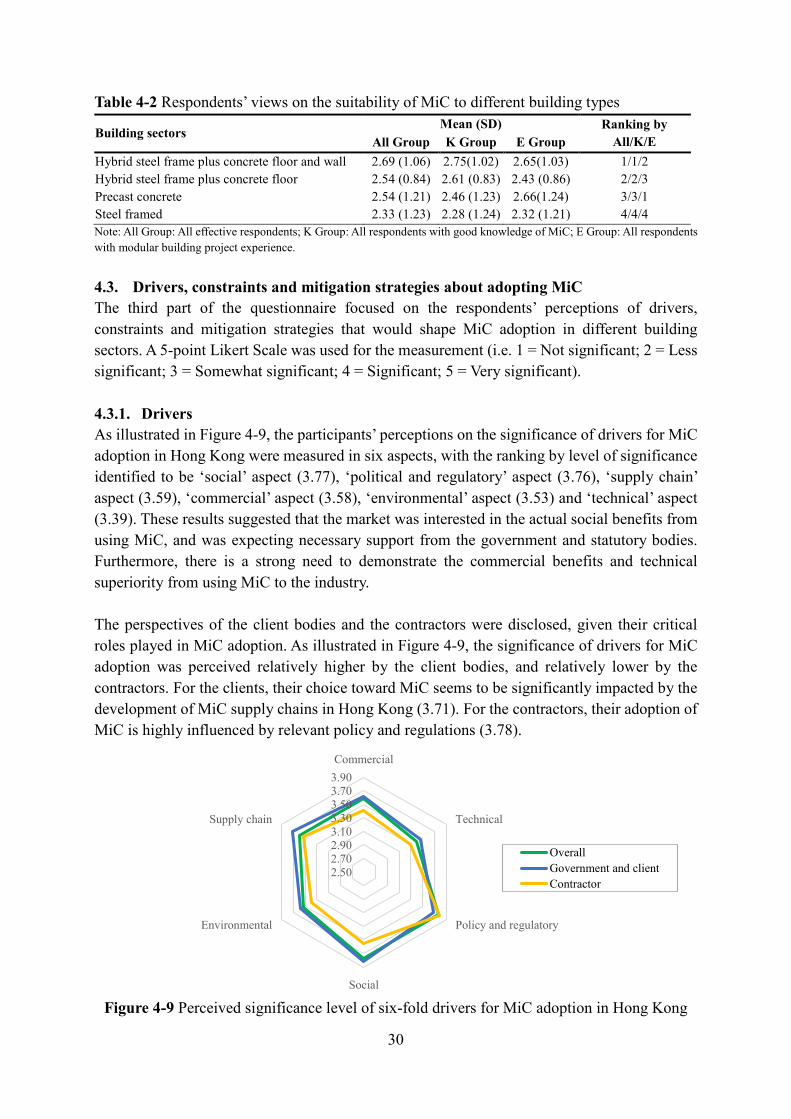
30
Table 4-2 Respondents’ views on the suitability of MiC to different building types
Building sectors Mean (SD) Ranking by
All/K/E All Group K Group E Group Hybrid steel frame plus concrete floor and wall 2.69 (1.06) 2.75(1.02) 2.65(1.03) 1/1/2 Hybrid steel frame plus concrete floor 2.54 (0.84) 2.61 (0.83) 2.43 (0.86) 2/2/3 Precast concrete 2.54 (1.21) 2.46 (1.23) 2.66(1.24) 3/3/1 Steel framed 2.33 (1.23) 2.28 (1.24) 2.32 (1.21) 4/4/4 Note: All Group: All effective respondents; K Group: All respondents with good knowledge of MiC; E Group: All respondents with modular building project experience. 4.3. Drivers, constraints and mitigation strategies about adopting MiC The third part of the questionnaire focused on the respondents’ perceptions of drivers, constraints and mitigation strategies that would shape MiC adoption in different building sectors. A 5-point Likert Scale was used for the measurement (i.e. 1 = Not significant; 2 = Less significant; 3 = Somewhat significant; 4 = Significant; 5 = Very significant). 4.3.1. Drivers As illustrated in Figure 4-9, the participants’ perceptions on the significance of drivers for MiC adoption in Hong Kong were measured in six aspects, with the ranking by level of significance identified to be ‘social’ aspect (3.77), ‘political and regulatory’ aspect (3.76), ‘supply chain’ aspect (3.59), ‘commercial’ aspect (3.58), ‘environmental’ aspect (3.53) and ‘technical’ aspect (3.39). These results suggested that the market was interested in the actual social benefits from using MiC, and was expecting necessary support from the government and statutory bodies. Furthermore, there is a strong need to demonstrate the commercial benefits and technical superiority from using MiC to the industry. The perspectives of the client bodies and the contractors were disclosed, given their critical roles played in MiC adoption. As illustrated in Figure 4-9, the significance of drivers for MiC adoption was perceived relatively higher by the client bodies, and relatively lower by the contractors. For the clients, their choice toward MiC seems to be significantly impacted by the development of MiC supply chains in Hong Kong (3.71). For the contractors, their adoption of MiC is highly influenced by relevant policy and regulations (3.78).
Figure 4-9 Perceived significance level of six-fold drivers for MiC adoption in Hong Kong
2.502.702.903.103.303.503.703.90Commercial
Technical
Policy and regulatory
Social
Environmental
Supply chain
OverallGovernment and clientContractor
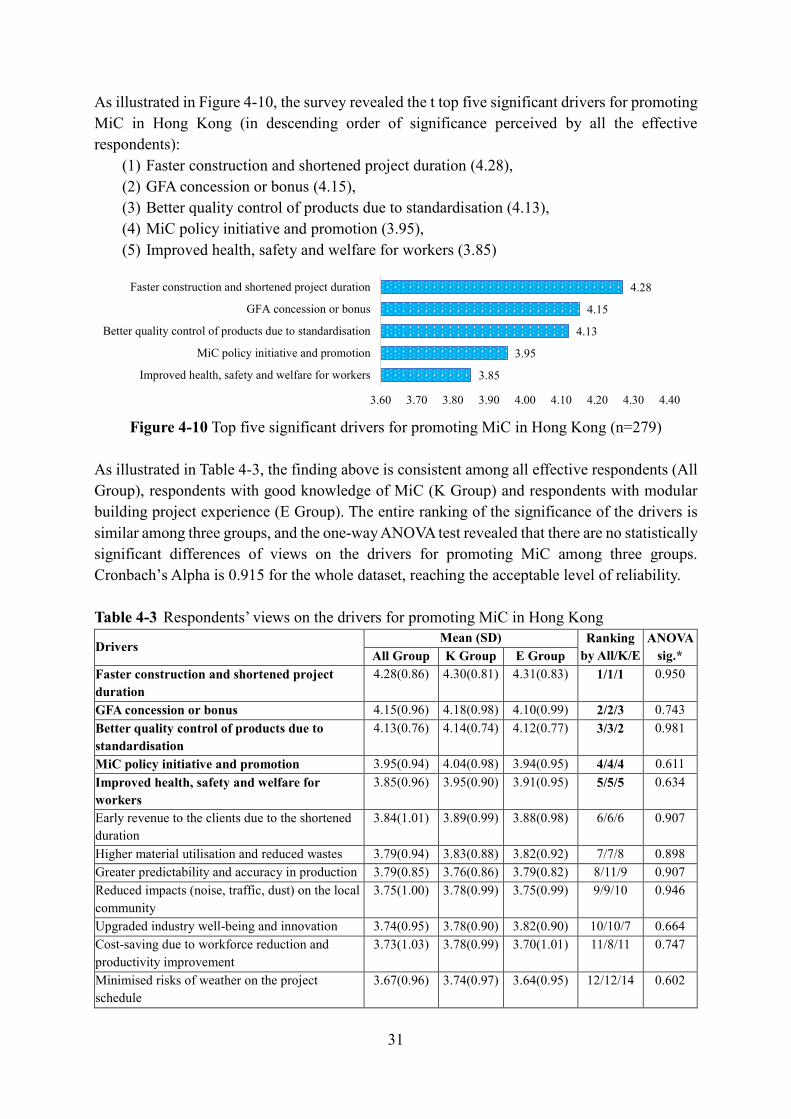
31
As illustrated in Figure 4-10, the survey revealed the t top five significant drivers for promoting MiC in Hong Kong (in descending order of significance perceived by all the effective respondents):
(1) Faster construction and shortened project duration (4.28), (2) GFA concession or bonus (4.15), (3) Better quality control of products due to standardisation (4.13), (4) MiC policy initiative and promotion (3.95), (5) Improved health, safety and welfare for workers (3.85)
Figure 4-10 Top five significant drivers for promoting MiC in Hong Kong (n=279)
As illustrated in Table 4-3, the finding above is consistent among all effective respondents (All Group), respondents with good knowledge of MiC (K Group) and respondents with modular building project experience (E Group). The entire ranking of the significance of the drivers is similar among three groups, and the one-way ANOVA test revealed that there are no statistically significant differences of views on the drivers for promoting MiC among three groups. Cronbach’s Alpha is 0.915 for the whole dataset, reaching the acceptable level of reliability. Table 4-3 Respondents’ views on the drivers for promoting MiC in Hong Kong
Drivers Mean (SD) Ranking
by All/K/E ANOVA
sig.* All Group K Group E Group Faster construction and shortened project duration
4.28(0.86) 4.30(0.81) 4.31(0.83)
1/1/1 0.950
GFA concession or bonus 4.15(0.96) 4.18(0.98) 4.10(0.99) 2/2/3 0.743 Better quality control of products due to standardisation
4.13(0.76) 4.14(0.74) 4.12(0.77) 3/3/2 0.981
MiC policy initiative and promotion 3.95(0.94) 4.04(0.98) 3.94(0.95) 4/4/4 0.611 Improved health, safety and welfare for workers
3.85(0.96) 3.95(0.90) 3.91(0.95) 5/5/5 0.634
Early revenue to the clients due to the shortened duration
3.84(1.01) 3.89(0.99) 3.88(0.98) 6/6/6 0.907
Higher material utilisation and reduced wastes 3.79(0.94) 3.83(0.88) 3.82(0.92) 7/7/8 0.898 Greater predictability and accuracy in production 3.79(0.85) 3.76(0.86) 3.79(0.82) 8/11/9 0.907 Reduced impacts (noise, traffic, dust) on the local community
3.75(1.00) 3.78(0.99) 3.75(0.99) 9/9/10 0.946
Upgraded industry well-being and innovation 3.74(0.95) 3.78(0.90) 3.82(0.90) 10/10/7 0.664 Cost-saving due to workforce reduction and productivity improvement
3.73(1.03) 3.78(0.99) 3.70(1.01)
11/8/11 0.747
Minimised risks of weather on the project schedule
3.67(0.96) 3.74(0.97) 3.64(0.95)
12/12/14 0.602
3.85
3.95
4.13
4.15
4.28
3.60 3.70 3.80 3.90 4.00 4.10 4.20 4.30 4.40
Improved health, safety and welfare for workers
MiC policy initiative and promotion
Better quality control of products due to standardisation
GFA concession or bonus
Faster construction and shortened project duration
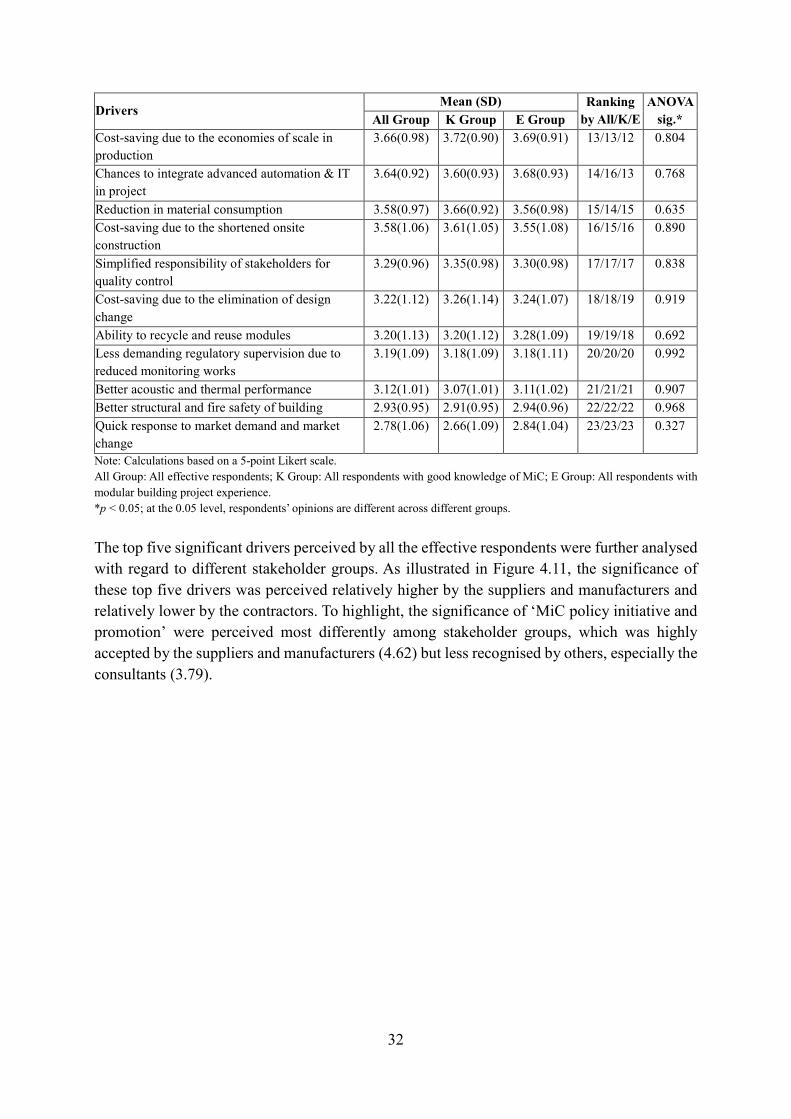
32
Drivers Mean (SD) Ranking
by All/K/E ANOVA
sig.* All Group K Group E Group Cost-saving due to the economies of scale in production
3.66(0.98) 3.72(0.90) 3.69(0.91)
13/13/12 0.804
Chances to integrate advanced automation & IT in project
3.64(0.92) 3.60(0.93) 3.68(0.93)
14/16/13 0.768
Reduction in material consumption 3.58(0.97) 3.66(0.92) 3.56(0.98) 15/14/15 0.635 Cost-saving due to the shortened onsite construction
3.58(1.06) 3.61(1.05) 3.55(1.08)
16/15/16 0.890
Simplified responsibility of stakeholders for quality control
3.29(0.96) 3.35(0.98) 3.30(0.98)
17/17/17 0.838
Cost-saving due to the elimination of design change
3.22(1.12) 3.26(1.14) 3.24(1.07)
18/18/19 0.919
Ability to recycle and reuse modules 3.20(1.13) 3.20(1.12) 3.28(1.09) 19/19/18 0.692 Less demanding regulatory supervision due to reduced monitoring works
3.19(1.09) 3.18(1.09) 3.18(1.11)
20/20/20 0.992
Better acoustic and thermal performance 3.12(1.01) 3.07(1.01) 3.11(1.02) 21/21/21 0.907 Better structural and fire safety of building 2.93(0.95) 2.91(0.95) 2.94(0.96) 22/22/22 0.968 Quick response to market demand and market change
2.78(1.06) 2.66(1.09) 2.84(1.04) 23/23/23 0.327
Note: Calculations based on a 5-point Likert scale. All Group: All effective respondents; K Group: All respondents with good knowledge of MiC; E Group: All respondents with modular building project experience. *p < 0.05; at the 0.05 level, respondents’ opinions are different across different groups. The top five significant drivers perceived by all the effective respondents were further analysed with regard to different stakeholder groups. As illustrated in Figure 4.11, the significance of these top five drivers was perceived relatively higher by the suppliers and manufacturers and relatively lower by the contractors. To highlight, the significance of ‘MiC policy initiative and promotion’ were perceived most differently among stakeholder groups, which was highly accepted by the suppliers and manufacturers (4.62) but less recognised by others, especially the consultants (3.79).
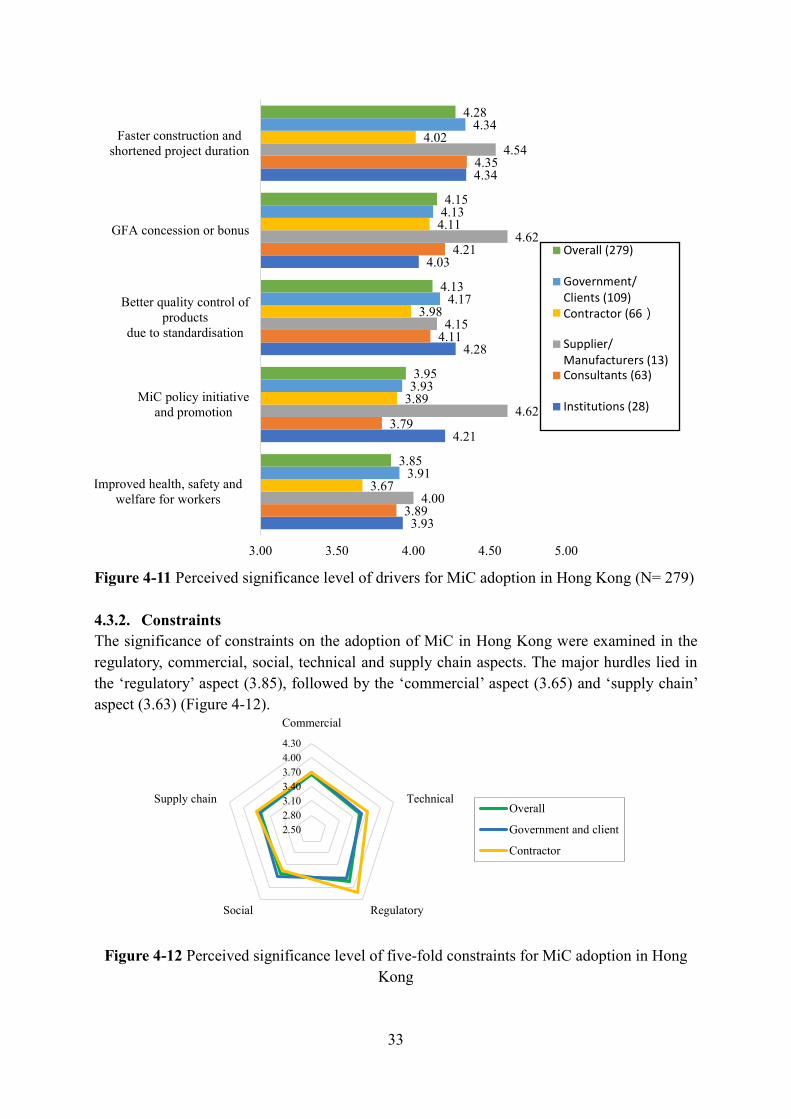
33
Figure 4-11 Perceived significance level of drivers for MiC adoption in Hong Kong (N= 279) 4.3.2. Constraints The significance of constraints on the adoption of MiC in Hong Kong were examined in the regulatory, commercial, social, technical and supply chain aspects. The major hurdles lied in the ‘regulatory’ aspect (3.85), followed by the ‘commercial’ aspect (3.65) and ‘supply chain’ aspect (3.63) (Figure 4-12).
Figure 4-12 Perceived significance level of five-fold constraints for MiC adoption in Hong
Kong
3.93
4.21
4.28
4.03
4.34
3.89
3.79
4.11
4.21
4.35
4.00
4.62
4.15
4.62
4.54
3.67
3.89
3.98
4.11
4.02
3.91
3.93
4.17
4.13
4.34
3.85
3.95
4.13
4.15
4.28
3.00 3.50 4.00 4.50 5.00
Improved health, safety andwelfare for workers
MiC policy initiativeand promotion
Better quality control ofproducts
due to standardisation
GFA concession or bonus
Faster construction andshortened project duration
Overall (279)
Government/Clients (109)Contractor (66)
Supplier/Manufacturers (13)Consultants (63)
Institutions (28)
2.502.803.103.403.704.004.30
Commercial
Technical
RegulatorySocial
Supply chainOverall
Government and client
Contractor
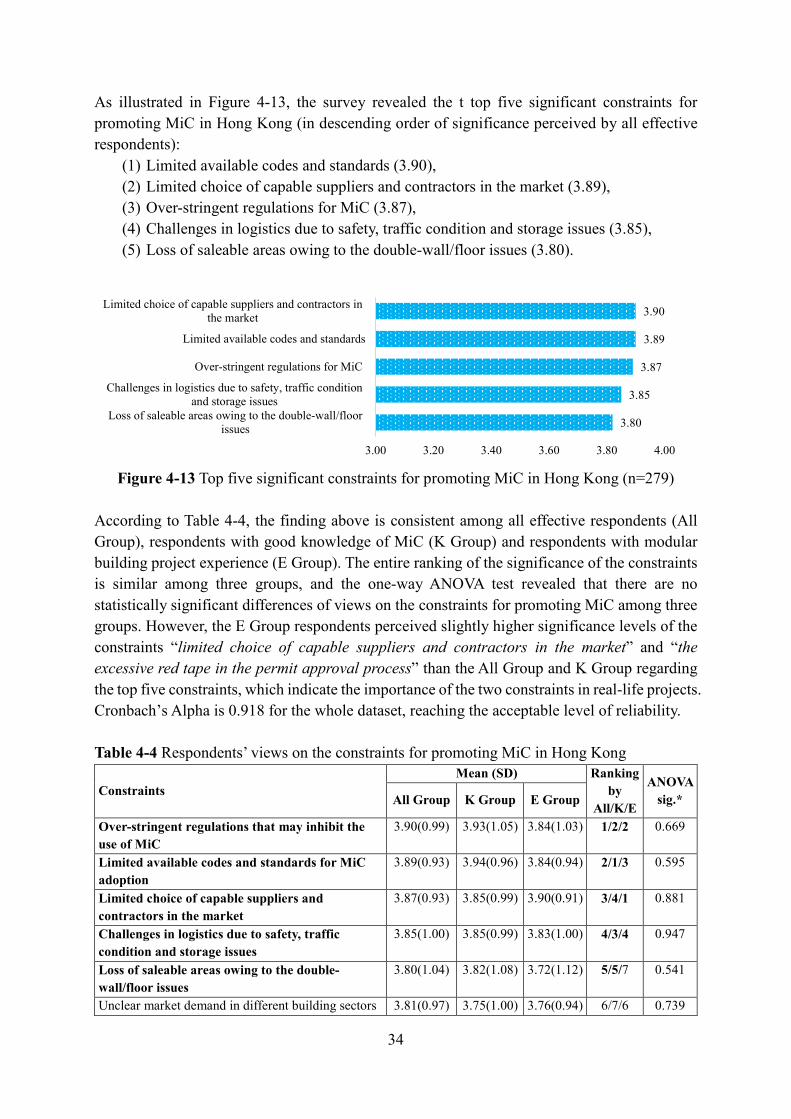
34
As illustrated in Figure 4-13, the survey revealed the t top five significant constraints for promoting MiC in Hong Kong (in descending order of significance perceived by all effective respondents):
(1) Limited available codes and standards (3.90), (2) Limited choice of capable suppliers and contractors in the market (3.89), (3) Over-stringent regulations for MiC (3.87), (4) Challenges in logistics due to safety, traffic condition and storage issues (3.85), (5) Loss of saleable areas owing to the double-wall/floor issues (3.80).
Figure 4-13 Top five significant constraints for promoting MiC in Hong Kong (n=279)
According to Table 4-4, the finding above is consistent among all effective respondents (All Group), respondents with good knowledge of MiC (K Group) and respondents with modular building project experience (E Group). The entire ranking of the significance of the constraints is similar among three groups, and the one-way ANOVA test revealed that there are no statistically significant differences of views on the constraints for promoting MiC among three groups. However, the E Group respondents perceived slightly higher significance levels of the constraints “limited choice of capable suppliers and contractors in the market” and “the excessive red tape in the permit approval process” than the All Group and K Group regarding the top five constraints, which indicate the importance of the two constraints in real-life projects. Cronbach’s Alpha is 0.918 for the whole dataset, reaching the acceptable level of reliability. Table 4-4 Respondents’ views on the constraints for promoting MiC in Hong Kong
Constraints Mean (SD) Ranking
by All/K/E
ANOVA sig.* All Group K Group E Group
Over-stringent regulations that may inhibit the use of MiC
3.90(0.99) 3.93(1.05) 3.84(1.03) 1/2/2 0.669
Limited available codes and standards for MiC adoption
3.89(0.93) 3.94(0.96) 3.84(0.94) 2/1/3 0.595
Limited choice of capable suppliers and contractors in the market
3.87(0.93) 3.85(0.99) 3.90(0.91) 3/4/1 0.881
Challenges in logistics due to safety, traffic condition and storage issues
3.85(1.00) 3.85(0.99) 3.83(1.00) 4/3/4 0.947
Loss of saleable areas owing to the double-wall/floor issues
3.80(1.04) 3.82(1.08) 3.72(1.12) 5/5/7 0.541
Unclear market demand in different building sectors 3.81(0.97) 3.75(1.00) 3.76(0.94) 6/7/6 0.739
3.80
3.85
3.87
3.89
3.90
3.00 3.20 3.40 3.60 3.80 4.00
Loss of saleable areas owing to the double-wall/floorissues
Challenges in logistics due to safety, traffic conditionand storage issues
Over-stringent regulations for MiC
Limited available codes and standards
Limited choice of capable suppliers and contractors inthe market
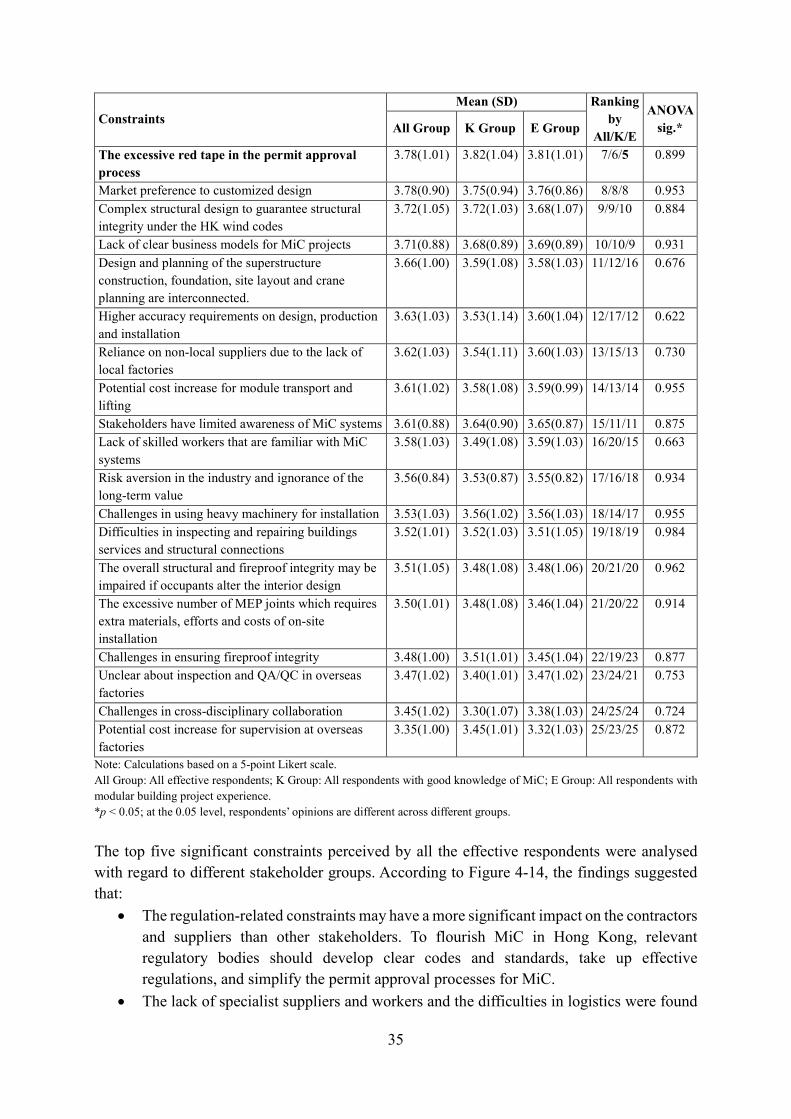
35
Constraints Mean (SD) Ranking
by All/K/E
ANOVA sig.* All Group K Group E Group
The excessive red tape in the permit approval process
3.78(1.01) 3.82(1.04) 3.81(1.01) 7/6/5 0.899
Market preference to customized design 3.78(0.90) 3.75(0.94) 3.76(0.86) 8/8/8 0.953 Complex structural design to guarantee structural integrity under the HK wind codes
3.72(1.05) 3.72(1.03) 3.68(1.07) 9/9/10 0.884
Lack of clear business models for MiC projects 3.71(0.88) 3.68(0.89) 3.69(0.89) 10/10/9 0.931 Design and planning of the superstructure construction, foundation, site layout and crane planning are interconnected.
3.66(1.00) 3.59(1.08) 3.58(1.03) 11/12/16 0.676
Higher accuracy requirements on design, production and installation
3.63(1.03) 3.53(1.14) 3.60(1.04) 12/17/12 0.622
Reliance on non-local suppliers due to the lack of local factories
3.62(1.03) 3.54(1.11) 3.60(1.03) 13/15/13 0.730
Potential cost increase for module transport and lifting
3.61(1.02) 3.58(1.08) 3.59(0.99) 14/13/14 0.955
Stakeholders have limited awareness of MiC systems 3.61(0.88) 3.64(0.90) 3.65(0.87) 15/11/11 0.875 Lack of skilled workers that are familiar with MiC systems
3.58(1.03) 3.49(1.08) 3.59(1.03) 16/20/15 0.663
Risk aversion in the industry and ignorance of the long-term value
3.56(0.84) 3.53(0.87) 3.55(0.82) 17/16/18 0.934
Challenges in using heavy machinery for installation 3.53(1.03) 3.56(1.02) 3.56(1.03) 18/14/17 0.955 Difficulties in inspecting and repairing buildings services and structural connections
3.52(1.01) 3.52(1.03) 3.51(1.05) 19/18/19 0.984
The overall structural and fireproof integrity may be impaired if occupants alter the interior design
3.51(1.05) 3.48(1.08) 3.48(1.06) 20/21/20 0.962
The excessive number of MEP joints which requires extra materials, efforts and costs of on-site installation
3.50(1.01) 3.48(1.08) 3.46(1.04) 21/20/22 0.914
Challenges in ensuring fireproof integrity 3.48(1.00) 3.51(1.01) 3.45(1.04) 22/19/23 0.877 Unclear about inspection and QA/QC in overseas factories
3.47(1.02) 3.40(1.01) 3.47(1.02) 23/24/21 0.753
Challenges in cross-disciplinary collaboration 3.45(1.02) 3.30(1.07) 3.38(1.03) 24/25/24 0.724 Potential cost increase for supervision at overseas factories
3.35(1.00) 3.45(1.01) 3.32(1.03) 25/23/25 0.872
Note: Calculations based on a 5-point Likert scale. All Group: All effective respondents; K Group: All respondents with good knowledge of MiC; E Group: All respondents with modular building project experience. *p < 0.05; at the 0.05 level, respondents’ opinions are different across different groups.
The top five significant constraints perceived by all the effective respondents were analysed with regard to different stakeholder groups. According to Figure 4-14, the findings suggested that:
• The regulation-related constraints may have a more significant impact on the contractors and suppliers than other stakeholders. To flourish MiC in Hong Kong, relevant regulatory bodies should develop clear codes and standards, take up effective regulations, and simplify the permit approval processes for MiC.
• The lack of specialist suppliers and workers and the difficulties in logistics were found
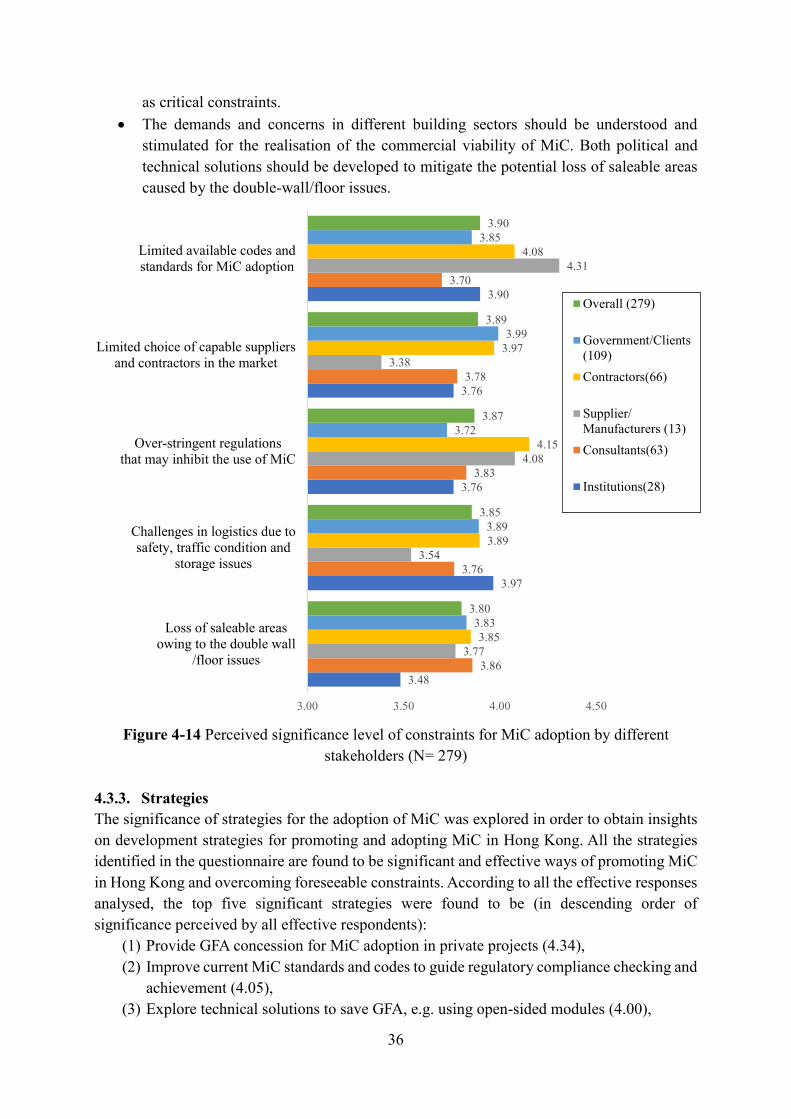
36
as critical constraints. • The demands and concerns in different building sectors should be understood and
stimulated for the realisation of the commercial viability of MiC. Both political and technical solutions should be developed to mitigate the potential loss of saleable areas caused by the double-wall/floor issues.
Figure 4-14 Perceived significance level of constraints for MiC adoption by different
stakeholders (N= 279) 4.3.3. Strategies The significance of strategies for the adoption of MiC was explored in order to obtain insights on development strategies for promoting and adopting MiC in Hong Kong. All the strategies identified in the questionnaire are found to be significant and effective ways of promoting MiC in Hong Kong and overcoming foreseeable constraints. According to all the effective responses analysed, the top five significant strategies were found to be (in descending order of significance perceived by all effective respondents):
(1) Provide GFA concession for MiC adoption in private projects (4.34), (2) Improve current MiC standards and codes to guide regulatory compliance checking and
achievement (4.05), (3) Explore technical solutions to save GFA, e.g. using open-sided modules (4.00),
3.48
3.97
3.76
3.76
3.90
3.86
3.76
3.83
3.78
3.70
3.77
3.54
4.08
3.38
4.31
3.85
3.89
4.15
3.97
4.08
3.83
3.89
3.72
3.99
3.85
3.80
3.85
3.87
3.89
3.90
3.00 3.50 4.00 4.50
Loss of saleable areasowing to the double wall
/floor issues
Challenges in logistics due tosafety, traffic condition and
storage issues
Over-stringent regulationsthat may inhibit the use of MiC
Limited choice of capable suppliersand contractors in the market
Limited available codes andstandards for MiC adoption
Overall (279)
Government/Clients(109)Contractors(66)
Supplier/Manufacturers (13)Consultants(63)
Institutions(28)
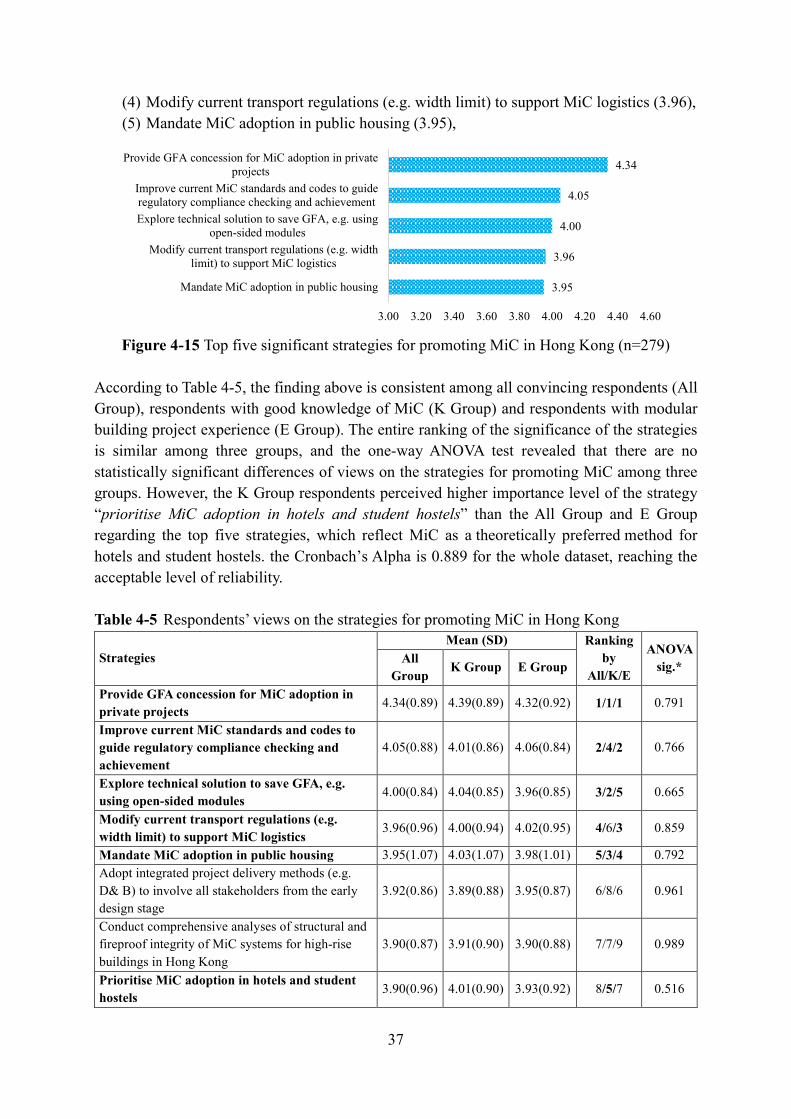
37
(4) Modify current transport regulations (e.g. width limit) to support MiC logistics (3.96), (5) Mandate MiC adoption in public housing (3.95),
Figure 4-15 Top five significant strategies for promoting MiC in Hong Kong (n=279)
According to Table 4-5, the finding above is consistent among all convincing respondents (All Group), respondents with good knowledge of MiC (K Group) and respondents with modular building project experience (E Group). The entire ranking of the significance of the strategies is similar among three groups, and the one-way ANOVA test revealed that there are no statistically significant differences of views on the strategies for promoting MiC among three groups. However, the K Group respondents perceived higher importance level of the strategy “prioritise MiC adoption in hotels and student hostels” than the All Group and E Group regarding the top five strategies, which reflect MiC as a theoretically preferred method for hotels and student hostels. the Cronbach’s Alpha is 0.889 for the whole dataset, reaching the acceptable level of reliability. Table 4-5 Respondents’ views on the strategies for promoting MiC in Hong Kong
Strategies Mean (SD) Ranking
by All/K/E
ANOVA sig.* All
Group K Group E Group
Provide GFA concession for MiC adoption in private projects
4.34(0.89) 4.39(0.89) 4.32(0.92) 1/1/1 0.791
Improve current MiC standards and codes to guide regulatory compliance checking and achievement
4.05(0.88) 4.01(0.86) 4.06(0.84) 2/4/2 0.766
Explore technical solution to save GFA, e.g. using open-sided modules
4.00(0.84) 4.04(0.85) 3.96(0.85) 3/2/5 0.665
Modify current transport regulations (e.g. width limit) to support MiC logistics
3.96(0.96) 4.00(0.94) 4.02(0.95) 4/6/3 0.859
Mandate MiC adoption in public housing 3.95(1.07) 4.03(1.07) 3.98(1.01) 5/3/4 0.792 Adopt integrated project delivery methods (e.g. D& B) to involve all stakeholders from the early design stage
3.92(0.86) 3.89(0.88) 3.95(0.87) 6/8/6 0.961
Conduct comprehensive analyses of structural and fireproof integrity of MiC systems for high-rise buildings in Hong Kong
3.90(0.87) 3.91(0.90) 3.90(0.88) 7/7/9 0.989
Prioritise MiC adoption in hotels and student hostels
3.90(0.96) 4.01(0.90) 3.93(0.92) 8/5/7 0.516
3.95
3.96
4.00
4.05
4.34
3.00 3.20 3.40 3.60 3.80 4.00 4.20 4.40 4.60
Mandate MiC adoption in public housing
Modify current transport regulations (e.g. widthlimit) to support MiC logistics
Explore technical solution to save GFA, e.g. usingopen-sided modules
Improve current MiC standards and codes to guideregulatory compliance checking and achievement
Provide GFA concession for MiC adoption in privateprojects
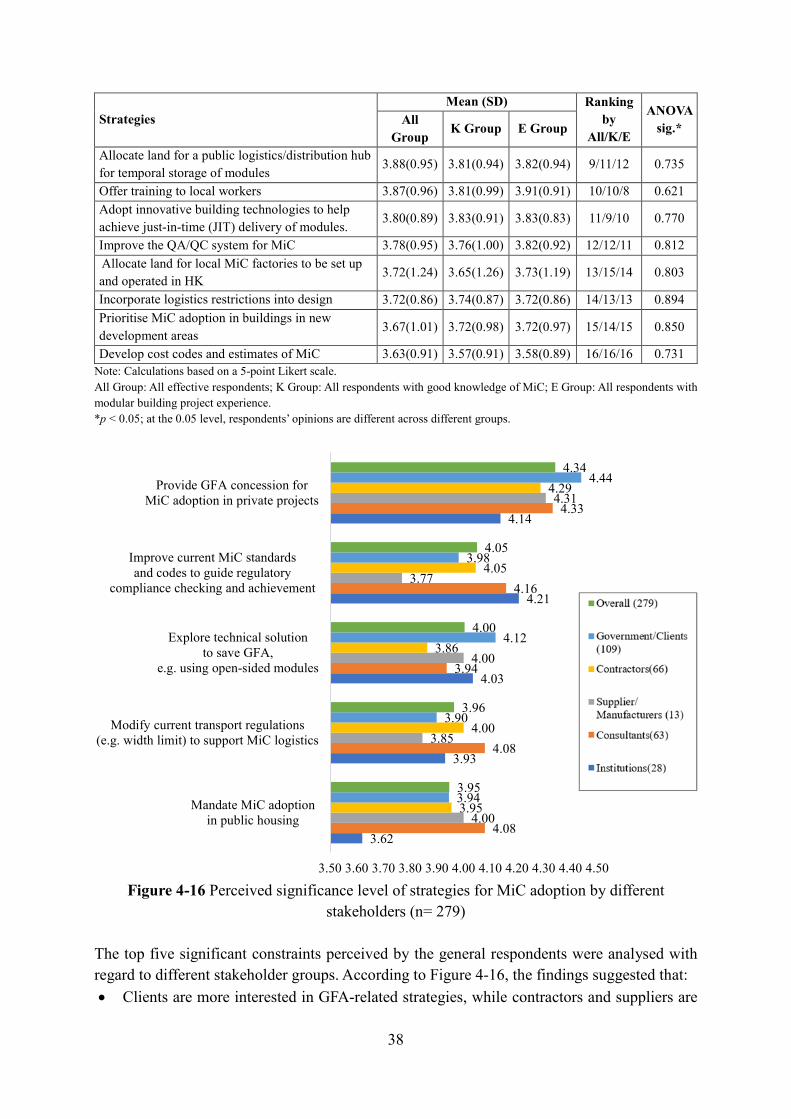
38
Strategies Mean (SD) Ranking
by All/K/E
ANOVA sig.* All
Group K Group E Group
Allocate land for a public logistics/distribution hub for temporal storage of modules
3.88(0.95) 3.81(0.94) 3.82(0.94) 9/11/12 0.735
Offer training to local workers 3.87(0.96) 3.81(0.99) 3.91(0.91) 10/10/8 0.621 Adopt innovative building technologies to help achieve just-in-time (JIT) delivery of modules.
3.80(0.89) 3.83(0.91) 3.83(0.83) 11/9/10 0.770
Improve the QA/QC system for MiC 3.78(0.95) 3.76(1.00) 3.82(0.92) 12/12/11 0.812 Allocate land for local MiC factories to be set up and operated in HK
3.72(1.24) 3.65(1.26) 3.73(1.19) 13/15/14 0.803
Incorporate logistics restrictions into design 3.72(0.86) 3.74(0.87) 3.72(0.86) 14/13/13 0.894 Prioritise MiC adoption in buildings in new development areas
3.67(1.01) 3.72(0.98) 3.72(0.97) 15/14/15 0.850
Develop cost codes and estimates of MiC 3.63(0.91) 3.57(0.91) 3.58(0.89) 16/16/16 0.731 Note: Calculations based on a 5-point Likert scale. All Group: All effective respondents; K Group: All respondents with good knowledge of MiC; E Group: All respondents with modular building project experience. *p < 0.05; at the 0.05 level, respondents’ opinions are different across different groups.
Figure 4-16 Perceived significance level of strategies for MiC adoption by different
stakeholders (n= 279) The top five significant constraints perceived by the general respondents were analysed with regard to different stakeholder groups. According to Figure 4-16, the findings suggested that: • Clients are more interested in GFA-related strategies, while contractors and suppliers are
3.62
3.93
4.03
4.21
4.14
4.08
4.08
3.94
4.16
4.33
4.00
3.85
4.00
3.77
4.31
3.95
4.00
3.86
4.05
4.29
3.94
3.90
4.12
3.98
4.44
3.95
3.96
4.00
4.05
4.34
3.50 3.60 3.70 3.80 3.90 4.00 4.10 4.20 4.30 4.40 4.50
Mandate MiC adoptionin public housing
Modify current transport regulations(e.g. width limit) to support MiC logistics
Explore technical solutionto save GFA,
e.g. using open-sided modules
Improve current MiC standardsand codes to guide regulatory
compliance checking and achievement
Provide GFA concession forMiC adoption in private projects
39
more interested in regulations and transport-related strategies. • To strategically encourage MiC adoption in different sectors, the results suggested to start
from mandating MiC adoption in the public housing sector and prioritising MiC adoption in hotel and hostel sectors. This could help to stimulate lead demand in the market and to speed up the development of MiC supply chains in Hong Kong. Nevertheless, MiC solution in public housing may need to be further studied for situations in Hong Kong, considering that various site constraints such as congested area and slope in development sites are the norms in public housing projects.
• The results further highlighted the importance of using integrated project delivery methods, ensuring early involvement of stakeholders and offering training to workers at the project level.
The overall results from the questionnaire survey were highly consistent with previous findings from the literature review, the case studies and the seminar. The results indicate that the market concerned the most about the commercial viability, political support and regulatory compliance issues in MiC adoption. Moreover, the views of the general respondents and the MiC expert respondents were highly consistent with regard to MiC suitability, system preference, drivers, constraints and strategies. Particularly, the experts highlighted to promote MiC in the public housing, hotel and student hostels sectors for better benefit achievements. Their views were in line with international experts of modular construction (e.g. Lawson et al., 2014), and should inform the Hong Kong government and industry to take relevant actions.
40
5. MiC Market Scenario Analysis This Chapter presents MiC market scenario analysis by first identifying key factors influencing the market demand, and then analysing market scenarios for different building sectors, and finally estimating sector-based market demand under scenarios. 5.1. Key influencing factors of market demand for MiC Several key influencing factors of market demand for MiC were identified through literature and document review and expert consultation, as well as the findings from the building sector analysis and the questionnaire survey as reported in preceding chapters. Specifically, we considered the following key influencing factors, i.e., government policy and regulation, supply capacity, availability of professionals, market awareness, application of smart technologies, labour situation, disruptive events, as explained below. • Government policy and regulation for MiC promotion and adoption. According to the
results of the questionnaire survey, there is a pressing need for clear guideline, policy and incentives for MiC adoption together with solutions to address the severe ‘red tape’ with relation to the approval procedures. Besides, the government as the main client should encourage MiC in government procured projects.
• Supply capacity refers to the maximum production capacity of all the manufacturers and suppliers that are available for the Hong Kong MiC market. Constrained supply capacity will negatively affect MiC projects’ supply chain performance, particularly in terms of efficiency and productivity. Besides, the size of the future MiC market could be limited if the supply capacity could match the rising demand for MiC (Bertram et al., 2019).
• Availability of professionals such as experienced contractors in MiC could effectively increase the chances of project success. In turn, the accumulation of empirical experience of real-world MiC projects can effectively improve the professional level of practitioners. By contrast, the lack of professionals will increase the business risks of the clients and developers, decreasing their demand for MiC.
• Market awareness reflects how much the building market understand the benefits from adopting MiC, particularly in terms of time, cost, quality, safety and sustainability. Benchmarking and demonstration of pilot MiC projects could lead to good market awareness, thus increasing the demand for MiC (Pan et al., 2019).
• Smart technologies, such as Internet of Things (IoT) and robotics, could effectively enhance the performance of MiC project (Yang et al. 2019). For example, the use of IoT proved helpful to assist project teams in supply chain planning and coordination (Zhang et al., 2020). The advancement of smart technologies could further accelerate MiC project delivery, possibly leading to fast growth of MiC demand.
• Labour situation in terms of age structure of the workforce, shortage of skilled labour, education and training. The Hong Kong construction industry suffers from a significant ageing labour problem and increasing labour cost, which may raise the preference of MiC that can minimise on-site workforce requirement.
• Disruptive events such as the Covid-19 that generate special demand for temporary facilities which could be quickly delivered by MiC, e.g. MiC quarantine centres in response to the epidemic (Chief Executive, 2020).
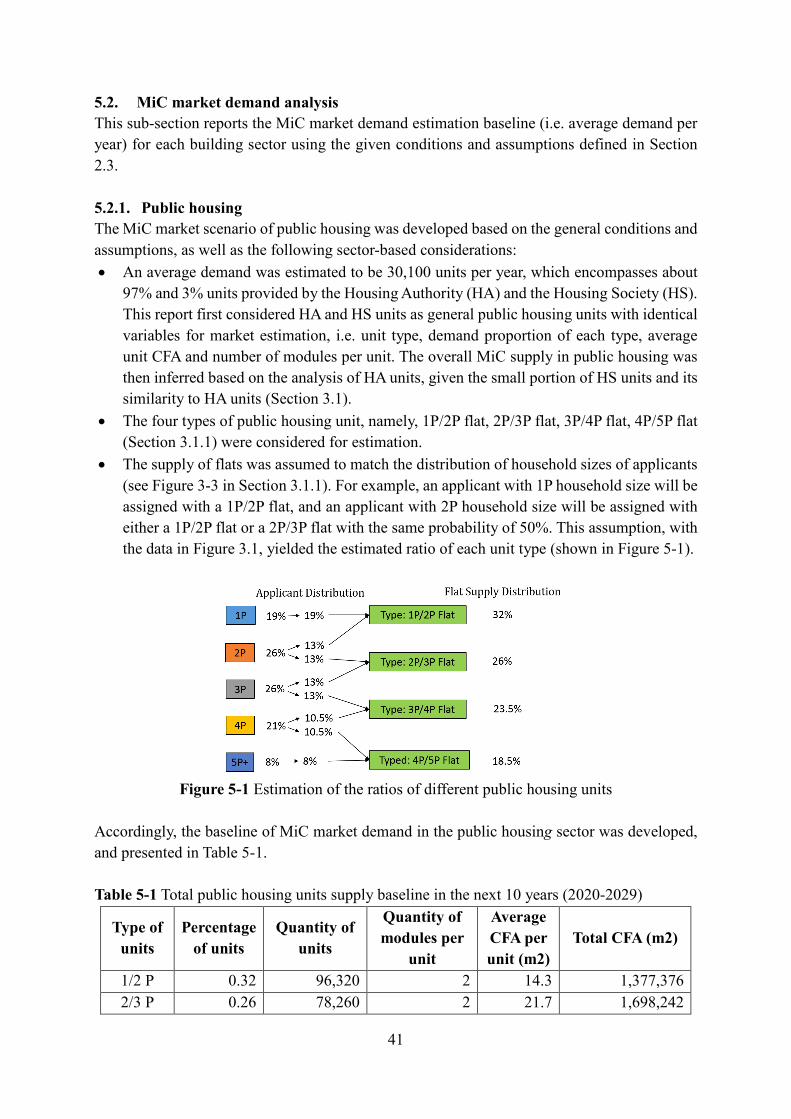
41
5.2. MiC market demand analysis This sub-section reports the MiC market demand estimation baseline (i.e. average demand per year) for each building sector using the given conditions and assumptions defined in Section 2.3. 5.2.1. Public housing The MiC market scenario of public housing was developed based on the general conditions and assumptions, as well as the following sector-based considerations: • An average demand was estimated to be 30,100 units per year, which encompasses about
97% and 3% units provided by the Housing Authority (HA) and the Housing Society (HS). This report first considered HA and HS units as general public housing units with identical variables for market estimation, i.e. unit type, demand proportion of each type, average unit CFA and number of modules per unit. The overall MiC supply in public housing was then inferred based on the analysis of HA units, given the small portion of HS units and its similarity to HA units (Section 3.1).
• The four types of public housing unit, namely, 1P/2P flat, 2P/3P flat, 3P/4P flat, 4P/5P flat (Section 3.1.1) were considered for estimation.
• The supply of flats was assumed to match the distribution of household sizes of applicants (see Figure 3-3 in Section 3.1.1). For example, an applicant with 1P household size will be assigned with a 1P/2P flat, and an applicant with 2P household size will be assigned with either a 1P/2P flat or a 2P/3P flat with the same probability of 50%. This assumption, with the data in Figure 3.1, yielded the estimated ratio of each unit type (shown in Figure 5-1).
Figure 5-1 Estimation of the ratios of different public housing units
Accordingly, the baseline of MiC market demand in the public housing sector was developed, and presented in Table 5-1. Table 5-1 Total public housing units supply baseline in the next 10 years (2020-2029)
Type of units
Percentage of units
Quantity of units
Quantity of modules per
unit
Average CFA per unit (m2)
Total CFA (m2)
1/2 P 0.32 96,320 2 14.3 1,377,376 2/3 P 0.26 78,260 2 21.7 1,698,242
42
3/4 P 0.235 70,735 3 30.6 2,164,491 4/5 P 0.185 55,685 4 35.5 1,976,818 Total 1 301,000 - 7,216,927
5.2.2. Private residential buildings The MiC market scenario of private residential buildings was developed based on the general conditions and assumptions as well as the following sector-based considerations: • In order to generate the total estimate for the cohort of 12,900 private housing units per
year, the calculation first considered the two main types of units, namely, Class A units (i.e. with a salable area smaller than 40m2) and Class B units (i.e. with a salable area of 40 to 69.9 m2), and then considered Class C+ as a third type of unit that covers Class C, D and E (i.e. units with a salable area above 69.9 m2).
• The demand ratio of Class A (35%), Class B (39%) and Class C+ (26%, including 16% of Class C, 7% of Class D and 3% of Class E) was determined using their ratios shown in Figure 3-6.
• The estimation for Class A and B units was made based on the modular layouts proposed in Section 3.2.2.
• The estimation for Class C+ units first assumed each unit of Class C, D and E to have average CFA of 85, 130, 180 m2, and have 6, 8, 10 modules, respectively. The CFA and number of modules for Class C+ units were then inferred using weighted average with the given demand ratios.
Accordingly, the baseline of MiC market demand was developed, and presented in Table 5-2. Table 5-2 Total private housing units supply in the next 10 years (2020-2029)
Type of units
Percentage of units
Quantity of units
Quantity of modules per
unit
Average CFA per unit (m2)
Total CFA (m2)
Class A 0.35 45,150 2 30.0 1,354,500 Class B 0.39 50,310 3 55.0 2,767,050 Class C+ 0.26 33,540 5 108 3,622,320 Total 1 129,000 7,743,870
5.2.3. Hotel The MiC market scenario of hotels was developed based on the general conditions and assumptions as well as the following sector-based considerations: • It was assumed that one hotel room to be made of one module with an average CFA of
20m2. • An average demand was estimated to be 1,650 hotel rooms per year.
The baseline of MiC market demand in the hotel sector was then identified (Table 5-3).
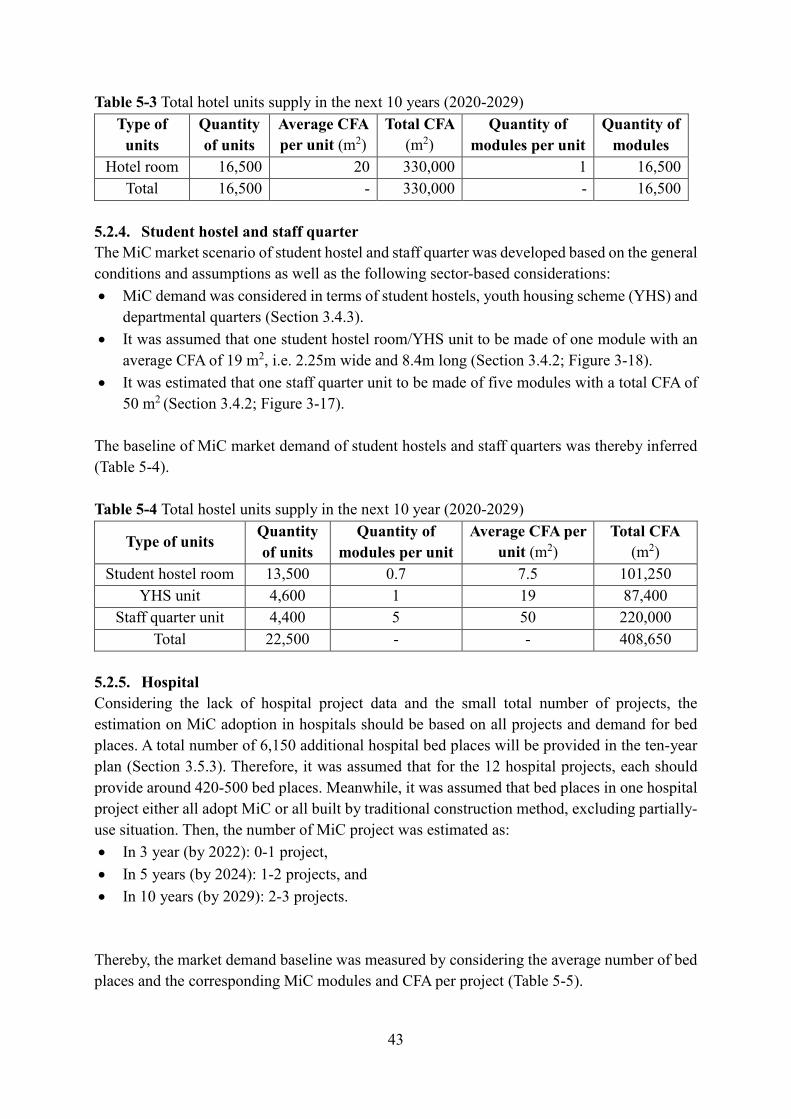
43
Table 5-3 Total hotel units supply in the next 10 years (2020-2029) Type of
units Quantity of units
Average CFA per unit (m2)
Total CFA (m2)
Quantity of modules per unit
Quantity of modules
Hotel room 16,500 20 330,000 1 16,500 Total 16,500 - 330,000 - 16,500
5.2.4. Student hostel and staff quarter The MiC market scenario of student hostel and staff quarter was developed based on the general conditions and assumptions as well as the following sector-based considerations: • MiC demand was considered in terms of student hostels, youth housing scheme (YHS) and
departmental quarters (Section 3.4.3). • It was assumed that one student hostel room/YHS unit to be made of one module with an
average CFA of 19 m2, i.e. 2.25m wide and 8.4m long (Section 3.4.2; Figure 3-18). • It was estimated that one staff quarter unit to be made of five modules with a total CFA of
50 m2 (Section 3.4.2; Figure 3-17).
The baseline of MiC market demand of student hostels and staff quarters was thereby inferred (Table 5-4). Table 5-4 Total hostel units supply in the next 10 year (2020-2029)
Type of units Quantity of units
Quantity of modules per unit
Average CFA per unit (m2)
Total CFA (m2)
Student hostel room 13,500 0.7 7.5 101,250 YHS unit 4,600 1 19 87,400
Staff quarter unit 4,400 5 50 220,000 Total 22,500 - - 408,650
5.2.5. Hospital Considering the lack of hospital project data and the small total number of projects, the estimation on MiC adoption in hospitals should be based on all projects and demand for bed places. A total number of 6,150 additional hospital bed places will be provided in the ten-year plan (Section 3.5.3). Therefore, it was assumed that for the 12 hospital projects, each should provide around 420-500 bed places. Meanwhile, it was assumed that bed places in one hospital project either all adopt MiC or all built by traditional construction method, excluding partially-use situation. Then, the number of MiC project was estimated as: • In 3 year (by 2022): 0-1 project, • In 5 years (by 2024): 1-2 projects, and • In 10 years (by 2029): 2-3 projects.
Thereby, the market demand baseline was measured by considering the average number of bed places and the corresponding MiC modules and CFA per project (Table 5-5).
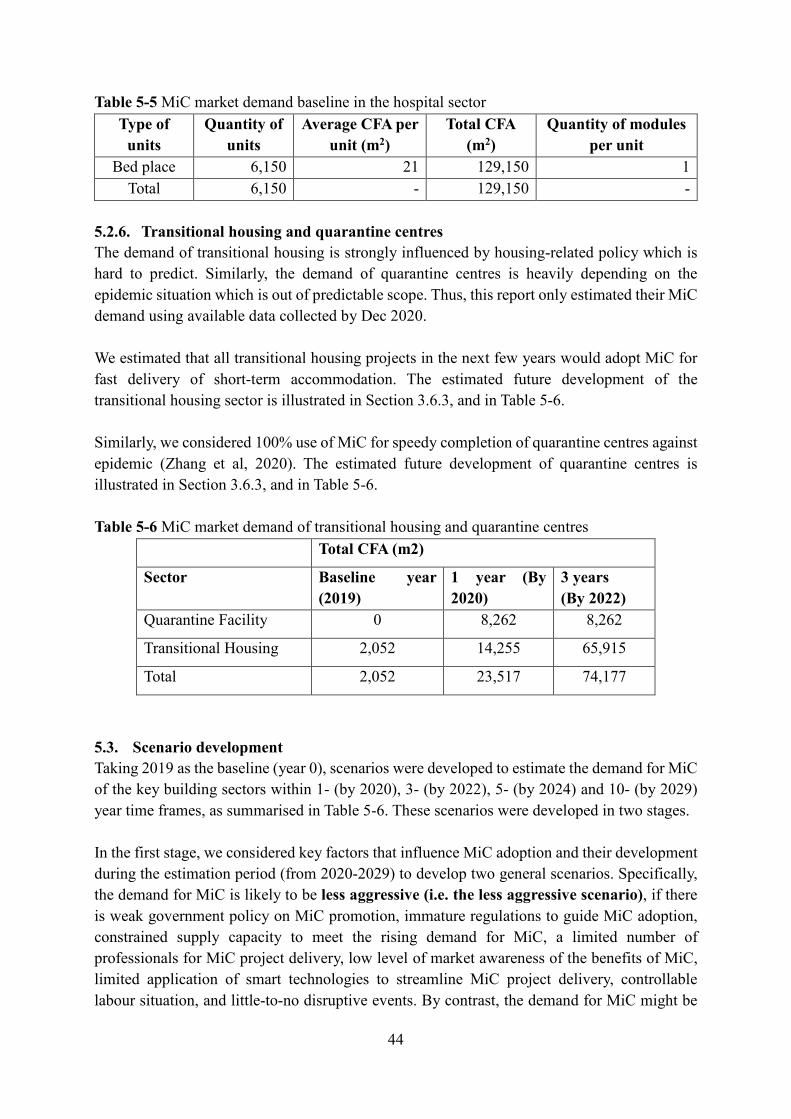
44
Table 5-5 MiC market demand baseline in the hospital sector Type of
units Quantity of
units Average CFA per
unit (m2) Total CFA
(m2) Quantity of modules
per unit Bed place 6,150 21 129,150 1
Total 6,150 - 129,150 - 5.2.6. Transitional housing and quarantine centres The demand of transitional housing is strongly influenced by housing-related policy which is hard to predict. Similarly, the demand of quarantine centres is heavily depending on the epidemic situation which is out of predictable scope. Thus, this report only estimated their MiC demand using available data collected by Dec 2020. We estimated that all transitional housing projects in the next few years would adopt MiC for fast delivery of short-term accommodation. The estimated future development of the transitional housing sector is illustrated in Section 3.6.3, and in Table 5-6. Similarly, we considered 100% use of MiC for speedy completion of quarantine centres against epidemic (Zhang et al, 2020). The estimated future development of quarantine centres is illustrated in Section 3.6.3, and in Table 5-6. Table 5-6 MiC market demand of transitional housing and quarantine centres
Total CFA (m2)
Sector Baseline year (2019)
1 year (By 2020)
3 years (By 2022)
Quarantine Facility 0 8,262 8,262
Transitional Housing 2,052 14,255 65,915
Total 2,052 23,517 74,177
5.3. Scenario development Taking 2019 as the baseline (year 0), scenarios were developed to estimate the demand for MiC of the key building sectors within 1- (by 2020), 3- (by 2022), 5- (by 2024) and 10- (by 2029) year time frames, as summarised in Table 5-6. These scenarios were developed in two stages. In the first stage, we considered key factors that influence MiC adoption and their development during the estimation period (from 2020-2029) to develop two general scenarios. Specifically, the demand for MiC is likely to be less aggressive (i.e. the less aggressive scenario), if there is weak government policy on MiC promotion, immature regulations to guide MiC adoption, constrained supply capacity to meet the rising demand for MiC, a limited number of professionals for MiC project delivery, low level of market awareness of the benefits of MiC, limited application of smart technologies to streamline MiC project delivery, controllable labour situation, and little-to-no disruptive events. By contrast, the demand for MiC might be
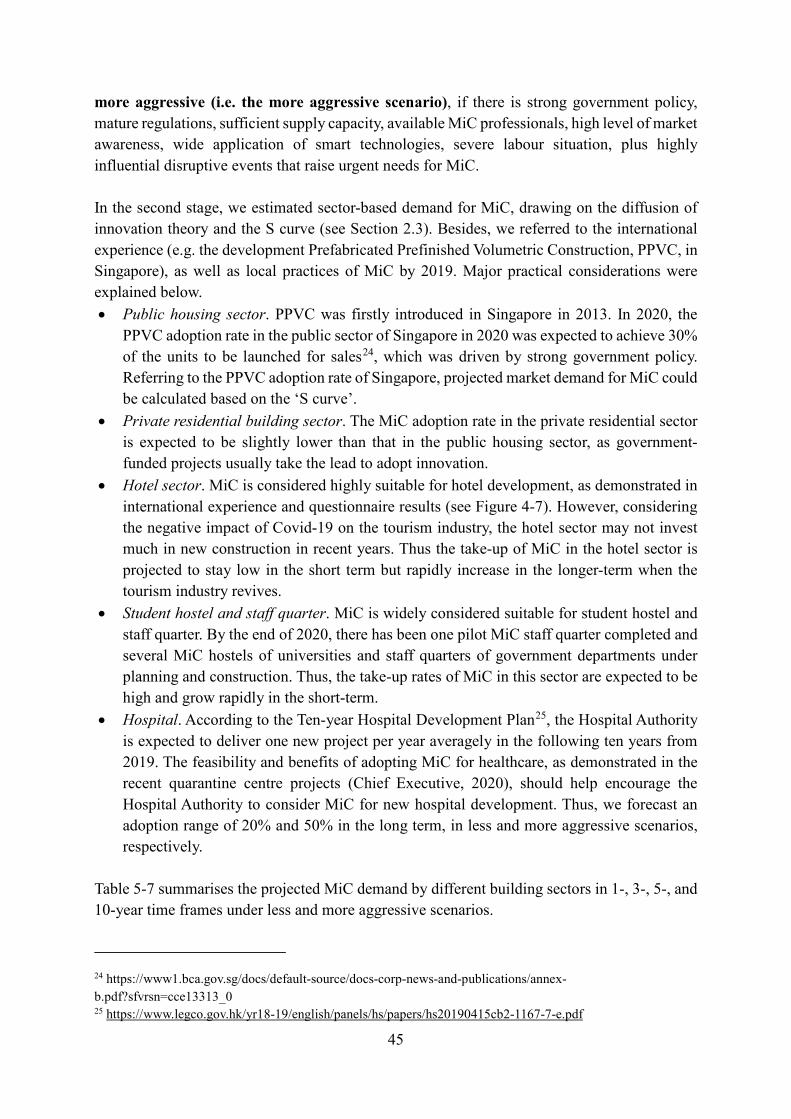
45
more aggressive (i.e. the more aggressive scenario), if there is strong government policy, mature regulations, sufficient supply capacity, available MiC professionals, high level of market awareness, wide application of smart technologies, severe labour situation, plus highly influential disruptive events that raise urgent needs for MiC. In the second stage, we estimated sector-based demand for MiC, drawing on the diffusion of innovation theory and the S curve (see Section 2.3). Besides, we referred to the international experience (e.g. the development Prefabricated Prefinished Volumetric Construction, PPVC, in Singapore), as well as local practices of MiC by 2019. Major practical considerations were explained below. • Public housing sector. PPVC was firstly introduced in Singapore in 2013. In 2020, the
PPVC adoption rate in the public sector of Singapore in 2020 was expected to achieve 30% of the units to be launched for sales24, which was driven by strong government policy. Referring to the PPVC adoption rate of Singapore, projected market demand for MiC could be calculated based on the ‘S curve’.
• Private residential building sector. The MiC adoption rate in the private residential sector is expected to be slightly lower than that in the public housing sector, as government-funded projects usually take the lead to adopt innovation.
• Hotel sector. MiC is considered highly suitable for hotel development, as demonstrated in international experience and questionnaire results (see Figure 4-7). However, considering the negative impact of Covid-19 on the tourism industry, the hotel sector may not invest much in new construction in recent years. Thus the take-up of MiC in the hotel sector is projected to stay low in the short term but rapidly increase in the longer-term when the tourism industry revives.
• Student hostel and staff quarter. MiC is widely considered suitable for student hostel and staff quarter. By the end of 2020, there has been one pilot MiC staff quarter completed and several MiC hostels of universities and staff quarters of government departments under planning and construction. Thus, the take-up rates of MiC in this sector are expected to be high and grow rapidly in the short-term.
• Hospital. According to the Ten-year Hospital Development Plan25, the Hospital Authority is expected to deliver one new project per year averagely in the following ten years from 2019. The feasibility and benefits of adopting MiC for healthcare, as demonstrated in the recent quarantine centre projects (Chief Executive, 2020), should help encourage the Hospital Authority to consider MiC for new hospital development. Thus, we forecast an adoption range of 20% and 50% in the long term, in less and more aggressive scenarios, respectively.
Table 5-7 summarises the projected MiC demand by different building sectors in 1-, 3-, 5-, and 10-year time frames under less and more aggressive scenarios.
24 https://www1.bca.gov.sg/docs/default-source/docs-corp-news-and-publications/annex-b.pdf?sfvrsn=cce13313_0 25 https://www.legco.gov.hk/yr18-19/english/panels/hs/papers/hs20190415cb2-1167-7-e.pdf
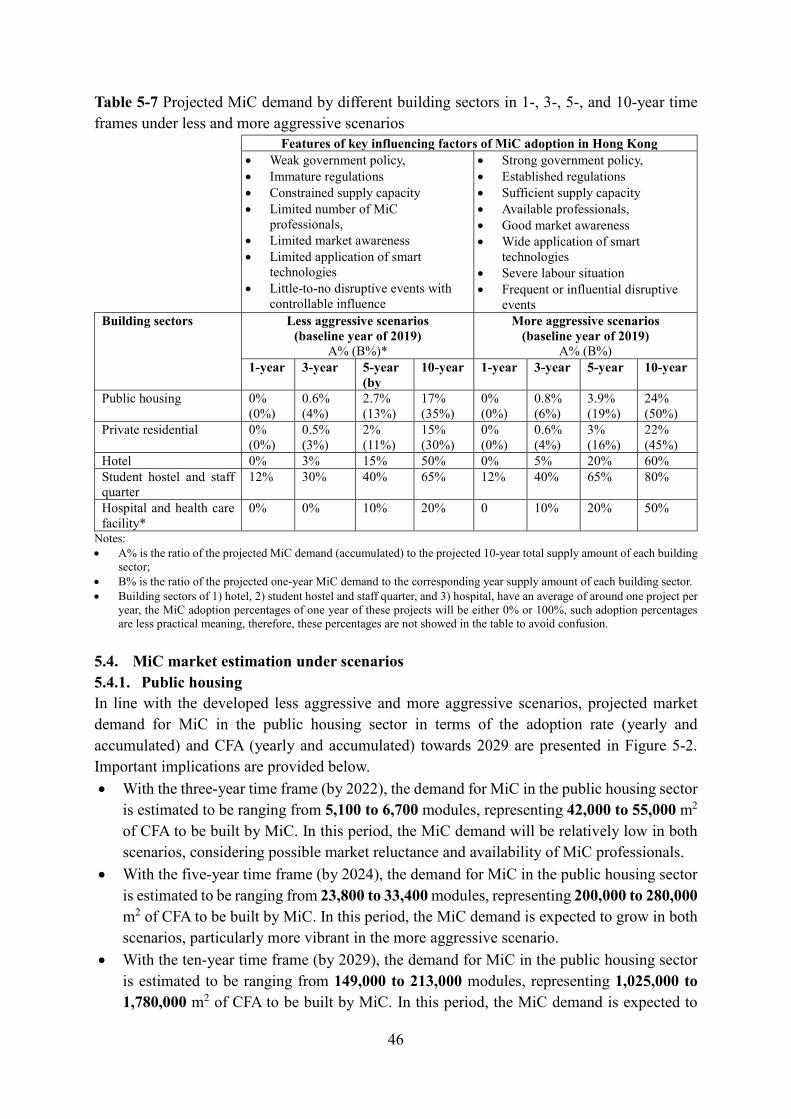
46
Table 5-7 Projected MiC demand by different building sectors in 1-, 3-, 5-, and 10-year time frames under less and more aggressive scenarios
Features of key influencing factors of MiC adoption in Hong Kong • Weak government policy,
• Immature regulations • Constrained supply capacity • Limited number of MiC
professionals, • Limited market awareness • Limited application of smart
technologies • Little-to-no disruptive events with
controllable influence
• Strong government policy, • Established regulations • Sufficient supply capacity • Available professionals, • Good market awareness • Wide application of smart
technologies • Severe labour situation • Frequent or influential disruptive
events Building sectors Less aggressive scenarios
(baseline year of 2019) A% (B%)*
More aggressive scenarios (baseline year of 2019)
A% (B%) 1-year 3-year 5-year
(by 10-year 1-year 3-year 5-year 10-year
Public housing 0%
(0%) 0.6% (4%)
2.7% (13%)
17% (35%)
0% (0%)
0.8% (6%)
3.9% (19%)
24% (50%)
Private residential 0% (0%)
0.5% (3%)
2% (11%)
15% (30%)
0% (0%)
0.6% (4%)
3% (16%)
22% (45%)
Hotel 0% 3% 15% 50% 0% 5% 20% 60% Student hostel and staff quarter
12% 30% 40% 65% 12% 40% 65% 80%
Hospital and health care facility*
0% 0% 10% 20% 0 10% 20% 50%
Notes: • A% is the ratio of the projected MiC demand (accumulated) to the projected 10-year total supply amount of each building
sector; • B% is the ratio of the projected one-year MiC demand to the corresponding year supply amount of each building sector. • Building sectors of 1) hotel, 2) student hostel and staff quarter, and 3) hospital, have an average of around one project per
year, the MiC adoption percentages of one year of these projects will be either 0% or 100%, such adoption percentages are less practical meaning, therefore, these percentages are not showed in the table to avoid confusion.
5.4. MiC market estimation under scenarios 5.4.1. Public housing In line with the developed less aggressive and more aggressive scenarios, projected market demand for MiC in the public housing sector in terms of the adoption rate (yearly and accumulated) and CFA (yearly and accumulated) towards 2029 are presented in Figure 5-2. Important implications are provided below. • With the three-year time frame (by 2022), the demand for MiC in the public housing sector
is estimated to be ranging from 5,100 to 6,700 modules, representing 42,000 to 55,000 m2 of CFA to be built by MiC. In this period, the MiC demand will be relatively low in both scenarios, considering possible market reluctance and availability of MiC professionals.
• With the five-year time frame (by 2024), the demand for MiC in the public housing sector is estimated to be ranging from 23,800 to 33,400 modules, representing 200,000 to 280,000 m2 of CFA to be built by MiC. In this period, the MiC demand is expected to grow in both scenarios, particularly more vibrant in the more aggressive scenario.
• With the ten-year time frame (by 2029), the demand for MiC in the public housing sector is estimated to be ranging from 149,000 to 213,000 modules, representing 1,025,000 to 1,780,000 m2 of CFA to be built by MiC. In this period, the MiC demand is expected to
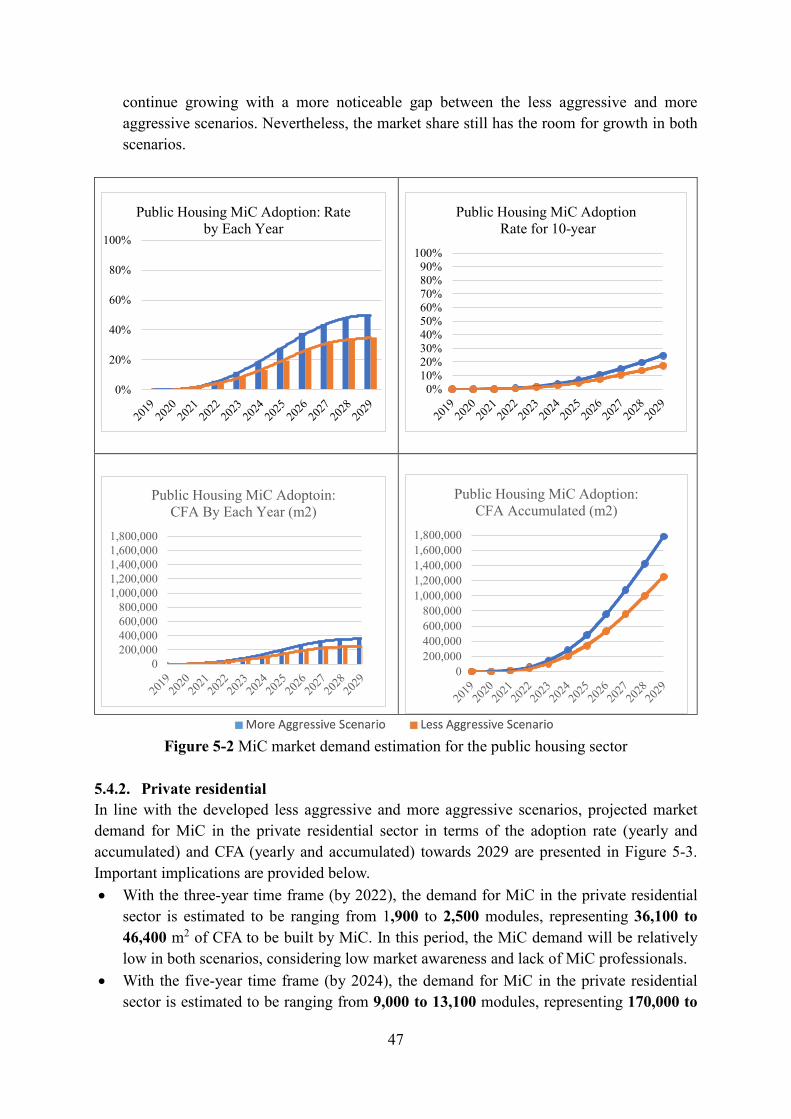
47
continue growing with a more noticeable gap between the less aggressive and more aggressive scenarios. Nevertheless, the market share still has the room for growth in both scenarios.
Figure 5-2 MiC market demand estimation for the public housing sector
5.4.2. Private residential In line with the developed less aggressive and more aggressive scenarios, projected market demand for MiC in the private residential sector in terms of the adoption rate (yearly and accumulated) and CFA (yearly and accumulated) towards 2029 are presented in Figure 5-3. Important implications are provided below. • With the three-year time frame (by 2022), the demand for MiC in the private residential
sector is estimated to be ranging from 1,900 to 2,500 modules, representing 36,100 to 46,400 m2 of CFA to be built by MiC. In this period, the MiC demand will be relatively low in both scenarios, considering low market awareness and lack of MiC professionals.
• With the five-year time frame (by 2024), the demand for MiC in the private residential sector is estimated to be ranging from 9,000 to 13,100 modules, representing 170,000 to
0%
20%
40%
60%
80%
100%
Public Housing MiC Adoption: Rate by Each Year
0%10%20%30%40%50%60%70%80%90%
100%
Public Housing MiC AdoptionRate for 10-year
0200,000400,000600,000800,000
1,000,0001,200,0001,400,0001,600,0001,800,000
Public Housing MiC Adoptoin:CFA By Each Year (m2)
0200,000400,000600,000800,000
1,000,0001,200,0001,400,0001,600,0001,800,000
Public Housing MiC Adoption:CFA Accumulated (m2)
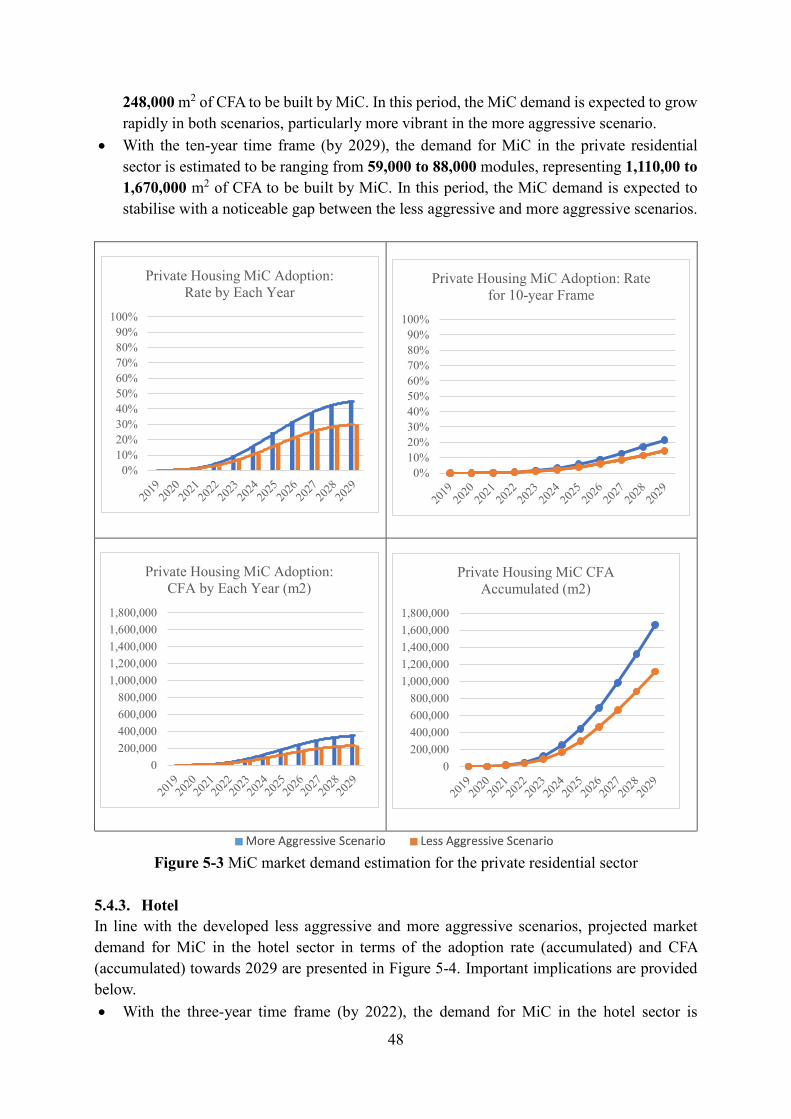
48
248,000 m2 of CFA to be built by MiC. In this period, the MiC demand is expected to grow rapidly in both scenarios, particularly more vibrant in the more aggressive scenario.
• With the ten-year time frame (by 2029), the demand for MiC in the private residential sector is estimated to be ranging from 59,000 to 88,000 modules, representing 1,110,00 to 1,670,000 m2 of CFA to be built by MiC. In this period, the MiC demand is expected to stabilise with a noticeable gap between the less aggressive and more aggressive scenarios.
Figure 5-3 MiC market demand estimation for the private residential sector 5.4.3. Hotel In line with the developed less aggressive and more aggressive scenarios, projected market demand for MiC in the hotel sector in terms of the adoption rate (accumulated) and CFA (accumulated) towards 2029 are presented in Figure 5-4. Important implications are provided below. • With the three-year time frame (by 2022), the demand for MiC in the hotel sector is
0%10%20%30%40%50%60%70%80%90%
100%
Private Housing MiC Adoption: Rate by Each Year
0%10%20%30%40%50%60%70%80%90%
100%
Private Housing MiC Adoption: Rate for 10-year Frame
0200,000400,000600,000800,000
1,000,0001,200,0001,400,0001,600,0001,800,000
Private Housing MiC Adoption:CFA by Each Year (m2)
0200,000400,000600,000800,000
1,000,0001,200,0001,400,0001,600,0001,800,000
Private Housing MiC CFA Accumulated (m2)
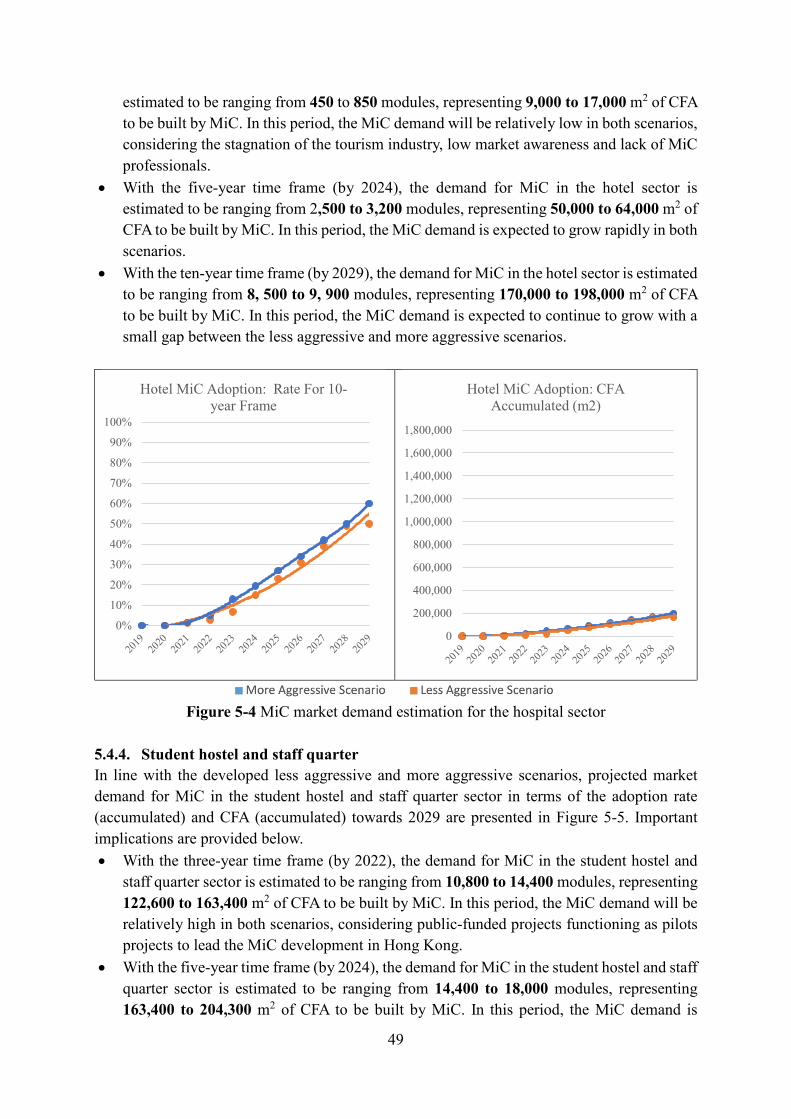
49
estimated to be ranging from 450 to 850 modules, representing 9,000 to 17,000 m2 of CFA to be built by MiC. In this period, the MiC demand will be relatively low in both scenarios, considering the stagnation of the tourism industry, low market awareness and lack of MiC professionals.
• With the five-year time frame (by 2024), the demand for MiC in the hotel sector is estimated to be ranging from 2,500 to 3,200 modules, representing 50,000 to 64,000 m2 of CFA to be built by MiC. In this period, the MiC demand is expected to grow rapidly in both scenarios.
• With the ten-year time frame (by 2029), the demand for MiC in the hotel sector is estimated to be ranging from 8, 500 to 9, 900 modules, representing 170,000 to 198,000 m2 of CFA to be built by MiC. In this period, the MiC demand is expected to continue to grow with a small gap between the less aggressive and more aggressive scenarios.
Figure 5-4 MiC market demand estimation for the hospital sector 5.4.4. Student hostel and staff quarter In line with the developed less aggressive and more aggressive scenarios, projected market demand for MiC in the student hostel and staff quarter sector in terms of the adoption rate (accumulated) and CFA (accumulated) towards 2029 are presented in Figure 5-5. Important implications are provided below. • With the three-year time frame (by 2022), the demand for MiC in the student hostel and
staff quarter sector is estimated to be ranging from 10,800 to 14,400 modules, representing 122,600 to 163,400 m2 of CFA to be built by MiC. In this period, the MiC demand will be relatively high in both scenarios, considering public-funded projects functioning as pilots projects to lead the MiC development in Hong Kong.
• With the five-year time frame (by 2024), the demand for MiC in the student hostel and staff quarter sector is estimated to be ranging from 14,400 to 18,000 modules, representing 163,400 to 204,300 m2 of CFA to be built by MiC. In this period, the MiC demand is
0%
10%
20%
30%
40%
50%
60%
70%
80%
90%
100%
Hotel MiC Adoption: Rate For 10-year Frame
0
200,000
400,000
600,000
800,000
1,000,000
1,200,000
1,400,000
1,600,000
1,800,000
Hotel MiC Adoption: CFA Accumulated (m2)
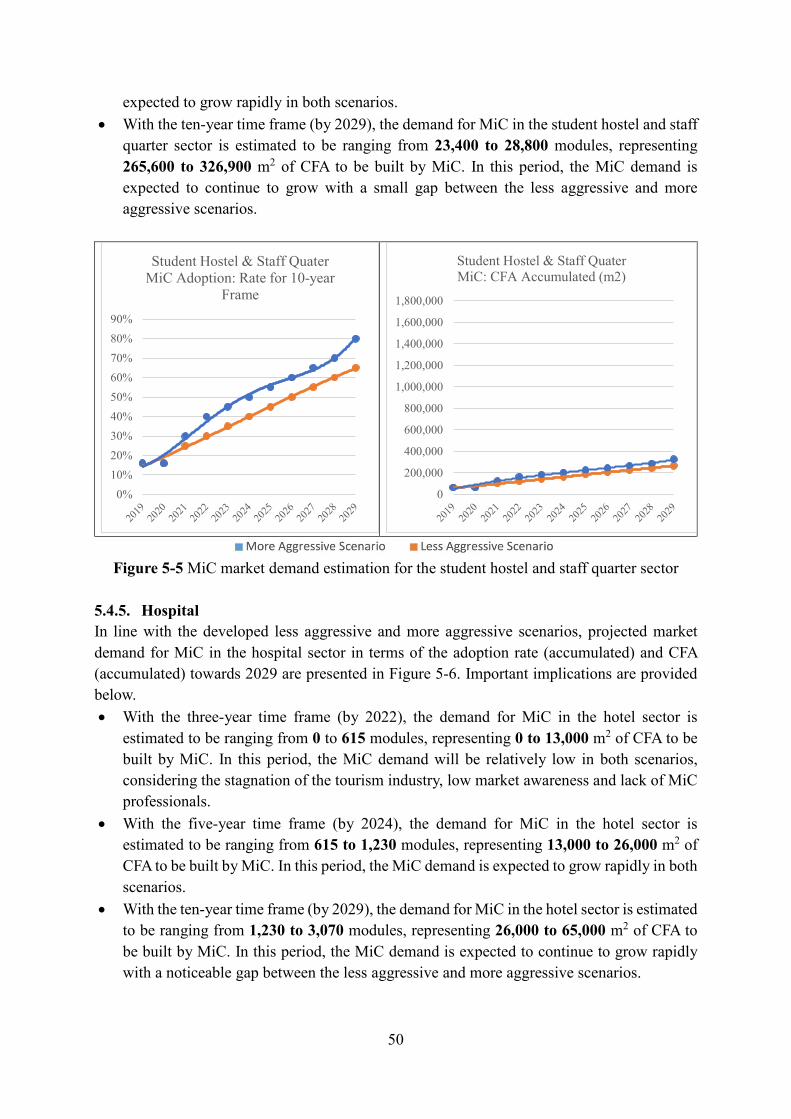
50
expected to grow rapidly in both scenarios. • With the ten-year time frame (by 2029), the demand for MiC in the student hostel and staff
quarter sector is estimated to be ranging from 23,400 to 28,800 modules, representing 265,600 to 326,900 m2 of CFA to be built by MiC. In this period, the MiC demand is expected to continue to grow with a small gap between the less aggressive and more aggressive scenarios.
Figure 5-5 MiC market demand estimation for the student hostel and staff quarter sector 5.4.5. Hospital In line with the developed less aggressive and more aggressive scenarios, projected market demand for MiC in the hospital sector in terms of the adoption rate (accumulated) and CFA (accumulated) towards 2029 are presented in Figure 5-6. Important implications are provided below. • With the three-year time frame (by 2022), the demand for MiC in the hotel sector is
estimated to be ranging from 0 to 615 modules, representing 0 to 13,000 m2 of CFA to be built by MiC. In this period, the MiC demand will be relatively low in both scenarios, considering the stagnation of the tourism industry, low market awareness and lack of MiC professionals.
• With the five-year time frame (by 2024), the demand for MiC in the hotel sector is estimated to be ranging from 615 to 1,230 modules, representing 13,000 to 26,000 m2 of CFA to be built by MiC. In this period, the MiC demand is expected to grow rapidly in both scenarios.
• With the ten-year time frame (by 2029), the demand for MiC in the hotel sector is estimated to be ranging from 1,230 to 3,070 modules, representing 26,000 to 65,000 m2 of CFA to be built by MiC. In this period, the MiC demand is expected to continue to grow rapidly with a noticeable gap between the less aggressive and more aggressive scenarios.
0%10%20%30%40%50%60%70%80%90%
Student Hostel & Staff QuaterMiC Adoption: Rate for 10-year
Frame
0
200,000
400,000
600,000
800,000
1,000,000
1,200,000
1,400,000
1,600,000
1,800,000
Student Hostel & Staff QuaterMiC: CFA Accumulated (m2)
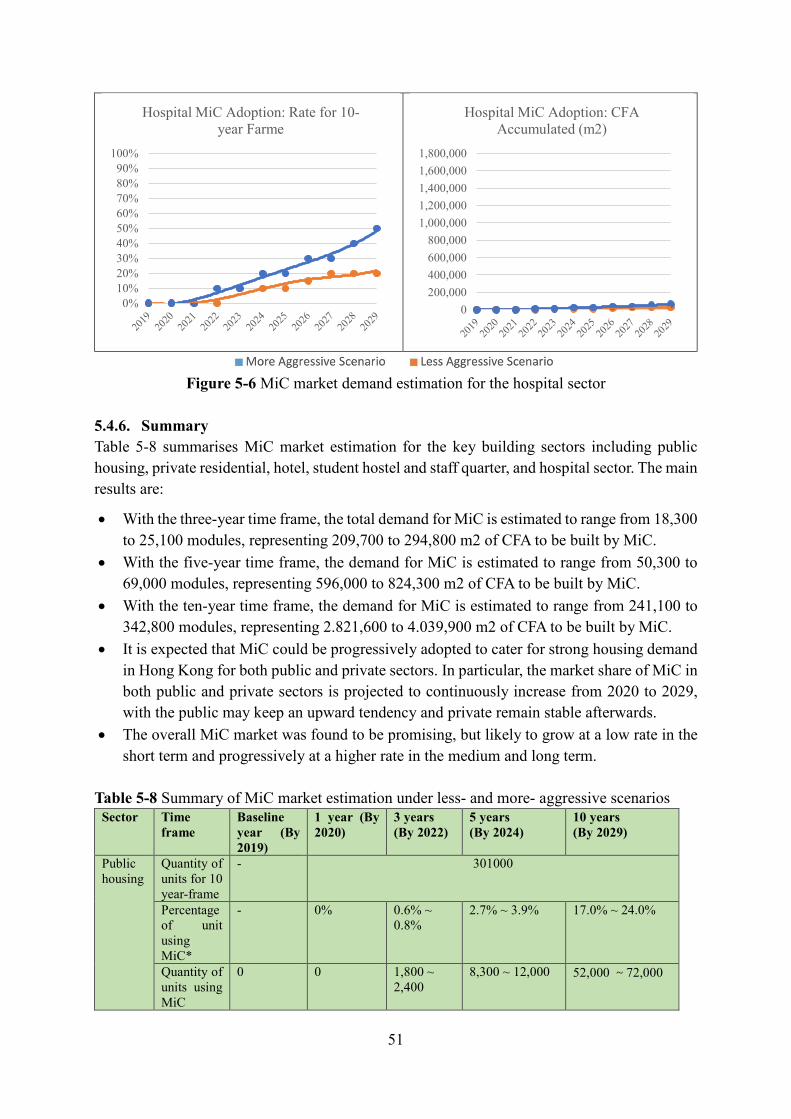
51
Figure 5-6 MiC market demand estimation for the hospital sector 5.4.6. Summary Table 5-8 summarises MiC market estimation for the key building sectors including public housing, private residential, hotel, student hostel and staff quarter, and hospital sector. The main results are:
• With the three-year time frame, the total demand for MiC is estimated to range from 18,300 to 25,100 modules, representing 209,700 to 294,800 m2 of CFA to be built by MiC.
• With the five-year time frame, the demand for MiC is estimated to range from 50,300 to 69,000 modules, representing 596,000 to 824,300 m2 of CFA to be built by MiC.
• With the ten-year time frame, the demand for MiC is estimated to range from 241,100 to 342,800 modules, representing 2.821,600 to 4.039,900 m2 of CFA to be built by MiC.
• It is expected that MiC could be progressively adopted to cater for strong housing demand in Hong Kong for both public and private sectors. In particular, the market share of MiC in both public and private sectors is projected to continuously increase from 2020 to 2029, with the public may keep an upward tendency and private remain stable afterwards.
• The overall MiC market was found to be promising, but likely to grow at a low rate in the short term and progressively at a higher rate in the medium and long term.
Table 5-8 Summary of MiC market estimation under less- and more- aggressive scenarios
Sector Time frame
Baseline year (By 2019)
1 year (By 2020)
3 years (By 2022)
5 years (By 2024)
10 years (By 2029)
Public housing
Quantity of units for 10 year-frame
- 301000
Percentage of unit using MiC*
- 0% 0.6% ~ 0.8%
2.7% ~ 3.9% 17.0% ~ 24.0%
Quantity of units using MiC
0 0 1,800 ~ 2,400
8,300 ~ 12,000 52,000 ~72,000
0%10%20%30%40%50%60%70%80%90%
100%
Hospital MiC Adoption: Rate for 10-year Farme
0200,000400,000600,000800,000
1,000,0001,200,0001,400,0001,600,0001,800,000
Hospital MiC Adoption: CFA Accumulated (m2)
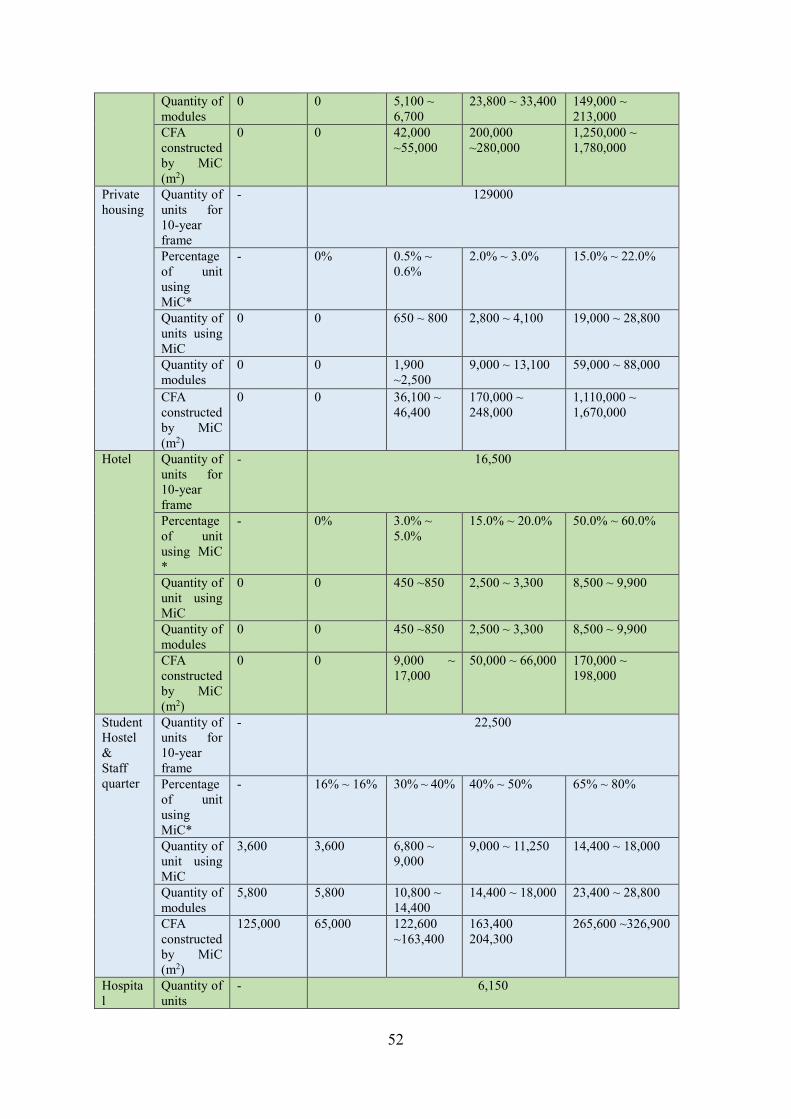
52
Quantity of modules
0 0 5,100 ~ 6,700
23,800 ~ 33,400 149,000 ~ 213,000
CFA constructed by MiC (m2)
0 0 42,000 ~55,000
200,000 ~280,000
1,250,000 ~ 1,780,000
Private housing
Quantity of units for 10-year frame
- 129000
Percentage of unit using MiC*
- 0% 0.5% ~ 0.6%
2.0% ~ 3.0% 15.0% ~ 22.0%
Quantity of units using MiC
0 0 650 ~ 800 2,800 ~ 4,100 19,000 ~ 28,800
Quantity of modules
0 0 1,900 ~2,500
9,000 ~ 13,100 59,000 ~ 88,000
CFA constructed by MiC (m2)
0 0 36,100 ~ 46,400
170,000 ~ 248,000
1,110,000 ~ 1,670,000
Hotel Quantity of units for 10-year frame
- 16,500
Percentage of unit using MiC *
- 0% 3.0% ~ 5.0%
15.0% ~ 20.0% 50.0% ~ 60.0%
Quantity of unit using MiC
0 0 450 ~850 2,500 ~ 3,300 8,500 ~ 9,900
Quantity of modules
0 0 450 ~850 2,500 ~ 3,300 8,500 ~ 9,900
CFA constructed by MiC (m2)
0 0 9,000 ~ 17,000
50,000 ~ 66,000 170,000 ~ 198,000
Student Hostel & Staff quarter
Quantity of units for 10-year frame
- 22,500
Percentage of unit using MiC*
- 16% ~ 16% 30% ~ 40% 40% ~ 50% 65% ~ 80%
Quantity of unit using MiC
3,600 3,600 6,800 ~ 9,000
9,000 ~ 11,250 14,400 ~ 18,000
Quantity of modules
5,800 5,800 10,800 ~ 14,400
14,400 ~ 18,000 23,400 ~ 28,800
CFA constructed by MiC (m2)
125,000 65,000 122,600 ~163,400
163,400 204,300
265,600 ~326,900
Hospital
Quantity of units
- 6,150
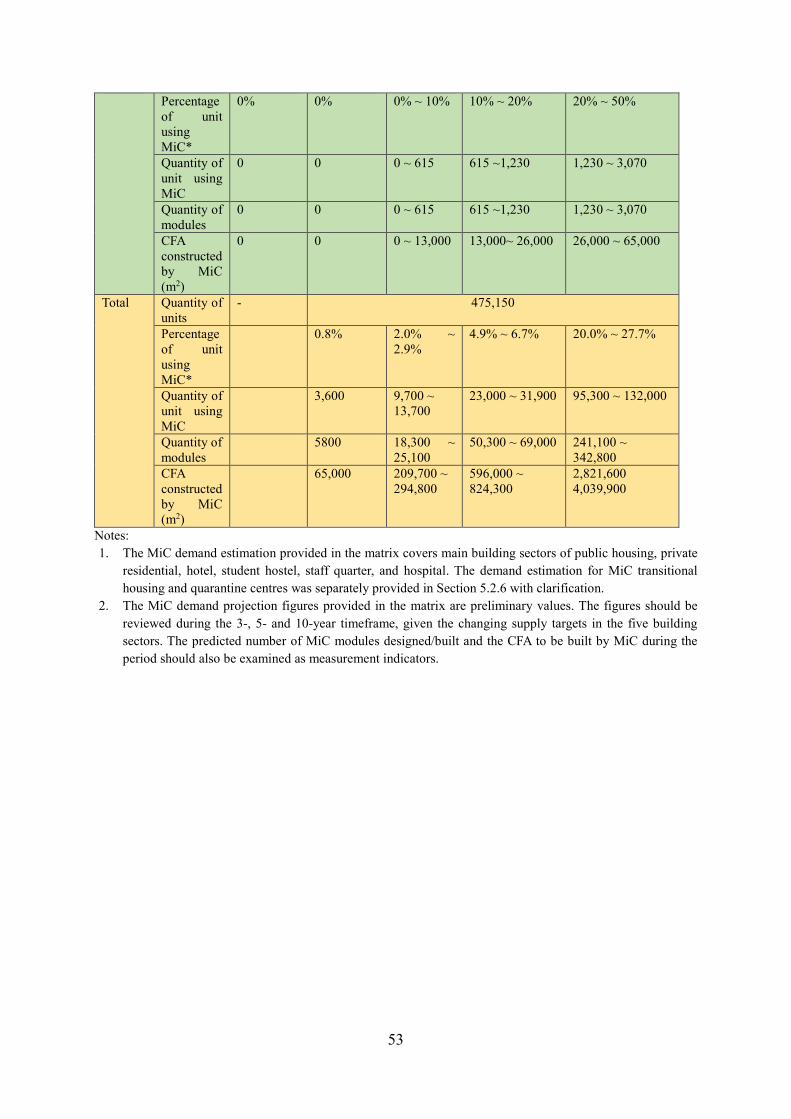
53
Percentage of unit using MiC*
0% 0% 0% ~ 10% 10% ~ 20% 20% ~ 50%
Quantity of unit using MiC
0 0 0 ~ 615 615 ~1,230 1,230 ~ 3,070
Quantity of modules
0 0 0 ~ 615 615 ~1,230 1,230 ~ 3,070
CFA constructed by MiC (m2)
0 0 0 ~ 13,000 13,000~ 26,000 26,000 ~ 65,000
Total Quantity of units
- 475,150
Percentage of unit using MiC*
0.8% 2.0% ~ 2.9%
4.9% ~ 6.7% 20.0% ~ 27.7%
Quantity of unit using MiC
3,600 9,700 ~ 13,700
23,000 ~ 31,900 95,300 ~ 132,000
Quantity of modules
5800 18,300 ~ 25,100
50,300 ~ 69,000 241,100 ~ 342,800
CFA constructed by MiC (m2)
65,000 209,700 ~ 294,800
596,000 ~ 824,300
2,821,600 4,039,900
Notes: 1. The MiC demand estimation provided in the matrix covers main building sectors of public housing, private
residential, hotel, student hostel, staff quarter, and hospital. The demand estimation for MiC transitional housing and quarantine centres was separately provided in Section 5.2.6 with clarification.
2. The MiC demand projection figures provided in the matrix are preliminary values. The figures should be reviewed during the 3-, 5- and 10-year timeframe, given the changing supply targets in the five building sectors. The predicted number of MiC modules designed/built and the CFA to be built by MiC during the period should also be examined as measurement indicators.
54
6. Discussion and recommendations In the recent Government initiative to achieve ‘Construction 2.0’, MiC was highlighted as a key action to change the innovative landscape for the Hong Kong industry and drive forward productivity, efficiency and enhanced project delivery outcomes. In this report, we have demonstrated the suitability of adopting of MiC in various key building sectors, including public housing, private residential, hotel, student hostel, staff quarter, hospital and special sectors (e.g. quarantine centres and transitional housing). We have also forecast market demand for MiC under less- and more- aggressive scenarios, considering the influence of government policy and regulation, supply capacity, availability of professionals, market awareness, application of smart technologies, labour structure plus disruptive events. The MiC market was found to be promising, but likely to grow at a low rate in the short term and progressively at a higher rate in the medium and long term. It is thus timely and essential to develop strategies to safeguard the modernisation of Hong Kong construction through modularisation. Below are our recommendations on different stakeholders’ strategic actions for MiC promotion and adoption. Government departments • The government should encourage the adoption of MiC via refined approval process plus
reasonable incentives. • The government should tailor the present statutory inspection framework to suit the new
MiC production arrangement. • In the medium to long term, the government should provide policy, fund and land support
to the industry to set up local MiC production facilities. • The government should consider granting of floor area concessions. • The government should explore the feasibility of adopting MiC in different building sectors
and ask relevant clients to look at MiC seriously. • The government should provide policy, fund and land support to attract new MiC
manufacturers and suppliers into the market to meet the rising demand for MiC. • The government should facilitate project owners and other parties to make the best use of
CITF26. • The joint efforts of the government, industry and universities will be critical and imperative
for addressing the technical challenges, given the current lack of MiC-related knowledge and experience in the Hong Kong construction industry.
• The government should examine the practicability of mandating the use of MiC in public housing projects.
26 https://www.citf.cic.hk/
55
Clients • Clients can refer to the Buildings Department’s MiC pre-acceptance list to identify eligible
suppliers. • Project-level partnering between the client and its professional advisors and supply chains
from the preliminary design stage, particularly early contractors’ involvement, proves to be essential to secure technical success.
• Clients should be open-minded to innovative technologies. • The public sectors should take the lead to use MiC, setting good examples for the private
sectors. • Develop systematic MiC performance measurement methodologies and key performance
indicator systems.
Contractors • Designing and constructing with BIM could help project members reap the benefits of MiC
through comprehensive understanding and better collaboration. • Contractors should team up with qualified MiC manufacturers and suppliers at early stage. • The benefits and know-hows of MiC should be demonstrated to encourage the industry to
take up MiC, e.g. through benchmarking project case studies. • Smart project delivery solutions (by utilising construction technologies and digitalisation)
for MiC should be progressively developed. • Early liaison with Transport Department to resolve problems with the transportation of
oversized modules should be made.
Consultants/designers • Consultants/designers are suggested to design the layouts similar to the conventional floor
plans for for-sale products. • Consultants/designers are suggested to design with reasonable flexibility for future
addition and alteration. • Consultants/designers can collaborate with universities and research institutions to
investigate structural solutions, connection details and new materials for high-rise modular buildings.
MiC manufacturers and suppliers • All-concrete modules should closely resemble the common Hong Kong premises.Rigid
quality control in factory with enterprise-level standards is significant to realising the promise of high quality during module production.
• Suppliers can organise factory tours to buyers, enabling diversity in cladding systems design, and providing fully furnished homes are primary strategies for overcoming the challenges from consumers’ perception and making buyers psychological comfortable.
• Current precast suppliers should be aware of the promising market of MiC and consider transferring their current production systems for module production.

56
Professional institutions and universities • Institutions and universities could assess the full economics, perceptions and technicalities
of MiC. • Institutions and universities should provide training courses to practitioners covering
different trades, e.g. trucking, cranage and related skilful personnel for transportation, logistics and lifting.
• Studies on the economics and life cycle costs of high-rise MiC building are needed. Cost estimates should be conducted to support the industry in producing effective cost benchmarking.
• Institutions and universities should publish articles in professional journals like HKIE to promote MiC.

57
7. Conclusions In order to enhance construction productivity and competitiveness in Hong Kong, it is urgent and necessary to adopt MiC. This report has demonstrated the suitability of different types of buildings for MiC, including public housing, private residential, hotel, student hostel, staff quarter, hospital and special sectors (e.g. quarantine centres and transitional housing), through building sectors analysis and typical floor plan modularisation and an industry-wide MiC market survey. To enrich the discussion and alert the government and industry to get well prepared for potential MiC developments, this report has further estimated market demand for MiC based on a scenario analysis approach. The key findings of the report are summarised below: • The key building sectors (including public housing, private residential, hotel, student hostel,
staff quarter, hospital and special sectors) were analysed in terms of current development, typical floor plan modularisation and future development. The building sector analysis preliminarily demonstrated the suitability of different types of buildings for MiC, and provided an empirical foundation for the follow-up market demand estimation.
• An industry-wide questionnaire survey was conducted, the findings of which were found consistent among all effective respondents, respondents with good knowledge of MiC and residents with modular building project experience. The survey revealed the top three suitable building types to adopt MiC to be (in descending order of suitability perceived by all effective respondents): (1) Student/staff hostels (2) Budget hotels (3) High-rise public residential buildings
Overall MiC was perceived more suitable for the public, residential and low-end building sectors than for the private, functional and high-end ones. This result suggests a need to raise the awareness of the industry of the benefits of adopting MiC in various building sectors in Hong Kong.
• All effective respondents and respondents with good knowledge of MiC prefer “the hybrid
steel frame plus concrete floor and wall” MiC system the most for their real-life projects, while respondents with modular building project experience prefer “precast concrete” MiC system the most. All the three groups considered “steel-framed” MiC system as the least preferable. The results reflect the market preference on concrete modules.
• The top five most important drivers for adopting MiC were identified to be (in descending
order of importance perceived by all effective respondents): (1) faster construction and shortened project duration; (2) GFA concession or bonus; (3) better quality control of products due to standardisation;
58
(4) MiC policy initiative and promotion; and (5) improved health, safety and welfare for workers. These drivers are directly or indirectly related to the commercial merits of MiC.
• The top five most significant constraints to MiC adoption were revealed to be (in descending order of significance perceived by all effective respondents): (1) limited available codes and standards27; (2) limited choice of capable suppliers and contractors in the market; (3) over-stringent regulations; (4) challenges in logistics due to safety, traffic condition and storage issues; and (5) loss of saleable areas owing to the double wall/floor issues. These constraints were more or less related to the regulatory aspect of innovation building.
• The top five most important strategies for promoting MiC in Hong Kong were found to be (in descending order of importance by all effective respondents): (1) providing GFA concession for MiC adoption in private projects; (2) improving current MiC standards and codes to guide regulatory compliance
checking and achievement; (3) exploring technical solutions to save GFA, e.g. using open-sided modules; (4) modifying current transport regulations (e.g. width limit) to support MiC logistics; (5) mandating MiC adoption in public housing.
• MiC market demand was estimated to predict the demand in the building sectors including
public housing, private residential, hotels, student hostels, staff quarters, and hospitals within the 1-year (by 2020), 3- year (by 2022), 5-year (by 2024) and 10-year (by 2029) time frames, from the baseline year of 2019. The developed scenarios provide lower and upper bounds of MiC adoption rate, denoting the less aggressive scenario and the more aggressive scenario, respectively. These scenarios were developed considering the key factors that influence the adoption of MiC, which include government policy and regulations, supply capacity, availability of professionals, market awareness, smart technologies and disruptive events.
• Under the less aggressive scenarios, the overall MiC market demand in the studied building sectors is estimated to reach: (1) 18,300 modules by the end of 2022, with about 209,700 m2 of CFA by MiC; (2) 50,300 modules by the end of 2024, with about 596,000 m2 of CFA by MiC; and (3) 241,100 modules by the end of 2029, with about 2,821,600 m2 of CFA by MiC.
• Under the more aggressive scenarios, the MiC market demand in the studied building sectors is estimated to reach: (1) 25,100 modules by the end of 2022, with about 294,800 m2 of CFA by MiC; (2) 69,000 modules by the end of 2024, with about 824,300 m2 of CFA
27 Codes specific for module manufacturing, customs declaration and clearance are lacking.
59
by MiC; and (3) 342,800 modules by the end of 2029, with about 4,039,900 m2 of CFA by MiC.
• The results of the market estimation and industry questionnaire survey together unveil the
significant opportunities and an urgent need to nurture the MiC market in Hong Kong. Thus, strategic actions should be taken to best meet the market demand and realise the opportunities. A summary of recommended actions for critical stakeholders is provided below: o Government departments should provide support in terms of policy, regulation, land,
funding and techniques to the MiC industry for supply chain enhancement. o Clients should be open-minded to innovative technologies and team up with eligible
MiC professionals for MiC project planning, implementation, monitoring and control. o Contractors should collaborate with MiC professionals from early-stage and transfer the
merits of MiC into tangible benefits. o Consultants should integrate market preferences (e.g. preference for concrete) and user
behaviour (e.g. possible alteration) into module design o MiC manufacturers and suppliers should ensure transportation feasibility and quality
control at the project level and seek ways to increase market awareness at the industry level.
o Institutions and universities should enhance MiC related research and development, and be involved by the government and the practitioners in streamlining MiC project delivery.
The findings of this report should help the stakeholders of the Hong Kong building industry to gain a better understanding of the market potential of MiC and to de-risk their business decision-making of considering MiC methods for their projects. The reported estimates of the MiC market potential should also help the government to better formulate and implement the MiC promotion policy and support the strategic planning of the industry for establishing MiC supply chains for Hong Kong.
60
References BD (2020). Pre-accepted Modular Integrated Construction Systems/Components.
https://www.bd.gov.hk/en/resources/codes-and-references/modular-integrated-construction/mic_acceptedList.html.
Bertram, N., Fuchs, S., Mischke, J., Palter, R., Strube, G. and Woetzel, J. (2019). Modular construction: From projects to products. McKinsey & Company: Capital Projects & Infrastructure, 1-34.
CSD (2018). Hong Kong Annual Digest of Statistics 2018. Hong Kong, Census and Statistics Department, HKSAR.
DEVB (2020). List of Approved Contractors for Public Works. https://www.devb.gov.hk/Contractor.aspx?section=80&lang=1.
Gausemeier, J., Fink, A., and Schlake, O. (1998). Scenario management: An approach to develop future potentials. Technological Forecasting and Social Change, 59(2), 111-130.
HKIS (2020). About HKIS. 2020. https://www.hkis.org.hk/en/index.html. HKSAR (2012). The 2011-12 Policy Address: From Strength to Strength. Hong Kong. Javed, A., Pan, W., Chen, L. and Zhan, W. T. (2018). A Systemic Exploration of Drivers for and
Constraints on Construction Productivity Enhancement. Built Environment and Project Asset Management, 8(3), 239-252. https://doi.org/10.1108/BEPAM-10-2017-0099.
Kucuk, U., Eyuboglu, M., Kucuk, H.O. and Degirmencioglu, G (2016). Importance of using proper post hoc test with ANOVA. International Journal of Cardiology, 209, 346.
LD (2014). Accountable and Non-accountable Gross Floor Area (GFA) under Lease, Practice Note, Lands Department, Hong Kong.
LegCO (2019). Fact sheet: Transitional housing in selected places. HKSAR Legislative Council. Hong Kong. https://www.legco.gov.hk/research-publications/english/1819fs06-transitional-housing-in-selected-places-20190218-e.pdf.
McKinsey (2020). The next normal in construction: How disruption is reshaping the world’s largest ecosystem, McKinsey.
Pan, M., Linner, T., Pan, W., Cheng, H., & Bock, T. (2020). Structuring the context for construction robot development through integrated scenario approach. Automation in Construction, 114, 103174.
Pan, M. and Pan, W. (2019). Determinants of adoption of robotics in precast concrete production for buildings. Journal of Management in Engineering, 35(5), 05019007.
Pan, M., and Pan, W. (2020). Stakeholder Perceptions of the Future Application of Construction Robots for Buildings in a Dialectical System Framework. Journal of Management in Engineering, 36(6), 04020080. http://dx.doi.org/10.1061/(ASCE)ME.1943-5479.0000846.
Pan, W., Dainty, A. R. J. and Gibb, A. G. F. (2012). Establishing and Weighting Decision Criteria for Building System Selection in Housing Construction. ASCE Journal of Construction Engineering and Management, 138(11), 1239-1250.
Pan, W. and Hon, C. K. (2018). Modular integrated construction for high-rise buildings. Proceedings of the ICE - Municipal Engineer: 1-5. http://dx.doi.org/10.1680/jmuen.18.00028.
61
Pan, W. and Pan, M. (2018). A dialectical system framework of zero carbon emission building policy for high-rise high-density cities: Perspective from Hong Kong. Journal of Cleaner Production, 205, 1-13. https://doi.org/10.1016/j.jclepro.2018.09.025.
Pan, W., and Pan, M. (2019). Opportunities and risks of implementing zero-carbon building policy for cities: Hong Kong case. Applied Energy, 256, 113835. https://doi.org/10.1016/j.apenergy.2019.113835.
Pan, W., Yang, Y., Zhang, Z. Q. and Chan, Y. S. (2019). Modularisation for modernisation: a strategy paper rethinking Hong Kong construction. HKU, Hong Kong.
PD (2016). Consolidated Land Requirement and Supply Analysis. Hong Kong 2030+: Towards A Planning Vision and Strategy Transcending 2030. Hong Kong, Planning Department, HKSAR.
Qin, H. (2015). Natural ventilation of high-rise high-density residential buildings of Hong Kong. PhD, University of Hong Kong.
REDA (2016). Board of Directors and Executive Committee. http://www.reda.hk/executive-committee/.
Rogers, E. M. (2010). Diffusion of innovations. Simon and Schuster, New York. RVD (2019). Hong Kong Property Review 2019. Hong Kong, Rating and Valuation Department. SHADAC (2012). Understanding 1-, 3-, and 5-year ACS Estimates: Summary Tabulations and
Public Use Files. The University of Minnesota’s State Health Access Data Assistance Center (SHADAC).
THB (2013). Design of the New Public Housing Flats by the Hong Kong Housing Authority Hong Kong, Transport and Housing Bureau.
THB (2018). Long Term Housing Strategy (LTHS) Annual Progress Report 2018. Hong Kong, Transport and Housing Bureau, HKSAR.
THB (2019). Hong Kong: The Facts.https://www.thb.gov.hk/eng/psp/publications/housing/hongkongthefacts/index.htm.
Yang, Y., Pan, M., & Pan, W. (2019). ‘Co-evolution through interaction’ of innovative building technologies: The case of modular integrated construction and robotics. Automation in Construction, 107, 102932. https://doi.org/10.1016/j.autcon.2019.102932.
Yang, Y. and Pan, W., 2020. Automated guided vehicles in modular integrated construction: potentials and future directions. Construction Innovation. In press. https://doi.org/10.1108/CI-07-2019-0073.
Zhang, Z., Pan, W., and Zheng, Z. (2020). Fighting Covid-19 through fast delivery of a modular quarantine camp with smart construction. In Proceedings of the Institution of Civil Engineers-Civil Engineering, 1-8. https://doi.org/10.1680/jcien.20.00025.
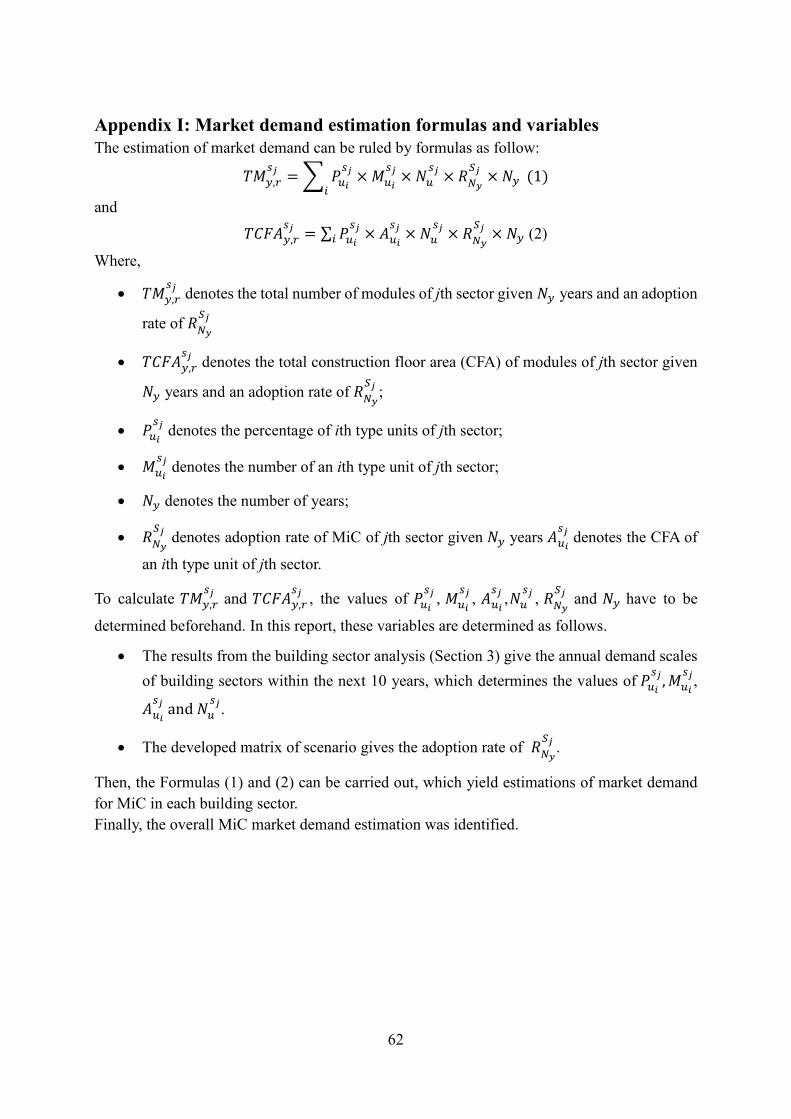
62
Appendix I: Market demand estimation formulas and variables The estimation of market demand can be ruled by formulas as follow:
𝑇𝑇𝑇𝑇𝑦𝑦,𝑟𝑟𝑠𝑠𝑗𝑗 = � 𝑃𝑃𝑢𝑢𝑖𝑖
𝑠𝑠𝑗𝑗 × 𝑇𝑇𝑢𝑢𝑖𝑖𝑠𝑠𝑗𝑗 × 𝑁𝑁𝑢𝑢
𝑠𝑠𝑗𝑗 × 𝑅𝑅𝑁𝑁𝑦𝑦𝑆𝑆𝑗𝑗 × 𝑁𝑁𝑦𝑦
𝑖𝑖 (1)
and
𝑇𝑇𝑇𝑇𝑇𝑇𝑇𝑇𝑦𝑦,𝑟𝑟𝑠𝑠𝑗𝑗 = ∑ 𝑃𝑃𝑢𝑢𝑖𝑖
𝑠𝑠𝑗𝑗 × 𝑇𝑇𝑢𝑢𝑖𝑖𝑠𝑠𝑗𝑗 × 𝑁𝑁𝑢𝑢
𝑠𝑠𝑗𝑗 × 𝑅𝑅𝑁𝑁𝑦𝑦𝑆𝑆𝑗𝑗 × 𝑁𝑁𝑦𝑦
𝑖𝑖 (2)
Where,
• 𝑇𝑇𝑇𝑇𝑦𝑦,𝑟𝑟𝑠𝑠𝑗𝑗 denotes the total number of modules of jth sector given 𝑁𝑁𝑦𝑦 years and an adoption
rate of 𝑅𝑅𝑁𝑁𝑦𝑦𝑆𝑆𝑗𝑗
• 𝑇𝑇𝑇𝑇𝑇𝑇𝑇𝑇𝑦𝑦,𝑟𝑟𝑠𝑠𝑗𝑗 denotes the total construction floor area (CFA) of modules of jth sector given
𝑁𝑁𝑦𝑦 years and an adoption rate of 𝑅𝑅𝑁𝑁𝑦𝑦𝑆𝑆𝑗𝑗 ;
• 𝑃𝑃𝑢𝑢𝑖𝑖𝑠𝑠𝑗𝑗 denotes the percentage of ith type units of jth sector;
• 𝑇𝑇𝑢𝑢𝑖𝑖𝑠𝑠𝑗𝑗 denotes the number of an ith type unit of jth sector;
• 𝑁𝑁𝑦𝑦 denotes the number of years;
• 𝑅𝑅𝑁𝑁𝑦𝑦𝑆𝑆𝑗𝑗 denotes adoption rate of MiC of jth sector given 𝑁𝑁𝑦𝑦 years 𝑇𝑇𝑢𝑢𝑖𝑖
𝑠𝑠𝑗𝑗 denotes the CFA of
an ith type unit of jth sector.
To calculate 𝑇𝑇𝑇𝑇𝑦𝑦,𝑟𝑟𝑠𝑠𝑗𝑗 and 𝑇𝑇𝑇𝑇𝑇𝑇𝑇𝑇𝑦𝑦,𝑟𝑟
𝑠𝑠𝑗𝑗 , the values of 𝑃𝑃𝑢𝑢𝑖𝑖𝑠𝑠𝑗𝑗 , 𝑇𝑇𝑢𝑢𝑖𝑖
𝑠𝑠𝑗𝑗 , 𝑇𝑇𝑢𝑢𝑖𝑖𝑠𝑠𝑗𝑗 ,𝑁𝑁𝑢𝑢
𝑠𝑠𝑗𝑗 , 𝑅𝑅𝑁𝑁𝑦𝑦𝑆𝑆𝑗𝑗 and 𝑁𝑁𝑦𝑦 have to be
determined beforehand. In this report, these variables are determined as follows.
• The results from the building sector analysis (Section 3) give the annual demand scales of building sectors within the next 10 years, which determines the values of 𝑃𝑃𝑢𝑢𝑖𝑖
𝑠𝑠𝑗𝑗 ,𝑇𝑇𝑢𝑢𝑖𝑖𝑠𝑠𝑗𝑗,
𝑇𝑇𝑢𝑢𝑖𝑖𝑠𝑠𝑗𝑗 and 𝑁𝑁𝑢𝑢
𝑠𝑠𝑗𝑗 .
• The developed matrix of scenario gives the adoption rate of 𝑅𝑅𝑁𝑁𝑦𝑦𝑆𝑆𝑗𝑗 .
Then, the Formulas (1) and (2) can be carried out, which yield estimations of market demand for MiC in each building sector. Finally, the overall MiC market demand estimation was identified.