Embed Size (px)
Citation preview

Denitrification in Aquatic Sediments
- 1 -
Review
MODELLING DENITRIFICATION IN AQUATIC SEDIMENTS Authors: Katja Fennel1,#, Damian Brady2, Dominic DiToro2, Robinson W. Fulweiler3, Wayne S. Gardner4, Anne Giblin5, Mark J. McCarthy4,6, Alexandra Rao7, Sybil Seitzinger8, Marie Thouvenot-Korppoo9, Craig Tobias10 Affiliations: 1Dalhousie University, Oceanography, Halifax, NS, Canada 2University of Delaware, DE, USA 3Louisiana State University, Baton Rouge, LA, USA 4The University of Texas at Austin, Marine Science Institute, Port Aransas, TX, USA 5Marine Biological Laboratory Ecosystems Center, Woods Hole, MA, USA 6Current affiliation: Université du Québec à Montréal, Département sciences biologiques,
Montréal, QC, Canada 7Woods Hole Oceanographic Institution, Woods Hole, MA, USA 8Rutgers University, Institute of Marine and Coastal Sciences, Rutgers/NOAA CMER
Program, New Brunswick, NJ, USA 9Water Resources Engineering, Helsinki University of Technology, Helsinki, Finland 10University of North Carolina Wilmington, Wilmington, NC, USA # Corresponding author:
Katja Fennel Dalhousie University Department of Oceanography 1355 Oxford St Halifax, NS, B3H 4J1 Canada Phone: +1 902 494 4526 Fax: +1 902 494 3877 Email: [email protected]
Keywords: denitrification, diagenetic model, sediment Abbreviations: dissimalatory nitrate reduction to ammonium (DNRA), oxygen-demand units (ODUs), sediment flux model (SFM), sediment oxygen consumption (SOC)

Denitrification in Aquatic Sediments
- 2 -
ABSTRACT 1
Sediment denitrification is a major pathway of fixed nitrogen loss from aquatic systems. 2
Due to technical difficulties in measuring this process and its spatial and temporal 3
variability, estimates of local, regional and global denitrification have to rely on a 4
combination of measurements and models. Here we review approaches to describing 5
denitrification in aquatic sediments, ranging from mechanistic diagenetic models to 6
empirical parameterizations of nitrogen fluxes across the sediment-water interface. We 7
also present a compilation of denitrification measurements and ancillary data for different 8
aquatic systems, ranging from freshwater to marine. Based on this data compilation we 9
reevaluate published parameterizations of denitrification. We recommend that future 10
models of denitrification use (1) a combination of mechanistic diagenetic models and 11
measurements where bottom waters are temporally hypoxic or anoxic, and (2) the much 12
simpler correlations between denitrification and sediment oxygen consumption for oxic 13
bottom waters. For our data set, inclusion of bottom water oxygen and nitrate 14
concentrations in a multivariate regression did not improve the statistical fit. 15
16
INTRODUCTION 17
Unlike other important macro- and micronutrients, e.g. phosphorus and iron, the reservoir 18
of bioavailable nitrogen is regulated almost solely by biological activity. Two opposing, 19
microbially mediated processes, denitrification and nitrogen fixation, regulate the size of 20
this reservoir. Nitrogen is the major limiting nutrient in marine systems; thus, variations 21
in its availability have far-reaching consequences. Denitrification is any process by 22
which combined nitrogen (nitrate, ammonium or organic forms) is reduced to gaseous 23

Denitrification in Aquatic Sediments
- 3 -
end products (NO, N2O or N2) (Devol in press). In the more restrictive, classical 1
definition, denitrification is a dissimilatory nitrate reduction process during which nitrate 2
or nitrite (NO3− or NO2
−) is reduced anaerobically to any gaseous form of nitrogen by 3
heterotrophic bacteria (also referred to as canonical denitrification). It is carried out by 4
ubiquitous, facultatively anaerobic bacteria under suboxic conditions (i.e. at oxygen 5
concentrations below approximately 2 mg O2 l–1 or 63 mmol O2 m
−3) and its end product 6
is N2 gas. Denitrification in sediments containing ample labile organic matter is often 7
limited by the availability of nitrate or nitrite. Available fixed nitrogen in sediments is 8
mostly in the form of ammonium (NH4+, derived from ammonification of organic matter 9
or dissimilatory nitrate reduction to ammonium under some conditions). Unless there is a 10
flux of nitrate into the sediment from overlying bottom waters, denitrification in the 11
sediment depends on local rates of nitrification (the oxidation of ammonium to nitrite or 12
nitrate by chemoautotrophic bacteria). This combination of processes is commonly 13
referred to as coupled nitrification-denitrification. Denitrification supported by the 14
physical influx of nitrate is referred to as direct denitrification. 15
16
Denitrification is the major pathway of fixed nitrogen loss from aquatic systems. Thus, it 17
is a critical component of the global nitrogen budget and a balancing mechanism for 18
removal of anthropogenic nitrogen along the terrestrial-freshwater-marine continuum 19
(Galloway et al. 2003; Seitzinger et al. 2006). On the global scale, denitrification is an 20
important feedback mechanism on biogeochemical cycling and in the climate system. 21
For example, denitrification may have been a major impediment to the initial oxidation of 22
the planet during the suboxic stage in the Proterozoic (Fennel et al. 2005). Denitrification 23

Denitrification in Aquatic Sediments
- 4 -
can produce nitrous oxide (N2O, a potent greenhouse gas), which can have important 1
impacts on climate (Naqvi et al. 2000). In addition, denitrification may contribute to 2
glacial-interglacial changes in atmospheric CO2 by decreasing the supply of bioavailable 3
nitrogen and, thus, biologically fixed carbon during interglacial periods (Altabet et al. 4
1995; Falkowski 1997). 5
6
Anaerobic ammonium oxidation (anammox) by nitrite or nitrate has been identified as an 7
alternative microbial pathway of N2 production and, from a biogeochemical perspective, 8
can be considered a denitrifying process (Devol 2008). The possibility of anammox was 9
originally suggested by Richards et al. (1965) and invoked by various investigators based 10
on pore water solute profiles (Bender et al. 1989) before the discovery of organisms that 11
can carry out this process. Anammox was first observed in a wastewater bioreactor 12
(Mulder et al. 1995). Anammox organisms have been purified from wastewater reactor 13
biomass and identified in several natural marine systems, such as the suboxic zone of the 14
Black Sea and the Benguela upwelling system (Kuypers et al. 2003; Kuypers et al. 2005 15
and references therein), and in Randers Fjord, Denmark (Risgaard-Petersen et al. 2004). 16
The significance of anammox was demonstrated in a variety of coastal and marine 17
sediments (Thamdrup & Dalsgaard 2002; Trimmer et al. 2003; Dalsgaard et al. 2003; 18
Engström et al. 2005). In the following discussions, we adopt the biogeochemical view 19
of denitrification (inclusive of all processes producing N2) and do not differentiate 20
between the alternative pathways. 21
22

Denitrification in Aquatic Sediments
- 5 -
A first attempt to estimate annual denitrification on a global scale was made recently with 1
a spatially explicit global analysis of denitrification in all terrestrial, freshwater 2
(lakes/rivers), estuarine and shelf ecosystems using various models (Seitzinger et al. 3
2006). A global estimate of denitrification in lakes and reservoirs is presented by 4
Harrison et al. (this issue). These models are largely based on empirical relationships, for 5
example, in Harrison et al. (this issue) nitrogen removal is estimated from knowledge of 6
water depth and residence time in individual lakes and reservoirs. Boyer et al. (2006) 7
review approaches for modeling denitrification in terrestrial and aquatic ecosystems, and 8
focused on source-transport models for streams, lakes and rivers. These models aggregate 9
nitrogen removal processes estimated from empirical functions (typically denitrification 10
is parameterized as a function of water residence time) but do not explicitly account for 11
the production and cycling of organic nitrogen. 12
13
Here we describe approaches to estimating denitrification that predict nitrogen fluxes 14
across the sediment-water interface and can be incorporated into hydrographic ecosystem 15
models that explicitly describe inorganic and organic nitrogen cycling in the water 16
column. Hydrographic ecosystem models that focus on estuaries or continental shelves 17
tend to consider the pathways of sediment nitrogen cycling, (e.g. DiToro & Fitzpatrick 18
1993; Cerco & Seitzinger 1997; Fennel et al. 2006). Global and basin-scale 19
biogeochemical models typically ignore sediment denitrification even though this process 20
has been recognized as an important global nitrogen sink (Christensen 1994) and is 21
estimated to exceed denitrification in the water column by a factor of 3 (Seitzinger et al. 22
2006). For example, Meissner at al. (2005) and Moore & Doney (2007) investigate 23

Denitrification in Aquatic Sediments
- 6 -
feedbacks between global denitrification and nitrogen fixation in biogeochemical general 1
circulation models without the inclusion of sediment denitrification. 2
3
Placing denitrification in aquatic sediments in the broader and more complex context of 4
early diagenesis is helpful. Diagenesis can be considered, “the sum total of processes that 5
bring about changes in a sediment or sedimentary rock, subsequent to deposition in 6
water. The processes may be physical, chemical, and/or biological in nature” (Berner 7
1980, p. 3). Diagenetic processes thus include transport and reaction processes; both can 8
be the result of biological and physical phenomena (Boudreau 1997). 9
10
Progress in our understanding of diagenetic processes has rested on a close link between 11
observational approaches and diagenetic modeling, i.e. the idealized mathematical 12
representation of diagenetic processes (Berner 1980). Boudreau (1997) offers several 13
reasons for the important role of diagenetic modeling, several of which are relevant to 14
denitrification. First, many measurements do not provide information about the 15
interactions of the various processes; they only indicate the net result. With the help of 16
models one can make quantitative inferences about the relative importance or absence of 17
individual processes. Second, sampling techniques often disturb the system under 18
consideration. Many processes are transient and hard to resolve. Denitrification 19
measurements are particularly time consuming and imprecise, mostly because they either 20
try to measure a small production rate of N2 against the high background of atmospheric 21
N2 or use indirect measurements as a proxy for denitrification. Finally, trusted models 22
can become tools for prediction. As such, models allow scaling up from local 23

Denitrification in Aquatic Sediments
- 7 -
measurements to larger spatial and temporal scales. A strong link between measurement 1
and modeling is crucial. 2
3
Excellent reviews on diagenetic modeling have been provided by Berner (1980), 4
Boudreau (1997), DiToro (2001) and Burdige (2006) and will not be replicated here. Our 5
objectives are (1) to review approaches to diagenetic modeling with a focus on 6
denitrification, (2) to compile a data set of denitrification measurements and sediment-7
water fluxes of oxygen and different nutrient species that encompasses a range of aquatic 8
sediments, and (3) test the robustness of empirical parameterizations and evaluate one 9
example of a mechanistically based diagenetic model against the compiled data set. 10
11
12
MODEL APPROACHES 13
Denitrification depends on and interacts with a range of other processes occurring in 14
aquatic sediments (e.g. supply of organic matter, diffusive and advective transport of 15
oxygen and nitrate, nitrification). Our discussion of quantitative descriptions of 16
denitrification in aquatic sediments is thus best placed in the context of early diagenesis. 17
We refer to these quantitative descriptions of sediment denitrification as diagenetic 18
models or biogeochemical sediment models, but recognize that denitrification is just one 19
of many diagenetic processes. When assessing the importance of sediment denitrification 20
in nitrogen cycling we are interested primarily in the sediment-water interface fluxes of 21
nitrogen species; oxidation and reduction of other elements is not discussed here. For 22
simplicity, we refer to the sum of nitrite (NO2−) and nitrate (NO3
−) as nitrate. 23

Denitrification in Aquatic Sediments
- 8 -
1
Many different approaches to modeling early diagenetic processes exist. In terms of 2
temporal representation, diagenetic models can be steady state (concentrations and fluxes 3
are constant in time) or dynamic (the model allows for temporal variations in 4
concentrations and fluxes). In terms of spatial representation, models often consider 5
spatial variations only in the vertical dimension. They assume horizontal homogeneity. 6
In simple cases, the differential equations representing early diagenesis can be solved 7
analytically and yield vertically continuous solutions. These are typically steady state 8
models with simple reaction kinetics. More often the diagenetic equations are not 9
amenable to analytical solutions. In these cases, the vertical dimension is discretized in 10
vertical layers and solved numerically. In essence the layers represent a vertical 11
integration over processes and constituents in a vertical slice of sediment. These slices 12
can be functional or indiscriminate layers. Functional layers can be defined by the 13
occurrence of a reaction process or the presence of a dissolved constituent, e.g. an 14
anaerobic and an aerobic layer. Indiscriminate layers are strictly defined in terms of their 15
vertical coordinates and assume different functions; for example, they can switch 16
between aerobic mineralization and denitrification depending on the local oxygen 17
concentration. 18
19
Alternative approaches that attempt to account for three-dimensional heterogeneities have 20
been proposed, for example, representing anaerobic microenvironments within individual 21
particles in an otherwise aerobic environment, or the representation of animal burrows 22
(Aller 1980, 1988). 23

Denitrification in Aquatic Sediments
- 9 -
1
All of these models aim to describe a subset of the occurring diagenetic processes and 2
fluxes across the sediment-water interface. Early diagenetic models were developed 3
independent of water column biogeochemical models and, to this day, biogeochemical 4
models still rarely include diagenetic processes (see the excellent review by Soetaert et al. 5
2000). Biogeochemical models that do include some form of diagenesis typically use 6
parameterizations (e.g. Fennel et al. 2006), which can be thought of as the most 7
simplified quantitative description of early diagenesis. 8
9
The general diagenetic equations for solid constituents, S, and dissolved constituents in 10
the pore water, C, following Berner (1980) are: 11
),(111
CSRz
SD
zSw
zt
SBsed
(1a) 12
),( CSRz
CD
zCw
zt
CPW
(1b) 13
Here is the porosity (the fraction of sediment volume that is liquid), a dimensionless 14
number that varies between 0 and 1. The dissolved constituent C has units of mol m–3 of 15
pore water only and is multiplied by to convert to mol m–3 of sediment (pore water 16
solid). C represents, for example, the concentrations of oxygen, nitrate or ammonium. 17
Likewise, the solid S has units of mol m–3 of solid only and is multiplied by )1( to 18
convert to mol m–3 of sediment. S represents, for example, organic carbon or biogenic 19
silicate. The time-rate-of-change of solid and dissolved constituents (left hand sides of 20
equations 1a and 1b) equals the sum of changes due to vertical advection (first set of 21
terms on the right hand side [rhs]), diffusive processes (second set of terms on rhs) and 22

Denitrification in Aquatic Sediments
- 10 -
transformations due to biogeochemical reactions (collected in the term ∑R(S,C)). The 1
advection velocities of solids and pore water are wsed and wPW, respectively. Bioturbation 2
of solids (i.e. the “mixing” of sediment by the burrowing action of higher animals) is 3
often described as a diffusive mixing process with diffusivity DB. D is the pore water 4
diffusivity. 5
6
Steady-state models 7
Steady-state models (e.g. Jahnke et al. 1982; Middelburg et al. 1996; Soetaert et al. 8
1996b; Vanderborght et al. 1977a, b) are an application of the general diagenetic 9
equations (1a,b), where the left-hand-side is set to equal zero, thus eliminating the time 10
dependence. Some of these models have been solved analytically, some numerically. An 11
elegant analytical solution to a diagenetic equation of denitrification was derived by 12
Vanderborght et al. (1977a,b), for fine-grained, organically rich, coastal sediments in the 13
North Sea. Since the top 3.5 cm of sediment at their site appeared to go through a 14
continuous cycle of deposition and erosion due to the action of waves and currents, the 15
authors chose an elevated diffusivity in the well-oxygenated top layer and a diffusivity 16
more typical of pore water below. By solving the model analytically for silica, fitting 17
their solution to observed pore water profiles, they obtained an appropriate value for the 18
diffusivity in the top layer, which was then used in solving the nitrate equation. This 19
example illustrates two points: (1) processes other than molecular diffusion and 20
bioturbation can cause vertical mixing of sediment (an accurate parameterization of the 21
vertical mixing processes is important for making reasonable predictions of 22
denitrification rates); and (2) the distribution of an independent variable, in this case 23

Denitrification in Aquatic Sediments
- 11 -
dissolved silica, can provide a means to determine a reasonable parameterization for 1
diffusivity. In essence, the silica distribution adds independent information to the 2
parameterization. 3
4
An example of a steady-state model that is more complex biogeochemically and has to be 5
solved numerically is that of Middelburg et al. (1996). Their model explicitly resolves 6
the depth distribution of solid-phase organic carbon and nitrogen, and pore water 7
concentrations of oxygen, nitrate and ammonium. Reduced manganese, iron and sulfur 8
are lumped into oxygen-demand units (ODUs). ODUs are oxidized when they come in 9
contact with oxygen and are transported similarly to the other dissolved substances. This 10
choice allows one to include the net effect of manganese, iron and sulphur cycles on the 11
oxygen distribution without having to explicitly model their complex interactions. By 12
assuming global values for model parameters and applying one porosity profile globally, 13
Middelburg et al. (1996) arrived at a general parameterization of denitrification and 14
estimated the global rate of sediment denitrification. 15
16
Layered dynamic models 17
Dynamic representations of functional layers, e.g. in the Sediment Flux Model (SFM, 18
DiToro & Fitzpatrick 1993; DiToro 2001), or indiscriminate layers (e.g. in the model of 19
Soetaert et al. 1996a) are based on the diagenetic equations (1a,b) as well. 20
21
In the SFM (DiToro & Fitzpatrick 1993; DiToro 2001) the sediment is represented by 22
two functional layers: an aerobic layer directly below the sediment-water interface and an 23

Denitrification in Aquatic Sediments
- 12 -
anaerobic layer below. Concentration changes of solid and dissolved constituents are 1
described by mass balance equations where the change of a constituent within a given 2
volume is related to the sum of internal sources and sinks of the constituent (i.e. internal 3
reactions) and its fluxes across the volume boundaries. Essentially, the mass balance 4
equations are discrete representations of the continuous diagenetic equations. For 5
example, diffusive processes—which are parameterized by multiplying a diffusivity, D, 6
with the concentration gradient ∂c/∂z in the continuous case (see equations 1a,b)—7
become mass transfer coefficients in the layered case. The mass transfer rate for oxygen 8
is parameterized as the ratio of the computed sediment oxygen demand and the dissolved 9
oxygen concentration in the overlying bottom water and the surface mass transfer rates 10
for all other dissolved constituents are assumed to be equal to the transfer rate derived for 11
oxygen (Di Toro 2001). 12
13
The sediment model in Riverstrahler, a model of nutrient cycling in a river system (Billen 14
et al. 1994; Garnier et al. 1995; Billen & Garnier 1999), is an example for a vertically 15
integrated (1-layer) diagenetic model. In Riverstrahler, the representation of a river 16
drainage network is coupled with models of biogeochemical transformations in the 17
river’s water column and underlying sediment (Ruelland et al. 2007). The sediment in 18
Riverstahler is represented by one layer of deposited and erodable particulate material 19
assumed to be homogeneously distributed along the vertical dimension and overlying a 20
layer of consolidated non-erodable sediment. The sediment model is solved in quasi-21
steady-state mode, i.e. the sediment model is assumed to reach steady-state during each 22
sediment model time step. This assumption simplifies the treatment of the diagenetic 23

Denitrification in Aquatic Sediments
- 13 -
equations significantly, as most equations can be solved analytically (Thouvenot et al. 1
2007). 2
3
Microenvironments 4
All approaches discussed above assume that processes are local and occur along the 5
vertical dimension, with rates of diagenetic processes varying only with vertical gradients 6
in solute concentrations or redox conditions. This assumption has been used traditionally 7
and may be valid for some sediment types, e.g. muddy sediments and clays. However, it 8
is not a good assumption for permeable sands, which comprise approximately 70% of 9
continental shelves worldwide (Emery 1968). Solute exchange in muddy sediments is 10
driven by molecular diffusion and macrofaunal activity (mixing and pore water 11
irrigation), but the high permeabilities of sandy deposits permit pore water transport by 12
advection (Thibodeaux & Boyle 1987; Boudreau 1997). Pore water flows in these 13
sediments are linked to pressure gradients associated with current-topography 14
interactions, wave pumping, groundwater discharge, temperature and salinity gradients, 15
and other factors (Huettel & Webster 2001). Advective flows enhance the supply of 16
oxidants and fresh organic matter, and the removal of remineralization byproducts (e.g. 17
CO2 and reduced electron acceptors) from >10 cm depth in these organically poor 18
deposits, resulting in intense metabolic activity (Jahnke et al. 2005; Rao et al. 2007). 19
Some studies have shown microscale spatial heterogeneity in sediment denitrification 20
rates (Parkin 1987; Gold et al. 1998; Jacinthe et al. 1998). 21
22

Denitrification in Aquatic Sediments
- 14 -
Jahnke (1985) published a steady-state model of denitrification in sediment 1
microenvironments based on Jorgensen (1977), in which reactive microenvironments in 2
fecal pellets or other organic aggregates are represented as spherical particles of specified 3
diameter, porosity and reactivity, within which organic matter respiration, and chemical 4
and biologically mediated redox transformations occur. The distribution, reactivity and 5
physical characteristics of these reactive particles in sediments are therefore important 6
unknown parameters, which nonetheless must be specified in the model. 7
8
Model results were compared to pore water solute profiles measured in fine-grained 9
deep-sea sediments (Jahnke et al. 1985). This spherical microzone model may be applied 10
in other modeling frameworks, e.g. in dynamic models, to simulate microzone 11
denitrification. 12
13
Parameterizations 14
Different parameterizations of denitrification have been proposed where denitrification is 15
a function of one or more environmental factors that can be measured readily or 16
estimated. Such parameterizations are useful because they can predict denitrification 17
rates over large spatial and temporal scales, and in the absence of detailed information. 18
Such parameterizations can also easily be incorporated into regional and large-scale 19
biogeochemical models. Two examples are (1) a regression between sediment oxygen 20
consumption and denitrification for estuarine, coastal ocean and continental shelf regions 21
(Seitzinger & Giblin 1996); and (2) a regression between organic matter sedimentation 22
flux and denitrification for the open ocean (Middelburg et al 1996). These regressions 23

Denitrification in Aquatic Sediments
- 15 -
have been used directly to provide snapshots of shelf-scale and global-scale 1
denitrification, and as parameterizations in dynamics models (e.g. Fennel et al. 2006). 2
3
Middelburg et al. (1996, see also our ‘Steady-state models’ subsection, above) used a 4
steady-state diagenetic model to derive global rates of denitrification in marine 5
sediments. They used two different parameterizations, one where sediment 6
denitrification depends on organic matter sedimentation only, and one where it depends 7
on organic matter sedimentation, bottom water oxygen, and nitrate concentrations and 8
water depth. For the purpose of deriving a general parameterization, the authors assumed 9
global values for rate parameters, limitation and inhibition parameters, and assumed one 10
porosity profile to be globally applicable. Some parameters were chosen as water-depth 11
dependent, namely the sediment accumulation rate, the bioturbation rate and the flux of 12
labile carbon. A sensitivity study revealed that model-predicted denitrification rates 13
depend most strongly on the sedimentation flux and bottom-water concentrations of 14
nitrate and oxygen. The authors arrived at their parameterization by multivariate 15
regression of model-predicted sediment denitrification rates and model inputs 16
(sedimentation flux, bottom water concentrations, depth). A large number of model 17
solutions were used in the regression and were derived by randomly varying model 18
parameters (within specified intervals), bottom-water nitrate and oxygen concentrations, 19
and organic-matter carbon fluxes. 20
21
Organic-matter sedimentation flux is a useful descriptor for the open ocean and (possibly) 22
deep lakes, but it is of limited use for shallow aquatic systems (e.g. shallow lakes, 23

Denitrification in Aquatic Sediments
- 16 -
wetlands, rivers, estuaries and the nearshore coastal ocean), because organic matter 1
typically settles and is resuspended multiple times before being respired or buried. This 2
cycle of settling and resuspension is, at best, difficult to measure or quantify. Sediment 3
oxygen consumption is more easily measured, is closely related to the oxidation of 4
organic carbon in sediments and, hence, is more useful for shallow systems. 5
6
A parameterization for coupled nitrification-denitrification for continental shelf 7
sediments was derived based on measured rates of denitrification and sediment oxygen 8
consumption from different continental shelf regions by Seitzinger & Giblin (1996). This 9
parameterization was used to estimate the spatial distribution of denitrification 10
throughout shelf regions in the North Atlantic basin and suggests that sediment 11
denitrification is greater than nitrogen inputs from atmospheric deposition and river 12
sources combined, indicating that onwelling of deep water nitrate is a major nitrogen 13
source for denitrification on shelves. This parameterization was subsequently used in a 14
biogeochemical model for the continental shelf area of the North American east coast by 15
Fennel et al. (2006), who transformed it into a regression between denitrification and 16
organic matter flux, as this is the relevant quantity predicted by the biogeochemical 17
model. It was assumed that organic matter is remineralized instantaneously upon 18
reaching the sediment water interface and that sediment oxygen consumption occurs only 19
in the oxidation of carbon and the nitrification of ammonium. The same assumptions can 20
be used to reformulate the parameterization of Middelburg et al. (1996) in terms of 21
sediment oxygen consumption (SOC). We compare both of these parameterizations with 22
our data compilation below (‘Environmental control on N cycling processes’). 23

Denitrification in Aquatic Sediments
- 17 -
1
DATA 2
Data compilation 3
We synthesized a relatively large set of measured denitrification rates with ancillary 4
measurements, including our own unpublished data and data available in the literature. 5
As a minimum requirement for a data point to be considered useful, both denitrification 6
and sediment oxygen consumption rates had to be available coincidentally. Our data set 7
contains 657 data points that meet this minimum requirement. We also compiled 8
approximately 463 data points with coincident measurements of nitrate, ammonium and 9
phosphate fluxes between sediment and bottom water, and bottom water concentrations 10
of oxygen and nitrate. For some of these points, additional information, such as sediment 11
type or primary productivity rates, are available as well. 12
13
Our data originate from different aquatic environments, ranging from freshwater systems 14
(Lake Champlain and Old Woman Creek, Lake Erie) and brackish waters (Chesapeake 15
Bay and Corpus Christi Bay, Gulf of Mexico) to oceanic continental shelves (Arctic, 16
Washington and Middle Atlantic Bight shelves and the East China Sea). Data sources, 17
site descriptions and measurement techniques are listed in Table 1. The data compilation 18
is included as Supplementary Online Material. Denitrification rates were determined by 19
measuring N2:Ar ratios with membrane-inlet mass spectrometry (MIMS; Kana et al. 20
1994, 1998), except for the data from Lake Champlain, the University of Rhode Island 21
(URI) mesocosm experiments, Chesapeake Bay and the East China Sea. For data from 22
Lake Champlain, the URI mesocosms and Chesapeake Bay, we calculated denitrification 23

Denitrification in Aquatic Sediments
- 18 -
assuming Redfield stoichiometry for organic matter remineralization and a respiratory 1
coefficient of one (one mol organic carbon remineralized per mol O2 consumed). We 2
assume that denitrification accounts for the deficit in dissolved inorganic nitrogen flux 3
from the sediment with respect to the flux expected based on organic matter 4
remineralization (using sediment oxygen consumption as reference; see Table 2). For the 5
data from the East China Sea we calculated denitrification as the difference between the 6
production rate of ammonium and the sediment efflux of ammonium and nitrate (see 7
Table 2). 8
9
Mean tendencies 10
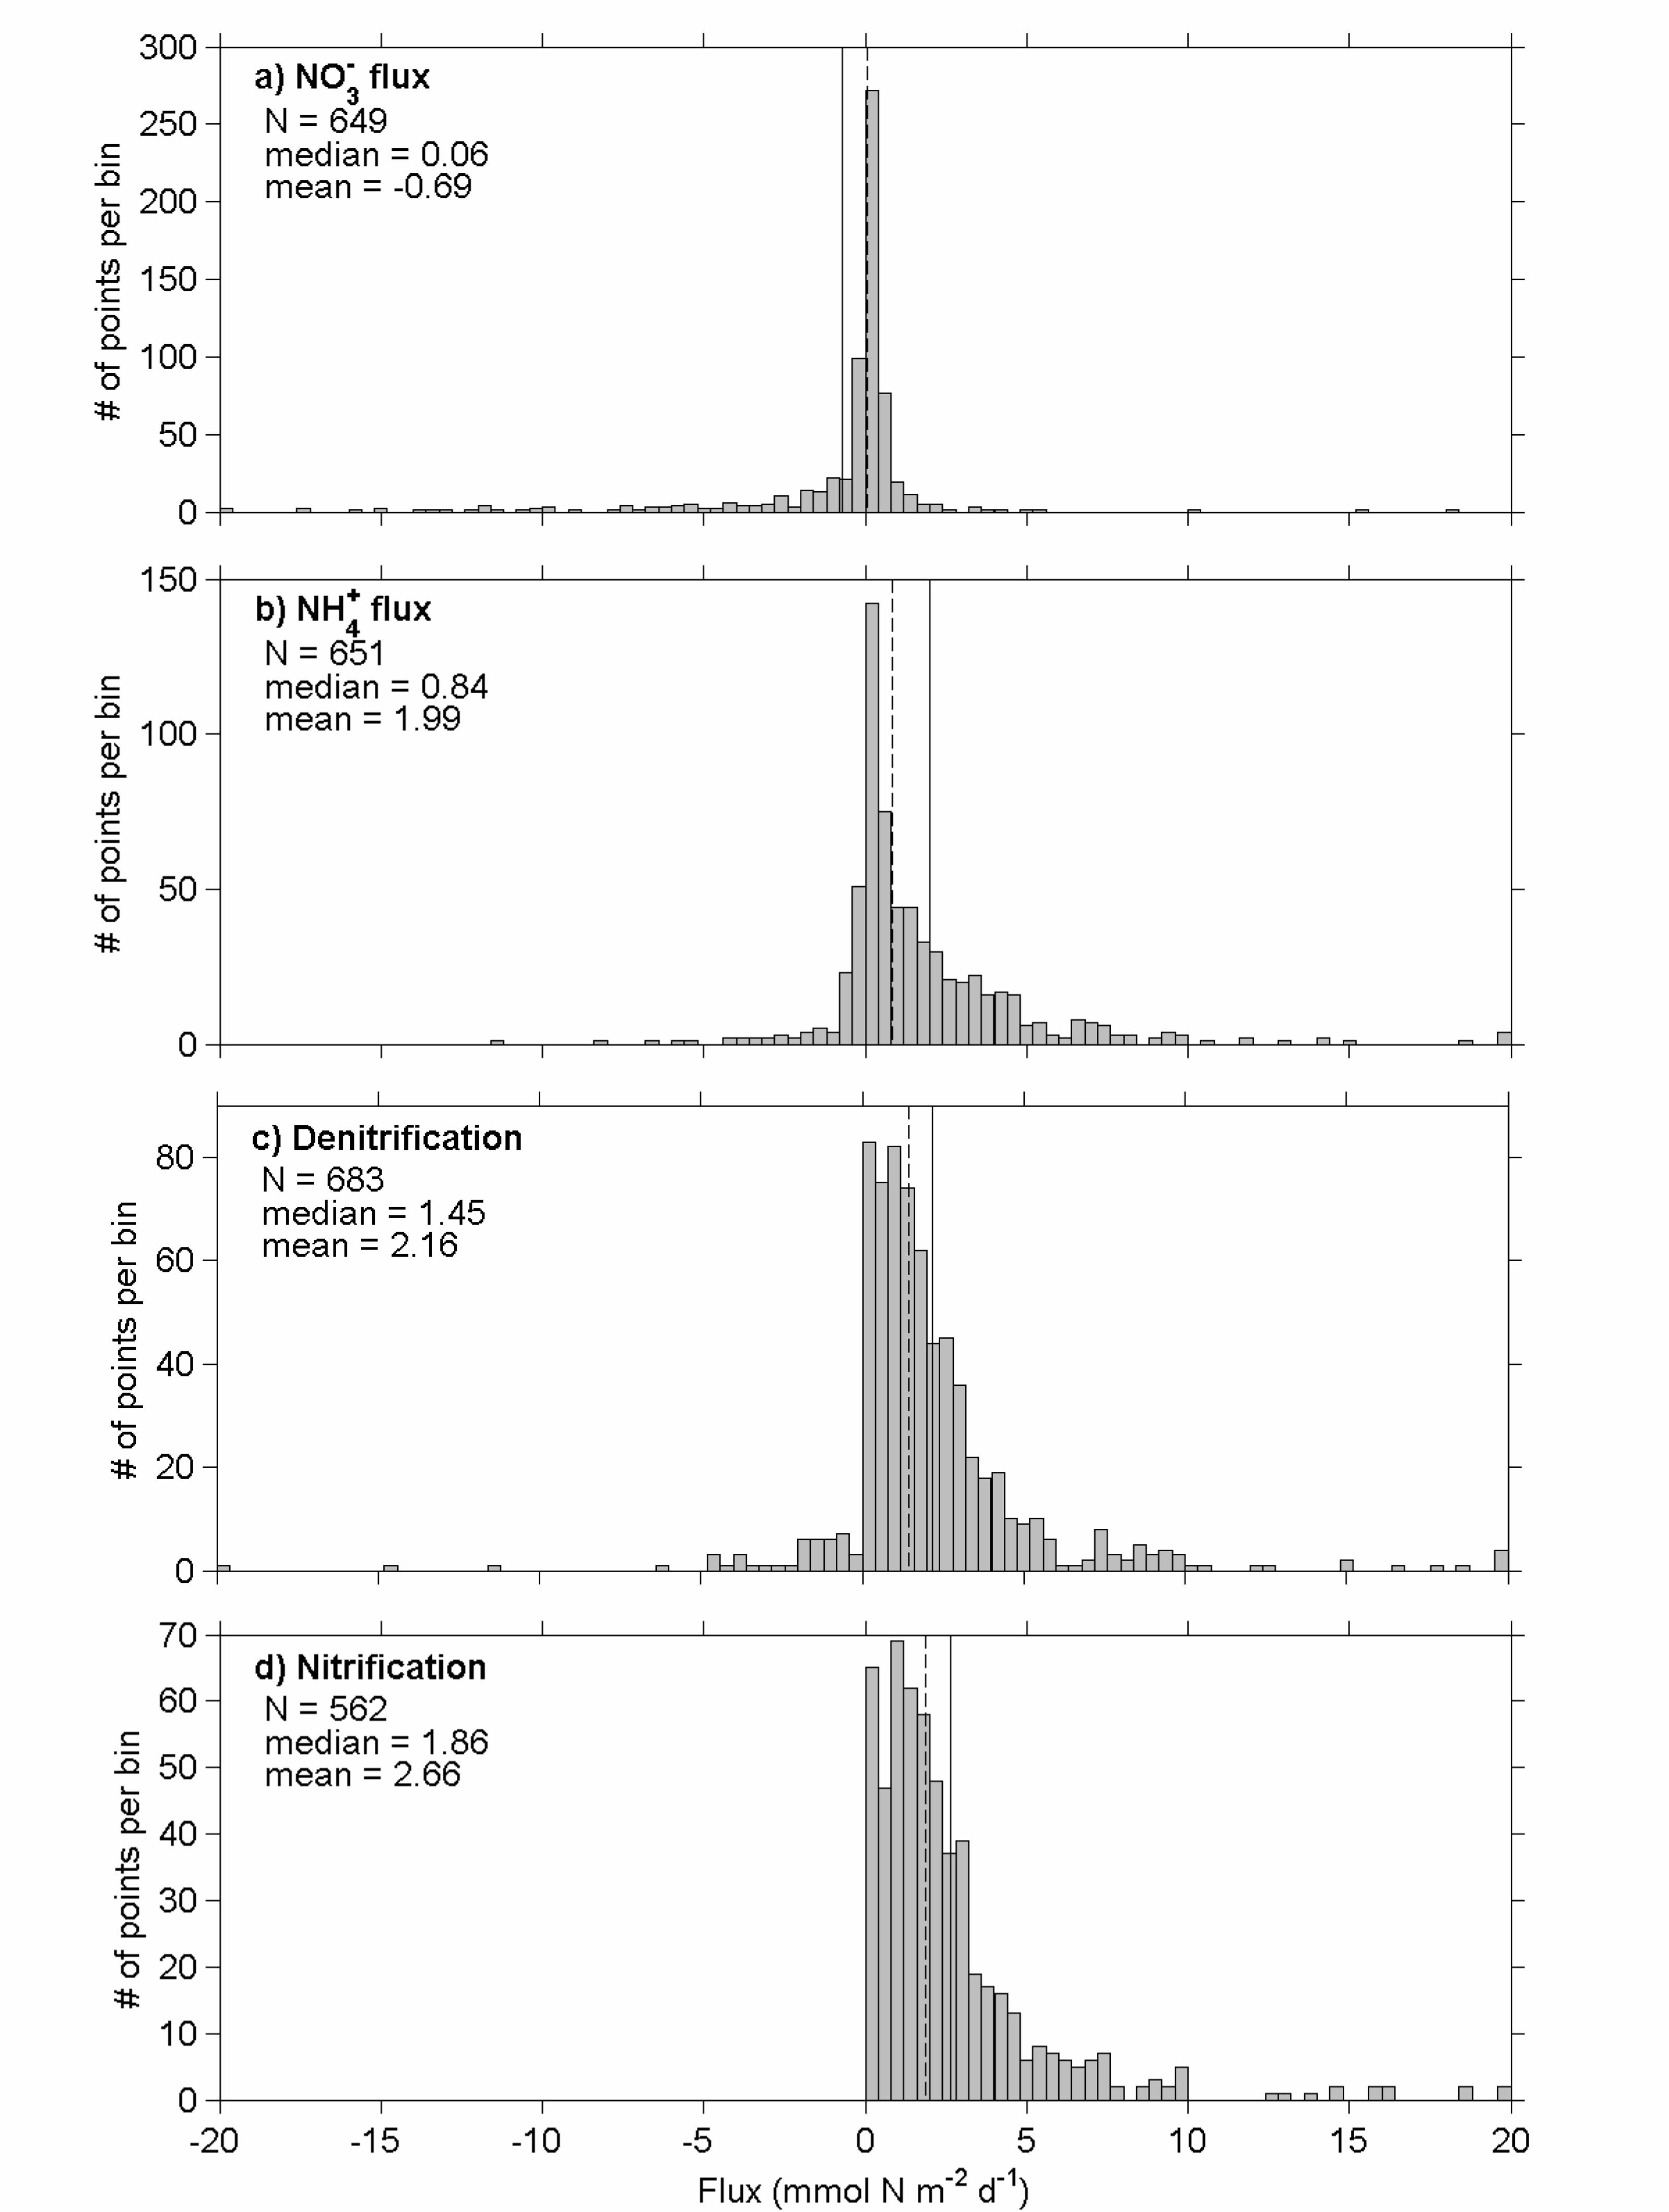
On average, the sediments in our data collection are a net sink of bioavailable nitrogen 11
with a mean and median denitrification rate of 2.2 mmol N m–2 d–1 and 1.5 mmol N m–2 12
d–1, respectively, and consumed oxygen at a mean and median rate of 27.0 and 20.1 13
mmol O2 m–2 d–1, respectively (Figures 1c, 2a). On average, the flux of nitrate and 14
phosphate into bottom waters is negligible, with median fluxes of 0.06 mmol NO3 m–2 d–1 15
and 0.03 mmol PO4 m–2 d–1 (Figure 1, phosphate flux not shown). Recycled bioavailable 16
nitrogen is returned to the bottom water as ammonium at mean and median rates of 2.0 17
and 0.84 mmol N m–2 d–1, respectively (Figure 1b). 18
19
There are 39 data points with net nitrogen fixation in our data set; 15 from Narragansett 20
Bay sediments, 22 from Corpus Christi Bay and 2 from Old Woman Creek. Biological 21
nitrogen fixation associated with autotrophic nitrogen fixers, such as cyanobacterial mats 22
and seagrass beds, occurs in shallow subtropical and tropical sediments, and can be an 23

Denitrification in Aquatic Sediments
- 19 -
important nitrogen source (Paerl & Zehr 2000). Nitrogen fixers in Old Woman Creek 1
and Corpus Christi Bay are probably cyanobacteria (McCarthy et al. 2007, 2008). 2
However, no cyanobacterial pigments were found in Narraganset Bay sediments, where 3
high rates (3 to 5 mmol N m–2 d–1) were observed during the summer of 2006 (Fulweiler 4
et al. 2007). The N2:Ar technique only measures the net N2 flux resulting from both 5
denitrification and nitrogen fixation, thus masking the individual contributions of both 6
processes. However, when combined with the isotope-pairing technique (An et al. 2001; 7
Gardner et al. 2006), individual rates can be estimated simultaneously (with the caveat 8
that rates may be sensitive to the bottom-water nitrate concentration and thus can be 9
affected by the addition of isotopically labeled nitrate). Nitrogen fixation and 10
denitrification occurred simultaneously in estuaries of the northern Gulf of Mexico at 11
rates an order of magnitude above the observed net N2 flux (Gardner et al. 2006). 12
13
We estimated the nitrification rate as the sum of N2, NO3− and NO2
− efflux from the 14
sediment (data points with net N2 flux into the sediment were excluded from this 15
calculation). On average (median), 17% of the total sediment oxygen consumption is due 16
to nitrification of ammonium to nitrite or nitrate. 17
18
We assessed the potential contribution of bottom water nitrate to the observed 19
denitrification flux (i.e. the potential for direct denitrification), assuming that any uptake 20
of bottom-water nitrate by the sediment would be denitrified. This assumption will 21
overestimate the importance of direct denitrification where dissimilatory nitrate reduction 22

Denitrification in Aquatic Sediments
- 20 -
to ammonium is important. Even so, in most of our data points (75%), the potential 1
contribution of bottom-water nitrate to the observed denitrification flux was small (<1%). 2
3
The oxidation of organic carbon in sediments occurs through aerobic mineralization as do 4
a range of anaerobic processes, including denitrification, and manganese, iron and sulfate 5
reduction. The rate of carbon oxidation by all processes other than denitrification can be 6
approximated as the difference between total sediment oxygen consumption and oxygen 7
consumption during nitrification, assuming a respiratory coefficient of one (one mole of 8
O2 is used in the oxidation of one mol of organic carbon; see Giblin et al. 1997, Rysgaard 9
et al. 1998). We calculated total carbon oxidation as the sum of carbon oxidation by 10
denitrification, assuming a C:N ratio of 106:84.8, and carbon oxidation by all other 11
processes based on sediment oxygen consumption (Figure 2b; see Table 2 for detail on 12
the calculation). The resulting median rate is 19 mmol C m–2 d–1 and 11% (median) of 13
this rate is supported by denitrification (Figure 2c). 14
15
Environmental control on N cycling processes 16
A number of studies report relationships between sediment nitrogen cycling processes 17
and environmental variables/characteristics. For example, a decrease of nitrification (and 18
subsequent increase of ammonium efflux from the sediment) with decreasing 19
concentrations of bottom-water oxygen has been observed (Klump & Martens 1987; 20
Kemp et al. 1990; Caffrey et al. 1993). An increase in the mean ammonium flux from the 21
sediment with increasing salinity was observed in Texas estuaries and attributed to an 22
increase in dissimalatory nitrate reduction to ammonium (DNRA) relative to 23

Denitrification in Aquatic Sediments
- 21 -
denitrification (Gardner et al. 2006). An increase in total and direct denitrification was 1
related to increasing concentrations of nitrate in the bottom water (Kana et al. 1998 and 2
references therein). We used our data compilation, which spans a range of systems and 3
environmental conditions, to assess whether these relationships are robust across systems. 4
5
Bottom-water oxygen concentrations in our data set range between 62 and 440 mmol O2 6
m–3 with a median of 203 mmol O2 m–3. When comparing the median nitrification fluxes 7
for bottom water oxygen concentrations smaller and larger than 94 mmol O2 m–3 (2.2 and 8
2.3 mmol N m–2 d–1, respectively), only a small and statistically insignificant increase is 9
seen, probably because we do not have a good representation of low oxygen 10
environments in our data set. 11
12
We investigated whether ammonium fluxes increase with increasing salinity in our data 13
set by comparing total ammonium efflux and the ammonium fraction of the total nitrogen 14
flux from our two freshwater systems to the flux from Chesapeake Bay, Corpus Christi 15
Bay and the Middle Atlantic Bight coastal regions (salinities of 0, 15 to 20, 24 to 28 and 16
30 to 32 PSU, respectively; see Table 1). We found a small, statistically insignificant 17
decrease in ammonium fluxes with increasing salinity. To account for differences in 18
sediment type, nutrient loading and organic matter supply to the sediment between these 19
systems, we also compared the ratio of ammonium efflux to total nitrogen flux and found 20
an increase with increasing salinities, in agreement with the results from Texas estuaries 21
(Gardner et al. 2006). However, the differences in median are not statistically significant, 22

Denitrification in Aquatic Sediments
- 22 -
hence, no general conclusions about the relationship between ammonium fluxes and 1
salinity can be drawn. 2
3
We found an increase of total denitrification with increasing bottom water nitrate 4
concentrations as well as an increase in the ratio of sediment nitrate uptake to total 5
denitrification (which one can interpret as an increase in the rate of direct denitrification). 6
For bottom water nitrate concentrations below and above 40 mmol N m–3, the median 7
denitrification fluxes are 1.8 and 2.6 mmol N m–2 d–1, respectively. The difference is 8
statistically highly significant (p < 0.0001). The median ratios of sediment nitrate uptake 9
to total denitrification are 0 and 0.83 for bottom-water nitrate concentrations below and 10
above 40 mmol N m–3, respectively (significant at p < 0.001). 11
12
APPLICATION OF DATA TO MODELS 13
Denitrification in aquatic sediments has long been recognized as an important sink of 14
fixed nitrogen. Approaches to modeling denitrification are crucial for a meaningful 15
extrapolation of local estimates of denitrification to larger spatial and temporal scales, as 16
well as for inclusion of this process in predictive models of aquatic ecosystems. Two 17
principal approaches for describing the impacts of sediment denitrification on nitrogen 18
fluxes across the sediment-water interface exist and have been described above (‘Model 19
approaches’): empirical parameterizations and detailed mechanistic descriptions of 20
diagenetic processes. Integration of these model approaches with measurements is 21
crucial, but qualitatively different for both approaches. While empirical 22
parameterizations are inherently data-based, the diagenetic models do not use 23

Denitrification in Aquatic Sediments
- 23 -
observations directly. Diagenetic models require specification of a number of model 1
parameters, the validity of which can typically only be estimated a posteriori, by 2
comparing model predictions with observations. 3
4
Our data compilation allows us to look for relationships between variables that could 5
potentially be used to improve predictive parameterizations of denitrification, to 6
reevaluate published parameterizations, and to evaluate the denitrification rates predicted 7
by diagenetic models. While diagenetic models have typically been applied to specific 8
sites, the model of Soetaert et al. (1996b) has been generalized to cover the global scale 9
by means of a meta-analysis (Middelburg et al. 1996). We will use this meta-analysis 10
below as an example of a diagenetic model. We first discuss a multivariate regression 11
analysis of our data set and reevaluate the regression between denitrification and 12
sediment oxygen consumption; we then analyze differences between nitrogen and 13
phosphate fluxes across the sediment-water interface; finally, we discuss qualitative 14
differences between parameterizations and diagenetic models by contrasting 15
denitrification fluxes predicted by a diagenetic model (Middelburg et al. 1996; Soetaert et 16
al. 1996b) with an empirical relationship derived from our data set. 17
18
Regression analysis 19
The existence of robust relationships between nitrogen cycling processes and 20
environmental variables, such as organic matter supply, sediment oxygen consumption, 21
benthic community structure, sediment type, seasonality or trophic status, and across a 22
diversity of systems would underpin predictive modeling of denitrification beyond the 23
Denitrification in Aquatic Sediments
- 24 -
regional scale of individual studies. We assessed whether previously reported 1
relationships, like a decrease of nitrification for low bottom water oxygen concentrations, 2
an increase of ammonium efflux with increasing salinity, or an increase in the 3
contribution of direct to total denitrification with increasing bottom water nitrate 4
concentrations are expressed in our data compilation. The only relationship we found to 5
be robust was the increase of direct denitrification with increasing bottom water nitrate 6
(‘Environmental control on N cycling processes’). 7
8
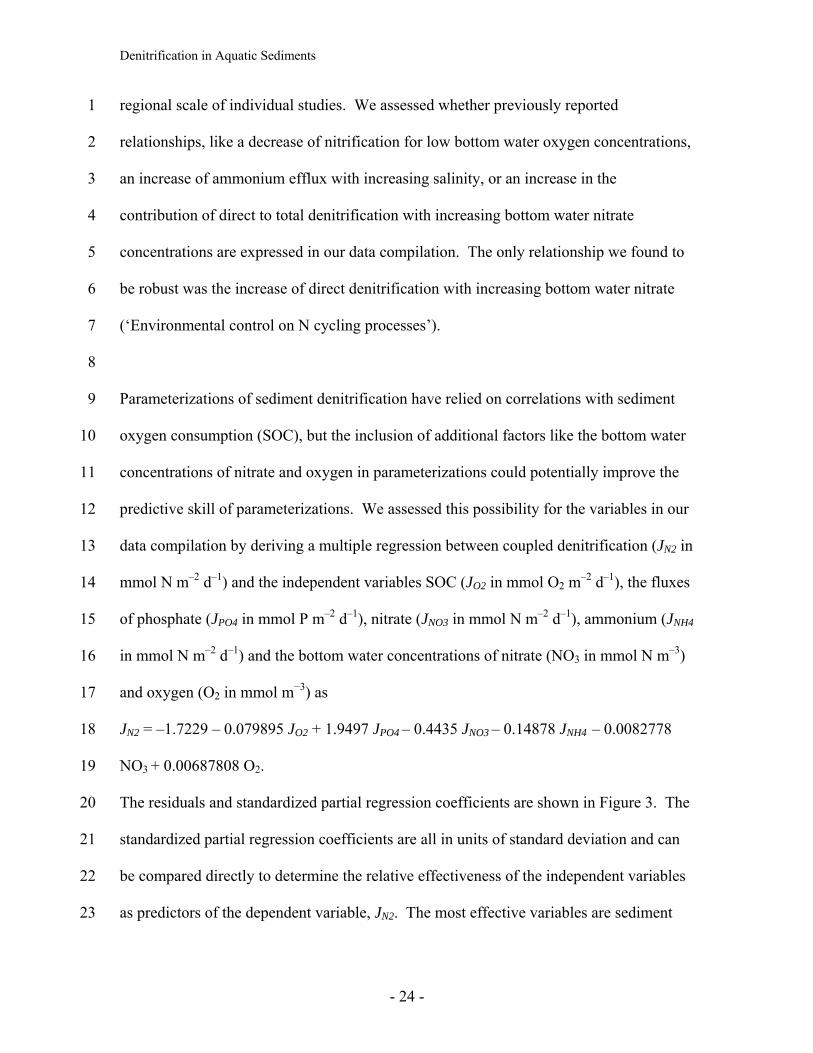
Parameterizations of sediment denitrification have relied on correlations with sediment 9
oxygen consumption (SOC), but the inclusion of additional factors like the bottom water 10
concentrations of nitrate and oxygen in parameterizations could potentially improve the 11
predictive skill of parameterizations. We assessed this possibility for the variables in our 12
data compilation by deriving a multiple regression between coupled denitrification (JN2 in 13
mmol N m–2 d–1) and the independent variables SOC (JO2 in mmol O2 m–2 d–1), the fluxes 14
of phosphate (JPO4 in mmol P m–2 d–1), nitrate (JNO3 in mmol N m–2 d–1), ammonium (JNH4 15
in mmol N m–2 d–1) and the bottom water concentrations of nitrate (NO3 in mmol N m–3) 16
and oxygen (O2 in mmol m−3) as 17
JN2 = –1.7229 – 0.079895 JO2 + 1.9497 JPO4 – 0.4435 JNO3 – 0.14878 JNH4 – 0.0082778 18
NO3 + 0.00687808 O2. 19
The residuals and standardized partial regression coefficients are shown in Figure 3. The 20
standardized partial regression coefficients are all in units of standard deviation and can 21
be compared directly to determine the relative effectiveness of the independent variables 22
as predictors of the dependent variable, JN2. The most effective variables are sediment 23

Denitrification in Aquatic Sediments
- 25 -
oxygen consumption and the sediment-water flux of nitrate. In contrast to our 1
expectation, the bottom-water concentrations of nitrate and oxygen are the least effective 2
predictors in the overall regression. By iteratively removing the least effective 3
independent variable (i.e. the variable with the smallest standardized partial regression), 4
we determined regressions for smaller subsets of the independent variables. It became 5
apparent that the bottom water concentrations (i.e. variables that are comparatively easy 6
to measure or estimate) added little predictive power (the R value decreased 7
insignificantly, from 0.68 to 0.67). 8
9
We also derived a linear regression between the coupled nitrification-denitrification flux 10
and sediment oxygen consumption using all data points in our data set (Figure 4, red line) 11
and using only data points where no net N fixation occurs (Figure 4, green line). Both 12
relationships are statistically significant at the 1% level (F test). The slope of this 13
relationship (0.09) is comparable to but lower than Seitzinger & Giblin’s (1996) slope of 14
0.12. This discrepancy is not surprising given the larger data set used here. The 15
relatively low R value of 0.55 in our regression is likely due to differences in sediment 16
type and biogeochemical environment across systems. For example, variations in the 17
relative importance of canonical denitrification and anammox to the total rate of N2 18
production would lead to a different stoichiometry and thus different regression 19
coefficients. The most important difference between anammox and canonical 20
denitrification is that anammox does not involve oxidation of organic matter. Anammox 21
is not directly tied to carbon oxidation but depends on the supply of NO3− and NO2
− that 22
is mostly derived from nitrification of ammonium produced in the respiration of organic 23

Denitrification in Aquatic Sediments
- 26 -
matter (an indirect link to organic matter oxidation). Hence, the C-to-O-to-N 1
stoichiometry of N2 production via the pathway of ammonification → nitrification → 2
canonical denitrification is different from that of N2 production via ammonification → 3
nitrification → anammox. Our data set is not comprehensive enough to assess the 4
relative importance of both pathways. One would need coincident measurements of 5
sediment-water fluxes of CO2, O2 and all the nitrogen species. 6
7
Phosphate fluxes 8
The fate of mineralized phosphate in sediments is qualitatively different than that of 9
mineralized nitrogen, in that phosphate is bound to iron and manganese minerals under 10
oxic conditions. It has been suggested that the extent to which phosphate can be bound in 11
sediments is dramatically different between freshwater and brackish/marine systems, and 12
that phosphate is essentially a conservative tracer of benthic decomposition in marine 13
sediments, but is strongly retained in freshwater sediments (Caraco et al. 1990). This 14
apparent difference was suggested to explain the observed differences in nutrient 15
limitation between marine and freshwater systems, with nitrogen often limiting in marine 16
systems and phosphorus more typically limiting in freshwater systems (Caraco et al. 17
1990). 18
19
We analyzed the N* (N* = N 16P) of sediment-water nutrient fluxes to see whether 20
our data are consistent with the notion that phosphate is a conservative tracer of benthic 21
decomposition in marine sediments and whether there are systematic differences in the 22
stoichiometry of the nutrient return flux from sediments between freshwater and marine 23

Denitrification in Aquatic Sediments
- 27 -
systems. The N* values of total nitrogen (N2 + NO3− + NH4
+) flux versus phosphate flux 1
are shown in Figure 5 for all our data points and separately for freshwater and marine 2
systems. In all three cases the mean N* is significantly larger than zero which 3
corresponds to the canonical Redfield ratio of 16 (t-test, p << 0.01). Our data thus 4
indicates that phosphate is retained more strongly than nitrogen in the sediments 5
represented in our data set (all are overlaid by oxic bottom waters) and hence not a 6
conservative tracer of benthic remineralization. However, the analysis in Figure 5 7
includes nitrogen that is returned as biologically unavailable N2 gas and thus not directly 8
relevant for assessing nutrient limitation. We repeated the analysis for N* calculated 9
from the bioavailable nitrogen (NO3− + NH4
+) flux versus phosphate flux (Figure 6). In 10
this case the N* values are not statistically different from zero (t-test, 1% significance 11
level). In other words the stoichiometry of nutrient fluxes from the sediment is 12
statistically not significantly different from the Redfield ratio of 16. Our data hence 13
suggest that both processes, phosphate retention in sediments and nitrogen removal 14
through denitrification, contribute to the N:P stoichiometry of bioavailable nutrients 15
returned from the sediment. Since our analysis does not suggest consistent differences in 16
the N:P ratio of returned bioavailable nutrients, sediment nutrient fluxes do not appear to 17
be a good explanation for the change in nutrient limitation from fresh to salt water, at 18
least not in our data set which is limited for freshwater systems. 19
20
Diagenetic model versus parameterization 21
Detailed diagenetic models and simpler empirical parameterizations have different 22
strengths and limitations. The empirical parameterizations are inherently data-based, 23

Denitrification in Aquatic Sediments
- 28 -
have the advantage of being conceptually simple and easy to implement, but they cannot 1
capture strong non-linearities or system hysteresis, for example the non-linear response to 2
nutrient reduction observed in the Chesapeake Bay (Kemp et al. 2005). Diagenetic 3
models are based on a mechanistic understanding of sediment processes, include 4
nonlinear feedback mechanisms and can include temporal dependencies such as delays or 5
storage of organic matter. As such they are more flexible and have the potential to 6
correctly predict system responses to changes in eutrophication status or oxygen supply; 7
for example, the Sediment Flux Model applied to data from a mesocosm eutrophication 8
experiment (see our ‘Layered dynamic models’ subsection; DiToro 2001). They can 9
also be extremely useful tools to further our mechanistic understanding; for example, the 10
microzone model (see ‘Microenvironments’ subsection) can explain the counterintuitive 11
observation of rapid denitrification observed in the presence of oxic pore water in 12
continental shelf sands with very low pore water nitrate concentrations (Rao et al. 2007). 13
On the other hand, these mechanistic models typically require detailed knowledge about 14
parameter values, such as reaction kinetics and sediment characteristics. For example, 15
the microzone denitrification model requires knowledge about the size, reactivity, and 16
composition of reactive sediment microenvironments. Likewise, layered diagenetic 17
models require a number of parameters describing reaction kinetics, sediment porosity 18
and assumptions about organic matter lability. 19
20
Middelburg et al. (1996) applied the diagenetic model of Soeteart et al. (1996) to the 21
global ocean by assuming uniform values for rate, limitation and inhibition parameters, 22
and a uniform porosity profile. However, their predicted denitrification rates show a 23

Denitrification in Aquatic Sediments
- 29 -
markedly different behavior than our data compilation suggests and overestimate the 1
observations for SOC rates, ranging from 5 to 50 mmol O2 m–2 d–1 (Figure 4). Note that 2
their parameterization relates denitrification to organic matter flux, which we considered 3
equal to sediment oxygen consumption (assuming steady state and a metabolic quotient 4
of 1 mol C:1 mol O2). Because of the observational and conceptual difficulties with 5
sedimentation flux in shallow systems, we recommend using SOC instead of 6
sedimentation flux when deriving parameterizations using denitrification measurements, 7
although sedimentation flux is typically the relevant quantity predicted by ecosystem 8
models coupled to hydrodynamic models or General Circulation Models. The poor 9
agreement between the observed denitrification rates and the rates predicted by the 10
diagenetic model may indicate that parameters and porosity profiles are not globally 11
applicable, as had been assumed. This interpretation is consistent with our finding that 12
bottom-water nitrate and oxygen concentrations were the least effective predictors in our 13
data set when included in a multivariate regression between denitrification and SOC (they 14
improved the coefficient of determination only insignificantly), while they were the most 15
important drivers in determining denitrification in sensitivity studies with the diagenetic 16
model (Soetaert et al. 1996). Assessing whether this discrepancy is indeed due to 17
differences like hydrographic setting, sediment type and benthic community across 18
systems is beyond the scope of this study. In a systematic assessment, one would apply 19
the diagnetic model to different sites that have detailed observations including pore water 20
profiles available. 21
22
23
CONCLUSIONS 24

Denitrification in Aquatic Sediments
- 30 -
There are no conceptual or technical difficulties in applying empirical parameterizations 1
or diagenetic models to large spatial scales. However, because diagenetic models are 2
typically tuned to match observations at specific sites there is no guarantee they will 3
make good predictors across larger spatial scales. The major difficulty thus lies in 4
evaluating fluxes predicted by diagenetic models against observations. We compared 5
denitrification rates predicted by a diagenetic model (Middelburg et al. 1996) with 6
observations in our data compilation after converting the organic carbon sedimentation 7
flux to sediment oxygen consumption units and found that the diagenetically predicted 8
fluxes significantly overestimate observed fluxes. Systematic studies will be necessary to 9
elucidate the underlying reasons; it is likely that regional adaptations of the model for 10
different environments and sediment types will be necessary. This would require a 11
spatially explicit characterization of benthic environments/sediment types, along with rate 12
measurements in all characteristic environments. 13
14
Based on our analysis, we recommend using empirical regressions between SOC and 15
denitrification for predicting denitrification in oxic bottom waters. We calculated the 16
linear relationship between sediment denitrification and sediment oxygen consumption 17
suggested by Seitzinger & Giblin (1996) for the larger data set compiled here and found a 18
similar regression slope, but a much smaller coefficient of determination (Figure 4). One 19
reason for the uncertainty in our regression may be variations in the relative importance 20
of canonical denitrification versus anammox across different systems, since the 21
underlying stoichiometries are different. Inclusion of bottom water concentrations of 22

Denitrification in Aquatic Sediments
- 31 -
nitrate and oxygen in a multivariate regression did not improve the coefficient of 1
determination significantly. 2
3
For suboxic and anoxic bottom waters (oxygen concentrations below 63 mmol O2 m−3) 4
strong feedbacks on elemental cycling can occur, but these conditions were not 5
represented in our data set. Perhaps the most relevant feedback in this context is the 6
inhibition of nitrification and thus denitrification at these low oxygen levels (Childs et al. 7
2002). A linear parameterization of SOC and denitrification cannot capture this response 8
and a non-linear multivariate regression based either exclusively on measurements or on 9
a combination of measurements and model-predicted rates will be necessary for such 10
cases. 11
12
Acknowledgements: Discussions reflected in this paper were initiated in November 13
2006 at a Modeling Workshop organized by the Research Coordination Network on 14
Denitrification (http://www.denitrification.org/). We thank the organizers and gratefully 15
acknowledge the constructive criticism from Eric Davidson and two anonymous 16
reviewers. We thank Jane Tucker for working up the data sets from Massachusetts Bay 17
and Boston Harbor. Financial support for AEG to work on the manuscript came from 18
NSF NSF-DEB-0423565. KF, DB and DDT acknowledge support from NOAA CHRP 19
grant NA07NOS4780191. NOAA publication number 102. 20
21

Denitrification in Aquatic Sediments
- 32 -
Table 1: Data sources, measurement methods and references. 1 Region
Site Description (# of data points)
Salinity Measurement technique
Lake Champlain (15)
0
Box core samples were taken; fluxes and overlying water concentrations of NH4, NO3, PO4, O2 were measured; methods described in Cornwell & Owens (1999); tabulated data from DiToro (2001)
Old Woman Creek hypereutrophic wetland,
Lake Erie (72)
0
Sediment cores were incubated in a continuous-flow system; N2:Ar ratios were measured with membrane-inlet mass spectrometry (MIMS); data from McCarthy et al. (2007)
Chesapeake Bay eutrophic, seasonally hypoxic estuary (82)
15–20
Box core samples were taken; fluxes and overlying water concentrations of NH4, NO3, PO4, O2 were measured; methods described in Cowan & Boynton (1996); tabulated data from DiToro (2001)
Corpus Christi Bay estuary on the shoreline of
the Gulf of Mexico (55)
25–29
Sediment cores were incubated in a continuous-flow system; N2:Ar ratios were measured with MIMS; data from McCarthy et al. (2008)
Narragansett Bay Mid-Atlantic Bight inner
shelf (93) 30–32
Sediment cores were incubated; N2:Ar ratios were measured with MIMS; data from Fulweiler et al. (2007); Fulweiler (2007); Fulweiler & Nixon (in press)
New Jersey Shelf coastal ocean in the Mid-
Atlantic Bight (20) 30–32
In situ benthic chambers; N2:Ar ratios measured with MIMS; data from Laursen & Seitzinger (2002)
Mesocosms facility at the Univ. of
Rhode Island (139)
30–32
Fluxes and overlying water concentrations of NH4, NO3, PO4, O2 were measured in mesocosms; data from the Nutrient Addition Experiment (Oviatt et al. 1986); tabulated data from DiToro (2001)
Boston Harbor Gulf of Maine inner shelf
(32) 28–34
Sediment cores were incubated at in situ temperatures; fluxes of O2, PO4, NH4, NO3 + NO2 were measured using standard techniques (Giblin et al. 1997); N2:Ar ratios measured with MIMS
Massachusetts Bay Gulf of Maine inner shelf
(48) 32–34
Same as Boston Harbor
Gulf of Mexico Coastal, seasonally hypoxic
ocean (36)
32–34
Sediment cores were incubated in a continuous-flow system; N2:Ar ratios were measured with MIMS; data Gardner & McCarthy (unpublished)
Mississippi River Plume Gulf of Mexico (4)
32–34 Benthic chambers; N2 fluxes estimated stoichiometrically; data from Gardner et al. ( 1993)
South Atlantic Bight (4)
oceanic Sediment oxygen consumption and denitrification calculated from volumetric rates obtained in sediment columns (Rao et al. 2007)
East China Sea (21)
oceanic Sediment care incubations; described in Aller et al. (1985)
Different shelf and open ocean regions
(41) oceanic
Data compilation from Middelburg et al. (1997)
Washington Shelf continental shelf
(17) oceanic
In situ benthic chambers; N2 fluxes measured with gas chromatography; data from Devol & Christensen (1993)
Western Arctic Shelf Continental shelf
(22) oceanic
In situ benthic chambers; N2 fluxes measured with gas chromatography; data from Devol et al. (1997)
2 3

Denitrification in Aquatic Sediments
- 33 -
Table 2: List of symbols and formulae for derived quantities. 1 2 Symbol Description Unit JN2 N2 flux across sediment-water interface due to
sediment denitrification mmol N m−2 d−1
JO2 O2 flux across sediment-water interface due to sediment oxygen consumption
mmol O2 m−2 d−1
JNH4 NH4+ flux across sediment-water interface mmol N m−2 d−1
JNO3 NO3− flux across sediment-water interface mmol N m−2 d−1
JPNH4 Production of NH4+ (ammonification rate) mmol N m−2 d−1
JPNO3 Production of NO3− (nitrification rate) mmol N m−2 d−1
JPCO2 Production of CO2 (total carbon oxidation rate) mmol C m−2 d−1 JPCO2;DNF Production of CO2 due to denitrification
(carbon oxidation attributed to denitrification) mmol C m−2 d−1
Derived quantities Applied to JN2 = −JO2/6.625 − JNO3 − JNH4 Data from Chesapeake Bay, University of
Rhode Island mesocosms, Lake Champlain JN2 = JPNH4 − JNH4 − JNO3 East China Sea data JPNO3 = JN2 + JNO3 All data points with JN2 > 0 (i.e. with net
denitrification) JPCO2 = (106/84.8) JN2 − JO2 − 2 JPNO3 All data points with JN2 > 0 JPCO2;DNF = (106/84.8) JN2/JPCO2 All data points with JN2 > 0 3
4
Denitrification in Aquatic Sediments
- 34 -
Figure 1: Histogram, mean (solid line) and median (dashed line) N fluxes in our data set. 1
Positive values indicate efflux from the sediments. Negative values indicate uptake by 2
the sediments. Positive and negative outliers are collected in the bins for the largest and 3
smallest value, respectively. 4
Figure 2: Histogram, mean (solid line) and median (dashed line) sediment oxygen 5
consumption (SOC), total carbon oxidation and the fraction of carbon oxidation carried 6
out by denitrifiers in our data set. Positive outliers are collected in the bins for the largest 7
value. 8
Figure 3: Residuals (top panel) and standardized partial regression coefficients (bottom 9
panel) for multiple regression of coupled nitrification-denitrification flux. Independent 10
variables are sediment oxygen consumption (SOC), sediment-water fluxes of phosphate, 11
nitrate and ammonium, and bottom water concentrations of nitrate and oxygen (see 12
‘Regression analysis’ in ‘Results and discussion’ for regression coefficients). Regression 13
coefficients were standardized by multiplying with the ratio of standard deviations of the 14
independent and dependent variable. Standardized partial regression coefficients can be 15
compared directly to assess which independent variables are most effective in 16
determining the denitrification flux. 17
Figure 4: Linear regression (red line) of denitrification and sediment oxygen 18
consumption (SOC) for all of our data points (gray dots) and excluding data points with 19
net N2 flux into the sediment, i.e. when net N fixation is occurring (green line, with 50% 20
confidence limits as dashed lines) in comparison with Seitzinger & Giblin’s (1996) 21
regression (blue line) and Middelburg et al.’s (1996) parameterization (magenta line). 22

Denitrification in Aquatic Sediments
- 35 -
Note that Middelburg’s parameterization relates carbon flux to denitrification flux. We 1
converted from carbon flux to SOC, assuming a 1 mol C:1 mol O2 quotient. 2
Figure 5: Histogram, mean (solid line) and median (dashed line) for N* of total 3
remineralized nitrogen (NH4+ + NO3
− + N2) versus phosphate flux (N*=N16P) for all 4
data points (top), freshwater only (middle) and marine systems only (bottom). The N* of 5
zero corresponds to the Redfield ratio and is indicated by the dotted line. Outliers that 6
fall outside the axis range are collected in the largest and smallest bins. 7
Figure 6: As in Figure 5, but for bioavailable nitrogen flux (NH4+ + NO3
−). 8
9

Denitrification in Aquatic Sediments
- 36 -
References 1
Aller RC (1980) Quantifying solute distributions in the bioturbated zone of marine 2 sediments by defining an average microenvironment. Geochim Cosmochim Acta 3 44(12):1955–1965 4
Aller RC (1988) Benthic fauna and biogeochemical processes in marine sediments: the 5 role of burrow structures. In: Blackburn TH, Soerensen J (eds) Nitrogen Cycling in 6 Coastal Marine Environments. John Wiley & Sons Ltd;. pp 301–338 7
Aller RC, Mackin JE, Ullman WJ, Wang CH, Tsai SM, Jin JC, et al. (1985) Early 8 chemical diagenesis, sediment-water solute exchange, and storage of reactive organic 9 matter near the mouth of the Changjiang, East China Sea. Cont.Shelf Res.;4(1/2):227-51. 10
Altabet MA, Francois R, Murray DW, Prell WL (1995) Climate-related variations in 11 denitrification in the Arabian Sea from sediment 15 N/14 N ratios. Nature 12 373(6514):506–509 13
Bender M, Jahnke R, Weiss R, Martin W, Heggie DT, Orchardo J, et al. (1989) Organic 14 carbon oxidation and benthic nitrogen and silica dynamics in San Clemente Basin, a 15 continental borderland site. Geochim Cosmochim Acta 53(3):685–697 16
Berner RA (1980) Early diagenesis: A theoretical approach. Princeton University Press, 17 Princeton 18
Billen G, Garnier J (1999) Nitrogen transfers through the Seine drainage network: a 19 budget based on the application of the Riverstrahler'model. Hydrobiologia 410:139–150 20
Billen G, Garnier J, Hanset P (1994) Modelling phytoplankton development in whole 21 drainage networks: the RIVERSTRAHLER Model applied to the Seine river system. 22 Hydrobiologia 289(1):119–137. 23
Boudreau BP (1997) Diagenetic models and their implementation: Modelling transport 24 and reactions in aquatic sediments. Springer, Berlin 25
Boyer EW, Alexander RB, Parton WJ, Li C, Butterbach-Bahl K, Donner SD, et al. (2006) 26 Modeling denitrification in terrestrial and aquatic ecosystems at regional scales: current 27 approaches and needs. Ecol Appl 16:2123–2142. 28
Burdige DJ (2006) Geochemistry of Marine Sediments. Princeton University Press, 29 Princeton 30
Caffrey JM, Sloth NP, Kaspar HF, Blackburn TH (1993) Effect of organic loading on 31 nitrification and denitrification in a marine microcosm. FEMS Microbiol Ecol 12:159–32 167 33
Caraco N, Cole J, Likens GE (1990) A comparison of phosphorus immobilization in 34 sediments of freshwater and coastal marine systems. Biogeochemistry 9(3):277–290. 35

Denitrification in Aquatic Sediments
- 37 -
Cerco CF, Seitzinger SP (1997) Measured and modeled effects of benthic algae on 1 eutrophication in Indian River-Rehoboth Bay, Delaware. Estuar Coasts 20(1):231–248. 2
Christensen JP (1994) Carbon export from continental shelves, denitrification and 3 atmospheric carbon dioxide. Contl Shelf Res 14(5):547–576. 4
Cornwell J, Owens M (1999) Benthic phosphorus cycling in Lake Champlain: Results of 5 an integrated field sampling/water quality modeling study. Part B: Field studies. Lake 6 Champlain Basin Program Tech Rep 7
Cowan JLW, Boynton WR (1996) Sediment-water oxygen and nutrient exchanges along 8 the longitudinal axis of Chesapeake Bay: Seasonal patterns, controlling factors and 9 ecological significance. Estuaries 19(3):562–580 10
Dalsgaard T, Canfield DE, Petersen J, Thamdrup B, Acuna-Gonzalez J (2003) N2 11 production by the anammox reaction in the anoxic water column of Golfo Dulce, Costa 12 Rica. Nature 422(6932):606–608 13
Devol AH (2008) Chapter 6: Denitrification including Anammox. In: Capone D, 14 Carpenter E, Mullholland M, Bronk D (eds) Nitrogen in the Marine Environment. 15 Elsevier, Amsterdam, pp 263–302 16
Devol AH, Christensen JP (1993) Benthic fluxes and nitrogen cycling in sediments of the 17 continental margin of the eastern North Pacific. J Mar Res 51:345–372 18
Devol AH, Codispoti LA, Christensen JP (1997) Summer and winter denitrification rates 19 in western Arctic shelf sediments. Cont Shelf Res 17(9):1029–1050. 20
DiToro DM (2001) Sediment flux modeling. Wiley-Interscience, New York 21
DiToro DM, Fitzpatrick JJ (1993) Chesapeake Bay Sediment Flux Model. US EPA 22 Contract Report, Annapolis 23
Emery K (1968) Relict sediments on continental shelves of world. AAPG Bull 24 52(3):445–464. 25
Engström P, Dalsgaard T, Hulth S, Aller RC (2005) Anaerobic ammonium oxidation by 26 nitrite (anammox): Implications for N2 production in coastal marine sediments. Geochim 27 Cosmochim Acta 69(8):2057–2065 28
Falkowski PG (1997) Evolution of the nitrogen cycle and its influence on the biological 29 sequestration of CO2 in the ocean. Nature 387:272–275 30
Fennel K, Follows M, Falkowski PG (2005) The co-evolution of the nitrogen, carbon and 31 oxygen cycles in the Proterozoic Ocean. Am J Sci 305:526–545 32
Fennel K, Wilkin J, Levin J, Moisan J, O’Reilly J, Haidvogel D (2006) Nitrogen cycling 33 in the Middle Atlantic Bight: Results from a three-dimensional model and implications 34

Denitrification in Aquatic Sediments
- 38 -
for the North Atlantic nitrogen budget. Global Biogeochemical Cycles 20, GB3007, 1 doi:10.1029/2005GB002456 2
Fulweiler RW (2007) Climate impacts on benthic-pelagic coupling and biogeochemistry 3 in Narragansett Bay, RI. PhD Dissertation, University of Rhode Island 4
Fulweiler RW, Nixon SW (in press) Responses of benthic-pelagic coupling to climate 5 change in a temperate estuary. Hydrobiologia 6
Fulweiler R, Nixon S, Buckley B, Granger S (2007) Reversal of the net dinitrogen gas 7 flux in coastal marine sediments. Nature 448:180–182 8
Galloway JN, Aber JD, Erisman JW, Seitzinger SP, Howarth RW, Cowling EB, et al. 9 (2003) The nitrogen cascade. Bioscience 53(4):341–356. 10
Gardner WS, Briones EE, Kaegi EC, Rowe GT (1993) Ammonium excretion by benthic 11 invertebrates and sediment-water nitrogen flux in the Gulf of Mexico near the Mississippi 12 River plume. Estuaries 16(4):799–808. 13
Gardner WS, McCarthy MJ, An S, Sobolev D, Sell KS, Brock D (2006) Nitrogen fixation 14 and dissimilatory nitrate reduction to ammonium (DNRA) support nitrogen dynamics in 15 Texas estuaries. Limnol Oceanogr 51(1):558–568 16
Garnier J, Billen G, Coste M (1995) Seasonal succession of diatoms and chlorophyceae 17 in the drainage network of the Seine River: Observations and modeling. Limnol 18 Oceanogr 40(4):750–765 19
Giblin AE, Hopkinson CS, Tucker J (1997) Benthic metabolism and nutrient cycling in 20 Boston Harbor, Massachusetts. Estuaries 20:346–364 21
Gold AJ, Jacinthe PA, Groffman PM, Wright WR, Puffer RH (1998) Patchiness in 22 groundwater nitrate removal in a riparian forest. Environ Qual 27:146–155 23
Harrison J, Maranger R, Alexander RB, Cornwell J, Giblin A, Jacinthe PA, et al. (this 24 issue) The regional and global significance of nitrogen removal in lakes and reservoirs. 25 Biogeochemistry 26
Huettel M, Webster IT (2001) Advective flow in permeable sediments. In: Boudreau BP, 27 Jørgensen BB (eds) The benthic boundary layer: Transport processes and 28 biogeochemistry. Oxford University Press, Oxford pp 144–179 29
Jacinthe PA, Groffman PM, Gold AJ, Mosier A (1998) Patchiness in microbial nitrogen 30 transformations in groundwater in a riparian forest. J Environ Quality 27:156–164 31
Jahnke R (1985) A model of microenvironments in deep-sea sediments: Formation and 32 effects on pore water profiles. Limnol Oceanogr 30(5):956–965 33

Denitrification in Aquatic Sediments
- 39 -
Jahnke RA, Emerson SR, Murray JW (1982) A model of oxygen reduction, 1 denitrification, and organic matter mineralization in marine sediments. Limnol Oceanogr 2 27(4):610–623 3
Jahnke RA, Richards M, Nelson J, Robertson C, Rao A, Jahnke D (2005) Organic matter 4 remineralization and pore water exchange rates in permeable South Atlantic Bight 5 continental shelf sediments. Contl Shelf Res 25:1433–1452 6
Kana TM, Darkangelo C, Hunt MD, Oldham JB, Bennett GE, Cornwell JC (1994) 7 Membrane inlet mass spectrometer for rapid high-precision determination of N2, O2, and 8 Ar in environmental water samples. Anal Chem 66(23):4166–4170 9
Kana TM, Sullivan MB, Cornwell JC, Groszkowski KM (1998) Denitrification in 10 estuarine sediments determined by membrane inlet mass spectrometry. Limnol Oceanogr 11 43(2):334–339 12
Kemp WM, Sampou P, Caffrey J, Mayer M, Henriksen K, Boynton WR (1990) 13 Ammonium recycling versus denitrification in Chesapeake Bay sediments. Limnol 14 Oceanogr 35(7):1545–1563 15
Kemp WM, Boynton WR, Adolf JE, Boesch DF, Boicourt WC, Brush G, et al. (2005) 16 Eutrophication of Chesapeake Bay: historical trends and ecological interactions. Mar 17 Ecol Prog Ser 303:1–29 18
Klump JV, Martens CS (1987) Biogeochemical cycling in an organic-rich coastal marine 19 basin. 5. Sedimentary nitrogen and phosphorus budgets based upon kinetic models mass 20 balaces, and the stoichiometry of nutrient regeneration. Geochim Cosmochim Acta 21 51(5):1161–1173 22
Kuypers MM, Sliekers AO, Lavik G, Schmid M, Jorgensen BB, Kuenen JG, et al. (2003) 23 Anaerobic ammonium oxidation by anammox bacteria in the Black Sea. Nature 24 422(6932):608–11 25
Kuypers MMM, Lavik G, Woebken D, Schmid M, Fuchs BM, Amann R, et al. (2005) 26 Massive nitrogen loss from the Benguela upwelling system through anaerobic ammonium 27 oxidation. Proc Natl Acad Sci USA 102(18):6478–6483 28
Laursen AE, Seitzinger SP (2002) The role of denitrification in nitrogen removal and 29 carbon mineralization in Mid-Atlantic Bight sediments. Contl Shelf Res 22:1397–1416 30
McCarthy MJ, Gardner WS, Lavrentyev PJ, Moats KM, Jochem FJ, Klarer DM (2007) 31 Effects of hydrological flow regime on sediment-water interface and water column 32 nitrogen dynamics in a Great Lakes coastal wetland (Old Woman Creek, Lake Erie). J 33 Great Lakes Res 33(1):219 34
McCarthy M, McNeal K, Morse J, Gardner W (2008) Bottom-water hypoxia effects on 35 sediment-water interface nitrogen transformations in a seasonally hypoxic, shallow bay 36 (Corpus Christi Bay, Texas, USA). Estuar Coasts DOI 10.1007/s12237-008-9041-z 37

Denitrification in Aquatic Sediments
- 40 -
Meissner KJ, Galbraith ED, Völker C (2005) Denitrification under glacial and 1 interglacial conditions: A physical approach. Paleoceanography 20(3) 2
Middelburg JJ, Soetaert K, Herman PMJ, Heip C (1996) Denitrification in marine 3 sediments: A model study. Global Biogeochem Cyc 10:661–673 4
Middelburg JJ, Soetaert K, Herman PMJ (1997) Empirical relationships for use in global 5 diagenetic models. Deep-Sea Res I 44(2):327–344 6
Moore JK, Doney SC (2007) Iron availability limits the ocean nitrogen inventory 7 stabilizing feedbacks between marine denitrification and nitrogen fixation. Global 8 Biogeochemical Cycles 21 9
Mulder A, van de Graaf AA, Robertson LA, Kuenen JG (1995) Anaerobic ammonium 10 oxidation discovered in a denitrifying fluidized bed reactor. FEMS Microbiol Ecol 11 16(3):177–183 12
Naqvi SW, Jayakumar DA, Narvekar PV, Naik H, Sarma VV, D'Souza W, et al. (2000) 13 Increased marine production of N2O due to intensifying anoxia on the Indian continental 14 shelf. Nature 408(6810):346–349 15
Oviatt CA, Keller AA, Sampou PA, Beatty LL (1986) Patterns of productivity during 16 eutrophication: a mesocosm experiment. Mar Ecol Prog Ser 28(1–2):69–80. 17
Paerl H, Zehr J. (2000) Marine nitrogen fixation. In: Kirchman DL (ed) Microbial 18 Ecology of the Oceans. Wiley-Liss, Wilmington, pp 387–426 19
Parkin TB (1987) Soil microsites as a source of denitrification variability. Soil Sci Soc 20 Am J 51:1194–1199 21
Rao AMF, McCarthy MJ, Gardner WS, Jahnke RA (2007) Respiration and denitrification 22 in permeable continental shelf deposits on the South Atlantic Bight: Rates of carbon and 23 nitrogen cycling from sediment column experiments. Cont Shelf Res 27(13):1801–1819 24
Richards FA, Cline JD, Broenkow WW, Atkinson LP (1965) Some Consequences of the 25 Decomposition of Organic Matter in Lake Nitinat, an Anoxic Fjord. Limnol Oceanogr 26 10:185–201 27
Risgaard-Petersen N, Meyer RL, Schmid M, Jetten MSM, Enrich-Prast A, Rysgaard S, et 28 al. (2004) Anaerobic ammonium oxidation in an estuarine sediment. Aquat Microb Ecol 29 36(3):293–304 30
Ruelland D, Billen G, Brunstein D, Garnier J. SENEQUE: A multi-scaling GIS interface 31 to the Riverstrahler model of the biogeochemical functioning of river systems. Sci Total 32 Environ 375:257–273 33

Denitrification in Aquatic Sediments
- 41 -
Seitzinger S, Harrison JA, Bohlke JK, Bouwman AF, Lowrance R, Peterson B, et al. 1 (2006) Denitrification across landscapes and waterscapes: a synthesis. Ecol Appl 2 16(6):2064–2090 3
Soetaert K, Herman PMJ, Middelburg JJ (1996a) Dynamic response of deep-sea 4 sediments to seasonal variations: A model. Limnol Oceanogr 41(8):1651–1668 5
Soetaert K, Herman PMJ, Middelburg JJ (1996b) A model of early diagenetic processes 6 from the shelf to abyssal depths. Geochim Cosmochim Acta 60(6):1019–1040 7
Soetaert K, Middelburg JJ, Herman PMJ, Buis K (2000) On the coupling of benthic and 8 pelagic biogeochemical models. Earth-Sci Rev 51:173–201 9
Thamdrup B, Dalsgaard T (2002) Production of N2 through anaerobic ammonium 10 oxidation coupled to nitrate reduction in marine sediments. Appl Environ Microbiol 11 68(3):1312–1318 12
Thibodeaux LJ, Boyle JD (1987) Bedform-generated convective transport in bottom 13 sediment. Nature 325(6102):341–343 14
Thouvenot M, Billen G, Garnier J Modelling nutrient exchange at the sediment-water 15 interface of river systems. J Hydrology 341(1–2):55–78 16
Trimmer M, Nicholls JC, Deflandre B (2003) Anaerobic Ammonium Oxidation 17 Measured in Sediments along the Thames Estuary, United Kingdom. Appl Environ 18 Microbiol 69(11):6447–6454 19
Trimmer M, Nicholls JC, Morley N, Davies CA, Aldridge J (2005) Biphasic behavior of 20 anammox regulated by nitrite and nitrate in an estuarine sediment. Appl Environ 21 Microbiol 71(4):1923–30 22
Vanderborght JP, Wollast R, Billen G (1977a) Kinetic models of diagenesis in disturbed 23 sediments. Part 1. Mass transfer properties and silica diagenesis. Limnol Oceanogr 24 22(5):787–793 25
Vanderborght JP, Wollast R, Billen G (1977b) Kinetic models of diagenesis in disturbed 26 sediments. Part 2. Nitrogen diagenesis. Limnol Oceanogr 22(5):794–803 27