Embed Size (px)
Citation preview

Turk J Elec Eng & Comp Sci
(2016) 24: 3524 – 3542
c⃝ TUBITAK
doi:10.3906/elk-1404-425
Turkish Journal of Electrical Engineering & Computer Sciences
http :// journa l s . tub i tak .gov . t r/e lektr ik/
Research Article
Modeling and performance optimization of photovoltaic and thermal collector
hybrid system
Dilsad ENGIN1,∗, Metin COLAK2
1Department of Control and Automation Technology, Ege Higher Vocational School, Ege University,
Bornova, Izmir, Turkey2Department of Electrical and Electronics Engineering, Faculty of Engineering, Ege University,
Bornova, Izmir, Turkey
Received: 15.04.2014 • Accepted/Published Online: 14.05.2015 • Final Version: 20.06.2016
Abstract: In this paper, the hybrid photovoltaic/thermal collector (PV/T) system’s electrical and thermal efficiency
was examined by stating a mathematical model and developing a prototype of the system. To enhance the electrical
efficiency, the cell temperature of the PV module was decreased with cooling and the heated fluid could be used for low
heating applications. For this purpose, a PV/T system was modeled and constructed using a thermal collector placed
beneath the photovoltaic panel where the excess heat and solar radiation through the transparent PV module was the
input of the thermal collector. A transparent solar module was used in order to improve the total efficiency of the hybrid
PV/T system by means of increasing the radiant solar energy reaching the absorber plate of the collector. The absorber
plate was coated with titanium dioxide as the absorption level of the coating was higher than 95%, which increases the
thermal output by 10%. We note that using TINOX coating for the absorber plate and transparent solar module had the
advantage of increasing the thermal yield of the hybrid system. The influences of the dynamic parameters on the system
performance, wind speed and water flow rate, were examined on a daily basis and it was observed that the wind speed
had a minor effect on the performance and that forced circulation improved the thermal efficiency. The PV/T hybrid
system was compared with the separate PV module and thermal collector efficiencies and the results are presented. With
these improvements, the efficiency of the single cover, water type PV/T hybrid system is increased to the maximum
reported value in literature.
Key words: Solar cell, solar collector, photovoltaic/thermal hybrid system, optimization, efficiency
1. Introduction
The awareness of the effects of global warming, mostly caused by CO2 emission, has led to a search for ways
of obtaining power from alternative energy sources such as wind, solar, and microhydro. Among the renewable
energy sources, solar power is widely used, especially for producing heat energy. These systems are used to
provide hot water requirements as well as for indoor heating. Electrical energy is generated from solar energy
using solar modules and arrays. Production of heat and electricity by the same unit has been the main idea of
many researches. It is a known fact that most of the solar radiation absorbed by the solar cells is not converted
into electrical energy, but it increases the cell temperature, whereas increased cell temperature decreases the
electrical efficiency. In order to obtain a higher efficiency, this heat should be extracted from the cells during
operation. As the photovoltaic conversion efficiency is a decreasing linear function of temperature, the cooled
∗Correspondence: [email protected]
3524

ENGIN and COLAK/Turk J Elec Eng & Comp Sci
solar cell power output increases. The heated fluid may also be used for low heating applications. This
phenomenon is the main idea of this paper.
A combined solar cell and thermal collector system, called a photovoltaic/thermal (PV/T) hybrid system,
that produces electrical energy as well as low temperature hot water, could be an alternative to the use of single
solar modules. The incident solar radiation on the solar module is converted to electrical energy, while the
absorber plate beneath the module absorbs the excess heat. The absorber plate may or may not be in thermal
contact with the solar module. In both scenarios the excess is used as an input. A heat carrier fluid, especially
water, removes this excess heat from the absorber plate and the solar cells, thus increasing the electrical efficiency
and the electrical output of the PV/T system.
2. Literature review and project approach
Various theoretical and experimental studies have been performed on PV/T hybrid systems since the 1970s.
In order to optimize the energy output of the PV/T hybrid systems, there has been much research over the
last 20 years. Authors’ approaches to PV/T systems vary, but these systems are usually investigated in 2 main
categories, as water-hybrid and air-hybrid collectors. Some of these studies have been performed using water
[1–13] and dual (water and air) heat exchangers [14,15].
In recent reviews, it has been reported by different authors [16–19] that many configurations of flat plate
PV/T collectors have been developed, either PVT/air or PVT/water. The main differences between the PV/T
designs are whether a glass cover on a PV laminate is present [8,20] or not [21,22], the design of the sheet-
and-tube collectors as round [3,5,20,23–25] or square/rectangular tube absorber type [26,27], and the type of
the heat extracting fluid. PV/T systems with “one cover and no cover” effects were also investigated [2,28,29].
Whereas some of the researches focuses on component-based efficiency studies, some of the papers are focused
on system-based applications regarding building heating/cooling [29–32] or water heating with or without a
storage tank and auxiliary heating [3,33].
Authors who have studied these component-based models and verified the results by field or indoor
experience stated that the achieved electrical efficiency is maximum for the uncovered collector, whereas the
highest total electrical and thermal efficiency is obtained for a single-covered collector configuration due to the
fact that thermal losses caused by convection decrease with a cover.
Several studies have followed up on the research and design of the water type PV/T collectors with one
solar panel as the cover. It was reported in [4] that the hybrid PV/T system’s total energy output is dependent
on the solar energy input, ambient temperature, wind speed, operating temperature of the system parts, and
heat extraction mode. Zondag et al. [5] pointed out that one of the main advantages of the PV/T system is the
average PV temperature in a PV/T collector that might be lower than for a conventional PV-laminate, thereby
increasing electrical performance.
PV/T hybrid collectors generate electrical energy beyond providing low temperature hot water. Thus,
the total efficiency increases. Bergene and Lovvik [34] showed that the total theoretical efficiency of a PV/T
collector that can be obtained is about 60–80%. Other test results stated that the thermal efficiency is about
50–70% [5]. The obtained results are, however, the instantaneous efficiencies, which are measured or calculated
under constant and low input temperature fluid flow conditions.
Chow [7] stated an explicit dynamic model for the PV/T systems in contrast to most previous steady-
state models and achieved a thermal efficiency of 60%. Ji et al. [30] also studied a dynamic thermal model
3525

ENGIN and COLAK/Turk J Elec Eng & Comp Sci
for the analysis of a facade-integrated photovoltaic/thermal collector system. Taking the dynamic parameters
that affect the thermal and electrical efficiencies into account, they calculated the PV/T efficiency as 58.9% for
the system using a thin film PV (EPV/T) and 60–80% for the system with a single silicon cell PV (BPV/T).
Corbin and Zhai [35] stated that thermal and combined (thermal plus electrical) efficiencies reached 19% and
34.9% based on a computational ?uid dynamics model, respectively. In [35], the efficiency was calculated for
a forced flow system where the fluid is circulated by a pump during daylight hours and a new correlation is
developed that allows cell efficiency to be calculated directly.
If a storage tank is included in the PV/T system as in some studies [3,8,29,36], the input temperature
in the closed system changes during the day. In such a system, as the inlet temperature is not constant during
the day, the thermal efficiency should be stated according to daily test results.
In this work, the field of interest was the water type PV/T collector with a semitransparent solar module
used as the cover. A storage tank was included in the system to provide a dynamic inlet water temperature
as in an actual thermal collector. Forced circulation by a pump was experienced as well as natural circulation.
The dynamic influences were taken into account in the developed model as the PV/T system was tested on the
roof of the Ege University Solar Energy Institute building. Model equations were calculated via MATLAB and
Simulink. The efficiency of the PV/T system was calculated according to outdoor daily test results, and the
experimental results and model calculations are presented.
3. The PV/T hybrid system components
3.1. Solar modules
In the PV/T hybrid system, the solar module is integrated with the thermal collector, either by pasting the
solar module onto the absorber plate of the collector or by placing them with an air gap. In these systems, the
heat on the solar cells is the input of the thermal collector, which is transferred to the heat carrier fluid, but
solar radiation is not incident on the absorber plate.
As some part of the incident solar radiation can be incident on the absorber plate, a thin-film amorphous
semitransparent solar module (ASITHRU-30-SG) having a transparency of about 10% and a size of 60 × 100
cm2 (Figure 1) was used. The electrical data of this module under standard test conditions (STC: 1000 W/m2 ,
AM 1.5, cell temperature 25 C) after exposure to sunlight for a few months are given in Table 1.
Table 1. Electrical data and cell temperature coefficients of the solar module.
Nominal power PMPP 27 Wp
Voltage at the maximum power point UMPP 36 VCurrent at the maximum power point IMPP 0.75 AShort circuit current Isc 1.02 AOpen circuit voltage Uoc 49 VNumber of series connected cells N 30Cell temperature coefficientsReferred to nominal power uP –0.2%/KReferred to open-circuit voltage uUOC –0.33%/KReferred to short-circuit current uISC +0.08%/K
3526

ENGIN and COLAK/Turk J Elec Eng & Comp Sci
Figure 1. ASITHRU-30-SG semitransparent solar cell.
3.2. Thermal collector
The thermal collector used in the hybrid system is an active system which uses a 3-speed control pump to
circulate a heat-transfer fluid between the collector and the storage tank. The performance of the system was
also tested under natural flow conditions. The choice of the heat-transfer fluid was potable water as the system
was tested in the mild climate of the city of Izmir. Polyurethane foam (50 mm) was used for the insulation of
the collector and the tank, which prevented freezing and heat loss at night. On the absorber plate, there are 6
copper tubes of 12 mm in diameter having a space of 10 cm in between them, as shown in Figure 2. The thermal
collector’s absorber plate was coated with titanium dioxide (TINOX) of 0.2 mm thick in order to optimize the
hybrid system’s efficiency. This coating was chosen as the absorption level is higher than 95%, which increases
the thermal output by 10% and reaches a higher plate temperature than the black absorber plate does.
TINOX® coated
absorber plate
Figure 2. Construction details of the TINOX coated absorber plate.
3.3. Temperature, meteorological, and electrical measurements
The inlet and outlet water temperatures of the collector and the temperature of the storage tank were measured
with 3 two-wire Metronik Pt-100 temperature sensors. The solar module’s surface temperature was measured
with two LM35 temperature sensors with 10 mV/C sensitivity. The outputs of the temperature sensors
were connected to a data logger via signal conditioning circuits and recorded with 10-min intervals. The
microcontroller-based data logger was particularly designed for temperature sensor connections and analog
inputs. The analog inputs were converted to digital with on-chip 16-bit analog-to-digital converters (SAR
ADCs), which have a programmable throughput up to 1 Msps with a conversion time of about 100 mu s,
and stored in a 128 Kbyte RAM memory. The data transfer to computer was performed via an EIA-232E
communication port; the transfer was accomplished through HyperTerminal software, saved as text files, and
then converted to comma-separated Microsoft Excel (*.csv) files. The current and voltage of the solar module
under a load of 48 Ω was measured with a current sensor, CSA-1V, and a measuring circuitry, which was
also stored in the data logger. The CSA-1V is a CMOS Hall sensor with an added ferromagnetic layer. The
ferromagnetic layer is used as a magnetic flux concentrator providing a magnetic gain of about 10 to increase the
output signal without increasing the inherent sensor electrical noise. The CSA-1V provides an analog output
3527

ENGIN and COLAK/Turk J Elec Eng & Comp Sci
voltage proportional to the magnetic field generated by the current flowing through a conductor near the IC.
This sensor was used for on-board DC current measurements with very low insertion loss and fast response.
Current-measuring circuitry, the data logger, and the sensor connections are shown in Figure 3. The measured
meteorological data, including ambient temperature, solar radiation, and wind speed, were supplied by the
Ege University Solar Energy Institute where the PV/T hybrid system was tested. These data was used for
calculation of beam and diffuse components of hourly radiation on a tilted surface. The detailed features of the
measuring and data logging units are given in Table 2.
Table 2. List of the measuring and data logging units.
Device Specification Value/feature
Pt-100 resistive
temperature
detector (RTD)
Sensor Single sensor, 2-wire, thin-film
Immersion length 50 mm for 2 RTDs, 100 mm for 1 RTD
Nominal resistance 100 Ω @ 0 C (IEC751 standard, Class B)
TCR (IEC751) α0 = 3.85× 10⁻³C−1 from 0 to 100 C
Temperature range –50 to +500 C
LM35
temperature
sensor
Calibration in C
Output Linear 10.0 mV/C scale factor
Accuracy 0.5 C (at +25 C)
Rated for full range –55 to +150 C
Nonlinearity ± 1/4C typical
CSA-1V current
sensor - low
current range
properties
Electrical noise Low
DC offset voltage ± 15 mV max
Working current range Up to 2 A
Signal output 140 mV for 1 A
Resolution Approx. 5 mA
Linearity <1%
Microcontroller-
based data logger
3 Pt-100 temperature sensor inputs
Two 0 to 10 mV, two 0 to 2.5 V, and one 0 to 1 V analog inputs
128 Kbyte data storage capacity
16 bit resolution on-chip SAR ADC, conversion time: 100 mu s
2 × 16 character LCD display
1 to 256 min user-adjustable range for data logging
Instantaneous value display on LCD
Meteorology
station
Solar radiation sensor 0 to 1800 W/m2; accuracy ± 5% FS
Anemometer with direction 1 to 322 km/h
Precision thermistor –40 to +65 C; accuracy ± 0.5 C
4. Design and experimental study of the PV/T hybrid system
In the experimental study, the solar module and the absorber plate were placed with a spacing of 2 cm and the
hybrid PV/T system was observed under forced and natural circulation conditions. In this system, as shown in
3528

ENGIN and COLAK/Turk J Elec Eng & Comp Sci
Figure 4, the solar module, which is 10% transparent to sunlight, was used as the cover of the thermal collector.
Most of the incoming solar radiation was absorbed and converted into electrical energy by the solar module and
a small portion was incident on the absorber plate. Electrical efficiency and the effect of temperature on the
efficiency were observed. With the aid of the PV/T system’s mathematical modeling in [5,34,37], the thermal
part was modeled. Experimental results and calculated results from the model were then compared.
a-Si Solar
module
Absorber
plate
Pump
Storage
tank
Flow
direction
Expansion
tank
Pt-100 for
measurement of Tin
Pt-100 for
measurement of Tout
Pt-100 for
measurement of
Ttank
Figure 3. Current measuring circuit, data logger, and
temperature sensor connections.
Figure 4. Schematic drawing of the PV/T system.
Electrical efficiency under STC was calculated as:
η0 =VMPP · IMPP
G ·APV(1)
Electrical efficiency as a function of temperature is defined as in Eq. (2) [37], and the temperature coefficient
–0.45% C−1 for monocrystalline silicon was replaced with –0.2% C−1 for amorphous silicon. Using this
equation and the surface temperatures of the solar module, the temperature dependence of the solar module
was analyzed.
ηe = η0(1− 0.002[Tcell − 25C]) (2)
5. Solar radiation on a tilted surface
For evaluation of the electrical and thermal efficiencies, the measured solar radiation and wind speed data were
used. As the meteorology station measures the solar radiation on the horizontal plane, the radiation onto the
tilted surface was calculated for the PV/T system facing south with a slope equal to Izmir’s latitude (β = Φ =
38.46 ). The hourly total radiation received on a tilted surface IT,β is the sum of the hourly beam irradiation
Ib,β , the hourly reflected irradiation Ir,β , and the hourly sky diffuse radiation on the tilted surface Id,β , which
is composed of 3 parts: isotropic, circumsolar diffuse, and horizon brightening.
For the PV/T system facing south (γ = 0 ) calculated hour angles (ω) and declination angles (δ) were
used to compute the hourly beam radiation component from the measured solar radiation using the model of
Erbs et al. [37,38].
3529

ENGIN and COLAK/Turk J Elec Eng & Comp Sci
The diffuse radiation component on the tilted surface was calculated using the anisotropic estimation
model of Perez [37,39] as it is the most used model with an accuracy of better than 10%. The equations in the
Perez model were utilized to calculate the 3 components of the diffused radiation on a tilted surface. By adding
the beam and the ground-reflected radiation, the total radiation was calculated as [39]:
IT,β = IbRb + Id(1− F1)
(1 + cosβ
2
)+ IdF1
a
b+ IdF2 sinβ + Iρg
(1− cosβ
2
)(3)
The brightness coefficients F1 and F2 are functions of the zenith angle θz , clearness ε as described in [39], and
brightness ∆.
A simulation program, Simulink, was used to calculate the hourly radiation on a tilted surface for any day
changing the number of the day, n , using the measured hourly solar radiation data and the results presented
in [40].
6. Energy balance equations for the PV/T system
In this model, the PV/T system studied was a flat-plate collector with a semitransparent solar module on top
serving as the cover of the collector. The absorber plate of the flat-plate collector was designed so that the
cylindrical copper tubes were in good contact with the plate. For the absorber plate, a highly selective titanium
dioxide coating was used to ensure the greatest possible degree of absorption within the solar radiation range
and the lowest possible degree of emissivity in the heat radiation range. Therefore, with the TINOX selective
coating, heat losses due to heat radiation from the absorber plate were prevented in the infrared range.
Rather than considering the photovoltaic and thermal parts separately, it was more convenient to model
the system as one unit affected by each. Energy balance equations were written for the flat-plate collector
where, instead of a glass cover, a thin film a-Si solar module in between 2 glasses was used (Figure 5).
S
p
F
D = 12 mmD W = 10 cm
0.2 mm
L =
100 cm
xy
2 cm
Figure 5. Geometric configuration and dimensions of the hybrid system model.
In the modeling, the effect of the change in hourly solar radiation and the effect of wind speed on the
performance of the PV/T system were considered for more accurate results, so the measured solar radiation,
temperature, and wind speed data were used.
In the geometrical configuration of the system shown in Figure 5, the Hottel–Whillier model was referenced
and some modifications were made due to the fact that the glass cover in that model was replaced by a
semitransparent thin-film a-Si solar module of 10 mm in thickness and the energy losses due to radiation and
convection from the 3 mm top glass of the module were taken into consideration [41].
Heat losses from the solar module due to convection may be a combination of free and forced convection
effects. When the front of the module is exposed to wind, forced convection will be the main cause of cooling
[41]. As a result, the overall convection heat transfer is the sum of the forced convection from the front surface
3530

ENGIN and COLAK/Turk J Elec Eng & Comp Sci
and the free convection from the rear surface. In this study, as the PV module is used for the glass cover placed
approximately 2.5 cm apart from the absorber plate, there is no cooling effect at the rear surface caused by
free convection. Heat losses from the top glass of the solar module due to convection caused by wind should
be taken into consideration as the PV module was used for the glass cover of the collector. McAdams’ (1954)
empirical heat transfer coefficient, hwind = 5.7 + 3.8vwind , was used for calculating the convective heat transfer
coefficient. For evaluation of the top loss coefficient Ut , the empirical formula of Klein in [37] was used, whereas
the calculations were done by a simulation software program [40].
There is a conductive heat transfer from the absorber plate to the case of the collector via insulation
material, so the bottom heat loss coefficient Ub was calculated as:
Ub =k
Lins(4)
Edge loss coefficient Ue was also calculated as the edge loss coefficient-area product (UA) edge to the collector
area Ac :
Ue =(UA)edge
Ac(5)
The collector overall loss coefficient, UL , is the sum of all these losses.
Tube-and-fin model [37] was used to find the heat conducted from the fin to the tube via the absorber
plate. Using the useful gain for the tube and fin per unit length in the flow directionq′
u , energy transferred from
the absorber plate to the fluid through the tubes was then calculated to find out how efficiently the collector,
and thus the PV/T system would work.
The fin, shown in Figure 6, is of length (W −D)/2. An energy balance on the elemental region of width
∆x and unit length in the flow direction is found to be:
q′fin = (W −D)F [S − UL(Tb − Ta)] (6)
where S is the absorbed solar radiation by the unit area of the absorber plate (J/m2), Tb is the bond
temperature, and F is the fin efficiency:
F =tanh[m(W −D)/2]
m(W −D)/2(7)
which is defined as the measure of how efficiently the heat is transferred from the fin to the tube via the absorber
plate, where m =√
UL/kδ , k is the thermal conductivity of TINOX coating, and δ is the absorber thickness.
Bond
Tb
D
xy
Δxx Tb
S
δ
−
2 −
2
2
Figure 6. Energy balance on the fin element.
3531
ENGIN and COLAK/Turk J Elec Eng & Comp Sci
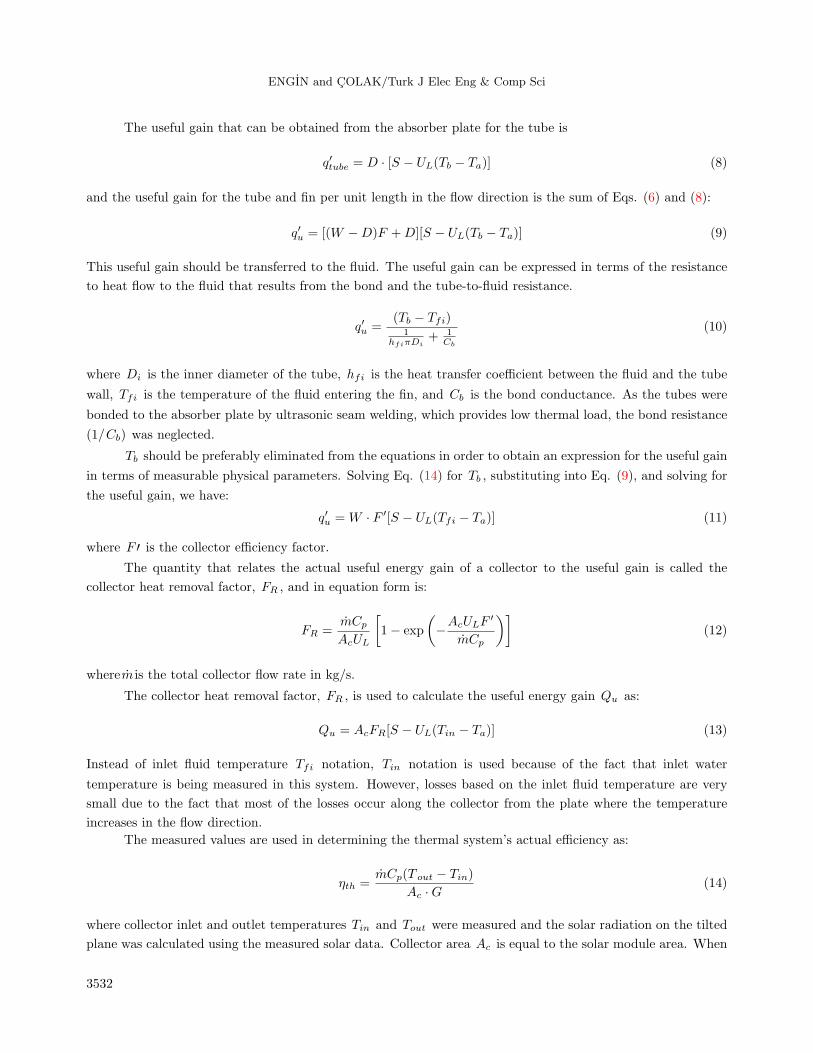
The useful gain that can be obtained from the absorber plate for the tube is
q′tube = D · [S − UL(Tb − Ta)] (8)
and the useful gain for the tube and fin per unit length in the flow direction is the sum of Eqs. (6) and (8):
q′u = [(W −D)F +D][S − UL(Tb − Ta)] (9)
This useful gain should be transferred to the fluid. The useful gain can be expressed in terms of the resistance
to heat flow to the fluid that results from the bond and the tube-to-fluid resistance.
q′u =(Tb − Tfi)
1hfiπDi
+ 1Cb
(10)
where Di is the inner diameter of the tube, hfi is the heat transfer coefficient between the fluid and the tube
wall, Tfi is the temperature of the fluid entering the fin, and Cb is the bond conductance. As the tubes were
bonded to the absorber plate by ultrasonic seam welding, which provides low thermal load, the bond resistance
(1/Cb) was neglected.
Tb should be preferably eliminated from the equations in order to obtain an expression for the useful gain
in terms of measurable physical parameters. Solving Eq. (14) for Tb , substituting into Eq. (9), and solving for
the useful gain, we have:
q′u = W · F ′[S − UL(Tfi − Ta)] (11)
where F ′ is the collector efficiency factor.
The quantity that relates the actual useful energy gain of a collector to the useful gain is called the
collector heat removal factor, FR , and in equation form is:
FR =mCp
AcUL
[1− exp
(−AcULF
′
mCp
)](12)
wherem is the total collector flow rate in kg/s.
The collector heat removal factor, FR , is used to calculate the useful energy gain Qu as:
Qu = AcFR[S − UL(Tin − Ta)] (13)
Instead of inlet fluid temperature Tfi notation, Tin notation is used because of the fact that inlet water
temperature is being measured in this system. However, losses based on the inlet fluid temperature are very
small due to the fact that most of the losses occur along the collector from the plate where the temperature
increases in the flow direction.
The measured values are used in determining the thermal system’s actual efficiency as:
ηth =mCp(T out − Tin)
Ac ·G(14)
where collector inlet and outlet temperatures Tin and Tout were measured and the solar radiation on the tilted
plane was calculated using the measured solar data. Collector area Ac is equal to the solar module area. When
3532
ENGIN and COLAK/Turk J Elec Eng & Comp Sci
the system works in natural circulation, the flow rate, m , changes with the difference between Tin and Tout .
This average flow rate in the closed loop in m/s is calculated using temperature difference by [42]:
vm = (gβ′QuH/8µLπCp)1/2 (15)
The useful heat Qu transferred from the tubes to the fluid is calculated as:
Qu = mCp(Tout − Tin) (16)
and placed into Eq. (15). The unknown mass flow rate in Eq. (16) was solved using:
m = ρvmAtube (17)
An iterative method was used to solve for vm , and m is calculated consequently.
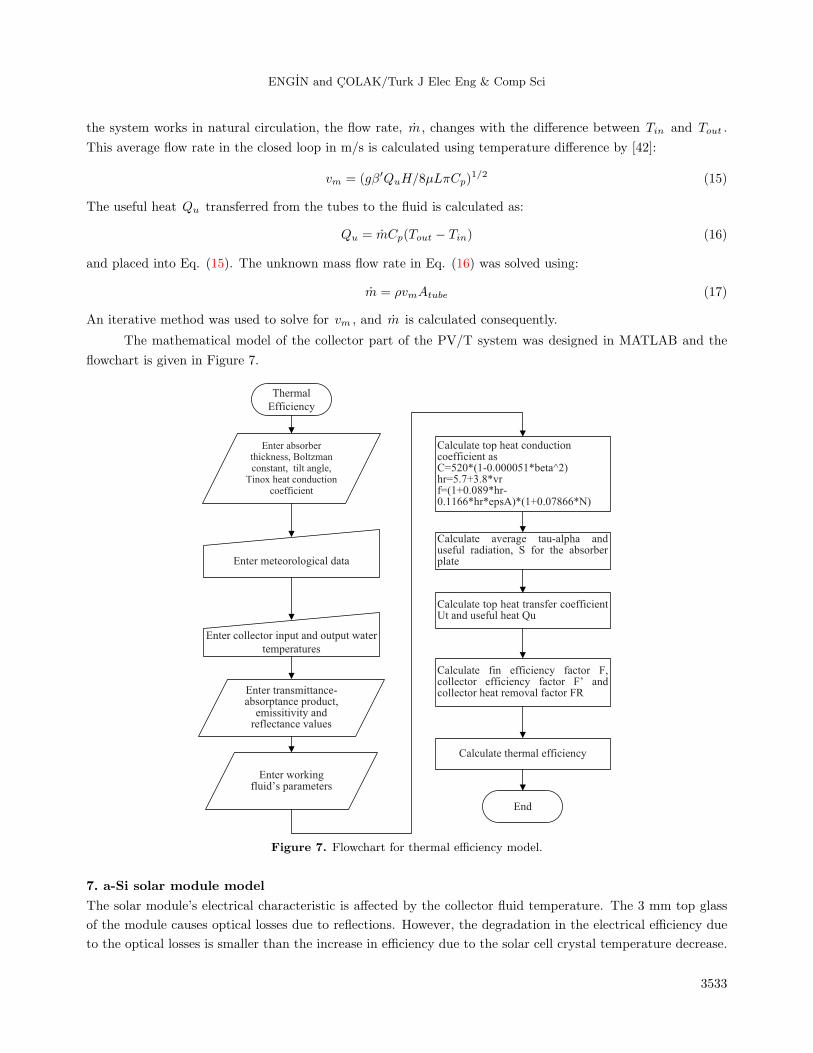
The mathematical model of the collector part of the PV/T system was designed in MATLAB and the
flowchart is given in Figure 7.
Enter absorber thickness, Boltzman constant, tilt angle,
Tinox heat conduction coefficient
Enter meteorological data
Calculate top heat conduction coefficient as C=520*(1-0.000051*beta^2)hr=5.7+3.8*vrf=(1+0.089*hr-0.1166*hr*epsA)*(1+0.07866*N)
Enter collector input and output water
temperatures
Enter transmittance-absorptance product,
emissitivity and reflectance values
Enter working fluid’s parameters
Calculate average tau-alpha and useful radiation, S for the absorber plate
Calculate top heat transfer coefficient Ut and useful heat Qu
Calculate fin efficiency factor F, collector efficiency factor F’ and collector heat removal factor FR
Thermal
Efficiency
Calculate thermal efficiency
End
Figure 7. Flowchart for thermal efficiency model.
7. a-Si solar module model
The solar module’s electrical characteristic is affected by the collector fluid temperature. The 3 mm top glass
of the module causes optical losses due to reflections. However, the degradation in the electrical efficiency due
to the optical losses is smaller than the increase in efficiency due to the solar cell crystal temperature decrease.
3533

ENGIN and COLAK/Turk J Elec Eng & Comp Sci
Integration of the solar module and the thermal collector changes the characteristics of both, so the
electrical part should also be modeled in order to investigate the system completely.
In a solar cell, the recombination in the depletion region represents a considerable loss, which cannot
be sufficiently modeled using a single diode model [43]. Therefore, the a-Si solar module is modeled using the
two-diode PV model in [44], and the equations in [45] are adapted to this model.
The two-diode PV model in Figure 8 was used due to the fact that the a-Si PV cell has a large series
resistance, Rs , and the recombination current is substantially high, both of which were taken into consideration
in the referenced model. Recombination current also directly affects the fill factor (FF) of the PV cell and thus
has a significant effect on the open-circuit voltage, Voc [46].
RL
Inr IndIph
I
hv
V
RS
RP
IRP
Figure 8. The a-Si PV two-diode model.
In this model, the PV cell’s dark current, I0 , can be stated in terms of diffusion current I0d and
recombination current I0r as:
I0 = I0d [exp(V/Vtd0)− 1] + I0r [exp(V/Vtr0)− 1] (18)
where Vtd0 = ndkTc0/qandVtr0 = nrkTc0/q . nd and nr are diode ideality factors, k is the Boltzmann constant,
and q is the electron charge.
The first diode represents the dark recombination current while the second represents the diffusion current.
In the equivalent circuit model, resistor RP represents high-conductivity paths through the solar cell caused
by crystal damage in the junction. The resistor RS represents the series resistance in the top surface of the
semiconductor and at the metal contact-to-semiconductor interface [44].
Eq. (18) may be rewritten taking into consideration these resistances as:
I0 = I0d [exp((V + IRS)/Vtd0)− 1] + I0r [exp((V + IRS)/Vtr0)− 1] + (V + IRS)/RP (19)
RP , in practice, has a very large value, though the current it draws is neglected in order to minimize the
calculation period in computer-based modeling. Therefore, by neglecting the last term in Eq. (19), the net
current that can be drawn from the circuit is the difference between photocurrent Iph and dark current as:
IPV = Iph − I0 = Iph − I0d [exp(V + IRS/Vtd0)− 1] + I0r [exp(V + IRS/Vtr0)− 1] (20)
The photocurrent depends on solar irradiation and temperature as indicated in Eq. (21):
Iph = (G/G0) [(Isc0 + uIsc(Tc − Tcref )] (21)
A solar cell mathematical model was implemented in MATLAB and cell parameters were obtained from reference
module parameters, and cell parameters were calculated and investigated as solar irradiation- and temperature-
dependent parameters under nominal working conditions. The dark current of the solar cell was calculated to
3534

ENGIN and COLAK/Turk J Elec Eng & Comp Sci
find the PV current as in Eq. (20). Solar cell efficiency (η0), FF, and RS were also calculated. The flowchart
for this model is given in Figure 9. By increasing the voltage values from 0 to open circuit voltage, I-V curves
were obtained for one cell of the module for various radiations and temperatures as given in Figure 10. In these
calculations equations from [45] were used. The I-V curve in Figure 10 is obtained for one cell; therefore, the
module voltage is 30 times the cell voltage. The obtained curve approximates the ideal curve as series resistance
was neglected for low currents.
Enter constants
Enter reference
module
parameters
Calculate module efficiency
Calculate cell parameters
under working conditions
Calculate PV cell parameters
Enter working conditions
V=0
Calculate and save current
value
V=V+0.1
V<=Voc
Yes
No
Draw I-V curve
End
I-V
Figure 9. Flowchart of PV cell model.
0 0.2 0.4 0.6 0.8 1 1.2 1.4 1.60
0.2
0.4
0.6
0.8
1
Cell Voltage (V)
Cel
l cu
rren
t (A
)
1000 W/m 750 W/m 300 W/m
500 W/m 750 W/m 22
222
Figure 10. The I-V curve of the cell obtained for various solar radiations.
3535

ENGIN and COLAK/Turk J Elec Eng & Comp Sci
8. Results and discussion
The PV/T hybrid system was installed, the measuring system was connected, and an outdoor test was imple-
mented. In this system, the PV module, which is 10% transparent to sunlight, was used as the cover of the
thermal collector. Most of the incoming solar radiation was absorbed and converted into electrical energy by
the solar module and a small portion was incident on the absorber plate. The measured collector input (Tin)
and output (Tout) water temperatures, the storage tank temperature (Ttank), the surface temperatures of the
solar module (Ts1 ,Ts2), and the ambient temperature (Ta) variations of the PV/T hybrid system on August
12 are shown in Figure 11.
10
15
20
25
30
35
40
45
50
55
00
:00
01
:00
02
:00
03
:00
04
:00
05
:00
06
:00
07
:00
08
:00
09
:00
10
:00
11
:00
12
:00
13
:00
14
:00
15
:00
16
:00
17
:00
18
:00
19
:00
20
:00
21
:00
22
:00
23
:00
00
:00
T (
°C)
Local Time
Tin Tout Ttank Ts1 Ts2 Ta
Figure 11. Measured temperatures of the PV/T hybrid system for August 12.
Measured electrical parameters of the PV/T hybrid system and the meteorological data are plotted versus
time for the same day in Figures 12 and 13, respectively.
Figure 12. Measured module current, voltage, and ambient temperature.
It can be inferred from the measurements that the PV/T system’s collector outlet water temperature
slightly exceeds 50 C, and heat was transferred to the water in the collector part. The difference between inlet
and outlet water temperatures was about 14 C for the natural flow through the system. Water temperature
in the tank exceeded 28 C and remained almost constant during the day although the warm water was used
by the consumer. This 1-day data can be verified for the measured water temperatures for a period between
August 20 and August 24 as shown in Figure 14.
3536

ENGIN and COLAK/Turk J Elec Eng & Comp Sci
0
0.5
1
1.5
2
2.5
3
3.5
0
100
200
300
400
500
600
700
800
900
06:00 07:00 08:00 09:00 10:00 11:00 12:00 13:00 14:00 15:00 16:00 17:00 18:00 19:00
Win
d S
pee
d (
m/s
)
Sola
r R
adia
tio
n (
W/m
^2
)
Local Time
radiation on tilted surface radiation on horizontal plane wind speed
Figure 13. Wind speed and solar radiation variations on August 12.
0
5
10
15
20
25
30
35
40
45
50
20-Aug 20-Aug 21-Aug 21-Aug 22-Aug 22-Aug 23-Aug 23-Aug 24-Aug
Co
llec
tor
& P
V s
urf
ace
tem
per
atu
res
Ttank(°C) Tout (°C) Tin(°C) Ts (°C)
Figure 14. Water temperatures for August 20–24 for the PV/T system.
The solar module’s surface temperatures, measured from two distinct places, did not exceed 40 C, even
during the sunshine duration, and remained almost constant during the day. As is shown in the meteorological
data graphic (Figure 13), wind speed reached at most 3.1 m/s and remained under 1.5 m/s during the day, so
forced convection had very little effect on the heat loss of the solar module surface.
In the experimental setup, a current through a 48 Ω load increases the PV module cell temperature
whereas water flow through the collector decreases this temperature. For comparison with the no-load condition,
the load was disconnected, the solar module voltage rose to approximately Uoc = 49 V @ STC, and the current
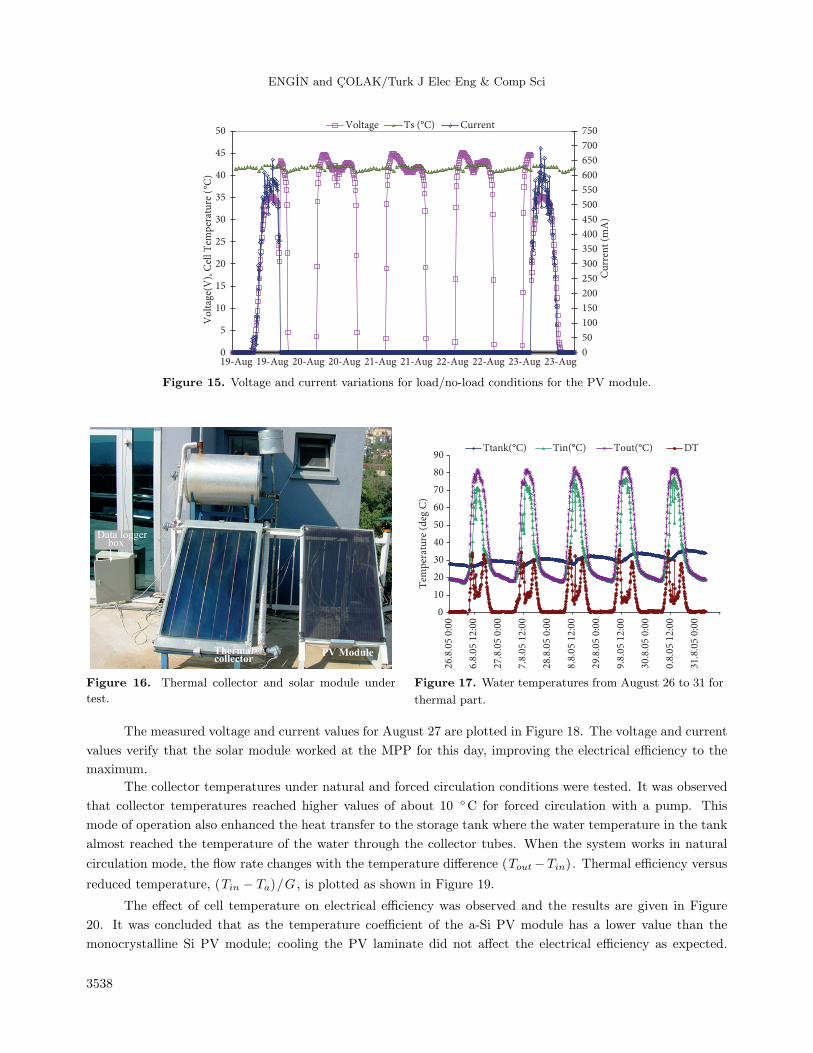
dropped to zero. The test results for load/no-load conditions are given in Figure 15.
The PV/T system was also operated under forced circulation conditions and the tank temperature reached
higher values, and heat transfer to the tank was accomplished.
The semitransparent solar module with 10% transparency was demounted from the system, and the
system was separated into 2 parts as a solar module and a thermal collector with a glass cover as shown in
Figure 16. Water temperatures were examined for the data from August 26 to 31, where the hot water flowing
through the collector tubes reached 80 C for the thermal collector working with a glass cover, as shown in
Figure 17. The water temperature for the PV/T system could not reach the high values that the thermal
collector did, due to the shading of the absorber plate by the solar module.
3537
ENGIN and COLAK/Turk J Elec Eng & Comp Sci
0
50
100
150
200
250
300
350
400
450
500
550
600
650
700
750
0
5
10
15
20
25
30
35
40
45
50
19-Aug 19-Aug 20-Aug 20-Aug 21-Aug 21-Aug 22-Aug 22-Aug 23-Aug 23-Aug
Cu
rren
t (m
A)
Vo
ltag
e(V
), C
ell T
emp
erat
ure
(°C
)
Voltage Ts (°C) Current
Figure 15. Voltage and current variations for load/no-load conditions for the PV module.
Thermal collector
PV Module
Data logger box
0
10
20
30
40
50
60
70
80
9026
.8.0
5 0:
00
6.8.
05 1
2:00
27.8
.05
0:00
7.8.
05 1
2:00
28.8
.05
0:00
8.8.
05 1
2:00
29.8
.05
0:00
9.8.
05 1
2:00
30.8
.05
0:00
0.8.
05 1
2:00
31.8
.05
0:00
Tem
per
atu
re (
deg
C)
Ttank(°C) Tout(°C) DT
Figure 16. Thermal collector and solar module under
test.
Figure 17. Water temperatures from August 26 to 31 for
thermal part.
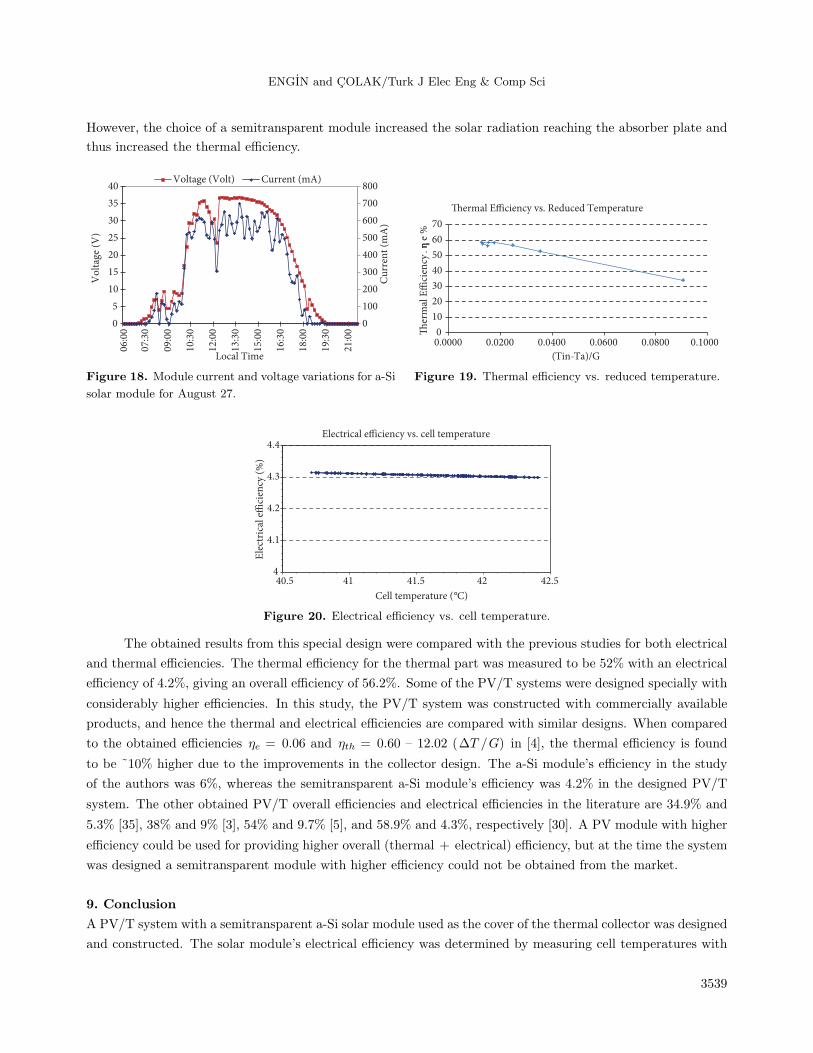
The measured voltage and current values for August 27 are plotted in Figure 18. The voltage and current
values verify that the solar module worked at the MPP for this day, improving the electrical efficiency to the
maximum.
The collector temperatures under natural and forced circulation conditions were tested. It was observed
that collector temperatures reached higher values of about 10 C for forced circulation with a pump. This
mode of operation also enhanced the heat transfer to the storage tank where the water temperature in the tank
almost reached the temperature of the water through the collector tubes. When the system works in natural
circulation mode, the flow rate changes with the temperature difference (Tout −Tin). Thermal efficiency versus
reduced temperature, (Tin − Ta)/G , is plotted as shown in Figure 19.
The effect of cell temperature on electrical efficiency was observed and the results are given in Figure
20. It was concluded that as the temperature coefficient of the a-Si PV module has a lower value than the
monocrystalline Si PV module; cooling the PV laminate did not affect the electrical efficiency as expected.
3538
ENGIN and COLAK/Turk J Elec Eng & Comp Sci
However, the choice of a semitransparent module increased the solar radiation reaching the absorber plate and
thus increased the thermal efficiency.
0
100
200
300
400
500
600
700
800
0
5
10
15
20
25
30
35
40
06:0
0
07:3
0
09:0
0
10:3
0
12:0
0
13:3
0
15:0
0
16:3
0
18:0
0
19:3
0
21:0
0
Cu
rren
t (m
A)
Vo
ltag
e (V
)
Local Time
Voltage (Volt) Current (mA)
0
10
20
30
40
50
60
70
0.0000 0.0200 0.0400 0.0600 0.0800 0.1000
er
mal
E"
icie
ncy
. ηηe
%
(Tin-Ta)/G
ermal E"iciency vs. Reduced Temperature
Figure 18. Module current and voltage variations for a-Si
solar module for August 27.
Figure 19. Thermal efficiency vs. reduced temperature.
4
4.1
4.2
4.3
4.4
40.5 41 41.5 42 42.5
Ele
ctri
cal e
"ic
ien
cy (
%)
Cell temperature (°C)
Electrical e"iciency vs. cell temperature
Figure 20. Electrical efficiency vs. cell temperature.
The obtained results from this special design were compared with the previous studies for both electrical
and thermal efficiencies. The thermal efficiency for the thermal part was measured to be 52% with an electrical
efficiency of 4.2%, giving an overall efficiency of 56.2%. Some of the PV/T systems were designed specially with
considerably higher efficiencies. In this study, the PV/T system was constructed with commercially available
products, and hence the thermal and electrical efficiencies are compared with similar designs. When compared
to the obtained efficiencies ηe = 0.06 and ηth = 0.60 – 12.02 (∆T /G) in [4], the thermal efficiency is found
to be ˜10% higher due to the improvements in the collector design. The a-Si module’s efficiency in the study
of the authors was 6%, whereas the semitransparent a-Si module’s efficiency was 4.2% in the designed PV/T
system. The other obtained PV/T overall efficiencies and electrical efficiencies in the literature are 34.9% and
5.3% [35], 38% and 9% [3], 54% and 9.7% [5], and 58.9% and 4.3%, respectively [30]. A PV module with higher
efficiency could be used for providing higher overall (thermal + electrical) efficiency, but at the time the system
was designed a semitransparent module with higher efficiency could not be obtained from the market.
9. Conclusion
A PV/T system with a semitransparent a-Si solar module used as the cover of the thermal collector was designed
and constructed. The solar module’s electrical efficiency was determined by measuring cell temperatures with
3539
ENGIN and COLAK/Turk J Elec Eng & Comp Sci
temperature sensors and the current and the voltage by a current sensor via a circuit. Experimentally, the
electrical efficiency was measured to be 4.35%, which is close to the stated efficiency of the manufacturer, and
was calculated to be 4.41% from the model.
The PV/T hybrid system efficiency was compared to the solar module and the thermal collector efficiencies
when operated separately. The thermal collector, operated in natural circulation mode, has a thermal efficiency
of 41%, whereas the efficiency was 58.7% during forced circulation with a pump. The PV/T hybrid system’s
instantaneous efficiency under natural flow conditions was found to be 71%. The PV/T system’s daily thermal
efficiency for forced circulation was calculated to be 59.5% by the model, whereas the measured efficiency for
the same day was 52%. Due to the selection of a semitransparent PV module and the TINOX coating of the
absorber plate with high absorption level, the overall efficiency of the PV/T hybrid system was improved, and
the obtained efficiency is close to or higher than the ones given in the literature as discussed in Section 5.
References
[1] Garg H, Agarwal R. Some aspects of a PV/T collector/forced circulation flat plate solar water heater with solar
cells. Energ Convers Manage 1995; 36: 87-99.
[2] Fujisawa T, Tani T. Annual exergy evaluation on photovoltaic-thermal hybrid collector. Sol Energ Mat Sol C 1997;
47: 135-148.
[3] Huang B, Lin T, Hung W, Sun F. Performance evaluation of solar photovoltaic/thermal systems. Sol Energy 2001;
70: 443-448.
[4] Tripanagnostopoulos Y, Nousia T, Souliotis M, Yianoulis P. Hybrid photovoltaic/thermal solar systems. Sol Energy
2002; 72: 217-234.
[5] Zondag HA, de Vries DW, van Helden WGJ, van Zolingen RJC, van Steenhoven AA. The thermal and electrical
yield of a PV-thermal collector. Sol Energy 2002; 72: 113-128.
[6] Zondag HA, de Vries DW, van Helden WGJ, van Zolingen RJC, van Steenhoven AA. The yield of different combined
PV-thermal collector designs. Sol Energy 2003; 74: 253-269.
[7] Chow T. Performance analysis of photovoltaic-thermal collector by explicit dynamic model. Sol Energy 2003; 75:
143-152.
[8] Chow TT, He W, Ji J. Hybrid photovoltaic-thermosyphon water heating system for residential application. Sol
Energy 2006; 80: 298-306.
[9] Sopian K, Yigit K, Liu H, Kakac S, Veziroglu T. Performance analysis of photovoltaic thermal air heaters. Energ
Convers Manage 1996; 37: 1657-1670.
[10] Garg HP, Adhikari RS. System performance studies on a photovoltaic/thermal (PV/T) air heating collector. Renew
Energ 1999; 16: 725-730.
[11] Hegazy AA. Comparative study of the performances of four photovoltaic/thermal solar air collectors. Energ Convers
Manage 2000; 41: 861-881.
[12] Aste N, Chiesa G, Verri F. Design, development and performance monitoring of a photovoltaic-thermal (PVT) air
collector. Renew Energ 2008; 33: 914-927.
[13] Tonui J, Tripanagnostopoulos Y. Performance improvement of PV/T solar collectors with natural air flow operation.
Sol Energy 2008; 82: 1-12.
[14] Assoa Y, Menezo C, Fraisse G, Yezou R, Brau J. Study of a new concept of photovoltaic–thermal hybrid collector.
Sol Energy 2007; 81: 1132-1143.
[15] Tripanagnostopoulos Y. Aspects and improvements of hybrid photovoltaic/thermal solar energy systems. Sol Energy
2007; 81: 1117-1131.
3540

ENGIN and COLAK/Turk J Elec Eng & Comp Sci
[16] Charalambous P, Maidment G, Kalogirou S, Yiakoumetti K. Photovoltaic thermal (PV/T) collectors: a review.
Appl Therm Eng 2007; 27: 275-286.
[17] Zondag HA. Flat-plate PV-thermal collectors and systems: a review. Renew Sust Energ Rev 2008; 12: 891-959.
[18] Chow T. A review on photovoltaic/thermal hybrid solar technology. Appl Energ 2010; 87: 365-379.
[19] Ibrahim A, Othman MY, Ruslan MH, Mat S, Sopian K. Recent advances in flat plate photovoltaic/thermal (PV/T)
solar collectors. Renew Sust Energ Rev 2011; 15: 352-365.
[20] De Vries DW, Van HeldenWGJ, Van Steenhoven RJ, Van Zoligen RJ, Smuders PT. Design of a photovoltaic/thermal
hybrid panel: design considerations and preliminary model. In: ISES EuroSun ’96 Conference; 16–19 September
1996; Freiburg, Germany. pp. 623-628.
[21] Muresan C, Menezo C, Bennacer R, Vaillon R. Numerical simulation of a vertical solar collector integrated in a
building frame: radiation and turbulent natural convection coupling. Heat Transfer Eng 2006; 27: 29-42.
[22] Krauter S, Araujo RG, Schroer S, Hanitsch R, Salhi MJ, Triebel C, Lemoine R. Combined photovoltaic and solar
thermal systems for facade integration and building insulation. Sol Energy 1999; 67: 239-248.
[23] Bakker M, Zondag HA, Elswijk MJ, Strootman KJ, Jong MJM. Performance and costs of a roof-sized PV/thermal
array combined with a ground coupled heat pump. Sol Energy 2005; 78: 331-339.
[24] Santbergen R, Rindt C, Zondag H, Van Zolingen R. Detailed analysis of the energy yield of systems with covered
sheet-and-tube PVT collectors. Sol Energy 2010; 84: 867-878.
[25] Charalambous P, Kalogirou S, Maidment G, Yiakoumetti K. Optimization of the photovoltaic thermal (PV/T)
collector absorber. Sol Energy 2011; 85: 871-880.
[26] Sandnes B, Rekstad J. A photovoltaic/thermal (PV/T) collector with a polymer absorber plate. Experimental study
and analytical model. Sol Energy 2002; 72: 63-73.
[27] Cristofari C, Notton G, Canaletti JL. Thermal behavior of a copolymer PV/Th solar system in low flow rate
conditions. Sol Energy 2009; 83: 1123-1138.
[28] Morita Y, Fujisawa T, Tani T. Moment performance of photovoltaic/thermal hybrid panel (numerical analysis and
exergetic evaluation). Electr Eng Jpn 2000; 133: 43-51.
[29] Fraisse G, Menezo C, Johannes K. Energy performance of water hybrid PV/T collectors applied to combisystems
of direct solar floor type. Sol Energy 2007; 81: 1426-1438.
[30] Ji J, Chow TT, He W. Dynamic performance of hybrid photovoltaic/thermal collector wall in Hong Kong. Build
Environ 2003; 38: 1327-1334.
[31] Vokas G, Christandonis N, Skittides F. Hybrid photovoltaic–thermal systems for domestic heating and cooling—a
theoretical approach. Sol Energy 2006; 80: 607-615.
[32] Eicker U, Dalibard A. Photovoltaic–thermal collectors for night radiative cooling of buildings. Sol Energy 2011; 85:
1322-1335.
[33] Dupeyrat P, Menezo C, Rommel M, Henning HM. Efficient single glazed flat plate photovoltaic–thermal hybrid
collector for domestic hot water system. Sol Energy 2011; 85: 1457-1468.
[34] Bergene T, Løvvik OM. Model calculations on a flat-plate solar heat collector with integrated solar cells. Sol Energy
1995; 55: 453-462.
[35] Corbin CD, Zhai ZJ. Experimental and numerical investigation on thermal and electrical performance of a building
integrated photovoltaic–thermal collector system. Energ Buildings 2010; 42: 76-82.
[36] Dubey S, Tiwari G. Thermal modeling of a combined system of photovoltaic thermal (PV/T) solar water heater.
Sol Energy 2008; 82: 602-612.
[37] Duffie JA, Beckman WA. Solar Engineering of Thermal Processes. 2nd ed. New York, NY, USA: Wiley, 1991.
[38] Notton G, Cristofari C, Poggi P, Muselli M. Calculation of solar irradiance profiles from hourly data to simulate
energy systems behaviour. Renew Energ 2002; 27: 123-142.
3541

ENGIN and COLAK/Turk J Elec Eng & Comp Sci
[39] Notton G, Cristofari C, Poggi P. Performance evaluation of various hourly slope irradiation models using Mediter-
ranean experimental data of Ajaccio. Energ Convers Manage 2006; 47: 147-173.
[40] Engin D, Engin M. Simulation modelling of a photovoltaic and thermal collector (PV/T) hybrid system. In: 6th
International Ege Energy Symposium and Exhibition; 28–30 June 2012; Izmir, Turkey. pp. 471-482.
[41] Jones A, Underwood C. A thermal model for photovoltaic systems. Sol Energy 2001; 70: 349-359.
[42] Basaran T. Kapalıtermosifon dongusunde akıs ve ısıtransferinin teorik ve deneysel incelenmesi. PhD, Dokuz Eylul
University, Izmir, Turkey, 2002 (in Turkish).
[43] Ishaque K, Salam Z, Taheri H. Simple, fast and accurate two-diode model for photovoltaic modules. Sol Energ Mat
Sol C 2011; 95: 586-594.
[44] Stutenbaeumer U, Mesfin B. Equivalent model of monocrystalline, polycrystalline and amorphous silicon solar cells.
Renew Energ 1999; 18: 501-512.
[45] Hansen AD, Sørensen P, Hansen LH, Bindner H. Models for a stand-alone PV system. In: Madsen PH, Lundsager
P, editors. Proceedings of UNDTCD/Danida/Risø International Workshop on Wind Energy. Roskilde, Denmark:
Danka Services International A/S, 2001.
[46] Zambrano RJ, Rubinelli FA, Arnoldbik WM, Rath JK, Schropp RE. Computer-aided band gap engineering and
experimental verification of amorphous silicon–germanium solar cells. Sol Energ Mat Sol C 2004; 81: 73-86.
3542


![Energy ffit multiconstrained optimization using hybrid …journals.tubitak.gov.tr/elektrik/issues/elk-16-24-5/elk-24-5-29... · AntHocNet [12] is a hybrid routing model considering](https://img.dokumen.tips/doc/110x75/5b83ea977f8b9a934f8e4e45/energy-t-multiconstrained-optimization-using-hybrid-anthocnet-12-is-a-hybrid.jpg)