Embed Size (px)
Citation preview
Turk J Elec Eng & Comp Sci
(2016) 24: 2290 – 2306
c⃝ TUBITAK
doi:10.3906/elk-1403-264
Turkish Journal of Electrical Engineering & Computer Sciences
http :// journa l s . tub i tak .gov . t r/e lektr ik/
Research Article
Power management using dynamic power state transitions and dynamic voltage
frequency scaling controls in virtualized server clusters
Mohan Raj VELAYUDHAN KUMAR1,∗, Shriram RAGHUNATHAN2
1Tata Research Development and Design Center, Tata Consultancy Services Limited, Pune, India2Department of Computer Science and Engineering, BS Abdur Rahman University, Chennai, India
Received: 26.03.2014 • Accepted/Published Online: 08.07.2014 • Final Version: 15.04.2016
Abstract: Reducing power consumption and maintaining user or application performance criteria is an important goal
in virtualized server cluster system design. Achieving this multiple objective requirement in a virtualized environment is
a challenge. One of the techniques widely explored in the literature to achieve this goal is the dynamic voltage frequency
scaling (DVFS) approach. However, power consumption reduction due to DVFS is far less than what can be achieved
with the dynamic power management (DPM) control approach to either switch OFF the server or to transition the
server to a low power SLEEP state when not processing application requests. In our work, we have formulated a power
optimization problem that meets the defined performance criteria for the workload. We have considered application
request response time as the performance metric. The adaptive controller is designed to track application performance
in the first step, with dynamic control and batch requests to the best server in order to minimize the power consumption
as the second step. In this paper, our aim is to reduce the power consumption of a virtualized server cluster by making
use of an adaptive hybrid approach that identifies the right server with the best performance for power metric (PPM),
DPM with server processor sleep state(s), and DVFS controls. Simulation results show that our hybrid approach using
PPM, DPM with sleep state, and DVFS controls is effective, achieves better energy savings, and meets the performance
criteria constraint.
Key words: Dynamic power management, dynamic voltage frequency scaling, power efficiency, processor sleep states
1. Introduction
Power and energy consumption has become the key concern in server cluster environments or datacenters.
Datacenter owners or cloud service providers have to pay more attention to energy consumption as it has direct
impact on their profitability. Server power efficiency or performance per watt used has remained roughly flat
over time, although advanced hardware technology has improved the performance per hardware dollar cost [1].
As a result, the electricity consumption cost of servers in datacenters will be more than the hardware cost and
has become a major contributor to total cost of ownership.
Datacenters hosting virtualized servers (datacenter clouds) have become a necessity as virtualization
helps efficiently manage system resources and provide them to users. This has definitely helped datacenters
scale up to meet ever increasing demands of users. The consumption of power consumed by datacenters has
increased 400% over the past decade [2]. For a datacenter owner, the primary goal is to satisfy the committed
performance metrics (service level agreements (SLAs), like request response-times or throughputs).
∗Correspondence: [email protected]
2290
VELAYUDHAN KUMAR and RAGHUNATHAN/Turk J Elec Eng & Comp Sci
Prior works have focused on CPU energy proportionality, adjusting the frequency and voltage according
to load (dynamic voltage/frequency scaling (DVFS)), and low-power CPU power states (DPM) in mostly
nonvirtualized single server or nonvirtualized cluster environments. In this work, our focus is to study energy
consumption and performance implications in a virtualized server cluster environment. We use a combination
of PPM, DPM, and DVFS methods to reduce datacenter energy consumption and maintain application or user
performance SLA metrics. Additionally, we extend DPM with server processor sleep states to reduce total
server cluster energy consumption and adhere to performance SLAs.
To our best knowledge, this work using DPM server processor sleep state controls, DVFS controls, and
heterogeneity aware PPM in a virtualized server cluster environment is unique and could help further augment
research in this area.
Using our approach, we show 1) an opportunity to reduce power consumption, 2) energy savings with min-
imal performance degradation (request response times are within a set threshold value), and 3) an improvement
in power efficiency (discussed in Section 3.2). We make the following contributions:
• propose an energy consumption reduction hybrid approach using PPM sequencing along with DPM and
DVFS controls;
• identify the opportunities for inclusion of server level processor sleep states in a virtualized server cluster
environment;
• empirically analyze workload processing in a virtualized environment using adaptive server DPM and
DVFS controls as levers to reduce energy consumption;
• empirically analyze impacts on energy consumption, performance response times, power consumption, and
power efficiency using the power-performance PPM sequencing, adaptive DPM, and DVFS control levers.
The rest of the paper is organized as follows. Section 2 reviews related work in this area. Sections 3 provide the
preliminaries and the proposed methodology to improve power efficiency. In Section 4, we discuss the results
obtained and we conclude the work in Section 5.
2. Related work
We focus on works done considering both DVFS and DPM to reduce server power consumption with application
request performance criteria as a constraint. For each of these related works, we highlight the approach adopted
and limitations or gaps in it that we have addressed in our proposed approach.
A power minimization policy approach [3] used a mixed integer programming modeling technique to
reduce power consumption while satisfying application performance constraints in a virtualized cluster environ-
ment. This model considers server ON and OFF states and transition or switching costs. This work considered
ON and OFF server processor power states only and did not consider server sleep states.
Gandhi et al. [4] proposed an optimization approach using an energy-response time product trade-off
metric with sleep states in server farms to reduce power consumption. This work considered energy savings
using both an optimal multimode sleep state and dynamic voltage scaling (DVS) in a multitier nonvirtualized
server cluster environment, whereas our work considers a virtualized heterogeneous server cluster environment.
Powernap and Dreamweaver [5,6] approaches proposed workload request scheduling techniques using CPU
power state transitions to achieve power savings at the physical sever level. The Dreamweaver [6] approach
accounts for server transitions in and out of an ultralow power nap state with a deferred or extended delay
2291

VELAYUDHAN KUMAR and RAGHUNATHAN/Turk J Elec Eng & Comp Sci
before waking up the processor and preempting in-process execution to enter the nap state. Both these works
considered a single nonvirtualized server.
Virtual batching [7] proposed an approach to group VMs of a host based on their request processing
schedule to achieve time-balanced alignment or synchrony based on request completion. When requests in VMs
of the host complete their execution at nearly the same time, it gives an option to put the host to a lower power
consumption state while waiting further. This work considers only one virtualized server, whereas in our work
we have considered a virtualized server cluster environment with heterogeneous server configurations.
The Powersleep approach [8] used both DPM with sleep state and DVS to reduce power consumption
while satisfying the response time constraints. This work was illustrated using only a single physical server,
whereas in our work we have considered a virtualized server cluster environment using heterogeneous aware
energy reduction technique.
The Napsac scheme [9] used workload as the basis to dynamically provision resources by determining the
set of servers that should be in operational state (awake) at a particular epoch time. This work considered only
a nonvirtualized server configuration, whereas in our work we consider virtualized server clusters.
The dynamic right-sizing [10] approach achieved power proportionality by turning servers off during
periods of low workload intensity using an online algorithm called lazy capacity provisioning. This work
considered physical servers and did not account for server sleep power state transitions.
The authors of [11,12] used machine learning selection techniques to arrive at a set of expert DPM policies
and DVFS voltage-frequency settings. These set of policies were used to control servers’ power states with an
objective to minimize power consumption. Both these work considered physical servers.
A reactive policy approach [13] proposed a server power sleep state transition in a virtualized server
cluster setup by considering a factor multiplier to a similar transition in a physical server cluster setup. In
reality, accounting for sleep states in virtualized server clusters is far more complex than a simple factor of a
safety multiplier approach.
The above works consider physical servers or do not consider the impact in using server processor
level DPM sleep state transitions on virtual machine (VM) usage, or do not consider heterogeneity server
configurations in a virtualized server cluster environment. In our work, we propose a hybrid approach that
uses heterogeneous aware PPM logic with DVFS controls and DPM server ON, OFF, and sleep power state
transition controls in a virtualized server cluster environment to reduce energy consumption and meet workload
performance SLAs.
3. Solution approach
We briefly discuss different models to arrive at server heterogeneity factor PPM, power, energy, and performance;
system architecture; and an algorithmic approach using these defined models. In this paper, we have extended
model notations and simulation test-bed setups from our earlier work [14] to account for DVFS and DPM sleep
state transitions.
3.1. Modeling server performance to power metric (PPM)
We consider a server cluster with N servers from among M heterogeneous distinct host types or configurations.
Servers of a particular host type exhibit unique or the same performance and power characteristics. No two
host type servers have the same characteristics.
2292

VELAYUDHAN KUMAR and RAGHUNATHAN/Turk J Elec Eng & Comp Sci
a) HT(k) is the host type vector represented as a tuple {P i, k, jutil% , MIPS(k) , Cores(k) }; where k ∈ {1 ...
M};k is the host type; M is the total number of host types; i ∈ {1 ... H k };Hk is the total servers of host
type k ;j ∈ {1 ... F k };Fk is the maximum server frequency index for the host type k ; util% ∈ {0...100}.
Ski ith server in kth host type;
util% is the CPU core utilization
x = usedMIPS100TotalMIPS (1)
usedMIPS processor core MIPS used by active run-time requests processed by the servercore=TotalMIPS – AvailableMIPS
TotalMIPS Total processor core MIPS= Cores(k) x MIPS(k)
AvailableMIPS free processor core MIPS
P i, k, jutil% power consumption at CPU utilization% of server Sk
i
MIPS(k) TotalMIPS of CPU of a server of host type k
Cores(k) number of cores of a server of host type k
b) Server Ski with the best power to performance metric (PPM) ratio in a server cluster is computed as
follows:
where k ∈ {1 .. M };k is the host type;M is the total number of host types; i ∈ {1 ... H k };Hk is the
total servers of host type k ;j ∈ {1 .. F k };Fk is the maximum server frequency index for the host type
k ; util% ∈ { 0 ... 100};
PPMki performance to power metric of server Sk
i
x = Cores(k)MIPS(k)
P(i, k, j)
0%
(2)
Server Ski with best = Max ( PPMk
i )
PPM metric where ∀i ∈ {1 .. H k}; ∀k ∈ {1 .. M }; (3)
The reason to consider server power consumption at idle state (utilization = 0%) is to account for the
high contribution of static power to the total server power consumption. We can dynamically include PPMki
computed using instantaneous server CPU utilization% value for better accuracy.
3.2. Modeling server cluster power efficiency
Power efficiency of the server cluster to process a request is defined as the ratio between work done and power
consumed.
PE Power efficiency per request [13]x = 1
(TAV GPAV G)
(4)
TAVG Mean request response time (in seconds) for requests completed during the course of the trace
PAVG Mean power consumption (in watts) of the servers in the cluster during the course of the trace
2293
VELAYUDHAN KUMAR and RAGHUNATHAN/Turk J Elec Eng & Comp Sci
If this PE metric for a scheme with sleep state is greater than PE of a baseline, it indicates that the
solution is useful [4]. To compare the schemes, we look at the normalized PE [4], NPE, defined as the PE for
the dynamic policy, say “DPM (with sleep state)” scheme, normalized by the PE for a “No DPM” AlwaysOn
baseline scheme.
NPEDPM withSleep stateNoDPM baseline Normalized power efficiency (NPE)
= PE(DPM with sleep state)
PENoDPM baseline (5)
When NPE exceeds 1, we infer that the “DPM (with sleep state)” scheme is superior to the “No DPM”
AlwaysOn baseline scheme.
3.3. Modeling server power state transition
Possible server power states are OFF, SETUP, SLEEP, IDLE, and BUSY. Power state transitions like OFF
to IDLE, IDLE to BUSY, BUSY to IDLE, IDLE to SLEEP, and SLEEP to OFF are termed as SETUP state
transitions. Server power states like OFF, SETUP, and SLEEP are referred to as nonoperational power states
and IDLE and BUSY server power states are referred to as operational or active power states. Each state
or transition is represented by a tuple of power consumption (P) and time spent (T) in the state or power
consumption during transition to another state and the time spent in transition {P, T}.
3.4. Modeling server power consumption using server CPU utilization
In this work, we consider physical server power consumption of different server configurations at different power
states as in Table 1.
P i,k,jo% is the server power consumption when no application is running in the server Sk
i , also known as
idle power (CPU utilization is 0%) of the server with host type k and frequency fkj .P
i,k,j100% is the server power
consumption when the server’s CPU utilization% = 100% of the server with host type k and frequency fkj .
We have used the below model to calculate server power consumption when utilization% is not covered
in SPEC results [15].
P i, k, jutil% = P i, k, j
⌊util%⌋ x +∆ (⌈util%⌉−⌈util%⌉)100 (6)
∆ = P i, k, j⌈util%⌉ − P i, k, j
⌊util%⌋
3.5. Modeling total server cluster energy and power consumption
As our hybrid approach uses both DPM and DVFS techniques, our energy model should account for power
consumed when in operational (DVFS : BUSY, IDLE) power states and also nonzero power consumed in
nonoperational (DPM : OFF, SLEEP, SETUP) power states. The SETUP transition power state captures one
of the transitions like OFF→IDLE; SLEEP→IDLE; IDLE→BUSY; IDLE→SLEEP; SLEEP→OFF.
2294

VELAYUDHAN KUMAR and RAGHUNATHAN/Turk J Elec Eng & Comp Sci
Table 1. Physical server state power consumption (in watts) [15].
Host type k Power (1) (2) (3) (4) (5) (6) (7) Comments
PM i,k,j 169 117 135 113 113 247 222 Peak power consumption of Ski at jth
frequency index
Pmi,k,j 105 86 93 41.6 42.3 67 58.4 Idle power consumption of Ski at jth
frequency index
P i,k,jSETUP 169 117 135 113 113 247 222 Power consumption of Sk
i atjth fre-quency index during state transition(e.g., OFF to IDLE; IDLE to SLEEP)
P i,k,jSLEEP 10 10 15 10 10 10 15 Power consumption of Sk
i at jth fre-quency index when in SLEEP state
P i,k,jOFF 0 0 0 0 0 0 0 Power consumption of Sk
i at jth fre-quency index in OFF state
(1) HpProLiantMl110G3PentiumD930, (2) HpProLiantMl110G4Xeon3040, (3) HpProLiantMl110G5Xeon3075,
(4) IbmX3250XeonX3470, (5) IbmX3250XeonX3480, (6) IbmX3550XeonX5670.
Ski ith server of kth host type;
Eki Total energy consumed by the server Sk
i
x x x x = P i,k,jSLEEP T i,k,j
SLEEP + 0T i,k,jOFF + P i,k,j
SETUP T i,k,jSETUP + P i,k,j
util% T i,k,jutil%
E Total server cluster energy consumption
=∑Hk
i=1
∑Mk=1
(Ek
i
) (7)
P ki Total power consumed by the serverSk
i
=Ek
i
T i,k,jSLEEP+T i,k,j
OFF+T i,k,jSETUP+T i,k,j
util%
P Total server cluster power consumption
=∑Hk
i=1
∑Mk=1 P
ki
(8)
P i,k,jSLEEP Power consumed by server Sk
i in SLEEP mode
T i,k,jSLEEP Time duration of server Sk
i in SLEEP mode
P i,k,jSETUP Power consumed by server Sk
i in SETUP mode (power state transitions)
T i,k,jSETUP Time duration of server Sk
i in SETUP mode
P i,k,jutil% Power consumed by server Sk
i in BUSY or IDLE mode; host type k and operating ata particular CPU utilization% and frequency fk
j
T i,k,jutil% Time duration of server Sk
i in BUSY or IDLE mode; host type k and operating at aparticular CPU utilization% and frequency fk
j
3.6. Modeling server DPM
Server power state downgrade transition policy: In the case that the physical server Ski has SLEEP
state(s), the break-even-time (BET) to wait in the IDLE state before downgrading or transitioning to SLEEP
state is given by T i,k,jWAIT SLEEP . Here we have assumed the case of physical server Sk
i with just one SLEEP
state. In that case, the physical server does not have SLEEP state(s), and then BET to wait in the IDLE state
before transitioning to the OFF state is given by T i,k,jWAIT OFF . In the case that the physical server has one
SLEEP state, the BET to wait in the IDLE state for T i,k,jWAIT SLEEP before transitioning to the SLEEP state
2295
VELAYUDHAN KUMAR and RAGHUNATHAN/Turk J Elec Eng & Comp Sci
and then wait in the SLEEP state for T′i,k,jWAIT SLEEP before transitioning to the OFF state is given.
T i,k,jWAIT SLEEP= T i,k,j
SLEEP IDLE × P i,k,jSETUP ÷ P i,k,j
IDLE (9)
T i,k,jWAIT OFF= T i,k,j
OFF IDLE × P i,k,jSETUP ÷ P i,k,j
IDLE (10)
T i,k,jWAIT SLEEP OFF= T ′i,k,j
WAIT SLEEP + T i,k,jWAIT SLEEP (11)
T′i,k,jWAIT SLEEP= T i,k,j
OFF SLEEP × P i,k,jSETUP ÷ P i,k,j
SLEEP (12)
T i,k,jOFF SLEEP= T i,k,j
OFF IDLE ÷ 2 (13)
Power consumption at different states is as follows:
PM i,k,j > Pmi,k,j >> P i,k,jSLEEP > P i,k,j
OFF = 0
Setup/transition time comparison from SLEEP or OFF state to IDLE state is as follows:
T i,k,jSLEEP IDLE<T i,k,j
OFF IDLE
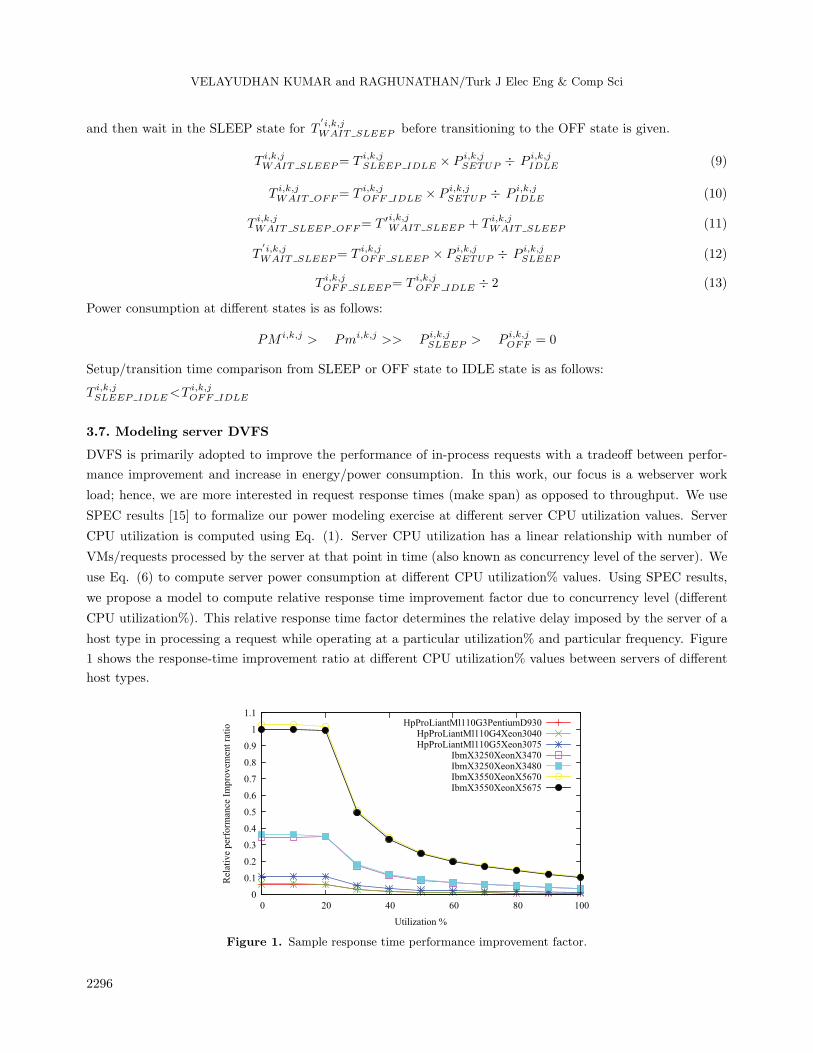
3.7. Modeling server DVFS
DVFS is primarily adopted to improve the performance of in-process requests with a tradeoff between perfor-
mance improvement and increase in energy/power consumption. In this work, our focus is a webserver work
load; hence, we are more interested in request response times (make span) as opposed to throughput. We use
SPEC results [15] to formalize our power modeling exercise at different server CPU utilization values. Server
CPU utilization is computed using Eq. (1). Server CPU utilization has a linear relationship with number of
VMs/requests processed by the server at that point in time (also known as concurrency level of the server). We
use Eq. (6) to compute server power consumption at different CPU utilization% values. Using SPEC results,
we propose a model to compute relative response time improvement factor due to concurrency level (different
CPU utilization%). This relative response time factor determines the relative delay imposed by the server of a
host type in processing a request while operating at a particular utilization% and particular frequency. Figure
1 shows the response-time improvement ratio at different CPU utilization% values between servers of different
host types.
Figure 1. Sample response time performance improvement factor.
2296

VELAYUDHAN KUMAR and RAGHUNATHAN/Turk J Elec Eng & Comp Sci
3.8. System architecture
In this section, we give a high level description of our architecture. The goal is to meet request response time
criteria while minimizing total energy consumption of the server cluster. To achieve this goal, we adopt the
following techniques: request batching, DPM controlled server duty cycle management with and without sleep
state, DVFS controlled run-time response time management, and a selection approach to arrive at the best or
optimal performance to power server configuration. Figure 2 captures the solution architecture.
Arbitrator
Server State Monitor
Power State Transitioner
DVFS Controller
Performance to Power (PPM) Configuration
Selector
DPM Controller
Workload
S 1
VM 1,1
VM 1,2
VM 1,m1
S 2
VM 2,1
VM 2,2
VM 2,m2
S 3
VM 3,1
VM 3,2
VM 3,m3
S N
VM n,1
VM n,2
VM n,mn
BUSY
IDLE
SLEEP
OFF
Virtualized Server Cluster
Figure 2. System architecture.
When the server is active, it is in the running mode or is in the middle or processing jobs, or it is in the
idle mode at the default frequency fkFk
without processing any valid job, or it is in the idle mode at one of the
possible frequencies fkj ; j ∈ {1... F k }without processing any valid job. With DPM, the server can transition
between power states. However, there are overheads [16] (power and SETUP transition time expended) to be
accounted for. These transition expenses are referred to as setup power and setup time. We consider a Poisson
job request arrival with an arrival rate λ and we assume that jobs follow a uniform service time distribution.
The system architecture comprises the following modules:
• Performance to power configuration selector
• DVFS controller
• DPM controller
• Low power state transitioner
• Arbitrator
2297
VELAYUDHAN KUMAR and RAGHUNATHAN/Turk J Elec Eng & Comp Sci
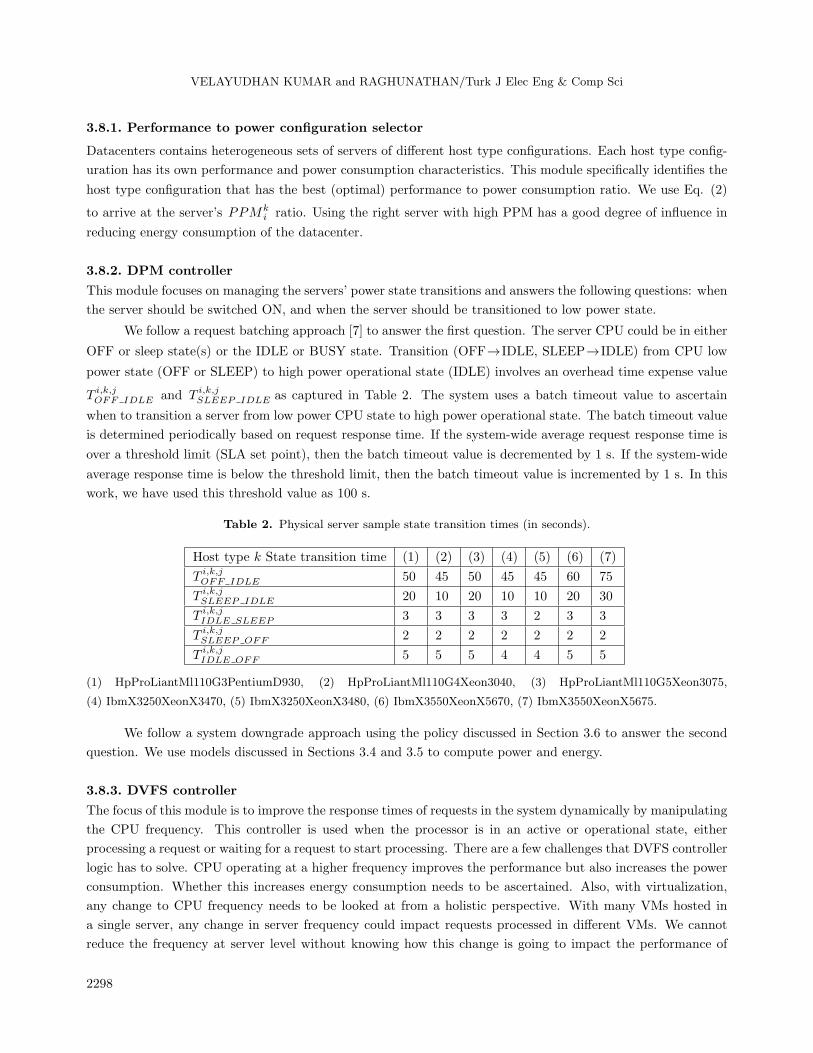
3.8.1. Performance to power configuration selector
Datacenters contains heterogeneous sets of servers of different host type configurations. Each host type config-
uration has its own performance and power consumption characteristics. This module specifically identifies the
host type configuration that has the best (optimal) performance to power consumption ratio. We use Eq. (2)
to arrive at the server’s PPMki ratio. Using the right server with high PPM has a good degree of influence in
reducing energy consumption of the datacenter.
3.8.2. DPM controller
This module focuses on managing the servers’ power state transitions and answers the following questions: when
the server should be switched ON, and when the server should be transitioned to low power state.
We follow a request batching approach [7] to answer the first question. The server CPU could be in either
OFF or sleep state(s) or the IDLE or BUSY state. Transition (OFF→IDLE, SLEEP→IDLE) from CPU low
power state (OFF or SLEEP) to high power operational state (IDLE) involves an overhead time expense value
T i,k,jOFF IDLE and T i,k,j
SLEEP IDLE as captured in Table 2. The system uses a batch timeout value to ascertain
when to transition a server from low power CPU state to high power operational state. The batch timeout value
is determined periodically based on request response time. If the system-wide average request response time is
over a threshold limit (SLA set point), then the batch timeout value is decremented by 1 s. If the system-wide
average response time is below the threshold limit, then the batch timeout value is incremented by 1 s. In this
work, we have used this threshold value as 100 s.
Table 2. Physical server sample state transition times (in seconds).
Host type k State transition time (1) (2) (3) (4) (5) (6) (7)
T i,k,jOFF IDLE 50 45 50 45 45 60 75
T i,k,jSLEEP IDLE 20 10 20 10 10 20 30
T i,k,jIDLE SLEEP 3 3 3 3 2 3 3
T i,k,jSLEEP OFF 2 2 2 2 2 2 2
T i,k,jIDLE OFF 5 5 5 4 4 5 5
(1) HpProLiantMl110G3PentiumD930, (2) HpProLiantMl110G4Xeon3040, (3) HpProLiantMl110G5Xeon3075,
(4) IbmX3250XeonX3470, (5) IbmX3250XeonX3480, (6) IbmX3550XeonX5670, (7) IbmX3550XeonX5675.
We follow a system downgrade approach using the policy discussed in Section 3.6 to answer the second
question. We use models discussed in Sections 3.4 and 3.5 to compute power and energy.
3.8.3. DVFS controller
The focus of this module is to improve the response times of requests in the system dynamically by manipulating
the CPU frequency. This controller is used when the processor is in an active or operational state, either
processing a request or waiting for a request to start processing. There are a few challenges that DVFS controller
logic has to solve. CPU operating at a higher frequency improves the performance but also increases the power
consumption. Whether this increases energy consumption needs to be ascertained. Also, with virtualization,
any change to CPU frequency needs to be looked at from a holistic perspective. With many VMs hosted in
a single server, any change in server frequency could impact requests processed in different VMs. We cannot
reduce the frequency at server level without knowing how this change is going to impact the performance of
2298

VELAYUDHAN KUMAR and RAGHUNATHAN/Turk J Elec Eng & Comp Sci
requests in the VMs. In our work, we start (awaken) a server at the lowest possible frequency for the host
type. When the server is in an active or operational state, we periodically check if the system response time is
greater than a threshold value. If the system response time is greater than the threshold value, it means that
the system is either missing or about to miss SLA norms. When this happens, we upgrade the frequency of the
server to improve the performance with the possibility of an increase in power consumption. Another possibility
is to migrate request(s) to a server with higher performance/processing capability.
3.8.4. Low power state transitioner
The function of this module is to transition a server from a high power state to low power state (both at
DVFS and DPM controlled states). This function is initiated after completion of each request, if the average
response times of the system are lower than the threshold limit by a margin, which means that the system is
performing far better than the requirement, with periodic control interval runs of the power downgrade routine.
The following constraints and action policy rules are followed when the power transitioner function is calledupon:
• No request should be in process in any of the VMs hosted in the server.
• On DVFS: The servers’ frequency is defaulted to the lowest frequency value. This change is applied only
when the server is operating at a higher frequency value.
• On DPM: The downgrade policy discussed in Section 3.6 is adopted, using the optimal time to wait
(TWAIT ) in a higher power state before transitioning to a lower power state determined for the server.
3.8.5. Arbitrator
The arbitrator is the crucial intelligent module that orchestrates and controls functions of other modules in the
architecture. Web requests or workloads from clients are redirected based on a load balancing scheme.
We have used a time-shared scheduling policy and first-come first-served servicing policy. Generally, a
trade-off exists between high performance and low power consumption: high performance means more power
consumption and possibly more energy consumption. In real problems, we usually place the performance
demand criteria prior to the power consumption. Hence, the problem can be formulated as:
Minimize (P )
Subject to TAVG <= TSETPOINT
Here, P is the server cluster power consumption, TAVG is the average request response time, and
TSETPOINT is the response time threshold requirement. We use the hybrid approach captured in Pseudocode
1 to process workload requests.
2299
VELAYUDHAN KUMAR and RAGHUNATHAN/Turk J Elec Eng & Comp Sci
//PPM
1: Find server’s PPMi using Eq. (2)
2: Build hostList with servers sorted by decreasing PPMi value
3: While workload request exists Do //cloudlet request queue
4: consider request from arbitrator queue
5: For each server in the hostList Do
6: If server is in operational state (i.e. BUSY or IDLE) "en
7: If server has VM available to process the request "en
8: Use DVFS controller to control performance and power (Section 3.8.3)
9: Use this server and VM to process the request
10: proceed with next workload request
11: End For
//When there is no server in operational state then check whether there are any servers in SLEEP state
12: For each server in the hostList Do
13: If server is in SLEEP state "en
14: use DPM controllers wake up batching routine (Section 3.8.2) to transition the
server from SLEEP IDLE state
15: re-queue the request enabling it to be considered for processing again
16: End For
//When there is no server in any of the BUSY, IDLE, SLEEP states then check //whether there are any servers in
IDLE state
17: For each server in the hostList Do
18: If server is in OFF state "en
19: use DPM controllers wake up batching routine (Section 3.8.2) to transition
the server from OFF IDLE state
20: re-queue the request enabling it to be considered for processing again
21: End For
22: End While //cloud request
//power reduction reclaiming policy run
23: Do a#er each request process completion in the VM (or) at select control epoch
24: If the VM does not have any in-process request and TAVG < TSETPOINT, "en
25: initiate DPM controller’s downgrade policy routine (Section 3.8.4) IDLE SLEEP OFF state
transition
26: End Do
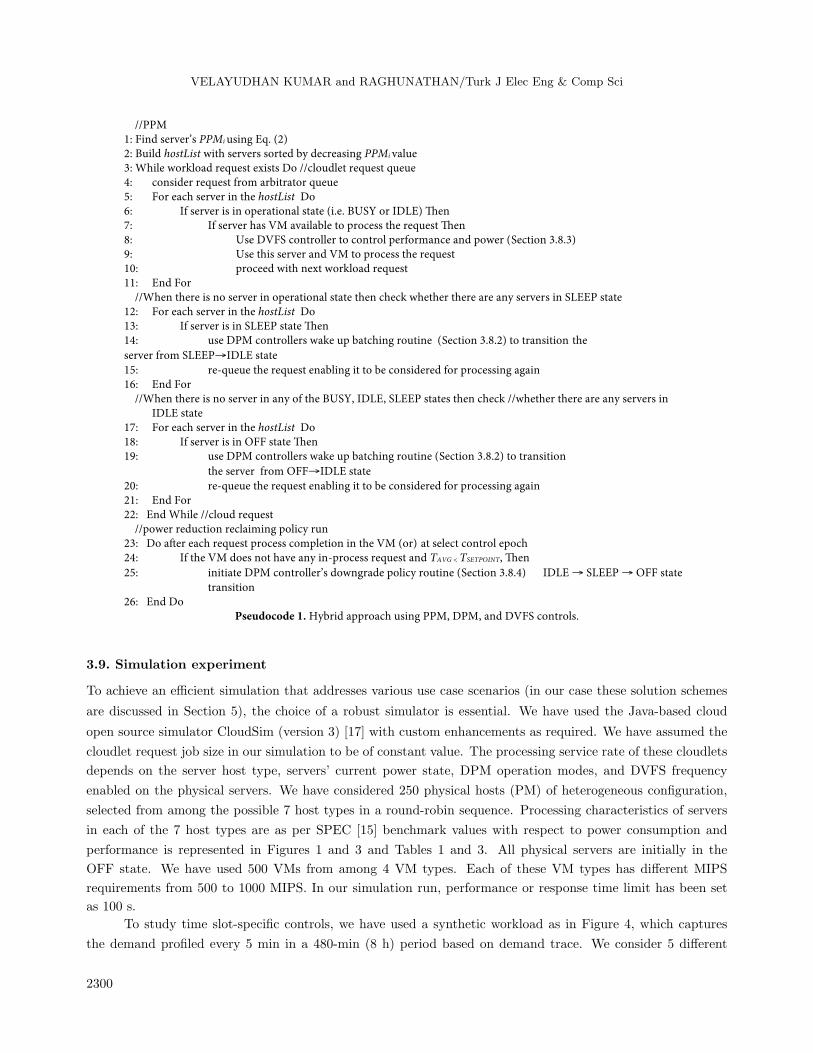
Pseudocode 1. Hybrid approach using PPM, DPM, and DVFS controls.
3.9. Simulation experiment
To achieve an efficient simulation that addresses various use case scenarios (in our case these solution schemes
are discussed in Section 5), the choice of a robust simulator is essential. We have used the Java-based cloud
open source simulator CloudSim (version 3) [17] with custom enhancements as required. We have assumed the
cloudlet request job size in our simulation to be of constant value. The processing service rate of these cloudlets
depends on the server host type, servers’ current power state, DPM operation modes, and DVFS frequency
enabled on the physical servers. We have considered 250 physical hosts (PM) of heterogeneous configuration,
selected from among the possible 7 host types in a round-robin sequence. Processing characteristics of servers
in each of the 7 host types are as per SPEC [15] benchmark values with respect to power consumption and
performance is represented in Figures 1 and 3 and Tables 1 and 3. All physical servers are initially in the
OFF state. We have used 500 VMs from among 4 VM types. Each of these VM types has different MIPS
requirements from 500 to 1000 MIPS. In our simulation run, performance or response time limit has been set
as 100 s.
To study time slot-specific controls, we have used a synthetic workload as in Figure 4, which captures
the demand profiled every 5 min in a 480-min (8 h) period based on demand trace. We consider 5 different
2300
VELAYUDHAN KUMAR and RAGHUNATHAN/Turk J Elec Eng & Comp Sci
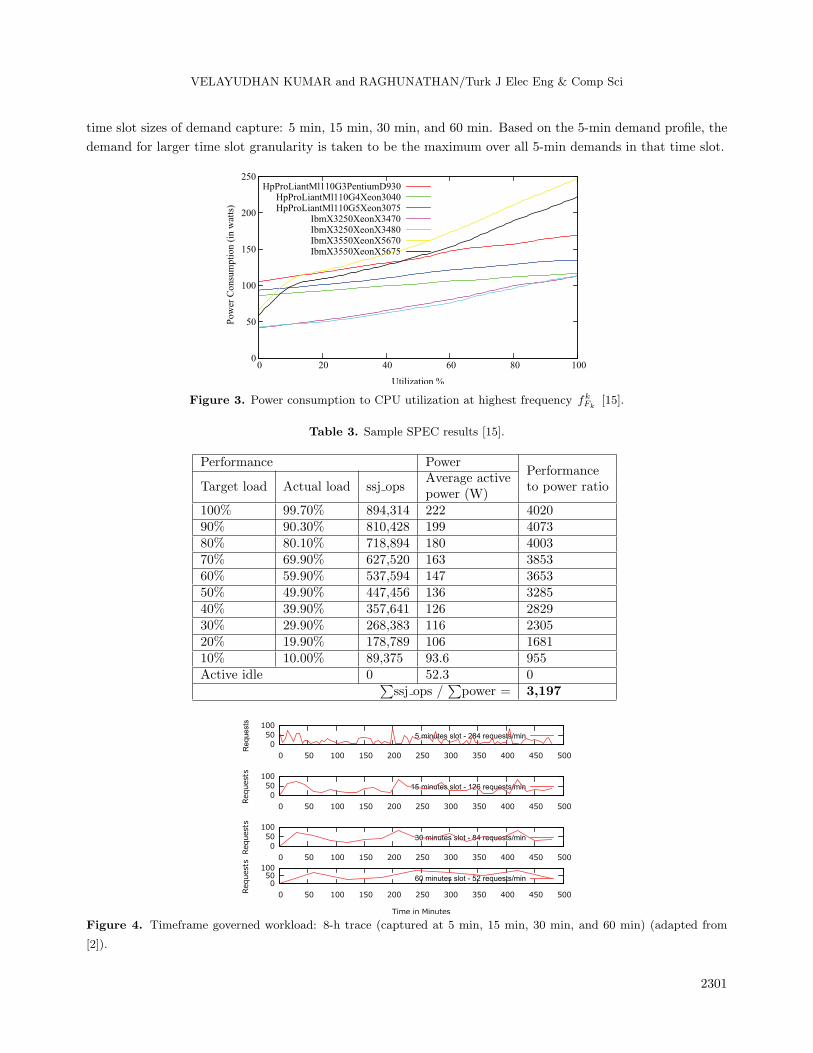
time slot sizes of demand capture: 5 min, 15 min, 30 min, and 60 min. Based on the 5-min demand profile, the
demand for larger time slot granularity is taken to be the maximum over all 5-min demands in that time slot.
Figure 3. Power consumption to CPU utilization at highest frequency fkFk
[15].
Table 3. Sample SPEC results [15].
Performance PowerPerformance
Target load Actual load ssj opsAverage active
to power ratiopower (W)
100% 99.70% 894,314 222 402090% 90.30% 810,428 199 407380% 80.10% 718,894 180 400370% 69.90% 627,520 163 385360% 59.90% 537,594 147 365350% 49.90% 447,456 136 328540% 39.90% 357,641 126 282930% 29.90% 268,383 116 230520% 19.90% 178,789 106 168110% 10.00% 89,375 93.6 955Active idle 0 52.3 0∑
ssj ops /∑
power = 3,197
Figure 4. Timeframe governed workload: 8-h trace (captured at 5 min, 15 min, 30 min, and 60 min) (adapted from
[2]).
2301
VELAYUDHAN KUMAR and RAGHUNATHAN/Turk J Elec Eng & Comp Sci
D(t, t + ∆) = max{D(t),. . . ,D(t +∆) }; where D(t, t + ∆) denotes the maximum demand for time
duration ∆, for, e.g., the 5-min slot (from t to t+5 ) [2]. We have 2092, 1134, 764, and 468 requests tracked
against 5 min, 15 min, 30 min, and 60 min of demand distribution.
The main purpose of using four types of request distribution (5 min, 15 min, 30 min, and 60 min) is to:
a) Consider workloads with different request arrival rates as captured below in our simulation process runs:
- 5-min distribution tracks 2092 requests over 8 h (480 min) of duration with arrival rate of 284
requests per minute,
- 15-min distribution tracks 1134 requests over 8 h of duration with arrival rate of 126 requests per
minute,
- 30-min distribution tracks 764 requests over 8 h of duration with arrival rate of 84 requests per
minute, and
- 60-min distribution tracks 468 requests over 8 h of duration with arrival rate of 52 requests per
minute.
b) Understand the impacts of workload arrival rates (requests per minute ratio) on performance (TAVG),
energy consumption (E), and power efficiency (NPE ) metrics.
Assumptions: Each host type configuration has one intermediate sleep state (OFF, ON, and BUSY
are the other states). Each host type configuration operates at two frequencies. With DVFS, we have used
frequency as the lever to manage response times of requests processed in a server. Each VM created/assigned
to a PM is exclusively pinned to one of the physical machine cores and VMs or requests’ MIPS requirements
cannot exceed the capacity of a single core.
4. Results
We have used the simulation test bed described in Section 3.9 to perform our experimentation runs. We have
considered the following schemes in our simulation:
• “No DPM”: PM states are OFF, ON, IDLE — only server power state upgrades possible; request batching;
this is one of the baseline schemes and is also called the Always ON without DVFS solution scheme.
• “DPM (without SLEEP state)”: PM states are OFF, ON, IDLE — both state upgrades and downgrades
possible; processor runs at lowest frequency; request batching; this is one of the DPM alone schemes.
• “DPM (with SLEEP state)”: PM states are OFF, SLEEP, IDLE, ON — both state upgrade and
downgrade possible; processor runs at lowest frequency; request batching; this is one of the DPM alone
schemes.
• “No DPM + DVFS”: PM states are OFF, ON, IDLE — only state upgrades possible; processor frequency
change allowed; request batching; this is one of the baseline schemes and is also called the Always ON
with DVFS solution scheme.
• “DPM (without SLEEP state) + DVFS”: PM states are OFF, ON, IDLE — both state upgrade and
downgrade possible; processor frequency change allowed; request batching.
2302
VELAYUDHAN KUMAR and RAGHUNATHAN/Turk J Elec Eng & Comp Sci
• “DPM (with SLEEP state) + DVFS”: PM states are OFF, ON, SLEEP, IDLE — both state upgrade
and downgrade possible; processor frequency change allowed; request batching.
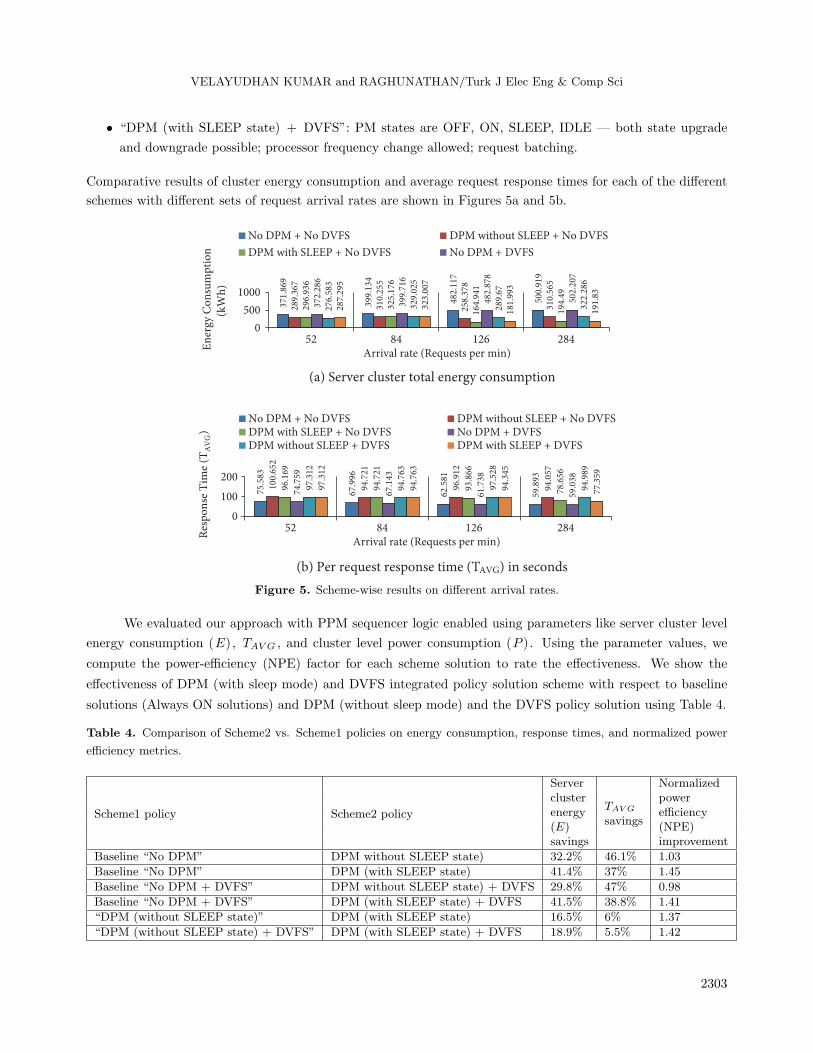
Comparative results of cluster energy consumption and average request response times for each of the different
schemes with different sets of request arrival rates are shown in Figures 5a and 5b.
(a) Server cluster total energy consumption
(b) Per request response time (TAVG) in seconds
371.
869
399.
134
482.
117
500.
919
289.
367
310.
255
258.
378
310.
565
296.
936
325.
176
164.
941
194.
49
372.
286
399.
716
482.
878
502.
207
276.
583
329.
025
289.
67
322.
286
287.
295
323.
007
181.
993
191.
83
0
500
1000
52 84 126 284
En
ergy
Co
nsu
mp
tio
n
(kW
h)
Arrival rate (Requests per min)
No DPM + No DVFS DPM without SLEEP + No DVFS
DPM with SLEEP + No DVFS No DPM + DVFS75
.583
67.9
96
62.5
81
59.8
93
100.
652
94.7
21
96.9
12
94.0
57
96.1
69
94.7
21
93.8
66
78.6
56
74.7
59
67.1
43
61.7
38
59.0
38
97.3
12
94.7
63
97.5
28
94.9
89
97.3
12
94.7
63
94.3
45
77.3
59
0
100
200
52 84 126 284
Res
po
nse
Tim
e (T
AV
G)
Arrival rate (Requests per min)
No DPM + No DVFS DPM without SLEEP + No DVFSDPM with SLEEP + No DVFS No DPM + DVFSDPM without SLEEP + DVFS DPM with SLEEP + DVFS
Figure 5. Scheme-wise results on different arrival rates.
We evaluated our approach with PPM sequencer logic enabled using parameters like server cluster level
energy consumption (E), TAVG , and cluster level power consumption (P ). Using the parameter values, we
compute the power-efficiency (NPE) factor for each scheme solution to rate the effectiveness. We show the
effectiveness of DPM (with sleep mode) and DVFS integrated policy solution scheme with respect to baseline
solutions (Always ON solutions) and DPM (without sleep mode) and the DVFS policy solution using Table 4.
Table 4. Comparison of Scheme2 vs. Scheme1 policies on energy consumption, response times, and normalized power
efficiency metrics.
Scheme1 policy Scheme2 policy
Server
TAV G
Normalizedcluster
savings
powerenergy efficiency(E) (NPE)savings improvement
Baseline “No DPM” DPM without SLEEP state) 32.2% 46.1% 1.03
Baseline “No DPM” DPM (with SLEEP state) 41.4% 37% 1.45
Baseline “No DPM + DVFS” DPM without SLEEP state) + DVFS 29.8% 47% 0.98
Baseline “No DPM + DVFS” DPM (with SLEEP state) + DVFS 41.5% 38.8% 1.41
“DPM (without SLEEP state)” DPM (with SLEEP state) 16.5% 6% 1.37
“DPM (without SLEEP state) + DVFS” DPM (with SLEEP state) + DVFS 18.9% 5.5% 1.42
2303

VELAYUDHAN KUMAR and RAGHUNATHAN/Turk J Elec Eng & Comp Sci
Baseline schemes exhibit higher energy and power consumption. This is primarily due to the fact that
servers, once activated, stay in the operational or active state throughout the duration of the run. The idle
power of activated servers when not in use contributes to the substantially high power and energy consumption.
Using our DPM-based approach, energy and power consumption of the cluster is reduced and this gives
a savings of at least 32% when compared with baseline “No DPM” schemes. On response times, baseline “No
DPM” schemes perform the best because servers are more often in the operational state for the requests to be
processed compared to DPM schemes.
DPM schemes (with sleep state) consistently exhibit reduced TAVG value compared to DPM schemes
(without sleep state). This is due to the fact that setup time for a server in the sleep state to be transitioned to
operational IDLE state is less than when a server has to be transitioned from OFF state to operational state.
Thus, the probability of a request getting processed by a server in getting into operational state is quicker
with sleep state schemes compared to non-sleep state schemes. From our simulation run, DPM with sleep state
schemes exhibit around 46% higher TAVG , and DPM without sleep state exhibits around 37% higher TAVG
when compared with baseline schemes. With the per request response time set as 100 s, both our DPM with
sleep and without sleep state schemes do meet the criteria. DPM schemes consistently exhibit higher PE metric
values than baseline non-DPM schemes. DPM schemes (with sleep) also give better PE metric values than
DPM schemes (without sleep), which gives a good reason to adopt sever sleep states in the server cluster. With
increase in request arrival rate, per request average response times TAVG are reduced.
Figure 6 depicts the comparative results for response times TAVG representing DPM with sleep, DPM
without sleep, and the baseline scenario for a given workload processing run. It clearly shows that response
times with DPM with sleep scheme are better (reduced) than DPM without sleep scheme, but the baseline gives
the best (reduced) response times compared to both DPM with and without sleep schemes.
Figure 6. Response time distribution for 5-min workload scenario.
We compared our approach with and without PPM sequencer logic. Simulation results show that
heterogeneity aware PPM sequencer logic achieves an energy consumption savings of at least 56% and high
savings% in TAVG of 76% in contrast to a scenario run without PPM sequencer logic.
We also tested our approach on the Grid ANL workload (Parallel ANL Workloads Archive) [18] with the
results similar to those of the synthetic workload test.
2304

VELAYUDHAN KUMAR and RAGHUNATHAN/Turk J Elec Eng & Comp Sci
5. Conclusion
Energy consumption is a key issue in the design of computing systems today. In this paper, we studied the
energy consumption, performance, and power efficiency characteristics of a virtualized server cluster environment
using different workload distributions. We have proposed a hybrid approach using PPM power-to-performance
sequencer logic and DVFS and DPM (both with and without server processor sleep state) controls to reduce
energy consumption. Simulation experimental results based on the select workloads prove the effectiveness of
our proposed approach. With our approach, the following summarized results highlight the fact that effective
sleep state adoption gives positive savings with respect to:
a) Performance (TAVG): system performance tracked by per request make span or request response
time (TAVG) for DPM with server processor sleep state (with or without DVFS controls) scenario run shows
an improvement of 5.75% on average when compared to DPM without server processor sleep state (with or
without DVFS) scenario run.
b) Energy consumption (E): DPM with server processor sleep state (with or without DVFS) consumes
less energy of 17.7% on average compared to DPM without server processor sleep state (with or without DVFS).
c) Power efficiency (NPE): DPM with server processor sleep state (with or without DVFS) schemes
approximately gives 1.3x power efficiency normalized (NPE) ratio compared with DPM without server processor
sleep state (with or without DVFS) schemes.
We achieved higher energy savings of 36.22% on average with our hybrid approach in comparison with
baseline solution schemes. With heterogeneity aware PPM sequencer logic, we achieved an average energy
consumption savings of 56% and 76% improvement in TAVG in contrast to a scenario run without PPM sequencer
logic. As part of our future work, we plan to consider varied workload types, accounting for input-output and
memory resource requirements and workload phase variability in our model.
Acknowledgments
We would like to thank our colleagues Rajesh Jayaprakash and Chetan Malavade for their valuable input.
References
[1] Goiri I, Katsak W, Ley K, Nguyen TD, Bianchini R. GreenSwitch: managing datacenters powered by renewable
energy. In: International Conference on Architectural Support for Programming Languages and Operating Systems;
2013. pp. 51-64.
[2] Qian H, Medhi D. Server operational cost optimization for cloud computing service providers over a time horizon.
In: USENIX Workshop on Hot Topics in Management of Internet, Cloud, and Enterprise Networks and Services;
2011. pp. 4-9.
[3] Petrucci V, Carrera EV, Loques O, Leits J, Mosse D. Optimized management of power and performance for
virtualized heterogeneous server clusters. In: IEEE/ACM International Symposium on Cluster, Cloud, and Grid;
2011. pp. 23-32.
[4] Gandhi A, Gupta V, Harchol-Balter M, Kozuch M. Optimality analysis of energy-performance trade-off for server
farm management. In: International Symposium on Computer Performance, Modeling, Measurements, and Evalu-
ation; 2010. pp. 1155-1171.
[5] Meisner D, Gold BT, Wenisch TF. PowerNap: eliminating server idle power. In: Proceedings of International
Conference on Architectural Support for Programming Languages and Operating Systems; 2009. pp. 205-216.
[6] Meisner D, Wenisch T. DreamWeaver: architectural support for deep sleep. In: Proceedings of International
Conference on Architectural Support for Programming Languages and Operating Systems; 2012. pp. 313-324.
2305

VELAYUDHAN KUMAR and RAGHUNATHAN/Turk J Elec Eng & Comp Sci
[7] Wang Y, Deaver R, Wang X. Virtual batching: request batching for energy conservation in virtualized servers. In:
IEEE International Workshop on Quality of Service; 2010. pp. 1-9.
[8] Wang S, Liu J, Liu X, Chen J. PowerSleep: A smart power-saving scheme with sleep for servers under response
time constraint. IEEE J Emerg Sel Top Circuits Syst 2011; 1: 289-298.
[9] Krioukov A, Mohan P, Alspaugh S, Keys L, Culler D, Katz R. NapSAC: Design and implementation of a power-
proportional web cluster. In: Green Networking; 2010. pp. 15-22.
[10] Lin M, Wierman A, Lachlan L, Andrew H, Thereska E. Dynamic right-sizing for power-proportional data centers.
In: INFOCOM; 2011. pp. 1098-1106.
[11] Bhatti M, Belleudy C, Auguin M. Hybrid power management in real time embedded systems: an interplay of DVFS
and DPM techniques. In: Conference on Real-Time Systems; 2011. pp. 143-162.
[12] Dhiman G, Simunic Rosing T. System-level power management using online learning. IEEE T Comput Aid D 2009;
28: 676-689.
[13] Gandhi A, Harchol-Balter M, Kozuch M. Are sleep states effective in data centers? In: International Green
Computing Conference and Workshops; 2012. pp. 1-10.
[14] Kumar MRV, Raghunathan S. Energy efficient and interference aware provisioning in virtualized server cluster
environment. J Comput Sci 2014; 10: 143-156.
[15] Standard Performance Evaluation Corporation. First Quarter 2011 SPECpower ssj2008 Result Benchmarks.
Gainesville, VA, USA: SPEC, 2011.
[16] Gandhi A, Harchol-Balter M, Kozuch M. The case for sleep states in servers. In: Proceedings of the 4th Workshop
on Power-Aware Computing and Systems; 2011. Article 2.
[17] Calheiros R, Ranjan R, Beloglazov A, De Rose CAF, Buyya R. CloudSim: a toolkit for modeling and simulation
of cloud computing environments and evaluation of resource provisioning algorithms. Journal of Software: Practice
and Experience 2011; 41: 23-50.
[18] Coghlan S, Desai N. Blue Gene/P (Intrepid) Argonne National Laboratory Log. In: Parallel Workloads Archive;
2009.
2306


![A comparative study in power oscillation damping by ...journals.tubitak.gov.tr/elektrik/issues/elk-13-21-1/elk...enhancement and power oscillation damping is shown in [5{9]. In this](https://img.dokumen.tips/doc/110x75/5afebddd7f8b9a8b4d8f5fad/a-comparative-study-in-power-oscillation-damping-by-and-power-oscillation-damping.jpg)