Embed Size (px)
Citation preview
Title Page
MICROBIAL DEGRADATION KINETICS OF VOLATILE ORGANIC HYDROCARBONS: EFFECT OF BTEX CONCENTRATION AND ENVIRONMENT
FINAL REPORT
November 15, 2002
DSR Contact Person: Paul Sanders
Research Agenda Item: IV. 2., Inhibition of Microbial Degradation in Soil and Aquifers at High Levels of Volatile Organic Hydrocarbons in Soil
Proposal Title: Microbial degradation kinetics of volatile organic hydrocarbons: effect of BTEX concentration and environment.
2
ACKNOWLEDGEMENTS This work was supported primarily by the New Jersey Department of Environmental Protection, Division of Science and Research (Research Contract #48106000052). Additional funding which supported background work done before this project started and closely related work was received from the New Jersey Agricultural Experiment Station (NJAES) and the US Department of Defense, Advanced Research Projects Agency, Office of Naval Research, University Research Initiative (Grant # N00014-92-J-1888, R&T Code a40r41ruri).
We wish to thank Paul Sanders, our NJDEP DSR Contact Person, and Dr. Andrew C. Marinucci, a Research Scientist of the NJDEP, for their help with this project and their patience with the numerous delays. Both Mr. Sanders and Dr. Marinucci provided help in formulating and approving changes in the scope and direction of the project that became necessary due to difficulties encountered during the work.
We also with to thank Drs. Gerben Zylstra and Jerome Kukor for providing microbial cultures used in this study and sharing their knowledge, and Dr. Stephanie Murphy and Mr. Mark Whitaker for help in obtaining soil samples used in this work.
3
TABLE OF CONTENTS EXECUTIVE SUMMARY ......................................................................................5
Major Findings .................................................................................................6 Additional Findings ..........................................................................................7
Temperature ....................................................................................................................... 7 Dissolved Oxygen............................................................................................................... 8 Findings From Separate But Related Work........................................................................ 8 Final question from Paul Sanders: “How high can we go and still have natural attenuation be active, and roughly what might the rates be?”............................................ 8
INTRODUCTION/PROBLEM STATEMENT.......................................................10 Problem Statement........................................................................................10 Objectives:.....................................................................................................11 General Methodology Description: ................................................................11 Products and Applications: ............................................................................12
PROJECT DESIGN & METHODS......................................................................13 Aerobic Respirometer....................................................................................13 Seed culture and start-up ..............................................................................13 Effect of temperature .....................................................................................15 Effect of oxygen limitation..............................................................................15 Data Analysis.................................................................................................16
Temperature Study........................................................................................................... 16 Chemical Analyses ........................................................................................17
Chemical Oxygen Demand............................................................................................... 17 Methyl tertiary Butyl Ether ................................................................................................ 17 Determination of Oxygen, Substrate and Biomass Concentrations ................................. 17
QUALITY ASSURANCE PROCEDURES ..........................................................18 General laboratory quality policies.................................................................18 Project Quality Control Coordinator ...............................................................18 Project Specific QA Information.....................................................................18
RESULTS AND DISCUSSION ...........................................................................20 TASK 1: Development of Mathematical Models Useful for Describing Inhibition at High Contaminant Concentrations..............................................20
INTRODUCTION .............................................................................................................. 20 METHODOLOGY ............................................................................................................. 22 RESULTS AND DISCUSSION......................................................................................... 23
Justification of the Wayman and Tseng Model for Substrate Inhibition 23 Justifying an Extension to the Wayman and Tseng Model for Substrate Inhibition 30 Mechanisms Which Support the Use of Terminal Substrate Inhibition Models 36
CONCLUSIONS ............................................................................................................... 38 NOMENCLATURE ........................................................................................................... 38 GREEK SYMBOLS........................................................................................................... 38
TASK 2: Development of Experimental Methods for Quantifying Inhibition at High Contaminant Concentrations.................................................................39
INTRODUCTION .............................................................................................................. 39 RESULTS AND DISCUSSION......................................................................................... 40
Use of Respirometry at Low Initial Substrate Concentrations 40 Use of Respirometry at High Initial Substrate Concentrations 41
Task 3: Use Of Pure Culture Benzene And Toluene Degrading Cultures To Investigate Inhibition At High Contaminant Concentrations...........................44
4
METHODOLOGY ............................................................................................................. 44 Chemicals 44 Growth of inoculum 44
RESULTS AND DISCUSSION......................................................................................... 45 Low concentration - Monod kinetics 45
Parameter ......................................................................................................................... 46 Substrate .......................................................................................................46
High concentration – Inhibition kinetics 47 DISCUSSION ................................................................................................................... 52
Mechanisms of benzene and toluene toxicity on cells 56 CONCLUSIONS ............................................................................................................... 56
Task 4: Investigation of benzene and toluene biodegradation at high concentration through enrichment and acclimation of benzene and toluene degrading cultures from a typical New Jersey soil (Adelphia Soil).................57
Benzene Inhibition ............................................................................................................ 57 Toluene Inhibition ............................................................................................................. 58 DISCUSSION ................................................................................................................... 60
Mechanism of inhibition 61 Task 5. Investigation of MTBE biodegradation at high concentration through enrichment and acclimation of MTBE degrading cultures from New Jersey soils (Adelphia Soil – unsuccessful; Blacksmith Site Soil – successful) ........62
MTBE inhibition ................................................................................................................ 62 Task 6. Effect of dissolved oxygen and temperature on the activity of pure cultures degrading benzene or toluene .........................................................66
Effect of temperature on Maximum Specific Growth rate 66 Effect of temperature on b, Yg, and Ks 68 Effect of dissolved oxygen on the growth kinetics when grown on benzene and toluene 71
Task 7. Effect of dissolved oxygen and temperature on the activity of enrichment cultures degrading MTBE ...........................................................73
MTBE degradation............................................................................................................ 73 Task 8. Overall Significance Of This Work. ...................................................76 Analysis of the partitioning of benzene, toluene, and MTBE from gasoline into water; including whether the maximum expected concentrations in source zone groundwater likely to be inhibitory.........................................................76
Future Concerns............................................................................................................... 79 Analysis concerning how to apply the kinetics results from this work to improve groundwater modeling efforts. .........................................................80
Conversion From Specific Growth Rate Kinetics To Kinetics Useful For Groundwater Modeling ........................................................................................................................... 80
CONCLUSIONS AND RECOMMENDATIONS FOR APPLICATION AND USE BY NJDEP..........................................................................................................82
Major Findings ...............................................................................................82 Additional Findings ........................................................................................83
Temperature ..................................................................................................................... 83 Dissolved Oxygen............................................................................................................. 83 Findings From Separate But Related Work...................................................................... 84 Final question from Paul Sanders: “How high can we go and still have natural attenuation be active, and roughly what might the rates be?”.......................................... 84
REFERENCES ...................................................................................................85

5
EXECUTIVE SUMMARY The purpose of this research was to expand the range of knowledge concerning what constitutes ‘reasonable’ groundwater on rates for water-soluble contaminants present in gasoline. In particular evidence was collected to aid in bringing about a better understanding of how the presence of high concentrations of contaminants affect microbial activities (i.e., what is the inhibitory nature of the groundwater contaminants derived from gasoline).
Initially the research was to be conducted using benzene, toluene, ethylbenzene and the xylenes (BTEX) due to the emergence of MTBE as a recognized contaminant of concern and our success with MTBE biodegradation in a separate study, the scope of the work was changed to include benzene, toluene and MTBE.
Additional changes were made to the original project task list given in the research proposal. These changes were made in coordination with Mr. Paul Sanders and Dr. Andrew Marinucci and approved by them. The end result was the project task list given here:
1. Development of mathematical models useful for describing inhibition at high contaminant concentrations
2. Development of experimental methods for quantifying inhibition at high contaminant concentrations
3. Use of pure culture benzene and toluene degrading cultures to investigate inhibition at high contaminant concentrations
4. Investigation of benzene and toluene biodegradation at high concentration through enrichment and acclimation of benzene and toluene degrading cultures from a typical New Jersey soil (Adelphia Soil)
5. Investigation of MTBE biodegradation at high concentration through enrichment and acclimation of MTBE degrading cultures from New Jersey soils (Adelphia Soil – unsuccessful; Blacksmith Site Soil – successful)
6. Effect of dissolved oxygen and temperature on the activity of pure cultures degrading benzene or toluene
7. Effect of dissolved oxygen and temperature on the activity of enrichment cultures degrading MTBE
8. Overall significance of this work: a. Analysis of the partitioning of benzene, toluene, and MTBE from gasoline
into water; including whether the maximum expected concentrations in source zone groundwater likely to be inhibitory.
b. Analysis concerning how to apply the kinetics results from this work to improve groundwater modeling efforts.
The general approach to be taken in the conduct of this study will be to evaluate the intrinsic capabilities of microbial populations enriched from samples of New Jersey soils/sediments (specified in body of paper) using soil-free batch experiments. This information is then combined with literature values representing in-situ degradation rates under non-inhibitory concentration conditions in order to provide models useful in predicting in-situ degradation rates. The use of the soil-free experiments allows the direct interpretation of the intrinsic capabilities of the microbial populations without the
6
interference caused by adsorption and desorption processes. It also provides the upper bound on what could be considered ‘reasonable’ biodegradation rates.
The actual techniques used for the conduct of the studies included; 1) growth associated, batch culture, biodegradation experiments and 2) batch biodegradation soil slurry culture enrichment experiments. These experiments yielded, respectively; 1) intrinsic biodegradation kinetics for single compounds for each culture, 2) information on the acclimation of each culture for biodegradation of each compound.
The progress of the biodegradation reactions was followed using a combination of techniques including respirometric analysis (oxygen uptake versus time) and the measurement of electron donor concentrations, by both (specific chemical (benzene, toluene, MTBE) and COD analysis.
The reduction of experimental data to obtain estimates of kinetic and stoichiometric parameters concerning contaminant degradation was performed using a combination of linear and non-linear regression analysis techniques. This work also included selection, development, calibration and corroboration of the most appropriate mathematical models to represent the kinetics and stoichiometry of the biodegradation reactions.
A summary of the major findings of this study are contained in the following table:
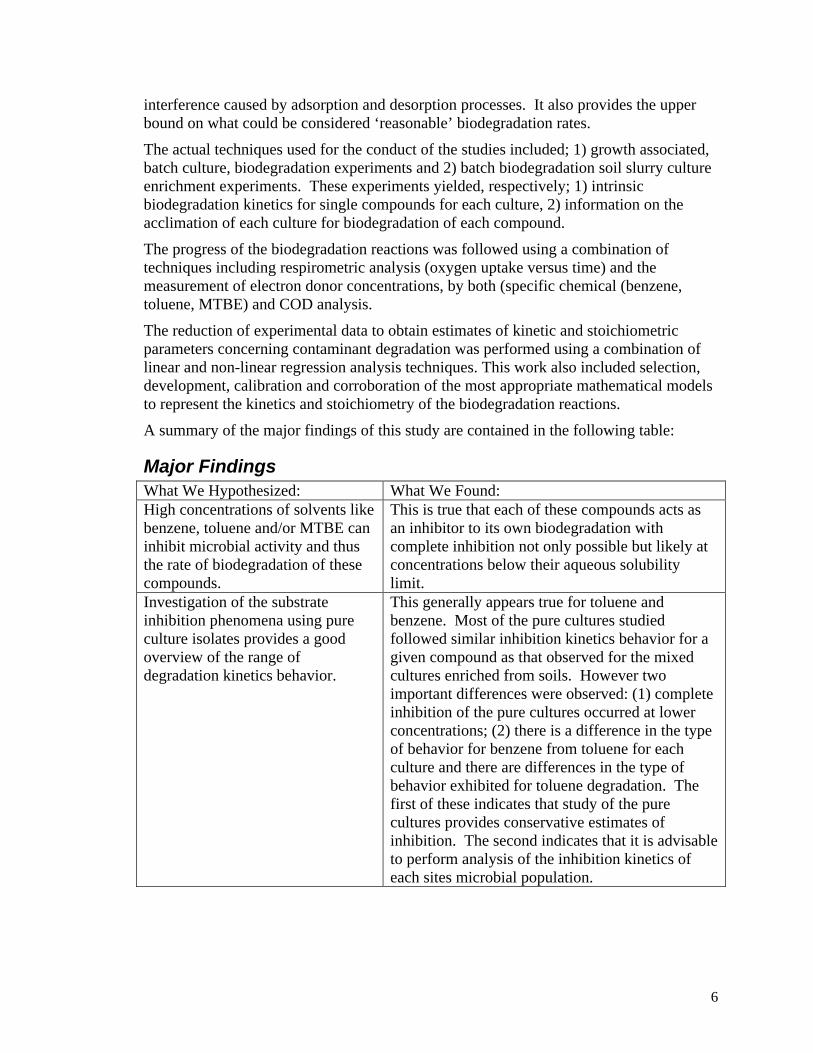
Major Findings What We Hypothesized: What We Found: High concentrations of solvents like benzene, toluene and/or MTBE can inhibit microbial activity and thus the rate of biodegradation of these compounds.
This is true that each of these compounds acts as an inhibitor to its own biodegradation with complete inhibition not only possible but likely at concentrations below their aqueous solubility limit.
Investigation of the substrate inhibition phenomena using pure culture isolates provides a good overview of the range of degradation kinetics behavior.
This generally appears true for toluene and benzene. Most of the pure cultures studied followed similar inhibition kinetics behavior for a given compound as that observed for the mixed cultures enriched from soils. However two important differences were observed: (1) complete inhibition of the pure cultures occurred at lower concentrations; (2) there is a difference in the type of behavior for benzene from toluene for each culture and there are differences in the type of behavior exhibited for toluene degradation. The first of these indicates that study of the pure cultures provides conservative estimates of inhibition. The second indicates that it is advisable to perform analysis of the inhibition kinetics of each sites microbial population.
7
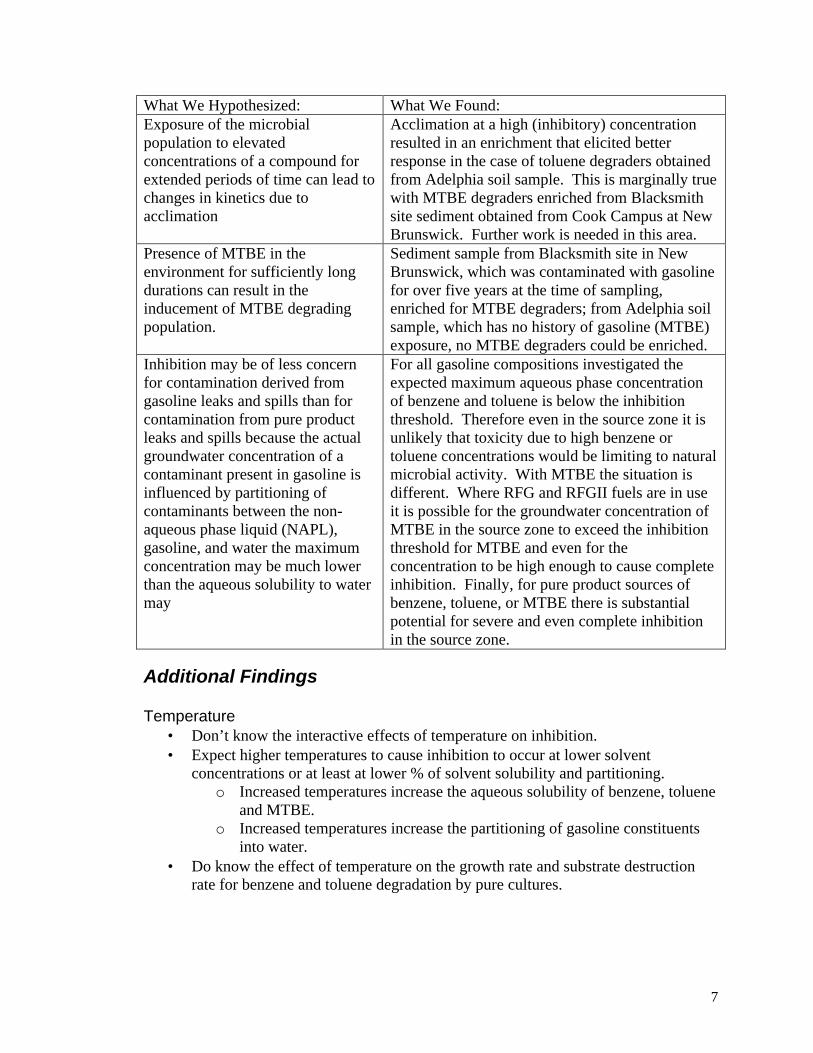
What We Hypothesized: What We Found: Exposure of the microbial population to elevated concentrations of a compound for extended periods of time can lead to changes in kinetics due to acclimation
Acclimation at a high (inhibitory) concentration resulted in an enrichment that elicited better response in the case of toluene degraders obtained from Adelphia soil sample. This is marginally true with MTBE degraders enriched from Blacksmith site sediment obtained from Cook Campus at New Brunswick. Further work is needed in this area.
Presence of MTBE in the environment for sufficiently long durations can result in the inducement of MTBE degrading population.
Sediment sample from Blacksmith site in New Brunswick, which was contaminated with gasoline for over five years at the time of sampling, enriched for MTBE degraders; from Adelphia soil sample, which has no history of gasoline (MTBE) exposure, no MTBE degraders could be enriched.
Inhibition may be of less concern for contamination derived from gasoline leaks and spills than for contamination from pure product leaks and spills because the actual groundwater concentration of a contaminant present in gasoline is influenced by partitioning of contaminants between the non-aqueous phase liquid (NAPL), gasoline, and water the maximum concentration may be much lower than the aqueous solubility to water may
For all gasoline compositions investigated the expected maximum aqueous phase concentration of benzene and toluene is below the inhibition threshold. Therefore even in the source zone it is unlikely that toxicity due to high benzene or toluene concentrations would be limiting to natural microbial activity. With MTBE the situation is different. Where RFG and RFGII fuels are in use it is possible for the groundwater concentration of MTBE in the source zone to exceed the inhibition threshold for MTBE and even for the concentration to be high enough to cause complete inhibition. Finally, for pure product sources of benzene, toluene, or MTBE there is substantial potential for severe and even complete inhibition in the source zone.
Additional Findings
Temperature • Don’t know the interactive effects of temperature on inhibition. • Expect higher temperatures to cause inhibition to occur at lower solvent
concentrations or at least at lower % of solvent solubility and partitioning. o Increased temperatures increase the aqueous solubility of benzene, toluene
and MTBE. o Increased temperatures increase the partitioning of gasoline constituents
into water. • Do know the effect of temperature on the growth rate and substrate destruction
rate for benzene and toluene degradation by pure cultures.
8
Dissolved Oxygen • Obviously the presence of dissolved oxygen is required for maintaining the
catabolic activity of aerobic microbes. • While the literature contains evidence of anaerobic microbial activities for the
destruction of benzene, toluene, and MTBE, only toluene it considered “readily” degradable under anaerobic conditions.
• The dissolved oxygen sensitivity of the microbial populations studied can be considered typical.
• Effect of DO on biodegradation rate can be represented using standard models calibrated with the kinetic parameters supplied in this report.
• No attempt was made to investigate any potential interaction between dissolved oxygen concentration and substrate (solvent) toxicity.
Findings From Separate But Related Work • MTBE biodegradation is dependent of dissolved oxygen concentration with a KO2
of 0.7 mg O2/L (Park, 1999). • Anaerobic MTBE degradation is possible under sulfate reducing conditions
(Somsomak et al, 2001).
Final question from Paul Sanders: “How high can we go and still have natural attenuation be active, and roughly what might the rates be?”
• Some activity can be expected as long as aqueous phase concentrations are below the concentrations at which complete inhibition occurs. Based on the most conservative results of this study that would be benzene concentrations below 335 mg/L (B. cepacia G4), toluene concentrations below 333 mg/L (P. putida mt2), and MTBE concentrations below 890 mg/L (high concentration enrichment).
• Therefore where gasoline served as the source of groundwater contamination there should be no case where the benzene or toluene concentration is too high to permit aerobic biological activity. In most cases with gasoline contamination aqueous MTBE concentrations should also be low enough to allow aerobic biological activity, the exception would be that in the near source area of RFG and RFGII contaminated sites the MTBE concentration could be well above the level which can cause 100% inhibition of MTBE degraders.
• Where pure compound spills are concerned all three compounds can lead to 100% inhibition.
• If source zone removal is practiced there should be no situation where benzene or toluene prevents biological activity. There is less certainty this would also be true for MTBE.
• As far as rates are concerned: Because of uncertainties in the amount of biomass present in an aquifer it is difficult to directly convert from the type of kinetics presented in this study to those typically used in simulations of in-situ biological activity (e.g., in modeling of natural attenuation). However, this should not prevent the results of this work from being useful for natural attenuation simulations. The recommended approach is to use the results given here to modify literature and/or experimental values of in-situ degradation rates.
9
• Literature values for in-situ degradation (loss) rates for organic contaminants are typically given as first order rate coefficients (first order with respect to the contaminant concentration). For benzene and toluene the value of this parameter is typically in the range of 0.001 to 0.013 /day (field data), for MTBE the values are lower, typically 0.0005 to 0.005/day (field data). The need is to convert from these first order kinetics models, which are applicable only at very low contaminant concentrations, to more complex models that account for saturation kinetics and inhibition kinetics behavior. Details on a suggested way to perform these conversions are given in the Task 8 part of this report.
10
INTRODUCTION/PROBLEM STATEMENT The purpose of this research was to expand the range of knowledge concerning what constitutes ‘reasonable’ groundwater on rates for water-soluble contaminants present in gasoline. In particular evidence was collected to aid in bringing about a better understanding of how the presence of high concentrations of contaminants affect microbial activities (i.e., what is the inhibitory nature of the groundwater contaminants derived from gasoline).
Initially the research was to be conducted using benzene, toluene, ethylbenzene and the xylenes (BTEX) due to the emergence of MTBE as a recognized contaminant of concern and our success with MTBE biodegradation in a separate study, the scope of the work was changed to include benzene, toluene and MTBE.
Additional changes were made to the original project task list given in the research proposal. These changes were made in coordination with Mr. Paul Sanders and Dr. Andrew Marinucci and approved by them. The end result was the project task list given below under objectives.
Problem Statement
Groundwater and soil contamination by volatile organic hydrocarbons is a widespread problem within New Jersey, across the United States and around the world. The most common source of this contamination is leakage from underground storage tanks and spills at gasoline service stations, transfer terminals and tank storage yards. The soil and groundwater contaminants most commonly regulated due to this contamination are the light aromatic hydrocarbons benzene, toluene, ethylbenzene and o, m and p-xylene (BTEX) and the dominant fuel oxygenate, MTBE.
Lately significant attention has been turned toward the naturally occurring biodegradation of BTEX compounds because it has been shown that many soils and aquifer sediments contain microorganisms that can biochemically transform, and even mineralize, these compounds. Similarly much attention is now focused on the biodegradation of MTBE in similar environments. Unfortunately, the level of understanding concerning the rate of these natural occurring reactions is quite limited, particularly with respect to contaminant destruction at high concentrations. In addition, the effects that changes in pH, temperature, terminal electron acceptor type (e.g., O2, NO3
-) concentration, and the composition of microbial populations have on the degradation rates are also limited. The consequence of these limitations in our knowledge is that it is difficult to predict (or to evaluate other’s predictions) of in-situ degradative capacity, particularly under ‘natural’ conditions.
This is of particular concern because the method most commonly used for the estimation of contaminant degradation rates for intrinsic bioremediation/natural attenuation is to determine them empirically as an adjustable fitting parameter (i.e. the degradation rate is adjusted in order to obtain agreement between a model prediction and the site data). This method does not provide any information on whether the empirical degradation rate parameters derived are reasonable and can lead to nonsensical values. Therefore, it is necessary to have knowledge concerning what constitutes ‘reasonable’ values so that the
11
results of analyses that yield nonsensical values can be recognized. Unfortunately this knowledge exists only for a limited range of environmental conditions and that makes it difficult for regulatory personnel, such as those at the NJ-DEP, to evaluate site remediation proposals for intrinsic bioremediation/natural attenuation.
The purpose of this proposed research is to expand the range of knowledge concerning what constitutes ‘reasonable’ degradation rates under ‘natural’ conditions and in particular how the presence of high, perhaps inhibitory, concentrations of contaminants (BTEX and MTBE) influence the rate at which these contaminants will undergo microbial degradation.
Objectives:
Determine the biodegradation rates as a function of concentration (up to saturation conditions) for benzene, toluene and MTBE by a variety of microbial populations including those derived from New Jersey soils/sediments.
These objectives were met by carrying out the following tasks: 1. Development of mathematical models useful for describing inhibition at high
contaminant concentrations 2. Development of experimental methods for quantifying inhibition at high
contaminant concentrations 3. Use of pure culture benzene and toluene degrading cultures to investigate
inhibition at high contaminant concentrations 4. Investigation of benzene and toluene biodegradation at high concentration
through enrichment and acclimation of benzene and toluene degrading cultures from a typical New Jersey soil (Adelphia Soil)
5. Investigation of MTBE biodegradation at high concentration through enrichment and acclimation of MTBE degrading cultures from New Jersey soils (Adelphia Soil – unsuccessful; Blacksmith Site Soil – successful)
6. Effect of dissolved oxygen and temperature on the activity of pure cultures degrading benzene or toluene
7. Effect of dissolved oxygen and temperature on the activity of enrichment cultures degrading MTBE
8. Overall significance of this work: a. Analysis of the partitioning of benzene, toluene, and MTBE from gasoline
into water; including whether the maximum expected concentrations in source zone groundwater likely to be inhibitory.
b. Analysis concerning how to apply the kinetics results from this work to improve groundwater modeling efforts.
General Methodology Description:
The general approach to be taken in the conduct of this study will be to evaluate the intrinsic capabilities of microbial populations enriched from samples of New Jersey soils/sediments (specified in body of paper) using soil-free batch experiments. This information is then combined with literature values representing in-situ degradation rates under non-inhibitory concentration conditions in order to provide models useful in
12
predicting in-situ degradation rates. The use of the soil-free experiments allows the direct interpretation of the intrinsic capabilities of the microbial populations without the interference caused by adsorption and desorption processes. It also provides the upper bound on what could be considered ‘reasonable’ biodegradation rates.
The actual techniques used for the conduct of the studies included; 1) growth associated, batch culture, biodegradation experiments and 2) batch biodegradation soil slurry culture enrichment experiments. These experiments yielded, respectively; 1) intrinsic biodegradation kinetics for single compounds for each culture, 2) information on the acclimation of each culture for biodegradation of each compound.
The progress of the biodegradation reactions was followed using a combination of techniques including respirometric analysis (oxygen uptake versus time) and the measurement of electron donor concentrations, by both (specific chemical (benzene, toluene, MTBE) and COD analysis.
The reduction of experimental data to obtain estimates of kinetic and stoichiometric parameters concerning contaminant degradation was performed using a combination of linear and non-linear regression analysis techniques. This work also included selection, development, calibration and corroboration of the most appropriate mathematical models to represent the kinetics and stoichiometry of the biodegradation reactions.
Products and Applications:
Quantitative information concerning the rates of BTEX contaminant removal which can reasonably be expected to occur in soils and aquifers under a range of environmental conditions including temperature, pH, electron acceptor concentration, the effect that individual electron donor (BTEX) concentrations have on their own rate of removal, and the effect than mixtures on electron donors (BTEX) have on the rate of removal of each compound in the mixture. This information will help increase regulatory confidence in the choice of natural attenuation as a valid protective remediation option for BTEX contaminated sites. It will also aid in the analysis of proposals for the use of active biochemical remediation technologies.

13
PROJECT DESIGN & METHODS The original design of the project called for study of benzene, toluene, ethylbenzene, and xylenes under aerobic and nitrate reducing conditions, the collection of kinetics data in soil slurry reactors, and the investigation of inhibition in mixed contaminant systems. Several issues arose during conduct of the study that resulted in agreements to change the project design to concentrate on the study of benzene, toluene and MTBE under aerobic conditions. These issues were: (1) the emergence of methyl tert-butyl ether (MTBE) as an important groundwater contaminant; (2) the discovery that the single compound inhibition behavior was more complex that originally anticipated; (3) the inability of our respirometric equipment supplier to deliver a system useful for the conduct of soil slurry experiments (this system would also have provided higher oxygen mass transfer rates); (4) the need to run many rather than just a few experiments for each microbial population – contaminant pair (due to oxygen mass transfer limitations restricting the amount of information which could be obtained from each experiment); and (5) difficulties encountered with the development of efficient experimental methods for running the nitrate reducing condition experiments. and resulted in revision of the overall design of the project. The end result was a project design targeted at accomplishing the task list given in the previous section.
While most of the experimental methods are given later under each Task section some methodology information is given here.
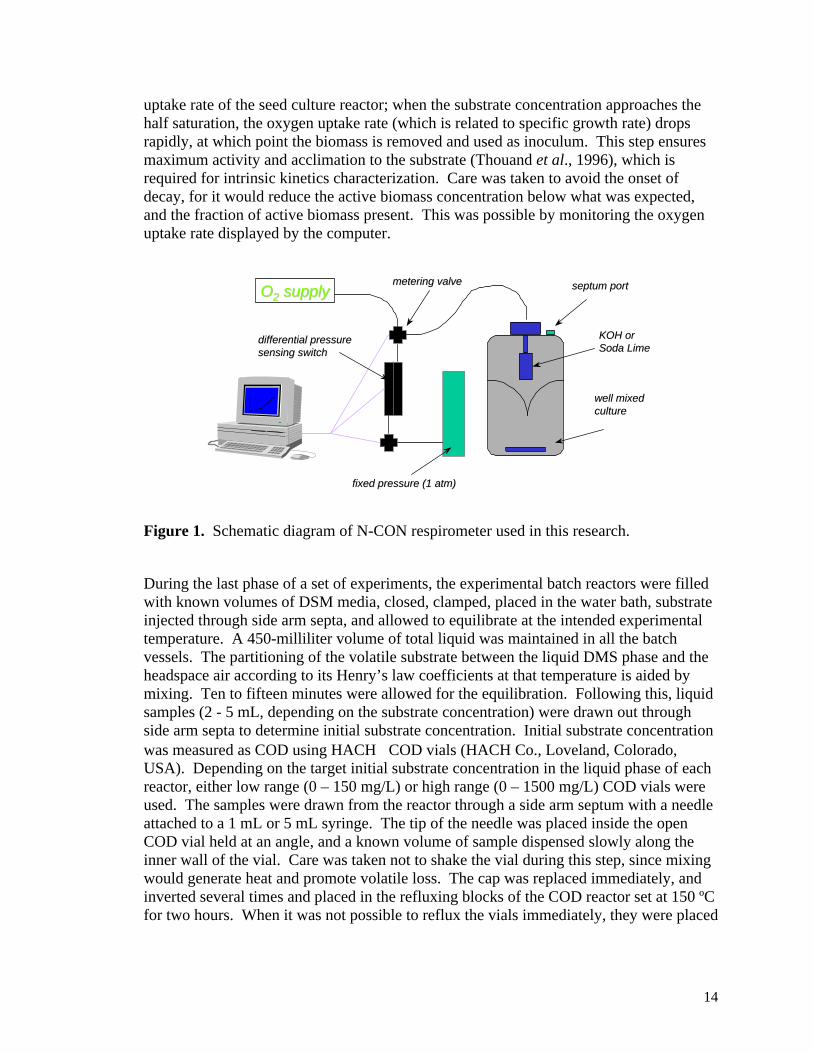
Aerobic Respirometer
Figure 1 is a schematic representation of the N-CON aerobic respirometer used in this study. This instrument is capable of collecting continuous oxygen uptake data and delivery of oxygen to replace that used for respiration. A constant headspace pressure of 1 atmosphere (absolute) is maintained in the headspace through use of a differential pressure sensing switch and a metering valve, thereby any pressure drop (due to oxygen uptake/respiration) resulted in the delivery of pure oxygen by the system to restore the set pressure. A pressure drop occurs when the participating biomass respires (utilizing stoichiometric amounts of oxygen and releasing equal moles of carbon dioxide) and the released carbon dioxide is sorbed from the headspace using soda lime or potassium hydroxide. The batch vessel used in this study was a 500 ml Pyrex bottle with a side-arm arrangement, fitted with a septum to draw samples. Its top accommodated a provision to hold soda lime (to sorb carbon dioxide produced during respiration) inside the vessel, and tygon tubing with pressure lock that can be connected to the oxygen delivery port of the respirometric chamber. Essential modifications and additions were made to the instrument and the batch reactor vessels as found appropriate.
Seed culture and start-up
Seed cultures for the experiments were obtained by growing a single colony of specific strains (for pure culture work), or from slurry of the soil sample in the respirometer with substrate in liquid DMS media, until the late log phase before the substrate in the batch reactor is completely utilized. This is possible by constant monitoring of the oxygen
14
uptake rate of the seed culture reactor; when the substrate concentration approaches the half saturation, the oxygen uptake rate (which is related to specific growth rate) drops rapidly, at which point the biomass is removed and used as inoculum. This step ensures maximum activity and acclimation to the substrate (Thouand et al., 1996), which is required for intrinsic kinetics characterization. Care was taken to avoid the onset of decay, for it would reduce the active biomass concentration below what was expected, and the fraction of active biomass present. This was possible by monitoring the oxygen uptake rate displayed by the computer.
OO22 supplysupplymetering valvemetering valve
fixed pressure (1fixed pressure (1 atmatm) )
KOH or KOH or Soda LimeSoda Lime
well mixed well mixed cultureculture
differential pressuredifferential pressuresensing switchsensing switch
septum portseptum port
Figure 1. Schematic diagram of N-CON respirometer used in this research.
During the last phase of a set of experiments, the experimental batch reactors were filled with known volumes of DSM media, closed, clamped, placed in the water bath, substrate injected through side arm septa, and allowed to equilibrate at the intended experimental temperature. A 450-milliliter volume of total liquid was maintained in all the batch vessels. The partitioning of the volatile substrate between the liquid DMS phase and the headspace air according to its Henry’s law coefficients at that temperature is aided by mixing. Ten to fifteen minutes were allowed for the equilibration. Following this, liquid samples (2 - 5 mL, depending on the substrate concentration) were drawn out through side arm septa to determine initial substrate concentration. Initial substrate concentration was measured as COD using HACH COD vials (HACH Co., Loveland, Colorado, USA). Depending on the target initial substrate concentration in the liquid phase of each reactor, either low range (0 – 150 mg/L) or high range (0 – 1500 mg/L) COD vials were used. The samples were drawn from the reactor through a side arm septum with a needle attached to a 1 mL or 5 mL syringe. The tip of the needle was placed inside the open COD vial held at an angle, and a known volume of sample dispensed slowly along the inner wall of the vial. Care was taken not to shake the vial during this step, since mixing would generate heat and promote volatile loss. The cap was replaced immediately, and inverted several times and placed in the refluxing blocks of the COD reactor set at 150 ºC for two hours. When it was not possible to reflux the vials immediately, they were placed
15
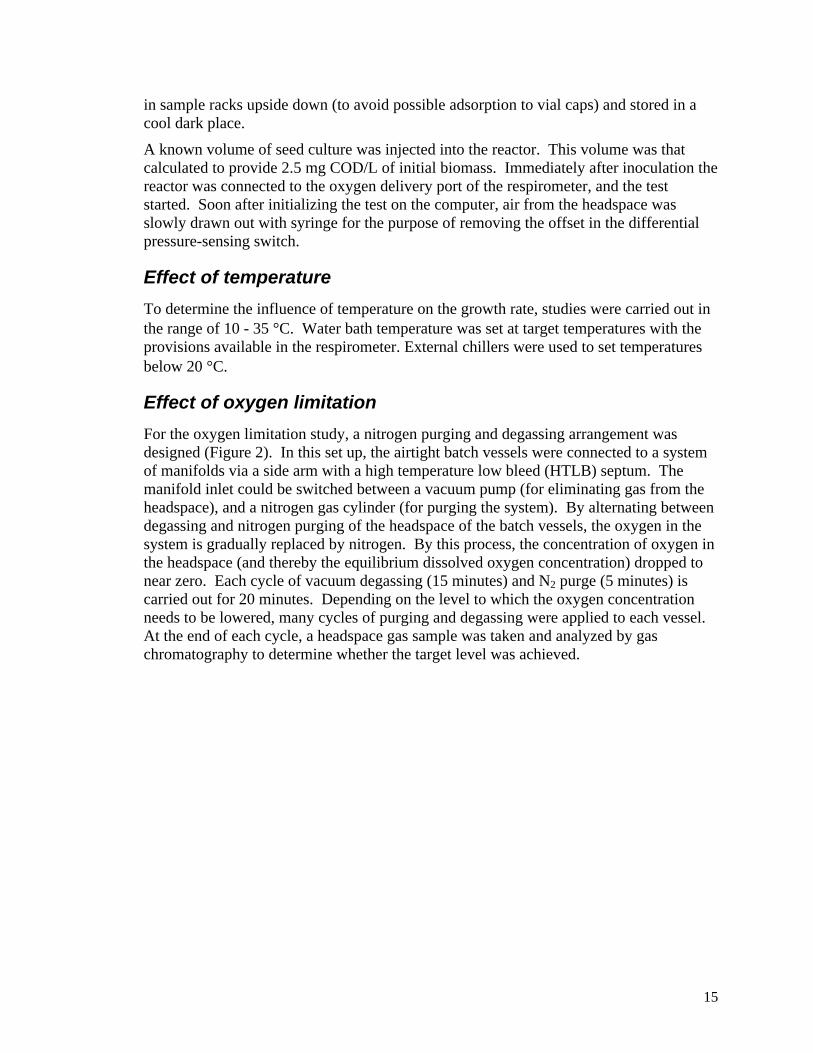
in sample racks upside down (to avoid possible adsorption to vial caps) and stored in a cool dark place.
A known volume of seed culture was injected into the reactor. This volume was that calculated to provide 2.5 mg COD/L of initial biomass. Immediately after inoculation the reactor was connected to the oxygen delivery port of the respirometer, and the test started. Soon after initializing the test on the computer, air from the headspace was slowly drawn out with syringe for the purpose of removing the offset in the differential pressure-sensing switch.
Effect of temperature
To determine the influence of temperature on the growth rate, studies were carried out in the range of 10 - 35 °C. Water bath temperature was set at target temperatures with the provisions available in the respirometer. External chillers were used to set temperatures below 20 °C.
Effect of oxygen limitation
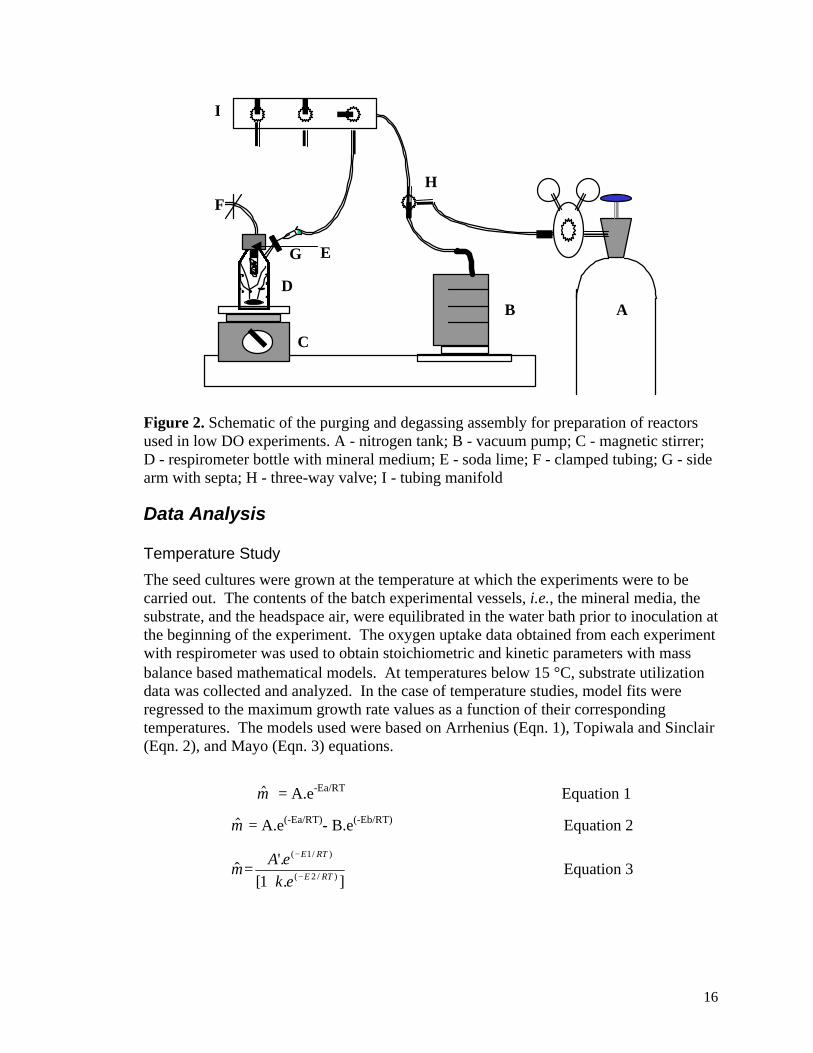
For the oxygen limitation study, a nitrogen purging and degassing arrangement was designed (Figure 2). In this set up, the airtight batch vessels were connected to a system of manifolds via a side arm with a high temperature low bleed (HTLB) septum. The manifold inlet could be switched between a vacuum pump (for eliminating gas from the headspace), and a nitrogen gas cylinder (for purging the system). By alternating between degassing and nitrogen purging of the headspace of the batch vessels, the oxygen in the system is gradually replaced by nitrogen. By this process, the concentration of oxygen in the headspace (and thereby the equilibrium dissolved oxygen concentration) dropped to near zero. Each cycle of vacuum degassing (15 minutes) and N2 purge (5 minutes) is carried out for 20 minutes. Depending on the level to which the oxygen concentration needs to be lowered, many cycles of purging and degassing were applied to each vessel. At the end of each cycle, a headspace gas sample was taken and analyzed by gas chromatography to determine whether the target level was achieved.
16
AB
C
D
E
F
G
H
I
Figure 2. Schematic of the purging and degassing assembly for preparation of reactors used in low DO experiments. A - nitrogen tank; B - vacuum pump; C - magnetic stirrer; D - respirometer bottle with mineral medium; E - soda lime; F - clamped tubing; G - side arm with septa; H - three-way valve; I - tubing manifold
Data Analysis
Temperature Study
The seed cultures were grown at the temperature at which the experiments were to be carried out. The contents of the batch experimental vessels, i.e., the mineral media, the substrate, and the headspace air, were equilibrated in the water bath prior to inoculation at the beginning of the experiment. The oxygen uptake data obtained from each experiment with respirometer was used to obtain stoichiometric and kinetic parameters with mass balance based mathematical models. At temperatures below 15 °C, substrate utilization data was collected and analyzed. In the case of temperature studies, model fits were regressed to the maximum growth rate values as a function of their corresponding temperatures. The models used were based on Arrhenius (Eqn. 1), Topiwala and Sinclair (Eqn. 2), and Mayo (Eqn. 3) equations.
$µ = A.e-Ea/RT Equation 1
$µ = A.e(-Ea/RT)- B.e(-Eb/RT) Equation 2
].1[
'.ˆ
)/2(
)/1(
RTE
RTE
ek
eA−
−
+=µ Equation 3
17
where $µ is the temperature dependent maximum specific growth rate, A and A’ are exponential factors, Ea and E1 are the activation energy for cellular multiplication, R is the universal gas constant, and T is the absolute temperature.
The oxygen uptake data were analyzed with Micromath Scientist® (1995), a simulation software for non-linear data analysis. The Monod model incorporates mass balance relationships between the oxygen demand, substrate utilization, biomass accumulation, and product formation
Chemical Analyses
Chemical Oxygen Demand
Chemical Oxygen Demand (COD) was determined by the Hach COD closed reflux micromethod (Hach Company, Loveland, CO) with the low-range (0 to 150 mg/L) and high-range (0 - 1,500 mg/L) ampules using a colorimetric analysis with a Spec. 20D (Milton Roy Co., Rochester, NY) spectrophotometer. All COD measurements were done in duplicate or triplicate. Calibration standards were made from volumetric dilution of a purchased COD standard (Hach Company). Calibration curves were developed each time samples were analyzed. Soluble COD measurements for culture samples were done using liquid supernatant after centrifugation of culture samples (10,000 rpm for 15 minutes in a centrifuge with rotor).
Methyl tertiary Butyl Ether
The specific analysis of MTBE was done with a Hewlett-Packard 5890 series II gas chromatography (Wilmington, DE.) equipped with a Hewlett-Packard 7673 autosampler, SPB-Octyl column (0.32-mm inner diameter, 1.0 µm film thickness, and 30-m length; Supelco Inc., Bellefonte, PA), a Hewlett-Packard 5730A integrator and a flame ionization detector (FID).
For quantification of MTBE, a modified version of the static headspace method of Robbins et al. (1993) was used. A 50 µL headspace gas sample from the closed respirometer bottles using a sample lock syringe (Hamilton, Reno, Nevada) were injected to the column. A splitless mode of injection was used. The column temperature was initially 40 oC for 1 min. and was programmed to rise to 125 oC at 8 oC/min. The retention time of MTBE was 3.2 minutes with 30 mL/min of the carrier gas, helium. For headspace analysis at 20 °C, the analytical detection limit of this method is 500 µg/L MTBE, and the quantitative limit is 4.7 mg/L. The response factor was 0.02 ng/unit peak area over the range of MTBE concentrations from 0.925 mg/L to 74 mg/L.
Determination of Oxygen, Substrate and Biomass Concentrations
Headspace gas samples were analyzed by gas chromatography using a molecular sieve 5A (2 m x 1/8" inner diameter, 60/80 mesh) and haysep DB (10 m x 1/8" inner diameter, 100/120 mesh) columns with thermal conductivity detector (TCD). The operating conditions were: column temperature-40 °C; injector/detector temperature-20 °C; TCD current - 70 mA; helium as carrier gas flowing at 30 mL/min, 570 kPa.

18
The initial and final substrate and biomass concentrations were measured as their chemical oxygen demand. The closed reflux method was used with the low range (0 – 150 mg/L) HACH COD reactor and vials with ready-made reagents (HACH, 1998).
QUALITY ASSURANCE PROCEDURES
General laboratory quality policies • Quality activities shall emphasize prevention rather than correction. • Students and other laboratory personnel will be provided with written
documentation describing the Quality Assurance Plan. • The laboratory shall use appropriate, fresh reagents, chemicals, reference
standards, and appropriately calibrated glassware, gauges, and instruments. • The use of certain laboratory instruments will be controlled and documented by
specific procedures. • Research notebooks will be controlled through standard operation procedures. • Researchers will follow appropriate guidelines and procedures for procurement
and handling and storage of chemicals, materials, and supplies.
Project Quality Control Coordinator
A Project Quality Control Coordinator will be appointed for the project entitled “Microbial degradation kinetics of volatile organic hydrocarbons: effect of BTEX concentration and environment”. The responsibilities of this project control coordinator are as follows:
• establish specific quality objectives and/or plan; • issue and/or control of research notebooks; • statistical procedures and techniques; • procurement procedures; and • quality auditing, inspections, and training.
Project Specific QA Information
Specific data quality objectives will be established for the project entitled “Microbial degradation kinetics of volatile organic hydrocarbons: effect of BTEX concentration and environment” in consultation with the NJ-DEP Project Officer.
In addition, the following project specific guidelines will be followed: • Students assigned to this project will be responsible for all analytical and
computational work for their portion of the project in order to maximize their educational benefit. As part of their training, all students will be required to establish the accuracy and precision of their laboratory techniques and the verification of all computer coding per the Quality Assurance Project Plan to be established for this project.
• The analytical procedures will be established to meet the Data Quality Objectives of the project (to be established in conjunction with the NJ-DEP Project Officer.

19
• Laboratory QC samples will be analyzed and tracked to ensure quality control. The laboratory QC samples will include calibration standards, solvent blanks and reagent blanks. Quality assessment will be conducted through the use of control charts, validation of test and measurement procedures and QA reviews. Corrective actions will be taken for any measurement that exceeds the acceptable limits established.
• All measurement methods and test procedures will be documented and readily available to the analysts. All project participants will maintain a bound research notebook with sequentially numbered pages and a method for duplication of each page.
• Any statistical treatment of the data will be documented. Data validation will include spot checking for errors in transferring, verification of any electronic data handling and acceptance or rejection of data based on specified criteria. All reported data will include error estimates.
20
RESULTS AND DISCUSSION
TASK 1: Development of Mathematical Models Useful for Describing Inhibition at High Contaminant Concentrations
This section contains text, figures and table from the publication: Alagappan and Cowan (2001) Biokinetic Models for Representing the Complete Inhibition of Microbial Activity at High Substrate Concentrations. Biotechnology and Bioengineering, 75 (4), 393-405.
INTRODUCTION
The use of sophisticated mathematical models to simulate compound (pollutant) fate and transport in natural and engineered systems has seen rapid growth since the introduction of inexpensive computers in the early 1980s. Examples of this increasing sophistication, to which this work is relevant, can be found in modeling of: bioreactors used in waste treatment; bioreactors used for the production of chemicals; and, contaminant fate and transport in the environment. The past efforts of numerous researchers and practitioners have lead to substantial improvements in the ability to use information concerning the physical and chemical properties of contaminants, contaminant mixtures, and the environment to predict the fate and transport of many organic and inorganic chemicals (Rubin et al., 1997). The processes accounted for in these models include advection, dispersion, diffusion, adsorption, volatilization, other phase partitioning behavior, and the interaction between chemistry and/or geochemistry of the environment and the dominant microbiology (i.e., available electron acceptors determine which types of microbial communities are dominant), and even an increased use of biodegradation reaction stoichiometry. However, despite this increasing sophistication in the use of the physical and chemical knowledge and reaction stoichiometry, there has been little progress made in using increased knowledge of biodegradation kinetics for improving the mathematical modeling of the microbially mediated reactions.
Typically, fate and transport models express biologically mediated transformations as first order decay reactions wherein the rate is dependent only on the contaminant concentration and a rate coefficient. Often this approach is taken because sparse data prevents the modeler from obtaining statistically relevant parameter estimates for calibration of more complex models. This simplified approach is usually required where field data is used. Where more sophisticated biokinetic models have been used, the models selected have generally been those of Monod (Equation 4) and/or Andrews (Equation 5). These equations are empirically derived functions that are applicable to non-inhibitory and asymptotic inhibitory conditions, respectively. The kinetic parameter values used in applying the Monod and/or Andrews functions within a fate and transport model rarely are derived from field data. Instead, typically they are derived from laboratory research data, and often the kinetic parameter values used are taken from the literature.
SK
S
S +=
·µ̂µ or
SK
Sqq
S +=
·ˆ Equation 4
21
IS KSSK
S
/
·ˆ2++
=µ
µ or IS KSSK
Sqq
/
·ˆ2++
= Equation 5
While this approach is often effective and the Monod and Andrews functions often are appropriate for describing the effect of substrate (contaminant) concentration on microbial activity, it is easy to conceive of situations where use of these functions would lead to inaccurate, misleading, and non-conservative results. For example, many solvents (including benzene, toluene, ethylbenzene and the xylenes) are known to be toxic and are capable of causing microbial cell death at concentrations below their solubility limit (Sikkema et al., 1995). Therefore, in situations where a sufficient quantity of solvent is present (e.g., a non aqueous phase liquid, NAPL, such as a pure solvent or gasoline in contact with water) there is the potential for complete inhibition of microbial activity, including that associated with biodegradation of the inhibitory contaminant. Furthermore, the literature contains several examples of experimental biodegradation kinetics data that show a clear trend of toxicity consistent with the complete loss of activity.
Because the Andrews (1968) substrate inhibition model (and others such as Aiba et al., 1968) describe inhibition behavior in which the specific growth rate and specific substrate removal rate asymptotically approach zero at high substrate concentrations, these models can not be used to effectively represent substrate inhibition which caused a complete loss of activity at a known finite substrate concentration (Grady, 1990). Instead, these situations require use of models that predict a more rapid decrease in activity and the loss of all activity as the aqueous concentration of the compound is at or above some finite “critical” substrate concentration. Fortunately, several inhibition models that are capable of ascribing the above-mentioned attribute are available (Wayman and Tseng, 1976; Luong, 1987; Han and Levenspiel, 1988). However, it is rare to find instances in the literature where they have been applied. More commonly these models has been ignored, even where the data presented would support their use. In these instances the data has been left either without a mathematical representation, or has been fit with non-inhibitory or asymptotic inhibition models (Moletta et al., 1986; Suwa et al., 1994).
Some of the most likely reasons why these terminal concentration inhibition models have largely been ignored are: their greater number of kinetic parameters (Aitken, 1993); the difficulty in obtaining statistically relevant kinetic parameter estimates, particularly where there is a limited amount of data available (Aitken, 1993); the discontinuous nature of some of these models (Aitken, 1993); a lack of awareness that these alternate models exist; doubt about the reality of the observed data that supports the use of these types of models; and, a lack of awareness that known mechanisms of toxicity and inhibition could lead to the kinetic response pattern represented by their data. Furthermore, precedent supports application of the Monod and Andrews functions. An exhaustive amount of literature is available in which application of these most popular models provides successful representation of experimental data, acceptable simulation of observed process performance in a wide variety of reactor types (Jones et al., 1973; Aitken, 1993), and successful modeling of subsurface bioremediation (Schirmer et al., 1999; Schirmer, 1998). This widespread application of the Monod and Andrews equations makes it easy to gain acceptance for their use in additional situations.
22
The hypothesis behind this work is that existing terminal substrate inhibition models provide useful representations of the effects that high concentrations of certain organic compounds have on microbial activity when those compounds also serve as the electron donor (i.e., substrate); and, that a new terminal substrate concentration inhibition model (an extension of an existing model) is needed to obtain reasonable representations of some experimental data. Thus, this work contains a review of the predictive capabilities of several threshold inhibition models, including the regression of these models to experimental data. The data used include examples found in the literature and new data that was collected as part of this work. The statistical results from the least squares regression of the models to the data are used as the basis for comparison of the various terminal substrate inhibition models to each other and to the asymptotic Andrews inhibition model. In some cases the qualitative/visual appearance of the representation is used together with the statistical analysis results to justify selection of the best-fit equation. Finally, known mechanisms of microbial (solvent) toxicity are discussed as they provide further support for the use of these empirical models.
METHODOLOGY
Pseudomonas putida F1 (Zylstra and Gibson, 1989) and Burkholderia pickettii PKO1 (Kukor and Kaphammer, 1994) strains were obtained as frozen cultures from Dr. Gerben Zylstra and Dr. Jerome Kukor, respectively, at Rutgers University. They were transferred from frozen culture to R2A agar plates (APHA, 1995) and incubated overnight at 30 °C. Single colonies were picked and transferred to mineral salts solution (200 mg/L CaCl2, 15 mg/L FeCl3
.6H2O, 1.5 mg/L CoCl2.6H2O, 1.5 mg/L ZnCl2, 0.5 mg/L CuCl2
.2H2O, 0.15 mg/L H3BO3, 0.03 mL concentrated HCl, 150 mg/L MgSO4
.7H2O, 4.5 mg/L MnSO4
.H2O, 0.5 mg/L Na2MoO4.2H2O, 4350 mg/L K2HPO4, 3400 mg/L KH2PO4, 1012
mg/L NH4Cl, all of ACS reagent grade or better) agar (15 g/L of Difco) plates. These were incubated at room temperature in a sealed vessel containing a small beaker of toluene, i.e., toluene was available from the vapor phase. Several colonies were picked from these plates and transferred to a 600 mL Pyrex bottles containing 400 mL of sterile mineral salts solution. This culture was fed toluene to a known and measured concentration between 15 and 40 mg/L and grown to serve as the inoculum for the experiments. The inoculum culture and all of the experimental cultures were grown at 20 °C in an automated respirometer (Comput-Ox 244, N-CON Systems, Inc., Athens, GA), allowing monitoring and collection of oxygen consumption data. Care was taken to harvest the inoculum for transfer to the experiments during late exponential/early stationary phase, before substantial biomass decay could occur. In all cases the residual toluene concentration in the inoculum culture was estimated to be <1 mg/L. Inoculation was obtained by transferring 20 to 40 mL of the inoculum culture directly (i.e., without centrifugation or washing) to 400 mL of MSM. Thus the maximum transfer of residual substrate to the new reactor was 0.04 mg, or an equivalent of 0.1 mg/L.
Experiments were initiated when a known quantity of toluene, as pure compound, was injected through a Teflon-lined rubber septum into the culture, and oxygen uptake data collection started. Immediately preceding this step, a small sample of headspace and/or liquid was taken and analyzed by GC/FID and/or chemical oxygen demand (COD)
23
analysis using HACH (Loveland, Colorado) COD vials. Results of these analyses confirmed that the initial substrate concentrations were close (±5 %) to the target value.
Oxygen uptake data were collected for the length of time required to obtain complete removal of the added toluene, except where no oxygen uptake was observed due to toxicity. This data, along with knowledge of the initial biomass and toluene concentrations, was used to obtain estimates of specific growth rate and biomass yield. The specific growth rate, µ, was calculated through non-linear regression analysis of the oxygen uptake data collected before the oxygen transfer rate, rather than the microbial growth rate, became limiting (usually the first 5 to 10 mg/L of oxygen uptake). Each value of µ thus estimated was assigned as the specific growth rate for the corresponding initial toluene concentration. The yield value observed for each experiment was calculated as the difference between the COD of the added toluene and the cumulative amount of oxygen uptake at the time of complete toluene removal, divided by the initial toluene concentration. This value was compared to the true growth yield obtained for the same microbial population grown on a low (non-inhibitory) concentration of toluene. In all cases, the yield value observed for the inhibition kinetics experiments was within 5% of the true growth yield, suggesting that toxicity did not lead to any substantial quantity of toluene undergoing only partial degradation.
The experimentally derived data on specific growth rate versus toluene concentration, and similar rate versus substrate concentration data collected from the literature, were used to verify the utility of a variety of substrate inhibition models. Each substrate inhibition model was used to obtain best-fit parameter estimates for each data set. The statistical results from the least squares regression of each model to each data set were then used to compare models. Regression analysis was performed using Scientist (MicroMath Inc., Salt Lake City, UT), a Windows (Microsoft, Redmond, WA) based modeling and curve-fitting program. When a continuous inhibition kinetics model was used, the full data set was used for simultaneous regression based estimation of all of the model parameters. However, for the discontinuous models (Wayman and Tseng, and the Modified Wayman and Tseng model proposed here) it was necessary to first obtain the (Monod or Andrews model) kinetic parameter estimates through regression of the data collected in the lower concentration range (i.e., from 0 through Sθ). The additional parameter estimates were then obtained using the data falling in the toxicity inhibition region Sθ ≤ S < Si, i.e., the range from Sθ to the highest concentration at which growth was observed. The analyses of Monod or Andrews region parameter values and the toxicity/inhibition parameter values were performed iteratively until an optimum value was obtained for Sθ. These optimum Sθ values and the other stoichiometric and kinetic parameters were defined as those providing the lowest sum of squares of the deviation (SSD) between the full data set and the full discontinuous model.
RESULTS AND DISCUSSION
Justification of the Wayman and Tseng Model for Substrate Inhibition
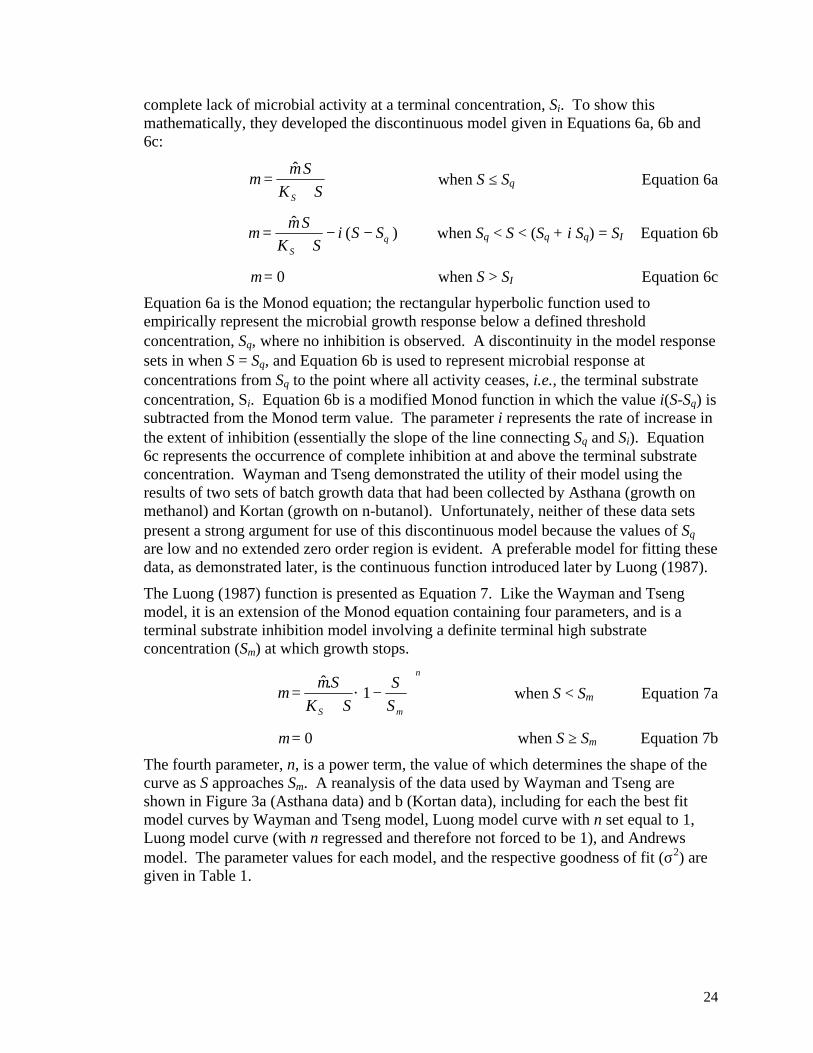
Wayman and Tseng (1976) developed their model to illustrate that some inhibitory substrates elicit a sharp, almost linear, drop in microbial activity when the substrate concentration exceeds a characteristic threshold concentration, Sθ, thus leading to a
24
complete lack of microbial activity at a terminal concentration, Si. To show this mathematically, they developed the discontinuous model given in Equations 6a, 6b and 6c:
SK
S
S +=
µ̂µ when S ≤ Sθ Equation 6a
)( ˆ
θµ
µ SSiSK
S
S
−−+
= when Sθ < S < (Sθ + i Sθ) = SI Equation 6b
µ = 0 when S > SI Equation 6c
Equation 6a is the Monod equation; the rectangular hyperbolic function used to empirically represent the microbial growth response below a defined threshold concentration, Sθ, where no inhibition is observed. A discontinuity in the model response sets in when S = Sθ, and Equation 6b is used to represent microbial response at concentrations from Sθ to the point where all activity ceases, i.e., the terminal substrate concentration, Si. Equation 6b is a modified Monod function in which the value i(S-Sθ) is subtracted from the Monod term value. The parameter i represents the rate of increase in the extent of inhibition (essentially the slope of the line connecting Sθ and Si). Equation 6c represents the occurrence of complete inhibition at and above the terminal substrate concentration. Wayman and Tseng demonstrated the utility of their model using the results of two sets of batch growth data that had been collected by Asthana (growth on methanol) and Kortan (growth on n-butanol). Unfortunately, neither of these data sets present a strong argument for use of this discontinuous model because the values of Sθ are low and no extended zero order region is evident. A preferable model for fitting these data, as demonstrated later, is the continuous function introduced later by Luong (1987).
The Luong (1987) function is presented as Equation 7. Like the Wayman and Tseng model, it is an extension of the Monod equation containing four parameters, and is a terminal substrate inhibition model involving a definite terminal high substrate concentration (Sm) at which growth stops.
n
mS S
S
SK
S
−
+= 1·
.µ̂µ when S < Sm Equation 7a
µ = 0 when S ≥ Sm Equation 7b
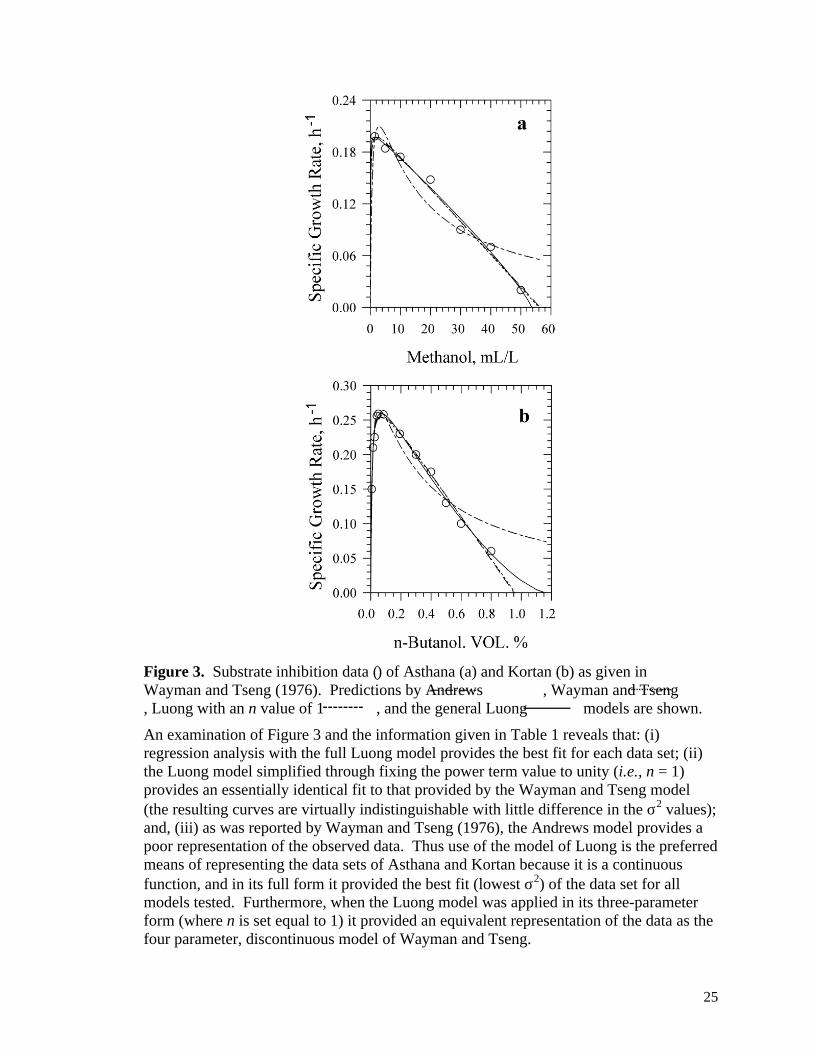
The fourth parameter, n, is a power term, the value of which determines the shape of the curve as S approaches Sm. A reanalysis of the data used by Wayman and Tseng are shown in Figure 3a (Asthana data) and b (Kortan data), including for each the best fit model curves by Wayman and Tseng model, Luong model curve with n set equal to 1, Luong model curve (with n regressed and therefore not forced to be 1), and Andrews model. The parameter values for each model, and the respective goodness of fit (σ2) are given in Table 1.
25
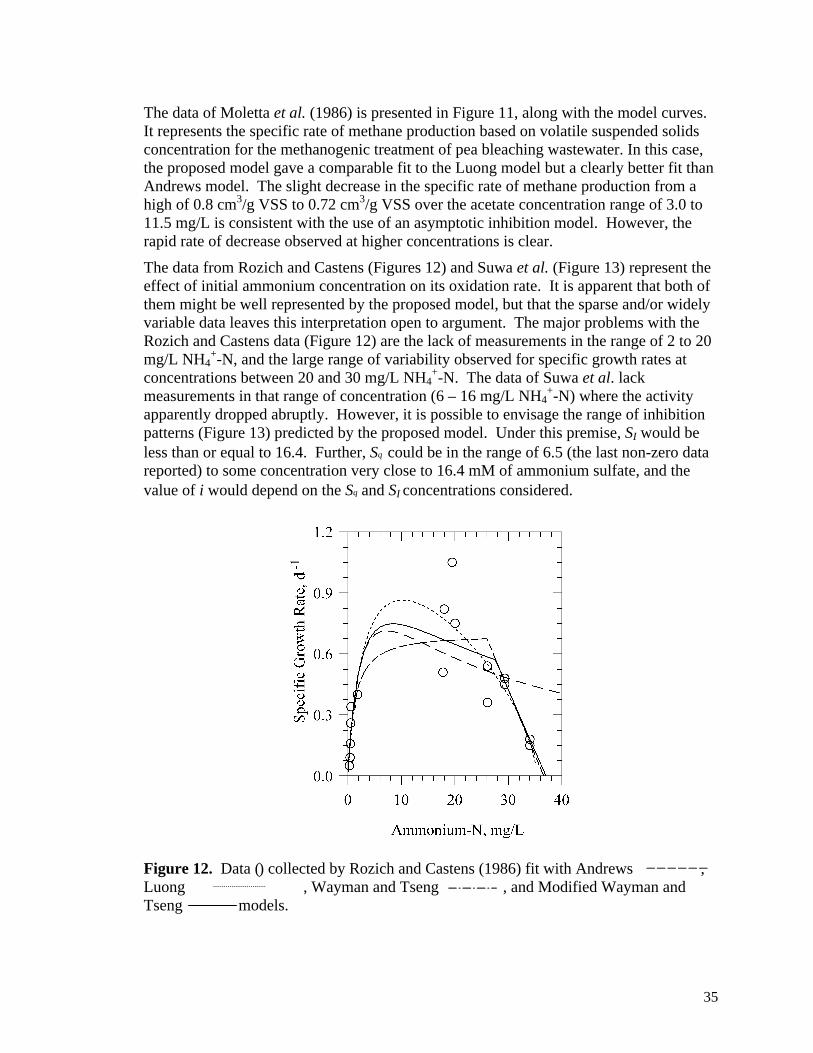
Figure 3. Substrate inhibition data (�) of Asthana (a) and Kortan (b) as given in Wayman and Tseng (1976). Predictions by Andrews , Wayman and Tseng , Luong with an n value of 1 , and the general Luong models are shown.
An examination of Figure 3 and the information given in Table 1 reveals that: (i) regression analysis with the full Luong model provides the best fit for each data set; (ii) the Luong model simplified through fixing the power term value to unity (i.e., n = 1) provides an essentially identical fit to that provided by the Wayman and Tseng model (the resulting curves are virtually indistinguishable with little difference in the σ2 values); and, (iii) as was reported by Wayman and Tseng (1976), the Andrews model provides a poor representation of the observed data. Thus use of the model of Luong is the preferred means of representing the data sets of Asthana and Kortan because it is a continuous function, and in its full form it provided the best fit (lowest σ2) of the data set for all models tested. Furthermore, when the Luong model was applied in its three-parameter form (where n is set equal to 1) it provided an equivalent representation of the data as the four parameter, discontinuous model of Wayman and Tseng.

Table 1. Kinetic parameters for the data sets fitted with Luong, Wayman and Tseng, and Andrews models.
Data Model µ̂ KS KI Sm or SI* n i Sθ σ2 x10⁻⁴
Asthana Andrews 0.31±0.12 0.7±0.1 12±8.5 7.5 Luong 0.2±0.01 0.03±0.14 55.6±4.0 0.84±0.2 1.0 Luong (n = 1) 0.2±0.01 0.08±0.1 56.5±2 1.0 (fixed) 0.8 Wayman & Tseng 0.21 0.094 56.0 0.004 2.2 1.2 Kortan Andrews 0.36±0.04 0.01±0.003 0.3±0.07 4.0 Luong 0.31±0.007 0.007±0.007 1.16±0.16 1.47±0.3 0.43 Luong (n = 1) 0.3±0.006 0.006±0.0007 1.0 (fixed) 0.67 Wayman & Tseng 0.29±0.008 0.006±0.0007 0.95 0.31±0.01 0.027±0.02 0.60 Pilát and Andrews 0.19±0.04 0.12±0.07 3.5±1.6 6.7 Prokop Luong 0.134 0.05±0.01 7.97±0.015 0.43±0.06 1.8 Wayman & Tseng 0.14±0.001 0.05±0.003 8.1 0.03±0.0015 3.67±0.14 0.014 Rudek Andrews 1.4 0.6±0.7 20±4 300.0 Luong 1.39±0.2 1.14±0.66 40.3±4.8 0.76±0.32 18.0 Wayman & Tseng 1.0 0.089±0.089 44.35 0.03±0.002 12.9±0.94 19.0 Velizarov Andrews 0.6±0.2 0.027±0.02 0.7±0.4 37.5 and Luong 0.5 0.027±0.018 1.51± 0.13 0.68±0.13 14.0 Beschkov Wayman & Tseng 0.38±0.006 0.0091±0.001 1.59 0.39±0.05 0.62±0.06 3.6 This work, Andrews 0.63±0.5 11±24 168±216 125.0 P. putida F1 Luong 0.4 6.8±3.4 402±1.3 0.48±0.06 49.0 Wayman & Tseng 0.35±0.01 0.6±0.07 400 1.0E-3±1E-4 280±9 14.0
σ2 – Goodness of fit. *- The parameters Sm (Luong model) and SI (Wayman and Tseng model) are the concentrations at which growth/activity completely ceases. Error values shown are ± one standard deviation or standard error as reported by Scientist.
27
An attempt is made to show relative efficacies of different models (primarily those of Luong and Wayman and Tseng) to represent substrate inhibition data obtained in this study and some data found in the literature. The goodness of fit is calculated for each model with all the data sets for this purpose. The number of degrees of freedom for the Luong and Wayman and Tseng models were the same since both have four parameters. Further, the F-values were calculated with the goodness of fit values for these two models, and the probability level at which one model is significantly better is determined (see Edwards, 1970).
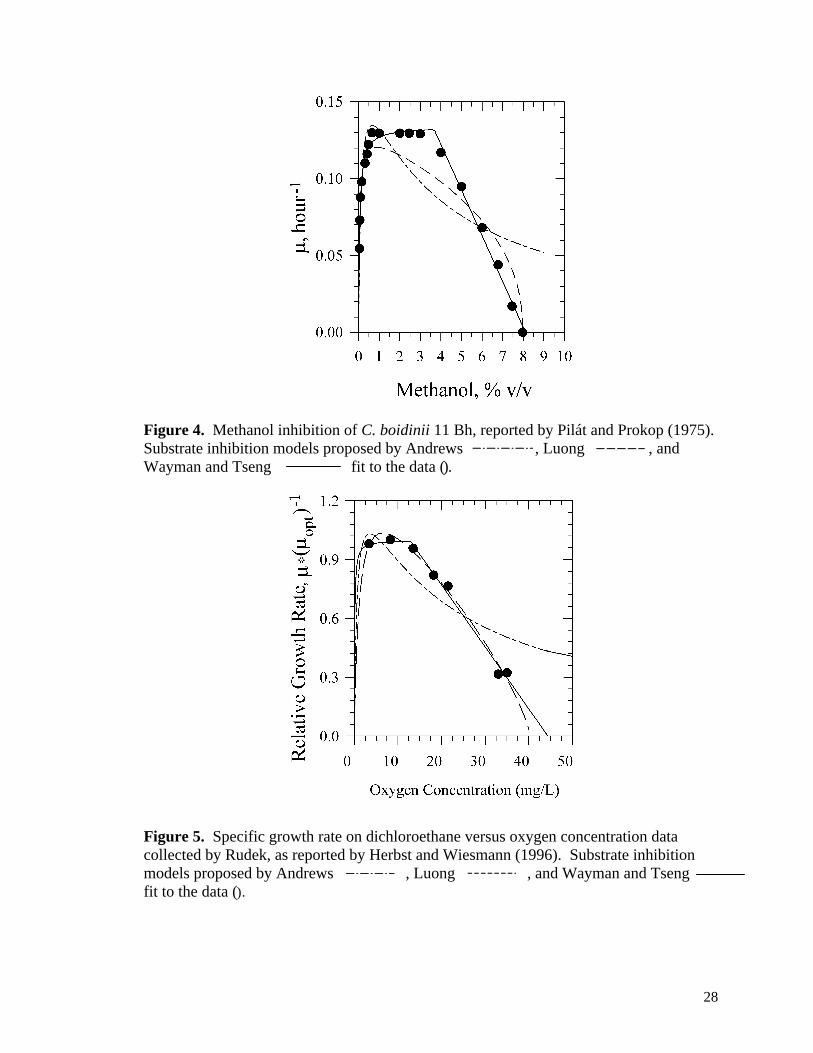
The published data of Pilát and Prokop (1975), Velizarov and Beschkov (1998), Rudek in Herbst and Wiesmann (1996), and toluene inhibition of P. putida F1 shown in this study represent the type of data for which the Wayman and Tseng model is clearly necessary. Figure 4 presents the Pilát and Prokop data showing the effect of various initial methanol (carbon and energy source) concentrations on the growth of the yeast, Candida boidinii 11 Bh at 30 °C. A zero order non-inhibitory growth region is prominent, followed by a region in which the activity begins to drop steadily towards complete inactivation. Clearly, the Wayman and Tseng model fits this data much better than the other models considered (Luong and Andrews).
Rudek’s data (Figure 5) shows the effect of oxygen (electron acceptor) on dichloroethane-based growth rate, with the Wayman and Tseng, the Luong, and the Andrews model fits. In this case, the data indicate that oxygen is not inhibitory at concentrations high enough that the specific growth rate might be considered zero order with respect to oxygen concentration ( µ̂ region). However, at dissolved oxygen concentrations greater than 13 mg/L, the specific growth rate is found to drop rapidly. Unfortunately, there is no data in the range of dissolved oxygen concentrations between 0 and 2 mg/L, thereby the KS value is poorly defined. The result is a virtually identical fit by the Luong and the Wayman and Tseng models (Table 1).
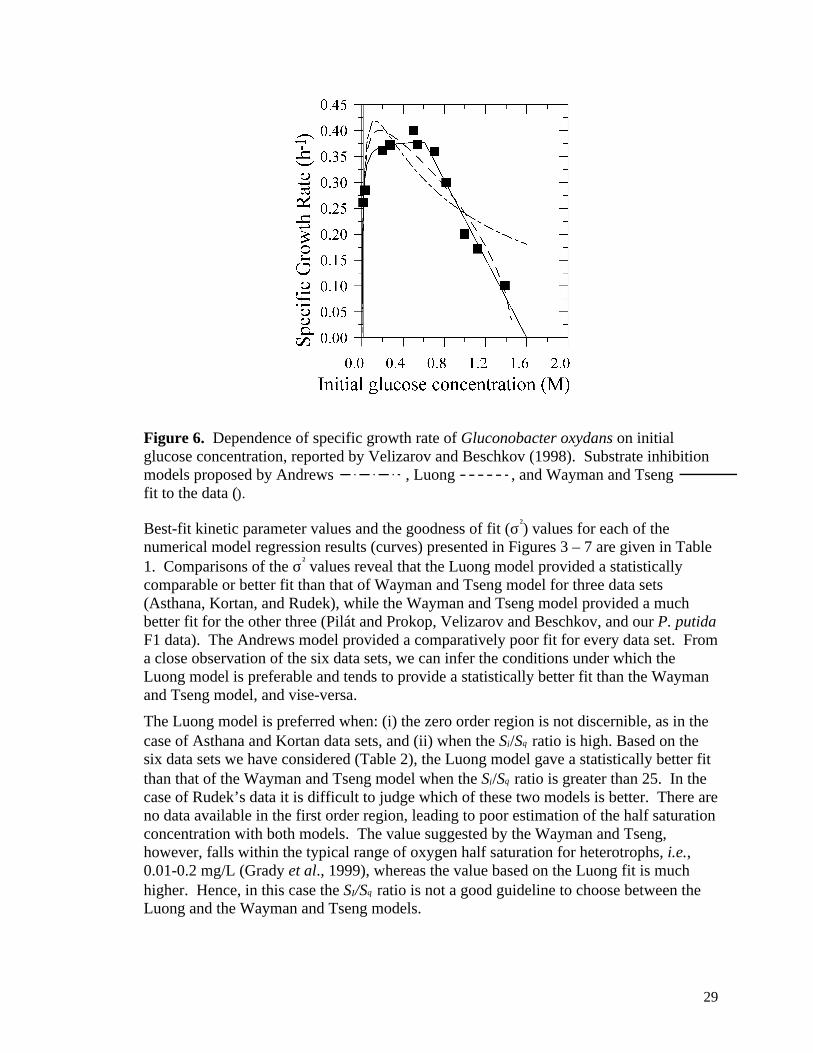
Velizarov and Beschkov data (Figure 6) shows the substrate inhibition pattern of glucose on Gluconobacter oxydans fitted with the three models. This data reveals that the specific growth rate of G. oxydans follows a Monod model pattern up to 0.62 M (112 g/L). Beyond this concentration, the growth rate drops rapidly, clearly suggesting that the discontinuous Wayman and Tseng model is the appropriate model to represent this inhibition trend.
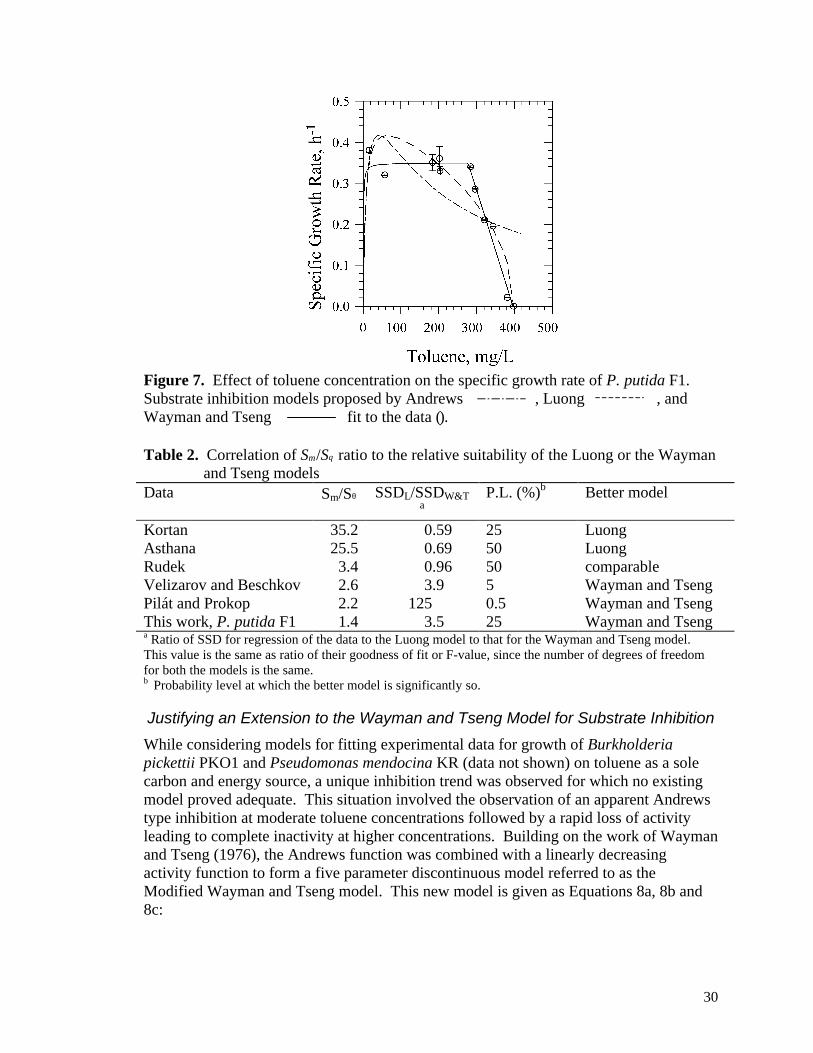
Data collected on the effect of high toluene concentrations on the specific growth rate of Pseudomonas putida F1 (Figure 7), where toluene serves as the sole carbon and energy source, also shows the trend of a zero-order effect of toluene concentration ( µ̂ region, suggesting it behaves as a non-inhibitory substrate) followed by a region where specific growth rate rapidly drops off to zero once a threshold concentration is exceeded.
28
Figure 4. Methanol inhibition of C. boidinii 11 Bh, reported by Pilát and Prokop (1975). Substrate inhibition models proposed by Andrews , Luong , and Wayman and Tseng fit to the data (�).
Figure 5. Specific growth rate on dichloroethane versus oxygen concentration data collected by Rudek, as reported by Herbst and Wiesmann (1996). Substrate inhibition models proposed by Andrews , Luong , and Wayman and Tseng fit to the data (�).
29
Figure 6. Dependence of specific growth rate of Gluconobacter oxydans on initial glucose concentration, reported by Velizarov and Beschkov (1998). Substrate inhibition models proposed by Andrews , Luong , and Wayman and Tseng fit to the data (�).
Best-fit kinetic parameter values and the goodness of fit (σ²) values for each of the numerical model regression results (curves) presented in Figures 3 – 7 are given in Table 1. Comparisons of the σ² values reveal that the Luong model provided a statistically comparable or better fit than that of Wayman and Tseng model for three data sets (Asthana, Kortan, and Rudek), while the Wayman and Tseng model provided a much better fit for the other three (Pilát and Prokop, Velizarov and Beschkov, and our P. putida F1 data). The Andrews model provided a comparatively poor fit for every data set. From a close observation of the six data sets, we can infer the conditions under which the Luong model is preferable and tends to provide a statistically better fit than the Wayman and Tseng model, and vise-versa.
The Luong model is preferred when: (i) the zero order region is not discernible, as in the case of Asthana and Kortan data sets, and (ii) when the Si/Sθ ratio is high. Based on the six data sets we have considered (Table 2), the Luong model gave a statistically better fit than that of the Wayman and Tseng model when the Si/Sθ ratio is greater than 25. In the case of Rudek’s data it is difficult to judge which of these two models is better. There are no data available in the first order region, leading to poor estimation of the half saturation concentration with both models. The value suggested by the Wayman and Tseng, however, falls within the typical range of oxygen half saturation for heterotrophs, i.e., 0.01-0.2 mg/L (Grady et al., 1999), whereas the value based on the Luong fit is much higher. Hence, in this case the SI/Sθ ratio is not a good guideline to choose between the Luong and the Wayman and Tseng models.
30
Figure 7. Effect of toluene concentration on the specific growth rate of P. putida F1. Substrate inhibition models proposed by Andrews , Luong , and Wayman and Tseng fit to the data (�). Table 2. Correlation of Sm/Sθ ratio to the relative suitability of the Luong or the Wayman
and Tseng models Data Sm/Sθ SSDL/SSDW&T
a P.L. (%)b Better model
Kortan 35.2 0.59 25 Luong Asthana 25.5 0.69 50 Luong Rudek 3.4 0.96 50 comparable Velizarov and Beschkov 2.6 3.9 5 Wayman and Tseng Pilát and Prokop 2.2 125 0.5 Wayman and Tseng This work, P. putida F1 1.4 3.5 25 Wayman and Tseng a Ratio of SSD for regression of the data to the Luong model to that for the Wayman and Tseng model. This value is the same as ratio of their goodness of fit or F-value, since the number of degrees of freedom for both the models is the same. b Probability level at which the better model is significantly so.
Justifying an Extension to the Wayman and Tseng Model for Substrate Inhibition
While considering models for fitting experimental data for growth of Burkholderia pickettii PKO1 and Pseudomonas mendocina KR (data not shown) on toluene as a sole carbon and energy source, a unique inhibition trend was observed for which no existing model proved adequate. This situation involved the observation of an apparent Andrews type inhibition at moderate toluene concentrations followed by a rapid loss of activity leading to complete inactivity at higher concentrations. Building on the work of Wayman and Tseng (1976), the Andrews function was combined with a linearly decreasing activity function to form a five parameter discontinuous model referred to as the Modified Wayman and Tseng model. This new model is given as Equations 8a, 8b and 8c:
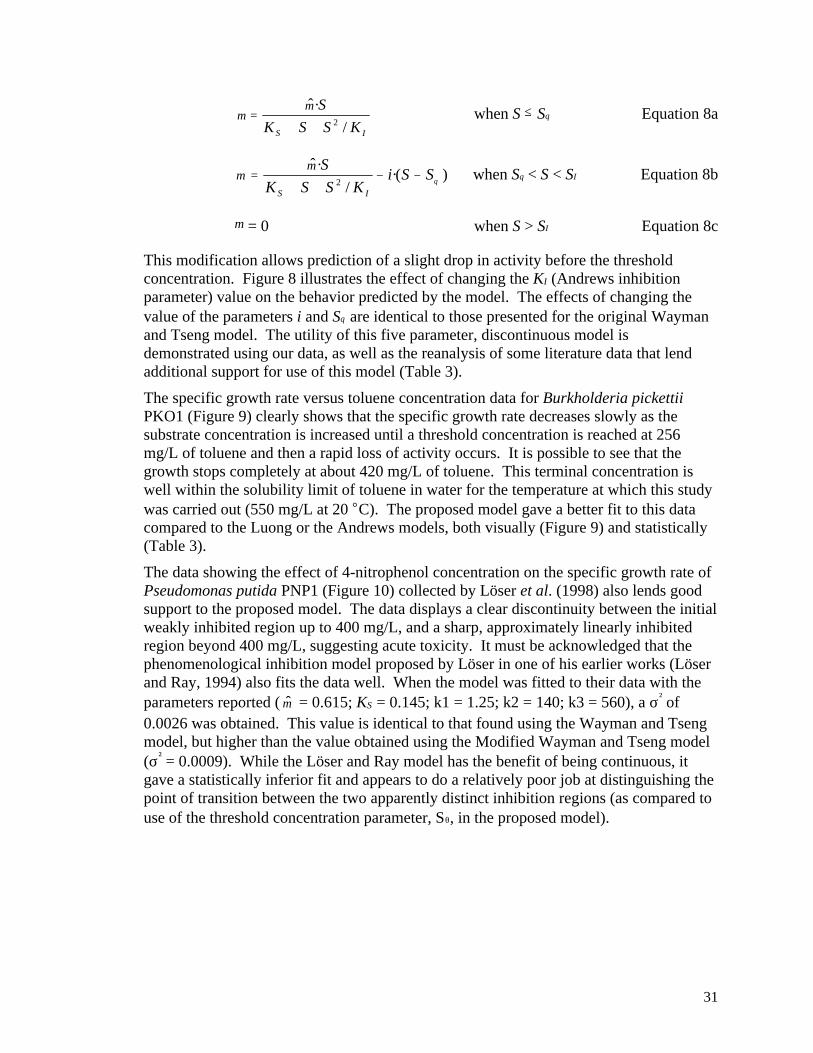
31
IS KSSK
S
/
·ˆ2++
=µ
µ when S ≤ Sθ Equation 8a
)(·/
·ˆ2 θ
µµ SSi
KSSK
S
IS
−−++
= when Sθ < S < SΙ Equation 8b
µ = 0 when S > SΙ Equation 8c
This modification allows prediction of a slight drop in activity before the threshold concentration. Figure 8 illustrates the effect of changing the KI (Andrews inhibition parameter) value on the behavior predicted by the model. The effects of changing the value of the parameters i and Sθ are identical to those presented for the original Wayman and Tseng model. The utility of this five parameter, discontinuous model is demonstrated using our data, as well as the reanalysis of some literature data that lend additional support for use of this model (Table 3).
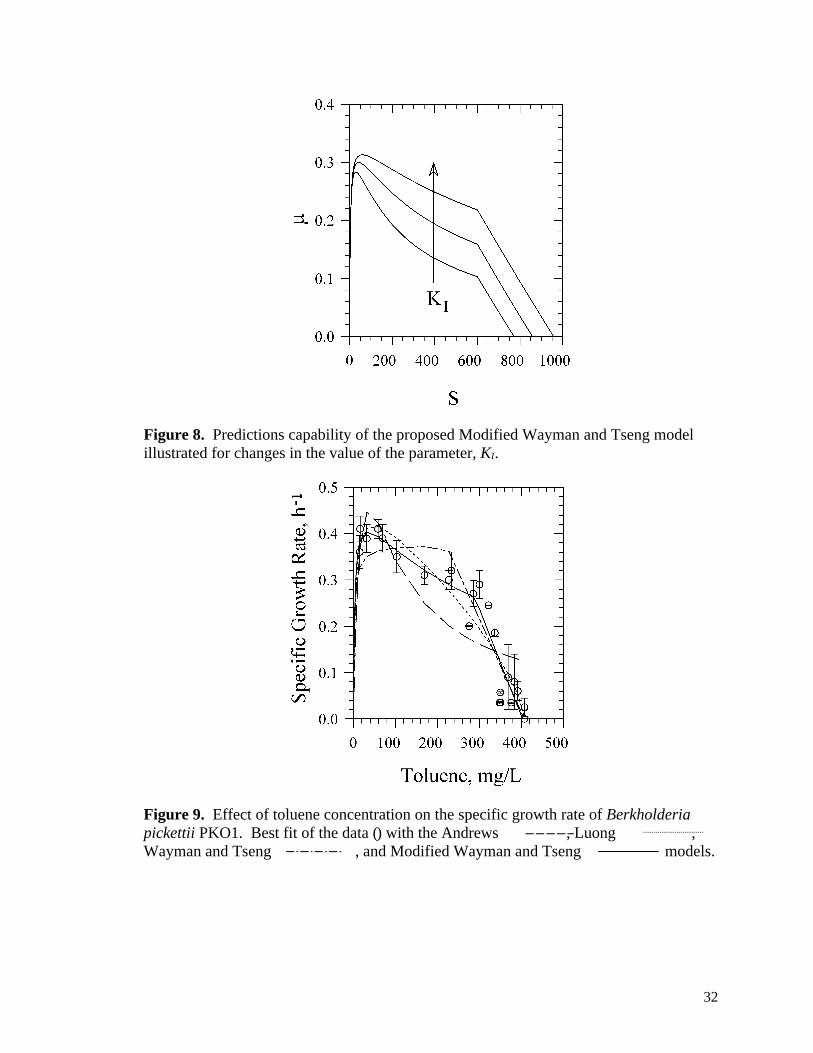
The specific growth rate versus toluene concentration data for Burkholderia pickettii PKO1 (Figure 9) clearly shows that the specific growth rate decreases slowly as the substrate concentration is increased until a threshold concentration is reached at 256 mg/L of toluene and then a rapid loss of activity occurs. It is possible to see that the growth stops completely at about 420 mg/L of toluene. This terminal concentration is well within the solubility limit of toluene in water for the temperature at which this study was carried out (550 mg/L at 20 °C). The proposed model gave a better fit to this data compared to the Luong or the Andrews models, both visually (Figure 9) and statistically (Table 3).
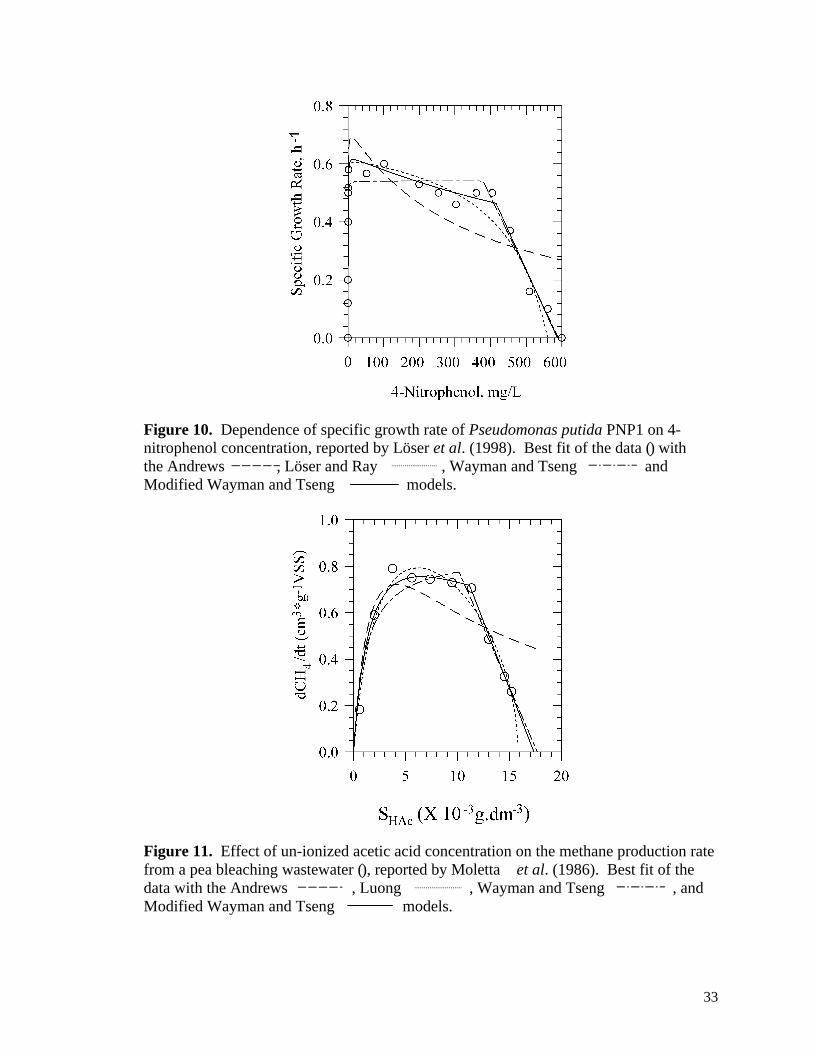
The data showing the effect of 4-nitrophenol concentration on the specific growth rate of Pseudomonas putida PNP1 (Figure 10) collected by Löser et al. (1998) also lends good support to the proposed model. The data displays a clear discontinuity between the initial weakly inhibited region up to 400 mg/L, and a sharp, approximately linearly inhibited region beyond 400 mg/L, suggesting acute toxicity. It must be acknowledged that the phenomenological inhibition model proposed by Löser in one of his earlier works (Löser and Ray, 1994) also fits the data well. When the model was fitted to their data with the parameters reported ( µ̂ = 0.615; KS = 0.145; k1 = 1.25; k2 = 140; k3 = 560), a σ² of 0.0026 was obtained. This value is identical to that found using the Wayman and Tseng model, but higher than the value obtained using the Modified Wayman and Tseng model (σ² = 0.0009). While the Löser and Ray model has the benefit of being continuous, it gave a statistically inferior fit and appears to do a relatively poor job at distinguishing the point of transition between the two apparently distinct inhibition regions (as compared to use of the threshold concentration parameter, Sθ, in the proposed model).
32
Figure 8. Predictions capability of the proposed Modified Wayman and Tseng model illustrated for changes in the value of the parameter, KI.
Figure 9. Effect of toluene concentration on the specific growth rate of Berkholderia pickettii PKO1. Best fit of the data (�) with the Andrews , Luong , Wayman and Tseng , and Modified Wayman and Tseng models.
33
Figure 10. Dependence of specific growth rate of Pseudomonas putida PNP1 on 4-nitrophenol concentration, reported by Löser et al. (1998). Best fit of the data (�) with the Andrews , Löser and Ray , Wayman and Tseng and Modified Wayman and Tseng models.
Figure 11. Effect of un-ionized acetic acid concentration on the methane production rate from a pea bleaching wastewater (�), reported by Moletta et al. (1986). Best fit of the data with the Andrews , Luong , Wayman and Tseng , and Modified Wayman and Tseng models.
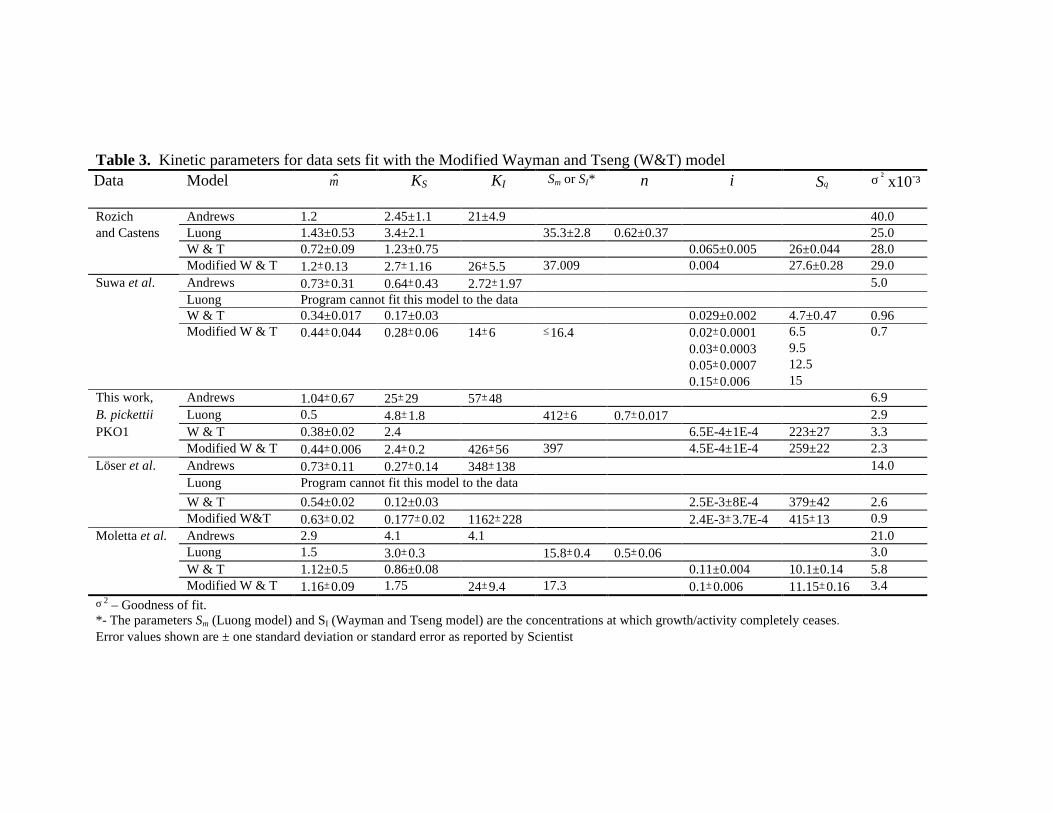
Table 3. Kinetic parameters for data sets fit with the Modified Wayman and Tseng (W&T) model Data Model µ̂ KS KI Sm or SI* n i Sθ σ ² x10-³
Rozich Andrews 1.2 2.45±1.1 21±4.9 40.0 and Castens Luong 1.43±0.53 3.4±2.1 35.3±2.8 0.62±0.37 25.0 W & T 0.72±0.09 1.23±0.75 0.065±0.005 26±0.044 28.0 Modified W & T 1.2±0.13 2.7±1.16 26±5.5 37.009 0.004 27.6±0.28 29.0 Suwa et al. Andrews 0.73±0.31 0.64±0.43 2.72±1.97 5.0 Luong Program cannot fit this model to the data W & T 0.34±0.017 0.17±0.03 0.029±0.002 4.7±0.47 0.96 Modified W & T 0.44±0.044 0.28±0.06 14±6 ≤16.4 0.02±0.0001 6.5 0.7 0.03±0.0003 9.5 0.05±0.0007 12.5 0.15±0.006 15 This work, Andrews 1.04±0.67 25±29 57±48 6.9 B. pickettii Luong 0.5 4.8±1.8 412±6 0.7±0.017 2.9 PKO1 W & T 0.38±0.02 2.4 6.5E-4±1E-4 223±27 3.3 Modified W & T 0.44±0.006 2.4±0.2 426±56 397 4.5E-4±1E-4 259±22 2.3 Löser et al. Andrews 0.73±0.11 0.27±0.14 348±138 14.0
Luong Program cannot fit this model to the data
W & T 0.54±0.02 0.12±0.03 2.5E-3±8E-4 379±42 2.6 Modified W&T 0.63±0.02 0.177±0.02 1162±228 2.4E-3±3.7E-4 415±13 0.9 Moletta et al. Andrews 2.9 4.1 4.1 21.0 Luong 1.5 3.0±0.3 15.8±0.4 0.5±0.06 3.0 W & T 1.12±0.5 0.86±0.08 0.11±0.004 10.1±0.14 5.8 Modified W & T 1.16±0.09 1.75 24±9.4 17.3 0.1±0.006 11.15±0.16 3.4 σ 2 – Goodness of fit. *- The parameters Sm (Luong model) and SI (Wayman and Tseng model) are the concentrations at which growth/activity completely ceases. Error values shown are ± one standard deviation or standard error as reported by Scientist
35
The data of Moletta et al. (1986) is presented in Figure 11, along with the model curves. It represents the specific rate of methane production based on volatile suspended solids concentration for the methanogenic treatment of pea bleaching wastewater. In this case, the proposed model gave a comparable fit to the Luong model but a clearly better fit than Andrews model. The slight decrease in the specific rate of methane production from a high of 0.8 cm3/g VSS to 0.72 cm3/g VSS over the acetate concentration range of 3.0 to 11.5 mg/L is consistent with the use of an asymptotic inhibition model. However, the rapid rate of decrease observed at higher concentrations is clear.
The data from Rozich and Castens (Figures 12) and Suwa et al. (Figure 13) represent the effect of initial ammonium concentration on its oxidation rate. It is apparent that both of them might be well represented by the proposed model, but that the sparse and/or widely variable data leaves this interpretation open to argument. The major problems with the Rozich and Castens data (Figure 12) are the lack of measurements in the range of 2 to 20 mg/L NH4
+-N, and the large range of variability observed for specific growth rates at concentrations between 20 and 30 mg/L NH4
+-N. The data of Suwa et al. lack measurements in that range of concentration (6 – 16 mg/L NH4
+-N) where the activity apparently dropped abruptly. However, it is possible to envisage the range of inhibition patterns (Figure 13) predicted by the proposed model. Under this premise, SI would be less than or equal to 16.4. Further, Sθ could be in the range of 6.5 (the last non-zero data reported) to some concentration very close to 16.4 mM of ammonium sulfate, and the value of i would depend on the Sθ and SI concentrations considered.
Figure 12. Data (�) collected by Rozich and Castens (1986) fit with Andrews , Luong , Wayman and Tseng , and Modified Wayman and Tseng models.
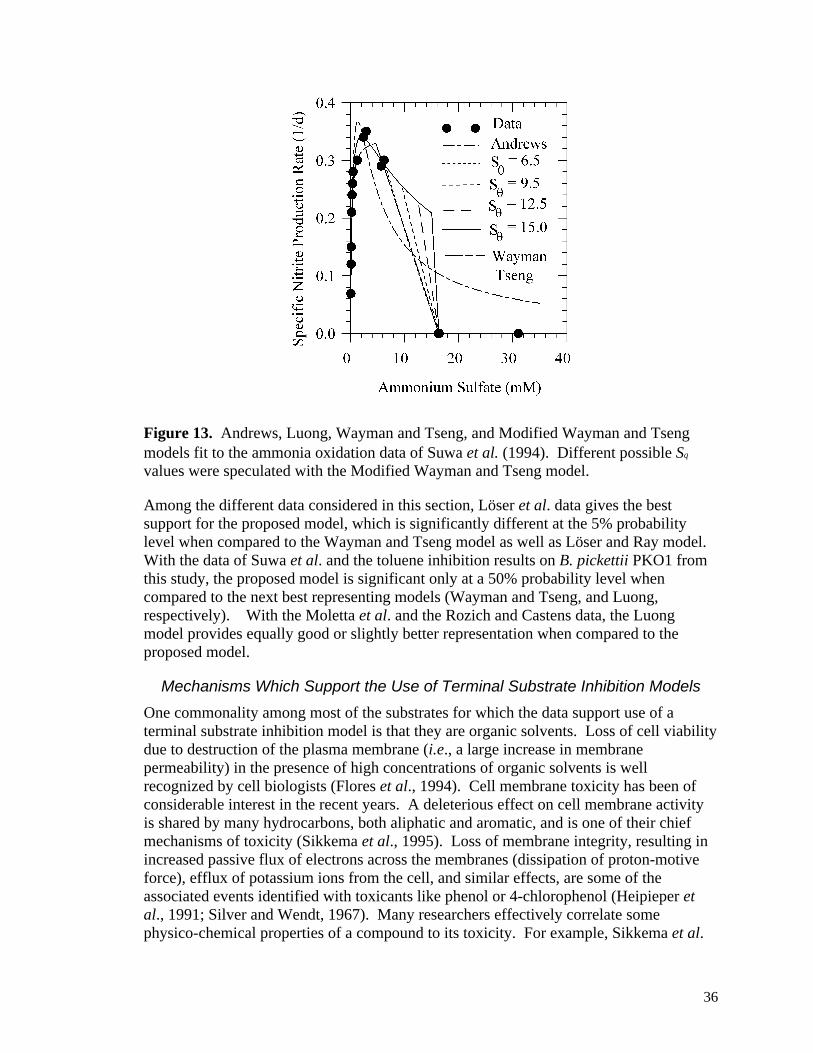
36
Figure 13. Andrews, Luong, Wayman and Tseng, and Modified Wayman and Tseng models fit to the ammonia oxidation data of Suwa et al. (1994). Different possible Sθ values were speculated with the Modified Wayman and Tseng model.
Among the different data considered in this section, Löser et al. data gives the best support for the proposed model, which is significantly different at the 5% probability level when compared to the Wayman and Tseng model as well as Löser and Ray model. With the data of Suwa et al. and the toluene inhibition results on B. pickettii PKO1 from this study, the proposed model is significant only at a 50% probability level when compared to the next best representing models (Wayman and Tseng, and Luong, respectively). With the Moletta et al. and the Rozich and Castens data, the Luong model provides equally good or slightly better representation when compared to the proposed model.
Mechanisms Which Support the Use of Terminal Substrate Inhibition Models
One commonality among most of the substrates for which the data support use of a terminal substrate inhibition model is that they are organic solvents. Loss of cell viability due to destruction of the plasma membrane (i.e., a large increase in membrane permeability) in the presence of high concentrations of organic solvents is well recognized by cell biologists (Flores et al., 1994). Cell membrane toxicity has been of considerable interest in the recent years. A deleterious effect on cell membrane activity is shared by many hydrocarbons, both aliphatic and aromatic, and is one of their chief mechanisms of toxicity (Sikkema et al., 1995). Loss of membrane integrity, resulting in increased passive flux of electrons across the membranes (dissipation of proton-motive force), efflux of potassium ions from the cell, and similar effects, are some of the associated events identified with toxicants like phenol or 4-chlorophenol (Heipieper et al., 1991; Silver and Wendt, 1967). Many researchers effectively correlate some physico-chemical properties of a compound to its toxicity. For example, Sikkema et al.
37
(1994) showed that octanol-water partition coefficient (KOW) for cyclic hydrocarbons could serve as an index for the ability to partition onto biological membranes. Additionally, Vaishnav and Lopas (1985) have demonstrated a parabolic relationship between log KOW and the experimental microbial EC50 values for 10 primary alcohols (in this context, EC50 refers to the concentration at which the biodegradation rate is reduced to half the maximum observed rate).
The observed quantitative change in membrane properties from exposure to different concentrations of a toxicant is of interest to this work. Findings by Skerlavaj et al. (1990) on the effect of bactenecins, a class of arginine-rich antibacterial peptides, on several gram-negative bacteria suggest that the decrease in bacterial viability is causally related to the increase in membrane permeability and the subsequent fall in respiration-linked proton-motive force, with the attendant loss of cellular metabolites and macromolecular biosynthetic ability. Smejtek (1987) showed a clear correlation between pentachlorophenol (PCP) concentration, toxicity (drop in 14C assimilation), and a decrease in the electrical resistance of the cell membrane of Selenastrum capricornutum, an algal species. While at lower concentrations there was no detectable effect of PCP on activity or electrical resistance (i.e., zero order response to [PCP]), the same PCP concentration that was associated with the first detectable changes in membrane resistivity was the associated with the first evidence of toxicity. This behavior is consistent with a Wayman and Tseng-type relationship between specific activity and substrate concentration.
Similar relationships have been reported to exist between the occurrence of toxicity and change in membrane properties for other toxic compounds (antibiotics, for instance) that target the cell membrane. According to Maftah et al. (1993), mesentericin Y105, a bacteriocin produced by a Leuconostoc mesenteroides strain, dissipates the plasma membrane potential of Listeria monocytogenes and inhibits the transport of leucine and glutamic acid. It also induces an efflux of preaccumulated amino acids from cells, possibly by inducing pore formation in the energy-transducing membrane. Loss of selective permeability of the cells seems to occur sometimes without structural damage, as in the case of chlorine dioxide action on E. coli, destroying the latter’s trans-membrane gradient (Berg et al., 1986). Mycotoxins such as trichothecenes were found to have no effect on biosynthetic (enzyme related) mechanisms including formation of proteins, DNA, or RNA, but deplete the cytoplasmic pool of soluble low mass precursors by affecting the permeability of the cell membrane (Rottem et al., 1984).
These facts strongly indicate that microbial growth inhibition need not always be enzyme related. Instead, when whole cells are involved, impact on cell organelles and membranes should also be given due consideration. Asymptotic inhibition models such as that of Andrews cannot effectively model these whole cell effects, even empirically. Because the Andrews function is an identical mathematical formulation to the enzyme inhibition function of Haldane (1930), it can be expected to be most capable of accounting for enzyme-related inhibition. With both the Wayman and Tseng model and the new model proposed in this work, the discontinuity permits representation of the kind of growth inhibition expected for substrates that affect membrane permeability, or some other whole cell effect that may be independent of catabolic processing of the substrate. When we consider the extent of membrane permeability or related parameters associated
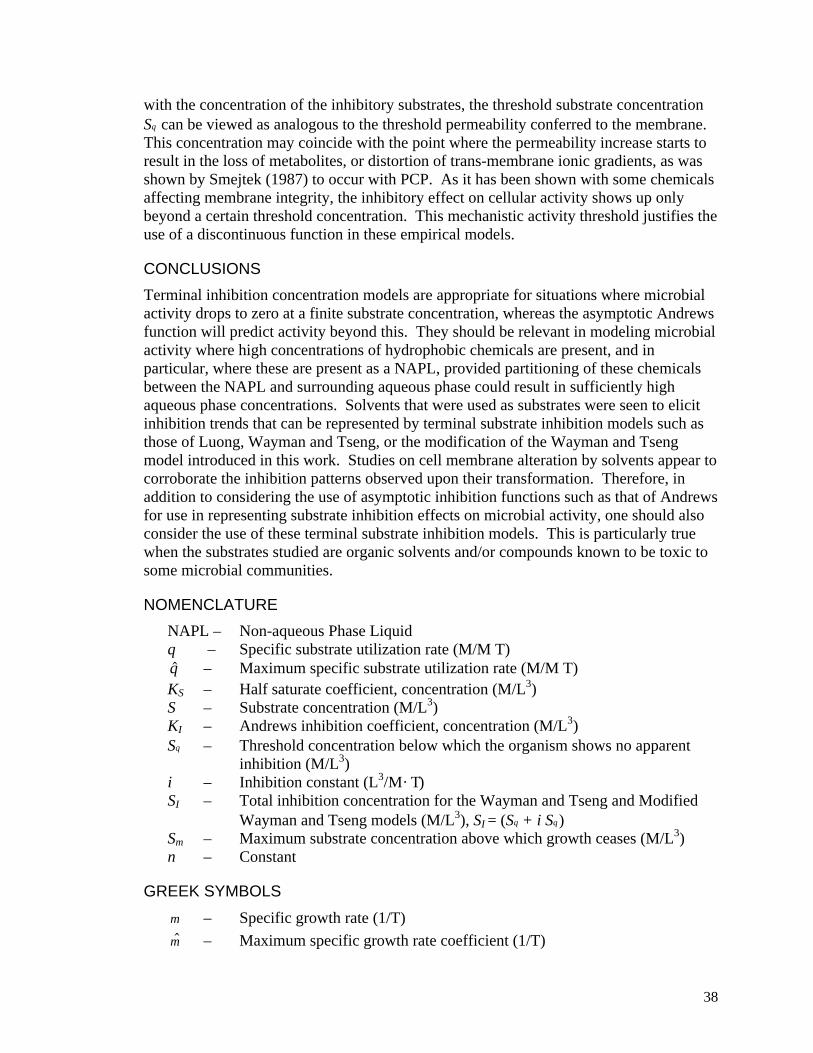
38
with the concentration of the inhibitory substrates, the threshold substrate concentration Sθ can be viewed as analogous to the threshold permeability conferred to the membrane. This concentration may coincide with the point where the permeability increase starts to result in the loss of metabolites, or distortion of trans-membrane ionic gradients, as was shown by Smejtek (1987) to occur with PCP. As it has been shown with some chemicals affecting membrane integrity, the inhibitory effect on cellular activity shows up only beyond a certain threshold concentration. This mechanistic activity threshold justifies the use of a discontinuous function in these empirical models.
CONCLUSIONS
Terminal inhibition concentration models are appropriate for situations where microbial activity drops to zero at a finite substrate concentration, whereas the asymptotic Andrews function will predict activity beyond this. They should be relevant in modeling microbial activity where high concentrations of hydrophobic chemicals are present, and in particular, where these are present as a NAPL, provided partitioning of these chemicals between the NAPL and surrounding aqueous phase could result in sufficiently high aqueous phase concentrations. Solvents that were used as substrates were seen to elicit inhibition trends that can be represented by terminal substrate inhibition models such as those of Luong, Wayman and Tseng, or the modification of the Wayman and Tseng model introduced in this work. Studies on cell membrane alteration by solvents appear to corroborate the inhibition patterns observed upon their transformation. Therefore, in addition to considering the use of asymptotic inhibition functions such as that of Andrews for use in representing substrate inhibition effects on microbial activity, one should also consider the use of these terminal substrate inhibition models. This is particularly true when the substrates studied are organic solvents and/or compounds known to be toxic to some microbial communities.
NOMENCLATURE
NAPL – Non-aqueous Phase Liquid q – Specific substrate utilization rate (M/M T) $q – Maximum specific substrate utilization rate (M/M T)
KS – Half saturate coefficient, concentration (M/L3) S – Substrate concentration (M/L3) KI – Andrews inhibition coefficient, concentration (M/L3) Sθ – Threshold concentration below which the organism shows no apparent
inhibition (M/L3) i – Inhibition constant (L3/M· T) SI – Total inhibition concentration for the Wayman and Tseng and Modified
Wayman and Tseng models (M/L3), SI = (Sθ + i Sθ) Sm – Maximum substrate concentration above which growth ceases (M/L3) n – Constant
GREEK SYMBOLS
µ – Specific growth rate (1/T) $µ – Maximum specific growth rate coefficient (1/T)
39
TASK 2: Development of Experimental Methods for Quantifying Inhibition at High Contaminant Concentrations
INTRODUCTION
Although the automated respirometric techniques have many advantages, when they are used with the high initial substrate concentrations needed to study some types of substrate inhibition, oxygen transfer rate limitations occur during the course of the experiment which invalidate the standard methods of data interpretation (see Smets et al. 1996). This problem occurs for BTEX compounds because for many organisms that degrade these compounds inhibition occurs at high substrate concentrations (Oh et al., 1994).
The magnitude of the limiting oxygen transfer rate is dependent on the particular respirometric equipment used and the conditions of the particular experiment. The dominant characteristic of importance with respect to the equipment is the amount of available mixing power which can be delivered per unit volume of liquid (i.e., the larger the stirrer and the higher the mixing speed, the greater the potential oxygen mass transfer rate). The conditions of the experiment that influence the oxygen mass transfer rate are: temperature, headspace oxygen concentration, and to a lesser extent the salinity of the solution. The only one of these that can readily be changed from experiment to experiment is the headspace oxygen concentration but this comes with the risk of oxygen toxicity (and the potential of creating an explosive mixture of a volatile chemical and oxygen in the reactor headspace). This makes the resultant oxygen uptake data unfit for analysis using methods that rely on use of the full data set (such as those presented by Smets et al., 1996 and Brown et al., 1990).
In this work a method was developed in order to overcome the fact that the high initial substrate concentrations used led to oxygen transfer rate limitations that thus prevented the direct analysis of the complete oxygen uptake curve. Instead the data collected prior to the onset of the oxygen transfer rate limitation was used to obtain single value estimates of the specific growth rates at the initial substrate concentrations used in each experiment. These specific growth rate versus substrate concentration results were then combined with the analysis results obtained from regression of the full oxygen uptake versus time data collected from low (~50 mg COD/L) initial substrate concentration experiments. Together these were used to obtain model parameters describing specific growth rate for substrate concentrations ranging from zero to near aqueous solubility. Initial rate studies on benzene and toluene were carried out at 20 °C with five toluene-degrading strains with toluene and benzene as their sole carbon and energy sources. The specific growth rates of the organisms grown at different aqueous phase substrate concentrations were derived based on mass balance, without any bias towards specific models. Several published substrate inhibition models (see Task 1) were regressed to these data, and evaluated for their efficacies to predict the results obtained based on statistical values. An attempt has been made to correlate observations in this study with the information in the literature by way of providing mechanistic interpretations to the parameters of the models found appropriate to represent the data.
40
RESULTS AND DISCUSSION
Use of Respirometry at Low Initial Substrate Concentrations
Oxygen uptake versus time data obtained from low concentration experiments, where oxygen transfer rate limitations were not apparent, were scrutinized for their suitability to data analysis according to Smets et al. (1996). Acceptable data sets were then analyzed following Naziruddin et al. (1993) with MicroMath Scientist®, a Windows software that can perform non-linear regression. Figure 14 is a sample representation of low substrate concentration data analyzed with Monod equation based on mass balance between oxygen, substrate, biomass, and product concentrations, where (a) is the oxygen uptake data collected along with best fit curve generated by the model; (b) is the distribution of error between the observed oxygen uptake and model calculated values; (c) is oxygen uptake transform plot of oxygen uptake rate versus oxygen uptake values. Note that there is no apparent inhibition (linear increase of oxygen uptake rate) and no mass transfer limitation with oxygen or substrate (no plateau in oxygen uptake rate); and (d) is the calculated specific growth rate versus oxygen uptake value. A horizontal distribution of predicted specific growth rate from 0 to 20 mg/L of oxygen uptake indicates non-inhibitory growth, and a good estimate of initial biomass concentration.
Figure 14. Oxygen uptake data for B. pickettii PK01 grown on 50 mg COD/L toluene. Monod model is fitted to obtain kinetic parameters (a) with the associated error between the data and collected values (b). Transformed oxygen uptake plots are shown in (c) and (d).
41
Use of Respirometry at High Initial Substrate Concentrations
High initial substrate concentrations lead to conditions later in an experiment where a high concentration of active biomass causes the oxygen transfer rate from the headspace into solution to become limiting. The fact that this has occurred in any given experiment is easily determined from an analysis of the oxygen uptake data where the Ou versus time data is used to develop dOu/dt versus Ou and µ versus Ou plots, where dOu/dt is the oxygen uptake rate (mg/L-h), µ is the specific growth rate of the organism (h-1), and Ou is the oxygen uptake (mg/L). Figure 15 contains an example of this behavior. Because the occurrence of this situation represents a non-biological rate limitation, the oxygen uptake data from high initial substrate concentration experiments cannot be analyzed using the method of Naziruddin et al. (1993) and Smets et al. (1996). Instead, a different method had to be derived for analysis of the data from high initial substrate concentration experiments where the only oxygen uptake data that could be used was that collected prior to the onset of the oxygen transfer rate limitation.
The specific growth rate at any given time can be derived directly from oxygen uptake data using the expression:
t0
t
Ou+Yp))-Yg-(1*/Yg)((X(dOu/dt)
=µ Equation 9
where X0 is the initial biomass concentration in mg COD/L, Yg is the growth yield (mg COD of biomass produced/mg substrate COD consumed), and Yp, the product yield (mg COD of metabolic product produced/mg COD substrate consumed). Therefore, provided the estimates of Xo, Yg, and Yp are available, the specific growth rate values can be calculated without prior knowledge of any kinetic parameters such as µ max, KS, KI, etc. This can be used to advantage in overcoming the data analysis problem presented by the oxygen mass transfer limitation.
In this work the values of Xo, Yg, and Yp were obtained from the low initial concentration experiments. This was possible because least one initial concentration experiment was run with the same biomass provided at the same initial biomass concentration and at the same time and each high initial concentration experiment.
Therefore analysis of the data called for the following: Use the low concentration experiment derived values of Xo, Yg, and Yp and Equation 9 to transform of the oxygen uptake versus time data from a high initial concentration experiment to a µ versus Ou plot then use the information provided from that plot to obtain a best estimate of the initial specific growth rate. This specific growth rate value could then be assigned as the specific growth rate at the initial substrate concentration applied to that experiment. Finally, an overall relationship describing specific growth rate as a function of substrate concentration could be obtained by combining the results from several high initial concentration experiments and the specific growth rate versus substrate concentration model found to be applicable at low concentration (from the low initial concentration experiments).
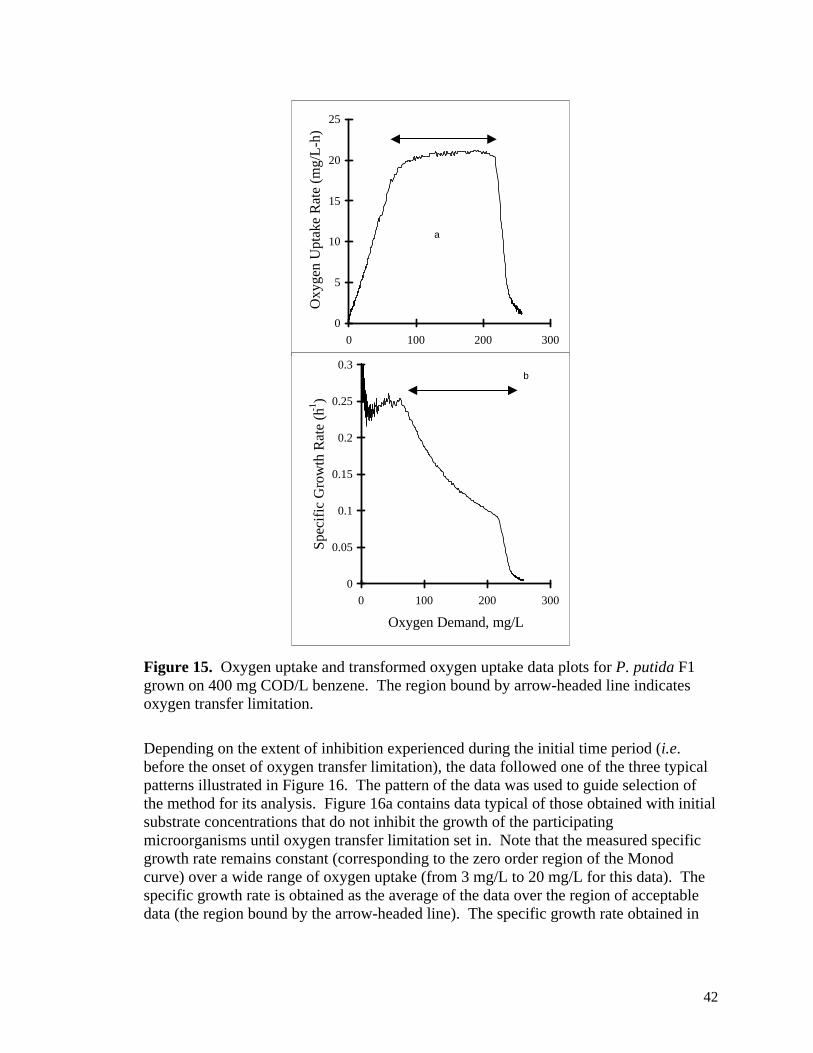
42
0
5
10
15
20
25
0 100 200 300
Oxy
gen
Upt
ake
Rat
e (m
g/L
-h)
a
0
0.05
0.1
0.15
0.2
0.25
0.3
0 100 200 300
Oxygen Demand, mg/L
Spec
ific
Gro
wth
Rat
e (h
-1)
b
Figure 15. Oxygen uptake and transformed oxygen uptake data plots for P. putida F1 grown on 400 mg COD/L benzene. The region bound by arrow-headed line indicates oxygen transfer limitation.
Depending on the extent of inhibition experienced during the initial time period (i.e. before the onset of oxygen transfer limitation), the data followed one of the three typical patterns illustrated in Figure 16. The pattern of the data was used to guide selection of the method for its analysis. Figure 16a contains data typical of those obtained with initial substrate concentrations that do not inhibit the growth of the participating microorganisms until oxygen transfer limitation set in. Note that the measured specific growth rate remains constant (corresponding to the zero order region of the Monod curve) over a wide range of oxygen uptake (from 3 mg/L to 20 mg/L for this data). The specific growth rate is obtained as the average of the data over the region of acceptable data (the region bound by the arrow-headed line). The specific growth rate obtained in
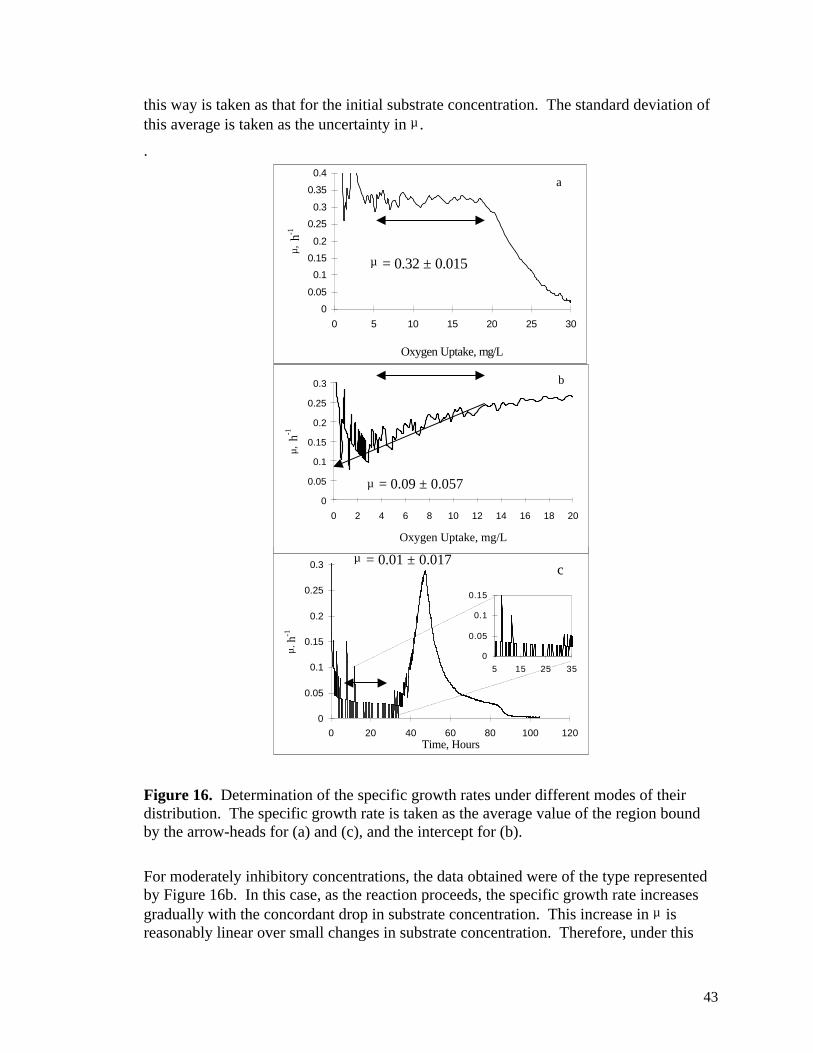
43
this way is taken as that for the initial substrate concentration. The standard deviation of this average is taken as the uncertainty in µ .
.
0
0.05
0.1
0.15
0.2
0.25
0.3
0.35
0.4
0 5 10 15 20 25 30
Oxygen Uptake, mg/L
µ, h
-1
a
µ = 0.32 ± 0.015
0
0.05
0.1
0.15
0.2
0.25
0.3
0 20 40 60 80 100 120Time, Hours
µ, h
-1
cµ = 0.01 ± 0.017
0
0.05
0.1
0.15
0.2
0.25
0.3
0 2 4 6 8 10 12 14 16 18 20
Oxygen Uptake, mg/L
µ, h
-1
b
µ = 0.09 ± 0.057
0
0.05
0.1
0.15
5 15 25 35
Figure 16. Determination of the specific growth rates under different modes of their distribution. The specific growth rate is taken as the average value of the region bound by the arrow-heads for (a) and (c), and the intercept for (b).
For moderately inhibitory concentrations, the data obtained were of the type represented by Figure 16b. In this case, as the reaction proceeds, the specific growth rate increases gradually with the concordant drop in substrate concentration. This increase in µ is reasonably linear over small changes in substrate concentration. Therefore, under this
44
condition, the µ vs oxygen uptake data can be used to calculate µ at S0 as the Y-intercept from linear regression of a region of acceptable quality. For the data given in Figure 16b the acceptable data lies between 2 and 12 mg/L. The uncertainty for µ was taken as the standard error of the Y-intercept.
Under highly inhibitory conditions, the specific growth rate remains relatively constant (and close to zero) for a substantial length of time before enough substrate is depleted to cause decreased inhibition and a steady increase in µ (Figure 16c). In this case, the data interpretation is performed using a µ vs. time plot. The µ at S0 is taken as the mean over the full range of the acceptable data. For the data given in Figure 16c, the region used ranged from 5 to 35 hours (see inset). The uncertainty in µ is taken as the standard deviation of the mean.
With most of the data studied, sharp deviation in oxygen uptake rate (correspondingly, the specific growth rate) is observed for a short duration before it reaches consistency. This could be due to equilibration of the volatile substrate between the liquid and gas phases, equilibration of temperature, equilibration of CO2 and moisture with soda lime, or error associated with the estimate of initial biomass concentration (Smets et al. 1996). This condition is not likely to affect the overall quality of the calculated value, considering the frequency at which the data were being collected.
Data on specific growth rates for the pure cultures grown on various initial concentrations of benzene and toluene were fitted with some of the substrate inhibition models in the literature. MicroMath Scientist
(MicroMath Scientific Software, Salt Lake City, Utah,
USA), a Windows® software, was used for this purpose. The µ max and KS values obtained from low substrate concentration experiments (where no inhibition occurred) were used as the initial input data. All the experiments were carried out at 20 °C, and non-dimensional Henry’s law coefficients of 0.185 and 0.23 (concentration in air/concentration in water) were used for benzene and toluene, respectively, for data analysis.
Task 3: Use Of Pure Culture Benzene And Toluene Degrading Cultures To Investigate Inhibition At High Contaminant Concentrations
METHODOLOGY
Chemicals
The substrates used, benzene and toluene, were reagent grade or better obtained from Fisher Scientific. The properties used for these chemicals included dimensionless Henry’s Law coefficients of 0.185 and 0.23, respectively at 20 °C (Turner, 1995), and formula COD (mass of oxygen required to oxidize a unit mass of the compound, g/g) of 3.076 and 3.13, respectively.
Growth of inoculum
Pure cultures of toluene degrading strains (Pseudomonas putida F1, P. putida mt2, and P. mendocina KR from Dr. Gerben Zylstra at Rutgers University, Ralstonia (formerly
45
Burkholderia) pickettii PKO1 from Dr. Jerome Kukor at Rutgers University, and B. cepacia G4 from Dr. Malcolm Shields at University of West Florida) were maintained as frozen cultures at -70 °C. These strains differ in the position of their initial oxygenase attack (Zylstra, 1994). Every 3-4 months, frozen samples were revived by transfer to R2A agar plates incubated at 30 °C. Single colonies from the R2A plates were streaked on to Daigger mineral salts (DMS; Daigger, 1979) agar plates and grown in desiccator chambers (without any desiccant) containing an open container of neat toluene to provide vapor phase toluene as their sole carbon and energy source. The mineral medium was composed of: 20 mg/L CaCl2; 15 mg/L FeCl3.6H2O; 1.5 mg/L CoCl2.6H2O; 1.5 mg/L ZnCl2; 0.5 mg/L CuCl2.2H2O; 0.15mg/L H3BO3; 0.03mL/L conc. HCl; 150 mg/L MgSO4.7H2O; 4.5 mg/L MnSO4.H2O; 0.5 mg/L Na2MoO4.2H2O; 4.35 g/L K2HPO4; 3.4 g/L KH2PO4; 1.012 g/L NH4Cl. The agar medium was prepared with 1.5% Bacto agar in the above-mentioned mineral medium. To minimize premature drying of the agar plates, a container of water was also located in the glass desiccator. The colonies grown on toluene were transferred to batch respirometer vessels with DMS medium and either benzene or toluene (50 mg COD/L; 16.25 mg/L benzene, 15.97 mg/L toluene; 0.208 mM benzene, 0.174 mM toluene) as the sole carbon and energy source. The liquid seed cultures thus initiated were allowed to proceed until the late log phase, just before the substrate in the system was completely utilized. This was possible by constant monitoring of the oxygen uptake rate of the seed culture reactor; when the substrate concentration approaches the half saturation value, the oxygen uptake rate (which is related to specific growth rate) drops rapidly, at which point the biomass is removed and used as inoculum. This step ensures maximum activity and acclimation to the substrate (Thouand et al., 1996), which is required for intrinsic kinetics characterization. Care was taken to avoid the onset of decay, for it would reduce the active biomass concentration below what was expected, as well as the fraction of active biomass present.
RESULTS AND DISCUSSION
Low concentration - Monod kinetics
Experiments with target initial biomass concentrations of 2.5 mg COD/L and initial substrate concentrations of 50 mg COD/L and higher were started simultaneously with equivalent amounts of a common inoculum. Oxygen uptake data from the 50 mg COD/L substrate was used to calculate the intrinsic, non-inhibitory Monod kinetic parameters, Yg, b, µ max, KS, and Xo, where b is the decay co-efficient (h-1) and KS is the half saturation constant (mg COD/L). Parameters obtained for all five strains studied when grown on benzene and toluene as the sole carbon and energy source are given in Table 4. The Monod parameters for the bacterial strains studied in this work fall within the range for typical BTEX degraders (Goudar and Strevett, 1998).
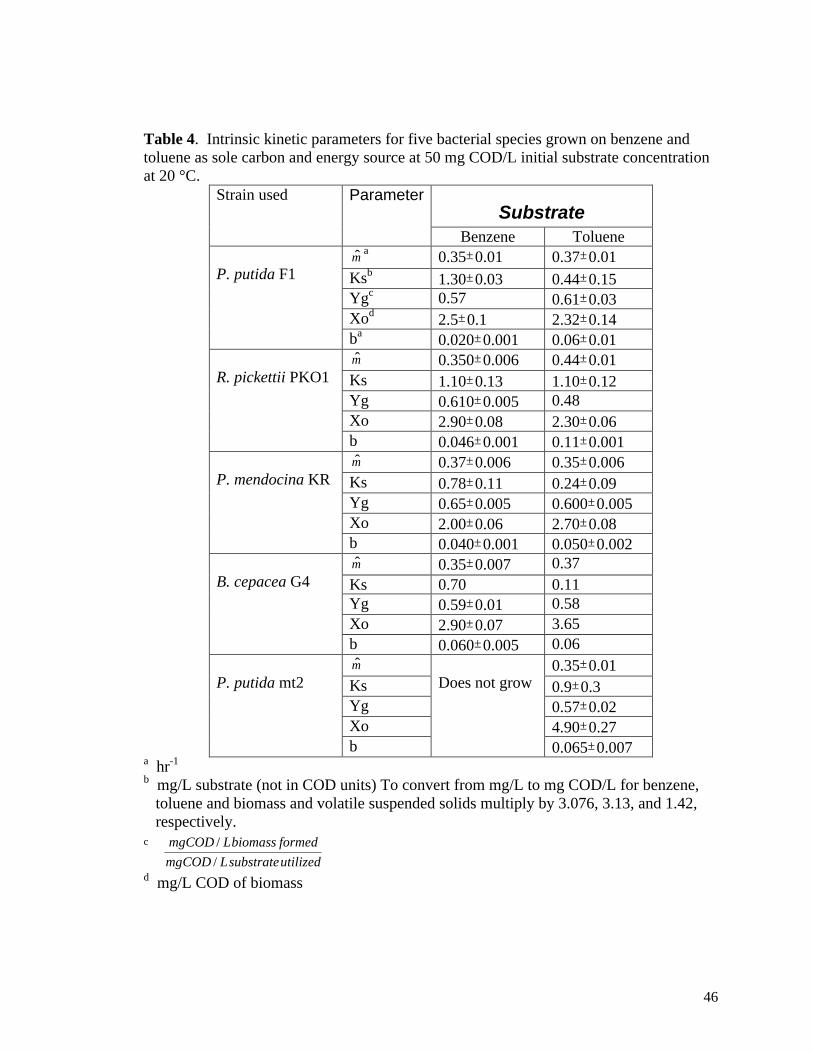
46
Table 4. Intrinsic kinetic parameters for five bacterial species grown on benzene and toluene as sole carbon and energy source at 50 mg COD/L initial substrate concentration at 20 °C.
Substrate Strain used Parameter
Benzene Toluene µ̂ a 0.35±0.01 0.37±0.01 Ksb 1.30±0.03 0.44±0.15 Ygc 0.57 0.61±0.03 Xod 2.5±0.1 2.32±0.14
P. putida F1
ba 0.020±0.001 0.06±0.01 µ̂ 0.350±0.006 0.44±0.01 Ks 1.10±0.13 1.10±0.12 Yg 0.610±0.005 0.48 Xo 2.90±0.08 2.30±0.06
R. pickettii PKO1
b 0.046±0.001 0.11±0.001 µ̂ 0.37±0.006 0.35±0.006 Ks 0.78±0.11 0.24±0.09 Yg 0.65±0.005 0.600±0.005 Xo 2.00±0.06 2.70±0.08
P. mendocina KR
b 0.040±0.001 0.050±0.002 µ̂ 0.35±0.007 0.37 Ks 0.70 0.11 Yg 0.59±0.01 0.58 Xo 2.90±0.07 3.65
B. cepacea G4
b 0.060±0.005 0.06 µ̂ 0.35±0.01 Ks 0.9±0.3 Yg 0.57±0.02 Xo 4.90±0.27
P. putida mt2
b
Does not grow
0.065±0.007 a hr-1
b mg/L substrate (not in COD units) To convert from mg/L to mg COD/L for benzene, toluene and biomass and volatile suspended solids multiply by 3.076, 3.13, and 1.42, respectively.
c
utilizedsubstrateLCODmg
formedbiomassLCODmg
/
/
d mg/L COD of biomass
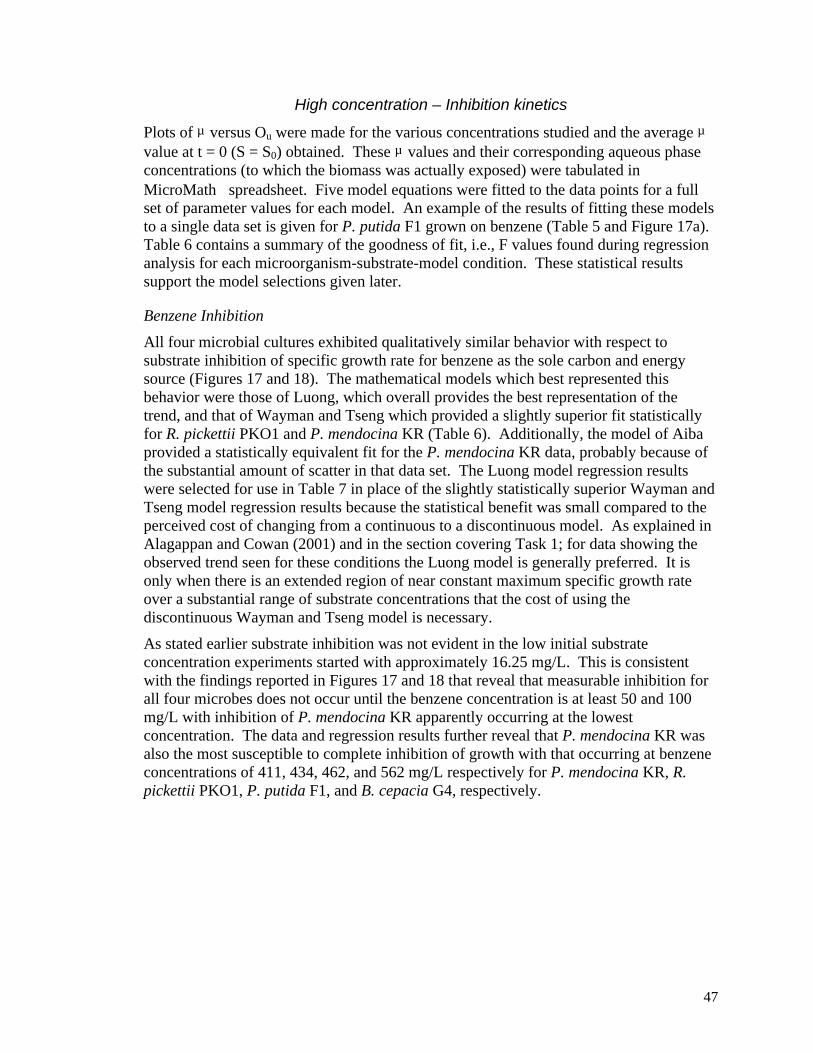
47
High concentration – Inhibition kinetics
Plots of µ versus Ou were made for the various concentrations studied and the average µ value at t = 0 (S = S0) obtained. These µ values and their corresponding aqueous phase concentrations (to which the biomass was actually exposed) were tabulated in MicroMath
spreadsheet. Five model equations were fitted to the data points for a full
set of parameter values for each model. An example of the results of fitting these models to a single data set is given for P. putida F1 grown on benzene (Table 5 and Figure 17a). Table 6 contains a summary of the goodness of fit, i.e., F values found during regression analysis for each microorganism-substrate-model condition. These statistical results support the model selections given later.
Benzene Inhibition
All four microbial cultures exhibited qualitatively similar behavior with respect to substrate inhibition of specific growth rate for benzene as the sole carbon and energy source (Figures 17 and 18). The mathematical models which best represented this behavior were those of Luong, which overall provides the best representation of the trend, and that of Wayman and Tseng which provided a slightly superior fit statistically for R. pickettii PKO1 and P. mendocina KR (Table 6). Additionally, the model of Aiba provided a statistically equivalent fit for the P. mendocina KR data, probably because of the substantial amount of scatter in that data set. The Luong model regression results were selected for use in Table 7 in place of the slightly statistically superior Wayman and Tseng model regression results because the statistical benefit was small compared to the perceived cost of changing from a continuous to a discontinuous model. As explained in Alagappan and Cowan (2001) and in the section covering Task 1; for data showing the observed trend seen for these conditions the Luong model is generally preferred. It is only when there is an extended region of near constant maximum specific growth rate over a substantial range of substrate concentrations that the cost of using the discontinuous Wayman and Tseng model is necessary.
As stated earlier substrate inhibition was not evident in the low initial substrate concentration experiments started with approximately 16.25 mg/L. This is consistent with the findings reported in Figures 17 and 18 that reveal that measurable inhibition for all four microbes does not occur until the benzene concentration is at least 50 and 100 mg/L with inhibition of P. mendocina KR apparently occurring at the lowest concentration. The data and regression results further reveal that P. mendocina KR was also the most susceptible to complete inhibition of growth with that occurring at benzene concentrations of 411, 434, 462, and 562 mg/L respectively for P. mendocina KR, R. pickettii PKO1, P. putida F1, and B. cepacia G4, respectively.
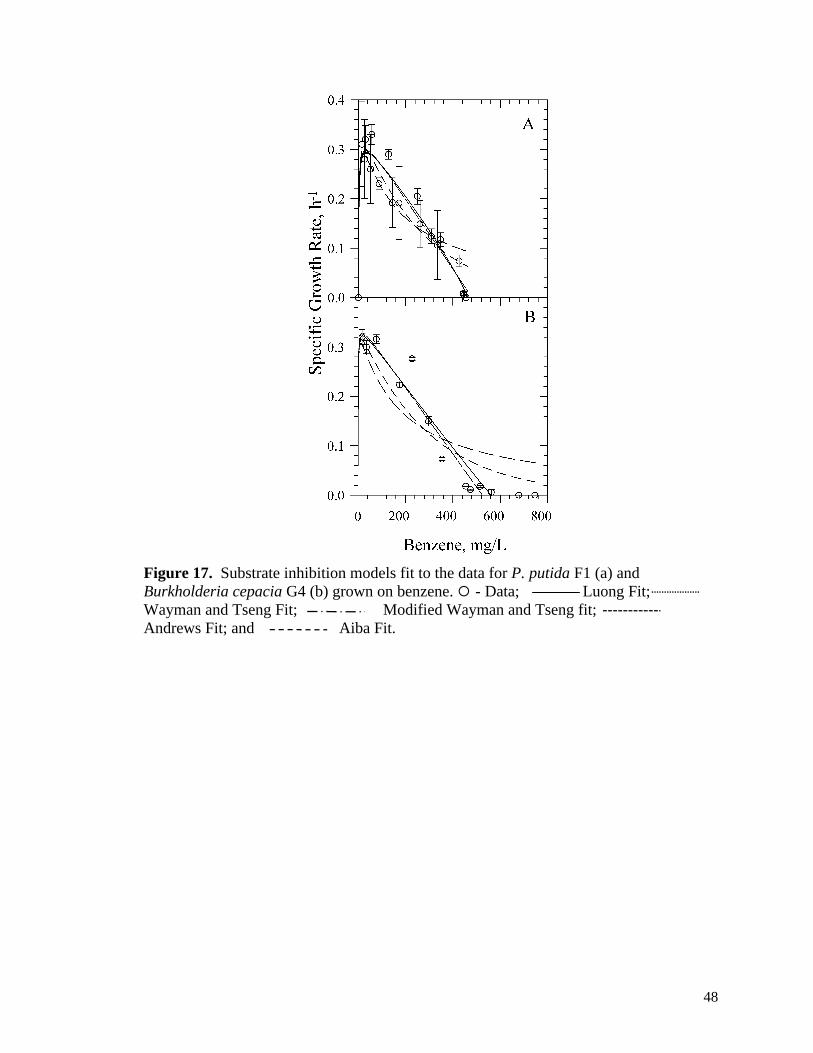
48
Figure 17. Substrate inhibition models fit to the data for P. putida F1 (a) and Burkholderia cepacia G4 (b) grown on benzene. ¡ - Data; Luong Fit; Wayman and Tseng Fit; Modified Wayman and Tseng fit; Andrews Fit; and Aiba Fit.
49
Figure 18. Benzene inhibition data for B. pickettii PK01(a) and P. mendocina KR (b) fit by Luong model.
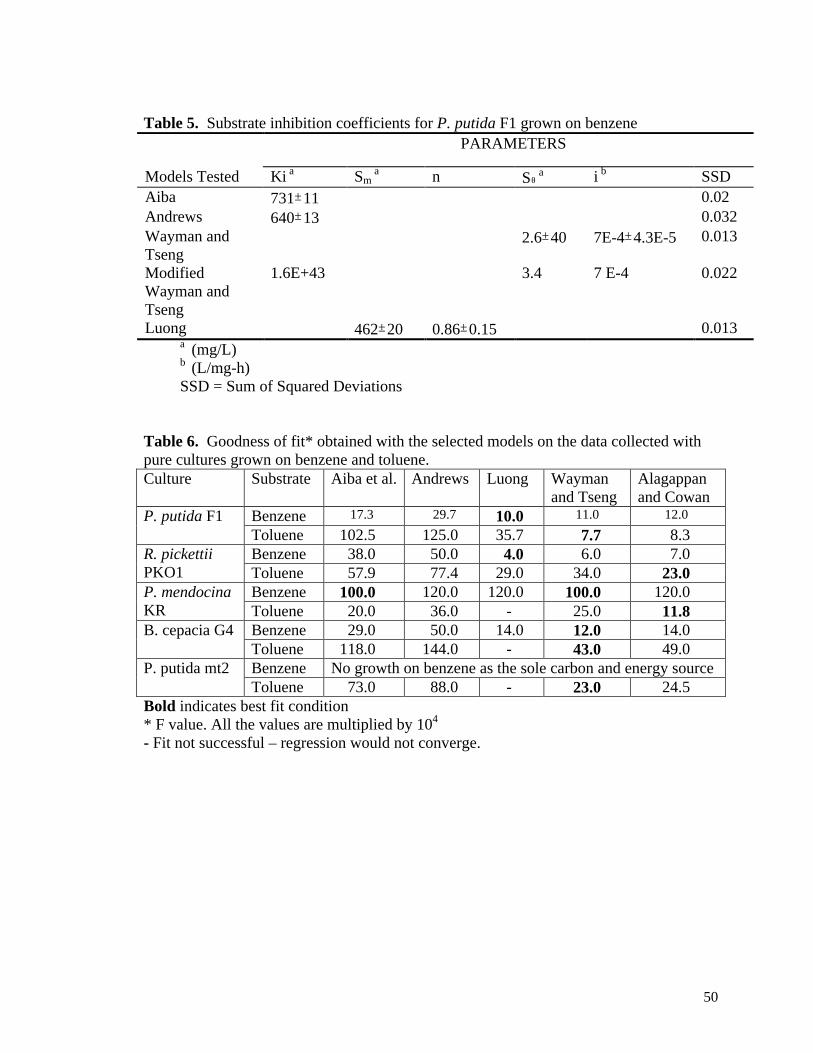
50
Table 5. Substrate inhibition coefficients for P. putida F1 grown on benzene PARAMETERS
Models Tested Ki a Sm a n Sθ
a i b SSD Aiba 731±11 0.02 Andrews 640±13 0.032 Wayman and Tseng
2.6±40 7E-4±4.3E-5 0.013
Modified Wayman and Tseng
1.6E+43 3.4 7 E-4 0.022
Luong 462±20 0.86±0.15 0.013 a (mg/L) b (L/mg-h) SSD = Sum of Squared Deviations
Table 6. Goodness of fit* obtained with the selected models on the data collected with pure cultures grown on benzene and toluene. Culture Substrate Aiba et al. Andrews Luong Wayman
and Tseng Alagappan and Cowan
Benzene 17.3 29.7 10.0 11.0 12.0 P. putida F1 Toluene 102.5 125.0 35.7 7.7 8.3 Benzene 38.0 50.0 4.0 6.0 7.0 R. pickettii
PKO1 Toluene 57.9 77.4 29.0 34.0 23.0 Benzene 100.0 120.0 120.0 100.0 120.0 P. mendocina
KR Toluene 20.0 36.0 - 25.0 11.8 Benzene 29.0 50.0 14.0 12.0 14.0 B. cepacia G4 Toluene 118.0 144.0 - 43.0 49.0 Benzene No growth on benzene as the sole carbon and energy source P. putida mt2 Toluene 73.0 88.0 - 23.0 24.5
Bold indicates best fit condition * F value. All the values are multiplied by 104 - Fit not successful – regression would not converge.
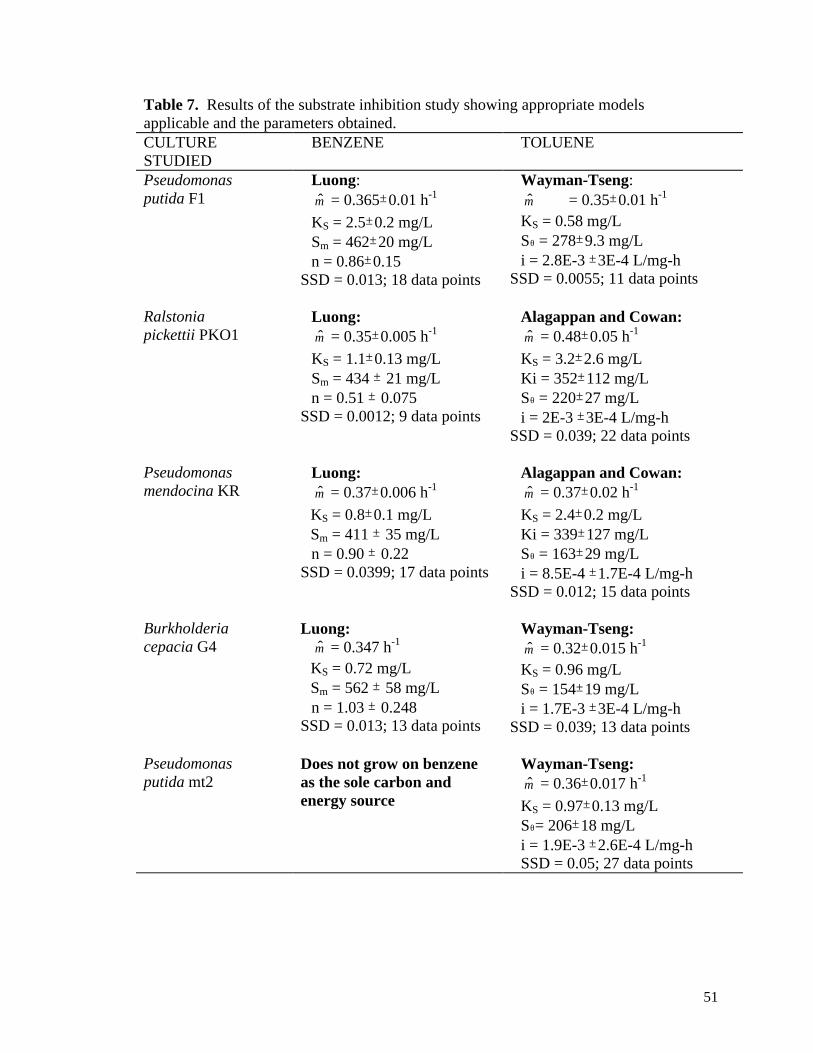
51
Table 7. Results of the substrate inhibition study showing appropriate models applicable and the parameters obtained. CULTURE STUDIED
BENZENE TOLUENE
Pseudomonas putida F1
Luong: µ̂ = 0.365±0.01 h-1
KS = 2.5±0.2 mg/L Sm = 462±20 mg/L n = 0.86±0.15
SSD = 0.013; 18 data points
Wayman-Tseng: µ̂ = 0.35±0.01 h-1
KS = 0.58 mg/L Sθ = 278±9.3 mg/L i = 2.8E-3 ±3E-4 L/mg-h
SSD = 0.0055; 11 data points
Ralstonia pickettii PKO1
Luong: µ̂ = 0.35±0.005 h-1
KS = 1.1±0.13 mg/L Sm = 434 ± 21 mg/L n = 0.51 ± 0.075
SSD = 0.0012; 9 data points
Alagappan and Cowan: µ̂ = 0.48±0.05 h-1
KS = 3.2±2.6 mg/L Ki = 352±112 mg/L Sθ = 220±27 mg/L i = 2E-3 ±3E-4 L/mg-h
SSD = 0.039; 22 data points
Pseudomonas mendocina KR
Luong: µ̂ = 0.37±0.006 h-1
KS = 0.8±0.1 mg/L Sm = 411 ± 35 mg/L n = 0.90 ± 0.22
SSD = 0.0399; 17 data points
Alagappan and Cowan: µ̂ = 0.37±0.02 h-1
KS = 2.4±0.2 mg/L Ki = 339±127 mg/L Sθ = 163±29 mg/L i = 8.5E-4 ±1.7E-4 L/mg-h
SSD = 0.012; 15 data points
Burkholderia cepacia G4
Luong: µ̂ = 0.347 h-1
KS = 0.72 mg/L Sm = 562 ± 58 mg/L n = 1.03 ± 0.248
SSD = 0.013; 13 data points
Wayman-Tseng: µ̂ = 0.32±0.015 h-1
KS = 0.96 mg/L Sθ = 154±19 mg/L i = 1.7E-3 ±3E-4 L/mg-h
SSD = 0.039; 13 data points
Pseudomonas putida mt2
Does not grow on benzene as the sole carbon and energy source
Wayman-Tseng: µ̂ = 0.36±0.017 h-1
KS = 0.97±0.13 mg/L Sθ= 206±18 mg/L i = 1.9E-3 ±2.6E-4 L/mg-h SSD = 0.05; 27 data points
52
Toluene Inhibition
For toluene, all five tested strains showed a definite concentration beyond which the growth rate drops precipitously to no activity level is apparent (Figures 19 and 20). These data were best represented by model equations that contain a discontinuity at the threshold concentration (Sθ), beyond which the nature of the effect of increasing substrate concentration appears to change drastically. In the case of P. putida F1, P. putida mt2, and B. cepacia G4, no inhibition was apparent up to about 280 mg/L, 206 mg/L, and 155 mg/L of toluene, respectively (Table 7). The non-inhibitory Monod model adequately represented the data collected for these pure cultures up to their respective threshold concentrations. Above these threshold values, µ decreased rapidly with the increase in toluene concentration to the point where the activity stopped (Figure 19). The second part of the model proposed by Wayman and Tseng (1976) explained this condition fairly well, with the Monod function (the first part of this model) describing the initial uninhibited region. The activities were predicted to stop at 396, 333, and 403 mg/L, respectively, which are very close to the concentrations observed at which no growth occurred. A similar trend in biotransformation kinetics has been reported by Hack et al. (2000) with P. putida UV4, which hydroxylates toluene to toluene cis-glycol (Figure 21). In this data, a first order reaction rate region, followed by zero order region extending up to 220 mg/L toluene is clearly discernible. Beyond this threshold concentration, the rate drops rapidly until the activity ceases at a concentration corresponding to 276 mg/L toluene.
In the cases of R. pickettii PKO1 and P. mendocina KR, a similar condition is observable with high toluene concentrations, except that the region before the threshold concentration showed a gradual drop in activity (Figure 20). The Wayman and Tseng equation cannot model this behavior. The modified Wayman and Tseng equation (Equation 8), introduced by Alagappan and Cowan (2001) – see Task 1 section - with Andrews function in place of the Monod function, worked well to describe this data (Table 7). Statistically, the models proposed by either Wayman and Tseng (1976) or its modification proposed by Alagappan and Cowan (2001) best represented all the toluene inhibition data shown in this study (Table 6).
DISCUSSION
With toluene, all the strains studied displayed an abrupt drop in activity before the critical substrate concentration. This characteristic is suggestive of the dominant mechanism by which toluene exerts toxicity on the cells, permeabilization of the cell membrane (Heipieper et al., 1994; Sikkema et al., 1994). This possibility has not been verified with the cultures exposed to high toluene concentrations in this study, which could be done by microscopic or fatty acid analyses.
In the literature on toluene as a substrate for microbial growth, one can observe a lack of consensus regarding the effect of high concentrations on growth kinetics. Some researchers have reported that the Andrews inhibition model provided an acceptable fit for their data (Choi et al., 1992; Oh et al., 1994; Mirpuri et al., 1997). Others reported they did not observe significant inhibition and therefore used a non-inhibitory Monod equation (Chang et al., 1993; Pedersen et al., 1997; Reardon et al., 2000). These results support the observation in this study that below some threshold concentration, toluene
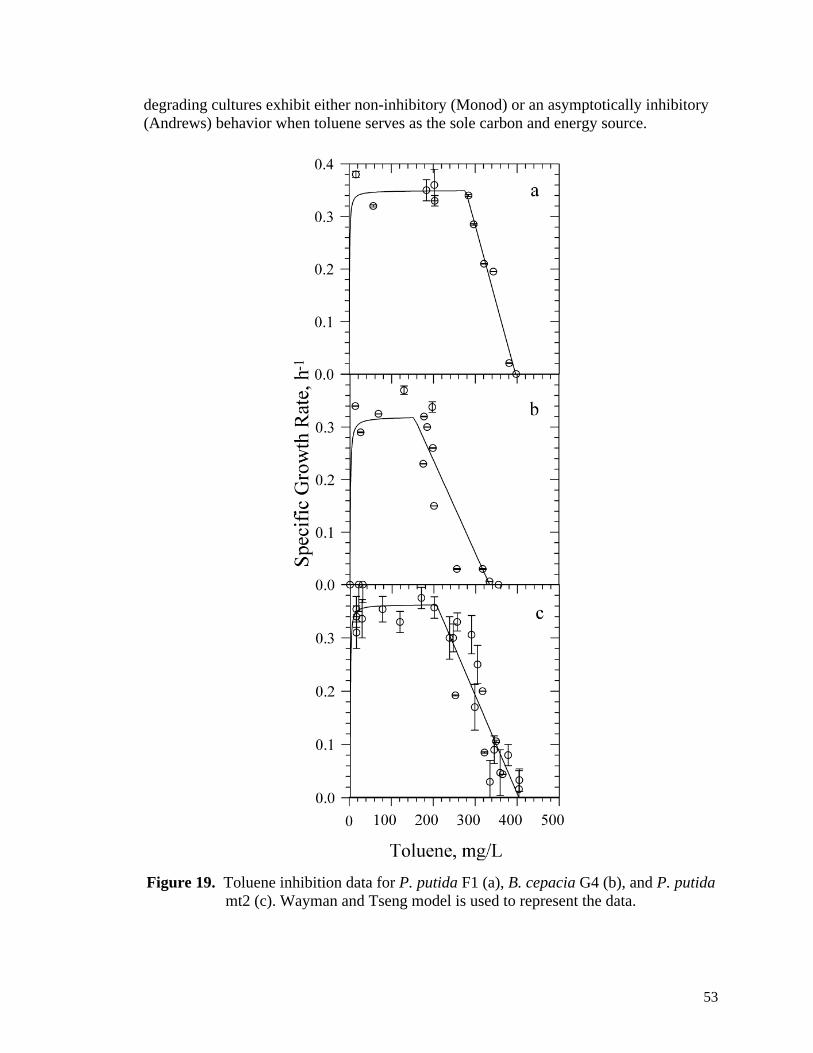
53
degrading cultures exhibit either non-inhibitory (Monod) or an asymptotically inhibitory (Andrews) behavior when toluene serves as the sole carbon and energy source.
Figure 19. Toluene inhibition data for P. putida F1 (a), B. cepacia G4 (b), and P. putida
mt2 (c). Wayman and Tseng model is used to represent the data.
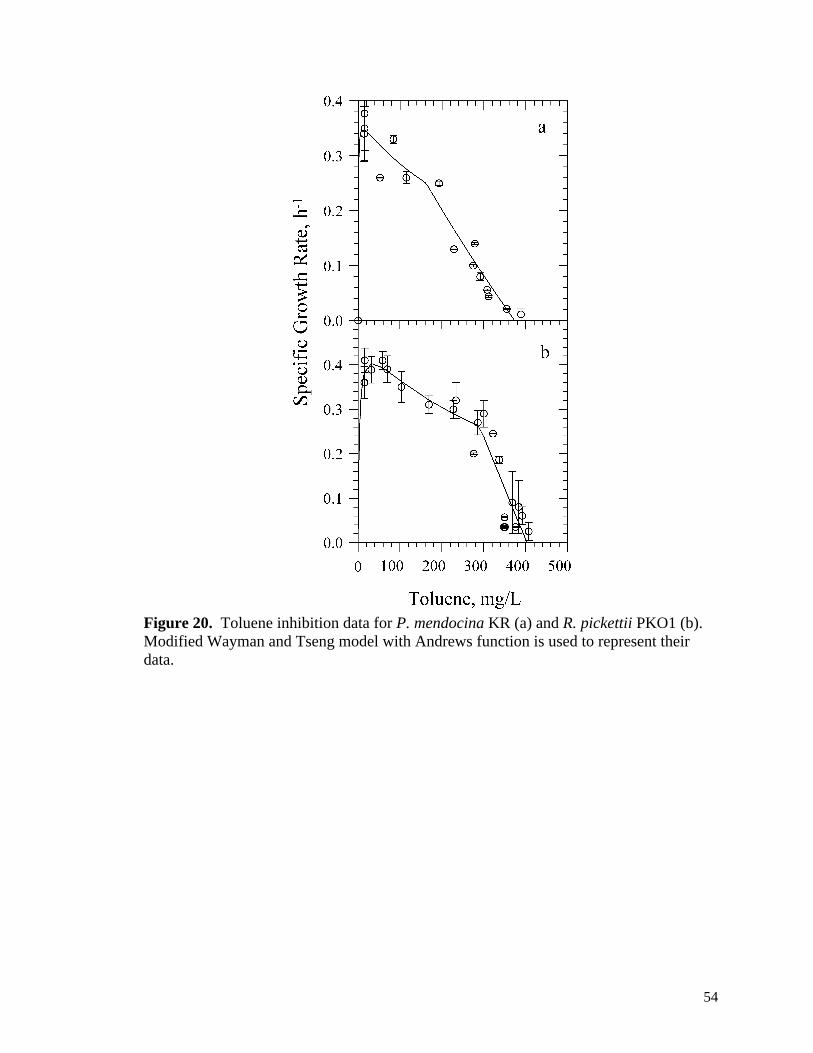
54
Figure 20. Toluene inhibition data for P. mendocina KR (a) and R. pickettii PKO1 (b). Modified Wayman and Tseng model with Andrews function is used to represent their data.
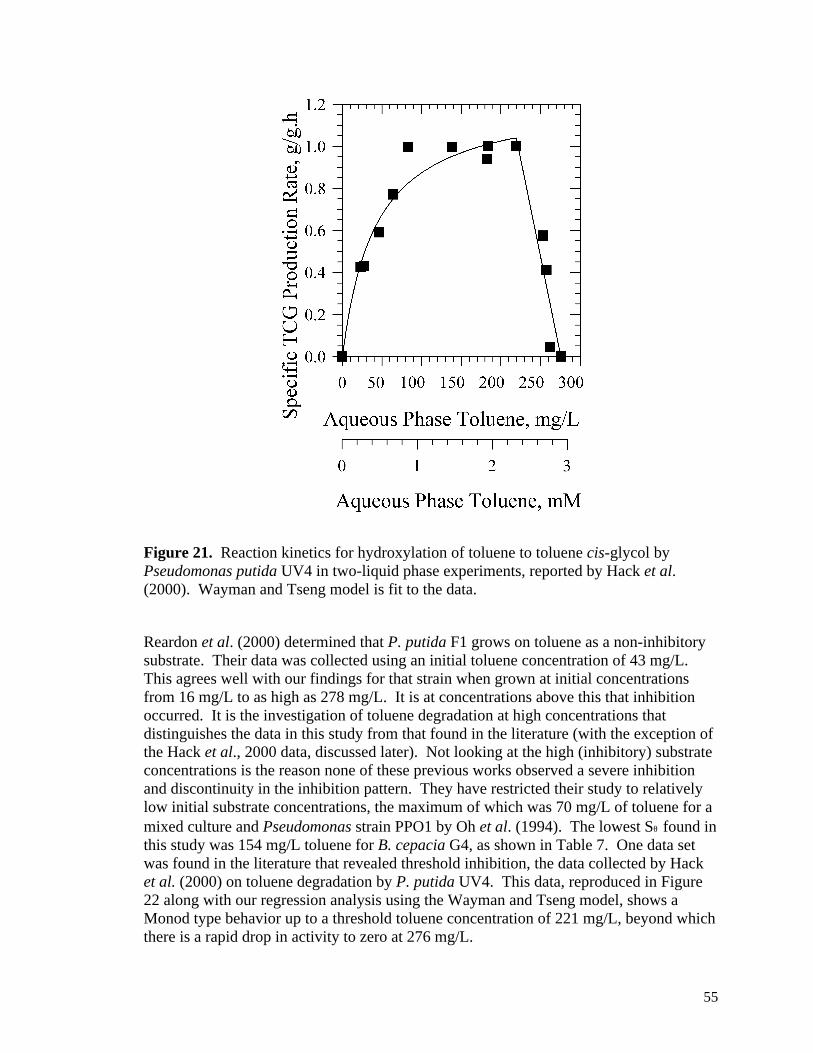
55
Figure 21. Reaction kinetics for hydroxylation of toluene to toluene cis-glycol by Pseudomonas putida UV4 in two-liquid phase experiments, reported by Hack et al. (2000). Wayman and Tseng model is fit to the data.
Reardon et al. (2000) determined that P. putida F1 grows on toluene as a non-inhibitory substrate. Their data was collected using an initial toluene concentration of 43 mg/L. This agrees well with our findings for that strain when grown at initial concentrations from 16 mg/L to as high as 278 mg/L. It is at concentrations above this that inhibition occurred. It is the investigation of toluene degradation at high concentrations that distinguishes the data in this study from that found in the literature (with the exception of the Hack et al., 2000 data, discussed later). Not looking at the high (inhibitory) substrate concentrations is the reason none of these previous works observed a severe inhibition and discontinuity in the inhibition pattern. They have restricted their study to relatively low initial substrate concentrations, the maximum of which was 70 mg/L of toluene for a mixed culture and Pseudomonas strain PPO1 by Oh et al. (1994). The lowest Sθ found in this study was 154 mg/L toluene for B. cepacia G4, as shown in Table 7. One data set was found in the literature that revealed threshold inhibition, the data collected by Hack et al. (2000) on toluene degradation by P. putida UV4. This data, reproduced in Figure 22 along with our regression analysis using the Wayman and Tseng model, shows a Monod type behavior up to a threshold toluene concentration of 221 mg/L, beyond which there is a rapid drop in activity to zero at 276 mg/L.
56
Mechanisms of benzene and toluene toxicity on cells
Reduction in the metabolic activity due to alteration of cell membrane permeability has been well recognized (Edwards, 1970). Toluene has been conventionally used by researchers to increase cell permeability for in situ enzymatic and physiological studies on cells (Sikkema et al., 1995). Exposure to 1% toluene has been shown to remove considerable amounts of protein, phospholipid, and polysaccharides from cells (de Smet et al., 1978), particularly from the cytoplasmic membrane. Toluene treatment has also been shown to destroy the fracture plane through the cytoplasmic membrane by disorganizing the bilayer structure, removing phospholipids. Besides the loss of cell envelope components, several intracellular proteins like malate dehydrogenase were also found to be lost due to increased permeabilization. These lead to loss of the enzyme functions, and ultimately complete inactivation of the cells.
Benzene, a less apolar solvent than toluene, has also been reported to bring about modifications in membrane permeability, lipid solubilization, adsorption to and inactivation of proteins, and aberrations in DNA molecules, besides other effects (Yarmoff et al., 1988). Most of the studies on benzene toxicity focused on mammalian systems, where the effect seems to be caused by benzene metabolites. Benzenetriol and benzoquinone, two such metabolic products, have been implicated in DNA damage, with ED50 values of 6.94 and 0.27 mg/L respectively (Pellack-Walker and Blumer, 1986). Another mechanism proposed to explain benzene toxicity is based on the sensitivity of metalloproteins to oxidants (Yarmoff et al., 1988). The inactivation of benzene dioxygenase would be consistent with this mechanism of toxicity. Finally, the formation of superoxide radicals and hydroxyl (OH.) radicals at high benzene concentrations has been reported (Snyder et al., 1993; Shen et al, 1996).
In summary, benzene and toluene have been reported to exert various mechanisms of cell inhibition/toxicity at both cellular and sub-cellular (i.e., molecular) levels.
Benzene, on the other hand, might involve various inhibitory mechanisms in a synergistic fashion. It is possible that with increasing concentrations, different effects come into play, leading to a gradual increase in the magnitude of inhibition. A mechanistic interpretation could thus make an otherwise empirical model more meaningful in explaining substrate inhibition.
CONCLUSIONS
In general, all the data sets obtained in this study conformed to substrate inhibition models predicting a definite substrate concentration (within the solubility limit) at which growth stops. Asymptotic models such as the popular inhibition model of Andrews are clearly not appropriate for representing this behavior. Therefore, while the asymptotic model may be applicable up to certain concentrations (as shown by Yerushalmi and Guiot, 1998) or for some substrates, they cannot be used to represent the data for other compounds, such as benzene and toluene, over the entire concentration range at which activity occurs. The more complex Luong, Wayman and Tseng, modified Wayman and Tseng models were found to be effective for representing this data. Finally, the known mechanisms of toluene and benzene toxicity appear consistent with the observed
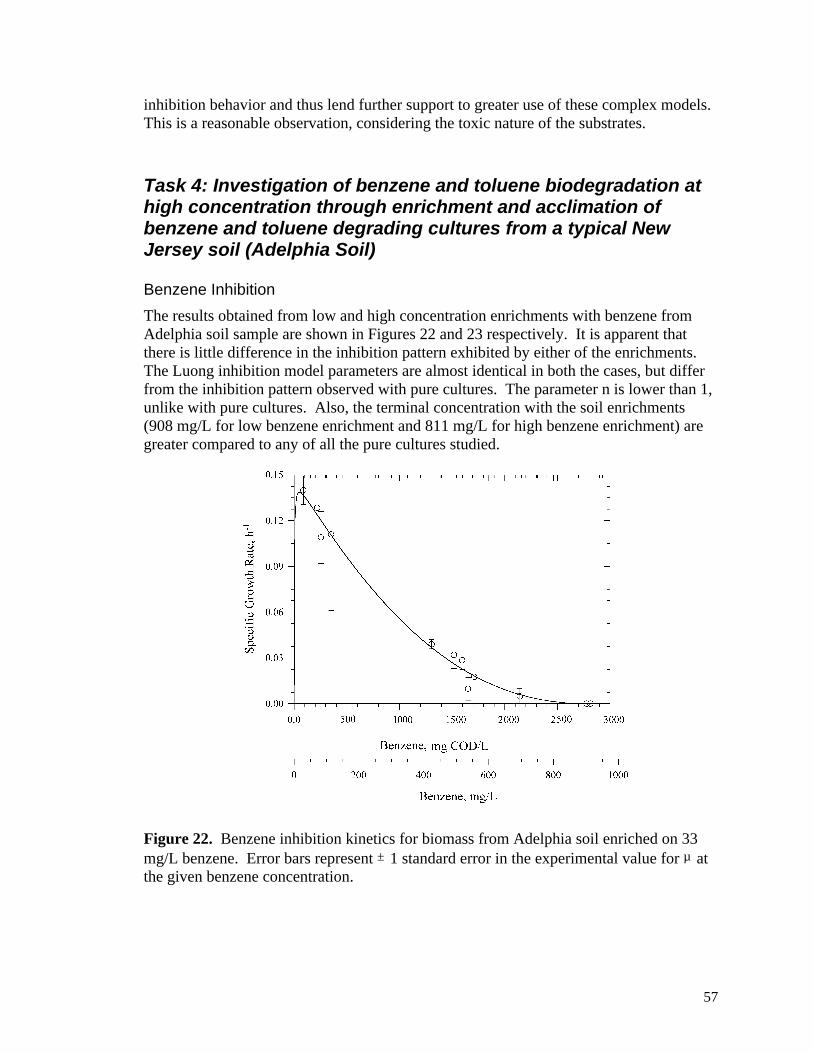
57
inhibition behavior and thus lend further support to greater use of these complex models. This is a reasonable observation, considering the toxic nature of the substrates.
Task 4: Investigation of benzene and toluene biodegradation at high concentration through enrichment and acclimation of benzene and toluene degrading cultures from a typical New Jersey soil (Adelphia Soil)
Benzene Inhibition
The results obtained from low and high concentration enrichments with benzene from Adelphia soil sample are shown in Figures 22 and 23 respectively. It is apparent that there is little difference in the inhibition pattern exhibited by either of the enrichments. The Luong inhibition model parameters are almost identical in both the cases, but differ from the inhibition pattern observed with pure cultures. The parameter n is lower than 1, unlike with pure cultures. Also, the terminal concentration with the soil enrichments (908 mg/L for low benzene enrichment and 811 mg/L for high benzene enrichment) are greater compared to any of all the pure cultures studied.
Figure 22. Benzene inhibition kinetics for biomass from Adelphia soil enriched on 33 mg/L benzene. Error bars represent ± 1 standard error in the experimental value for µ at the given benzene concentration.
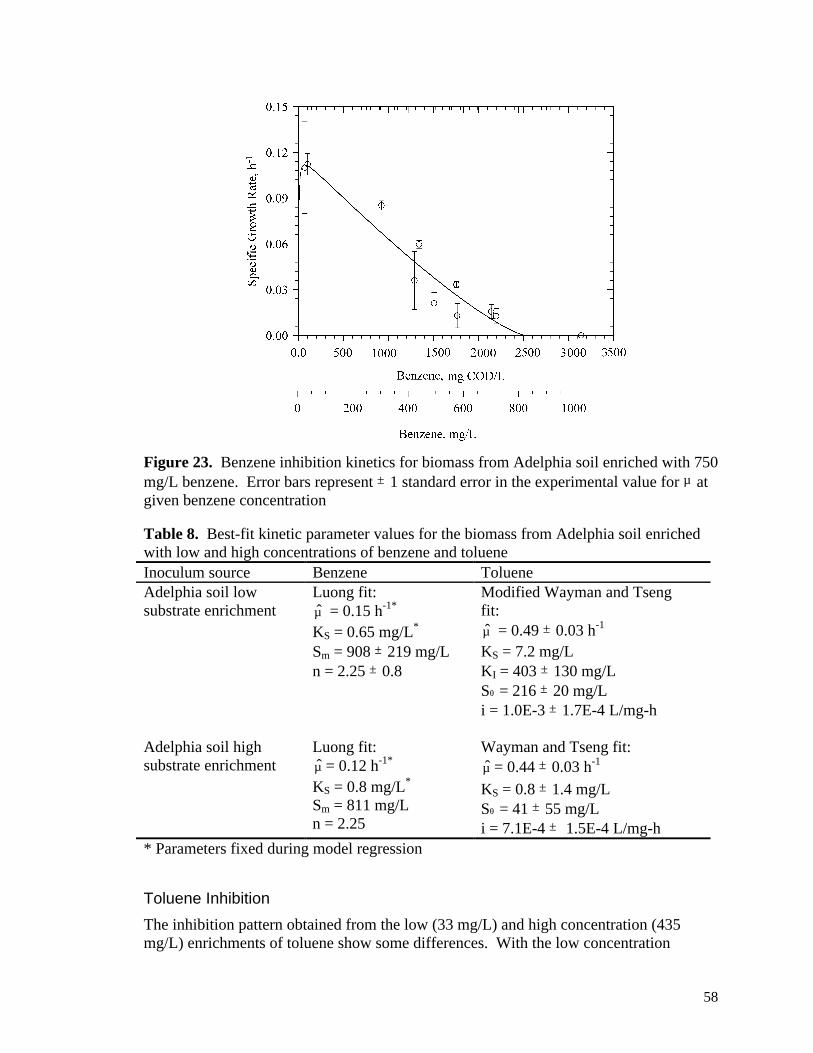
58
Figure 23. Benzene inhibition kinetics for biomass from Adelphia soil enriched with 750 mg/L benzene. Error bars represent ± 1 standard error in the experimental value for µ at given benzene concentration Table 8. Best-fit kinetic parameter values for the biomass from Adelphia soil enriched with low and high concentrations of benzene and toluene Inoculum source Benzene Toluene Adelphia soil low substrate enrichment
Luong fit: µ̂ = 0.15 h-1* KS = 0.65 mg/L* Sm = 908 ± 219 mg/L n = 2.25 ± 0.8
Modified Wayman and Tseng fit: µ̂ = 0.49 ± 0.03 h-1 KS = 7.2 mg/L KI = 403 ± 130 mg/L Sθ = 216 ± 20 mg/L i = 1.0E-3 ± 1.7E-4 L/mg-h
Adelphia soil high substrate enrichment
Luong fit: µ̂ = 0.12 h-1* KS = 0.8 mg/L* Sm = 811 mg/L n = 2.25
Wayman and Tseng fit: µ̂ = 0.44 ± 0.03 h-1
KS = 0.8 ± 1.4 mg/L Sθ = 41 ± 55 mg/L i = 7.1E-4 ± 1.5E-4 L/mg-h
* Parameters fixed during model regression
Toluene Inhibition
The inhibition pattern obtained from the low (33 mg/L) and high concentration (435 mg/L) enrichments of toluene show some differences. With the low concentration
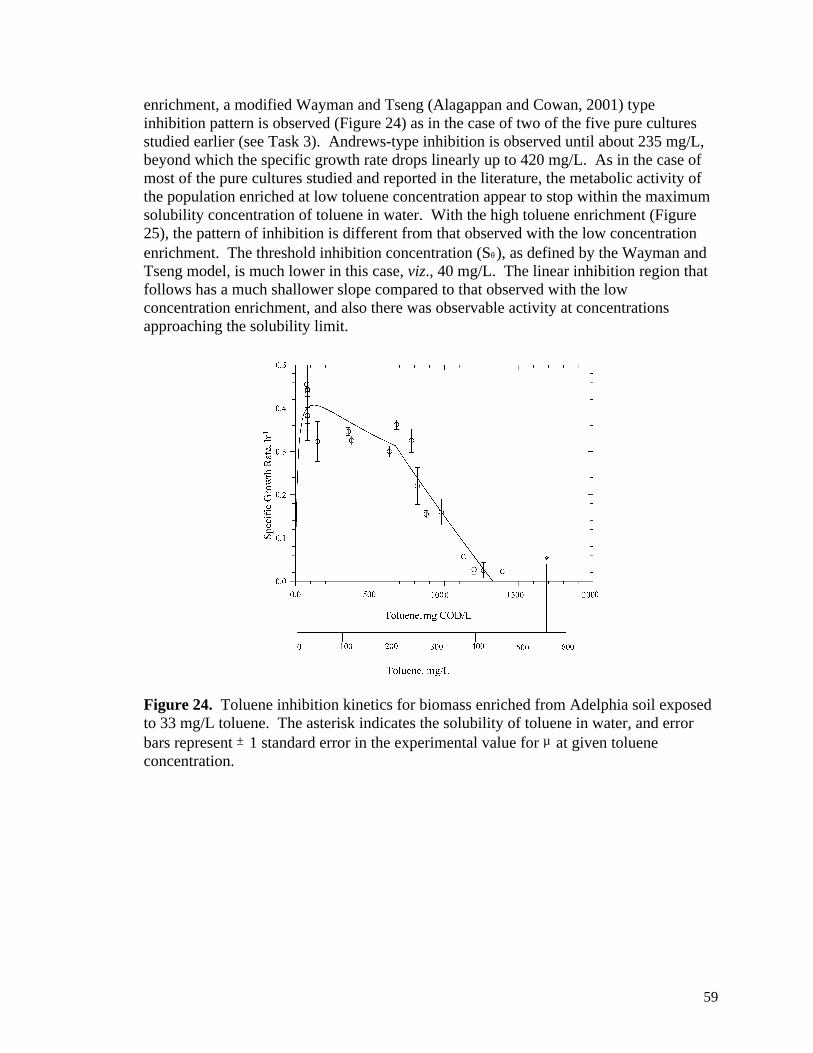
59
enrichment, a modified Wayman and Tseng (Alagappan and Cowan, 2001) type inhibition pattern is observed (Figure 24) as in the case of two of the five pure cultures studied earlier (see Task 3). Andrews-type inhibition is observed until about 235 mg/L, beyond which the specific growth rate drops linearly up to 420 mg/L. As in the case of most of the pure cultures studied and reported in the literature, the metabolic activity of the population enriched at low toluene concentration appear to stop within the maximum solubility concentration of toluene in water. With the high toluene enrichment (Figure 25), the pattern of inhibition is different from that observed with the low concentration enrichment. The threshold inhibition concentration (Sθ), as defined by the Wayman and Tseng model, is much lower in this case, viz., 40 mg/L. The linear inhibition region that follows has a much shallower slope compared to that observed with the low concentration enrichment, and also there was observable activity at concentrations approaching the solubility limit.
Figure 24. Toluene inhibition kinetics for biomass enriched from Adelphia soil exposed to 33 mg/L toluene. The asterisk indicates the solubility of toluene in water, and error bars represent ± 1 standard error in the experimental value for µ at given toluene concentration.
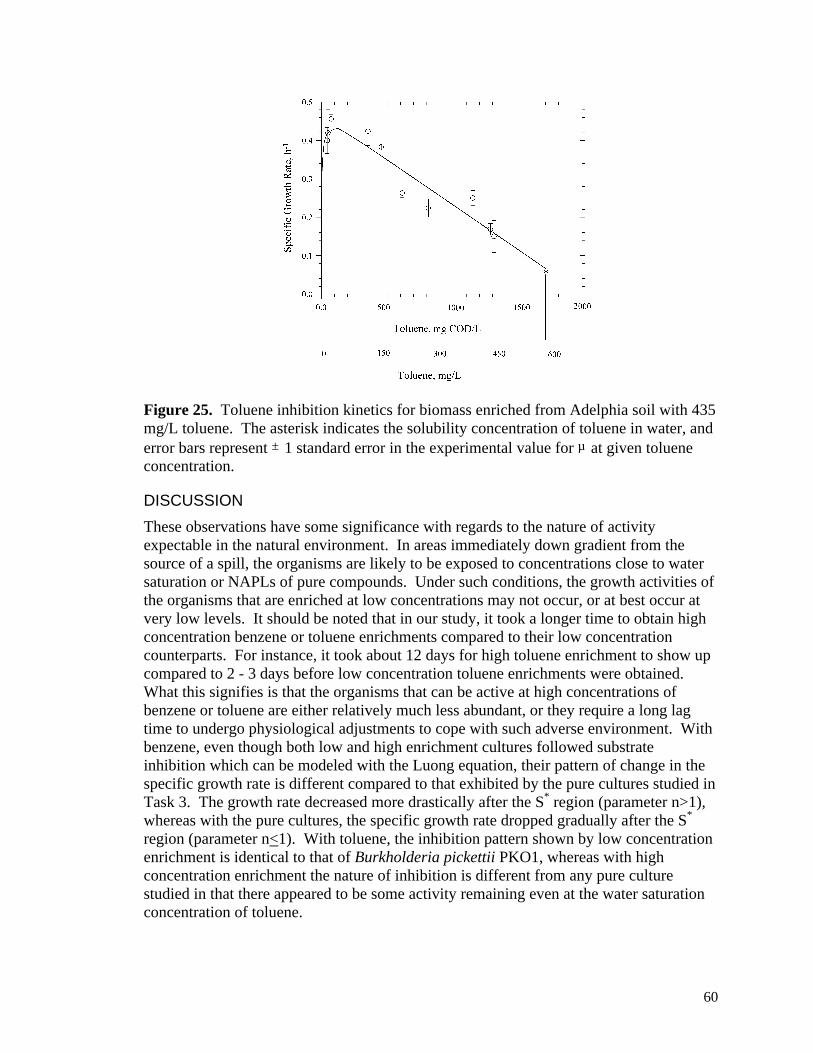
60
Figure 25. Toluene inhibition kinetics for biomass enriched from Adelphia soil with 435 mg/L toluene. The asterisk indicates the solubility concentration of toluene in water, and error bars represent ± 1 standard error in the experimental value for µ at given toluene concentration.
DISCUSSION
These observations have some significance with regards to the nature of activity expectable in the natural environment. In areas immediately down gradient from the source of a spill, the organisms are likely to be exposed to concentrations close to water saturation or NAPLs of pure compounds. Under such conditions, the growth activities of the organisms that are enriched at low concentrations may not occur, or at best occur at very low levels. It should be noted that in our study, it took a longer time to obtain high concentration benzene or toluene enrichments compared to their low concentration counterparts. For instance, it took about 12 days for high toluene enrichment to show up compared to 2 - 3 days before low concentration toluene enrichments were obtained. What this signifies is that the organisms that can be active at high concentrations of benzene or toluene are either relatively much less abundant, or they require a long lag time to undergo physiological adjustments to cope with such adverse environment. With benzene, even though both low and high enrichment cultures followed substrate inhibition which can be modeled with the Luong equation, their pattern of change in the specific growth rate is different compared to that exhibited by the pure cultures studied in Task 3. The growth rate decreased more drastically after the S* region (parameter n>1), whereas with the pure cultures, the specific growth rate dropped gradually after the S* region (parameter n<1). With toluene, the inhibition pattern shown by low concentration enrichment is identical to that of Burkholderia pickettii PKO1, whereas with high concentration enrichment the nature of inhibition is different from any pure culture studied in that there appeared to be some activity remaining even at the water saturation concentration of toluene.
61
Of the various works found in the literature on toluene as a substrate for microbial growth, one can observe a lack of consensus regarding the effect of high concentrations on growth kinetics. Some researchers have reported that the Andrews inhibition model provided an acceptable fit for their data (Sikkema et al., 1992; Oh et al., 1994; Mirpuri et al., 1997). Others reported they did not observe significant inhibition and therefore used a non-inhibitory Monod equation (Chang et al., 1993; Pedersen et al., 1997; Reardon et al., 2000). These results support the observation in this study that below some threshold concentration, toluene degrading cultures exhibit either non-inhibitory (Monod) or an asymptotically inhibitory (Andrews) behavior when toluene serves as the sole carbon and energy source.
Reardon et al. (2000) determined that P. putida F1 grows on toluene as a non-inhibitory substrate. Their data was collected using an initial toluene concentration of 43 mg/L. This agrees well with our findings for that strain when grown at initial concentrations from 16 mg/L to as high as 278 mg/L. It is at concentrations above this that inhibition occurred. It is the investigation of toluene degradation at high concentrations that distinguishes the data in this study from that found in the literature (with the exception of the Hack et al. (2000) data, discussed later). This trend of not looking at the high inhibitory substrate concentrations is the reason none of these previous works observed a severe inhibition and discontinuity in the inhibition pattern. They have restricted their study to relatively low initial substrate concentrations, the maximum of which was 70 mg/L of toluene for a mixed culture and a Pseudomonas strain PPO1 by Oh et al. (1994). The lowest Sθ found in this study was 155 mg/L toluene concentration for B. cepacia G4. One data set was found in the literature that revealed threshold inhibition; the data collected by Hack et al. (2000) on toluene degradation by P. putida UV4. This data with our regression analysis using the Wayman and Tseng model, shows a Monod type behavior up to a threshold toluene concentration of 221 mg/L, beyond which there is a rapid drop in activity, falling to zero at 276 mg/L.
Mechanism of inhibition
Alteration of cell membrane permeability as a cause for reduction in the metabolic activity of a cell has been well recognized (Edwards, 1970). Toluene is conventionally used by researchers to increase cell permeability for in situ enzymatic and physiological studies on cells (Sikkema et al., 1995). Exposure to 1% toluene has been shown to remove considerable amounts of protein, phospholipid, and polysaccharides from cells (de Smet et al., 1978), particularly from the cytoplasmic membrane. Toluene treatment has also been shown to destroy the fracture plane through the cytoplasmic membrane by disorganizing the bilayer structure, removing phospholipids. Besides the loss of cell envelope components, several intracellular proteins like malate dehydrogenase were also found to be lost due to increased permeabilization. These lead to loss of the enzyme functions, and ultimately complete inactivation of the cells.
Benzene, a more polar solvent than toluene, has also been reported to bring about modifications in membrane permeability, lipid solubilization, adsorption to and inactivation of proteins, aberrations in DNA molecules, besides other effects (Yarmoff et al., 1988). Most of the studies on benzene toxicity focused on mammalian systems,
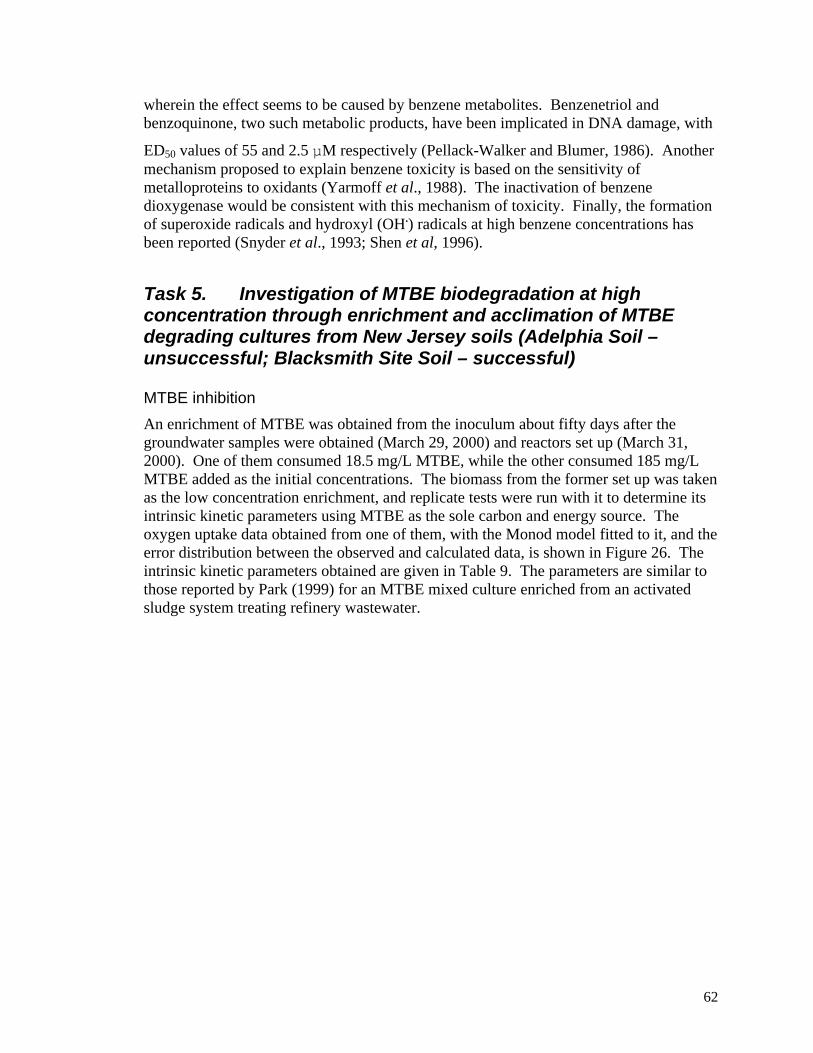
62
wherein the effect seems to be caused by benzene metabolites. Benzenetriol and benzoquinone, two such metabolic products, have been implicated in DNA damage, with
ED50 values of 55 and 2.5 µM respectively (Pellack-Walker and Blumer, 1986). Another mechanism proposed to explain benzene toxicity is based on the sensitivity of metalloproteins to oxidants (Yarmoff et al., 1988). The inactivation of benzene dioxygenase would be consistent with this mechanism of toxicity. Finally, the formation of superoxide radicals and hydroxyl (OH.) radicals at high benzene concentrations has been reported (Snyder et al., 1993; Shen et al, 1996).
Task 5. Investigation of MTBE biodegradation at high concentration through enrichment and acclimation of MTBE degrading cultures from New Jersey soils (Adelphia Soil – unsuccessful; Blacksmith Site Soil – successful)
MTBE inhibition
An enrichment of MTBE was obtained from the inoculum about fifty days after the groundwater samples were obtained (March 29, 2000) and reactors set up (March 31, 2000). One of them consumed 18.5 mg/L MTBE, while the other consumed 185 mg/L MTBE added as the initial concentrations. The biomass from the former set up was taken as the low concentration enrichment, and replicate tests were run with it to determine its intrinsic kinetic parameters using MTBE as the sole carbon and energy source. The oxygen uptake data obtained from one of them, with the Monod model fitted to it, and the error distribution between the observed and calculated data, is shown in Figure 26. The intrinsic kinetic parameters obtained are given in Table 9. The parameters are similar to those reported by Park (1999) for an MTBE mixed culture enriched from an activated sludge system treating refinery wastewater.
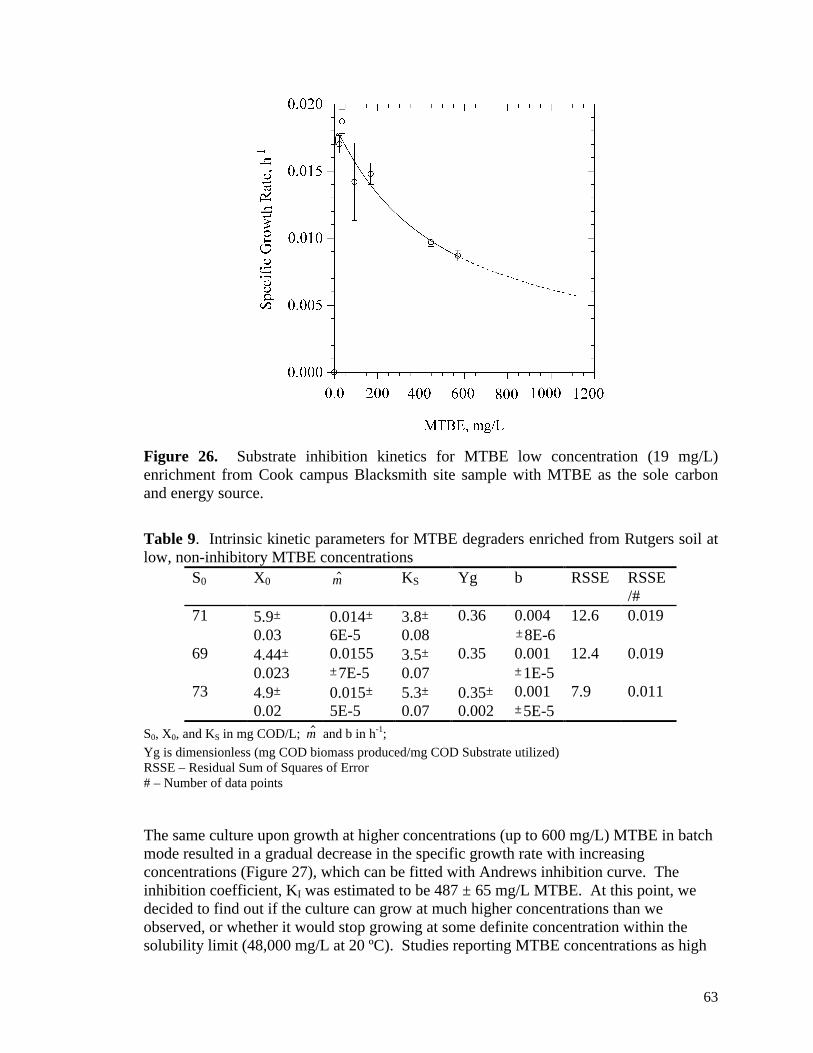
63
Figure 26. Substrate inhibition kinetics for MTBE low concentration (19 mg/L) enrichment from Cook campus Blacksmith site sample with MTBE as the sole carbon and energy source.
Table 9. Intrinsic kinetic parameters for MTBE degraders enriched from Rutgers soil at low, non-inhibitory MTBE concentrations
S0 X0 $µ KS Yg b RSSE RSSE/#
71 5.9± 0.03
0.014± 6E-5
3.8± 0.08
0.36 0.004 ±8E-6
12.6 0.019
69 4.44± 0.023
0.0155 ±7E-5
3.5± 0.07
0.35 0.001 ±1E-5
12.4 0.019
73 4.9± 0.02
0.015± 5E-5
5.3± 0.07
0.35± 0.002
0.001±5E-5
7.9 0.011
S0, X0, and KS in mg COD/L; $µ and b in h-1;
Yg is dimensionless (mg COD biomass produced/mg COD Substrate utilized) RSSE – Residual Sum of Squares of Error # – Number of data points
The same culture upon growth at higher concentrations (up to 600 mg/L) MTBE in batch mode resulted in a gradual decrease in the specific growth rate with increasing concentrations (Figure 27), which can be fitted with Andrews inhibition curve. The inhibition coefficient, KI was estimated to be 487 ± 65 mg/L MTBE. At this point, we decided to find out if the culture can grow at much higher concentrations than we observed, or whether it would stop growing at some definite concentration within the solubility limit (48,000 mg/L at 20 ºC). Studies reporting MTBE concentrations as high
64
as 800 mg/L in the environment (Weaver et al., 1996) are found in the literature, which brings up the questions, will there be any activity at such high concentrations even if there are MTBE degraders present and other conditions are favorable? Will the degrading organisms develop favorable adaptation to high concentrations of these solvents (or selection of a few organisms capable of withstanding high concentrations, but following different growth kinetics than those organisms enriched at low concentrations?
To address these questions, the biomass enriched at 185 mg/L was taken in a 2-liter fermentor (Bioflo 2000, New Brunswick Scientific, Edison, NJ, USA), which was connected to a respirometer port. The concentration of MTBE in the reactor was gradually increased, and the oxygen uptake rate monitored. Biomass was periodically removed in an effort to keep the biomass concentration relatively constant. This accomplished so that the reactor does not experience oxygen transfer limitation. After 350 hours, after the last spike of 350 mg/L, the oxygen uptake ceased, indicating complete inhibition. At that point, the concentration of MTBE in the aqueous phase was determined to be 1279 ± 100 mg/L, and the biomass COD was about 400 mg/L on a COD basis. Attempts to regain the activity by diluting the MTBE were not successful, which indicates the biomass not only was inhibited by this concentration of MTBE but also was likely killed. Loss of activity due to loss of selective membrane permeability is a well-recognized mode of toxicity for solvents.
To understand the pattern of inhibition quantitatively, initial rate studies were carried out with MTBE biomass adapted to 770 mg/L MTBE (Figure 27). At concentrations up to approximately 500 mg/L the kinetics could be described using Andrews equation, the kinetic parameter estimates being µ̂ = 0.025 ± 0.007 h-1, Ks = 7 ± 17 mg/L, and KI = 555 ± 417 mg/L. Beyond 530 ± 40 mg/L, the specific growth rate was observed to decrease rapidly, with no detectable growth occurring at an MTBE concentration of 1000 mg/L. The modification of the Wayman and Tseng model proposed in Task 1, and presented in Alagappan and Cowan (2001), is capable of represent this data. The model parameters were those of the Andrews equation, plus those applicable at S> Sθ, with Sθ being 530 ± 40mg/L and i, 2.6E-5 ± 6.5E-6 L/mg-h. Based on this model prediction, the concentration of MTBE at which the growth will cease is 890 mg/L. This terminal concentration is lower than the observed maximum based on the fermenter study, where the growth was found to be completely lost at 1280 mg/L.
Table 10 compares the specific growth rates calculated at selected MTBE concentrations from the fermenter study and the substrate inhibition study with high MTBE enrichment culture. Note that the µ values from both the methods are comparable from the methods for 693, 701, and 733 mg/L MTBE concentrations. At 943 mg/L, we do not have any data in the inhibition study. Based on our model calculations the activity stopped at 890 mg/L, and the lowest observed concentration at which growth stopped completely is 995 mg/L. However, based on the fermenter study, we calculate 0.0026 h-1 at 943 mg/L MTBE, and complete loss of activity at 1279 ± 36 mg/L MTBE. Although not exactly the same, we find a reasonable correspondence between the two methods to predict growth rate at different MTBE concentrations.
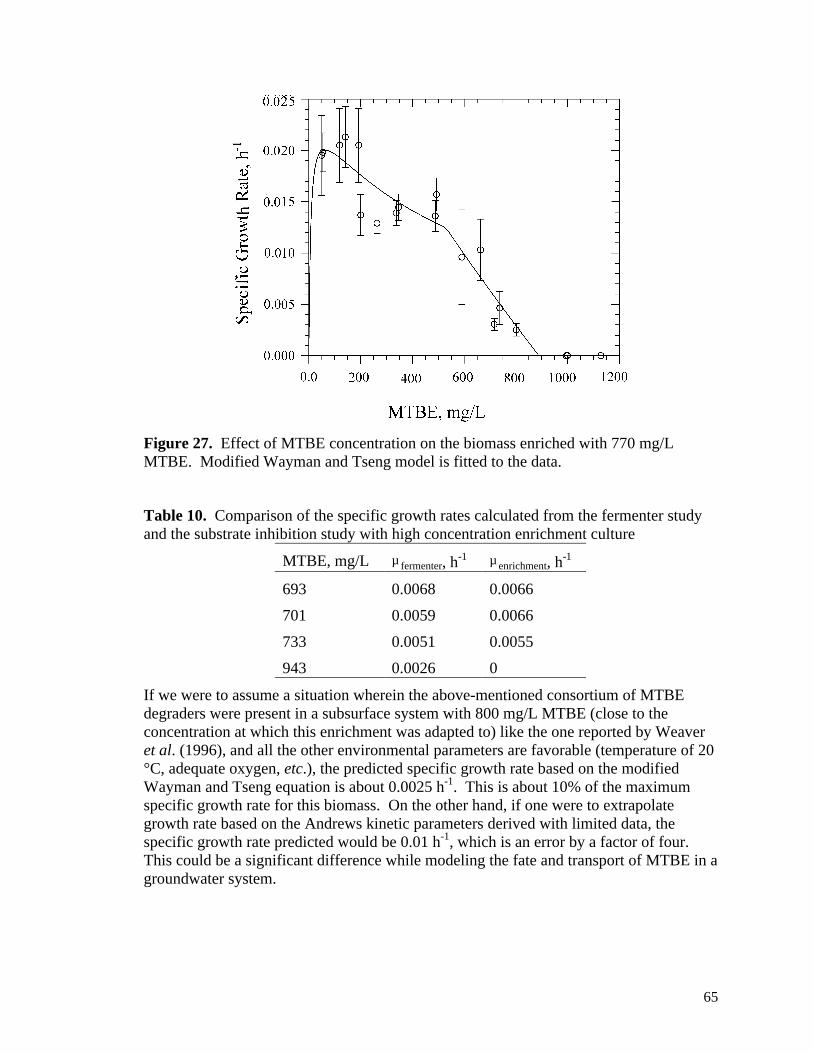
65
Figure 27. Effect of MTBE concentration on the biomass enriched with 770 mg/L MTBE. Modified Wayman and Tseng model is fitted to the data.
Table 10. Comparison of the specific growth rates calculated from the fermenter study and the substrate inhibition study with high concentration enrichment culture
MTBE, mg/L µ fermenter, h-1 µ enrichment, h
-1
693 0.0068 0.0066
701 0.0059 0.0066
733 0.0051 0.0055
943 0.0026 0
If we were to assume a situation wherein the above-mentioned consortium of MTBE degraders were present in a subsurface system with 800 mg/L MTBE (close to the concentration at which this enrichment was adapted to) like the one reported by Weaver et al. (1996), and all the other environmental parameters are favorable (temperature of 20 °C, adequate oxygen, etc.), the predicted specific growth rate based on the modified Wayman and Tseng equation is about 0.0025 h-1. This is about 10% of the maximum specific growth rate for this biomass. On the other hand, if one were to extrapolate growth rate based on the Andrews kinetic parameters derived with limited data, the specific growth rate predicted would be 0.01 h-1, which is an error by a factor of four. This could be a significant difference while modeling the fate and transport of MTBE in a groundwater system.
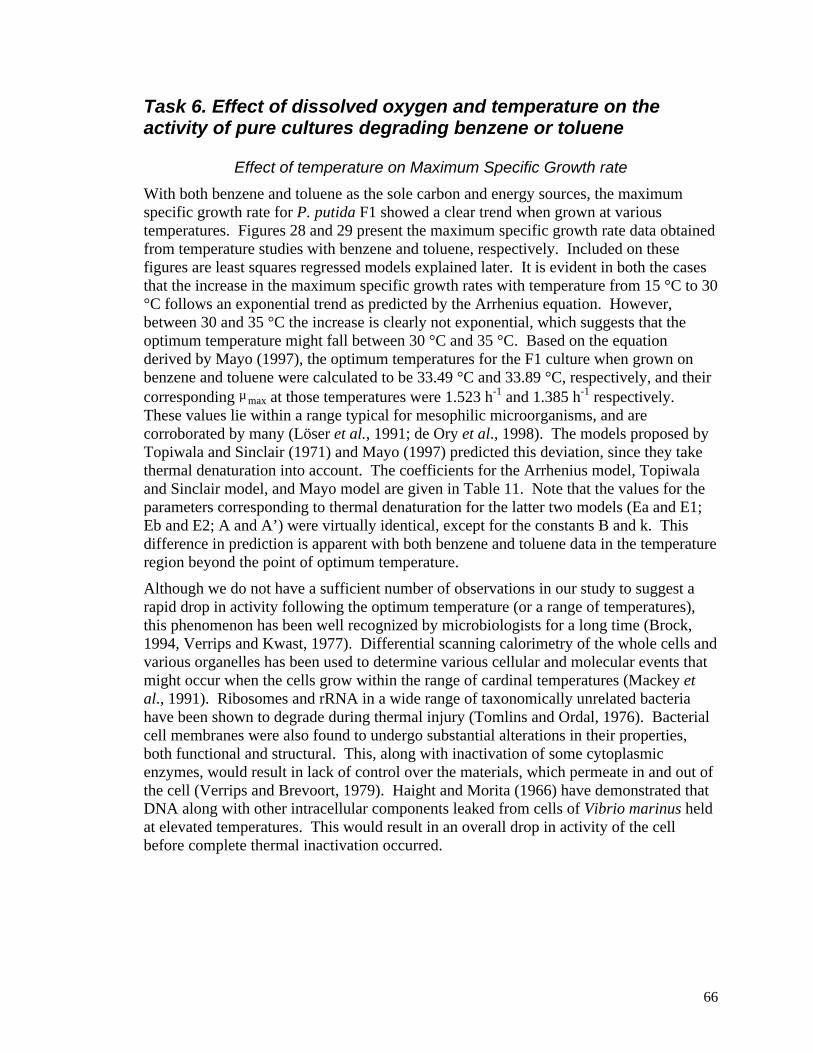
66
Task 6. Effect of dissolved oxygen and temperature on the activity of pure cultures degrading benzene or toluene
Effect of temperature on Maximum Specific Growth rate
With both benzene and toluene as the sole carbon and energy sources, the maximum specific growth rate for P. putida F1 showed a clear trend when grown at various temperatures. Figures 28 and 29 present the maximum specific growth rate data obtained from temperature studies with benzene and toluene, respectively. Included on these figures are least squares regressed models explained later. It is evident in both the cases that the increase in the maximum specific growth rates with temperature from 15 °C to 30 °C follows an exponential trend as predicted by the Arrhenius equation. However, between 30 and 35 °C the increase is clearly not exponential, which suggests that the optimum temperature might fall between 30 °C and 35 °C. Based on the equation derived by Mayo (1997), the optimum temperatures for the F1 culture when grown on benzene and toluene were calculated to be 33.49 °C and 33.89 °C, respectively, and their corresponding µ max at those temperatures were 1.523 h-1 and 1.385 h-1 respectively. These values lie within a range typical for mesophilic microorganisms, and are corroborated by many (Löser et al., 1991; de Ory et al., 1998). The models proposed by Topiwala and Sinclair (1971) and Mayo (1997) predicted this deviation, since they take thermal denaturation into account. The coefficients for the Arrhenius model, Topiwala and Sinclair model, and Mayo model are given in Table 11. Note that the values for the parameters corresponding to thermal denaturation for the latter two models (Ea and E1; Eb and E2; A and A’) were virtually identical, except for the constants B and k. This difference in prediction is apparent with both benzene and toluene data in the temperature region beyond the point of optimum temperature.
Although we do not have a sufficient number of observations in our study to suggest a rapid drop in activity following the optimum temperature (or a range of temperatures), this phenomenon has been well recognized by microbiologists for a long time (Brock, 1994, Verrips and Kwast, 1977). Differential scanning calorimetry of the whole cells and various organelles has been used to determine various cellular and molecular events that might occur when the cells grow within the range of cardinal temperatures (Mackey et al., 1991). Ribosomes and rRNA in a wide range of taxonomically unrelated bacteria have been shown to degrade during thermal injury (Tomlins and Ordal, 1976). Bacterial cell membranes were also found to undergo substantial alterations in their properties, both functional and structural. This, along with inactivation of some cytoplasmic enzymes, would result in lack of control over the materials, which permeate in and out of the cell (Verrips and Brevoort, 1979). Haight and Morita (1966) have demonstrated that DNA along with other intracellular components leaked from cells of Vibrio marinus held at elevated temperatures. This would result in an overall drop in activity of the cell before complete thermal inactivation occurred.

67
Figure 28. Effect of temperature on the maximum specific growth rate of Pseudomonas putida F1 grown on non-inhibitory benzene concentration: Topiwala-Sinclair model fit; Arrhenius model fit to the first five points (15 – 30 ºC); Arrhenius model fit to all the data points (15 – 35 ºC), and Mayo model.
Figure 29. Effect of temperature on the maximum specific growth rate of Pseudomonas putida F1 grown on non-inhibitory toluene concentration: Topiwala-Sinclair model fit; Arrhenius model fit to the first five points (15 – 30 ºC); Arrhenius model fit to all the data points (15 – 35 ºC), and Mayo model.
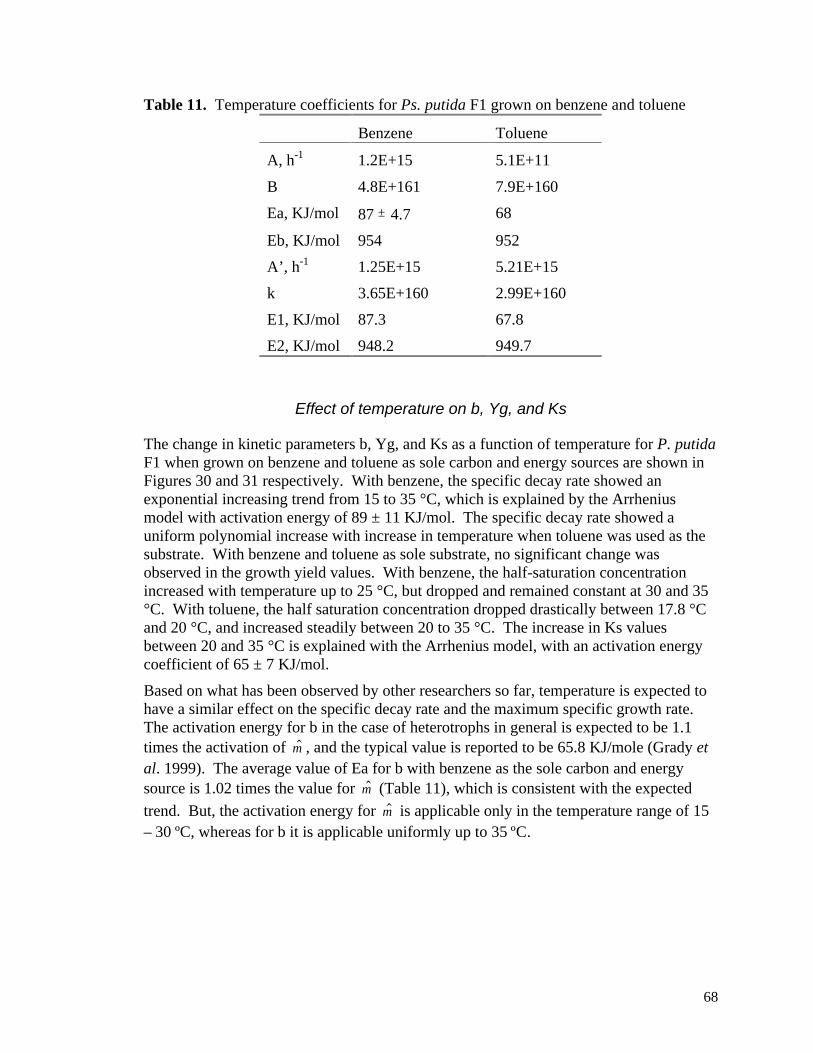
68
Table 11. Temperature coefficients for Ps. putida F1 grown on benzene and toluene
Benzene Toluene
A, h-1 1.2E+15 5.1E+11
B 4.8E+161 7.9E+160
Ea, KJ/mol 87 ± 4.7 68
Eb, KJ/mol 954 952
A’, h-1 1.25E+15 5.21E+15
k 3.65E+160 2.99E+160
E1, KJ/mol 87.3 67.8
E2, KJ/mol 948.2 949.7
Effect of temperature on b, Yg, and Ks
The change in kinetic parameters b, Yg, and Ks as a function of temperature for P. putida F1 when grown on benzene and toluene as sole carbon and energy sources are shown in Figures 30 and 31 respectively. With benzene, the specific decay rate showed an exponential increasing trend from 15 to 35 °C, which is explained by the Arrhenius model with activation energy of 89 ± 11 KJ/mol. The specific decay rate showed a uniform polynomial increase with increase in temperature when toluene was used as the substrate. With benzene and toluene as sole substrate, no significant change was observed in the growth yield values. With benzene, the half-saturation concentration increased with temperature up to 25 °C, but dropped and remained constant at 30 and 35 °C. With toluene, the half saturation concentration dropped drastically between 17.8 °C and 20 °C, and increased steadily between 20 to 35 °C. The increase in Ks values between 20 and 35 °C is explained with the Arrhenius model, with an activation energy coefficient of 65 ± 7 KJ/mol.
Based on what has been observed by other researchers so far, temperature is expected to have a similar effect on the specific decay rate and the maximum specific growth rate. The activation energy for b in the case of heterotrophs in general is expected to be 1.1 times the activation of $µ , and the typical value is reported to be 65.8 KJ/mole (Grady et al. 1999). The average value of Ea for b with benzene as the sole carbon and energy source is 1.02 times the value for $µ (Table 11), which is consistent with the expected
trend. But, the activation energy for $µ is applicable only in the temperature range of 15 – 30 ºC, whereas for b it is applicable uniformly up to 35 ºC.
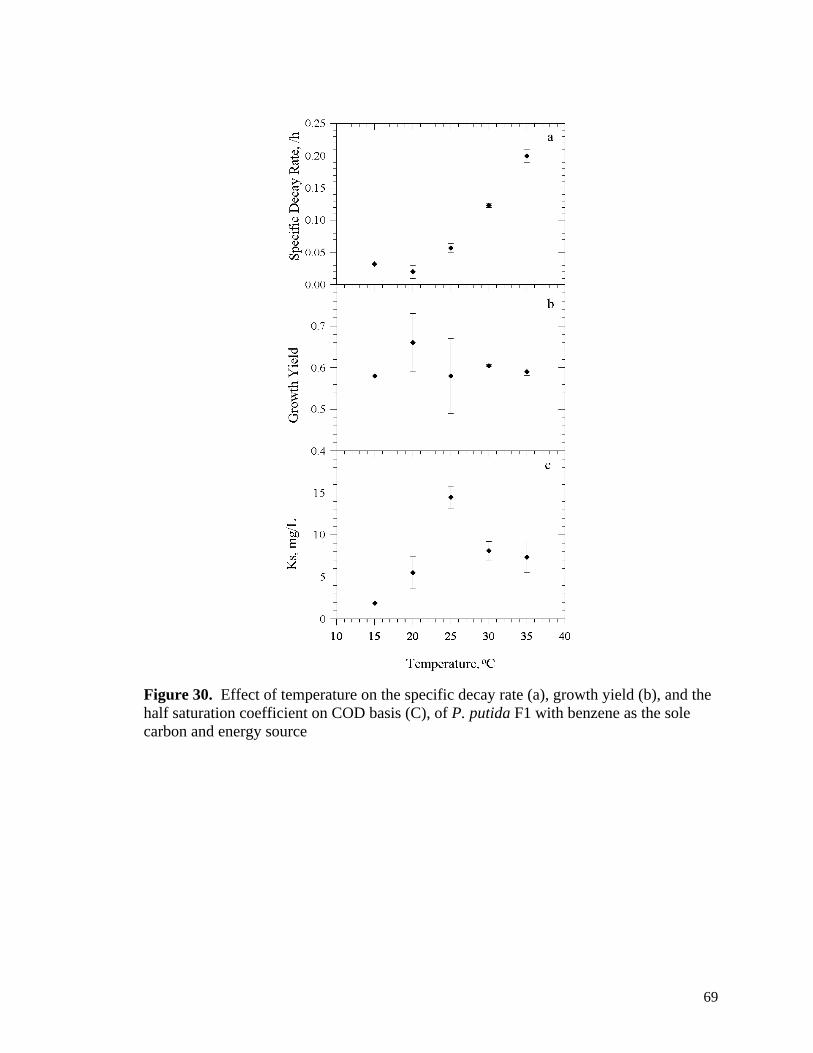
69
Figure 30. Effect of temperature on the specific decay rate (a), growth yield (b), and the half saturation coefficient on COD basis (C), of P. putida F1 with benzene as the sole carbon and energy source
70
Figure 31. Effect of temperature on the specific decay rate (a), growth yield (b), and the half saturation coefficient on COD basis (c), of P. putida F1 with toluene as the sole carbon and energy source.
With the models of Topiwala and Sinclair or Mayo (extended Arrhenius models incorporating activation energy for thermal denaturation), it is reasonable to anticipate the coefficients Eb or E2 obtained from $µ versus temperature data to be correlated to the Arrhenius coefficient Ea obtained with b versus temperature data. However, the values Eb and E2 (950 KJ/mole) are about 11 times higher than the Ea value obtained with b. It is therefore likely that b and its temperature coefficients are not indicative of thermal denaturation.
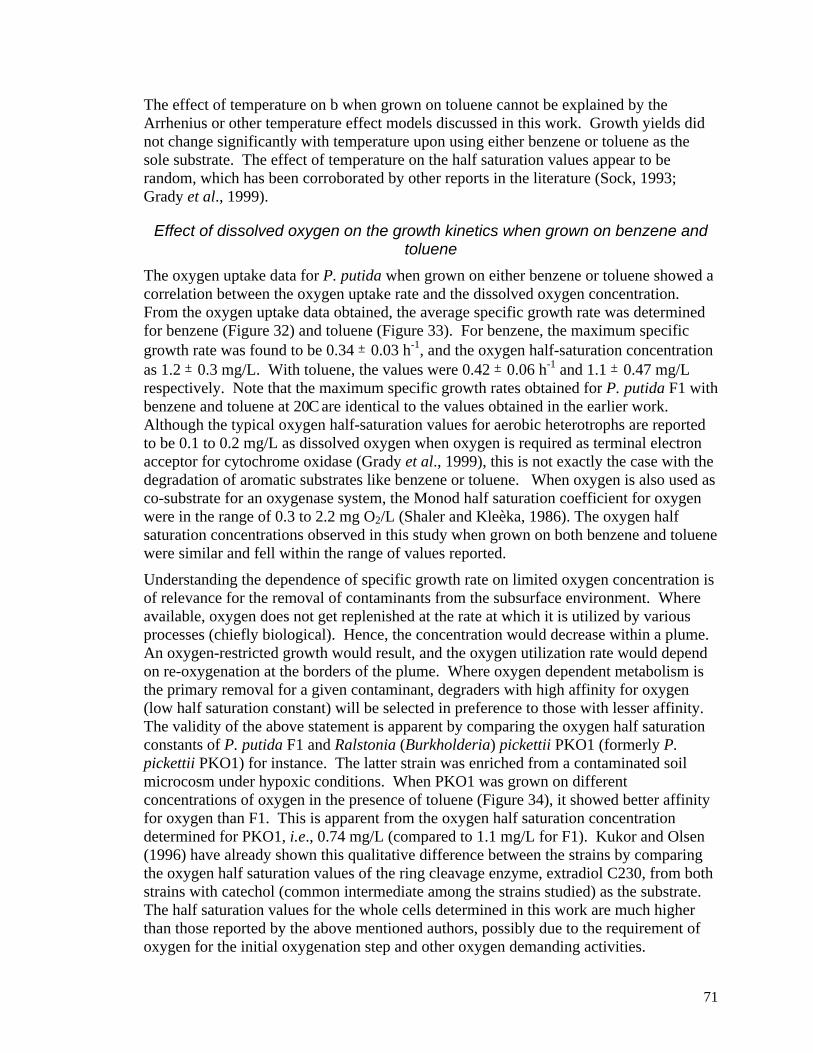
71
The effect of temperature on b when grown on toluene cannot be explained by the Arrhenius or other temperature effect models discussed in this work. Growth yields did not change significantly with temperature upon using either benzene or toluene as the sole substrate. The effect of temperature on the half saturation values appear to be random, which has been corroborated by other reports in the literature (Sock, 1993; Grady et al., 1999).
Effect of dissolved oxygen on the growth kinetics when grown on benzene and toluene
The oxygen uptake data for P. putida when grown on either benzene or toluene showed a correlation between the oxygen uptake rate and the dissolved oxygen concentration. From the oxygen uptake data obtained, the average specific growth rate was determined for benzene (Figure 32) and toluene (Figure 33). For benzene, the maximum specific growth rate was found to be 0.34 ± 0.03 h-1, and the oxygen half-saturation concentration as 1.2 ± 0.3 mg/L. With toluene, the values were 0.42 ± 0.06 h-1 and 1.1 ± 0.47 mg/L respectively. Note that the maximum specific growth rates obtained for P. putida F1 with benzene and toluene at 20 �C are identical to the values obtained in the earlier work. Although the typical oxygen half-saturation values for aerobic heterotrophs are reported to be 0.1 to 0.2 mg/L as dissolved oxygen when oxygen is required as terminal electron acceptor for cytochrome oxidase (Grady et al., 1999), this is not exactly the case with the degradation of aromatic substrates like benzene or toluene. When oxygen is also used as co-substrate for an oxygenase system, the Monod half saturation coefficient for oxygen were in the range of 0.3 to 2.2 mg O2/L (Shaler and Kleèka, 1986). The oxygen half saturation concentrations observed in this study when grown on both benzene and toluene were similar and fell within the range of values reported.
Understanding the dependence of specific growth rate on limited oxygen concentration is of relevance for the removal of contaminants from the subsurface environment. Where available, oxygen does not get replenished at the rate at which it is utilized by various processes (chiefly biological). Hence, the concentration would decrease within a plume. An oxygen-restricted growth would result, and the oxygen utilization rate would depend on re-oxygenation at the borders of the plume. Where oxygen dependent metabolism is the primary removal for a given contaminant, degraders with high affinity for oxygen (low half saturation constant) will be selected in preference to those with lesser affinity. The validity of the above statement is apparent by comparing the oxygen half saturation constants of P. putida F1 and Ralstonia (Burkholderia) pickettii PKO1 (formerly P. pickettii PKO1) for instance. The latter strain was enriched from a contaminated soil microcosm under hypoxic conditions. When PKO1 was grown on different concentrations of oxygen in the presence of toluene (Figure 34), it showed better affinity for oxygen than F1. This is apparent from the oxygen half saturation concentration determined for PKO1, i.e., 0.74 mg/L (compared to 1.1 mg/L for F1). Kukor and Olsen (1996) have already shown this qualitative difference between the strains by comparing the oxygen half saturation values of the ring cleavage enzyme, extradiol C230, from both strains with catechol (common intermediate among the strains studied) as the substrate. The half saturation values for the whole cells determined in this work are much higher than those reported by the above mentioned authors, possibly due to the requirement of oxygen for the initial oxygenation step and other oxygen demanding activities.
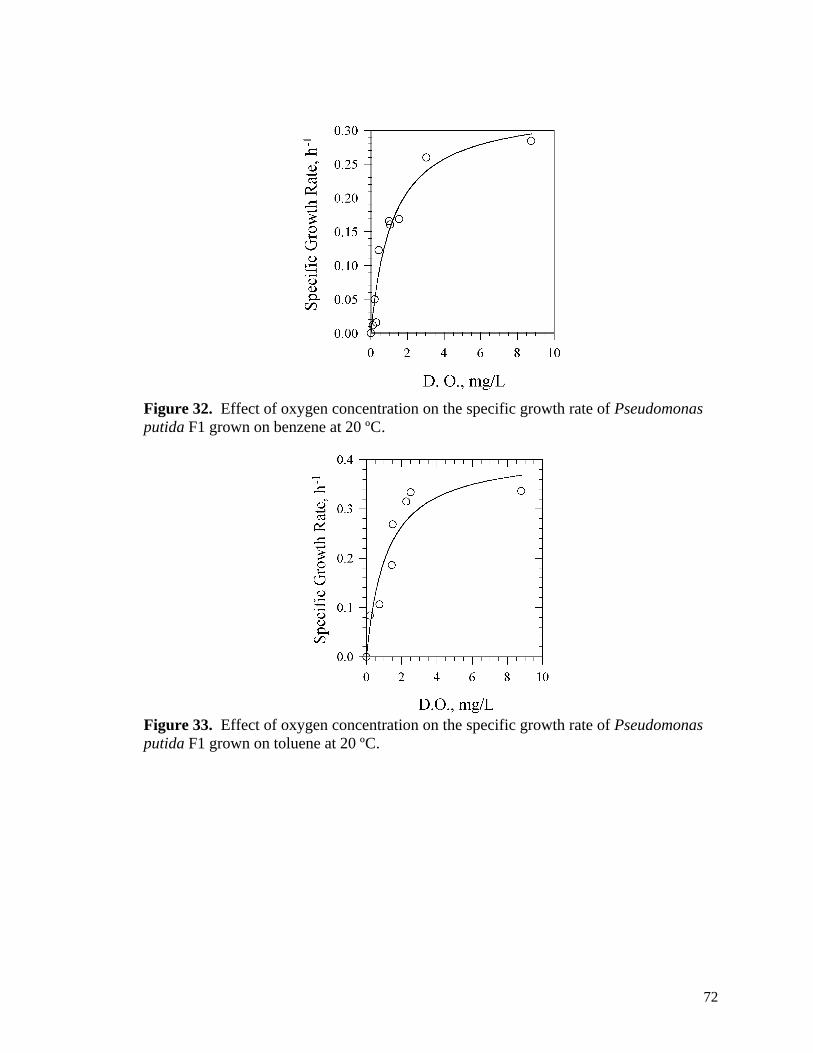
72
Figure 32. Effect of oxygen concentration on the specific growth rate of Pseudomonas putida F1 grown on benzene at 20 ºC.
Figure 33. Effect of oxygen concentration on the specific growth rate of Pseudomonas putida F1 grown on toluene at 20 ºC.
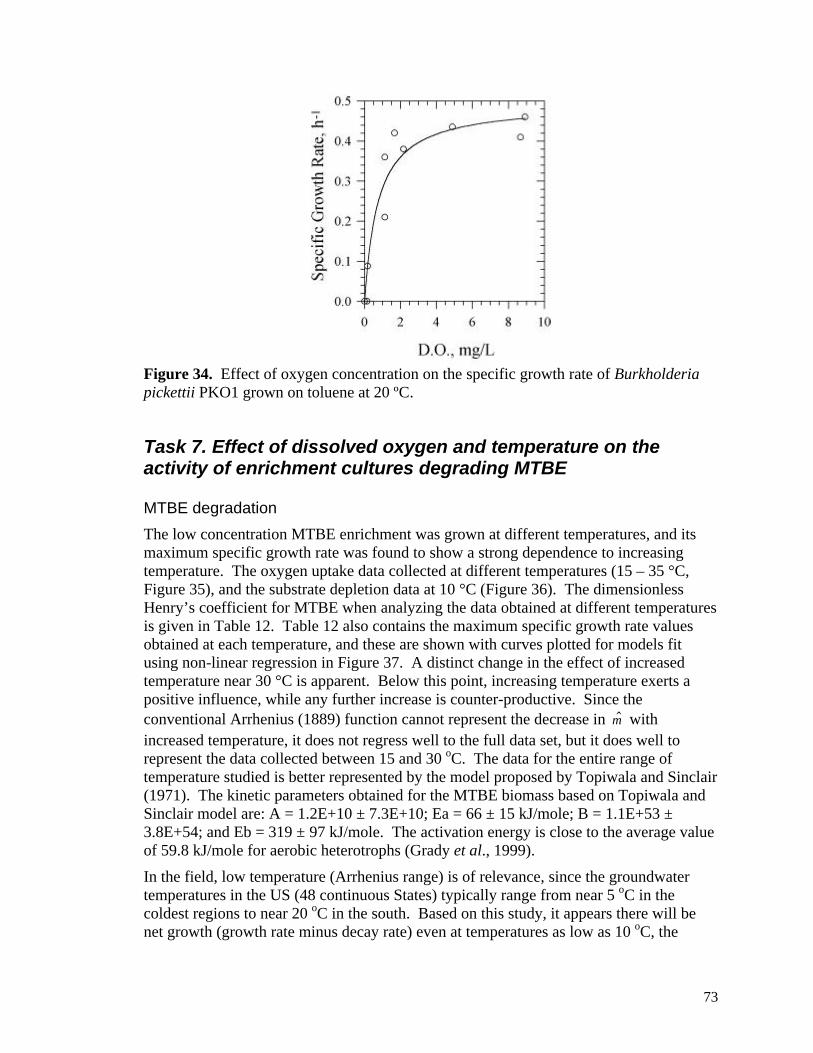
73
Figure 34. Effect of oxygen concentration on the specific growth rate of Burkholderia pickettii PKO1 grown on toluene at 20 ºC.
Task 7. Effect of dissolved oxygen and temperature on the activity of enrichment cultures degrading MTBE
MTBE degradation
The low concentration MTBE enrichment was grown at different temperatures, and its maximum specific growth rate was found to show a strong dependence to increasing temperature. The oxygen uptake data collected at different temperatures (15 – 35 °C, Figure 35), and the substrate depletion data at 10 °C (Figure 36). The dimensionless Henry’s coefficient for MTBE when analyzing the data obtained at different temperatures is given in Table 12. Table 12 also contains the maximum specific growth rate values obtained at each temperature, and these are shown with curves plotted for models fit using non-linear regression in Figure 37. A distinct change in the effect of increased temperature near 30 °C is apparent. Below this point, increasing temperature exerts a positive influence, while any further increase is counter-productive. Since the conventional Arrhenius (1889) function cannot represent the decrease in $µ with increased temperature, it does not regress well to the full data set, but it does well to represent the data collected between 15 and 30 oC. The data for the entire range of temperature studied is better represented by the model proposed by Topiwala and Sinclair (1971). The kinetic parameters obtained for the MTBE biomass based on Topiwala and Sinclair model are: A = 1.2E+10 ± 7.3E+10; Ea = 66 ± 15 kJ/mole; B = 1.1E+53 ± 3.8E+54; and Eb = 319 ± 97 kJ/mole. The activation energy is close to the average value of 59.8 kJ/mole for aerobic heterotrophs (Grady et al., 1999).
In the field, low temperature (Arrhenius range) is of relevance, since the groundwater temperatures in the US (48 continuous States) typically range from near 5 oC in the coldest regions to near 20 oC in the south. Based on this study, it appears there will be net growth (growth rate minus decay rate) even at temperatures as low as 10 oC, the
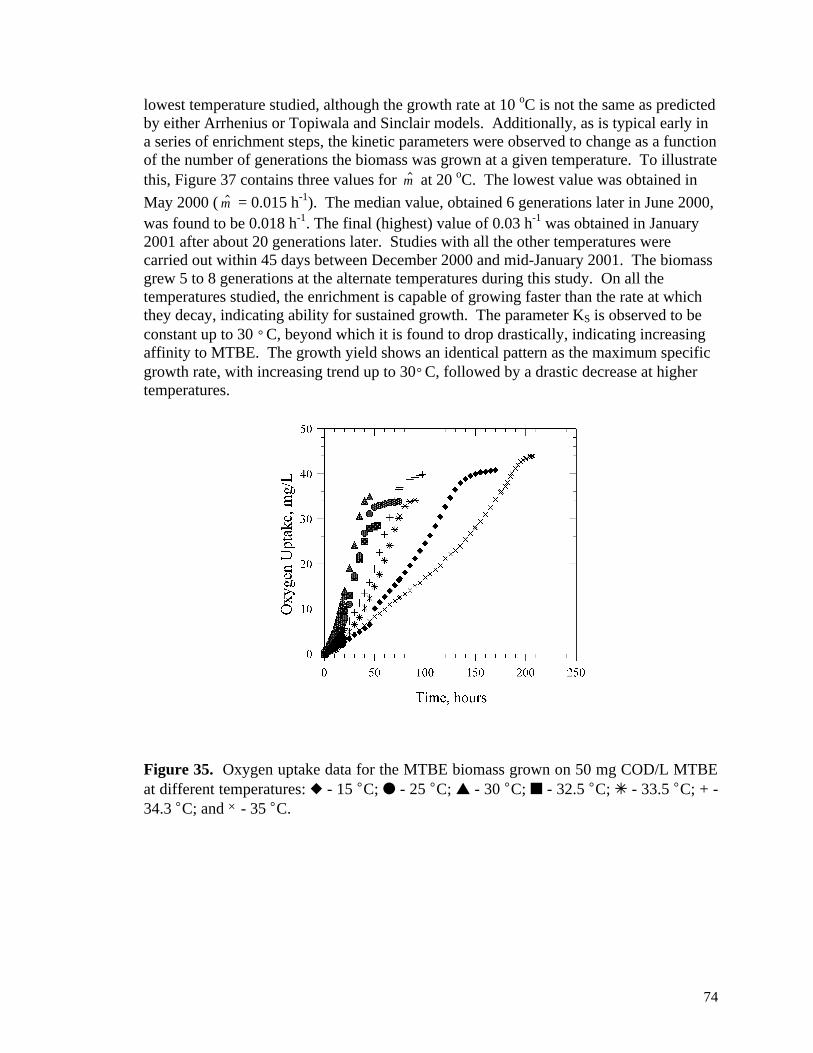
74
lowest temperature studied, although the growth rate at 10 oC is not the same as predicted by either Arrhenius or Topiwala and Sinclair models. Additionally, as is typical early in a series of enrichment steps, the kinetic parameters were observed to change as a function of the number of generations the biomass was grown at a given temperature. To illustrate this, Figure 37 contains three values for $µ at 20 oC. The lowest value was obtained in
May 2000 ( $µ = 0.015 h-1). The median value, obtained 6 generations later in June 2000, was found to be 0.018 h-1. The final (highest) value of 0.03 h-1 was obtained in January 2001 after about 20 generations later. Studies with all the other temperatures were carried out within 45 days between December 2000 and mid-January 2001. The biomass grew 5 to 8 generations at the alternate temperatures during this study. On all the temperatures studied, the enrichment is capable of growing faster than the rate at which they decay, indicating ability for sustained growth. The parameter KS is observed to be constant up to 30 °C, beyond which it is found to drop drastically, indicating increasing affinity to MTBE. The growth yield shows an identical pattern as the maximum specific growth rate, with increasing trend up to 30°C, followed by a drastic decrease at higher temperatures.
Figure 35. Oxygen uptake data for the MTBE biomass grown on 50 mg COD/L MTBE at different temperatures: u - 15 °C; l - 25 °C; s - 30 °C; n - 32.5 °C; T - 33.5 °C; + - 34.3 °C; and × - 35 °C.
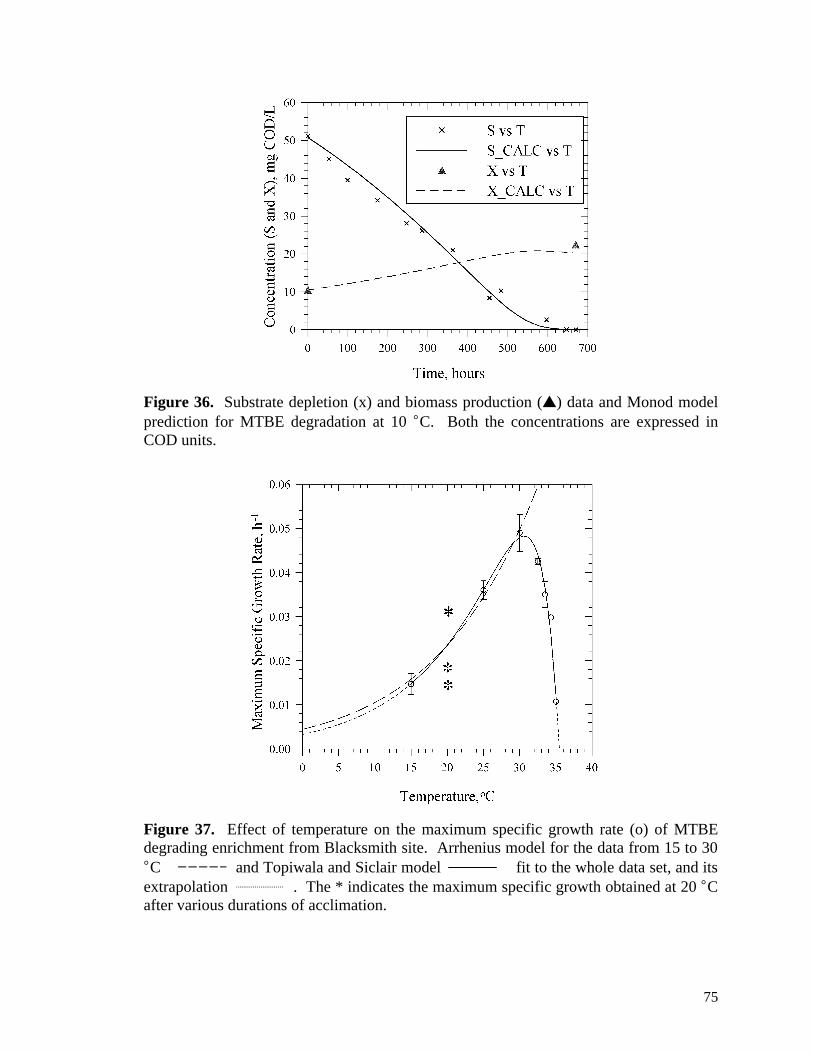
75
Figure 36. Substrate depletion (x) and biomass production (s) data and Monod model prediction for MTBE degradation at 10 °C. Both the concentrations are expressed in COD units.
Figure 37. Effect of temperature on the maximum specific growth rate (o) of MTBE degrading enrichment from Blacksmith site. Arrhenius model for the data from 15 to 30 °C and Topiwala and Siclair model fit to the whole data set, and its extrapolation . The * indicates the maximum specific growth obtained at 20 °C after various durations of acclimation.
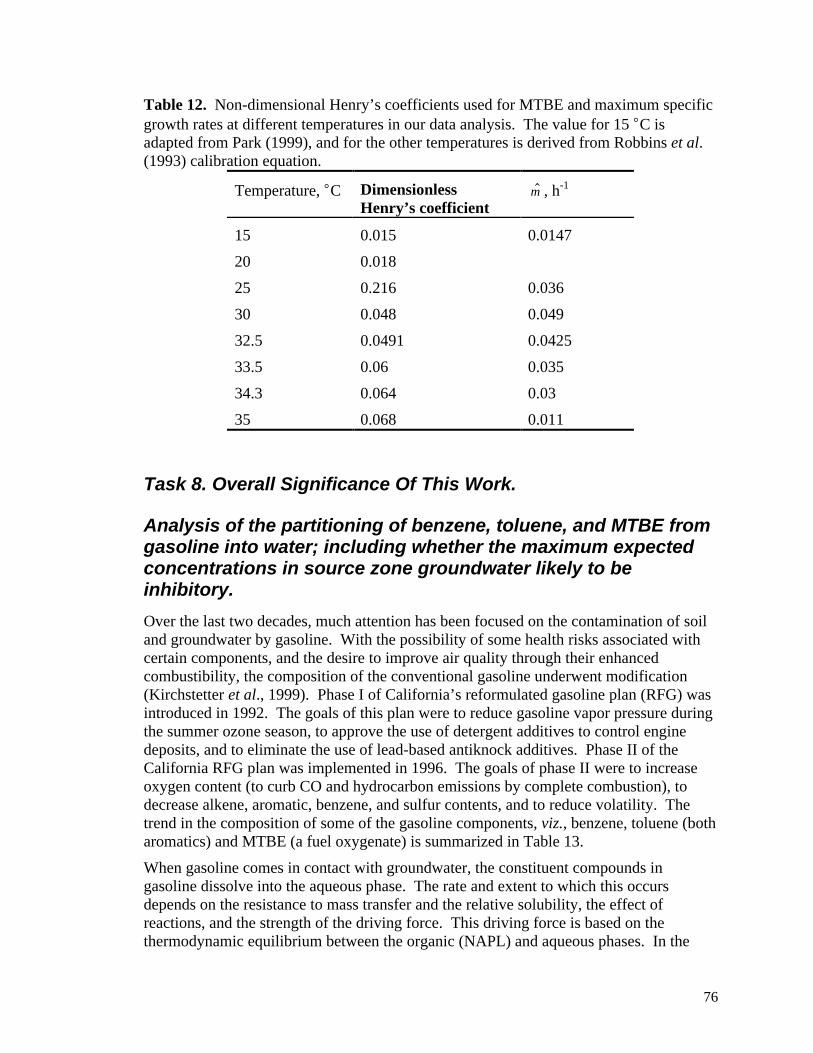
76
Table 12. Non-dimensional Henry’s coefficients used for MTBE and maximum specific growth rates at different temperatures in our data analysis. The value for 15 °C is adapted from Park (1999), and for the other temperatures is derived from Robbins et al. (1993) calibration equation.
Temperature, °C Dimensionless Henry’s coefficient
$µ , h-1
15 0.015 0.0147
20 0.018
25 0.216 0.036
30 0.048 0.049
32.5 0.0491 0.0425
33.5 0.06 0.035
34.3 0.064 0.03
35 0.068 0.011
Task 8. Overall Significance Of This Work.
Analysis of the partitioning of benzene, toluene, and MTBE from gasoline into water; including whether the maximum expected concentrations in source zone groundwater likely to be inhibitory.
Over the last two decades, much attention has been focused on the contamination of soil and groundwater by gasoline. With the possibility of some health risks associated with certain components, and the desire to improve air quality through their enhanced combustibility, the composition of the conventional gasoline underwent modification (Kirchstetter et al., 1999). Phase I of California’s reformulated gasoline plan (RFG) was introduced in 1992. The goals of this plan were to reduce gasoline vapor pressure during the summer ozone season, to approve the use of detergent additives to control engine deposits, and to eliminate the use of lead-based antiknock additives. Phase II of the California RFG plan was implemented in 1996. The goals of phase II were to increase oxygen content (to curb CO and hydrocarbon emissions by complete combustion), to decrease alkene, aromatic, benzene, and sulfur contents, and to reduce volatility. The trend in the composition of some of the gasoline components, viz., benzene, toluene (both aromatics) and MTBE (a fuel oxygenate) is summarized in Table 13.
When gasoline comes in contact with groundwater, the constituent compounds in gasoline dissolve into the aqueous phase. The rate and extent to which this occurs depends on the resistance to mass transfer and the relative solubility, the effect of reactions, and the strength of the driving force. This driving force is based on the thermodynamic equilibrium between the organic (NAPL) and aqueous phases. In the
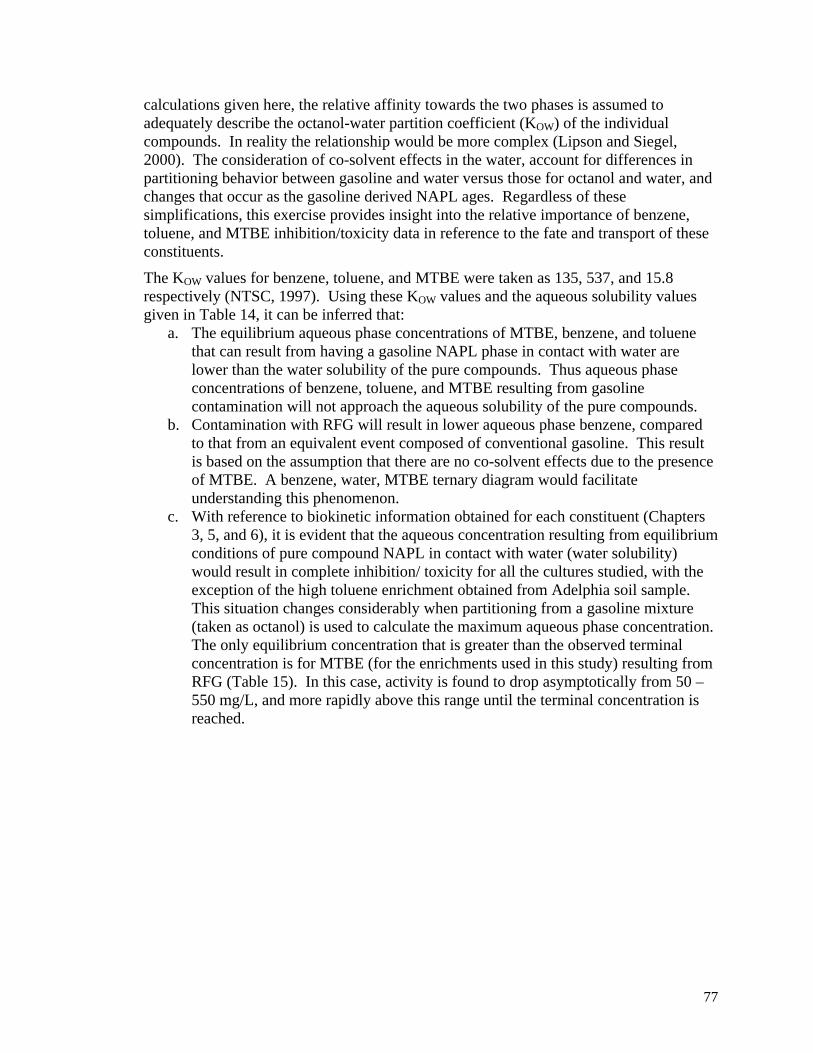
77
calculations given here, the relative affinity towards the two phases is assumed to adequately describe the octanol-water partition coefficient (KOW) of the individual compounds. In reality the relationship would be more complex (Lipson and Siegel, 2000). The consideration of co-solvent effects in the water, account for differences in partitioning behavior between gasoline and water versus those for octanol and water, and changes that occur as the gasoline derived NAPL ages. Regardless of these simplifications, this exercise provides insight into the relative importance of benzene, toluene, and MTBE inhibition/toxicity data in reference to the fate and transport of these constituents.
The KOW values for benzene, toluene, and MTBE were taken as 135, 537, and 15.8 respectively (NTSC, 1997). Using these KOW values and the aqueous solubility values given in Table 14, it can be inferred that:
a. The equilibrium aqueous phase concentrations of MTBE, benzene, and toluene that can result from having a gasoline NAPL phase in contact with water are lower than the water solubility of the pure compounds. Thus aqueous phase concentrations of benzene, toluene, and MTBE resulting from gasoline contamination will not approach the aqueous solubility of the pure compounds.
b. Contamination with RFG will result in lower aqueous phase benzene, compared to that from an equivalent event composed of conventional gasoline. This result is based on the assumption that there are no co-solvent effects due to the presence of MTBE. A benzene, water, MTBE ternary diagram would facilitate understanding this phenomenon.
c. With reference to biokinetic information obtained for each constituent (Chapters 3, 5, and 6), it is evident that the aqueous concentration resulting from equilibrium conditions of pure compound NAPL in contact with water (water solubility) would result in complete inhibition/ toxicity for all the cultures studied, with the exception of the high toluene enrichment obtained from Adelphia soil sample. This situation changes considerably when partitioning from a gasoline mixture (taken as octanol) is used to calculate the maximum aqueous phase concentration. The only equilibrium concentration that is greater than the observed terminal concentration is for MTBE (for the enrichments used in this study) resulting from RFG (Table 15). In this case, activity is found to drop asymptotically from 50 – 550 mg/L, and more rapidly above this range until the terminal concentration is reached.
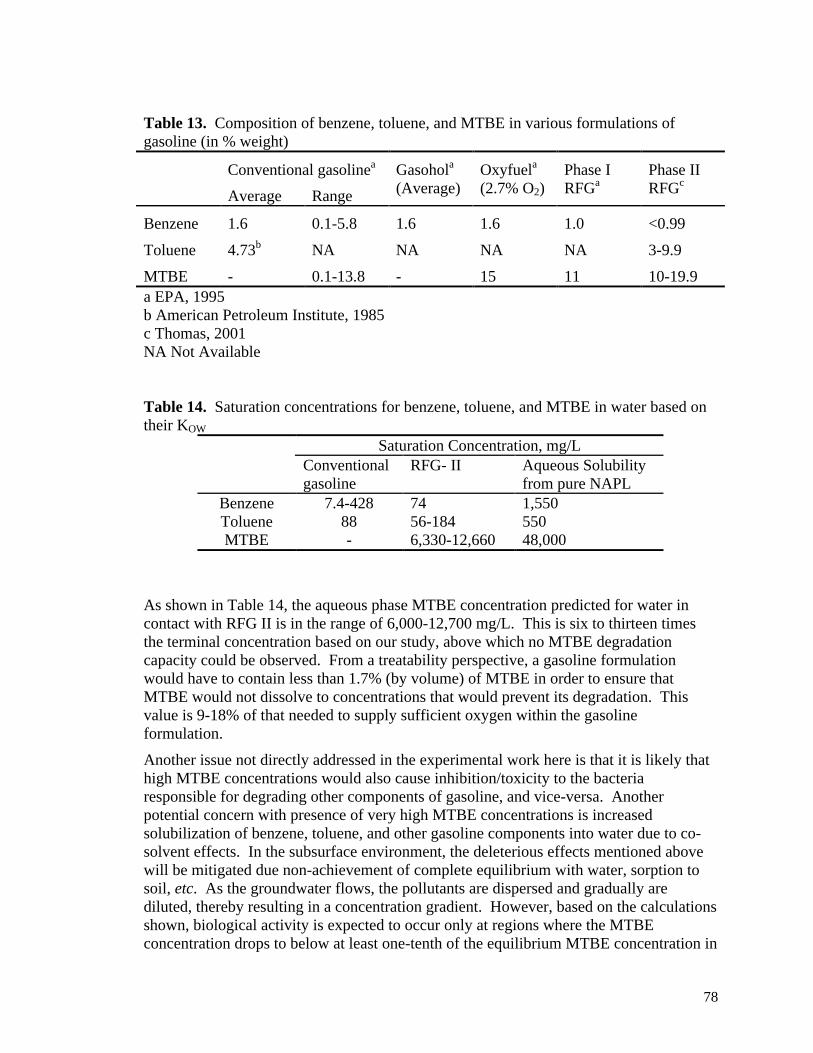
78
Table 13. Composition of benzene, toluene, and MTBE in various formulations of gasoline (in % weight)
Conventional gasolinea
Average Range
Gasohola (Average)
Oxyfuela (2.7% O2)
Phase I RFGa
Phase II RFGc
Benzene 1.6 0.1-5.8 1.6 1.6 1.0 <0.99
Toluene 4.73b NA NA NA NA 3-9.9
MTBE - 0.1-13.8 - 15 11 10-19.9 a EPA, 1995 b American Petroleum Institute, 1985 c Thomas, 2001 NA Not Available
Table 14. Saturation concentrations for benzene, toluene, and MTBE in water based on their KOW
Saturation Concentration, mg/L Conventional gasoline
RFG- II Aqueous Solubility from pure NAPL
Benzene 7.4-428 74 1,550 Toluene 88 56-184 550 MTBE - 6,330-12,660 48,000
As shown in Table 14, the aqueous phase MTBE concentration predicted for water in contact with RFG II is in the range of 6,000-12,700 mg/L. This is six to thirteen times the terminal concentration based on our study, above which no MTBE degradation capacity could be observed. From a treatability perspective, a gasoline formulation would have to contain less than 1.7% (by volume) of MTBE in order to ensure that MTBE would not dissolve to concentrations that would prevent its degradation. This value is 9-18% of that needed to supply sufficient oxygen within the gasoline formulation.
Another issue not directly addressed in the experimental work here is that it is likely that high MTBE concentrations would also cause inhibition/toxicity to the bacteria responsible for degrading other components of gasoline, and vice-versa. Another potential concern with presence of very high MTBE concentrations is increased solubilization of benzene, toluene, and other gasoline components into water due to co-solvent effects. In the subsurface environment, the deleterious effects mentioned above will be mitigated due non-achievement of complete equilibrium with water, sorption to soil, etc. As the groundwater flows, the pollutants are dispersed and gradually are diluted, thereby resulting in a concentration gradient. However, based on the calculations shown, biological activity is expected to occur only at regions where the MTBE concentration drops to below at least one-tenth of the equilibrium MTBE concentration in
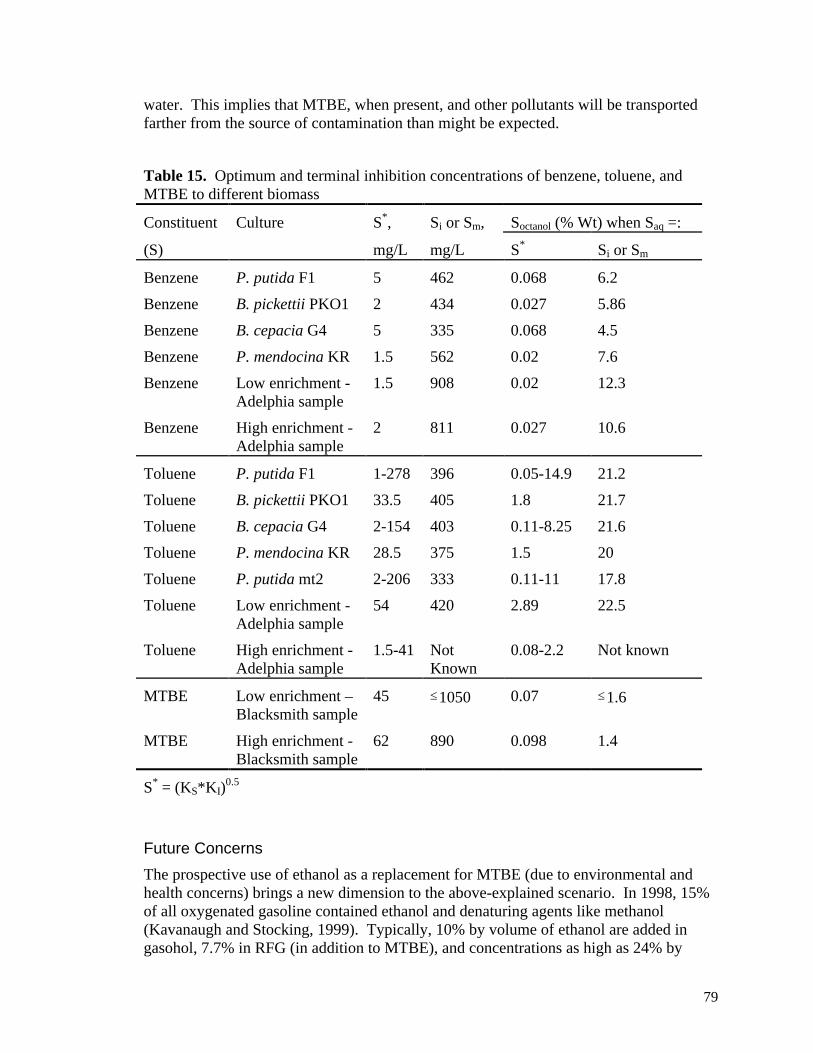
79
water. This implies that MTBE, when present, and other pollutants will be transported farther from the source of contamination than might be expected.
Table 15. Optimum and terminal inhibition concentrations of benzene, toluene, and MTBE to different biomass
Constituent Culture S*, Si or Sm, Soctanol (% Wt) when Saq =:
(S) mg/L mg/L S* Si or Sm
Benzene P. putida F1 5 462 0.068 6.2
Benzene B. pickettii PKO1 2 434 0.027 5.86
Benzene B. cepacia G4 5 335 0.068 4.5
Benzene P. mendocina KR 1.5 562 0.02 7.6
Benzene Low enrichment - Adelphia sample
1.5 908 0.02 12.3
Benzene High enrichment - Adelphia sample
2 811 0.027 10.6
Toluene P. putida F1 1-278 396 0.05-14.9 21.2
Toluene B. pickettii PKO1 33.5 405 1.8 21.7
Toluene B. cepacia G4 2-154 403 0.11-8.25 21.6
Toluene P. mendocina KR 28.5 375 1.5 20
Toluene P. putida mt2 2-206 333 0.11-11 17.8
Toluene Low enrichment - Adelphia sample
54 420 2.89 22.5
Toluene High enrichment - Adelphia sample
1.5-41 Not Known
0.08-2.2 Not known
MTBE Low enrichment – Blacksmith sample
45 ≤1050 0.07 ≤1.6
MTBE High enrichment - Blacksmith sample
62 890 0.098 1.4
S* = (KS*KI)0.5
Future Concerns
The prospective use of ethanol as a replacement for MTBE (due to environmental and health concerns) brings a new dimension to the above-explained scenario. In 1998, 15% of all oxygenated gasoline contained ethanol and denaturing agents like methanol (Kavanaugh and Stocking, 1999). Typically, 10% by volume of ethanol are added in gasohol, 7.7% in RFG (in addition to MTBE), and concentrations as high as 24% by
80
volume by some oil companies in Brazil. The implications of such formulations are fast dissolution in water (ethanol is highly miscible), lower sorption, and cosolvency effects. Corseuil et al. (1998) reported that the solubility of BTEX compounds in water is increased at aqueous phase ethanol concentrations >10,000 ppm. This could not only result in the more rapid and farther transport of these compounds but may also result in aqueous phase concentrations of ethanol and BTEX compounds that are toxic to the microorganisms that can degrade them. These potentialities should be considered while collecting data on their likely impact to BTEX fate and transport.
Finally, while much of the focus in the past has been on gasoline spills and leaks, contamination of the environment also occurs from pure solvent (MTBE and BTEX) spills and leaks, and thus a greater extent of groundwater contamination (Burtt, 2001). These events result in much higher groundwater concentrations of benzene, toluene, and MTBE. Under these conditions, the likelihood is that substrate toxicity and limitations of low temperature and availability of electron acceptors will result in lower biological activity of the native subsurface population, as shown in this study, and thus a greater extent of groundwater contamination.
Analysis concerning how to apply the kinetics results from this work to improve groundwater modeling efforts.
Conversion From Specific Growth Rate Kinetics To Kinetics Useful For Groundwater Modeling
The most commonly used kinetics model for simulating contaminant biodegradation in groundwater modeling is a first order decay expression dependent on substrate concentration. This model is used because it is typically impossible to know the amount of biomass present and in most cases it does not vary greatly enough over time or space to make modeling it a worthwhile exercise. So instead of writing:
r XS
K SX
S
= =+
µ µ$ Equation 10
which, under conditions where S<<KS simplifies to an expression which is first order with respect to substrate:
rK
SXS
=$µ
Equation 11
One usually writes:
r kS= Equation 12
Clearly this is limited to constant biomass concentration and low substrate concentrations and is therefore not useful where we wish if consider high substrate concentrations.
We cannot directly use the kinetics developed in this study because they have biomass concentration dependence and we do not know the biomass mass concentration in a soil
81
or aquifer. Additionally we do not wish to loose the ability to use the available literature on natural attenuation biodegradation rates because they, in general application, are biomass concentration independent. Therefore we need a way to combine the information learned in this study with the literature. A method to do that is presented here.
r kSK
SXS
= =$µ
Equation 13
Therefore the first order rate coefficient used in groundwater modeling is effectively the same as the Monod maximum specific growth rate divided by the Monod half saturation constant times the biomass concentration.
kK
XS
=$µ
Equation 14
Because the Monod specific growth rate is ½ the Monod maximum specific growth rate when S = ½ KS it follows that the value of the effective maximum rate can be calculated from the first order rate coefficient at a value of S=2KS, or:
$r k KS= ∗2 Equation 15
This maximum rate can them be used to calculate the contaminant concentration dependent rate using equations analogous to those developed in this research. In other words the parameter values for KS, KI, θ, i, etc. are used to modify the maximum rate to obtain an appropriate rate at a given contaminant concentration. For example, if we take a typical first order rate coefficient for toluene from the literature (Aronsen et al, 1998) of 0.01 day-1 and the KS value we found for noninhibitory conditions for P. putida mt2 we obtain:
dayLmgKkr S −==∗= /0194.097.0*2*01.02ˆ Equation 16
this can then be converted to the preferred concentration dependent rate model for P. putida mt2 growing on toluene by using the kinetic parameter values given in Table 7. This overall model is:
)206(0019.97.0
*0194.0)(ˆ −−+
=−−+
= SS
SSSi
SK
Srr
Sθ Equation 17
Similar calculations can be performed for all other microbial population – contaminant pairs. These equations can them be incorporated into groundwater transport models. Once this is done these improved models would models should be corroborated and if possible verified through comparison with detailed field and column study data.
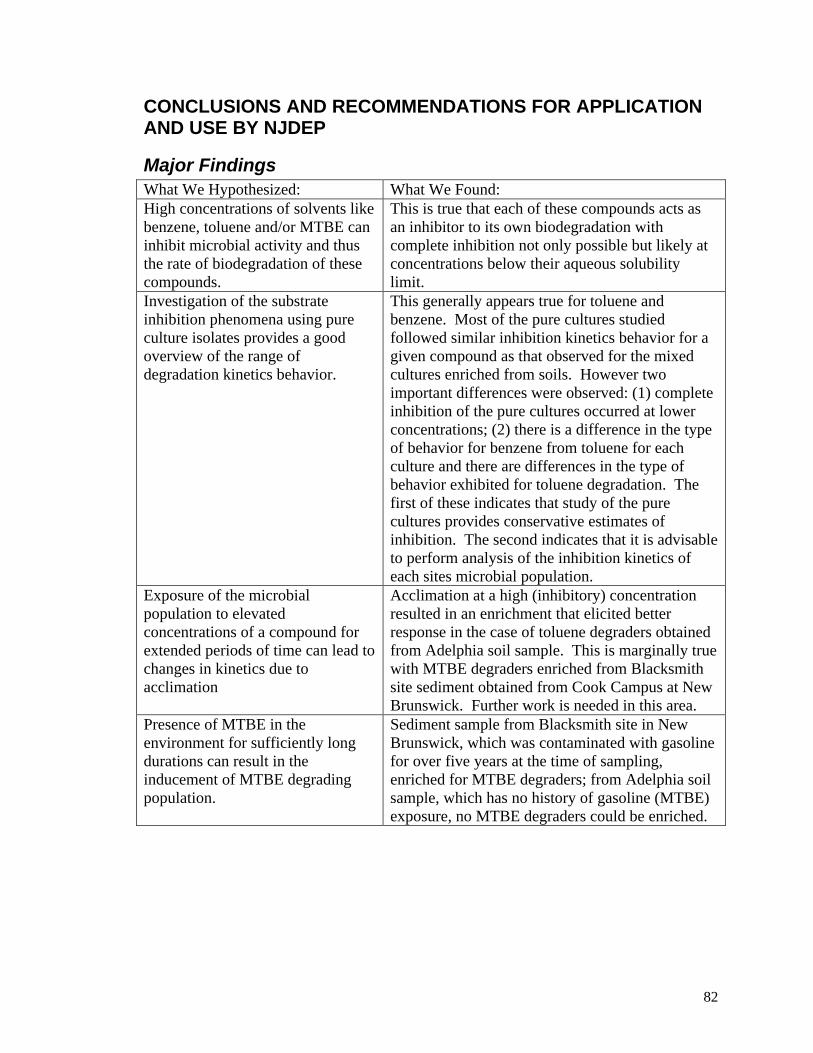
82
CONCLUSIONS AND RECOMMENDATIONS FOR APPLICATION AND USE BY NJDEP
Major Findings What We Hypothesized: What We Found: High concentrations of solvents like benzene, toluene and/or MTBE can inhibit microbial activity and thus the rate of biodegradation of these compounds.
This is true that each of these compounds acts as an inhibitor to its own biodegradation with complete inhibition not only possible but likely at concentrations below their aqueous solubility limit.
Investigation of the substrate inhibition phenomena using pure culture isolates provides a good overview of the range of degradation kinetics behavior.
This generally appears true for toluene and benzene. Most of the pure cultures studied followed similar inhibition kinetics behavior for a given compound as that observed for the mixed cultures enriched from soils. However two important differences were observed: (1) complete inhibition of the pure cultures occurred at lower concentrations; (2) there is a difference in the type of behavior for benzene from toluene for each culture and there are differences in the type of behavior exhibited for toluene degradation. The first of these indicates that study of the pure cultures provides conservative estimates of inhibition. The second indicates that it is advisable to perform analysis of the inhibition kinetics of each sites microbial population.
Exposure of the microbial population to elevated concentrations of a compound for extended periods of time can lead to changes in kinetics due to acclimation
Acclimation at a high (inhibitory) concentration resulted in an enrichment that elicited better response in the case of toluene degraders obtained from Adelphia soil sample. This is marginally true with MTBE degraders enriched from Blacksmith site sediment obtained from Cook Campus at New Brunswick. Further work is needed in this area.
Presence of MTBE in the environment for sufficiently long durations can result in the inducement of MTBE degrading population.
Sediment sample from Blacksmith site in New Brunswick, which was contaminated with gasoline for over five years at the time of sampling, enriched for MTBE degraders; from Adelphia soil sample, which has no history of gasoline (MTBE) exposure, no MTBE degraders could be enriched.
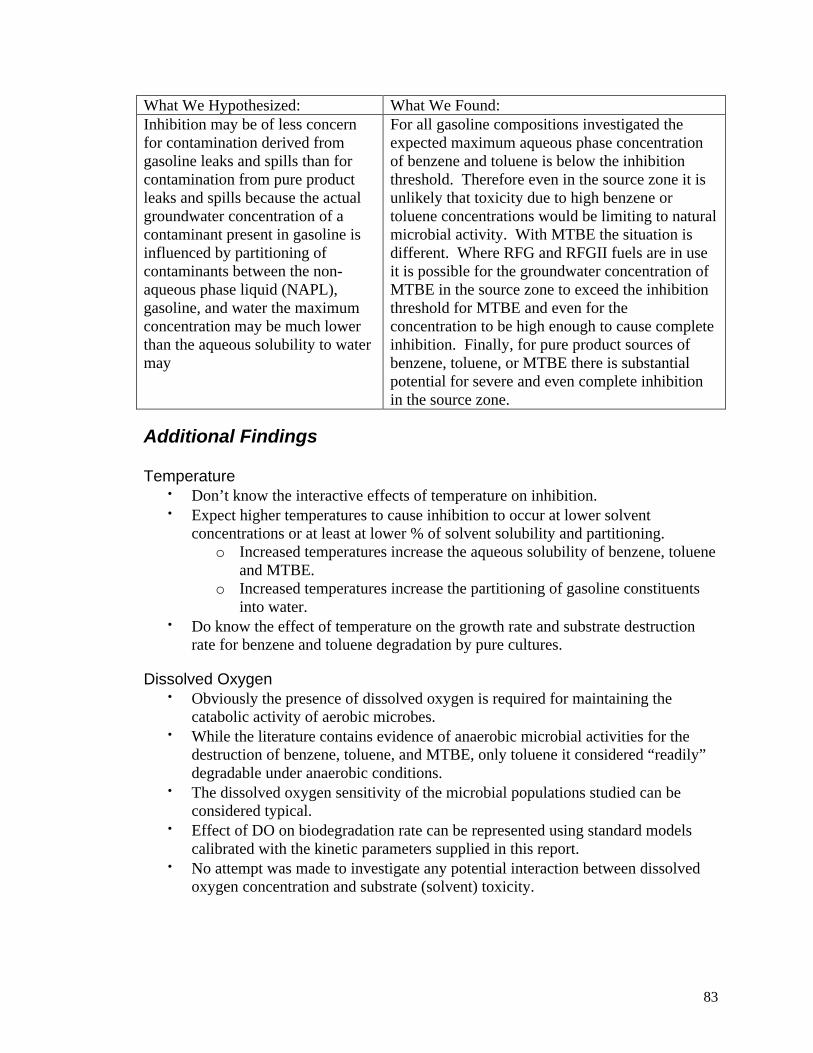
83
What We Hypothesized: What We Found: Inhibition may be of less concern for contamination derived from gasoline leaks and spills than for contamination from pure product leaks and spills because the actual groundwater concentration of a contaminant present in gasoline is influenced by partitioning of contaminants between the non-aqueous phase liquid (NAPL), gasoline, and water the maximum concentration may be much lower than the aqueous solubility to water may
For all gasoline compositions investigated the expected maximum aqueous phase concentration of benzene and toluene is below the inhibition threshold. Therefore even in the source zone it is unlikely that toxicity due to high benzene or toluene concentrations would be limiting to natural microbial activity. With MTBE the situation is different. Where RFG and RFGII fuels are in use it is possible for the groundwater concentration of MTBE in the source zone to exceed the inhibition threshold for MTBE and even for the concentration to be high enough to cause complete inhibition. Finally, for pure product sources of benzene, toluene, or MTBE there is substantial potential for severe and even complete inhibition in the source zone.
Additional Findings
Temperature • Don’t know the interactive effects of temperature on inhibition. • Expect higher temperatures to cause inhibition to occur at lower solvent
concentrations or at least at lower % of solvent solubility and partitioning. o Increased temperatures increase the aqueous solubility of benzene, toluene
and MTBE. o Increased temperatures increase the partitioning of gasoline constituents
into water. • Do know the effect of temperature on the growth rate and substrate destruction
rate for benzene and toluene degradation by pure cultures.
Dissolved Oxygen • Obviously the presence of dissolved oxygen is required for maintaining the
catabolic activity of aerobic microbes. • While the literature contains evidence of anaerobic microbial activities for the
destruction of benzene, toluene, and MTBE, only toluene it considered “readily” degradable under anaerobic conditions.
• The dissolved oxygen sensitivity of the microbial populations studied can be considered typical.
• Effect of DO on biodegradation rate can be represented using standard models calibrated with the kinetic parameters supplied in this report.
• No attempt was made to investigate any potential interaction between dissolved oxygen concentration and substrate (solvent) toxicity.
84
Findings From Separate But Related Work • MTBE biodegradation is dependent of dissolved oxygen concentration with a KO2
of 0.7 mg O2/L (Park, 1999). • Anaerobic MTBE degradation is possible under sulfate reducing conditions
(Somsomak et al, 2001).
Final question from Paul Sanders: “How high can we go and still have natural attenuation be active, and roughly what might the rates be?”
• Some activity can be expected as long as aqueous phase concentrations are below the concentrations at which complete inhibition occurs. Based on the most conservative results of this study that would be benzene concentrations below 335 mg/L (B. cepacia G4), toluene concentrations below 333 mg/L (P. putida mt2), and MTBE concentrations below 890 mg/L (high concentration enrichment).
• Therefore where gasoline served as the source of groundwater contamination there should be no case where the benzene or toluene concentration is too high to permit aerobic biological activity. In most cases with gasoline contamination aqueous MTBE concentrations should also be low enough to allow aerobic biological activity, the exception would be that in the near source area of RFG and RFGII contaminated sites the MTBE concentration could be well above the level which can cause 100% inhibition of MTBE degraders.
• Where pure compound spills are concerned all three compounds can lead to 100% inhibition.
• If source zone removal is practiced there should be no situation where benzene or toluene prevents biological activity. There is less certainty this would also be true for MTBE.
• As far as rates are concerned: Because of uncertainties in the amount of biomass present in an aquifer it is difficult to directly convert from the type of kinetics presented in this study to those typically used in simulations of in-situ biological activity (e.g., in modeling of natural attenuation). However, this should not prevent the results of this work from being useful for natural attenuation simulations. The recommended approach is to use the results given here to modify literature and/or experimental values of in-situ degradation rates.
• Literature values for in-situ degradation (loss) rates for organic contaminants are typically given as first order rate coefficients (first order with respect to the contaminant concentration). For benzene and toluene the value of this parameter is typically in the range of 0.001 to 0.013 /day (Aronsen et al, 1998 -field data), for MTBE the values are lower, typically 0.0005 to 0.005/day (Wilson and Kolhatkar, 2002 - field data). The need is to convert from these first order kinetics models, which are applicable only at very low contaminant concentrations, to more complex models that account for saturation kinetics and inhibition kinetics behavior. Details on a suggested way to perform these conversions are given in the Task 8 part of this report.
85
REFERENCES Aiba, S., Shoda, M. and Nagatani, M. 1968. Kinetics of product inhibition in alcohol
kinetics. Biotechnol. Bioeng. 10: 845-864.
Aitken, M. D. 1993. Batch biological treatment of inhibitory substrates. J. Environ. Eng., 119(5): 855-869.
Alagappan, G. 2000. ===. Dissertation. Environmental Sciences Graduate Program, Rutgers, The Stete University of New Jersey.
Alagappan, G. and R. M. Cowan. 2001. Biokinetic Models for Representing the Complete Inhibition of Microbial Activity at High Substrate Concentrations. Biotechnol. Bioeng. 75: 393-405.
American Petroleum Institute. 1985. Laboratory study of solubilities of petroleum hydrocarbons in groundwater. API Publ. 4395.
Andrews, J. F. 1968. A mathematical model for the continuous culture of microorganisms utilizing inhibitory substrates. Biotechnol. Bioeng. 10: 707-723.
APHA, AWWA, WEF. 1995. Microbiological examination. In: A. D. Eaton, L. S. Clesceri, A. E. Greenberg (ed.), Standard methods for the examination of water and wastewater, 19th ed. American Public Health Association, American Water Works Association, Water Environment Federation, Washington, D. C., 9-32 p.
Aronson, D., M. Citra, K. Shuler, H. Printup, and P.H. Howard. 1998. Aerobic Biodegradation of Organic Chemicals in Environmental Media: A Summary of Field and Laboratory Studies. Prepared for U.S. EPA, Athens, GA.
Arrhenius, S. 1889. Über die reaktionsgeschwindigkeit bei ber inversion von rohrzucker durk sauren. Zeitschrift für Physikalische Chemie. 4: 226-248.
Berg, J.D., Roberts, P.V., Matin, A. 1986. Effect of chlorine dioxide on selected membrane functions of Escherichia coli. J. Appl. Bacteriol. 60(3): 213-220.
Brock, T. D., Madigan, M. T., Martinko, J. M. and Parker, J. 1994. Biology of Microorganisms. Seventh edition, Prentice Hall, Englewood Cliffs, New Jersey, USA.
Brown, S. C. and Grady, C. P. L. 1990. Biodegradation kinetics of substituted phenolics: Demonstration of a protocol based on electrolytic respirometry. Water Res. 24: 853-861.
Burtt, R. 2001. Firm faces charges after chemical spill. Kitchener-Waterloo Record.
Chang, M.-K., Voice, T. C. and Criddle, C. S. 1993. Kinetics of competitive inhibition and cometabolism in the biodegradation of benzene, toluene, and p-xylene by two Pseudomonas isolates. Biotechnol. Bioeng. 41: 1057-1065.
Choi , Y.-B., Lee, J.-Y. and Kim, H.-S. 1992. A novel bioreactor for the biodegradation of inhibitory organic solvents: experimental results and mathematical analysis. Biotechnol. Bioeng. 40: 1403-1411.
86
Corseuil, H. X., Hunt, C. S., Dos Santos, R. C. F. and Alvarez, P. J. J. 1998. The influence of the gasoline oxygenate ethanol on aerobic and anaerobic BTX biodegradation. Water Res. 32(7): 2065-2072.
Costa, J., Moriera, A. R. 1983. Growth inhibition kinetics for the acetone-butanol fermentation. In: Foundations of Biochemical engineering. Kinetics and thermodynamics in biological systems. ACS symposium series no. 207, pp. 501-514.
Cowan, R. M. and Park, K. 1996. Biodegradation of the gasoline oxygenates MTBE, ETBE, TAME, TBA, and TAA by aerobic mixed cultures. HAZARD IND WASTES PROC MID ATL IND WASTE CONF. LANCASTER, PA, (USA):. pp. 523-530
Daigger, G. T. 1979. The interaction of physiological adaptation and transient response for Pseudomonas putida and its implications for dynamic modeling of microbial growth. Ph.D. Dissertation, Purdue Univ., W. Lafayette, IN.
de Ory, I., Romero, L. E. and Canter, D. 1998. Modelling the kinetics of growth of Acetobacter aceti in discontinuous culture: influence of the temperature of operation. Appl. Microbiol. Biotechnol. 49: 189-193.
de Smet, M. J., Kingma, J. and Witholt, B. 1978. The effect of toluene on the structure and permeability of the outer and cytoplasmic membranes of Escherichia coli. Biochim. Biophys. Acta. 506: 64-80.
Edwards, V. H. 1970. The influence of high substrate concentration on microbial kinetics. Biotechnol. Bioeng. 12: 679-712.
EPA. 1995. Office of mobile sources. 420-F-95-007.
Flores, M. V., Voget, C. E., Ertola, R. J. J. 1994. Permeabilization of yeast cells (Kluyveromyces lactis) with organic solvents. Enzyme Microb. Technol. 16: 340-346.
Goudar, C. T. and Strevett, K. A. 1998. Comparison of relative BTEX biodegradation using respirometry. J. Indust. Microbiol. Biotechnol. 21: 11-18.
Grady, C. P. L. Jr. 1990. Biodegradation of toxic organics: status and potential. J. Environ. Eng. 116(5): 805-828.
Grady, C. P. L. Jr., Daigger, G. T., Lim, H. C. 1999. Biological wastewater treatment. 2nd edition. Marcel Dekker, New York.
HACH 1998. Products for analysis. Loveland, Colorado, USA. P. 23.
Hack, C. J., Woodley, J. M., Lilly, M. D. and Liddell, J. M. 2000. Design of a control system for biotransformation of toxic substrates: toluene hydroxylation by Pseudomonas putida UV4. Enz. Microb. Technol. 26: 530-536.
Haight, R. D. and Morita, R. Y. 1966. Thermally induced leakage from Vibrio marinus, an obligately psychrophilic marine bacterium. J. Bacteriol. 92: 1388-1393.
Haldane, J. B. S. 1930. Enzymes. Longman, London.
87
Han, K. and Levenspiel, O. 1988. Extended Monod kinetics for substrate, product, and cell inhibition. Biotechnol. Bioeng. 32: 430-437.
Heipieper, H. J., Weber, F. J., Sikkema, J., Keweloh, H., and de Bont, J. A. M. 1994. Mechanisms of resistance of whole cells to toxic organic solvents. TIBTECH. 12: 409-415.
Heipieper, H.-J., Keweloh, H., Rehm, H.-J. 1991. Influence of phenols on growth and membrane permeability of free and immobilized Escherichia coli. Appl. Environ. Microbiol. 57:1213-1217.
Herbst, B., Wiesmann, U. 1996. Kinetics and reaction engineering aspects of the biodegradation of dichloromethane and dichloroethane. Water Res. 30(5): 1069-1076.
Jones, G. L., Jansen, F., McKay, A. J. 1973. Substrate inhibition of growth of bacterium NCIB 8250 by phenol. J. Gen. Microbiol. 74: 139-148.
Kavanaugh, M. C. and Stocking, A. 1999. Fate and transport of ethanol in the environment. Presented to the Environmental Protection Agency Blue Ribbon Panel.
Kirchstetter, T. W., Singer, B. C., Harley, R. A., Kendall, G. R. and Hesson, J. M. 1999. Impact of California reformulated gasoline on motor vehicle emissions. 2. Volatile organic compounds speciation and reactivity. Environ. Sci. Technol. 33: 329-336.
Kukor, J. J. and Olsen, R. H. 1996. Catechol 2,3-dioxygenases functional in oxygen-limited environments. Appl. Environ. Microbiol. 62(5): 1728-1740.
Kukor, J.J. Kaphammer, B A 1994. Novel toluene-3-monooxygenase pathway cloned from Pseudomonas pickettii PKO1. J. Bacteriol. 176, 3749-3756.
Lipson, D. and Siegel, D. I. 2000. Using ternary diagrams to characterize transport and attenuation of BTX. Ground Water (Dublin). 38(1): 106-113.
Löser, C. and Ray, P. 1994. Modelling the aerobic degradation of toluene in a closed chemostat with and without a head space outlet. Acta Biotechnol. 14: 355-366.
Löser, C., Ait Oubelli, M. and Hertel, T. 1998. Growth kinetics of the 4-nitrophenol degrading strain Pseudomonas putida PNP1. Acta Biotechnol. 18(1): 29-41.
Luong, J. H. T. 1987. Generalization of Monod kinetics for analysis of growth data with substrate inhibition. Biotechnol. Bioeng. 29: 242-248.
Mackey, B. M., Miles, C. A., Parsons, S. E. and Seymour, D. A. 1991. Thermal denaturation of whole cells and cell components of Escherichia coli examined by differential scanning calorimetry. J. Gen. Microbiol. 137: 2361-2374.
Maftah, A., Renault, D., Vignoles, C., Hechard, Y., Bressollier, P., Ratinaud, M.H., Cenatiempo, Y., Julien, R. 1993. Membrane permeabilization of Listeria monocytogenes and mitochondria by the bacteriocin mesentericin Y105. J. Bacteriol. 175(10): 3232-3235.
88
Mayo, A. W. 1997. Effect of temperature and pH on the kinetic growth of unialga Chlorella vulgaris cultures containing bacteria. Water Environ. Res. 69(1): 64-72.
MicroMath, Inc. 1995. Scientist
for experimental data fitting. Salt Lake City, Utah, USA.
Mirpuri, R., Jones, W. and Bryers, J. D. 1997. Toluene degradation kinetics for planktonic and biofilm-grown cells for Pseudomonas putida 54G. Biotechnol. Bioeng. 53: 535-546.
Moletta, R., Verrier, D., Albagnac, G. 1986. Dynamic modelling of anaerobic digestion. Water Res. 20(4): 427-434.
Monod, J. 1949. The growth of bacterial cultures. Ann. Rev. Microbiol. 3: 371-394.
Naziruddin, M., Grady, C.P.L., Jr., and Tabak, H. H. 1995. Determination of biodegradation kinetics for volatile organic compounds through the use of respirometry. Water Environ. Res., 67: 151-158.*
NTSC. 1997. Interagency assessment of oxygenated fuels. Executive office of the President of United States. National Science and Technology Council, Committee on Environmental and Natural Resources.
Oh, Y.-S., Shareefdeen, Z., Baltzis, B. C., and Bartha, R. 1994. Interactions between benzene, toluene, and p-xylene (BTX) during their biodegradation. Biotechnol. Bioeng. 44: 533-538.
Park, K. Y. 1999. Biodegradation of the fuel oxygenate, methyl tert-butyl ether (MTBE), and treatment of MTBE contaminated ground water in laboratory scale reactors. Ph.D. Dissertation, Department of Environmental Sciences, Rutgers University, New Jersey, USA.
Pedersen, A. R., Møller, S., Molin, S. and Arvin, E. 1997. Activity of toluene degrading Pseudomonas putida in early growth phase of a biofilm for waste gas treatment. Biotechnol. Bioeng. 54: 131-141.
Pellack-Walker, P. and Blumer, J. L. 1986. DNA damage in L5178YS cells following exposure to benzene metabolites. Mol. Pharmacol. 30: 42-47.
Pilát, P., Prokop, A. 1975. The effect of methanol, formaldehyde, and formic acid on growth of Candida boidinii 11 Bh. Biotechnol. Bioeng. 16: 1717-1728.
Reardon, K. F., Mosteller, D. C. and Bull Rogers, J. D. 2000. Biodegradation kinetics of benzene, toluene, and phenol as single and mixed substrates for Pseudomonas putida F1. Biotechnol. Bioeng. 69: 385-400.
Robbins, G. A., Wang, S. and Stuart, J. D. 1993. Using the static headspace method to determine Henry’s law constants. Anal. Chem. 65: 3113-3118.
Rottem, S., Yagen, B., Katznell, A. 1984. Effect of trichothecenes on growth and intracellular pool size of Mycoplasma gallisepticum. FEBS Letters. 175(1): 189-192.
Rozich, A. F., Castens, D. J. 1986. Inhibition kinetics of nitrification in continuous-flow reactors. J. Water Pollut. Control Fed. 58(3): 220-226.
89
Rubin, H., Rathfelder, K., Abriola, L. M. 1997. Modelling quasi-steady NAPL dissolution in fractured permeable media. J. Environ. Eng. 123(3): 205-216.
Saylor, J. H., Stuckey, J. M. and Gross, P. M. 1938. Solubility studies. V. The validity of Henry’s law for the calculation of vapor solubilities. J. Am. Chem. Soc. 60: 373-376.
Schirmer, M. 1998. Investigation of multi-scale biodegradation processes: A modelling approach. Ph.D. thesis, University of Waterloo, Ontario, Canada.
Schirmer, M., Butler, B. J., Roy, J. W., Frind., E. O., Barker, J. F. 1999. A relative least-squares technique to determine unique Monod kinetic parameters of BTEX compounds using batch experiments. J. Contaminant Hydrol. 37(1-2): 69-86.
Shaler, T. A. and Kleèka, G. M. 1986. Effect of dissolved oxygen concentration on biodegradation of 2,4-dichlorophenoxyacetic acid. Appl. Environ. Microbiol. 51(5): 950-955.
Shen, Y., Shen, H.-M., Shi, C.-Y. and Ong, C.-N. 1996. Benzene metabolites enhance reactive oxygen species generation in HL60 human leukemia cells. Human Exp. Toxicol. 15(5), 422-427.
Sikkema, J., de Bont, J. A. M., Poolman, B. 1994. Interactions of cyclic hydrocarbons with biological membranes. J. Biol. Chem. 269: 8022-8028.
Sikkema, J., de Bont, J. A. M., Poolman, B. 1995. Mechanism of membrane toxicity of hydrocarbons. Microbiol. Rev. 59(2), 201-222.
Silver, S., Wendt, L. 1967. Mechanism of action of phenethyl alcohol: breakdown of the cellular permeability barrier. J. Bacteriol. 93: 560-566.
Skerlavaj, B. Romeo, D., Gennaro, R. 1990. Rapid membrane permeabilization and inhibition of vital functions of Gram-negative bacteria by bactenecins. Infection and Immunity. 58(11): 3724-3730.
Smejtek, P. 1987. The physicochemical basis of the membrane toxicity of pentachlorophenol: an overview. J. Membrane Sci. 33: 249-268.
Smets, B. F., Jobbagy, A., Cowan, R. M., and Grady, C. P. L. Jr. 1996. Evaluation of respirometric data: Identification of features that preclude data fitting with existing kinetic expressions. Ecotoxicol. Environ. Saf. 33: 88-99.
Snyder, R., Witz, G. and Goldstein, B. G. 1993. The toxicology of benzene. Environ. Health Perspectives, 100: 293-306.
Sock, S. M. 1993. A comprehensive evaluation of biodegradation as a treatment alternative for removal of 1,4-dioxane. Master of Science Thesis, Environmental Systems Engineering, Clemson University, Clemson, SC
Suwa, Y., Imamura, Y., Suzuki, T., Tahiro, T., Urushigawa, Y. 1994. Ammonia-oxidizing bacteria with different sensitivities to (NH4)2SO4 in activated sludges. Water Res. 28(7): 1523-1532.
Thomas, M. 2001. Data on CARB (California) Phase II reformulated gasoline. Global Engineers, Milwaukee, WI. Personal Communication.
90
Thouand, G. Capdeville, B. and Block, J. C. 1996. Preadapted inocula for limiting the risk of errors in biodegradability tests. Ecotoxicol. Environ. Saf. 33: 261-297.
Tomlins, R. I. And Ordal. Z. J. 1976. Thermal injury and inactivation in vegetative bacteria. In: Inhibition and inactivation of vegetative microbes. Edited by F. A. Skinner and W. B. Hugo. pp. 153-190. Academic Press, New York.
Topiwala, H. and Sinclair, C. G. 1971. Temperature relationship in continuous culture. Biotechnol. Bioeng. 13: 795-813.**
Turner, L. H. 1995. Vapor-liquid equilibrium of highly non-ideal aqueous organic system. Ph.D. thesis submitted in Chemical and Biochemical Engineering Program, Rutgers University.
U. S. Environmental Protection Agency. 1997. Drinking water advisory: Consumer acceptability advice and health effects analysis on methyl tertiary-butyl ether (MtBE). EPA-822-F-97-009. Office of water, 4304.
Vaishnav, D. M., Lopas, D. M. 1985. Relationship between lipophilicity and biodegradation inhibition of selected industrial chemicals. Dev. Ind. Microbiol. 26: 557-565.
Velizarov, S., Beschkov, V. 1998. Biotransformation of glucose to free gluconic acid by Gluconobacter oxidans: substrate and product inhibition situations. Process Biochem. 33(5): 527-534.
Verrips, C. T. and Kwast, R. H. 1977. Heat resistance of Citrobacter freundii in media with various water activities. Eur. J. Appl. Microbiol. 4: 225-231.
Verrips, Th. and Brevoort, H. 1979. Some molecular aspects of heat inactivation of C. freundii. Antonie van Leeuwenhoek, 45: 613.
Wayman, M. and Tseng, M. C. 1976. Inhibition threshold substrate concentrations. Biotechnol. Bioeng. 18: 383-387.
Weaver JW, Hass JE & Wilson JT 1996. Analysis of gasoline spill at East Patchoque, New York. Proc. American Society of Civil Engineers Conference on Non-aqueous liquids in the subsurface environment. November 12-14, Washington DC.
Wilson, J.T. and R. Kolhatkar. 2002. Role of Natural Attenuation in Life Cycle of MTBE Plumes. J. Environ. Eng. 128: 876-882.
Yarmoff, J.-J., Kawakami, Y., Yago, T. and Nishimura, H. 1988. Benzene toxicity and yield improvement in a cis-benzeneglycol production process. J. Ferment. Technol. 66(3), 313-321.
Yerushalmi, L. and Guiot, S. R. 1998. Kinetics of biodegradation of gasoline and its components. Appl. Microbiol. Biotechnol. 49(4), 475-481.
Zylstra, G. 1994. Molecular analysis of aromatic hydrocarbon degradation. In: S. J. Garte (ed.), Molecular environmental biology, Lewis publishers, Ann Arbor.

91
Zylstra, G.J. Gibson, D.T 1989. Toluene degradation by Pseudomonas putida F1. Nucleotide sequence of the todC1C2BADE genes and their expression in Escherichia coli. J. Biol. Chem. 264, 14940-14946.


![Degradation Kinetics of Metronidazole in Solution[1]](https://img.dokumen.tips/doc/110x75/54f94e5c4a7959d7638b4b82/degradation-kinetics-of-metronidazole-in-solution1.jpg)