Embed Size (px)
Citation preview
Thermal Degradation and Isomerisation Kinetics of Triolein studied by Infrared
Spectrometry and GC-MS Combined with Chemometrics
Alfred A. Christy*, Zhanfeng Xu1 and Peter de B. Harrington
1
Department of Chemistry, Faculty of Engineering and Science, University of Agder, Serviceboks 422, N-4604 Kristiansand, Norway.
1Department of Chemistry and Biochemistry, Clippinger Laboratories, OHIO University, Athens 45701, Ohio, USA.
Abstract
Triolein, a triglyceride containing oleic acid as the only acid moiety in the glyceride molecules has been isothermally treated at 280, 300, and 325 oC in glass vials under nitrogen atmosphere. The products formed during the thermal treatment at each temperature have been analysed both by infrared spectrometry and GC-MS. The GC-MS analysis was performed after derivatisation of the fatty acids into their methyl esters (FAMEs).
Chemometric tools were used in determining the concentrations of the main products namely triolein and trieaidin in the thermally treated mixtures. The concentration profiles of the trielaidin formed during thermal treatment at the above three temperatures were used in determining activation energy for the cis-trans isomerisation of triolein
The combined analysis reveals that the thermal treatment induces not only cis-trans isomerisation but also fission and fusion in the molecules. Furthermore, migration of the double bond in oleic and elaidic acids forming cis and trans isomers of the 18:1 acid was also observed. The heat induced isomerisation in triolein follows a zeroeth order reaction with an activation energy 41±5 kcal/mol.
Introduction
During heating and frying of oils fatty acid moieties in glyceride molecules can undergo several changes and lead to several different products. The mono and poly unsaturated fatty acid molecules can isomerise to trans fatty acids or undergo oxidation and degrade into other products or undergo intra cyclisation or polymerization [1-5]. Some of the products formed are toxic in higher concentrations. The processes leading to these products are very complex and identifying the precursors of different products can be difficult because of the number of fatty acids involved. Isomerisation of mono unsaturated and poly unsaturated 18 carbon fatty acids lead to all the different trans isomers in the heated oil. Analysing such a complex mixture for its total chemical composition is a daunting task.
Our intention in this work is to study the isomerisation kinetics for the cis-trans isomerisation of triolein in inert atmosphere. With several decades of research in the field of lipids, it is hard to find any research work that is dealing with the determination of kinetic parameters of lipids containing pure lone fatty acids. The published literature only deals with the chemical analysis of the mixture formed during heating of pure fatty acids [6-9], or methyl esters [10]. No kinetic parameters presented.
To study the isomerization kinetics, the information from the literature as mentioned in the preceding paragraph had to be taken in mind to plan the experimental and analytical methods for
brought to you by COREView metadata, citation and similar papers at core.ac.uk
provided by Agder University Research Archive
the study of the process. Triolein is a glyceride containing only 18:1(9) cis fatty acid units in the glyceride molecules. The heating process will lead to the formation of elaidic acid units in the glyceride molecules. Determination of kinetic parameters for the isomerization requires precise determination of the concentration of either reacted oleic acids or formed elaidic acids in the reaction mixture at regular time interval. There are two analytical methods that are used in this paper for the evaluation of the concentration of trans isomer/s in the mixtures. They are namely, infrared spectrometry and GC-MS.
The use infrared spectrometry and gas chromatography to determine the trans content in edible oils and fats have been extensively investigated and they are standardized by The American Oil Chemists Society (AOCS) [11]. Two of the methods employ gas chromatography and the third one employs conventional infrared spectrometry. The quantitative determination of trans fatty acid concentration in fats and oils is based on the fact that the trans isomers of monounsaturated fatty acids and trans isomers of the polyunsaturated fatty acids containing isolated double bonds give rise to one specific absorption at 969 cm-1. This absorption arises due to the =CH out of plane deformation vibration [12-15].
However, the absorption band representing this absorption is broad with downward sloping base line because of the overlap of the broad absorption of triglycerides and of the C-H out-of-plane deformation bands arising from the conjugated linoleic acids in the sample. The AOCS method involves the comparison of the peak height of the trans band of the sample dissolved in carbon disulphide (CS2 2% v/v) to the peak height of the trans band of elaidic acid at the same concentration when trans content is higher than 15%. The comparison is made with the peak height of the trans band of methyl elaidate when the trans content is less than 15%. This procedure requires sample preparation in a solvent that is considered unpleasant and toxic. Furthermore, the oil or fat under analysis has to go through saponification and methylation process to eliminate the sloping glyceride band.
There has been progress made in the use of the trans band in the quantification of trans fatty acids in edible oils and fats. Mossoba et al. [16] have summarised the developments in the sample handling and computational techniques in quantifying the absorption around 669 cm-1. Developments in infrared instrumentation, sampling techniques and multivariate data handling software were responsible for the refinements in the determination of trans fatty acids by infrared spectroscopy. Using the attenuated total internal reflectance technique with the FTIR instrumental advantage, samples in neat form have been measured to determine the trans fatty acids content [9, 17, 18]. It is clear from the enormous number of applications using a combination of infrared spectroscopy and chemometrics, the quantification of components formed during thermal treatment of triolein using chemometrics will be superior to any method using single peak based quantification. Because, the infrared spectra of pure triolein and trielaidin are available, we opted to use a method based on the decomposition of sample spectral matrix into triolein and trielaidin equivalents and rest. A description of this procedure is given in the Experimental Section.
Gas chromatography involves saponification and derivatisation of the oil or fat involved and the separation of the methyl esters using a high resolution capillary column that is suitable for the separation of cis and trans isomers. In GC-MS (with electron impact ionization), an additional dimension is available for confirmation of the molecular structure of an analyte. However, the cis and trans isomers do not show any differences between their mass spectra, the mass spectra are useful for indentifying the FAME congoners.
Experimental
Samples and heating experiments
Pure standards of triolein, methyl oleate and methyl elaidate were purchased from Sigma Aldrich. All the chemicals were GC grade with over 99% purity. The samples were used without purification. Methyl oleate and methyl elaidate were GC checked for their purity.
The heating experiments were carried out at 280, 300, and 325 oC in micro glass ampoules. Several glass ampoules of length 4 cm were made from glass tubes with 1.5 mm internal diameter and a wall thickness of 1 mm. Heating in micro size glass ampoules is an advantage experimentally. The glass tubes attain the temperature of reaction within a short time and cool quickly when the tubes are removed from the oven. A propane-oxygen flame was used in
melting one of the edges of each glass tube. Fifteen glass tubes were injected with 15 µl portions of triolein using a plastic syringe. Air in the remaining part of each of the glass tubes was flushed by a weak nitrogen flow and sealed by paraffin film. The paraffin film covered end of each tube was then melted and sealed. It is important to keep the glass tubes free from traces of air to avoid oxidation and polymerisation during the heating experiments . The sealed glass tubes were then placed in a short 5 ml glass vial and placed in a chromatographic oven set at 280oC. The vial was placed deep inside the oven on an inverted beaker. The same procedure was followed with samples heated at 300oC and 325oC. The glass tubes were removed at regular time intervals and the cooled samples were used in infrared and GC-MS analysis.
Infrared measurements and data treatment
A Perkin Elmer Spectrum One FT-IR spectrometer equipped with a Harrick single reflectance Attenuated Total internal Reflectance (ATR) accessory and lead glycine sulphate detector was used in measuring the infrared spectra. The accessory requires only a thin layer of sample on the crystal to acquire the infrared spectrum. Each glass ampoule was cut open and a small part of the sample was spread on the ATR crystal using the blunt side of a capillary glass tube. A background spectrum was scanned in the range of 4000-600 cm-1 before the application of a sample. A total of 30 scans at a resolution of 4 cm-1 were then made on each sample. The ATR crystal was washed with dichloromethane and acetone after each measurement.
The same procedure was repeated for samples heated at 300 and 325 oC. The sample tubes were sealed again by paraffin film.
The infrared spectra measured on the series were saved as absorption spectra. Each infrared absorbance spectrum was transformed to the second derivative and used further in the analysis for the determination of the concentrations of cis and trans isomers using multiple linear regression (MLR). The second derivatives of spectra were calculated by using Savitzky-Golay method with a smoothing window of 11 variables and a polynomial order of 3 [19]. The use of second derivatives of spectra aims to minimize the problem caused by baseline shift and overlap among peaks [20].
Derivatization and GC/MS analysis
The triolein samples remaining in the tubes after infrared analysis were subjected to derivatization. Each glass tube containing the sample was cut just above the liquid mark and crushed inside a 15 mL test tube. The test tube was then added 2 ml of 0.5 M sodium hydroxide
in methanol. The test tubes containing the mixtures were then placed in a water bath at 60 oC for 15 min. After cooling, each test tube was added 2 mL of BF3/methanol and placed in the water bath again for 10 min. Each test tube was then added 2 mL of a saturated solution of NaCl and 1 mL heptane. The tubes were shaken to aid separation and dissolution of the FAMEs lin the heptane layer. The glass tubes were then allowed to stand for a few minutes and the top heptane layer in each of the tubes was added anhydrous magnesium sulphate. The heptane layers in the tubes were carefully extracted and placed in small brown vials and kept in dark until GC/MS analysis.
The GC/MS analysis (electron impact MS) was carried out by using a Hewlett Packard 5890 gas chromatograph coupled to a 5971 quadrupole mass spectrometer. A 60 m capillary column with 0.25 mm internal diameter coated with 0.25 µm thick (50%-cyanopropyl)-methylpolysiloxane stationary phase was used in the separation of cis and trans isomers of the 18:1 fatty acid methyl esters. A temperature program with initial temperature 80 oC with equilibration time of 1 min and then a temperature gradient 10 oC/min with final temperature 220 oC and final time of 10 min was used. The GC-MS data was collected from 15 min run time. The chromatographic peaks were integrated and the peak areas were obtained as percentage.
Methodology-Kinetic analysis
When a reaction of the type A--->B + C is in progress, the rate of the reaction can be given by the following general equation:
d[A]/dt = -k [A]n (1)
Where A is the starting material, k is the reaction rate, and n is the order of the reaction.
Equation 1 can be written as follows and integrated for the concentration range and time interval as shown in equation 2.
d[A]/ [A]n = -kdt
[ [A](1-n) ] AoAt /(1-n) = -k[t] 0
t (2) Where [A]0, [A]t are concentrations of A at times 0 and t respectively.
The integral is valid for n ≥2. When the order of the reaction is zero, the result becomes,
[A]0- [A]t = kt (3)
By dividing the equation by initial concentration [A]0, the equation becomes
1- ([A]t/([A]0) = (k/[A]0)t (4)
This becomes ([A]0-[A]t)/ [A]0 =(k/[A]0)t
When relative concentration is used, [A]0 =1 and [A]t is the fraction that remains unreacted at time t. The left hand side of the equation denotes the fraction of the starting material that reacted. A plot of this quantity against time should give a straight line if the reaction is of zeroth order. For a reaction of zeroth order, the concentration change is independent of the concentration of the reactant and it is only proportional to the time of the reaction.
For a first order reaction, the result becomes,
ln ([A]t /[A]0) = -kt (5)
For a reaction of first order, the reaction rate is proportional to the concentration of the reactant in solution. The expression ln ([A]t /[A]0) will be proportional to the time of the reaction. In this work, the order of the reaction was determined by graphic correlations.
When the 18:1 fatty acids in the triglyceride isomerise to other isomers, the relationship between concentration of the unreacted fraction of the isomer and time can be investigated to determine the rate and order of the reaction. The activation energy needed to bring the molecules to an activated complex level during the isomerization tells us nothing about the product/products formed. The product can be just one isomer or a mixture of several isomers and other components. The end products formed and their amounts depend on the mechanisms involved in the systems.
The activation energy for the reaction can be determined by carrying out the reaction at different temperatures. The reaction rate k and temperature T of reaction are connected by the Arrhenius equation
k = Ae-Ea/RT (6)
for which, A is Arrhenius constant, R is the gas constant and Ea is activation energy.
For zeroth order reaction equation 6 can be written in the following form.
(k/[A]0) = (A/[A]0)e-Ea/RT (7)
ln (k/[A]0) = ln(A/[A]0) - (Ea/RT)
A plot of ln(k/[A]0) with respect to T-1 should give a linear relationship with slope of – Ea/R. Activation energy can be then calculated from the slope.
If the reaction rates of the isomerization are determined for at least three different temperatures, the activation energy can be determined from the plot between ln k and T-1.
Alternatively, if the concentration of the product B that is formed during the reaction is monitored, similar expressions can be set up to determine the rate and activation energy for the reaction.
The rate equation becomes [B]t = kt. (8)
This is for zeroeth order reaction only. When the pure trielaidin concentration (intensity of absorption) is known then the fraction of trielaidin formed during the heating can be written as:
[B]t /[B]trielaidin= (k/[B]trielaidin)t
A plot between [B]t /[B]trielaidin and time t would give linear relationships for zeroeth order reaction.
Data handling and concentration estimation
The spectral data collected from the samples during the heating experiments were imported into a data matrix using MATLAB 2007b with each row a spectrum and each column a spectral resolution element. The spectra absorbances were transformed to their second derivatives to give a data matrix D. When the doubly derivated spectra (S) of pure triolein and trielaidin are known, then their concentrations (C) in the mixtures can be found by using ordinary least squares (RILS)
= +
ˆ = /0
D CS E
C D S (10)
The chemometric technique calculates the equivalent of [B]t /[B]trielaidin which is used in the calculation of kinetic parameters.
Results and discussion
Infrared spectroscopy
Infrared spectra of the pure triolein, trielaidin, and a mixture obtained after 5 days during the heating experiment at 280 oC are given in Fig. 1. The infrared band assignments for triolein and trielaidin are given in Table 1. Partial second derivative profiles of the infrared spectra of the samples heated at 280 oC are given in Fig. 2. Another set of second derivative profiles from the samples treated at 300 oC is presented in Fig.3. The infrared spectra of the resolved components in the same sample mixture are given in Fig. 4. The spectra shown in Fig. 1 have common features except for the wavenumbers at 3004, 1710, and 969 cm-1. The changes in the absorptions are clearly visible in the second derivative profiles given in Fig. 2. The absorption at 3004 cm-1 is the stretching absorption of the C-H bond attached to the cis carbon atom in the oleic acid moieties. This absorption is absent in the spectrum of trans isomer trielaidin. The absorption at 969 cm-1 is due to the bending vibration of the C-H bond attached to the trans double bonds in trielaidin. The cis isomer lacks this absorption. However, the intensities of absorption between the two absorptions are completely different. This is because the extnction coefficient of the CH strtching absorption (of the cis CH) at 3004 cm-1 is ten times smaller than the =CH out of plane deformation vibration (of the trans CH) at 969 cm-1 (Fig. 1). The carbonyl group in both isomers absorb at 1745 cm-1. The third spectrum in Figure 1 shows absorption of carbonyl groups at 1710 cm-1 in the vicinity of the absorption of glyceride carbonyl group. A set of second derivative profiles in the carbonyl region for samples heated at 280 oC and 300 oC are presented in Fig. 3. This absorption at 1710 cm-1 is very characteristic to aldehyde carbonyl groups. Glycerides under thermal treatment at temperatures over 180oC undergo oxidation and form aldehydes [3], aldehyde acids, alcohols and hydrocarbons [21]. According to Fullana et al. [3] and Fujisaki et al. [5], octanal, nonanal, decanal, 2-decenal, and 2-undecenal are aldehydes formed from oleic acid moieties in the glyceride molecules. The chemical transformation of fatty acid moieties in the glyceride molecules into aldehydes under thermal treatment is evident from the Figures 1 and 3.
The progress of isomerisation as determined by infrared spectroscopy is shown in Fig. 4 for the three temperatures. The trans isomer concentration in the samples reached to a maximum of 35% in 7 days at 280 oC, 40% in four days at 300 oC and 42% in 0.62 (15 h) days at 325oC.
GC-MS analysis (electron impact MS)
The total ion chromatogram of the FAMEs obtained from three samples heated at 300 oC (Fig. 5) show that there is base line separation between the cis and trans isomers of the 18:1(9) fatty acids. The FAMEs of the cis and trans isomers of the 18:1(9) fatty acids were identified by pure standards of methyl oleate and methyl elaidate. There is clear evidence that the concentration of trans isomer increases with the heating time. Plots showing the progress in the formation of trans isomers as determined by GC-MS for the three temperatures are presented in Fig. 6. At 280oC, the concentration of trans isomers reached a maximum concentration of 41% in 7 days of heating. At 300oC, the concentration of trans isomers reached 64% in 5 days of heating and at 325oC, the concentration reached 56% in 0.7 (17 hours) days.
The concentrations of trans isomers determined by the two methods differ significantly. This difference is caused by the concentration of trans isomers determined by infrared measures the concentration of the reaction products which contains cis, trans isomers of 18:1 fatty acids acids and degradation products. The concentrations determined by GC-MS of the FAMEs estimate relative concentrations between cis, trans isomers and other fatty acids formed during the reaction. This result excludes the concentration of degradation products, aldehydes and other compounds without an acidic group, because only the fatty acids in the glyceride molecules and any other acid molecules formed during degradation participate in the derivatization process. In the infrared spectroscopy/chemometric technique, the infrared spectra of the heated samples were resolved into components representing the cis and trans isomers. Plots showing the correlation between the normalised trans isomer concentrations determined by IR/chemometrics versus GC-MS method are presented in Fig. 7. The concentrations presented in the plots are relative concentrations with only the cis and trans components taken into the calculation. Very good linear correlations with slopes almost unity (0.9947 for 280 oC, 0.9807 for 300 oC and 0.9923 for 325 oC) shows that the trans isomer concentrations in oils and fats can be precisely determined by infrared spectroscopy/chemometrics if one knows the fatty acid composition of the system well. The results clearly illustrate that the infrared spectroscopy combined with chemometrics gives relative concentrations (as fractions) of trans isomers in treated oils and fats. The results also indicate that the concentrations of trans isomers in thermally treated oils and fats determined by GC-MS as FAMEs are overestimated. Without knowing the composition, the GC-MS determinations of trans isomers as methyl esters can only lead to erroneous concentrations. Obviously, the infrared method determines the real concentrations of the trans isomers in the mixtures.
The concentrations (fractions) of other products formed during the heating experiments were determined by subtracting the concentrations of cis and trans isomer concentrations determined by FT-IR/chemometrics. The concentration of the degradation products reaches 8% in 8 days, 50% in 8 days, and 27% in 0.7 days at 280, 300, and 325 oC, respectively. It is very clear that the prolonged heating at higher temperatures leads to severe degradation and oxidation of fatty acids
in the glyceride molecules. The formation of several cis and trans 18:1 isomers start from the beginning but becomes prominent after three days at 300 oC. The unsymmetrical shape of the peaks representing the oleic and elaidic acid methyl esters in the total ion chromatograms indicates the formation of other positional isomers. As the double bond moves farther from the 9-10 carbon-carbon double bond, the retention time of the new isomers shift for longer retention times. The GC-MS analysis of samples heated 325 oC gave peaks with unsymmetrical shape but the formation of positional isomers was not prominent because of the short time of the heating experiments.
The peaks in the total ion chromatograms shown in Fig.5 indicate the formation of several cis and trans isomers of the 18:1 fatty acids. The appearance of peaks on both sides of the 18:1(9) trans and cis fatty acids methyl esters show that the double bond migrate in both directions during heating. The retention times of the positional isomers follow the order of their double bond position [22].
The peak appearing at a retention time of 22.46 min in Fig. 5 is methyl ester of 18:0 fatty acid. The identity was confirmed by GC/MS library search and by spiking the sample with 18:0 FAME. The concentration seems to increase with time. Eventhough, the accumulation is slow, the concentration becomes significant after 9 days of heating at 300 oC.
Reaction products and reaction mechanisms
There are several reactions that take place during thermal treatment of triolein molecules. A Sketch depicting the chemical reactions and possible transformations into different products are given in Figures 8 and 9. The possibilities for the formation of reaction products are: 1) the cis double bond can simply open up and rotate freely along the 9,10 C-C bond and intraconvert to a trans double bond, 2) with the opening of the double bond and hydrogen transfer, the double bond can migrate in both directions from the 9 -10 position and form several cis and trans isomers of the 18:1 fatty acids, or 3) the molecule can undergo oxidative fission at different positions of the carbon chain back bone. The first step in the fission reaction is the formation of a hydroperoxide at carbon number 8. The molecule is then cleaved by homolysis into alkoxy and
hydroxy radical (Fig. 9). The alkoxy radical then undergo β–scission of C-C bond on either side of the oxygen containing carbon atom. The scission leads to alkenes, aldehydes, aldehydic acids, alcohols etc. This process can continue with some of the molecules formed due to the migration of the double bond in the glyceride molecules or 4) exchange of hydrogen atoms can lead to saturated and poly-unsaturated fatty acid moieties in the system.
However, apart from the isomerisation and hydrogen transfer reactions, all the other reactions require the presence of oxygen in the reaction mixture. The heating experiments were carried out in the presence of nitrogen. It is not very clear where these oxygen atoms come from. One possibility is that they come from the glyceride molecules.
Isomerisation Kinetics and Activation Energy
Activation energy for the reaction
As discussed earlier, the activation energy for the heat induced reaction can be calculated by using the reaction rates k for the reactions at three different temperatures. Triolein used in the heating experiments undergo isomerization and degradation (Fig.10) and therefore the change in
the concentration of triolein cannot be used in the determination of activation energy for the isomerization reaction. However, the concentration of the trans isomer formed can be used for this purpose. A diagram illustrating the cis-trans isomerization with an arbitrary energy scale is given in Fig. 11. Plots showing the fraction equivalent of trielaidin formed with respect to time are presented in Fig. 12. Only a few data points representing the trans concentrations in the samples heated at 300 oC are included in the plot. The reason is because the trans isomers started decomposing and a decrease in the concentration of trans isomers observed (Fig. 4). Linear correlations indicate that the thermally induced isomerization reaction is of zeroth order.
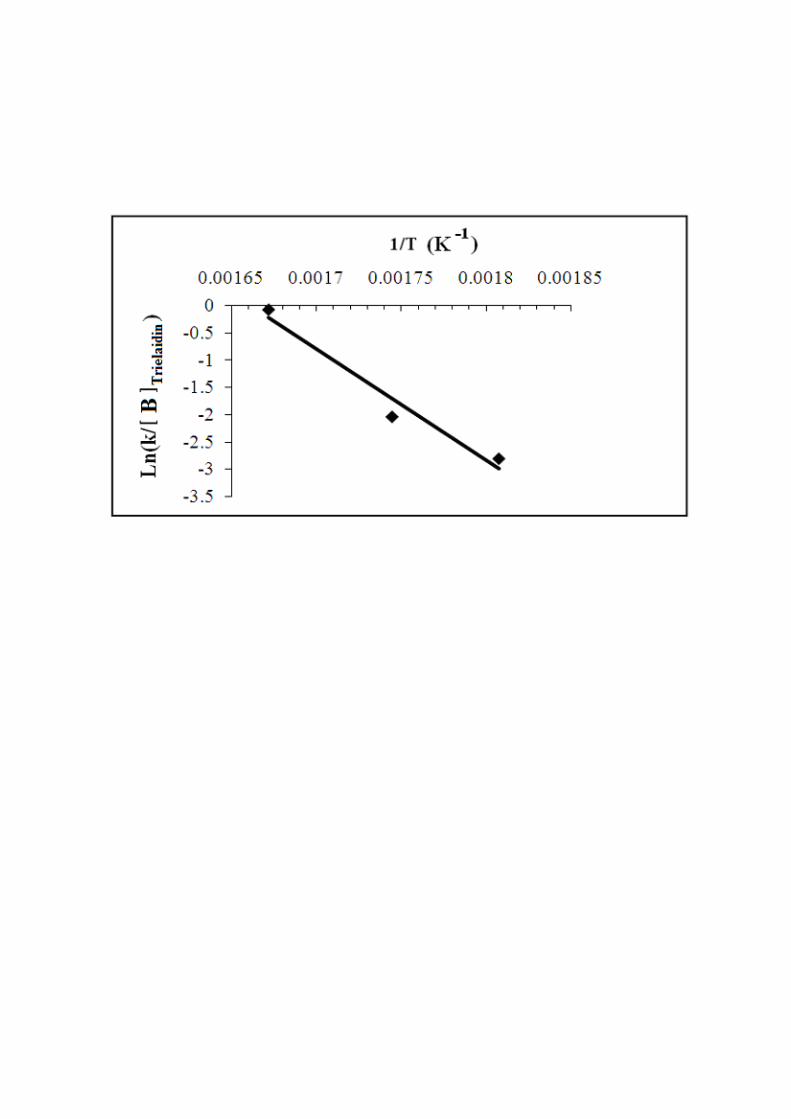
For a zeroth order reaction, the activation energy can be determined by using the parameters from a plot between ln (k//[B]trielaidin) and T-1 (Fig.13). The activation energy EA and the frequency factor A calculated for the isomerization reaction are given in Table 2. The activation energy calculated, 41±5 k.cal/mol for the cis-trans isomerisation lies within the values calculated
for C=C double bonds in systems (41-63 k. cal/mol) with different chemical environments [23-26]. The activation energy determined for cis-trans isomerisation of triolein reflects that the environment where the double bond is situated is more sterically hindered than in normal alkenes.
Conclusion
There are several interesting aspects of thermal degradation and isomerization reaction of triolein came to light after the analysis of the mixtures using two different analytical techniques. First of all, it is clear that thermal degradation takes place even within an inert atmosphere. The source of oxygen in these reactions is not known. Furthermore, the strain on the glyceride molecules under prolonged heating is evident from the experiments conducted at 300 oC. Almost half of the original concentration had degraded into other products. This result suggests that the frying oils heated at elevated temperatures in the presence of oxygen in restaurants and places that are open 24 hours may actually contain a complex mixture of dangerous chemicals in the frying oil bath. Low temperature frying should be encouraged whenever possible. The use of infrared spectroscopy in determining real concentration of trans isomers in fats and oils using chemometric multiple linear regression methods has given us confidence in using the technique in our future investigations involving fats and oils. Furthermore, the technique may also be used in determining trans concentrations in edible oils and fats, hydrogenated oils and other situations where quantitative determination of trans fatty acid content in a mixture is needed. The success of the estimation of the concentration relies on the fact that there was no chemical interactions between the molecules that may affect the extinction coefficients of the components in the mixture. The results clearly show that the GC-MS analysis of treated fats and oils as FAMEs may not give correct picture of the products formed in the systems during thermal trteatment and may lead to erroneous concentrations for trans isomers. The activation energy for the cis-trans isomerisation of triolein has been determined for the first time and the value and order of the reaction determined are now open for further investigation. We believe that the activation energy determined for the isomerisation is in the acceptable range for these types of systems.
References
1. Moreira, R. G., M. E. Castel–Perez, M. E. and Barufet, M. A., 1999, Deep-fat frying . Fundamentals and applications. Aspen Publishers. Inc, Gaithursburg, Maryland.
2. Rojo, J. A., Perkins, E. G., 1987, Cyclic and fatty acid monomer formationin frying
fats. J. Am. Oil Chem. Soc. 64, 414-421. 3. Fullana, A., Carbonell-barrachina, A. A. and Sidhu, S., 2004. Volatile aldehyde
emissions from heated cooking oils, J. Sci. Food Agric., 84, 2015-2021. 4. Umano, K., Shibamoto,T., 2001. Analysi of cooking oil fumesby ultraviolet spectroscopy
and gas chromatography-mass spectrometry, J. Sci. Food Agric., 49, 4790-4794. 5. Fujisaki, M., Endo, Y. and Fujimoto, K., 2002. Retardation of volatile aldehyde
formation in the exhaust of frying oil by heating under low oxygen atmospheres.J. Am. Oil Chem. Soc. 79, 909-914.
6. Lithfield, C., Lord, J. E., Isbell, A. F. and Reiser, R., 1963. Cis-Trans isomerization of oleic, linoleic and linolenic acids, J. Am. Oil Chem. Soc., 553-557.
7. Grompone, M. A., and Moyna, P., 1986. Geometric isomerization of fatty acids with nickel catalyst, JAOCS, 63, 4, 550-551.
8. Grandgirard, A., Sebedio, J. L., and Fleury, J., 1984. Geometrical isomerization of linoleic acid during heat treatment of vegetable oils, JAOCS, 61, 10, 1563-1568.
9. Dutten, H. J., 1974. Analysis and monitoring of trans-isomerization by IR ATR spectrometry, J. Am. Oil Chem. Soc. 51, pp. 406–409.
10. Chipault, J. R., Hawkins, J. M., 1960. Conversion of conjugated cis-trans octadecadienoates to the trans-trans isomers, JAOCS, 176-183.
11. Official Methods and recommended Practice of the Americal Oil Chemists’ Society, 4th edn., American Oil Chemists’ Society Campaign, 1989.
12. Belton, P. S., Wilson, R. H., Sadehgi-Jorabegi, H. and Peers, K. E., 1988. A Rapid Method for the Estimation of Isolated trans double bonds in Oils and fats Using FTIR combined with ATR. Lebensm. Wiss. Technol., 21, 153-157.
13. Dutten, H. J., 1974. Analysis and Monitoring of Trans-isomerization by IR ATR Spectrometry. J. Am. Oil. Chem. Soc. 51, 406-409.
14. Lancer, A. C. and Emkem, E. A., 1988. Comparison of FTIR and capillary GC methods for quantitation of trans Unsaturation in fatty acids methyl esters, Ibid, 65, 1483-1487.
15. Christy, A. A., Egeberg, P. K. and Østensen, E. T., 2003. Simultaneous Quantitative determination of isolated trans fatty acids and conjugated linoleic acids in oils and fats by Chemometric analysis of the infrared profiles, Vibrational spectroscopy, 33, 37-48.
16. Mossoba, M. M., Yurawecz, M. P. and McDonald, R.E., 1996. Rapid determination of total trans content of neat hydrogenated oils by attenuated total reflection spectroscopy, JOACS, 73, 8, 1003-1009.
17. Belton, P. S., Wilson, R. H., Sadehgi-Jorabegi, H. and Peers, K. E., 1988. A Rapid Method for the Estimation of Isolated trans double bonds in Oils and fats Using FTIR combined with ATR. Lebensm. Wiss. Technol., 21, 153-157.
18. Christy, A. A., and Egeberg, P. K., 2006. Quantitative determination of saturated and unsaturated fatty acids in edible oils by infrared spectroscopy and chemometrics, Chemometr. & intell. Lab. Syst., 82, 1-2, 130-136.
19. Savitzky, A., Golay, M. J. E., 1964. Smoothing and differentiation of data by simplified least squares procedures, Anal. Chem., 36, 1627-1639.
20. Windig, W., Stephenson, D. A., 1992. Self-modelling mixture analysis of second-derivative near-infrared spectral data using the simplisma approach, Anal. Chem., 64,
2735-2742. 21. Vann de Voort, F. R., Ismail, A. A., Sedman, J. and Emo, G., 1994. Monitoring the
oxidation of edible oils by Fourier transform infrared spectroscopy, JAOCS, 71, 3, 243-253.
22. Wolf, R. L. and Precht, D., 1998. Comments on the resolution of individual trans 18:1 isomers by gas-liquid chromatography, 75, 1, 421-422.B.
23. Rabinovitch, B. S., Michel, K. W. 1959. The Thermal Unimolecular cis-trans
Isomerization of cis-Butene-2, J. Am. Chem. Soc., 81 (1959) 5065=5071. 24. Rabinovitch, B. S, Hulatt, M. J., 1957. Thermal cis-trans isomerization of
dichloroethylene: An exceptional reaction, J. Chem. Phys. 27, 592-593. 25. Butler J. N., and AcAlpine, R. D., 1963. The thermal cis-trans isomerization of
crotononitrile, Can. J. Chem., 41, 192487-2491. 26. Lin, M. C, Laider, K. J., 1968, Some aspects of cis-trans-isomerization mechanisms,
46, 973-978.
Figure Captions
Fig. 1. Infrared spectra of triolein, trielaidin and a sample of triolein after five days of heating at 280 oC.
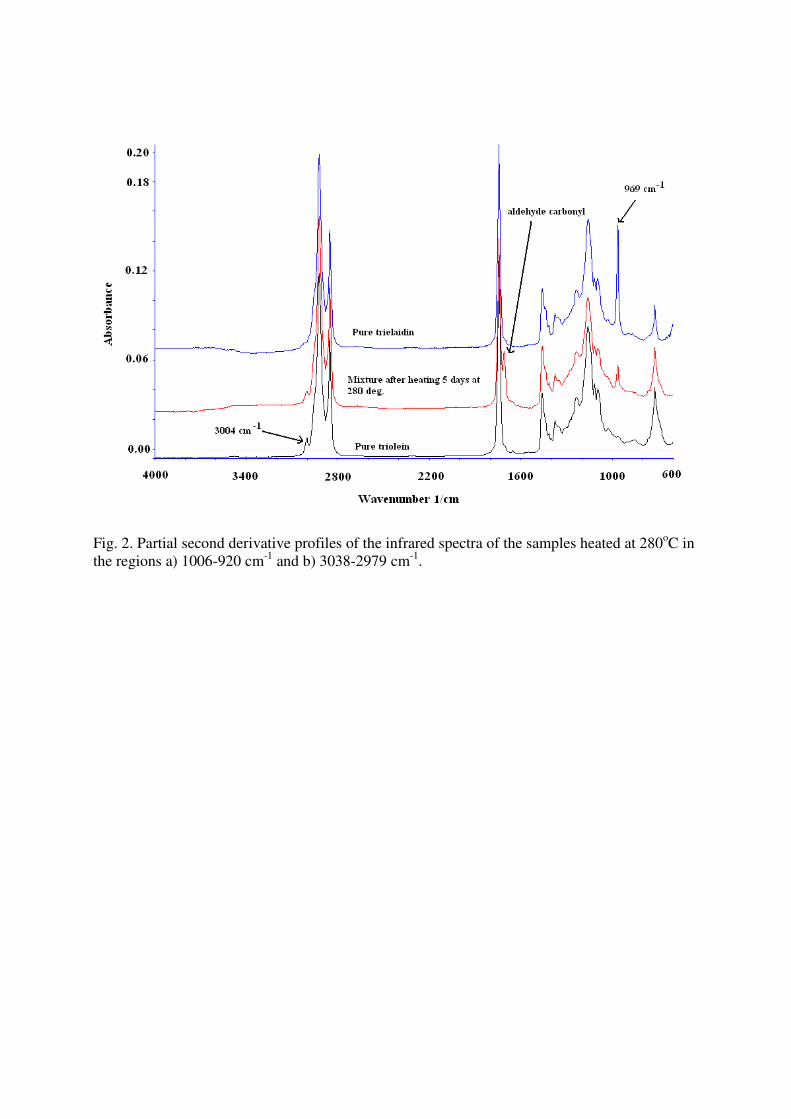
Fig. 2. Partial second derivative profiles of the infrared spectra of the samples heated at 280oC in the regions a) 1006-920 cm-1 and b) 3038-2979 cm-1.
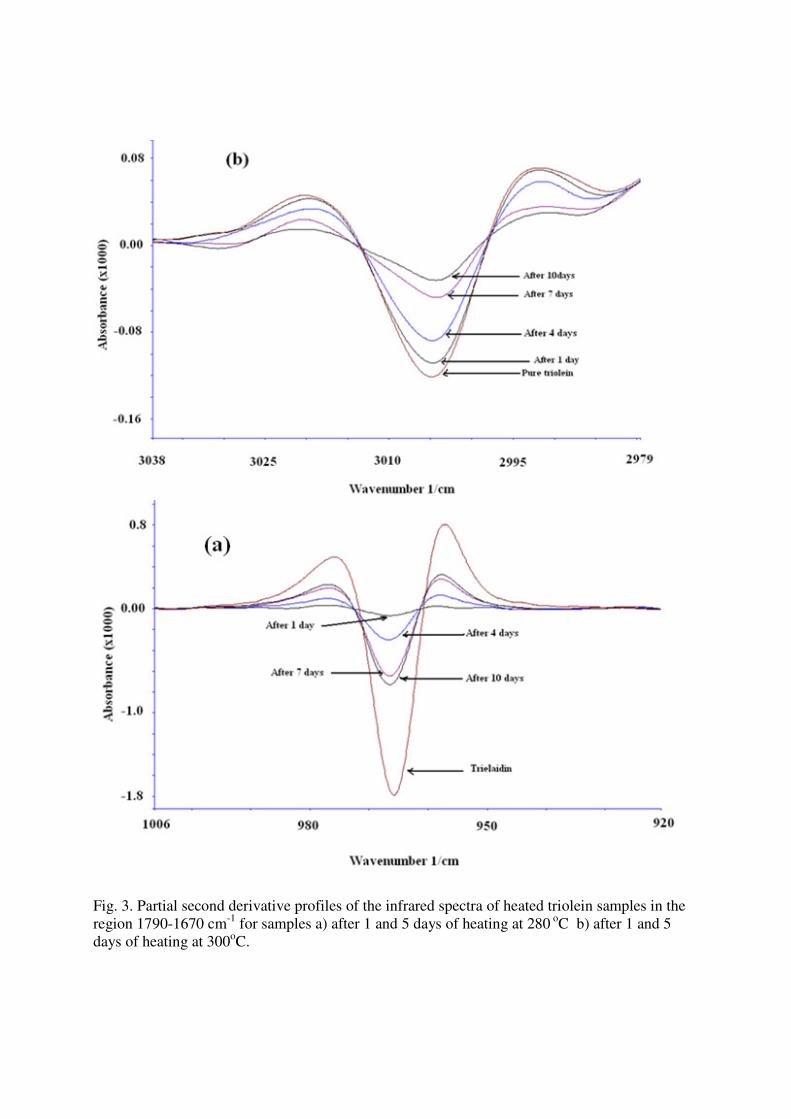
Fig. 3. Partial second derivative profiles of the infrared spectra of heated triolein samples in the region 1790-1670 cm-1 for samples a) after 1 and 5 days of heating at 280 oC b) after 1 and 5 days of heating at 300oC.
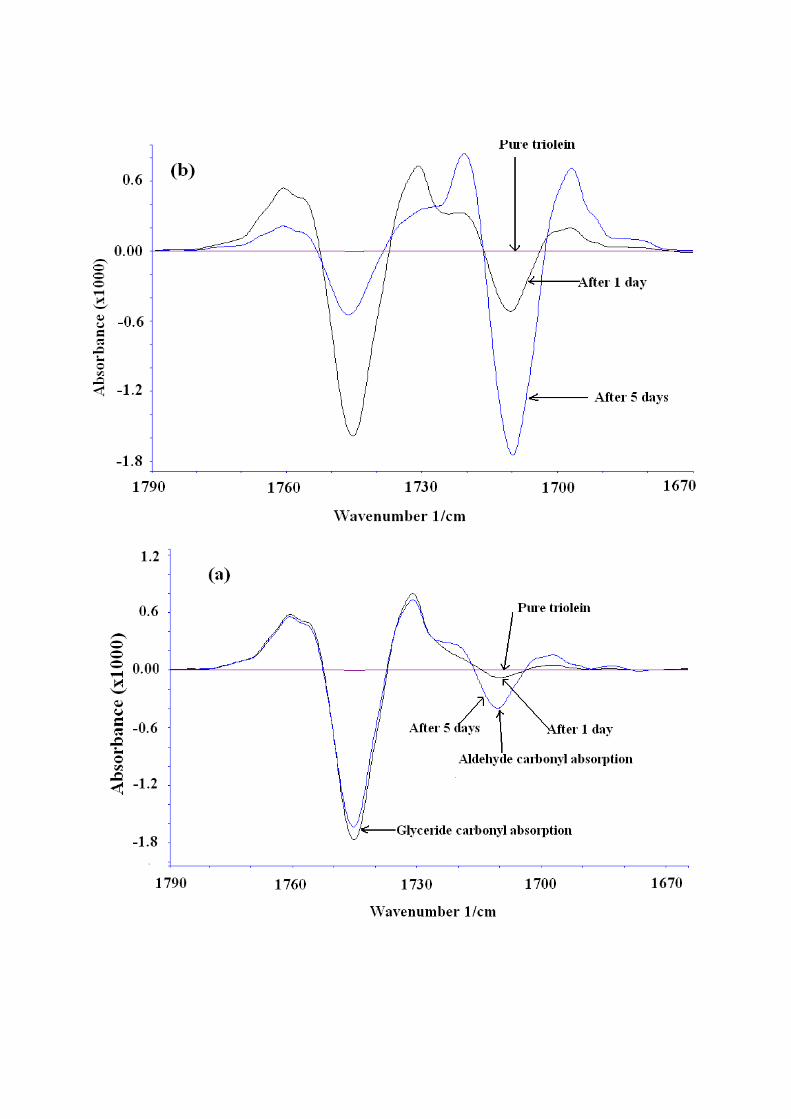
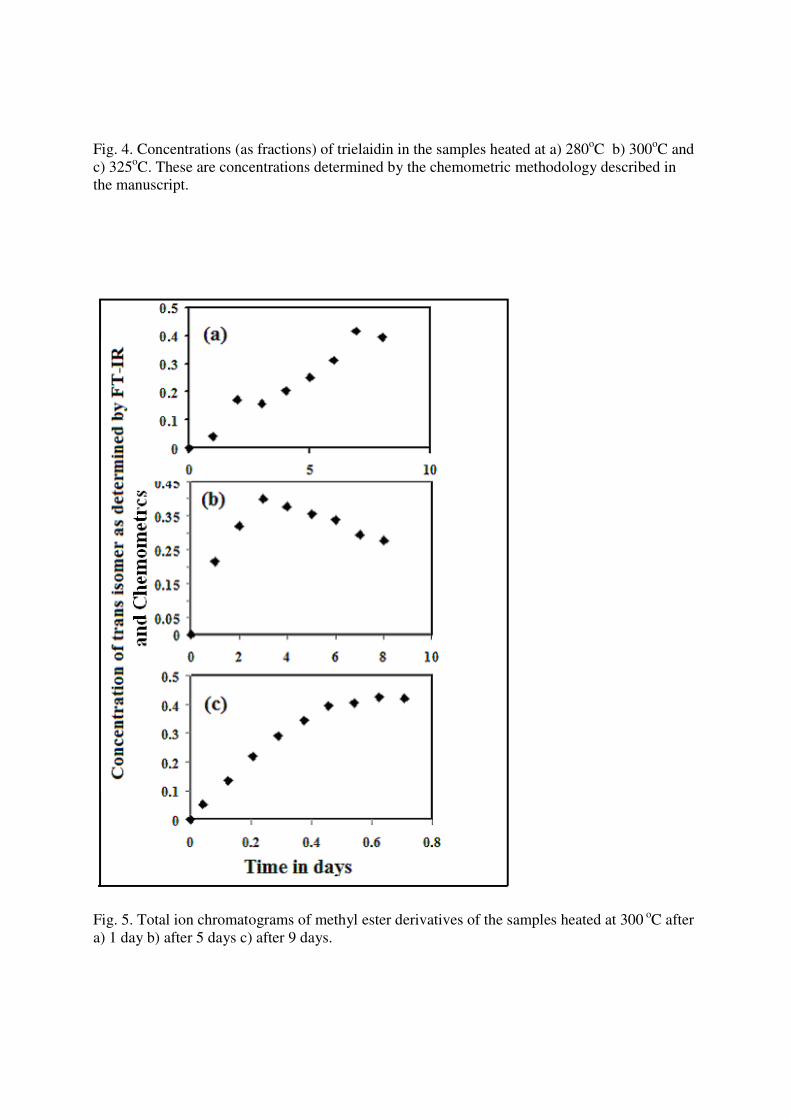
Fig. 4. Concentrations (as fractions) of trielaidin in the samples heated at a) 280oC b) 300oC and c) 325oC. These are concentrations determined by the chemometric methodology described in the manuscript.
Fig. 5. Total ion chromatograms of methyl ester derivatives of the samples heated at 300 oC after a) 1 day b) after 5 days c) after 9 days.
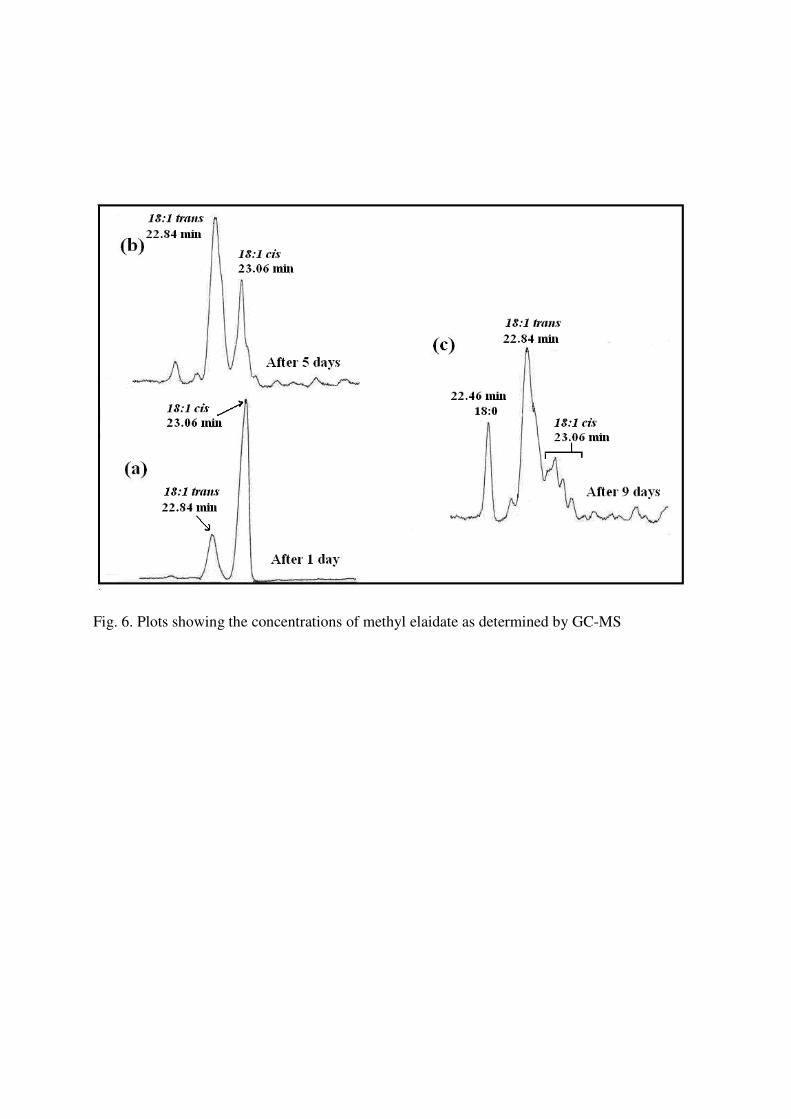
Fig. 6. Plots showing the concentrations of methyl elaidate as determined by GC-MS
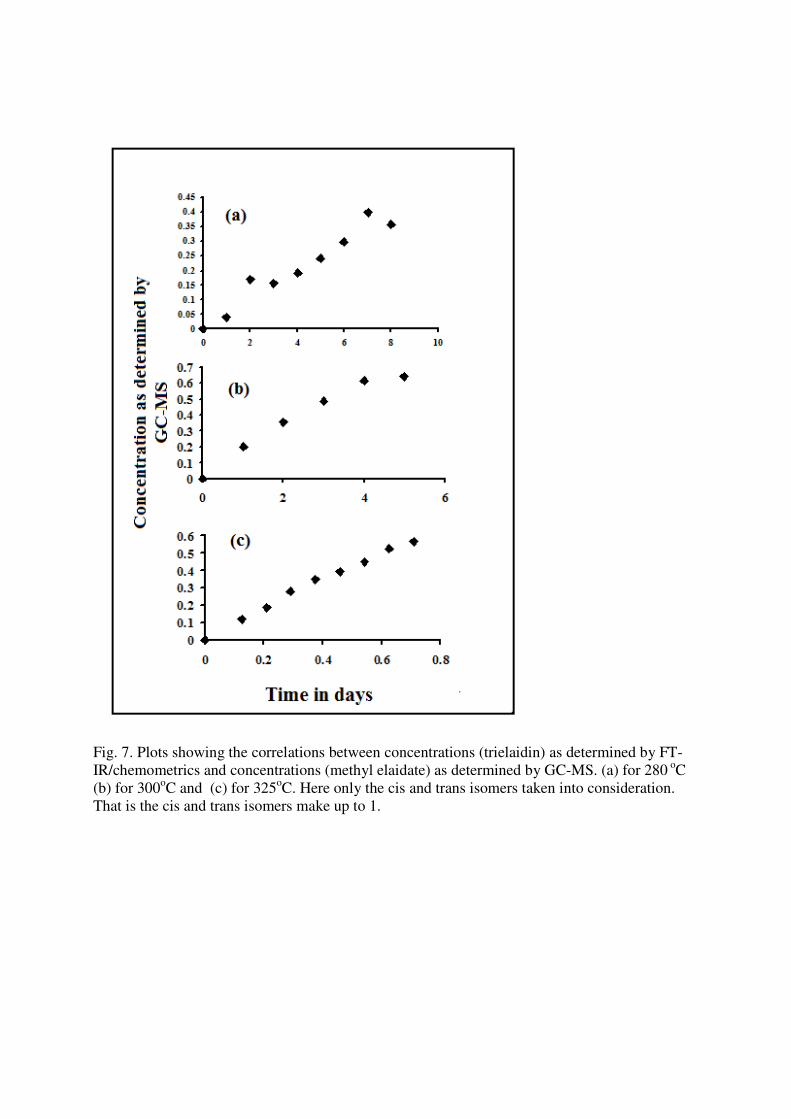
Fig. 7. Plots showing the correlations between concentrations (trielaidin) as determined by FT-IR/chemometrics and concentrations (methyl elaidate) as determined by GC-MS. (a) for 280 oC (b) for 300oC and (c) for 325oC. Here only the cis and trans isomers taken into consideration. That is the cis and trans isomers make up to 1.
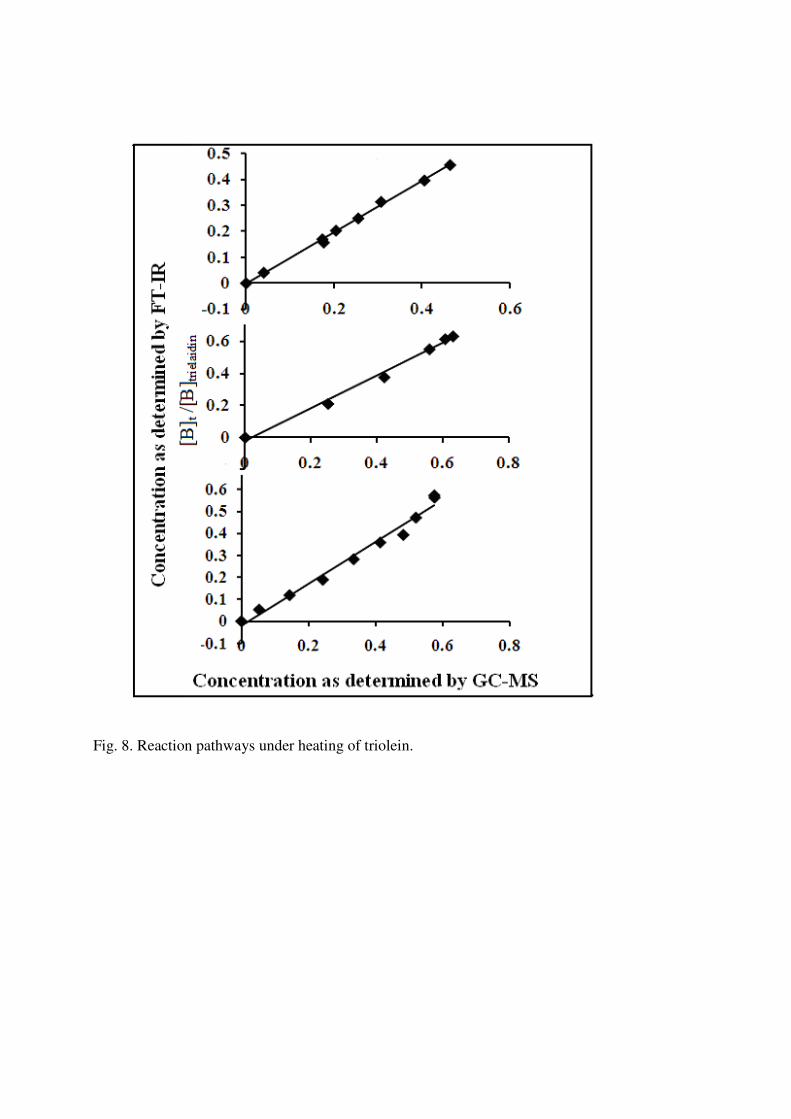
Fig. 8. Reaction pathways under heating of triolein.
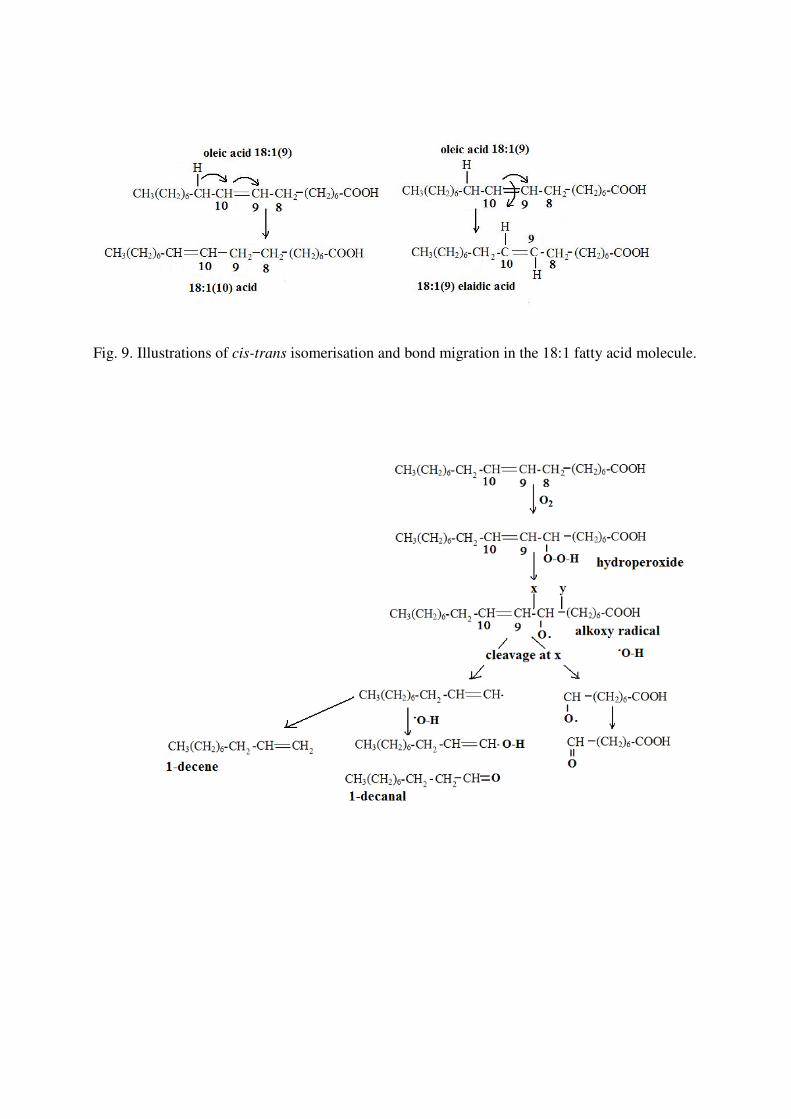
Fig. 9. Illustrations of cis-trans isomerisation and bond migration in the 18:1 fatty acid molecule.
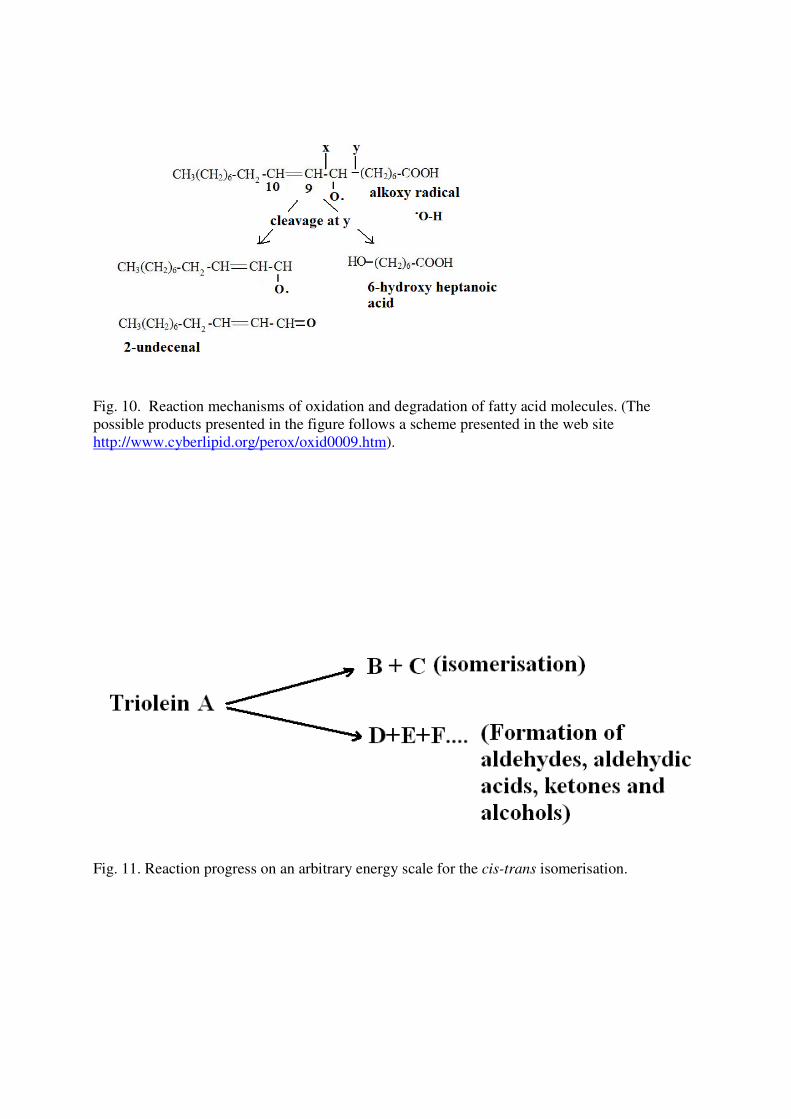
Fig. 10. Reaction mechanisms of oxidation and degradation of fatty acid molecules. (The possible products presented in the figure follows a scheme presented in the web site http://www.cyberlipid.org/perox/oxid0009.htm).
Fig. 11. Reaction progress on an arbitrary energy scale for the cis-trans isomerisation.
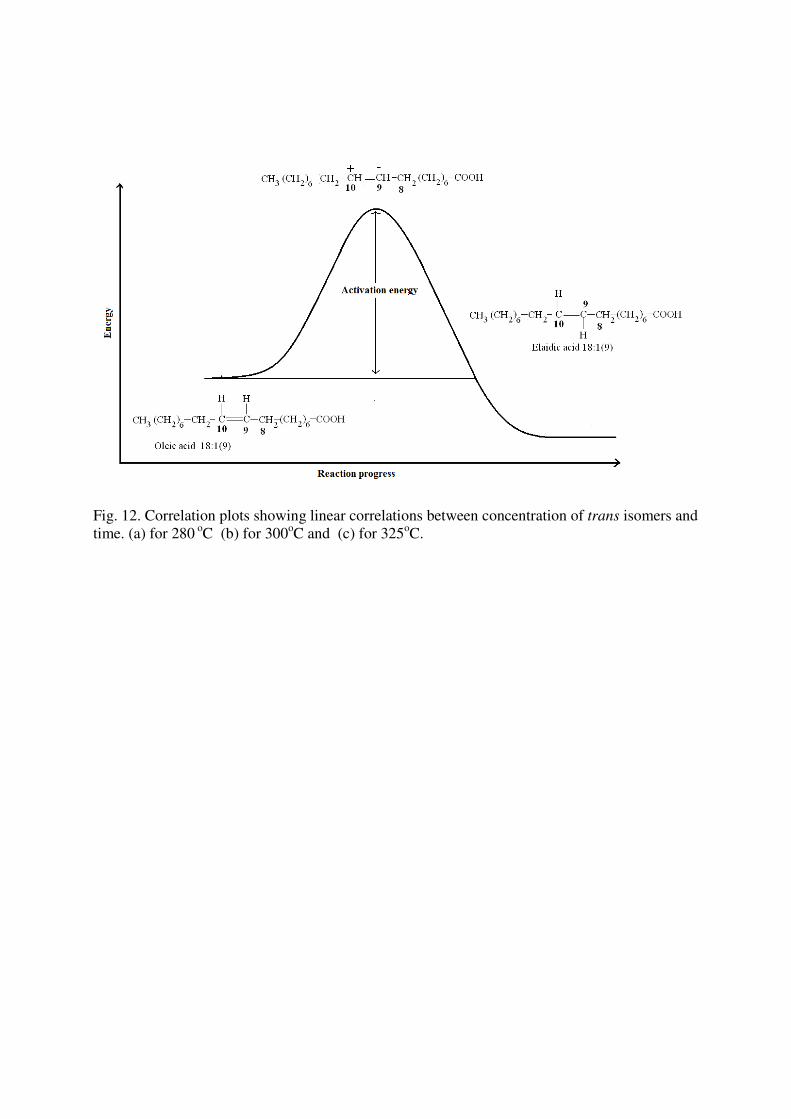
Fig. 12. Correlation plots showing linear correlations between concentration of trans isomers and time. (a) for 280 oC (b) for 300oC and (c) for 325oC.
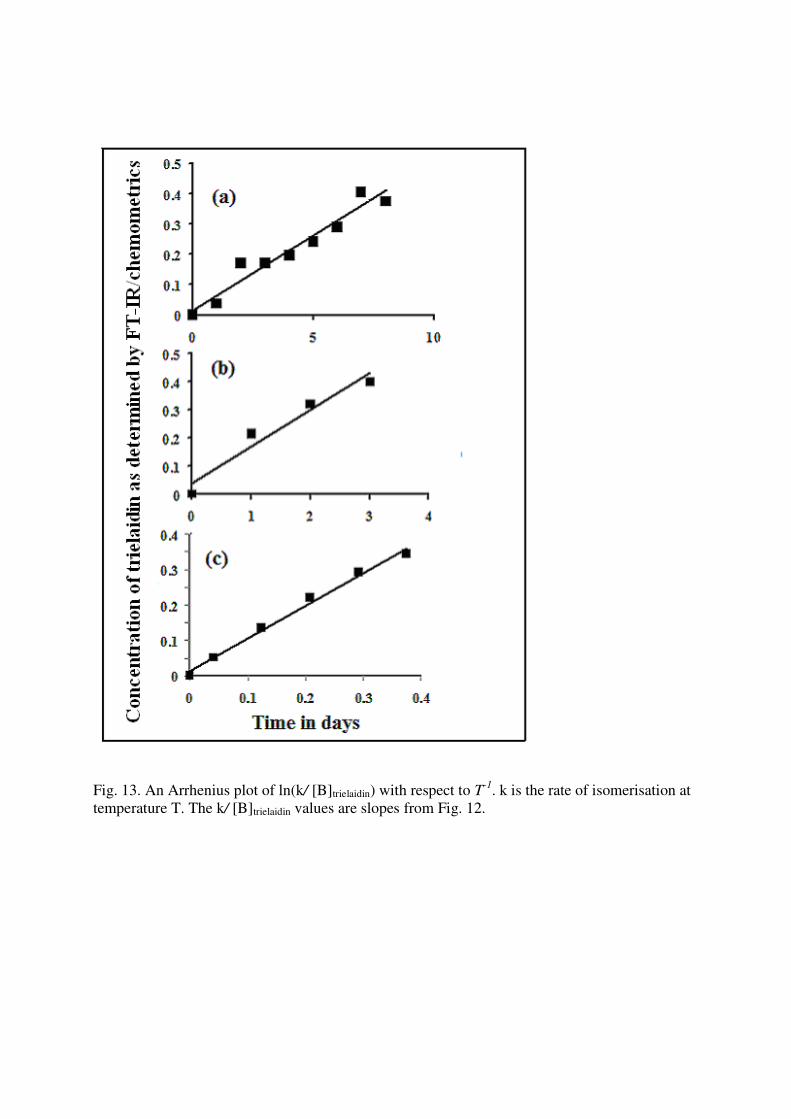
Fig. 13. An Arrhenius plot of ln(k/ [B]trielaidin) with respect to T-1. k is the rate of isomerisation at temperature T. The k/ [B]trielaidin values are slopes from Fig. 12.