Embed Size (px)
Citation preview
Adhesion and Debonding Kinetics in PV Devices and Modules
Chris Bruner, Stéphanie Dupont, Ryan Brock (PV active layers) Fernando Novoa, Warren Cui (encapsulation and optics)
Scott Isaacson, Tissa Mirfakhrai (ultra barrier films)
Reinhold H. Dauskardt ([email protected])
Adhesion and Debonding Kinetics in PV Devices and Modules
Collaborators: Stephen Eglash / Stanford
David Miller and Sarah Kurtz / NREL
Mike Wiemer, Taner Bilir and Homan Yuen / Solar Junction
Peter Hebert and Jim Ermer / Spectrolab (Boeing)
Support: DoE support through the Bay Area PV Consortium, Predicts CPV
program through SunShot, and the CAMP-KAUST center.

Degradation and
Substrate
Reliability of PV Devices and Modules
Thermal cycling, stress, moisture, chemically active environmental species, and solar UV.
Uncertain degradation kinetics and reliability models.
Severe operating environments:H2O, O2, H2
other active chemicalspecies
photochemical reactions
cracking and debonding
UV Exposure
defect evolution innanomaterial
layers
surface weathering
Substrate
H2O, O2, H2 other active chemical
species
photochemical reactions
cracking and debonding
UV Exposure
defect evolution in nanomaterial
layers
surface weathering
defects in semi-conductor layers
electro-luminescent
peeling metallized grids after thermal
cycling

Device Reliability and Evolution of Defects damage propagates if mechanical stresses are large enough so that
mechanical cohesion or “driving force” G Gc J / m2 adhesion
presence of chemical species and photons, damage propagates even if environment and
G G J / m2 stress accelerates c defect evolution
Role of coupled “stress” parameters:
• mechanical stress
• temperature
• environmental species
• photons (photochemical reactions)
Substrate
H2O
hOrganic layer

Limitations of Thin-Film Adhesion Tests Indenter
Plastic zone • Indentation/Scratch Test - complex stress and deformation fields - principally qualitative results - (nano) scratch test even less quantitative
Interface Crack Substrate
Film
M P
• Peel/m-ELT Test - difficult to apply loads - plastic deformation of film - temperature complications in m-ELT
• Blister Test - compliant loading system - environmental effects - etching/machining of cavity difficult
Interface Crack
Substrate
Film
PSubstrate Film
Cavity in Substrate
Major limitations: need detailed film properties, film stress relaxation and film plasticity
principally qualitative results for all above methods!

Coh
esio
n E
nerg
y, G
(J/m
2 )
Quantitative Adhesion/Cohesion and Debond Kinetics
(temp/environment /UV effects) Adhesion/Cohesion
threshold crucial for reliability
ITO (150 nm ) PEDOT:PSS (50-100 nm)
Al (100 nm)Ca (7 nm)
P3HT/PCBM (~150 nm)
Degradation Kinetics
2
1.5
1
0.5
0 Solar Cells
Outline
• Inherent Solar Cell Thermo-Mechanical Reliability • polymer / PCBM BHJ type devices • adhesion and cohesion properties in flexible systems
• Encapsulant and Ultra-barriers in Solar Modules • synergistic effects of multiple “stressing parameters” • kinetics and lifetimes

Factors Effecting Cohesion of BHJ Layersplastic zone
• Heterojunction layer thickness – is cohesion in organic layers sensitive
to layer thickness?
• Composition of the heterojunction layer – limited bonding to fullerene – polymer/PCBM ratio makes stronger layer
P3HT PCBM Indene C60
• Molecular intercalation – manipulating the types of intermolecular
interactions
• Annealing Standard 150°C 0.5h 150°C 2h
– morphology of the BHJ layer changes with annealing
organic BHJ elastic layer
elastic substrate
100kDa 79kDa 53kDa 28kDa
5
20
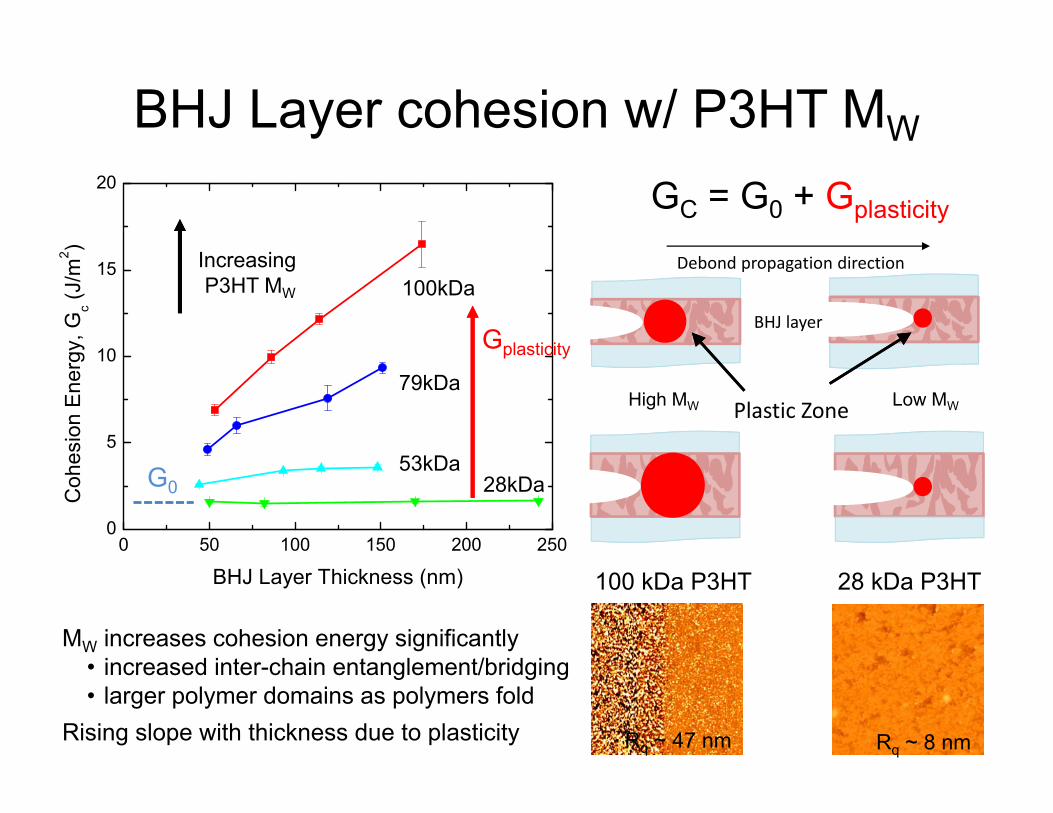
BHJ Layer cohesion w/ P3HT MW
Low MWPlastic Zone
Debond propagation direction
GC = G0 + Gplasticity
High MW
G0
100 kDa P3HT
79kDa
53kDa 28kDa
0 50 100 150 200 250
BHJ Layer Thickness (nm)
Increasing P3HT MW 100kDa
Gplasticity
Coh
esio
n E
nerg
y, G
(J/m
2 ) c
15
10
BHJ layer
0
28 kDa P3HT
MW increases cohesion energy significantly • increased inter-chain entanglement/bridging • larger polymer domains as polymers fold
Rising slope with thickness due to plasticity Rq ~ 47 nm Rq ~ 8 nm
--
-
-
Effi
cien
cy,
(%)
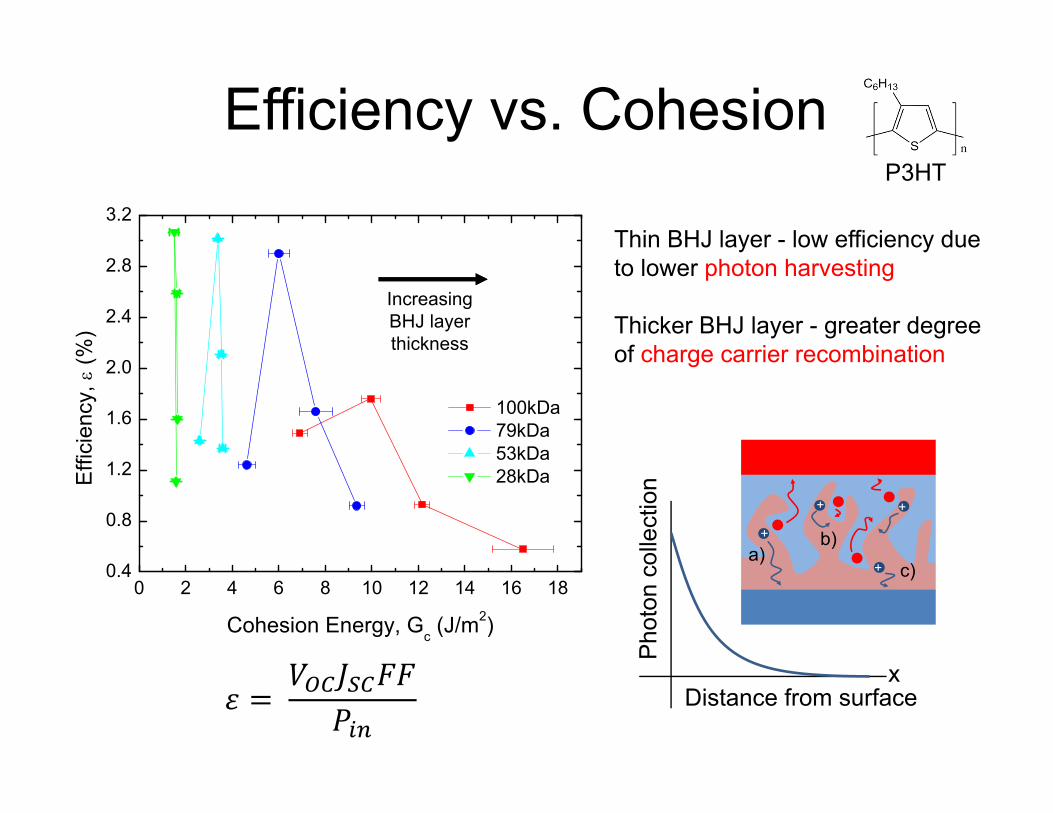
Efficiency vs. Cohesion P3HT
3.2 Thin BHJ layer - low efficiency due
2.8 to lower photon harvesting
100kDa 79kDa 53kDa 28kDa
Increasing BHJ layer thickness
0 2 4 6 8 10 12 14 16 18
2.4
2.0
1.6
1.2
0.8
0.4
Thicker BHJ layer - greater degree of charge carrier recombination
+
+
+
+
a) b)
c)
Pho
ton
colle
ctio
nCohesion Energy, G (J/m2)c
ைܬௌܨܨ xߝ ൌ Distance from surface
ZnO
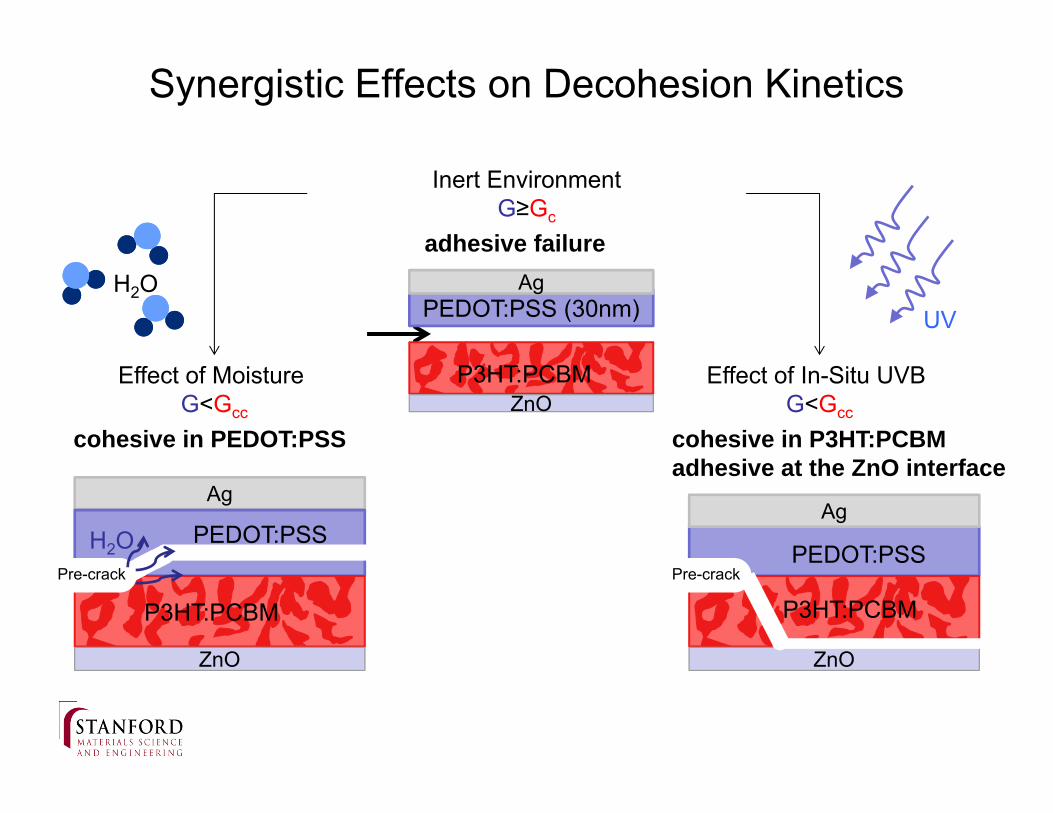
Synergistic Effects on Decohesion Kinetics
adhesive failure
PEDOT:PSS (30nm) Ag
P3HT:PCBM ZnO
Inert Environment G≥Gc
Effect of Moisture G<Gcc
Effect of In-Situ UVB G<Gcc
UV H2O
cohesive in PEDOT:PSS cohesive in P3HT:PCBM adhesive at the ZnO interface
Ag Ag
P3HT:PCBM
ZnO
H2O Pre-crack
PEDOT:PSS
P3HT:PCBM
ZnO
Pre-crack PEDOT:PSS
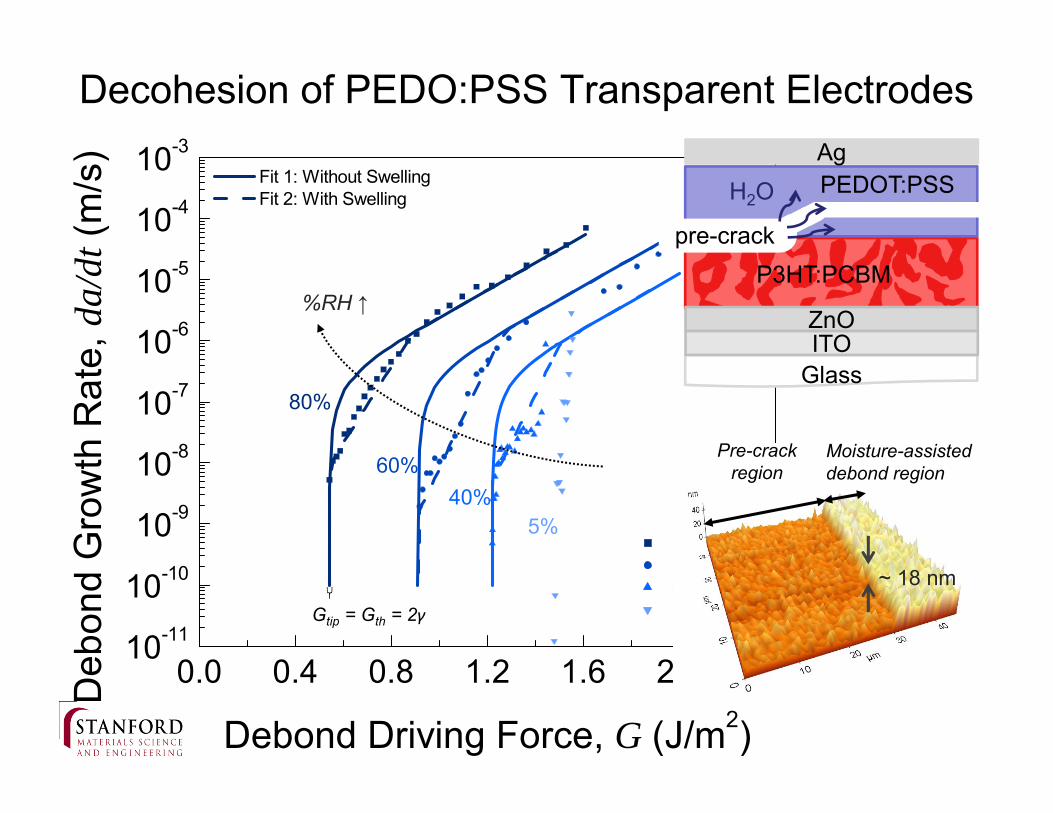
Decohesion of PEDO:PSS Transparent Electrodes D
ebon
d G
row
th R
ate,
da/
dt (m
/s) 10-3
10-4
10-5
10-6
10-7
10-8
10-9
10-10
0.0 0.4 0.8 1.2 1.6 2.0 2.410-11
Fit 1: Without Swelling Fit 2: With Swelling
80 % R.H. 60 % R.H. 40 % R.H. 5 % R.H.
60%
80%
40% 5%
Gtip = Gth = 2γ
%RH ↑ P3HT:PCBM
H2O
pre-crack
PEDOT:PSS
Glass
Ag
ZnO ITO
Moisture-assisted debond region
Pre-crack region
~ 18 nm
Debond Driving Force, G (J/m2)
80 % R.H. 60 % R.H. 40 % R.H. 5 % R.H.
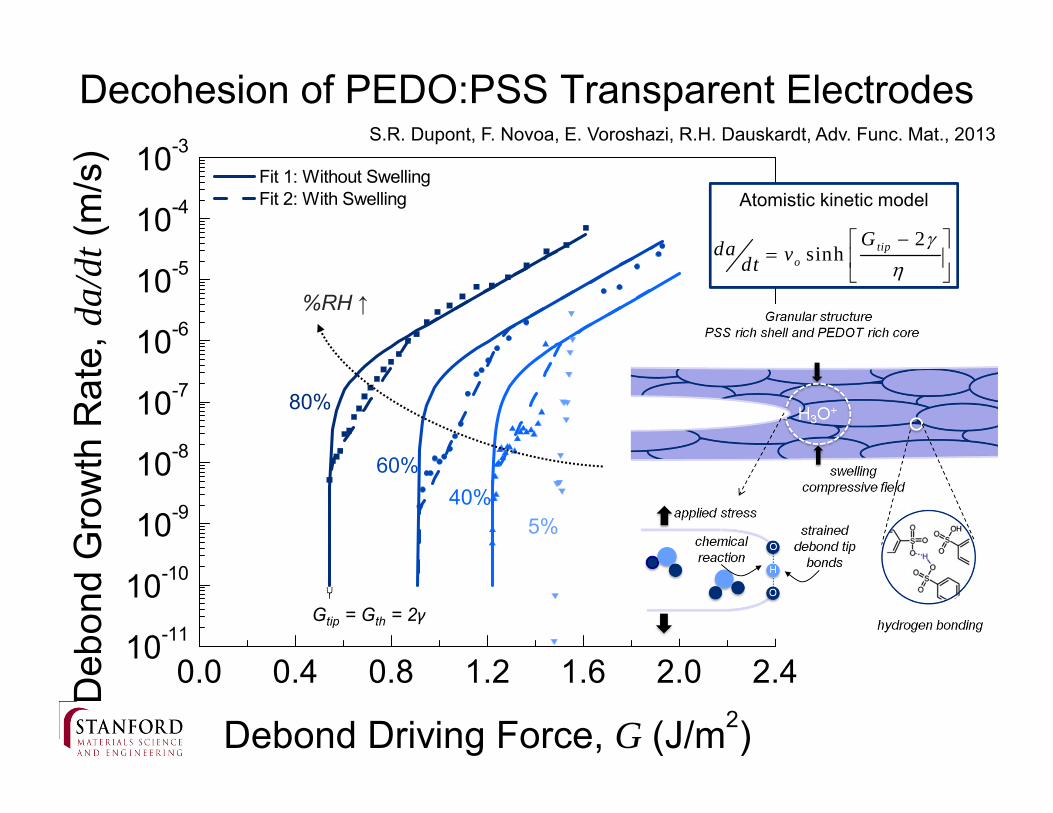
Decohesion of PEDO:PSS Transparent Electrodes S.R. Dupont, F. Novoa, E. Voroshazi, R.H. Dauskardt, Adv. Func. Mat., 2013
Deb
ond
Gro
wth
Rat
e, d
a/dt
(m/s
) 10-3
10-4
10-5
10-6
10-7
10-8
10-9
10-10
0.4 0.8 1.2 1.6 2.0 2.4
Fit 1: Without Swelling Fit 2: With Swelling
Gtip = Gth = 2γ
%RH ↑
2sinh tip
o
Gda vdt
Atomistic kinetic model
60%
80%
40% 5%
10-11
0.0
Debond Driving Force, G (J/m2)

Outline
• Inherent Solar Cell Thermo-Mechanical Reliability • polymer / PCBM BHJ type devices • adhesion and cohesion properties in flexible systems
• Encapsulants and Ultra-Barriers in Solar Modules • synergistic effects of multiple “stressing parameters” • kinetics and lifetimes
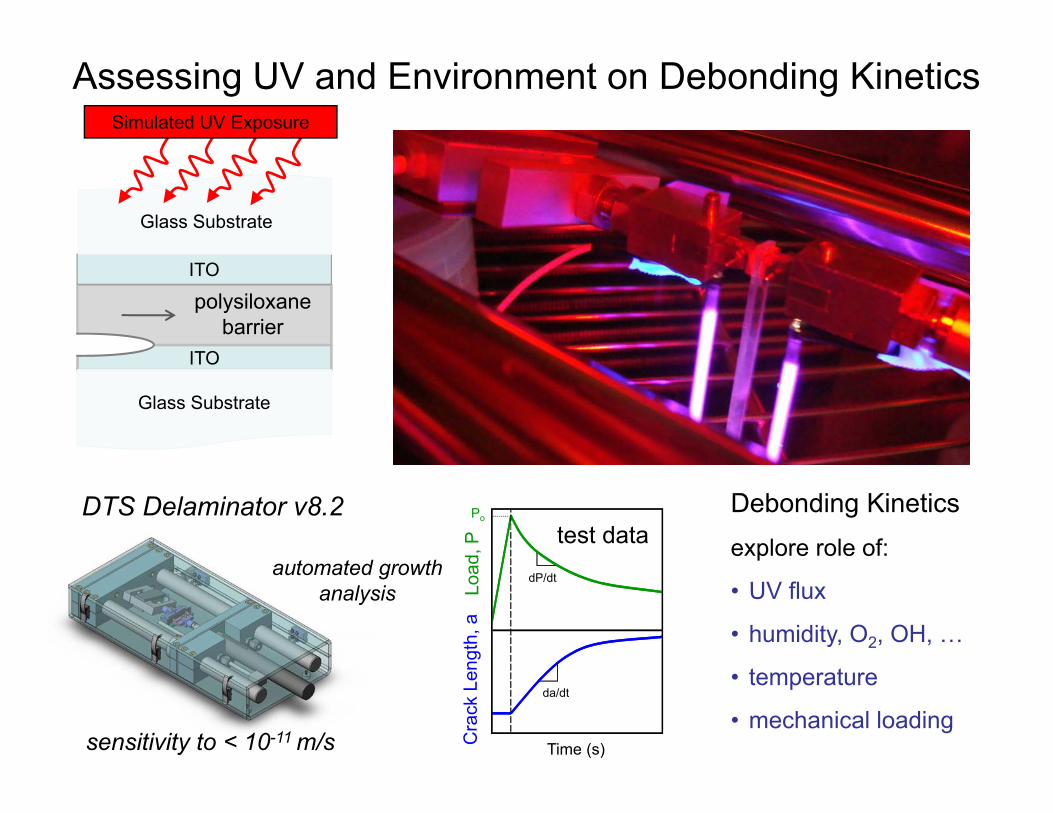
Assessing UV and Environment on Debonding Kinetics
Glass Substrate
ITO
Glass Substrate
Simulated UV Exposure
polysiloxane barrier
ITO
automated growth analysis
sensitivity to < 10-11 m/s
DTS Delaminator v8.2 Lo
ad, P
Cra
ck L
engt
h, a
dP/dt
da/dt
test data Debonding Kinetics Po
explore role of:
• UV flux
• humidity, O2, OH, …
• temperature
• mechanical loading Time (s)
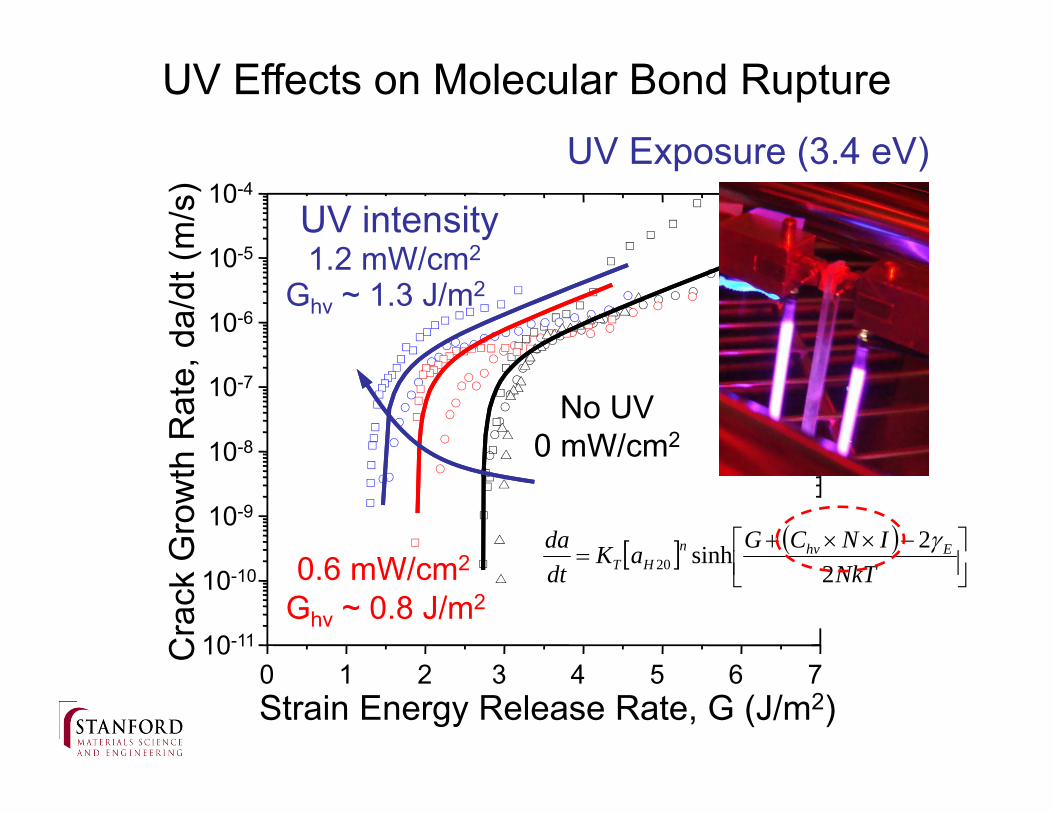
UV Effects on Molecular Bond Rupture UV Exposure (3.4 eV)
Cra
ck G
row
th R
ate,
da/
dt (m
/s)
10-10
10-11
10-4
10-5
10-6
10-7
10-8
10-9
No UV 0 mW/cm2
Ghv ~ 1.3 J/m2
Ghv ~ 0.8 J/m2
UV intensity 1.2 mW/cm2
0.6 mW/cm2
NkT
INCG aKdt da Ehvn
HT 2 2sinh20
0 1 2 3 4 5 6 7 Strain Energy Release Rate, G (J/m2)
EVA TPE- Bridging TPE- No Bridging0
5
10
15
20
25
30
35
40
45
50
55
Stra
in E
nerg
y R
elea
se R
ate,
G (J
/m2 )
Location of Failure
I
II
II
adhesion
Glass Substrate
EVA encapsulant
Tedlar (Polivinylfluoride)PET
EVA seed
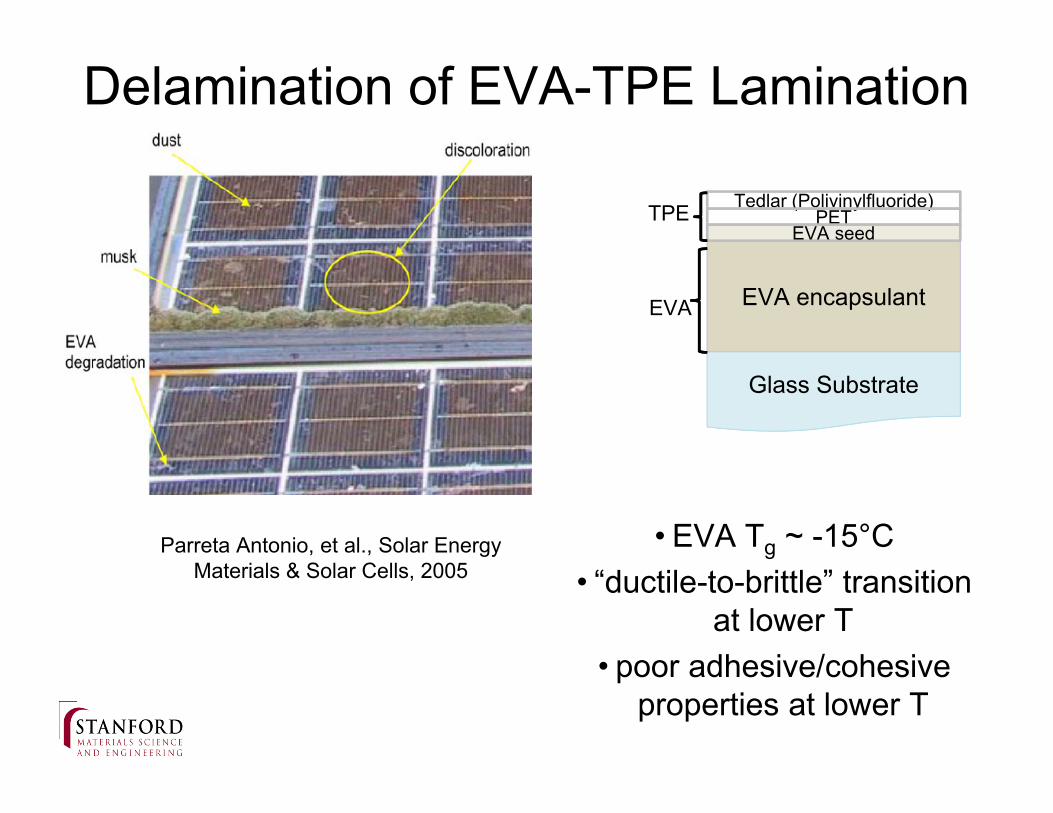
Delamination of EVA-TPE Lamination
Parreta Antonio, et al., Solar Energy Materials & Solar Cells, 2005
TPE
EVA
• EVA Tg ~ -15°C • “ductile-to-brittle” transition
at lower T
• poor adhesive/cohesive properties at lower T
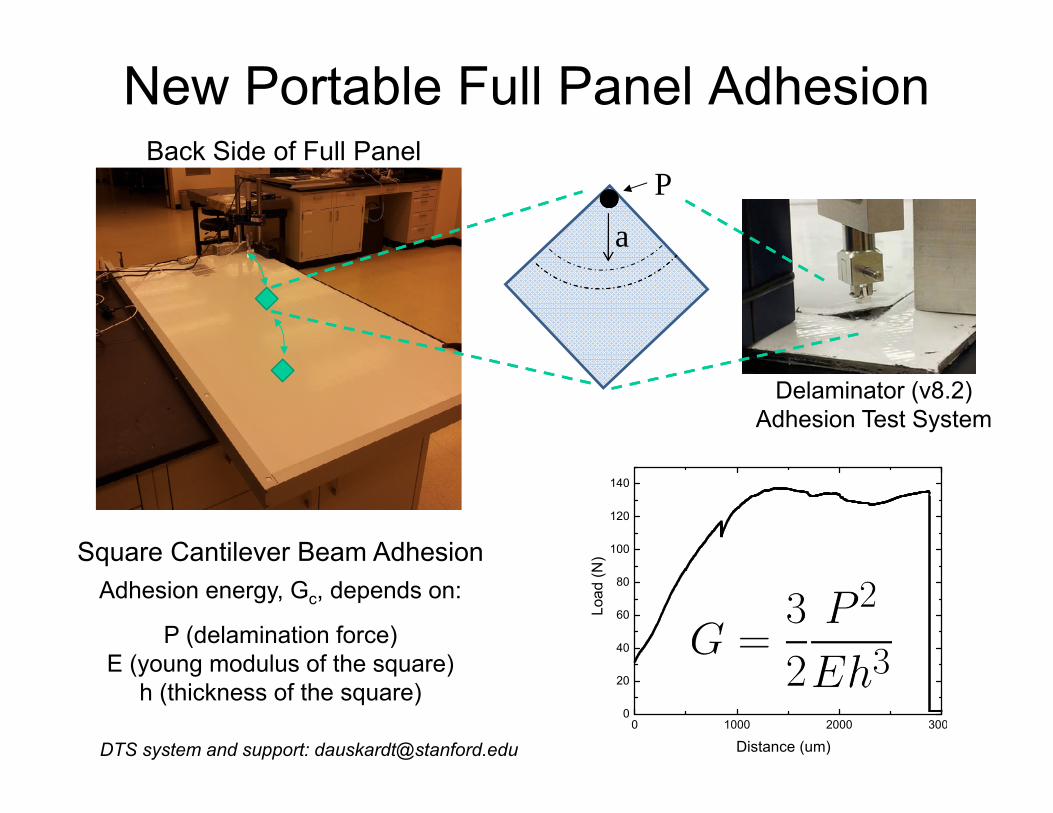
New Portable Full Panel Adhesion Back Side of Full Panel
P a
0 1000 2000 300 0
20
40
60
80
100
120
140
Load
(N) Square Cantilever Beam Adhesion
Adhesion energy, Gc, depends on:
P (delamination force) E (young modulus of the square)
h (thickness of the square)
Delaminator (v8.2) Adhesion Test System
DTS system and support: [email protected] Distance (um)
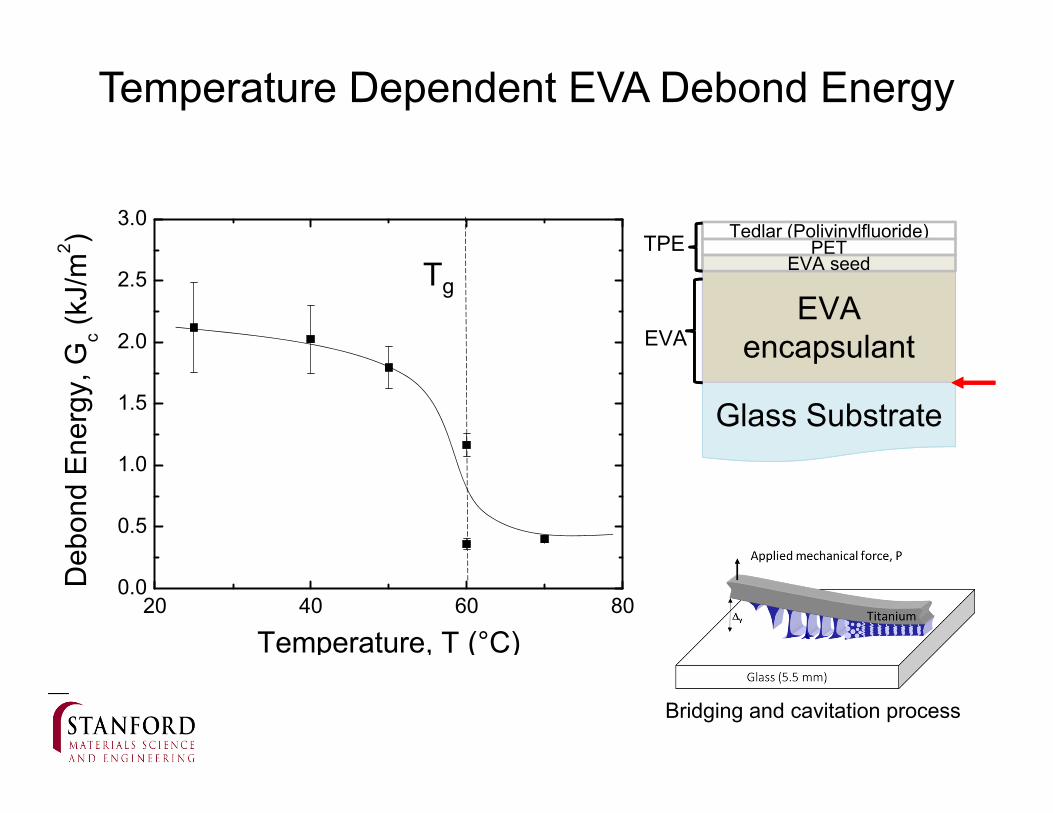
Temperature Dependent EVA Debond Energy
3.0 TPE
2.5
EVA2.0
1.5
1.0
Glass Substrate
EVA encapsulant
Tedlar (Polivinylfluoride)PET
EVA seed
0.5
0.0 20 40 60 80
Temperature, T (°C)
Bridging and cavitation process
Deb
ond
Ene
rgy,
G (k
J/m
2 ) c
Tg
Adh
esiv
e E
nerg
y, G
(J/m
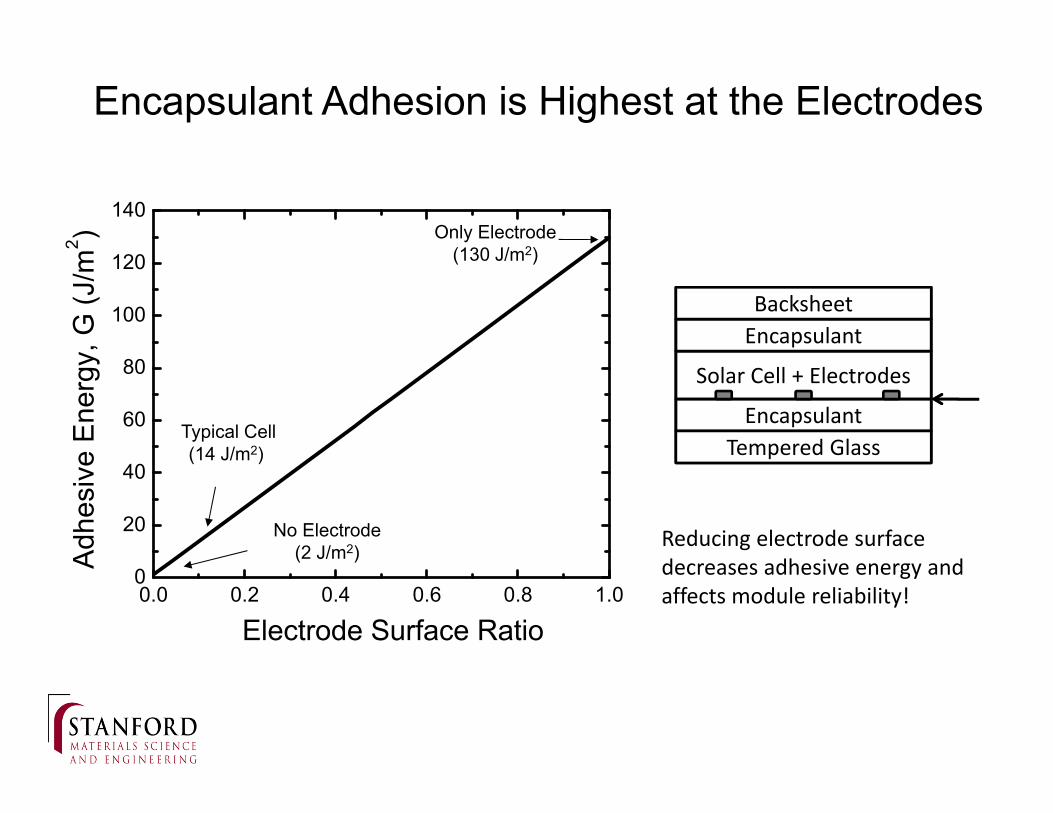
2 ) Encapsulant Adhesion is Highest at the Electrodes
140
120
100
80
60
40
20
0
Only Electrode (130 J/m2)
Typical Cell (14 J/m2)
No Electrode (2 J/m2)
0.0 0.2 0.4 0.6 0.8 1.0
Backsheet Encapsulant
Solar Cell + Electrodes
Encapsulant Tempered Glass
Reducing electrode surface decreases adhesive energy and affects module reliability!
Electrode Surface Ratio
20 300
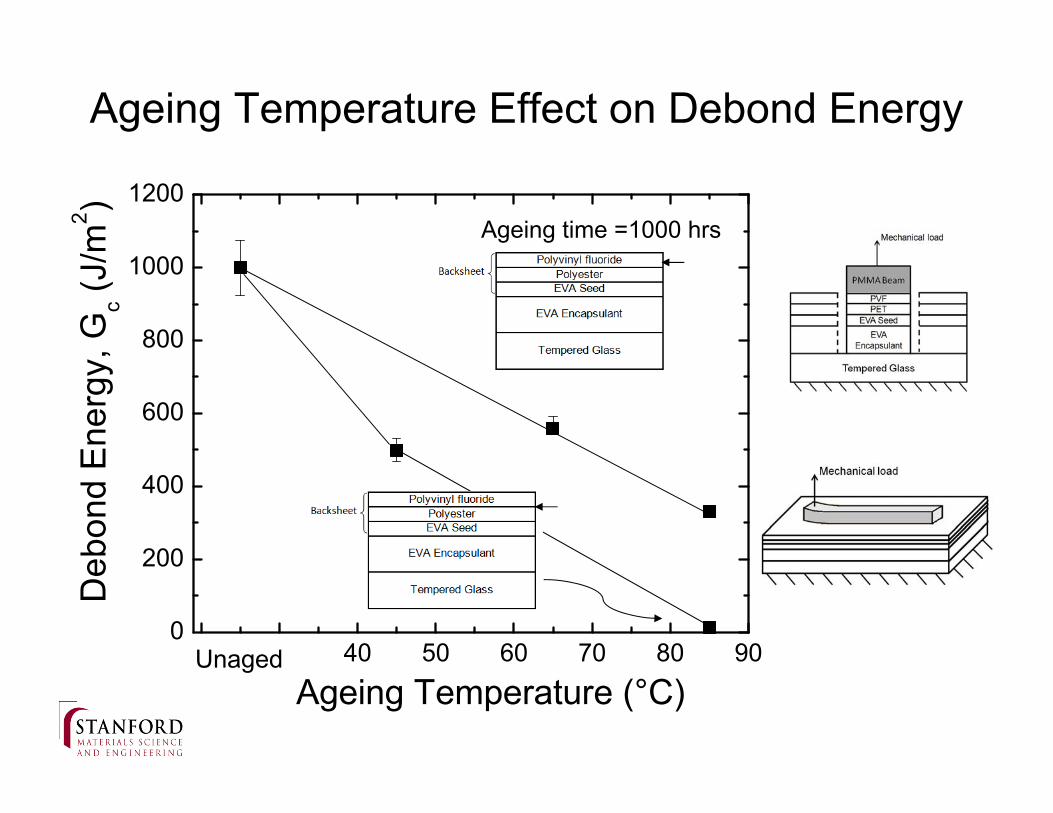
Ageing Temperature Effect on Debond Energy
200
400
600
800
1000
1200
Deb
ond
Ene
rgy,
Gc (J
/m 2 )
Ageing time =1000 hrs
Unaged 40 50 60 70 80 90
Ageing Temperature (°C)
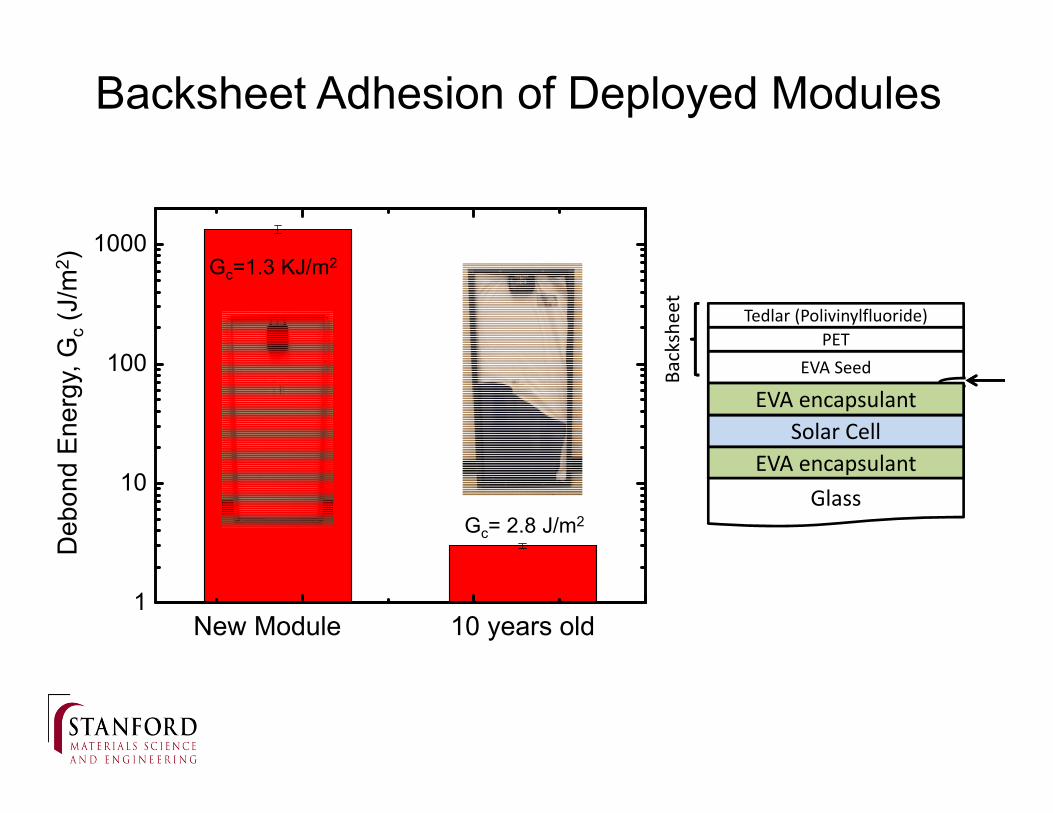
Backsheet Adhesion of Deployed Modules D
ebon
d E
nerg
y, G
c (J
/m2 )
1000
100
10
1 New Module
Gc= 2.8 J/m2
Gc=1.3 KJ/m2
Backsheet
EVA Seed
Solar Cell EVA encapsulant
Glass
PET Tedlar (Polivinylfluoride)
EVA encapsulant
10 years old
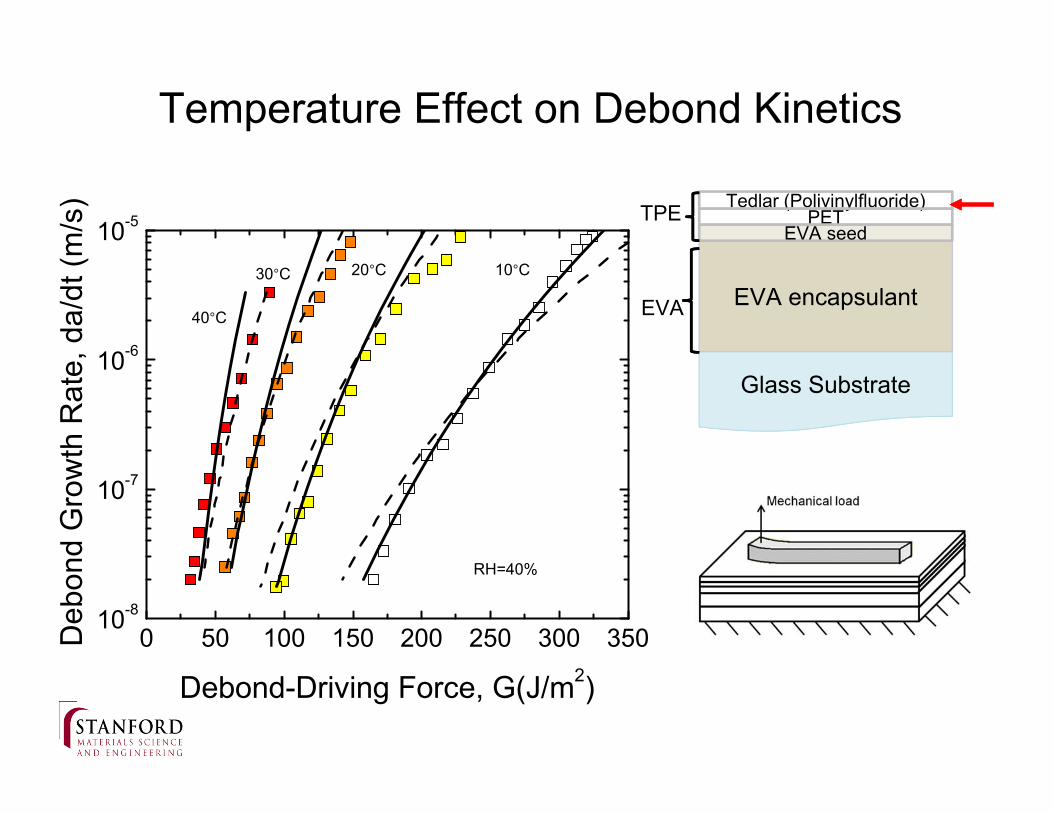
Temperature Effect on Debond Kinetics
0 50 100 150 200 250 300 35010-8
10-7
10-6
10-5
Deb
ond
Gro
wth
Rat
e, d
a/dt
(m/s
)
40°C
10°C20°C30°C
RH=40%
Glass Substrate
EVA encapsulant
Tedlar (Polivinylfluoride)PET
EVA seed TPE
EVA
Debond-Driving Force, G(J/m2)
Summary
• Inherent Solar Cell Thermo-Mechanical Reliability • polymer / PCBM BHJ type devices • adhesion and cohesion properties in flexible systems
• Encapsulants and Ultra-Barriers in Solar Modules • synergistic effects of multiple “stressing parameters” • kinetics and lifetimes