Embed Size (px)
Citation preview

Delft University of Technology
Ballast degradationEffect of particle size and shape using Los Angeles Abrasion test and image analysisGuo, Yunlong; Markine, Valeri; Song, Jianing; Jing, Guoqing
DOI10.1016/j.conbuildmat.2018.02.170Publication date2018Document VersionAccepted author manuscriptPublished inConstruction and Building Materials
Citation (APA)Guo, Y., Markine, V., Song, J., & Jing, G. (2018). Ballast degradation: Effect of particle size and shapeusing Los Angeles Abrasion test and image analysis. Construction and Building Materials, 169, 414-424.https://doi.org/10.1016/j.conbuildmat.2018.02.170
Important noteTo cite this publication, please use the final published version (if applicable).Please check the document version above.
CopyrightOther than for strictly personal use, it is not permitted to download, forward or distribute the text or part of it, without the consentof the author(s) and/or copyright holder(s), unless the work is under an open content license such as Creative Commons.
Takedown policyPlease contact us and provide details if you believe this document breaches copyrights.We will remove access to the work immediately and investigate your claim.
This work is downloaded from Delft University of Technology.For technical reasons the number of authors shown on this cover page is limited to a maximum of 10.

1
Ballast degradation: effect of particle size and shape using Los Angeles Abrasion test and image analysis
Yunlong Guo1, Valeri Markine
1, Jianing Song
2, Guoqing Jing
2 *
1. Faculty of Civil Engineering and Geosciences, Delft University of Technology, Delft,
2628CN, Netherlands
2. School of Civil Engineering, Beijing Jiaotong University, Beijing, 100044, China
[email protected]; [email protected]; [email protected]; [email protected];
* Corresponding author
Abstract:
Ballast track is the most widely used track for the railway transport, and ballast bed plays a significant role to provide resistances during train operation. Generally, the ballast bed consists of crushed stones. To achieve the mitigation of ballast degradation, the first priority is to describe the degradation development and to study its effect factors.
The influence of ballast morphology (particle size and shape) on ballast degradation is examined here using the Los Angeles Abrasion (LAA
1) test in combination with 3-D image analysis. LAA tests are used to obtain the
deteriorated ballast. Then, based on the 3-D images, the changes of ballast particles after the tests were analysed. To quantify the ballast degradation (abrasion and breakage), the Abrasion Depth based on the analysis of 3-D images were proposed, while ballast breakage was estimated using the broken particles ratio.
The results have shown that ballast degradation is directly related to the ballast morphology. The proposed image-based procedure can effectively be applied to assess ballast degradation. The results can be used for ballast material standardization, modelling of ballast degradation process and maintenance cycle prediction.
Key words: Ballast; Los Angeles Abrasion test; Image analysis; Ballast degradation; Ballast morphology
1 Introduction
Ballast bed used in railway track design (Figure 1) traditionally consists of crushed hard rocks with
average particle size range of 20 mm–65 mm under the sleeper, with high density, toughness,
hardness, and high resistance to weathering. Ballast shear strength is influenced by ballast compaction,
particle state and particle size distribution, and generally fresh ballast particles contribute more to
ballast resistance .
LAA test: Los Angeles Abrasion test
LAA loss: Los Angeles Abrasion loss
DEM: Discrete Element Method
FI: flakiness index
EI: elongation index
AAD: Average Abrasion Depth
MAD: Maximum Abrasion Depth
SLAV: Single LAA loss calculated with volume

2
Figure 1 Traditional railway track
A main problem of the traditional railway tracks is geometry deterioration, which is mainly related to
the track settlement. Most of the settlement is caused by the permanent deformation of the ballast layer
[1], which results from densification or dilation, distortion, and degradation, as concluded in [2].
Because ballast undergoes gradual and continuing degradation due to the cyclic loadings and the
maintenance operations, researchers keep developing methods (examples in [3-5]) to study ballast bed
degradation. Nevertheless, some issues are still controversial, such as the effects of shape and size on
degradation and deformation.
As the research in [2, 6], it was demonstrated that the particle’s shape and roughness influences the ballast
resistance and shear strength, and comparing to the rounded particles, the angular ones contribute to lower
permanent deformation [7]. However, higher particle angularity is related with the increasing of breaking
strain and the reduction of the ballast stiffness. Another study on particle shape shows that flaky or
elongated particles at a limited percentage could increase the shear strength, and reduce the settlement
for the lower rate of settlement accumulation [8]. However, it was also reported that flaky or elongated
particles would lead to increased particle degradation and higher deformation [9]. Likewise, there is no
general consensus on the effect of particle size [10]. It was found that particle size has little influence
on shear strength in [11]. Yet, it was concluded in [12] that the shear strength increases when the
particle size reduces. Conversely, the shear strength increases as the particle size increasing according
to the research in [13].
It is difficult to obtain unified principles of ballast study for it is granular material. Plenty of effect
factors will contribute to the final results causing no trends, if the ballast is only treated as a whole
sample. For instance, when studying how the ballast size influences the shear strength, the compaction
and bulk density might be the key factors [14]. However, during the adding normal stress or the
shearing process, the ballast breakage will change the compaction and also the contacts. It may
become a key factor, if ballast breakage is very severe [15]. For that, it needs to study from the
granular level other than analysing the trends according to the test results of the whole sample.
Therefore, it is significant to develop a method to estimate individual ballast particle degradation, and
based on that, the effect of the factors, such as the shape, and the size, could be quantified accurately.
In order to obtain the deteriorated ballast the Los Angeles Abrasion (LAA) test was used. Generally, it
is used for measuring toughness of grain materials .For this part, several laboratory tests, for instance,
the Los Angeles abrasion test(LAA), mill abrasion test, Deval abrasion test, were used for the studies
of ballast degradation and generation of fouled ballast [5, 16]. However, the mill abrasion test cannot
simulate the impact during train passing. And the abrasion results after the micro-Deval tests did not
exerts any relationship with the degradation of ballast under repeated loading [17]. Although LAA test
may not fully simulate the effect of field loading conditions [18], it was found that results of LAA test
are well-correlated with ballast box test results when tamping was considered in their experiments [19,
20].
During the test the material samples and a set of steel spheres are tumbled inside a closed, hollow,
steel cylinder (Figure 2), which is rotated around a horizontal axis. The LAA test is an effective and
simple way to obtain deteriorated ballast and the fouling, and for this purpose it was used in [21-23].
Rail Fastening
Sleeper
BallastSub-ballast
Subgrade

3
Cylinder
500 mm
700 mm
Figure 2 Los Angeles Abrasion (LAA) test machine
A comprehensive tests were performed in [17], finding that the LAA results correlated fairly well with
ballast breakage of the full scale track model test. It also concluded that the LAA test can distinguish
high-quality material and the poor material clearly. It was proposed in [24] that, the sieve analysis that
is used in the LAA test for determining how the particles reduce in size, is not precise enough to
estimate the ballast degradation, especially for the purpose of numerical simulations e.g. using
Discrete Element Method (DEM).
Recently, ballast degradation was studied and determined from the digital or X-ray images system by
various researchers [21, 25-27]. Detailed measurements of particle’s shape and roughness using the
image analysis method have been successfully used for quantifying particle morphology [28, 29].
Ballast particle abrasion and breakage by LAA tests with fouling index, and a relationship between the
fouling index and the flakiness and elongation index change, sharp corner loss and surface texture
reduction of the ballast particles, and the ballast shape factors evolution in different LAA test stages
were studied in [21]. However, how individual ballast particles with various morphology deteriorate
have not been systematically studied. Moreover, the digital or X-ray image is a cross section of an
individual particle, and reflects the morphology of ballast particles roughly. As proposed in [27], only
when the number of cross-sections is sufficiently large, the morphology of ballast particles can be
more accurately accessed, however, it is quite time consuming.
As a consequence, this paper describes a study to measure and evaluate how an individual particle
morphology (size and shape) changes during degradation. It is studied with LAA tests, as well as 3-D
image analysis. Based on the 3-D images, quantifications of individual particle changes in detailed
parameters are proposed and studied. 3-D image analysis is an ideal and accurate tool for quantifying
particle size and shape properties in a rapid, reliable and automated fashion when compared to
traditional manual methods, confirmed in [25, 26, 30-32]. Ballast images from laser scanning are
utilized to record initial ballast morphology, afterward the LAA test was conducted to obtain the
deteriorated ballast particles. Comparing the images before and after LAA tests can reveal the changes
on form, surface texture and sharp corner of ballast particles [33], as well as ballast breakage, and then
demonstrate the main form of ballast degradation. In addition, based on the image analysis method, the
effect factors were studied, such as particle shape and size. Using image analysis to study ballast
degradation could estimate ballast bed condition, so that can provide guidance on maintenance.
Moreover, the 3-D images can be applied in the DEM models as the particle templates to simulate the
irregular shape and sharp corners in the future research.
4
2 Analysis of ballast degradation
In this section, the detailed test procedure to analyse ballast degradation is introduced, including
sample processing, the LAA test and laser scanning. In addition, the methods applied to estimate
ballast degradation are described.
2.1 Test planning
With the aim of studying the ballast degradation, the test procedure is designed, as shown in Figure 3.
Also, the goal of the test was to verify the assumptions that the ballast degradation mainly results from
sharp corner loss, and that the flaky or elongated particles are more prone to break.
Prepare samples at three particle size ranges (25~35 mm, 40~50 mm and 50~60 mm) with different shapes (Flaky or elongated and cubic)
Choose typical ballast particles (different size and shape), which are used for laser scanning to record initial morphology, afterwards they
are painted and marked for distinguishing after LAA test
Perform LAA test to obtain deteriorated ballast particles
Scan the ballast particles again to compare the particle images
Figure 3 Test flow chart
2.1.1 Samples processing
In order to study effect factors of ballast degradation, the ballast particles were categorized by their
shapes as flaky or elongated and cubic, according to the flakiness and elongation index suggested in
[34-36]. By their size, three particle size ranges are categorized, namely 25~35 mm, 40~50 mm and
50~60 mm.
The flakiness and elongation index is quantified with the lengths of the three representative axes: the
longest axis with the length L, the medium axis with the length I and the shortest axis with the length
S. The medium axis length I is treated as the sieve size, which was proposed in [21, 25, 35, 37, 38].
After measuring the three axes of each particle, the flakiness index (FI) and elongation index (EI) for
each particle are obtained as follows:
Equation 1 ISFI /
Equation 2 LIEI /
As shown in Figure 4, the ballast particles with FI smaller than 0.6 or with EI above 1.8 as the flaky or
elongated ballast particles, according to [36]. Ballast particles that are neither elongated nor flaky are
considered as the cubic ones.

5
Figure 4 Flaky (left) and elongated (right) ballast particles in particle size range of 25~35 mm
The ballast material used in the tests was crushed granite as shown in Figure 5. The ballast particles
were washed with fresh water, and then dried in open air for 3 days. After that the particles were
selected and measured to calculate the flakiness and elongation index. The ballast particles were
sieved into 3 groups at the size range of 25~35 mm, 40~50 mm and 50~60 mm respectively, and each
group weighs 5 kg, including cubic, flaky or elongated particles.
The scanned (will be explained in the next Section 2.1.2), flaky or elongated and cubic particles were
painted into three different colors and each particle is marked with a certain number, for being
distinguished after the LAA test. To be more specific, the cubic particles are red, the flaky or elongated
ones are black, as shown in Figure 5b.
a
b
Figure 5 (a) Sample preparation; (b) Sample particle size ranges: 50~60 mm (left), 40~50 mm (middle), 25~35 mm (right)
2.1.2 Scanning ballast particles
In order to study how the shape of ballast particles influences ballast degradation, some of the particles
were scanned for subsequent analysis using the laser scanner. The scanned ballast particles, chosen
from the 3 different size ranges, contain flaky or elongated and cubic ones. In order to be distinguished
from the ballast particles that were not scanned, they were painted using blue color (Figure 5b). The
Capture Mini Scanner used here (Figure 6) has been optimized to meet the needs of product
development and engineering professionals to obtain the most effective and reliable way to acquire 3-

6
D measurements of physical objects. The scanner parameters are listed in Table 1.
Figure 6 Capture Mini Scanner
Table 1 Capture Mini Scanner properties
Property Capture Mini
Weight 1.04 kg
Dimensions (L × W × H)
155 × 109 × 49 mm
Data Capture Rate 985,000 points/scan
(0.3 sec per scan)
Resolution 0.080 mm at 157 mm
0.100 mm at 227 mm
Accuracy 0.034 mm
Stand-off Distance 157 mm
Depth of Field 70 mm
Field of View 87 × 68 mm (near)
88 × 87 mm (far)
The scanning process is as follow: firstly, a ballast particle is placed on a black turntable, which can
spin during scanning process to get images of every particle side; secondly, the laser light reflected
from particle surface is captured by coupled device camera; thirdly, about 500,000 vertices are
transmitted to the computer, and three consequent images are used to form one triangular plane.
Finally, all small triangular planes constitute the 3-D ballast particle image (Figure 7).
After getting the 3-D images, the next step is to reduce the noise and cover small holes resulting from
data deficiency. The areas of all the triangular planes are summed up, to calculate the surface area of
the 3-D particle, whereas the volume is obtained by summing up all the tetrahedral meshes. The
method for calculation of volume and surface area is described in [37].
As suggested in [39], the highest resolution of 0.080 mm, is used during the scanning process for
better analysis of ballast surface texture change [33]. Three images of one ballast particle with various
resolutions are shown in Figure 7. From this figure it can be seen that the highest resolution can better
present the surface texture.

7
Figure 7 Images of one ballast particle with 3 resolutions: low (left); medium (middle); high (right)
2.1.3 LAA test
The dynamic behavior and deformation of rock particles subject to train loading can be generally
studied by the cyclic triaxial and resonant cylinder tests, and parameters from these tests are
commonly used as the indices of ballast degradation [2, 40, 41]. A common test for particle abrasion
and fragmentation is the LAA test. It mainly causes fragmentation due to impact from steel balls, and
more rounding shape of particles result from abrasion, as proposed in [17].
Generally, the LAA tests are used to analyse durability and strength properties of granular materials.
For instance, in [42] the correlation between the material loss (also called LAA loss that will be
described in Section 2.2.1) and some physical properties, including bulk density, hardness, and point
load index. In [43], 35 different rock types were utilized to study the correlation between the LAA loss
and uniaxial compressive. These studies focused on the correlation between the LAA loss and
mechanical properties. LAA tests can also be used to obtain deteriorated ballast, confirmed in [16, 22,
23, 44]. With this method, the deteriorated ballast particles are produced.
The LAA machine has revolving speed at 31~33 r/min, and is filled with samples and steel balls.
According to [36], the drum was set to rotate 1,000 turns. However, it was halted every 250 turns
during the test, in order to make sure the painted particles were still with colors. After conducting the
test, small particles with diameter below 1.7mm were sieved out.
After that, the particles were separated into 3 groups according to the remained color (red, black and
blue) and marked number, and all particles in each size range were washed, measured and weighed.
2.1.4 Laser Scanning after LAA test
After the LAA test, the ballast particles with blue color were scanned again, as shown in Figure 8.
Afterwards, the particle changes during LAA test can be studied. The ballast particles before and after
the LAA test could be matched by the shape, size and marked numbers.

8
Figure 8 Scanned ballast particle and image; From left to right: initial ballast particle, initial image, painted particle, particle
after test, particle image after test
2.2 Degradation estimation
In Figure 9, the main properties of the ballast particle shape are shown. They are form, sharp corner
and surface texture, and their definitions are explained in [33]. They are used to characterise the shape,
because each of them is essentially independent properties of the shape, and can be varied without
affecting the other two properties, as proposed in [35]. More importantly, they are among the
properties of ballast particles that have great influence on the performance of ballast bed (durability,
shear strength and stiffness), by influencing mutual contacts [10, 45]. Another significant factor
affecting the performance of ballast layer is the ballast breakage. Because it has correlation with the
strength, modulus, bulk density and internal friction [12, 15]. Consequently, an extensive study is
necessary to clarify the ballast degradation mechanism, including the sharp corner loss, breakage, and
surface texture reduction, applicable to railway ballast.
Figure 9 Shape properties of ballast particle
However, most of research studies focused on quantifying ballast shape properties. A limited number
of studies were performed on investigating the changing of the shape properties with 2-D images
analysis [23]. To date, no studies has yet reported to use 3-D images for analyzing the shape property
changing of individual ballast particles. More importantly, to study the ballast breakage, various
indices were proposed, such as Bg, Br, BBI, B. Their methods are to measure the percentage of some
certain sieve sizes, or to estimate the change of Particle Size Distribution (PSD) [15, 41, 46, 47].
However, that costs large amount of time, and also the results are not accurate for they are based on
sieving, which always provides fluctuating results due to personal equation. Therefore, new methods
are proposed as follows to study the ballast degradation.
Based on the 3D images of ballast particles, ballast degradation was estimated using the following
parameters, and their definitions will be explained in the following sub-sections:
1. LAA loss (%) - the overall sample degradation estimation;
2. Broken number rate – ballast breakage
9
3. Image analysis
a. Average Abrasion Depth – estimating individual ballast particle degradation
b. 3D True Sphericity [48] – estimating form change (particles become more rounded)
c. Maximum Abrasion Depth - estimating sharp corner change (sharp corner loss)
d. Abrasion Depth – estimating roughness change (surface texture reduction)
2.2.1 LAA loss
The LAA loss (%) is a vital parameter characterising abrasion resistance of grain materials, as
described in [42]. It is defined as the weight loss rate:
Equation 3 1 2 1LA M M M
In the Equation 3, M1 is the initial weight of tested material, and the M2 is the weight of tested material
after the LAA test.
2.2.2 Broken particles ratio
To obtain the correlation between the shape/size and ballast breakage, for the scanned particles, the
broken ballast particles are counted. To be more specific, after picking out the scanned particles
according to color, they were compared with their initial images. However, some of the particles
cannot match any of the initial images, because they were broken during the test (Figure 10). Ballast
breakage can be assessed by the broken particles ratio defined as the ratio between the number of the
broken particles and the initial number of the particles.
Figure 10 Example of broken ballast particle that cannot match any of the initial images
2.2.3 3D True Sphericity
During the LAA test, the ballast particles deteriorate with the form changing to more rounded. In order
to quantify it, the “3D true Sphericity”, proposed in [48], was used in this study. Obtaining this
parameter includes three steps: the first step is to measure the volume of a ballast particle (V0), which
is used to calculate the radius r of the sphere with equivalent volume from
Equation 4 3
0
4
3V r
Then the radius r is used to calculate the surface area of the sphere, S:
Equation 5 24 rS
Finally, the “3D True Sphericity”, ψ, is calculated as the ratio between the surface area of the sphere,
10
S, and the surface area of ballast particle, S0.
Equation 6 0/ SS
2.2.4 Abrasion Depth
The Abrasion Depth is calculated by comparing the two images to obtain the difference values, as
shown in Figure 11.
Cross section of ballast particle image
before LAA test
Cross section of ballast particle image
after LAA test
Abrasion Depth
Enlarged
Figure 11 Explanation of Abrasion Depth calculation
As shown in Figure 12, the Abrasion Depth result shows the degree of abrasion in different zones,
including sharp corners, edges, and flat surfaces.
Sharp corner lossSurface texture reduction
Edge change
Figure 12 Abrasion Depth (in mm) of one ballast particle obtained from 3-D image analysis
Based on the Abrasion Depth, an alternative method, the Average Abrasion Depth (AAD), is proposed
to evaluate individual ballast degradation. The AAD is calculated by averaging the summation of all
the Abrasion Depth of one ballast particle. This parameter can be utilized to present the deterioration
degree of an individual ballast particle, which will be verified in the Section 2.2.5.
Another parameter, the Maximum Abrasion Depth (MAD), is used to estimate the sharp corner loss of
ballast particles. It is also based on the Abrasion Depth. As shown in Figure 12, the maximum value of
the Abrasion Depth is at the sharp corner that is around 5.90 mm (dark red color). It is defined as the
MAD.
As shown in Figure 12, it can be seen that the green part corresponds to the Abrasion Depth in the
range of 0.0~0.57 mm. It generally occurs at the flat surface, which is treated as the surface texture
reduction.
11
2.2.5 LAA loss of single particles
The LAA loss is for the whole sample (overall ballast particles) and is not suitable for degradation
analysis of individual ballast particle. Therefore, the Single LAA loss parameter is introduced. It is the
material loss of every individual ballast particles after the LAA test. It can be calculated on the basis of
mass or volume of a ballast particle (Equation 7 and Equation 8). In the equations: M1 is the initial
mass, V1 is the initial volume; The M2 and V2 are mass and volume after the LAA test respectively.
Equation 7 1 2 1( ) /SLAM M M M
Equation 8 1 2 1( ) /SLAV V V V
Volume is also available from image analysis, and it is more accurate than mass measurement,
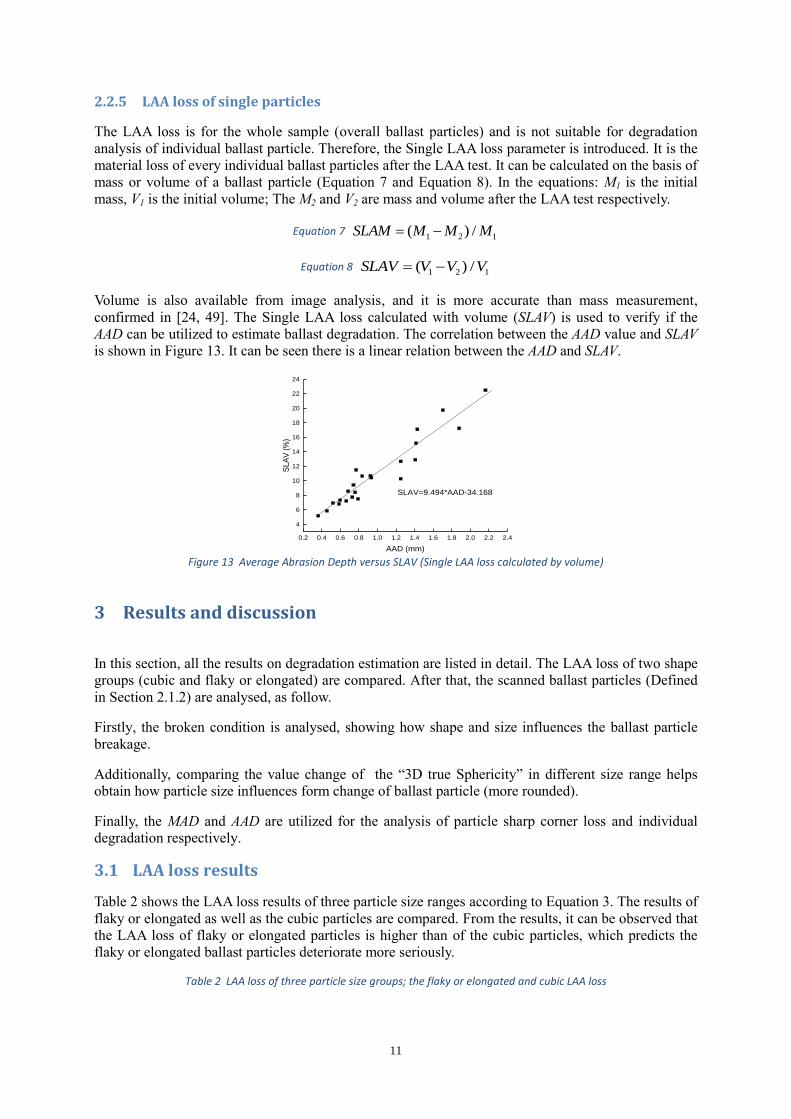
confirmed in [24, 49]. The Single LAA loss calculated with volume (SLAV) is used to verify if the
AAD can be utilized to estimate ballast degradation. The correlation between the AAD value and SLAV
is shown in Figure 13. It can be seen there is a linear relation between the AAD and SLAV.
0.2 0.4 0.6 0.8 1.0 1.2 1.4 1.6 1.8 2.0 2.2 2.4
4
6
8
10
12
14
16
18
20
22
24
SL
AV
(%
)
AAD (mm)
SLAV=9.494*AAD-34.168
Figure 13 Average Abrasion Depth versus SLAV (Single LAA loss calculated by volume)
3 Results and discussion
In this section, all the results on degradation estimation are listed in detail. The LAA loss of two shape
groups (cubic and flaky or elongated) are compared. After that, the scanned ballast particles (Defined
in Section 2.1.2) are analysed, as follow.
Firstly, the broken condition is analysed, showing how shape and size influences the ballast particle
breakage.
Additionally, comparing the value change of the “3D true Sphericity” in different size range helps
obtain how particle size influences form change of ballast particle (more rounded).
Finally, the MAD and AAD are utilized for the analysis of particle sharp corner loss and individual
degradation respectively.
3.1 LAA loss results
Table 2 shows the LAA loss results of three particle size ranges according to Equation 3. The results of
flaky or elongated as well as the cubic particles are compared. From the results, it can be observed that
the LAA loss of flaky or elongated particles is higher than of the cubic particles, which predicts the
flaky or elongated ballast particles deteriorate more seriously.
Table 2 LAA loss of three particle size groups; the flaky or elongated and cubic LAA loss
12
Particle size 50~60 mm 40~50 mm 25~35 mm
Flaky or elongated 15.10 19.28 16.17
Cubic 4.15 5.37 11.67
3.2 Breakage analysis results
By counting the broken particles ratio (defined in Section 2.2.2) of scanned particles, the results are
listed in Table 3. From the table, it can be concluded that flaky or elongated particles are more prone to
crack than the cubic particles. In addition, bigger ballast particles crack more easily. The explanations
are listed below:
1. The broken particles ratio of cubic particles are 0% (25~35 mm), 25% (40~50 mm) and 50%
(50~60 mm), which are lower than the flaky or elongated particles at 41.7% (25~35 mm),
58.3% (40~50 mm) and 77.8% (50~60 mm).
2. When it comes to the particle size, the total broken number rate of three groups are 31.3%
(25~35 mm), 50% (40~50 mm) and 69.2% (50~60 mm) respectively, from which it can be
concluded that the bigger particles are more prone to fracture.
Table 3 Number and ratio of broken ballast particles at three particle size ranges
Particle
size(mm)
Total
broken
rate(%)
Shape
Scanned
particle
number
Broken
particle
number
Broken
particles
ratio(%)
25~35 31.30
cubic 4 0 0.00
flaky or
elongated 12 5 41.70
40~50 50.00
cubic 4 1 25.00
flaky or
elongated 12 7 58.30
50~60 69.20
cubic 4 2 50.00
flaky or
elongated 9 7 77.80
3.3 3D true Sphericity analysis results
Based on the data (volume and surface area) in Table A.1 at appendix, the data in Table 4 can be
obtained. Table 4 presents the average “3D true Sphericity” value before and after the LAA test at two
particle size ranges (25~35 mm and 40~50 mm). The particle size range 50~60 mm was not used for
analysis, because it only has 4 unbroken particles left after the LAA test, which influences a lot on the
“3D true Sphericity” value.
According to the data in Table A.1, the volume and surface area of every particles decrease after the
LAA test, while, the “3D true Sphericity” values increase. It was proposed in [48] that the “3D true
Sphericity” value is in the range of 0.000~1.000, and the value is closer to 1.000 for the more rounded
particles. The increased “3D true Sphericity” value indicates that the LAA test can cause significant
changes of the particle form, which means ballast particles became smoother and more rounded.
Rounded particles will lead to less stable particle interlocking than the fresh ballast.
Table 4 Average “3D true Sphericity” value before and after LAA test
Particle size
Average 3D true
Sphericity
before test
Average 3D true
Sphericity
after test
Value change rate (%)
25~35 mm 0.747 0.806 7.89
40~50 mm 0.728 0.806 10.63
From Table 4, it can be seen that the value change rate of particle size range at 40~50 mm is 10.63%,
which is bigger than 7.89% (value change rate of particle size range at 25~35 mm). It indicates that

13
particle size influences ballast degradation during the LAA test, which means bigger particles are more
prone to become rounded.
3.4 MAD and AAD analysis results
From the Figure 14, it can be seen that the most serious abrasion zone occurs at the sharp corner, so
the MAD value can be used to quantify sharp corner loss, as described in Section 2.2.4.
It can also be observed that the serious abrasion zones mostly occur at sharp corners and edges, and
that less Abrasion Depth appears at the flat surface with the value within 1.00 mm. The image analysis
results are consistent with cyclic triaxal tests in [41], identifying that most ballast degradation is
primarily the consequence of sharp corner loss.
Figure 14 Abrasion Depth (in mm) of ballast particles
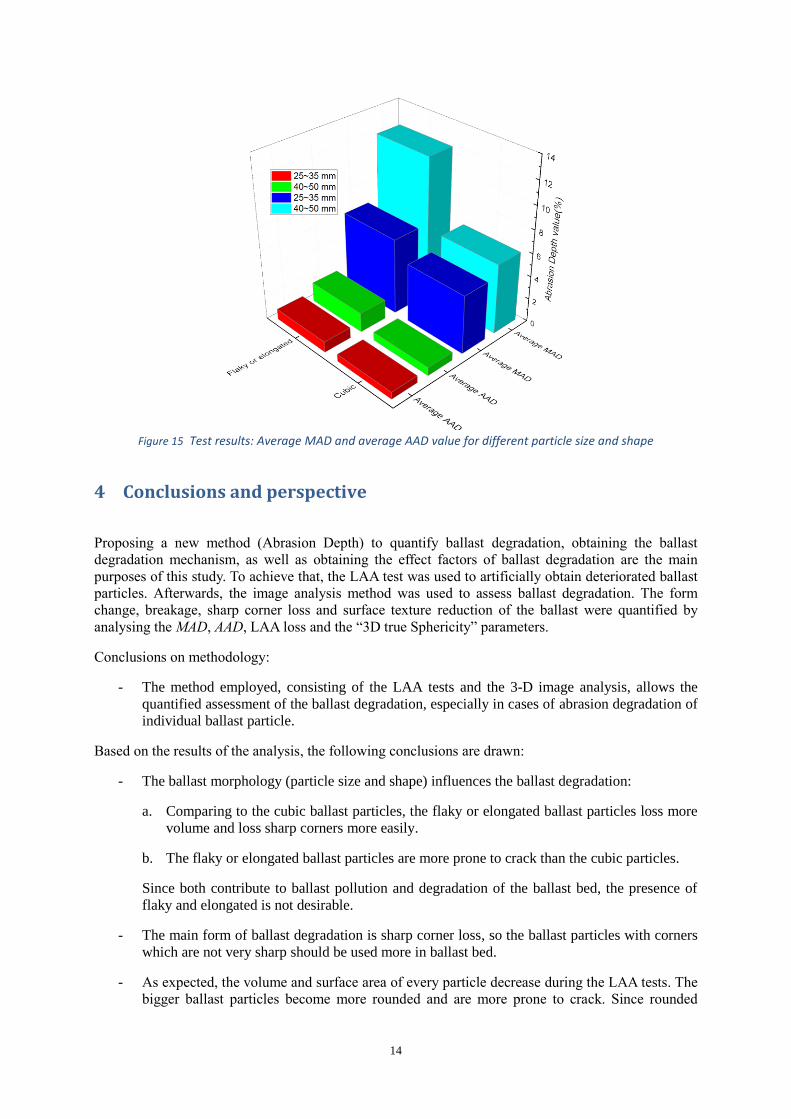
Figure 15 shows the average MAD and average AAD value at two size ranges (25~35 mm and 40~50
mm). The two size ranges (25~35 mm and 40~50 mm) are used for analysis, because the particle size
range 50~60 mm has only 4 unbroken particles left after the LAA test, which influences a lot on the
average value.
As shown in Figure 15, the flaky or elongated particles have higher average AAD and average MAD
than the cubic particles, indicating that flaky or elongated particles deteriorate more seriously and lost
their sharp corners more easily.
In addition, the particle size range 40~50 mm shows higher average AAD and average MAD than the
size range 25~35 mm, proving that bigger ballast particles deteriorate more seriously and lose sharp
corners more easily.
14
Figure 15 Test results: Average MAD and average AAD value for different particle size and shape
4 Conclusions and perspective
Proposing a new method (Abrasion Depth) to quantify ballast degradation, obtaining the ballast
degradation mechanism, as well as obtaining the effect factors of ballast degradation are the main
purposes of this study. To achieve that, the LAA test was used to artificially obtain deteriorated ballast
particles. Afterwards, the image analysis method was used to assess ballast degradation. The form
change, breakage, sharp corner loss and surface texture reduction of the ballast were quantified by
analysing the MAD, AAD, LAA loss and the “3D true Sphericity” parameters.
Conclusions on methodology:
- The method employed, consisting of the LAA tests and the 3-D image analysis, allows the
quantified assessment of the ballast degradation, especially in cases of abrasion degradation of
individual ballast particle.
Based on the results of the analysis, the following conclusions are drawn:
- The ballast morphology (particle size and shape) influences the ballast degradation:
a. Comparing to the cubic ballast particles, the flaky or elongated ballast particles loss more
volume and loss sharp corners more easily.
b. The flaky or elongated ballast particles are more prone to crack than the cubic particles.
Since both contribute to ballast pollution and degradation of the ballast bed, the presence of
flaky and elongated is not desirable.
- The main form of ballast degradation is sharp corner loss, so the ballast particles with corners
which are not very sharp should be used more in ballast bed.
- As expected, the volume and surface area of every particle decrease during the LAA tests. The
bigger ballast particles become more rounded and are more prone to crack. Since rounded

15
particle and particle breakage are not desirable in ballast bed, the proper particle size should
be used in ballast bed.
Perspective:
- The results obtained here together with the 3-D image analysis will be used in the detailed
numerical simulations using DEM to analyse the degradation mechanism of ballast.
- In addition, the method based on the 3-D image analysis to quantify ballast degradation could
be used to assess the ballast bed condition and to predict the maintenance cycle.
Acknowledgments
The paper was supported by the Natural Science Foundation of China (Grant No.51578051) and China
Scholarship Council.
Reference
[1] D. Li, J. Hyslip, T. Sussmann, S. Chrismer, Railway geotechnics, CRC Press2002. [2] Q.D. Sun, B. Indraratna, S. Nimbalkar, Deformation and degradation mechanisms of railway ballast under high frequency cyclic loading, Journal of Geotechnical and Geoenvironmental Engineering 142(1) (2015) 04015056. [3] N.T. Ngo, B. Indraratna, Improved performance of rail track substructure using synthetic inclusions: experimental and numerical investigations, International Journal of Geosynthetics and Ground Engineering 2(3) (2016) 24. [4] E. Kabo, A numerical study of the lateral ballast resistance in railway tracks, Proceedings of the Institution of Mechanical Engineers, Part F: Journal of Rail and Rapid Transit 220(4) (2006) 425-433. [5] H. Huang, E. Tutumluer, W. Dombrow, Laboratory characterization of fouled railroad ballast behavior, Transportation Research Record: Journal of the Transportation Research Board (2117) (2009) 93-101. [6] H. Huang, E. Tutumluer, Discrete Element Modeling for fouled railroad ballast, Construction and Building Materials 25(8) (2011) 3306-3312. [7] R. Knutson, M. Thompson, T. Mullin, S. Tayabji, BALLAST AND FOUNDATION MATERIALS RESEARCH PROGRAM. PHASE IV. MATERIALS EVALUATION STUDY, 1977. [8] T. Siller, Properties of railroad ballast and subballast for track performance prediction, Master's project report. Con-crete Tie Correlation Study, Department of Civil Engineering, University of Massachusetts, Amherst (1980). [9] Y. Gur, E. Shklarsky, M. Livneh, Effect of coarse-fraction flakiness on the strength of graded materials, Asian Conf Soil Mech & Fdn E Proc/Is/, 1967. [10] D. Ionescu, Evaluation of the engineering behaviour of railway ballast, (2004). [11] W. Holtz, H.J. Gibbs, Triaxial shear tests on pervious gravelly soils, Journal of the Soil Mechanics and Foundations Division 82(1) (1956) 1-22. [12] N.D. Marachi, C.K. Chan, H.B. Seed, Evaluation of properties of rockfill materials, Journal of Soil Mechanics & Foundations Div 97(SM1) (1900). [13] C. Dunn, P. Bora, Shear strength of untreated road base aggregates measured by variable lateral pressure triaxial cell, Journal of Materials 7(2) (1972). [14] Z. Wang, G. Jing, Q. Yu, H. Yin, Analysis of ballast direct shear tests by discrete element method under different normal stress, Measurement 63 (2015) 17-24.

16
[15] R.J. Marsal, Mechanical properties of rockfill, Publication of: Wiley (John) and Sons, Incorporated (1973). [16] Y. Qian, H. Boler, M. Moaveni, E. Tutumluer, Y. Hashash, J. Ghaboussi, Characterizing Ballast Degradation Through Los Angeles Abrasion Test and Image Analysis, Transportation Research Record: Journal of the Transportation Research Board 2448 (2014) 142-151. [17] R. Nålsund, Railway ballast characteristics, selection criterion and performance, Department of Civil and Transport Engineering, Norwegian University of Science and Technology, Trondheim (2014). [18] M. Moaveni, Y. Qian, I.I.A. Qamhia, E. Tutumluer, C. Basye, D. Li, Morphological Characterization of Railroad Ballast Degradation Trends in the Field and Laboratory, Transportation Research Record: Journal of the Transportation Research Board 2545 (2016) 89-99. [19] W.L. Lim, Mechanics of railway ballast behaviour, University of Nottingham, 2004. [20] G.R. McDowell, W.L. Lim, A.C. Collop, R. Armitage, N.H. Thom, Laboratory simulation of train loading and tamping on ballast, Proceedings of the Institution of Civil Engineers-Transport, Thomas Telford Ltd, 2005, pp. 89-95. [21] Y. Qian, H. Boler, M. Moaveni, E. Tutumluer, Y. Hashash, J. Ghaboussi, Characterizing ballast degradation through Los Angeles abrasion test and image analysis, Transportation Research Record: Journal of the Transportation Research Board (2448) (2014) 142-151. [22] J. Fernlund, 3-D image analysis size and shape method applied to the evaluation of the Los Angeles test, Engineering geology 77(1) (2005) 57-67. [23] Y. Qian, H. Boler, M. Moaveni, E. Tutumluer, Y.M. Hashash, J. Ghaboussi, Degradation-Related Changes in Ballast Gradation and Aggregate Particle Morphology, Journal of Geotechnical and Geoenvironmental Engineering 143(8) (2017) 04017032. [24] J.K. Anochie-Boateng, J.J. Komba, G.M. Mvelase, Three-dimensional laser scanning technique to quantify aggregate and ballast shape properties, Construction and building materials 43 (2013) 389-398. [25] L. Le Pen, W. Powrie, A. Zervos, S. Ahmed, S. Aingaran, Dependence of shape on particle size for a crushed rock railway ballast, Granular Matter 15(6) (2013) 849-861. [26] C. Rao, E. Tutumluer, I.T. Kim, Quantification of coarse aggregate angularity based on image analysis, Transportation Research Record: Journal of the Transportation Research Board (1787) (2002) 117-124. [27] L. Wang, X. Wang, L. Mohammad, C. Abadie, Unified method to quantify aggregate shape angularity and texture using Fourier analysis, Journal of Materials in Civil Engineering 17(5) (2005) 498-504. [28] F. Okonta, Relationships between abrasion index and shape properties of progressively abraded dolerite railway ballasts, Rock mechanics and rock engineering 47(4) (2014) 1335-1344. [29] F. Okonta, Effect of grading category on the roundness of degraded and abraded railway quartzites, Engineering Geology 193 (2015) 231-242. [30] C. Mora, A. Kwan, Sphericity, shape factor, and convexity measurement of coarse aggregate for concrete using digital image processing, Cement and concrete research 30(3) (2000) 351-358. [31] C. Rao, T. Pan, E. Tutumluer, Determination of coarse aggregate surface texture using image analysis, 16th ASCE Engineering Mechanics Conference, University of Washington, Seattle, 2003. [32] G.P. Raymond, V.A. Diyaljee, Railroad ballast load ranking classification, Journal of Geotechnical and Geoenvironmental Engineering 105(10) (1979). [33] J. Anochie-Boateng, J. Komba, G. Mvelase, Advanced and automated laser-based technique to evaluate aggregates, (2011). [34] T. Zingg, Beitrag zur schotteranalyse, 1935. [35] P. Barrett, The shape of rock particles, a critical review, Sedimentology 27(3) (1980) 291-303. [36] T.P.M.o. Railways, Railway Ballast, TB/T2140-2008, China Railway Publishing House, Beijing, 2008. [37] J. Fernlund, Image analysis method for determining 3-D shape of coarse aggregate, Cement and Concrete Research 35(8) (2005) 1629-1637.

17
[38] Y. Sun, B. Indraratna, S. Nimbalkar Dr, Three-dimensional characterisation of particle size and shape for ballast, (2014). [39] S.B. Sholts, S.K. Wärmländer, L.M. Flores, K.W. Miller, P.L. Walker, Variation in the measurement of cranial volume and surface area using 3D laser scanning technology, Journal of forensic sciences 55(4) (2010) 871-876. [40] R. Noålsund, E. Tutumluer, I. Horvli, Degradation of Railway Ballast Through Large Scale Triaxial and Full Scale Rail Track Model Tests: Comparison with Mechanical Laboratory Tests, Proc., 10th International Conference on Bearing Capacity of Roads, Railways and Airfields, pp. 25-27. [41] B. Indraratna, J. Lackenby, D. Christie, Effect of confining pressure on the degradation of ballast under cyclic loading, (2005). [42] I. Ugur, S. Demirdag, H. Yavuz, Effect of rock properties on the Los Angeles abrasion and impact test characteristics of the aggregates, Materials characterization 61(1) (2010) 90-96. [43] S. Kahraman, M. Fener, Predicting the Los Angeles abrasion loss of rock aggregates from the uniaxial compressive strength, Materials Letters 61(26) (2007) 4861-4865. [44] P. Tolppanen, 3-D Characterization and Degradation Analysis of Rock Aggregates, Institutionen för anläggning och miljö, 2001. [45] H. Boler, Y. Qian, E. Tutumluer, Influence of Size and Shape Properties of Railroad Ballast on Aggregate Packing, Transportation Research Record: Journal of the Transportation Research Board 2448 (2014) 94-104. [46] I. Einav, Breakage mechanics—Part I: Theory, Journal of the Mechanics and Physics of Solids 55(6) (2007) 1274-1297. [47] B.O. Hardin, Crushing of soil particles, Journal of Geotechnical Engineering 111(10) (1985) 1177-1192. [48] H. Wadell, Volume, shape, and roundness of quartz particles, The Journal of Geology 43(3) (1935) 250-280. [49] Y. Sun, B. Indraratna, S. Nimbalkar, Three-dimensional characterisation of particle size and shape for ballast, Géotechnique Letters 4(3) (2014) 197-202.

Appendix
Table A.1 Shape, condition after test, AAD, MAD, SLAM and SLAV of the scanned particles
Particle size: 25~35 mm
Marked
number Shape
Condition
after test
Initial
weight
(g)
Initial
volume
(mm3)
Initial
surface
area
(mm2)
Initial 3D
True
Sphericity
Weight
after test
(g)
Volume
after test
(mm3)
surface
area after
test
(mm2)
3D True
Sphericity
after test
SLAM
(%) SLAV (%)
AAD
(mm)
MAD
(mm)
2 elongated broken 38 13260.21 3922.41 0.691 - - - - - - - -
4 elongated unbroken 70 24661.63 5525.73 0.741 65 22944.42 4934.10 0.791 7.14 6.96 0.52 4.88
13 elongated broken 77 26882.24 6038.07 0.719 - -
- - - -
49 cubic unbroken 44 15938.72 3961.24 0.773 39 14102.81 3517.96 0.802 11.36 11.52 0.77 6.10
50 elongated unbroken 63 22067.62 5230.34 0.727 57 20175.21 4596.38 0.780 9.52 8.58 0.68 4.43
52 elongated unbroken 83 29006.67 6045.01 0.755 77 26907.42 5360.34 0.810 7.23 7.24 0.67 4.88
54 elongated unbroken 64 22639.56 5429.95 0.713 57 20220.98 4572.14 0.785 10.94 10.68 0.92 5.93
56 flaky broken 52 29006.67 6045.01 0.755 - - - - - - - -
65 elongated broken 81 28163.33 6658.16 0.672 - - - - - - - -
67 flaky broken 26 8881.64 3063.06 0.677 - - - - - - - -
69 flaky unbroken 34 12113.18 3531.29 0.722 30 10271.73 2825.09 0.809 11.76 15.20 1.42 7.80
84 cubic unbroken 47 16691.34 4026.51 0.784 43 15115.91 3491.40 0.847 8.51 9.44 0.74 4.97
95 flaky unbroken 35 12523.22 3554.92 0.734 30 10380.76 2826.39 0.814 14.29 17.11 1.43 12.61
96 flaky unbroken 41 14063.60 3796.77 0.742 35 12563.19 3281.91 0.796 14.63 10.67 0.84 5.19
100 cubic unbroken 36 12701.29 3556.74 0.740 34 11768.93 3115.48 0.803 5.56 7.34 0.60 4.62

101 cubic unbroken 43 15457.93 3795.02 0.791 40 14654.11 3471.33 0.834 6.98 5.20 0.36 4.53
Particle size: 40~50 mm
Marked
number Shape
Condition
after test
Initial
weight
(g)
Initial
volume
(mm3)
Initial
surface
area
(mm2)
Initial 3D
True
Sphericity
Weight
after test
(g)
Volume
after test
(mm3)
surface
area after
test
(mm2)
3D True
Sphericity
after test
SLAM
(%) SLAV (%)
AAD
(mm)
MAD
(mm)
2 elongated unbroken 172 60142.38 10397.04 0.714 150 52367.88 8670.56 0.781 12.79 12.93 1.41 8.60
3 cubic unbroken 75 26470.34 5313.76 0.808 71 24917.33 4863.00 0.848 5.33 5.87 0.46 5.23
5 flaky broken 57 20032.02 5009.33 0.712 - - - - - - - -
6 flaky unbroken 62 21638.11 5436.82 0.691 47 16767.06 4076.96 0.777 24.19 22.51 2.16 12.75
7 elongated broken 108 37872.39 8129.07 0.671 - - - - - - - -
8 flaky unbroken 70 24583.02 5999.08 0.682 55 19727.41 4511.04 0.783 21.43 19.75 1.70 11.39
10 cubic unbroken 108 37768.54 7074.91 0.769 97 33816.26 5985.98 0.845 10.19 10.46 0.94 6.91
13 flaky broken 36 12739.04 4550.35 0.580 - - - - - - - -
14 elongated unbroken 107 37839.32 8321.05 0.655 89 31316.50 6355.09 0.756 16.82 17.24 1.88 13.14
15 flaky broken 55 19623.54 5133.40 0.685 - - - - - - - -
26 cubic unbroken 80 27990.60 5649.72 0.789 73 25633.70 4962.24 0.847 8.75 8.42 0.76 6.00
47 flaky broken 45 15716.10 5393.46 0.563 - - - - - - - -
48 cubic broken 90 31865.52 7305.84 0.665 - - - - - - - -
50 flaky broken 77 27074.40 7335.95 0.594 - - - - - - - -
51 flaky broken 79 27910.41 7701.22 0.578 - - - - - - - -
53 elongated unbroken 98 35236.68 7221.27 0.720 87 30767.91 5853.42 0.811 11.22 12.68 1.25 14.79
Particle size: 50~60 mm
Marked
number Shape
Condition
after test
Initial
weight
(g)
Initial
volume
(mm3)
Initial
surface
area
(mm2)
Initial 3D
True
Sphericity
Weight
after test
(g)
Volume
after test
(mm3)
surface
area after
test
(mm2)
3D True
Sphericity
after test
SLAM
(%) SLAV (%)
AAD
(mm)
MAD
(mm)

3 elongated unbroken 200 69971.16 11285.79 0.728 179 62764.29 9496.89 0.804 10.50 10.30 1.25 10.77
5 elongated broken 192 67405.30 11864.53 0.675 - - - - - - - -
7 cubic unbroken 143 49907.64 9073.55 0.722 133 46506.57 8040.24 0.778 6.99 6.81 0.59 6.64
8 flaky broken 166 58522.91 10654.38 0.684 - - - - - - - -
10 cubic broken 195 67959.02 10711.46 0.752 - - - - - - - -
11 flaky broken 88 30733.13 7572.80 0.627 - - - - - - - -
13 elongated unbroken 166 58711.16 9951.62 0.734 154 54154.11 8692.18 0.796 7.23 7.76 0.73 6.53
25 elongated broken 214 75179.01 12866.36 0.670 - - - - - - - -
29 flaky broken 96 33616.68 9015.33 0.559 - - - - - - - -
30 flaky broken 97 33827.11 7764.89 0.651 - -
- - - -
33 cubic unbroken 166 58431.71 9202.25 0.791 155 54039.37 8050.58 0.859 6.63 7.52 0.79 4.74
34 cubic broken 163 57554.06 8635.02 0.835 - - - - - - - -
35 flaky broken 69 24448.11 6311.03 0.645 - - - - - - - -

Table A.2 LAA loss of three groups: the flaky or elongated, cubic and scanned LAA loss
Design
variance
50~60 mm 40~50 mm 25~35 mm
Initial
weight (kg)
Weight
after test (kg)
LAA
loss (%)
Initial
weight (kg)
Weight
after test (kg)
LAA
loss (%)
Initial
weight (kg)
Weight
after test (kg)
LAA
loss (%)
Scanned 1.955 1.671 14.53 1.319 1.074 18.57 0.834 0.731 12.35
Flaky or elongated
2.066 1.754 15.10 3.102 2.504 19.28 2.467 2.068 16.17
Cubic 0.988 0.947 4.15 0.559 0.529 5.37 1.705 1.506 11.67
Tiny
fragment - 0.024 - - 0.107 - - 0.139 -
total 5.009 4.396 12.24 4.98 4.214 15.38 5.006 4.444 11.23