Embed Size (px)
Citation preview
Michigan Department of
Transportation
Integrated Mobile Observations 3.0
Connected Vehicles for Road Weather
Management
PROJECT SUMMARY REPORT
Final
March 8, 2018
Version 02.50
Prepared By:
Mixon/Hill, Inc.
12980 Metcalf Avenue, Suite 470
Overland Park, Kansas 66213
(913) 239-8400
Technical Report Documentation Page
1. Report No.
SPR-1654
2. Government Accession No.
N/A
3. MDOT Project Manager
Steven J. Cook, P.E.
Collin Castle, P. E.
4. Title and Subtitle
Integrated Mobile Observations 3.0 (IMO)
Connected Vehicles for Road Weather Management
5. Report Date
March 8, 2018
6. Performing Organization Code
N/A
7. Author(s)
Lee T. Mixon, Jeffrey Brown 8. Performing Organization Report No.
N/A
9. Performing Organization Name and Address
Mixon Hill
12980 Metcalf Avenue, Suite 470
Overland Park, KS 66213
10. Work Unit No.
N/A
11. Contract or Grant No.
2011-0316
12. Sponsoring Agency Name and Address
Michigan Department of Transportation (MDOT)
Research Administration
8885 Ricks Road
P.O. Box 33049
Lansing, Michigan 48909
13. Type of Report and Period Covered
Final Report, 8/25/2014 to
11/30/2016
14. Sponsoring Agency Code
Federal Highway Administration
(FHWA)
15. Supplementary Notes
Conducted in cooperation with the U.S. Department of Transportation, Federal Highway
Administration. MDOT research reports are available at www.michigan.gov/mdotresearch.
16. Abstract
The purpose of the Integrated Mobile Observation 3.0 (IMO) project is to support the Michigan
Department of Transportation (MDOT) and its partners in evaluating uses and benefits of connected
vehicle and environmental data in transportation agency management and operations. The project
complements efforts throughout the transportation community in designing and deploying connected
vehicle infrastructure, vehicle equipment, and initial applications and investigates how data from
connected vehicles may benefit the ways MDOT and other transportation agencies perform business.
The MDOT Data Use Analysis and Processing (DUAP) research has been constrained by the relative
unavailability of connected vehicle data, but has successfully demonstrated: the capability to collect,
aggregate, process and provide data from connected vehicles; the pragmatic acquisition of diverse data
from a variety of sources; and the development of applications that may enhance weather responses,
traffic monitoring, and condition assessment. The project concludes that there is substantial potential
for the use of connected vehicle data in transportation management and operations. It is recommended
that the next phase of research focus on development of reliable data sources and specific applications
for implementation in MDOT.
17. Key Words
IMO, BSM, RSU, OBU, AVL, GPS, XML,
RWIS, ASOS/AWOS, NWS, Connected
Vehicle, VIDAS, Data Probe, weather,
DUAP, NCAR, WxDE, smartphone,
WxTINFO
18. Distribution Statement
No restrictions. This document is also available to the
public through the Michigan Department of
Transportation.
19. Security Classif. (of this report)
Unclassified
20. Security Classif. (of this page)
Unclassified
21. No. of Pages
37
22. Price
N/A
Michigan Department of Transportation Integrated Mobile Observations 3 (IMO)
Project Summary Report
IMO3_Final_Project_Summ_Rpt_Final.doc Page ii
.
Acknowledgements
Disclaimer
This publication is disseminated in the interest of information exchange. The Michigan
Department of Transportation (hereinafter referred to as MDOT) expressly disclaims any
liability, of any kind, or for any reason, that might otherwise arise out of any use of this
publication or the information or data provided in the publication. MDOT further
disclaims any responsibility for typographical errors or accuracy of the information
provided or contained within this information. MDOT makes no warranties or
representations whatsoever regarding the quality, content, completeness, suitability,
adequacy, sequence, accuracy or timeliness of the information and data provided, or that
the contents represent standards, specifications, or regulations.
Michigan Department of Transportation Integrated Mobile Observations 3 (IMO)
Project Summary Report
IMO3_Final_Project_Summ_Rpt_Final.doc Page 1
.
Table of Contents
EXECUTIVE SUMMARY .............................................................................................. 3
1 INTRODUCTION..................................................................................................... 5
1.1 Background ......................................................................................................................................... 5 1.1.1 Objective ..................................................................................................................................... 5 1.1.2 Scope ........................................................................................................................................... 5
1.2 Statement of Hypothesis ..................................................................................................................... 7
2 METHODOLOGY ................................................................................................... 8
2.1 Experimental Design ........................................................................................................................... 8
2.2 Project System Architecture .............................................................................................................. 8
2.3 Procedures ..........................................................................................................................................10 2.3.1 User Interface .............................................................................................................................10 2.3.2 Security.......................................................................................................................................12 2.3.3 Data Sources ...............................................................................................................................12
2.3.3.1 VIDAS Platform ...............................................................................................................12 2.3.3.2 Connected Vehicles ..........................................................................................................14 2.3.3.3 Weather Observations .......................................................................................................16 2.3.3.4 AVL ..................................................................................................................................17 2.3.3.5 Traffic Signal Phase and Timing ......................................................................................17
2.3.4 Data Feed to External Systems ...................................................................................................17
3 FINDINGS ............................................................................................................... 17
3.1 Summary of Projects and Applications ............................................................................................17 3.1.1 Projects .......................................................................................................................................18
3.1.1.1 Connected Vehicles ..........................................................................................................18 3.1.1.2 Saginaw Highway Corridor ..............................................................................................18 3.1.1.3 WxTINFO .........................................................................................................................19
3.1.2 Applications ...............................................................................................................................19 3.1.2.1 Traffic Condition Monitoring ...........................................................................................19 3.1.2.2 Weather Alert System .......................................................................................................20
3.2 Method of Analysis ............................................................................................................................20 3.2.1 Applications ...............................................................................................................................21
3.2.1.1 Connected Vehicles ..........................................................................................................21 3.2.1.2 Traffic Condition Monitoring ...........................................................................................21 3.2.1.3 Weather Alert System .......................................................................................................22
3.3 Presentation of Results ......................................................................................................................23 3.3.1 Applications ...............................................................................................................................23
3.3.1.1 Connected Vehicles ..........................................................................................................24 3.3.1.2 Traffic Condition Monitoring ...........................................................................................24 3.3.1.3 Weather Alert System .......................................................................................................25
Michigan Department of Transportation Integrated Mobile Observations 3 (IMO)
Project Summary Report
IMO3_Final_Project_Summ_Rpt_Final.doc Page 2
.
4 DISCUSSION .......................................................................................................... 26
4.1 Validity of Hypothesis ........................................................................................................................26
4.2 Factors Affecting the Results ............................................................................................................26
4.3 Implications ........................................................................................................................................27
5 CONCLUSIONS ..................................................................................................... 27
5.1 Conclusions from the Study ..............................................................................................................27 5.1.1 Benefits.......................................................................................................................................28 5.1.2 System Capabilities ....................................................................................................................28 5.1.3 Data Collection and Standards ...................................................................................................28 5.1.4 Applications ...............................................................................................................................29
6 LESSONS LEARNED ............................................................................................ 30
6.1 Overall Project Lessons .....................................................................................................................30
6.2 Preinstall Process ...............................................................................................................................30
6.3 Install Process .....................................................................................................................................31
6.4 Post Installation ..................................................................................................................................32
6.5 Field Devices .......................................................................................................................................32
6.6 Mobile Devices ....................................................................................................................................32
7 RECOMMENDATIONS ........................................................................................ 33
7.1 Recommendations for Further Research .........................................................................................33
7.2 Recommendations for Implementation ............................................................................................33
APPENDIX A - ACRONYMS AND ABBREVIATIONS ........................................ 35
APPENDIX B - REFERENCES ................................................................................. 37
List of Figures
FIGURE 1 – IMO 3.0 AND DUAP DATA FLOWS ..................................................................................... 6 FIGURE 2 – SAGINAW HIGHWAY CORRIDOR IN LANSING, MI ....................................................... 6 FIGURE 3 – DUAP PROCESS INTERACTIONS ........................................................................................ 9 FIGURE 4 – VIDAS MOBILE PLATFORM ...............................................................................................13 FIGURE 5 – CENTRAL INTERSECTION EQUIPMENT ..........................................................................15 FIGURE 6 – STANDARD INTERSECTION EQUIPMENT .......................................................................15 FIGURE 7 - MAP INTERFACE DISPLAY OF MOBILE DATA ...............................................................25
Michigan Department of Transportation Integrated Mobile Observations 3 (IMO)
Project Summary Report
IMO3_Final_Project_Summ_Rpt_Final.doc Page 3
.
Revision History
Revision Issue Date Status Authority Comments
01.00 2016.11.30 Draft LTM No comment.
01.10 2017.11.10 Draft LTM Updated based on feedback from
MDOT.
01.50 2018.01.22 Draft LTM Updated based on additional MDOT
comments
02.00 2018.03.07 Draft LTM Updated based on additional MDOT
comments
02.50 2018.04.20 Draft LTM Updated based on additional
comments from MDOT and FHWA
Final 2018.05.04 Final LTM Final
Electronic File
Saved As: IMO3_Final_Project_Summ_Rpt_Final
EXECUTIVE SUMMARY The purpose of the Integrated Mobile Observation 3.0 (IMO 3.0), Connected Vehicles for Road
Weather Management, project was to support the Michigan Department of Transportation
(MDOT) and its partners in evaluating benefits of enhancing their current data sources with
connected vehicle data for transportation agency functional area uses. The IMO 3.0 project
focused on collecting weather-related observations from connected vehicles and mobile data
acquisition platforms such as Vehicle-based Information and Data Acquisition System (VIDAS).
The project investigated the use and viability of the data collected in conjunction with other
agency’s systems such as the National Center for Atmospheric Research (NCAR) PikalertTM
Vehicle Data Translator, Federal Highway Administration (FHWA) Weather Data Environment
(WxDE), and MDOT’s Wx-TINFO. As such, the project complements parallel efforts of MDOT,
the U.S. Department of Transportation (USDOT), the Vehicle Infrastructure Integration
Consortium (VIIC), and others to design and deploy the connected vehicle infrastructure, vehicle
equipment, and initial applications. This project builds on that foundational work to investigate
how the availability of data from connected vehicles throughout the road network may impact the
ways MDOT, the USDOT, and other transportation agencies perform business.
The IMO 3.0 project has shown how the increase in availability of connected vehicle data, along
with the expansion of existing transportation and infrastructure data, continually improves the
information available to the agency. It expanded the MDOT Data Use Analysis and Processing
(DUAP) project to further examine how the weather-related data within the DUAP system can be
integrated with the collection of additional mobile weather observations to be used in
supplementing the agency’s information when formulating and guiding road weather
management responses.
The mobile nature of this data increases the coverage of weather observations from fixed stations
by allowing the agency to collect data where gaps in the data exists and in locations most affected
by the weather. The available data is based on the sensors installed on the vehicles. For this
Michigan Department of Transportation Integrated Mobile Observations 3 (IMO)
Project Summary Report
IMO3_Final_Project_Summ_Rpt_Final.doc Page 4
.
project, the mobile weather observations include ambient temperature, surface temperature,
humidity, barometric pressure, and dew point along with other vehicle data such as position,
speed, and acceleration.
MDOT’s VIDAS system is a mobile vehicle platform installed on many agency fleet vehicles that
collects data from the vehicle and sensors on the vehicle. Incorporating the VIDAS system
provides the ability to collect weather observations from a variety of sensors and provides
additional flexibility that was not available using the smartphones for the IMO 2.0 project. For
this project, vehicles were equipped with the VIDAS platform, Surface Patrol sensors, and
accelerometers to provide information concerning the pavement surface along with atmospheric
conditions.
The VIDAS platform includes the ability to transmit this environmental data directly to the back
office via cellular. This ability provides DUAP with current information which is used to
determine the impact of weather on the traveling public. This information can then be relayed to
the agency and the public to assist in guiding weather maintenance plans, travel suggestions,
emergency responses, etc.
In addition, the vehicles were equipped with On-Board Units (OBU), which were integrated with
VIDAS to provide the Vehicle to Vehicle (V2V) and Vehicle to Infrastructure (V2I) capabilities.
This data provides details such as current traffic flow and changes to the flow caused by events
such as incidents, weather impacts, or traffic signals, to name a few. This data can also be
received by the back office as additional information used by the DUAP system.
The DUAP system was responsible for forwarding the weather data received from the connected
vehicles and the VIDAS platform to both NCAR and WxDE (Weather Data Environment)
external systems in support of these related weather initiatives with the FHWA.
The project has successfully worked through a disciplined system engineering process to develop
and demonstrate applications leveraging existing connected vehicle system capabilities. These
applications used the mobile weather observations from the OBU and the VIDAS platform
installed on the MDOT vehicles to assist in determining the types of weather affecting the state
and reporting this information to the operations functional area.
The architecture design for the connected vehicle (CV) deployment had to consider the existing
infrastructure and its limitations. The solution implemented was able to deal with a lack of
communications backbone to the intersections which were equipped. The data from the RSUs had
to be transmitted to one of the central intersection’s signal controllers which then transmitted the
data from all of the RSUs to the back office. While this deployment was relatively small in size,
this solution would not be able to manage a deployment with a large number of equipped vehicles
and intersections. The line of sight restriction on the radios limits the locations this solution can
be deployed. Large scale deployments add complexity in working around this restriction,
depending on the geographical topology, existing infrastructure, and building density. The
processing ability and allowable data flow through the central radio also restricts the number of
intersections and vehicle data which can be processed and forwarded to the back office per
central radio.
Michigan Department of Transportation Integrated Mobile Observations 3 (IMO)
Project Summary Report
IMO3_Final_Project_Summ_Rpt_Final.doc Page 5
.
1 INTRODUCTION This document summarizes the results, accomplishments, and lessons learned from the MDOT’s
IMO 3.0 project. It also includes recommendations for further research and development and
provides an interface specification for potential data providers.
As a progressive expansion of the integrated mobile observations collected by smartphones in the
IMO 2.0 projects, IMO 3.0 introduced CV technologies in both vehicles and infrastructure along
with a robust mobile platform to provide flexibility in the type of data being collected.
1.1 Background
1.1.1 Objective
The IMO project aimed to capture mobile weather observations from sensors connected to the
VIDAS platform to supplement observations from existing fixed sensors and data sources to
enhance winter maintenance reactions to events affecting the traveling public and to provide more
detailed information to the public to assist in dealing with the weather threats and hazards. It is
thought that these enhancements can improve safety, improve the effectiveness of the DOT’s
winter maintenance activities, and increase mobility.
Leveraging the DUAP system, for the IMO 3.0 project, takes advantage of an existing system
which uses weather data to formulate event warnings to the agency and the public based on a
variety of data sources. Increasing the amount of mobile data ingested by the system increases the
coverage and detail of weather events occurring throughout the state. The DUAP system can also
disseminate the data to other external systems in support of additional FHWA weather research
activities.
1.1.2 Scope
The purpose of the IMO 3.0 project was to support USDOT, MDOT, and its partners in
evaluating uses and benefits of CV data in transportation agency management and operations. As
such, the project complements parallel efforts of MDOT, the USDOT, the VIIC, and others to
design and deploy the CV infrastructure, vehicle equipment, and initial applications. The project
builds on that foundational work to investigate how the availability of data from CVs throughout
the road network may impact the ways transportation agencies manage the transportation
infrastructure. The project focused specifically on the uses and benefits of weather-related data in
responding to safety concerns, managing traffic, and managing MDOT’s transportation assets.
The work also supported other CV projects, technology development for MDOT, and economic
growth for the state.
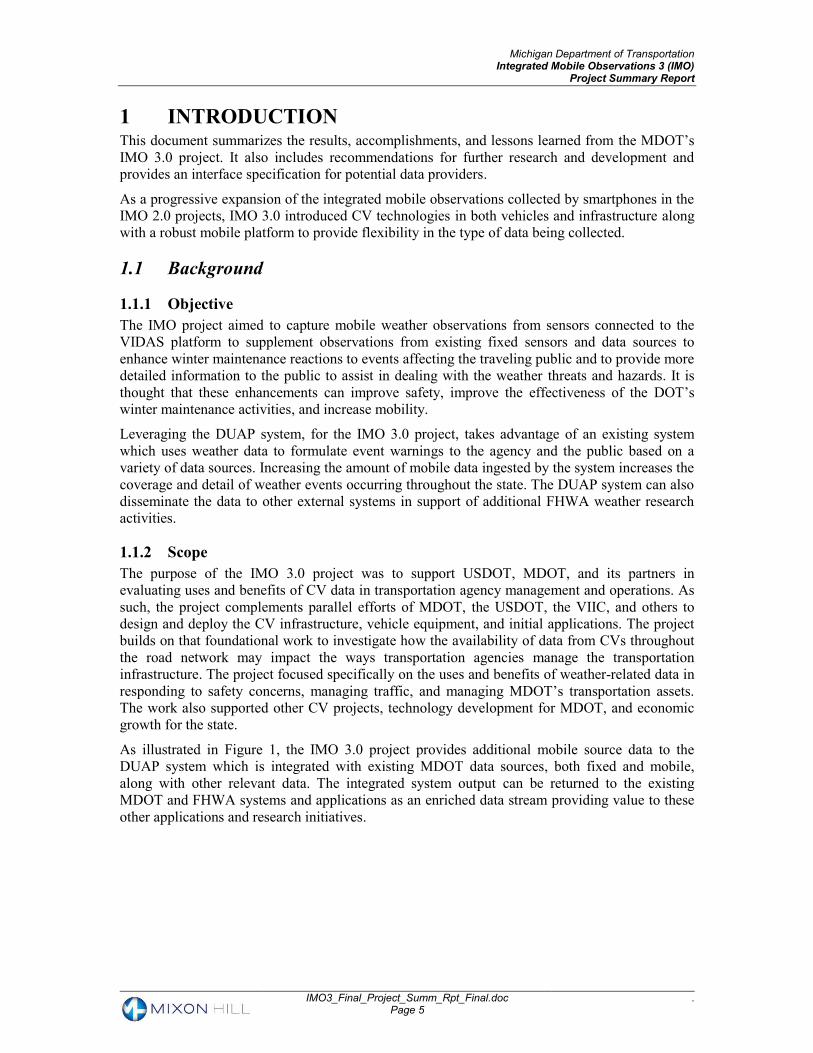
As illustrated in Figure 1, the IMO 3.0 project provides additional mobile source data to the
DUAP system which is integrated with existing MDOT data sources, both fixed and mobile,
along with other relevant data. The integrated system output can be returned to the existing
MDOT and FHWA systems and applications as an enriched data stream providing value to these
other applications and research initiatives.
Michigan Department of Transportation Integrated Mobile Observations 3 (IMO)
Project Summary Report
IMO3_Final_Project_Summ_Rpt_Final.doc Page 6
.
Figure 1 – IMO 3.0 and DUAP Data Flows
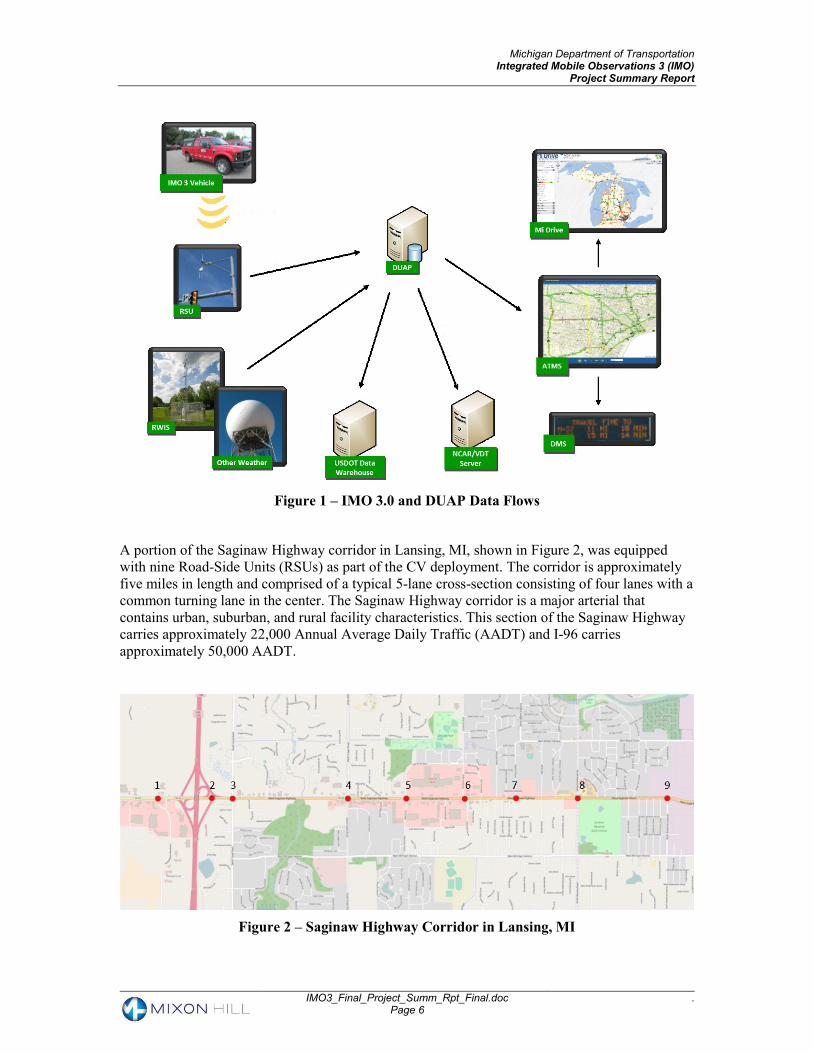
A portion of the Saginaw Highway corridor in Lansing, MI, shown in Figure 2, was equipped
with nine Road-Side Units (RSUs) as part of the CV deployment. The corridor is approximately
five miles in length and comprised of a typical 5-lane cross-section consisting of four lanes with a
common turning lane in the center. The Saginaw Highway corridor is a major arterial that
contains urban, suburban, and rural facility characteristics. This section of the Saginaw Highway
carries approximately 22,000 Annual Average Daily Traffic (AADT) and I-96 carries
approximately 50,000 AADT.
Figure 2 – Saginaw Highway Corridor in Lansing, MI
Michigan Department of Transportation Integrated Mobile Observations 3 (IMO)
Project Summary Report
IMO3_Final_Project_Summ_Rpt_Final.doc Page 7
.
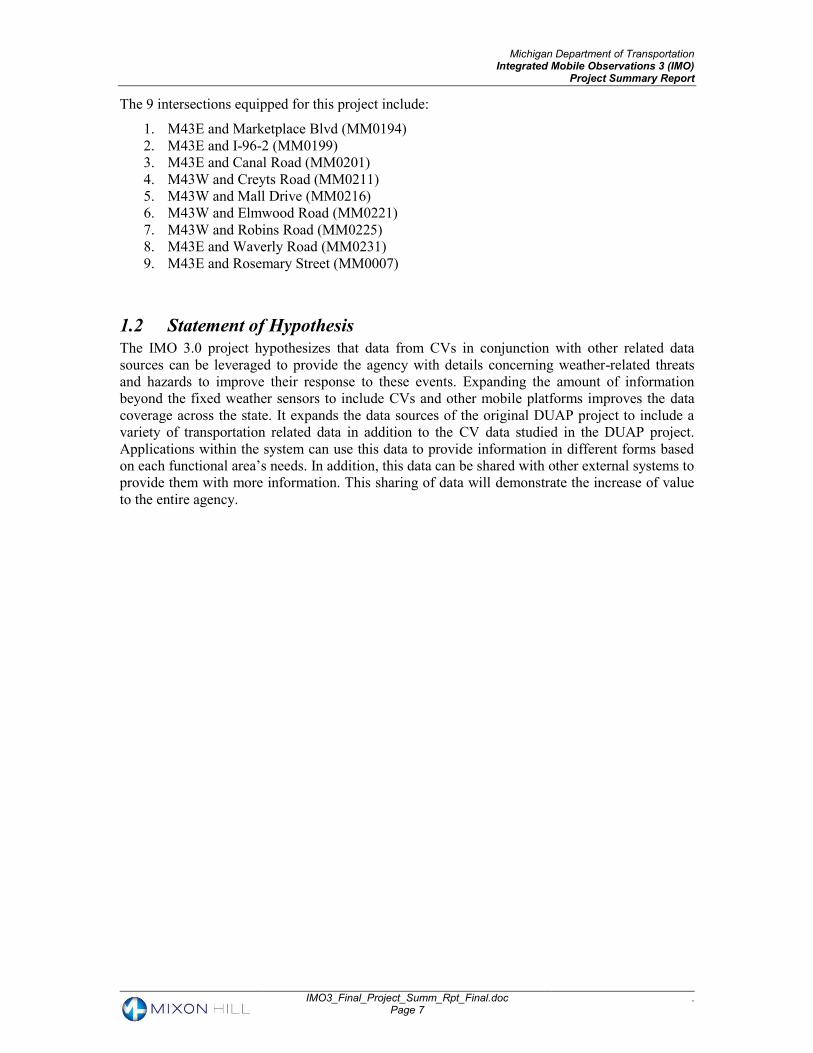
The 9 intersections equipped for this project include:
1. M43E and Marketplace Blvd (MM0194)
2. M43E and I-96-2 (MM0199)
3. M43E and Canal Road (MM0201)
4. M43W and Creyts Road (MM0211)
5. M43W and Mall Drive (MM0216)
6. M43W and Elmwood Road (MM0221)
7. M43W and Robins Road (MM0225)
8. M43E and Waverly Road (MM0231)
9. M43E and Rosemary Street (MM0007)
1.2 Statement of Hypothesis
The IMO 3.0 project hypothesizes that data from CVs in conjunction with other related data
sources can be leveraged to provide the agency with details concerning weather-related threats
and hazards to improve their response to these events. Expanding the amount of information
beyond the fixed weather sensors to include CVs and other mobile platforms improves the data
coverage across the state. It expands the data sources of the original DUAP project to include a
variety of transportation related data in addition to the CV data studied in the DUAP project.
Applications within the system can use this data to provide information in different forms based
on each functional area’s needs. In addition, this data can be shared with other external systems to
provide them with more information. This sharing of data will demonstrate the increase of value
to the entire agency.
Michigan Department of Transportation Integrated Mobile Observations 3 (IMO)
Project Summary Report
IMO3_Final_Project_Summ_Rpt_Final.doc Page 8
.
2 METHODOLOGY
2.1 Experimental Design
The experimental design for the IMO 3.0 project followed the system engineering design process.
System development projects should follow a disciplined systems engineering process from
planning through operations. Indeed, the use of a standard systems engineering process is a
requirement of Title 23 of Code of Federal Regulations (CFR) Section 940.11, which defines
eligibility for Federal Intelligent Transportation System (ITS) funding.
The process used for the IMO 3.0 project started with determining the scope and objectives of the
system through stakeholder meetings.
The IMO 3.0 project’s use of the existing DUAP system and its expansion of data ingested by
DUAP did not require a modification of the overall concept of the DUAP system. Therefore, a
concept of operations was not required for this project. Additional user needs and requirements
were, however, addressed in an abridged System Requirements Specification (SRS). The SRS
contains details of the changes to the existing DUAP system describing system functions for each
of the system’s major components; design constraints presented by policy and standards; quality
characteristics; and any external factors that may impact the system design based on changes for
the IMO 3.0 project.
The abbreviated System Architecture Description (SAD) identifies the changes to the system’s
components and describes its internal and external interfaces based on the changes identified in
the IMO 3.0 project.
The abbreviated System Design Description (SDD) documents the intended system changes to
address the requirements as specified in the SRS based on the IMO 3.0 project. The
documentation describes each component and its interfaces in detail. Both the SAD and SSD
documents will be published at a future date by MDOT.
2.2 Project System Architecture
The IMO 3.0 project was based on the presumption of data being available from the efforts of CV
projects along with other mobile platforms, such as Automatic Vehicle Location (AVL) and
VIDAS. The IMO 3.0 project includes equipping additional vehicles with the VIDAS platform
and on-board units (OBU) to provide V2V and V2I communication capability.
Intersections in Lansing Michigan along the Saginaw Highway (State of Michigan Trunkline; M-
43) corridor, as shown in Figure 2, were equipped with RSUs to provide the infrastructure for the
CV deployment. The corridor installations included Cohda RSUs at nine intersections chosen by
MDOT. The RSUs were connected to the existing MOD 50 Siemens controllers.
The Siemens Model 50 controllers have Siemens ACS Lite software installed for their operation.
These controllers supply the signal phase and timing information to the RSU. The RSU is then
able to encode and broadcast the Society of Automotive Engineers (SAE) J2735 Signal Phase and
Timing (SPaT) message along with the associated SAE J2735 Map message configured on the
device.
Existing and new VIDAS installations were used for integrating OBUs into nine MDOT vehicles
to provide Basic Safety Messages (BSM) to be captured by the RSUs along the corridor. The
BSMs contain information concerning the vehicle’s current status including location, speed, and
heading. These BSMs were to be forwarded to the DUAP system to be integrated with the other
information received; however, this functionality is still pending deployment.
Michigan Department of Transportation Integrated Mobile Observations 3 (IMO)
Project Summary Report
IMO3_Final_Project_Summ_Rpt_Final.doc Page 9
.
In addition to the BSM data, the VIDAS platform included weather sensors to capture weather-
related data not provided by the BSMs to supplement the data available to the weather processes
and algorithms within the DUAP system. The weather and vehicle data are used for formulating
information concerning the current weather and road-weather conditions.
The DUAP system includes functionality for sending its data to other systems. For the IMO 3.0
project, this functionality was used for forwarding the weather information from the VIDAS
installations to NCAR and the WxDE systems to support their programs.
Data from the MDOT AVL equipped winter maintenance trucks (WMT) or snow plow trucks
were also ingested by the DUAP system. This provided additional observations leveraging
existing equipped vehicles’ information.
The data from these mobile systems, along with information from the National Weather Service
(NWS), provided the DUAP system with data concerning the condition of and impacts on MDOT
assets, including pavement, the traveling public, and CV testbeds.
As was shown in Figure 1, the DUAP system collects data from many different sources, stores
that data, and applies algorithms to the available data—new and previous—to support existing
and new MDOT applications. The output from the DUAP system can be used to assist the agency
in managing their assets, to feed information to other systems, or as an application in a
geographic context supported directly by the user interface described in this section.
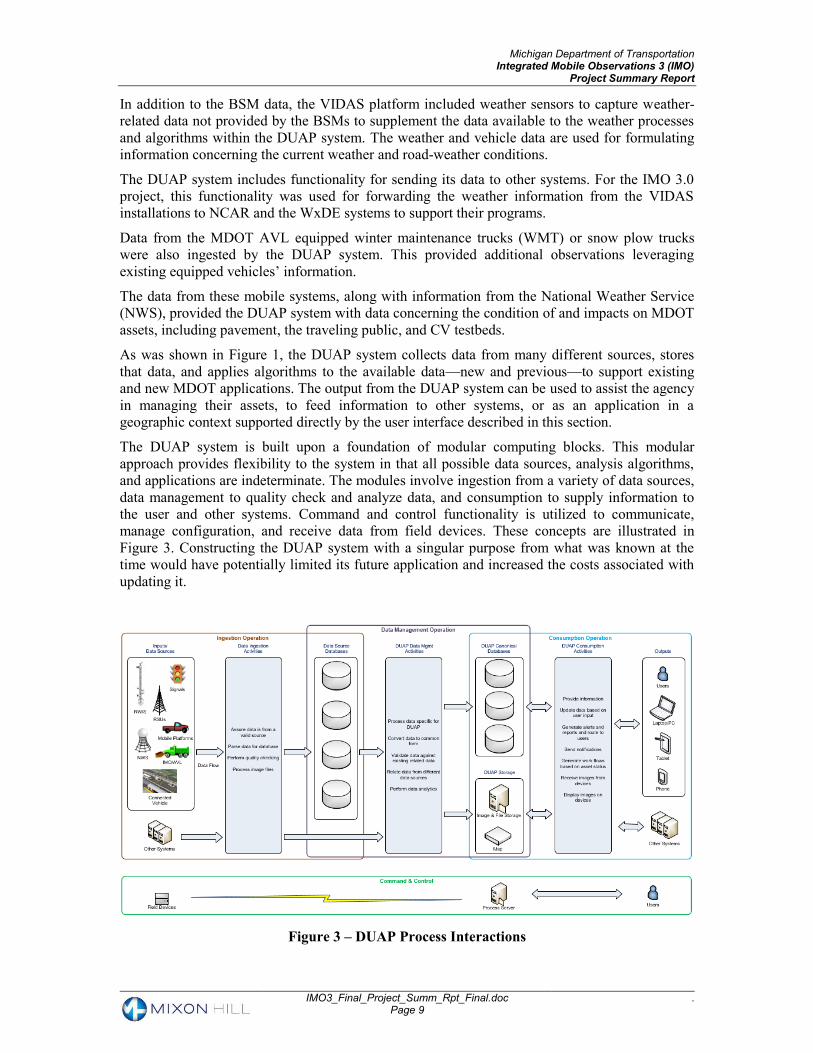
The DUAP system is built upon a foundation of modular computing blocks. This modular
approach provides flexibility to the system in that all possible data sources, analysis algorithms,
and applications are indeterminate. The modules involve ingestion from a variety of data sources,
data management to quality check and analyze data, and consumption to supply information to
the user and other systems. Command and control functionality is utilized to communicate,
manage configuration, and receive data from field devices. These concepts are illustrated in
Figure 3. Constructing the DUAP system with a singular purpose from what was known at the
time would have potentially limited its future application and increased the costs associated with
updating it.
Figure 3 – DUAP Process Interactions

Michigan Department of Transportation Integrated Mobile Observations 3 (IMO)
Project Summary Report
IMO3_Final_Project_Summ_Rpt_Final.doc Page 10
.
2.3 Procedures
This section provides an overview of the changes to the DUAP system to support the IMO 3.0
project. Details include the user interface, data sources ingested to support the applications,
security, and the storage model for the data. The descriptions of these facets of the system further
explain the procedures the system uses and how the system provides the necessary information to
support the agency.
2.3.1 User Interface
The user interface is the core application for the consumption phase of the system as shown in
Figure 3. Other aspects of this phase will be described in subsequent sections.
The web application is viewable on browser equipped computers and devices such as tablets and
smartphones. Where possible, a responsive GUI (graphical user interface) design is employed to
provide the user with a quality experience regardless of the type of device being used.
The interface provides the tools needed to visualize the CV and weather data in a geographic and
time-related context. The user selects which information to display for a particular time range. In
addition, the time zone is based on the device on which the user is viewing the application.
The applications interact with the user in the following ways.
Map – a geographic display of information
Reports – report-based views of observations ingested by the system, such as traffic
speeds
Analysis – graphical views of observations ingested from the VIDAS system, such as the
acceleration (in G) as measured by the accelerometry sensors
Data entry – allows users to enter or modify information in the system for a variety of
purposes including configuring field devices, entering traffic flow restrictions, and
modifying user information.
Feedback – a link to allow the user to email the support team with comments, issues, or
suggestion concerning the DUAP system
The primary screen displayed to the user is a map view. This provides a geographic context of the
various observations captured by the system. Map controls allow panning and zooming in and
out, and to display a plain map background. This screen provides a variety of applications which
can interact with each other.
The screen provides the ability for users to select various items to be displayed on the map based
on time, locations, and information types. Associating time with data can be complex, but users
generally work to their current local time. The code handles this by converting the local time for
the user to Coordinated Universal Time (UTC) when requesting time-based data. Different types
of information can be displayed to provide a clearer picture of what is happening on the
infrastructure.
The vehicle related applications contain selections for viewing data related to roads, vehicles and
their movements. The vehicle specific information includes data from AVL, VIDAS, and OBU
equipped vehicles. The user can select to view the paths of a specific vehicle or all of the vehicles
of the selected types during the specified time frame. There is also the option to animate the trip
and view the details of the collected data as the vehicle(s) moved along the road. Depending on
Michigan Department of Transportation Integrated Mobile Observations 3 (IMO)
Project Summary Report
IMO3_Final_Project_Summ_Rpt_Final.doc Page 11
.
the equipment installed, this detailed information can include location, speed, front facing camera
image, ambient temperature, surface temperature, humidity, dew point, plow status, treatment
materials and pavement condition along with other related data elements.
The Weather application contains selections for weather related information including
observations from state and NWS-owned fixed weather stations. NWS radar is also available
based on the radar installations and various radar types including precipitation and storm motions.
In addition, the user can view the weather alerts created by the system based on these and other
observations. Two views of the alerts are included to provide separate detailed and aggregated
views. The aggregated information is also passed to MDOT’s Advanced Traffic Management
System (ATMS).
The traffic-based information includes traffic detection, CCTV images, message signs, lane
restrictions, incidents, traffic signal phases, and CV RSU status. This information can supplement
the weather-related observations for verification of types and extent of weather impacting the
roads.
Most observations displayed on the map include an option to view additional detailed information
via popups or detail panes on the screen. This information can include
Metadata from field devices such as weather sensors, traffic sensors, dynamic message
signs, cameras, etc.
Observations collected by the field devices at a time specified by the user
Data from winter maintenance vehicles equipped with AVL, specifying whether a plow
was down and whether road treatment materials were being applied
Weather alerts which are color coded to specify the type of alert being displayed.
The user interface allows the user to turn on and off selections throughout the application. This
allows for easily changing selections to be displayed to target the information required for a
selected task.
The Vehicle tab also displays the latitude and longitude coordinates of any location clicked on the
map. This information is provided so the user can get a better sense of relative scale and distances
to known landmarks.
The Reporting application allows the user to select criteria for generating reports based on the
ingested data.
Reports can include a graphing option based on the observations such as displaying microwave
vehicle detection systems (MVDS) data for a selected location in a graphical form. Together the
two forms of presenting observations ingested by the system provide a variety of tools to assist
the agency in interpreting data from their systems and infrastructure. This process has been
designed to easily incorporate additional reports based on data ingested by the DUAP system.
The Analysis applications provide graphical views of data, such as accelerometry data ingested
from VIDAS devices. The view includes graphs for each of the accelerometer’s axes. This
graphing tool allows the user to see values at any given point along the graph and how the graphs
relate. The accelerometry data is in three axes as depicted in the graphs. A fourth graph contains
the net vector of the three axes.
The Configuration application allows authorized users to make configuration changes to field
devices such as the VIDAS platform. This provides the ability to modify aspects of the platform
and the metadata around its installation. The user can configure the mobile platform to specify
which sensors are installed and their location on the vehicle. This information allows the DUAP
system to ingest and process the data that the platform collects. Additional information detailing
this process will be further described below.
Michigan Department of Transportation Integrated Mobile Observations 3 (IMO)
Project Summary Report
IMO3_Final_Project_Summ_Rpt_Final.doc Page 12
.
2.3.2 Security
Multiple levels of security have been employed within the DUAP system to ensure the integrity
of the system and its data.
The DUAP GUI requires user authentication to access its applications and their functionality.
Each user can be assigned specific permissions to control which applications and functionality
within these applications that they have access to use. This granularity provides the ability to
assign access to only the processes required by the user to perform their work.
The ingestion processes use a variety of methods to ensure the integrity of its data including
various quality checking algorithms, verifying the source of the data, and controlling how data is
received.
Through these methods and others not mentioned, a multitude of processes keeps a vigilant watch
over the system for a variety of security risks. The goal is to follow and expand on best security
practices to help ensure security for the system, its data sources, and all entities interfacing with
the system.
2.3.3 Data Sources
For the DUAP system to be able to perform useful work, it must have data from a variety of
sources. The design of the DUAP system necessarily accommodates this variety of data sources
through its modular architecture. No single data representation mechanism exists that will
accurately convey information in every possible instance. The best approach is to create
collection software that can deal with source data in its native format and copy what it defined as
relevant to the DUAP system.
Leveraging the DUAP system and its current data sources for the IMO 3.0 project provides a
foundation for investigating the use of CV data for road weather applications. The project
expands the coverage of the system’s data sources through additional vehicle and infrastructure
deployments.
Data received by the system, specifically non-CV data, involves a variety of data formats.
Evidence suggests that the most popular data formats for information exchange are text-based—
humanly-readable letters and numbers. Both character-delimited text, JavaScript Object Notation
(JSON), and XML (extensible Markup Language) are text-based data exchange mechanisms. The
former typically defines columns by a header record, with data separated by a special character
with comma, semicolon, tab, and space being popular choices. The latter uses tags formatted to
the XML standard specification to identify data elements.
In addition to textual data, the DUAP system can ingest binary data which CV technologies use
almost exclusively for the data messages, including BSMs and SPaTs. This data follows the SAE
J2735 standard and uses the ASN.1 (Abstract Syntax Notation) format as specified by the SAE
J2735 standard. This functionality was used throughout the IMO 3.0 project to support the CV
data from the equipped vehicles and intersections along the corridor and transmitted by the OBU
and VIDAS equipped vehicles.
The data sources related to the IMO 3.0 project’s goals are ingested by the DUAP system for its
applications are further described in the following sections.
2.3.3.1 VIDAS Platform
MDOT fleet vehicles equipped with the VIDAS platform provide mobile data to the DUAP
system. The VIDAS platform, Figure 4, provides the ability to install a variety of sensors on a

Michigan Department of Transportation Integrated Mobile Observations 3 (IMO)
Project Summary Report
IMO3_Final_Project_Summ_Rpt_Final.doc Page 13
.
vehicle. The currently installed sensors collect data about the vehicle’s mobility and the
environment including the pavement surface.
The platform installed in support of the IMO 3.0 projects consisted of:
Eurotech Reliagate 10-20
Cellular and Wi-Fi connectivity
Cohda MK5 OBU
YEI 3-Space Sensor
Vaisala Surface Patrol
Antenna (GPS, Cellular, Wi-Fi)
Figure 4 – VIDAS Mobile Platform
The platform was installed on nine MDOT operated Ford F-150 trucks (seven new vehicles and
two vehicles from a previous effort). These trucks are located in the Lansing, Michigan area.
Some of these are located at the Grand Ledge garage to be near the IMO 3.0 deployed
infrastructure on the M-43, Saginaw Highway. This provided a base set of vehicles to monitor for
the project. The other vehicles chosen for the project were based on the number of miles the
drivers cover each week.
The mobile platform is able to collect a variety of observations, such as:
Latitude
Longitude
Date/time
Vehicle speed
Heading
Ambient air temperature
Michigan Department of Transportation Integrated Mobile Observations 3 (IMO)
Project Summary Report
IMO3_Final_Project_Summ_Rpt_Final.doc Page 14
.
Surface temperature
Humidity
Dew point
Accelerometry
The mobility data is needed near real-time since the weather information is time sensitive and is
transmitted via cellular at a configurable frequency. The DUAP system receives, ingests, quality
checks, and analyzes the data.
This data is used by the system in determining current weather conditions and vehicle status.
Analytics are performed on the data after ingestion to glean the information important to the
agency.
2.3.3.2 Connected Vehicles
For the IMO 3.0 project the number of vehicles equipped with OBUs and VIDAS was expanded
by five additional vehicles (for a total of 14 vehicles). The project focused on the M-43, Saginaw
Highway corridor in Lansing, Michigan. The installation of ten RSUs along the stated corridor
provides feedback to the DUAP system from the CV deployments. This area was chosen based on
its features, including:
Four lane road
Major arterial
Urban characteristics
Suburban characteristics
The Saginaw Highway corridor had limited access to communications with the MDOT network
and no access to the back office. To solve this issue, the intersections were equipped with Proxim
954 5GHz radios (point-to-point communication repeaters) to transmit their information to a
central intersection’s radio. This limited the amount of back office connections and cost needed to
support the infrastructure (e.g., this configuration eliminated cellular modem communication
backhaul at each intersection). Of the nine intersections, only the central intersection was
equipped with a Digi Transport WR21 router. The router provided the ability to communicate
between the back office, RSUs, and Traffic Signal Controllers to allow the back office to manage
the device configuration and allow for the transmission of the messages from the devices to the
back office.
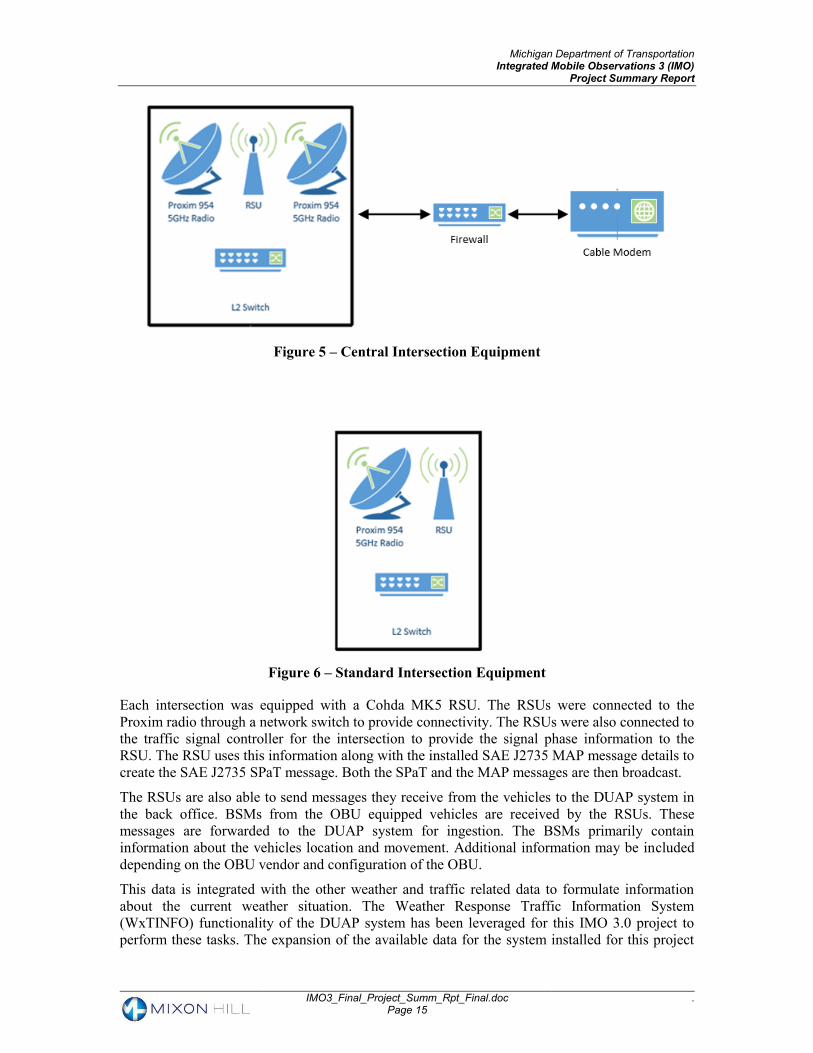
Figure 6 shows the equipment installed at the at the central intersection, Mall Drive (Figure 2
intersection 5) which in addition to the RSU communications, acts as a hub for the intersections
and all communications to the back office. This equipment includes the additional radio to
communicate with the other intersections and the networks components, firewall and modem,
which are required to communicate with the back office. The equipment for the other
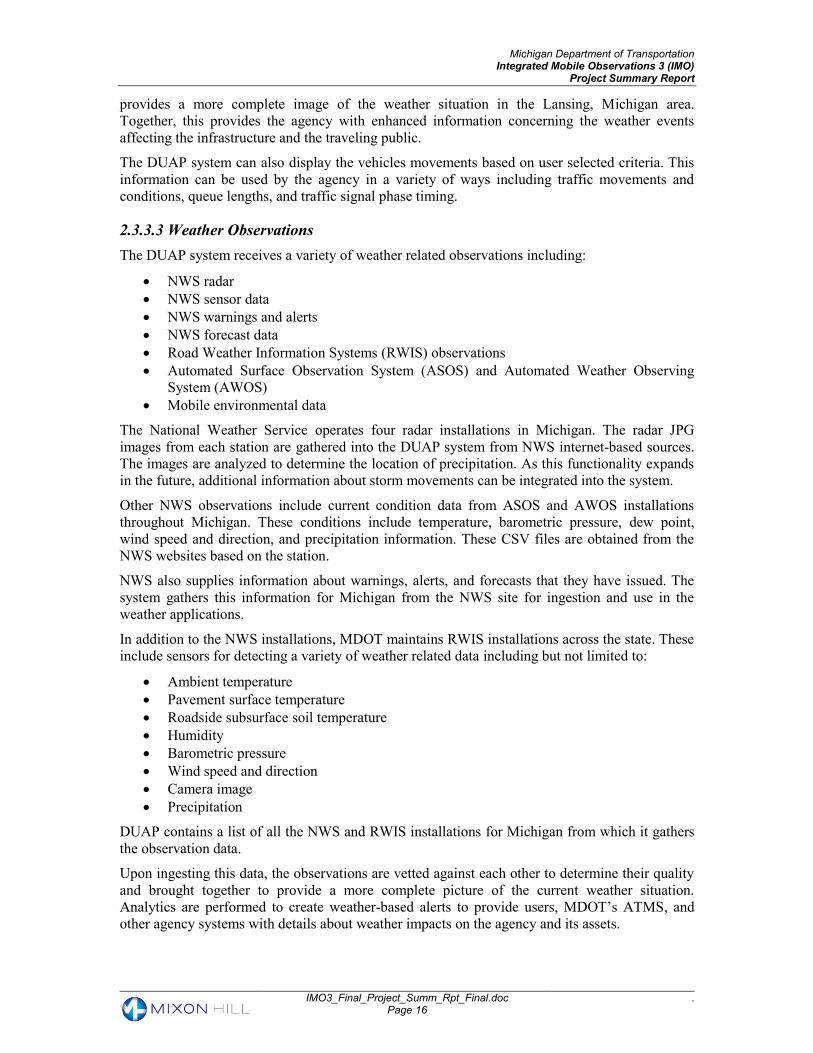
intersections, (Figure 2 intersection 1, 2, 3, 4, 6, 7, 8, 9), is shown in Figure 6. This includes the
RSU, a radio to communicate to the central intersection, and a switch for communications
between the devices.
Michigan Department of Transportation Integrated Mobile Observations 3 (IMO)
Project Summary Report
IMO3_Final_Project_Summ_Rpt_Final.doc Page 15
.
Figure 5 – Central Intersection Equipment
Figure 6 – Standard Intersection Equipment
Each intersection was equipped with a Cohda MK5 RSU. The RSUs were connected to the
Proxim radio through a network switch to provide connectivity. The RSUs were also connected to
the traffic signal controller for the intersection to provide the signal phase information to the
RSU. The RSU uses this information along with the installed SAE J2735 MAP message details to
create the SAE J2735 SPaT message. Both the SPaT and the MAP messages are then broadcast.
The RSUs are also able to send messages they receive from the vehicles to the DUAP system in
the back office. BSMs from the OBU equipped vehicles are received by the RSUs. These
messages are forwarded to the DUAP system for ingestion. The BSMs primarily contain
information about the vehicles location and movement. Additional information may be included
depending on the OBU vendor and configuration of the OBU.
This data is integrated with the other weather and traffic related data to formulate information
about the current weather situation. The Weather Response Traffic Information System
(WxTINFO) functionality of the DUAP system has been leveraged for this IMO 3.0 project to
perform these tasks. The expansion of the available data for the system installed for this project
Michigan Department of Transportation Integrated Mobile Observations 3 (IMO)
Project Summary Report
IMO3_Final_Project_Summ_Rpt_Final.doc Page 16
.
provides a more complete image of the weather situation in the Lansing, Michigan area.
Together, this provides the agency with enhanced information concerning the weather events
affecting the infrastructure and the traveling public.
The DUAP system can also display the vehicles movements based on user selected criteria. This
information can be used by the agency in a variety of ways including traffic movements and
conditions, queue lengths, and traffic signal phase timing.
2.3.3.3 Weather Observations
The DUAP system receives a variety of weather related observations including:
NWS radar
NWS sensor data
NWS warnings and alerts
NWS forecast data
Road Weather Information Systems (RWIS) observations
Automated Surface Observation System (ASOS) and Automated Weather Observing
System (AWOS)
Mobile environmental data
The National Weather Service operates four radar installations in Michigan. The radar JPG
images from each station are gathered into the DUAP system from NWS internet-based sources.
The images are analyzed to determine the location of precipitation. As this functionality expands
in the future, additional information about storm movements can be integrated into the system.
Other NWS observations include current condition data from ASOS and AWOS installations
throughout Michigan. These conditions include temperature, barometric pressure, dew point,
wind speed and direction, and precipitation information. These CSV files are obtained from the
NWS websites based on the station.
NWS also supplies information about warnings, alerts, and forecasts that they have issued. The
system gathers this information for Michigan from the NWS site for ingestion and use in the
weather applications.
In addition to the NWS installations, MDOT maintains RWIS installations across the state. These
include sensors for detecting a variety of weather related data including but not limited to:
Ambient temperature
Pavement surface temperature
Roadside subsurface soil temperature
Humidity
Barometric pressure
Wind speed and direction
Camera image
Precipitation
DUAP contains a list of all the NWS and RWIS installations for Michigan from which it gathers
the observation data.
Upon ingesting this data, the observations are vetted against each other to determine their quality
and brought together to provide a more complete picture of the current weather situation.
Analytics are performed to create weather-based alerts to provide users, MDOT’s ATMS, and
other agency systems with details about weather impacts on the agency and its assets.
Michigan Department of Transportation Integrated Mobile Observations 3 (IMO)
Project Summary Report
IMO3_Final_Project_Summ_Rpt_Final.doc Page 17
.
2.3.3.4 AVL
All MDOT’s WMTs (approximately 320 maintenance trucks) have AVL devices installed. The
DUAP system can ingest this data which consists of information about the state of the vehicle,
plow usage, and winter maintenance material distribution. MDOT supplies this information to
DUAP as a subset of the data points throughout the day. Only 1 data point per vehicle per minute
is transmitted in this data feed. A nightly complete data file provides more data points to
complete the information.
This data can be used by the agency in multiple applications including:
Displaying location of maintenance vehicles
Displaying routes covered by the vehicles
Tracking winter maintenance activities such as plowing and distributing materials
Tracking effects of plowing and use of material on pavement surfaces
Determining efficiencies from Performance Metrics and vehicle usage
Disseminating vehicle information to a public facing website
Front facing camera images of the road condition from the vehicle
2.3.3.5 Traffic Signal Phase and Timing
Some traffic signal controllers within Michigan are equipped for sending their phase and timing
data to the DUAP system. This includes the current phase group being displayed and the time
remaining until the next phase change.
The DUAP system uses SAE J2735 MAP message data to determine the phase for each lane
specified in the MAP and is able to display this information for monitoring the status of the
intersection.
2.3.4 Data Feed to External Systems
Using the DUAP system for the IMO 3.0 project allows for sharing the data from the CV and
VIDAS deployment with a variety of DUAP applications and external systems. This includes
sharing the weather-related data from the VIDAS and OBU equipped vehicles through
subscriptions to the data. Subscriptions were setup in the DUAP system to send the IMO 3.0 data
to both the WxDE and NCAR for use with the Vehicle Data Translator (VDT). This process
supplements the data for these other research initiatives while also being able to leverage the data
in the DUAP applications supporting MDOT including the WxTINFO application which supplies
information to MDOT’s ATMS.
3 FINDINGS The IMO 3.0 project has shown the viability of collecting information from CV deployments,
along with other mobile platforms, to be used for identifying weather-related situations affecting
the traveling public. Leveraging the DUAP system provided new and existing functionality which
was used for analyzing the weather events and for sharing the collected data with other weather
and operational systems used for assisting the agency in managing their response to the events.
The following sections further explain the use of the systems and the findings of the project.
3.1 Summary of Projects and Applications
The following sections describe the related projects and applications developed for or used in
support of the IMO 3.0 project. The descriptions include the information produced by the
applications related to and used by the systems identified in the IMO 3.0 project.
Michigan Department of Transportation Integrated Mobile Observations 3 (IMO)
Project Summary Report
IMO3_Final_Project_Summ_Rpt_Final.doc Page 18
.
3.1.1 Projects
The projects used in the IMO 3.0 project are described below to provide additional context to the
functionality available and used to support the project.
3.1.1.1 Connected Vehicles
MDOT has operated and been involved with multiple CV test beds and installations. These
installations have included a variety of brands of RSUs and OBUs. Field tests have included the
ability to:
Broadcast SPaT and MAP messages at equipped intersections
Broadcast Traveler Information Message (TIM) messages for traveler information
including speed limits and curve speed warnings
Broadcast CAMP Basic Information Message (BIM) messages containing details about
work zones
Capture BSM messages by the RSUs
RSUs must be configured with the proper message information to be broadcast. MAP, TIM, and
BIM message details can be loaded on the RSUs remotely to avoid the requirement to visit the
device for configuration changes.
Since each device has its own nuances concerning configuration methods based on the vendor,
the system must be able to be adapted to various methods of updating configuration information.
MDOT leveraged the DUAP system for configuring the RSUs and for capturing and presenting
the data from the devices and for assisting in the configuration of the installations. The CV
devices are dependent on configuration and monitoring from a back office to ensure they are
operating correctly and providing the pertinent information to the traveling public. The RSU must
be configured with the correct messages to be broadcast. This can include the SAE J2735
message set along with the CAMP BIM message.
The IMO 3.0 project expanded the number of equipped vehicles within the MDOT fleet by
adding Dedicated Short-Range Communications (DSRC) capabilities connected to the VIDAS
installations. This provided MDOT with the ability to target specific areas using DSRC and other
area using cellular where DSRC is not available.
This provided a basis for the functionality required by the IMO 3.0 project for gathering the data
from the new CV and VIDAS deployment.
3.1.1.2 Saginaw Highway Corridor
Specifically, for the IMO 3.0 project, MDOT instrumented a highly-travelled section of Saginaw
Highway in Lansing, Michigan, with RSUs at intersections along the route along with fleet
vehicles installed with the VIDAS platform and OBUs. This installation is designed to handle a
variety of applications along with the ability to expand in the future. Some of the current
applications include:
Safety
Mobility
Weather impacts and alerts
Expanding CV installations
Asset management
The DUAP system is used for configuration of these devices, monitoring the devices, capturing
the data, and providing the information to MDOT through DUAP’s applications.
Michigan Department of Transportation Integrated Mobile Observations 3 (IMO)
Project Summary Report
IMO3_Final_Project_Summ_Rpt_Final.doc Page 19
.
3.1.1.3 WxTINFO
MDOT’s operations functional area is responsible for notifying the public of events that may
affect travel. Using ATMS, MDOT can update dynamic message signs and the Mi Drive website
with this information. Weather is a primary event of interest. Understanding the weather events
occurring within the agency’s jurisdiction is instrumental to this task. Previously the traffic
operations within the operations functional area, who is responsible for controlling these
notifications, had to access various tools to gather a complete view of current weather events. The
WxTINFO project was responsible for adding functionality to the DUAP system to collect
information from various weather data sources, aggregate it into weather alerts based on this
information, and provide it to users and the ATMS. This automates the process of loading data
concerning weather events directly into ATMS to be pushed to dynamic message sign (DMS)
signs and Mi Drive.
Additional weather-based data sources were added to the ingestion processes to accept:
NWS radar
NWS sensor data
NWS warnings and alerts
NWS forecast data
RWIS observations
ASOS and AWOS
Mobile environmental data
This data is quality checked individually and in conjunction with other related data to improve the
accuracy of the information and to assist in monitoring the operational quality of the sensors
providing the data.
Once data is deemed valid and accurate, data analysis is performed to determine the types and
locations of weather events. A multitude of decision-based processes are able to build this
information based on available data. As the amount and frequency of the data increases, the
accuracy of the alert information increases.
The resulting information is available for viewing through DUAP’s weather application and fed
directly to the ATMS for use by operations. The provided information guides the operator in what
message should be displayed on DMS and which signs should receive the message.
As a weather event moves through the state, the signs can be updated automatically, thereby
reducing the operator’s work load during the hectic times of large weather events.
Leveraging this weather alerting functionality provided additional uses of the data created by the
IMO 3.0 deployments and supported the project’s goals of identifying road weather events which
can affect the traveling public.
3.1.2 Applications
The following sections describe applications which relate to the IMO 3.0 project. The
descriptions explain how they apply to the project and provide a basis for additional applications
in the future.
3.1.2.1 Traffic Condition Monitoring
Traditional and current traffic monitoring solutions are almost exclusively based on using
spatially-fixed vehicle detection stations to detect, count, and characterize the vehicles passing
each station. Independent of the particular technologies used to implement that detection and
characterization—induction loops, radar, video, and so forth—the detection is limited to those
Michigan Department of Transportation Integrated Mobile Observations 3 (IMO)
Project Summary Report
IMO3_Final_Project_Summ_Rpt_Final.doc Page 20
.
particular locations at which the detector is stationed. Probe vehicle solutions based on obtaining
the location of particular vehicles, such as VIDAS, AVL, and CV systems, can be used for
monitoring traffic in addition to their other roles.
Currently probe vehicle solutions sample a subset of the driving population; however, a broad
deployment of CV systems along with other mobile platforms would dramatically change this
situation. If all vehicles can report their locations, fixed detection and counting becomes a means
of confirming performance measures that are aggregated from the individual vehicle data. Traffic
monitoring would no longer be limited to the number of stations that could be deployed by the
transportation agency. For example, the agency could use CV data for generating accurate and
reliable arterial travel times and traffic demand at intersections in advance of detectors to be
utilized by the agency in optimizing a corridor.
Combining traditional traffic detection data with CV data provides a more accurate and complete
view of traffic conditions within the infrastructure. As the amount of data continues to expand the
value of the information will continue to increase.
The data from the vehicles equipped through the IMO 3.0 project were integrated into this
application to provide additional data expanding the available information for the agency.
3.1.2.2 Weather Alert System
The purpose of a weather alert system is to provide the agency with near-time information
concerning the weather impacts on travel and maintenance activities. The system brings together
near-time environmental/weather-related data collected from both fixed and mobile data sources.
While the weather-based processes are designed to operate as fully functional applications, they
are also a part of the overall DUAP system. The data sources that are being utilized for the
weather alert processes consist of some of the same sources used for applications within DUAP.
Weather event information generated by the system based on this data is forwarded to the ATMS
and made available to the operators to assist in notifying the public. This concept fits with
MDOT’s desire to define the data once, collect it continually, and use it many times for the
benefit of the entire agency.
For the IMO 3.0 project, this application was instrumental in determining the weather’s impacts
on the roads based on the data collected by the newly instrumented vehicles. Providing the
additional vehicles expanded the available coverage of the mobile data supporting the application.
MDOT is able to use these vehicles to provide targeted data collection where weather events
occur.
Specific to the IMO 3.0 project, the system is able to share the incoming mobile weather
observations by forwarding the data to NCAR and the WxDE in support of other road weather
research initiatives.
3.2 Method of Analysis
The objective of the application analysis for the IMO 3.0 project is to investigate and, if possible,
demonstrate enhanced transportation agency operations based on CV systems and weather-related
observations from CV and other mobile platforms. Within the frame of that objective, each
application area has particular objectives for safety, mobility, environmental affect, cost, and
timeliness. These objectives are likely to be driven by established agency performance measures
for that application area. Objectives may also relate to the existing agency systems—providing a
particular kind or format of data to fulfill regulatory, policy, or procedural goals.
Michigan Department of Transportation Integrated Mobile Observations 3 (IMO)
Project Summary Report
IMO3_Final_Project_Summ_Rpt_Final.doc Page 21
.
The concept for each application area starts and ends with the needs of the client for a particular
application but is built around the existing DUAP system and a common set of capabilities and
data sources. The needs of a particular application derive largely from the objective served by that
application, its associated performance measures, and the physical and operational nature of the
application. At a conceptually high level, some applications are focused on the transportation
system and data pertaining to each asset operating within the transportation system.
The application research consists of three phases, each of which serves as a gate for further
development and testing. The initial system development testing asks, “Can the system collect
usable quality data?” A successful development test then confirms accurate data collection and
synthesis into usable metrics. Acceptance testing asks, “Are the data reflective of actual
conditions?” Successful acceptance testing demonstrates correlation of application metrics as
compared to existing methods employed to solve similar issues. Application testing asks, “Can
the data collection be used to enhance DOT operations?” Successful application testing finally
demonstrates the ability of the application to meet the user needs of the agency.
Each application within the system has different resource needs which are evolving over time to
continue to improve the quality of the information they provide and the viability of their value to
the agency. This emphasizes the importance of the data’s quality, availability, and sustainability.
An application’s value is based on its ability to have reliable and correct data.
The analysis of each application is completed with conclusions on the relative success in meeting
the objectives for that application and suggestions for next steps in research and implementation.
3.2.1 Applications
The following sections detail the primary applications related to the IMO 3.0 project initiatives
and analysis. They provide examples of the abilities of the system in related to leveraging CV
data for identifying and responding to road weather events.
3.2.1.1 Connected Vehicles
Still in the infancy of CVs, standards and implementations continue to evolve. These changes can
have a costly impact on systems designed without the flexibility to evolve with the changes.
Creating a system which is configurable and that is able to ingest a variety of data formats from
multiple data sources allows the agency to adapt to the changes in the industry.
Vehicles for this project were chosen based on the number of miles they cover weekly, along with
the area of the state and types of roads the drivers cover. This provided a large amount of data in
a variety of situations.
The equipped corridor was a focus for a number of the trucks housed at the MDOT Grand Ledge
maintenance garage. This facility is in proximity to the equipped Saginaw Highway corridor. This
allows for collection of data through the VIDAS platform along with collection of the CV data.
Each of these data sources supplements the other in the quality checking of the data and helping
to provide ground truth in understanding the information.
3.2.1.2 Traffic Condition Monitoring
A vehicle’s relationship to the traffic flow is provided by data describing vehicle motion. These
data could include, at a given time, the vehicle:
Location (latitude and longitude from GPS)
Speed
Michigan Department of Transportation Integrated Mobile Observations 3 (IMO)
Project Summary Report
IMO3_Final_Project_Summ_Rpt_Final.doc Page 22
.
Heading
Brake status and ABS actuation
Steering status, yaw rate, and stability control actuation
Longitudinal and lateral acceleration
Traffic measures would then be derived from the aggregation of data from individual vehicles.
Traffic speed, for example, could be represented by the mean and standard deviation of speeds of
the vehicles along a given roadway segment within a certain time interval. Incident detections
might be synthesized from correlation of vehicle speeds with braking, acceleration, and steering
status. Travel time estimates could be derived from analysis of vehicle positions and speeds.
Low data latencies (on the order of seconds rather than minutes) will be required for vehicle
probe data to be useful in traffic monitoring and management. Current ATMS sensors and
networks operate in near real time, and any significant increase in data latency would
compromise both operations and public trust.
The number of vehicles needed to generate useful traffic data may be a constraint on traffic
monitoring applications, especially in the near term when CVs would represent a small fraction of
overall vehicle populations. A 2007 study1 found that probe vehicle populations on the order of
10 percent of vehicles are needed for accurate and reliable traffic travel time estimates, with
slightly more vehicles needed to estimate mean traffic speed. Increasing the number of vehicles
would provide both higher confidence and more accurate statistics. Traffic control applications
depending on vehicle counts (e.g., signal control) would require even higher population
percentages, approaching CV saturation, to be effective.
Expanding the number of vehicles equipped with CV systems or other mobile platforms increases
the quality and coverage of data supporting this application. Equipping vehicles in support of the
IMO project supplemented the data available for monitoring traffic conditions.
Sharing this information with all functional areas within the agency provides a variety of benefits
including but not limited to:
Monitoring traffic conditions
Planning maintenance and construction activities
Origin and destination planning
Assisting in traffic signal phase planning
Improving response time to incidents
3.2.1.3 Weather Alert System
Weather affects many aspects of the agency and the traveling public. The National Weather
Service supplies general weather alerts and warnings which can be used to assist the agency in
notifying the public, planning road maintenance activities such as road repairs or treating snow
covered roads. Additional information, such as NWS radar, weather-based websites, probe
vehicle weather sensor data, and camera images, can be used to help determine the impacts of
weather events. Combining this information into one application simplifies the task of tracking
the weather events. MDOT is using DUAP to integrate these various data.
DUAP is ingesting weather-based data from:
1 Noblis Inc. Vehicle-Infrastructure Integration (VII) Probe Data Characteristics: Analysis of Three Field
Data Sets. Falls Church, Virginia. June 2007.
Michigan Department of Transportation Integrated Mobile Observations 3 (IMO)
Project Summary Report
IMO3_Final_Project_Summ_Rpt_Final.doc Page 23
.
NWS radar files
NWS observations from fixed weather stations
NWS alerts
NWS forecast information
MDOT RWIS fixed stations
ASOS and AWOS
Mobile VIDAS platforms
Mobile AVL fleets (WMTs)
CV equipped vehicles (VIDAS & IMO)
The different weather data information is combined to provide the ability to quality check the
data to ensure accuracy, analyze the data to determine the type and location of weather events,
and provide a variety of granularity of the information based on user needs.
Each data source has a specific resolution and frequency of data which is supplied to the DUAP
system. The data analysis processes must handle these differences, along with the continuous
stream of information, to continually adjust the type and location of weather alerts being
generated.
Using the DUAP GUI, the user may view the information concerning the weather alerts generated
by the system. In addition, these alerts can be sent to other external systems, as needed. DUAP
currently provides the information to MDOT’s ATMS to assist operations in notifying the public
of the weather events. Other uses of the information include but are not limited to:
Determining if road construction or maintenance can be performed
Determining the areas that require winter maintenance
Determining type of winter maintenance needed
Notifying emergency agencies where weather is impacting the public
Trending impacts of winter weather and maintenance on roads
Tracking winter maintenance material usage
Tracking winter maintenance coverage
Adjusting traffic signal timing based on weather
Weather observations are also being shared with other external systems including NCAR and
WxDE in support of the IMO project. Leveraging DUAP’s ability to route data to these external
systems provided for the data sharing to support these research initiatives.
3.3 Presentation of Results
The IMO 3.0 project made the move from using smartphone technology for capturing mobile
weather-related data to using CV technology along with an integrated mobile platform capable of
capturing data from a variety of sensors. These technologies improved the accuracy, timeliness,
and reliability of the information and expanded the uses of the data. The data was used to
supplement existing data sources in weather and mobility related applications along with
providing the data to systems external to the DUAP system to expand the use of these systems.
The following sections detail the use of the system’s applications for the IMO 3.0 project.
3.3.1 Applications
The following sections provide details of the different applications developed to meet MDOT’s
needs. The IMO 3.0 project was able to leverage and to provide enhancements to these
applications to leverage the CV deployments for capturing and using road weather information.
The following applications were involved with this analysis.
Michigan Department of Transportation Integrated Mobile Observations 3 (IMO)
Project Summary Report
IMO3_Final_Project_Summ_Rpt_Final.doc Page 24
.
3.3.1.1 Connected Vehicles
The CV applications cover a variety of areas including but not limited to traffic conditions,
weather, construction, maintenance, and safety. Equipped vehicles and RSUs provide the data for
these applications. The message types can include:
BSM: RSUs receiving BSM message from mobile devices can forward the messages to
the DUAP system for analysis.
SPaT: Traffic signal phase information can be received directly from the traffic signal
controllers and ingested into the DUAP system and sent to the RSU to be broadcast to
listening devices such as OBUs. The DUAP system can also receive the data from the
RSU for ingestion.
MAP: The DUAP system can assist in configuring the RSU with the MAP data for MAP
broadcasting and for converting signal phase data into a SPaT for broadcasting along
with the MAP.
TIM: The DUAP system can assist in configuring the RSU with TIM messages for
broadcast to CV devices for traveler information.
BIM: RSUs can be configured with a CAMP BIM for broadcasting. The DUAP system
can assist in the creation of the BIM information and the RSU configuration for the
message
The DUAP system uses the information from these messages to assist the agency in a variety of
uses including:
Monitoring traffic situations
Monitoring queues at intersections
Supplementing weather information
Planning and adjusting traffic signal phase timing
Notifying the equipped travelers of information via TIM or BIM
The DUAP system has adapted as the CV devices and standards have evolved. The standards for
the messages have consisted of three primary format versions, 2009, 2015, and 2016. This initial
implementation of CV within DUAP involved the 2009 message format. This has been expanding
to incorporate 2015, as needed, with the target to totally support 2016 format enabled devices.
DUAP is able to display BSM data for vehicles within range of the RSUs along with the traffic
signal phase information.
These applications were used for the IMO 3.0 project for the ingestion of the BSMs from the
vehicles and managing the configuration of the RSUs deployed in the project.
3.3.1.2 Traffic Condition Monitoring
The DUAP system ingests data from a variety of data sources dealing with traffic flow including
fixed detection devices, such as MVDS, and mobile data, such as CV and VIDAS. The mobile
data sources provide data showing speeds at various points across the infrastructure to
supplement the fixed station data. As the equipped fleet continues to grow, the coverage of this
data will increase.
The application shows the traffic averages obtained by the fixed sensors for a specified route and
time frame. The GUI provides a list of equipped routes from which to select. This data can be
further expanded to show more detailed time-based graphs for a selected location along the route.
The actual sensor location and their data can be displayed on the map interface.
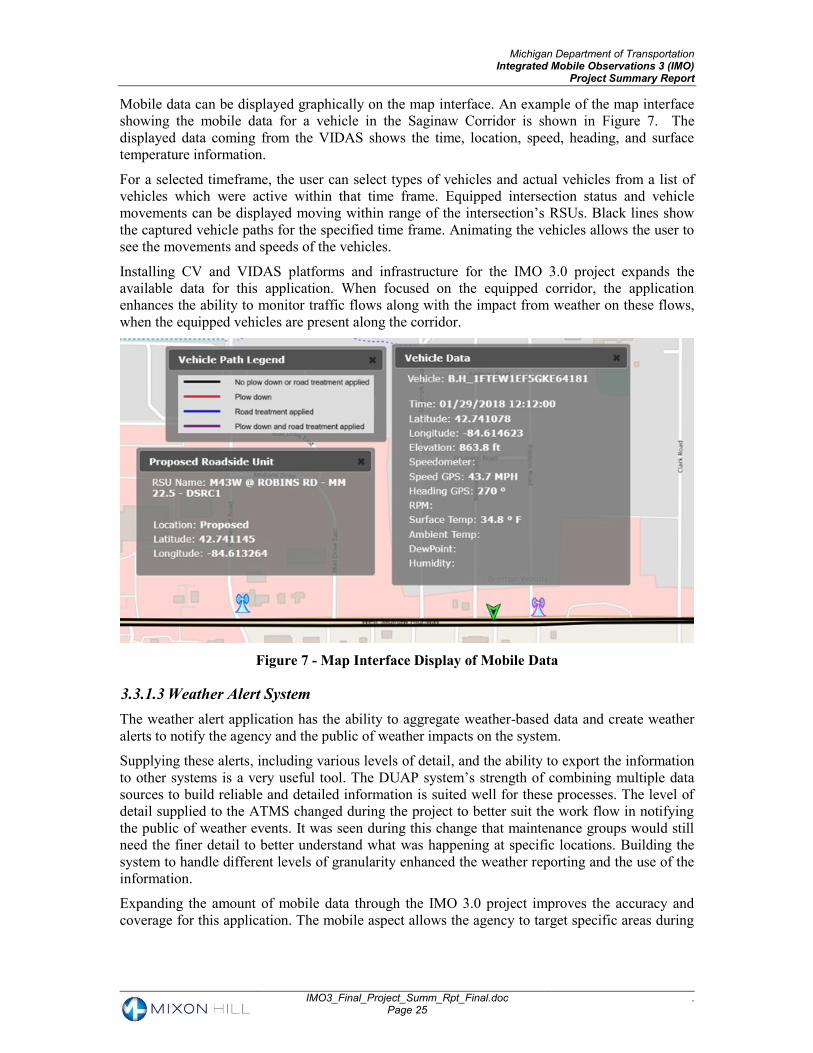
Michigan Department of Transportation Integrated Mobile Observations 3 (IMO)
Project Summary Report
IMO3_Final_Project_Summ_Rpt_Final.doc Page 25
.
Mobile data can be displayed graphically on the map interface. An example of the map interface
showing the mobile data for a vehicle in the Saginaw Corridor is shown in Figure 7. The
displayed data coming from the VIDAS shows the time, location, speed, heading, and surface
temperature information.
For a selected timeframe, the user can select types of vehicles and actual vehicles from a list of
vehicles which were active within that time frame. Equipped intersection status and vehicle
movements can be displayed moving within range of the intersection’s RSUs. Black lines show
the captured vehicle paths for the specified time frame. Animating the vehicles allows the user to
see the movements and speeds of the vehicles.
Installing CV and VIDAS platforms and infrastructure for the IMO 3.0 project expands the
available data for this application. When focused on the equipped corridor, the application
enhances the ability to monitor traffic flows along with the impact from weather on these flows,
when the equipped vehicles are present along the corridor.
Figure 7 - Map Interface Display of Mobile Data
3.3.1.3 Weather Alert System
The weather alert application has the ability to aggregate weather-based data and create weather
alerts to notify the agency and the public of weather impacts on the system.
Supplying these alerts, including various levels of detail, and the ability to export the information
to other systems is a very useful tool. The DUAP system’s strength of combining multiple data
sources to build reliable and detailed information is suited well for these processes. The level of
detail supplied to the ATMS changed during the project to better suit the work flow in notifying
the public of weather events. It was seen during this change that maintenance groups would still
need the finer detail to better understand what was happening at specific locations. Building the
system to handle different levels of granularity enhanced the weather reporting and the use of the
information.
Expanding the amount of mobile data through the IMO 3.0 project improves the accuracy and
coverage for this application. The mobile aspect allows the agency to target specific areas during
Michigan Department of Transportation Integrated Mobile Observations 3 (IMO)
Project Summary Report
IMO3_Final_Project_Summ_Rpt_Final.doc Page 26
.
weather events. Not only does this improve the information being reported to the agency, it
provides traffic operations with additional ground truth concerning the event.
4 DISCUSSION
4.1 Validity of Hypothesis
The IMO 3.0 project’s hypothesis of a system being able to leverage CV and other mobile
platform data to determine the occurrence and effects of weather on the traveling public has been
shown to be valid. Integrating the data from the CV deployment’s additional VIDAS platforms,
with the existing data being ingested by the DUAP system, has shown improvements in the
coverage of the weather-related details which can be provided to the user or other systems.
Employing the Wx-TINFO applications to expand the uses of the data further demonstrated the
viability of using vehicles to supplement the available data from fixed stations in determining the
types and location of weather events.
Sharing the mobile data with the other systems, NCAR and WxDE, further demonstrated the
importance of mobile data in analyzing and responding to weather events. Instead of each system
being responsible for deploying and collected its own CV infrastructure, this deployment
leverages the CV infrastructure for use by several systems. This one deployment is able to inform
many systems of environmental situations. Each system, DUAP, NCAR, and WxDE was able to
leverage the same data to provide their individual and combined functionality to the agency for a
more complete description of the current weather and how it was affecting the traveling public.
Establishing the interface between the systems provides functionality for continuing to expand the
mobile and CV deployments as these technologies continue to become adopted by the agency and
the public. Data from new deployments can be shared between the systems, increasing the value
of the data collected.
Applications can continue to be developed using the data sets currently ingested into the system.
Information based on this data can be disseminated, within these applications, in a variety of
ways to meet varying needs of the different functional areas.
4.2 Factors Affecting the Results
Infrastructure owners and operators are continually challenged to have the appropriate data in the
right locations at the right time. The infancy of the CVs has limited data availability. As MDOT
continues to expand their CV footprint this will continue to improve. The IMO 3.0 project has
shown how the data’s value can increase as the number of installations and CV market
penetration grows. Expanding the deployments for IMO would continue to improve the amount
and value of data generated.
One of the issues affecting the CV corridor was the lack of communications infrastructure at the
intersections. Due to this limitation, the RSUs were connected to radios at the intersections. These
radios were used to pass data between the RSUs and the back office. There were issues installing
the radios and ensuring each radio had stable communication to the primary radio used to
interface with the back office. The back office also needed to understand which RSU was sending
the data as all data was transmitted from the same radio. Using this architecture design met the
basic needs of the project but was not an ideal solution to the CV deployment.
There was a delay in completing the deployment due to the lack of an available communication
backbone at the intersections in the corridor. This prevented the collection of the CV data during
most of the winter timeframe during the project. The VIDAS platform, however, was able to
continue to collect the information concerning the weather and the pavement condition. This data
Michigan Department of Transportation Integrated Mobile Observations 3 (IMO)
Project Summary Report
IMO3_Final_Project_Summ_Rpt_Final.doc Page 27
.
was ingested by the DUAP system and forward to NCAR and WxDE for their use. Having this
data available helped in meeting the goals of the project in utilizing mobile weather-related data.
The current applications and their results have been based on currently available data sources. In
some cases, coverage from existing data sources may be lacking in specific geographical areas.
Depending on the needs of the agency, these data sources can be expanded or supplemented by
mobile platforms. As the DUAP system continues to receive additional and expanded data
sources the value of the data and the systems will continue to be realized.
4.3 Implications
The results of the IMO 3.0 project demonstrate that CV deployments can further enhance the road
weather data collected from other data sources to provide greater and more targeted coverage of
geographical areas. The data can be shared and disseminated in a variety of ways to meet the
needs of different functional areas. Expanding these deployments and other data sources would
provide more accurate and complete information across the infrastructure. This data will increase
in value as systems such as DUAP, NCAR, and WxDE continue to provide new applications
reusing the information to benefit different areas of the agency meeting their variety of needs.
As these deployments and data sources expand, the amount of data will also continue to increase.
This has a direct concern and increased cost to the systems ingesting the data. Processes are
required to ensure sustainability of the systems and to control the costs of operating the systems.
The architectural solution implemented to deal with the lack of a communications backbone to all
of the intersection was able to deal with the data from this deployment. However, it was seen that
a larger deployment with many equipped vehicles and intersections could result in the solution
not being sustainable or able to transmit the amount of data that would be generated. This showed
the importance of a quality communication backbone to the intersection included in CV
deployments.
These benefits imply value to the agency in continuing to expand the CV deployments, data
source coverage, system applications, and application usage.
5 CONCLUSIONS
5.1 Conclusions from the Study
The IMO 3.0 project has shown that is it viable for CV data to be used in identifying weather-
related threats and hazards. Combining this information with other fixed and mobile data can
provide additional coverage and details of the ground truth during weather events. Changing from
the use of smartphones to the CV and mobile platform technologies expands the capabilities and
uses of the deployment. This provides data for not only mobility applications but expands into
weather and safety applications.
CV technologies include V2V and V2I safety and mobility applications as shown in prior
deployments. IMO 3.0 pushes these capabilities into supporting agency responses to road weather
events by supporting multiple weather response systems such as DUAP, NCAR, and WxDE. The
DUAP system has shown how the data can be used to enhance the Wx-TINFO capabilities in
expanding the availability of weather data for notifying the agency of the type and location of
weather events. In passing this information to the traffic operations staff, improved weather
response plans can be developed.
As CV deployments continue to expand, the availability of the data will continue to improve the
resolution and accuracy of the road weather information. As this improves, agencies and the
traveling public will be better equipped to deal with the many hazards of weather.
Michigan Department of Transportation Integrated Mobile Observations 3 (IMO)
Project Summary Report
IMO3_Final_Project_Summ_Rpt_Final.doc Page 28
.
5.1.1 Benefits
Traveling Public: Provides traveling public with more timely/valuable information
allowing them to make safer decisions both pre-trip and en-route during inclement
weather conditions.
DOT TOC/TMC Operators: DOT operators are critical in providing motorists with
valuable information during winter weather events. Mobile information can provide
better roadway coverage and localized messaging for TOC/TMCs thereby better
informing motorist decisions as to the safest trip alternative.
Maintenance Staff: Provides the ability to utilize an alert system to advise maintenance
staff of necessary winter maintenance locations, including unsafe pavement/roadway
conditions, and enhances response times.
Savings: Optimizes the use of maintenance resources through data driven performance
metrics (tracking material usage, time on roadway/overtime, automates completing
vehicle logs & reports, reduced fuel consumption/emissions, etc.).
5.1.2 System Capabilities
DUAP has been successful in meeting the needs of the IMO 3.0 project, to evaluate uses and
benefits of mobile and CV weather observations from various platforms across the agency. The
program demonstrated, for example:
Acquisition of data from multiple data sources, including mobile platforms, CV devices,
weather, and traffic detection
Deployment of aftermarket on-board sensors and data acquisition units for measurements
of specific operational interest to DOTs
Analysis of multiple data types from each of the sources
Synthesis of performance measures for specific DOT applications (for example, segment
average speeds, or relative pavement conditions) from the probe data
Presentation of raw and processed data in consistent, flexible map-based operator
interfaces
Sharing of data with external systems
IMO 3.0’s success has shown the quality and availability of data from a variety of data sources,
including CVs, continues to expand and improve. This will continue to expand the usefulness of
the system and improve the information it creates. The availability of large volumes of data from
diverse systems led to a research plan exploring what might be done with the data. The current
reality is that data will continue to become available only as it is needed and can be obtained for
particular applications. The focus of research needs to shift from “what can we do with
everything that’s available?” to “what do we need, and how do we get it?”
5.1.3 Data Collection and Standards
The IMO 3.0 project demonstrated the ability to acquire and aggregate data from multiple sources
and formats into an integrated repository. The DUAP system philosophy and architecture of
isolating the data collecting components from the data repository enables the system to add new
collectors as needed to accommodate interfaces with varying data specifications, timing, and
network protocols. If a data source already provides an interface, a new collector component for
DUAP will be the most effective means of getting the data from that particular source.
Given the capability to collect data from a wide variety of interfaces, the data repository also
needs to be able to accommodate data from different sensors and sources at differing times and
Michigan Department of Transportation Integrated Mobile Observations 3 (IMO)
Project Summary Report
IMO3_Final_Project_Summ_Rpt_Final.doc Page 29
.
spatial resolutions. Each data source may provide values for a given parameter with its own
resolution, which may or may not match the resolutions needed by particular applications of that
data. For example, “speed” could be provided by multiple sensors on a vehicle (for each wheel,
for the average wheel, based on GPS coordinates) and by roadway sensors (which generally
provide only time averaged speeds over multiple passing vehicles). Each of these cases needs to
be specifically identified within the repository with metadata (for example, source) that may be
needed in the application of that data.
Maintaining the quality of data within the system based on the standards related to each data
source helps to preserve the value of the information used as a basis for the many applications of
the DUAP system.
Integration of a variety of data sources helps provide a more complete and accurate image of the
status of transportation to the agency and other systems. Sharing this information with the other
research initiatives provides additional value of expanding the use of the CV and mobile
platforms along with collecting the data for the variety of uses.
This capability was essential in meeting the needs of the IMO 3.0 project in expanding the
availability of CV and mobile platform data and integrating it with existing information to
improve the quality and use of the information.
5.1.4 Applications
Viability of any particular application using CV data depends directly on data characteristics
including:
Availability of the data types relevant to that application
Availability of sufficient data volumes
Data spatial and temporal resolutions consistent with the needs of that application
Metadata linking the data to the sensors and loggers that provided it to enable appropriate
data quality checks
Given these data conditions and the prototypical nature of CV systems, applications of value to
DOTs are likely to depend in the near term on data from DOT-controlled vehicles. Test bed and
demonstration deployments to date have been consistently unable to provide sufficient data to
enable DOT application development. The IMO project continued the deployment of additional
vehicles equipped with OBUs and VIDAS along with additional RSUs to support these equipped
vehicles.
CV technologies may eventually be valuable for traffic monitoring applications, but only after
they are sufficiently distributed within vehicle fleets. This conclusion reflects experience not just
within a formal “connected vehicle” context, but results seen in other AVL deployments and
commercial traffic data service providers. Combining a DOT’s fleet data with other transportation
and CV related data is beginning to provide valuable information for driving further research
along with actual application development.
Weather detection has been demonstrated in this project and should be achievable across the DOT
with currently available technologies. The availability of weather observations across the
different mobile platforms provides a variety of options to supplement the available weather-
related data. Deployment of these platforms continues to expand the information coverage across
the state to assist the agency with its operations. The value of this information continues to grow
as research initiatives examine uses of the data.
Michigan Department of Transportation Integrated Mobile Observations 3 (IMO)
Project Summary Report
IMO3_Final_Project_Summ_Rpt_Final.doc Page 30
.
6 LESSONS LEARNED The following section provides the lessons learned through the course of the IMO 3.0 project.
6.1 Overall Project Lessons
There were several general lessons learned on the overall project that are applicable across the
different applications of the project:
Collecting mobile data and sharing it with other systems demonstrated the importance of
mobile data in responding to weather events.
A more complete description of the current weather and the impact to the traveling public
has the potential to improve public safety and improve the agency’s operational
effectiveness.
Agencies should build hardened platforms to increase the stability of the data collection
and system operation.
Agencies should build hardened backhaul communications to increase the reliability of
data transmission.
Agencies should incorporate data use protocols to facilitate data interoperability.
Agencies should build institutional knowledge to support existing deployments and gain
greater involvement in expanding future applications.
Agencies should enhance sustainability with operations and management funding and
data usage.
Solutions may require proprietary software to run on off-the-shelf hardware. This
produces software to accomplish the specific tasks needed where open-source software
does not exist.
Agencies should build partnerships internally within the agency and externally with
public and private sectors of industry. These partnerships bring additional support,
resources, and expertise to achieving the goals of the agency.
Agencies should build a back office with the proper support to handle data storage and
communication for the system. The back office also provides the ability to monitor and
maintain the devices remotely. This can be done by the agency or built and managed by
others.
Agencies should educate internal stakeholders, external stakeholders, and sponsors to
maintain management support.
6.2 Preinstall Process
There were several lessons learned in the pre-installation process that help ensure the success of
the installation and overall project:
Scheduling of trucks for the install and cooperation with the drivers is critical.
Logistics of the vehicle availability for the required time needs to be well planned.
Administrative support is needed for coordination of the vehicle installations.
Michigan Department of Transportation Integrated Mobile Observations 3 (IMO)
Project Summary Report
IMO3_Final_Project_Summ_Rpt_Final.doc Page 31
.
Vehicle selection should be based on the availability, miles traveled, geographic
coverage.
6.3 Install Process
There were several lessons learned in the installation process that help ensure the success of the
project:
Have hoists available to simplify installations.
Have tools to support the installations (including lighting, hole saws, drill and bits, etc.).
Installing antennas on the truck cab is better than installing on truck bed toppers.
Package installation kits containing all of the correct components for each truck is
critical.
A spare kit would help for replacement of devices experiencing problems during install.
Bad sensors cause problems with the assigned devices. Make sure there is an easy
method for documenting the changes in which devices are installed on the vehicle.
Environmental impacts on the cables and devices (moisture, corrosion, grim, etc.) can
cause failures.
Installers should ensure mounting materials and processes alleviate impacts from
environment and wear.
Design cables for easy installation (potentially using wireless sensors if available)
wherever possible.
Installers should use a standard measurement process for collecting metadata for the
locations that the device is installed on the vehicle.
Make sure a driver is available for testing the installation.
Automate the testing of the install within the software to provide a consistent and
streamlined method for verifying installation of the components.
Installers should provide access to the communication channels (i.e., cellular, Wi-Fi,
DSRC).
Agencies should develop a backup plan for issues with the Wi-Fi at the facility for testing
the installation.
Agencies should support the needs of the installers (i.e., provide facilities, restrooms,
food, environmental, and access after normal working hours to facility).
Having two people to make the measurement of everything is much easier. Once
installed, it is necessary to measure the locations of the sensors and tires in relation to the
GPS antenna. It helps having two people doing those tasks to be more accurate.
Agencies should have internal coding to charge their time to for installation and
operations and maintenance needs. This allows the agency to track effort.
Stakeholders should clearly communicate (via meetings, written correspondence, etc.)
roles and responsibilities of all stakeholders in this process, including the vehicle drivers.
Michigan Department of Transportation Integrated Mobile Observations 3 (IMO)
Project Summary Report
IMO3_Final_Project_Summ_Rpt_Final.doc Page 32
.
6.4 Post Installation
There were several lessons learned post-installation that will support future deployments:
It is critical to have ongoing maintenance and support.
Agencies should monitor installed components and alert team to devices with problems.
Agencies should have spare kits available for replacements parts.
Agencies should have a maintenance program that includes annual maintenance
inspection, review, and calibration.
Agencies should have a process for tracking shock degradation, compare to baseline for
the vehicle.
Agencies should have a plan in place for vehicle turn over as equipment will need to be
removed from old vehicle and placed on the new vehicle.
6.5 Field Devices
There were additional lessons learned related to the field devices:
Field Infrastructure installation and communication are critical issues.
Agencies and field personnel should ensure compatible interface and applications
between the RSU and traffic signal controller.
Due to the lack of installed communication backhaul, the radios used with the RSUs
required line of sight to communicate.
Agencies should determine backhaul needs for the infrastructure for communicating with
the back office.
Resource needs and cost of field deployment should be determined based on the existing
infrastructure.
Equipment and communication costs (including justifying fleet expansion) may be
challenging and may compete with other funding requests.
6.6 Mobile Devices
There were also lessons learned related to the mobile devices:
Use more Public fleet vehicles to increase the number of deployed vehicles and make
sure there is funding to support those vehicles
The proprietary nature of OBD/CANBus data can be limiting (e.g., it is difficult to
receive data beyond basic CANBus information).
Coordination and installation of equipment on agency vehicles creates challenges.
Agencies should be sensitive to installation issues and be diligent in documenting sensors
on vehicles (e.g., meta-data needs).
Multiple communication protocols (cellular, WiFi, DSRC) were used to transfer data
from the mobile devices to the back office. This optimizes the efficiency of the system by
Michigan Department of Transportation Integrated Mobile Observations 3 (IMO)
Project Summary Report
IMO3_Final_Project_Summ_Rpt_Final.doc Page 33
.
using the appropriate communication channel based on the type and volume of data as
well as the intended use cases for the data and the back office.
7 RECOMMENDATIONS The following recommendations are offered to support MDOT’s continued deployment of the
weather, traffic monitoring, and CV applications.
The IMO 3.0 project can be used as a success story for others to deploy these applications
and for deployment of additional applications.
Mobile data can be used by agencies to support weather management, traffic monitoring,
and transportation management applications.
Providing data to NCAR can enhance the overall weather information available to the
public.
For these applications to be successful, it is critical that the agency or agencies establish a
back office, database, data management system, and communication to support the
applications and integrate those into current business models
Agencies should secure system operations and maintenance funding for program
sustainability.
7.1 Recommendations for Further Research
IMO 3.0’s purpose, simply stated, was to assess the use of data from CVs and available mobile
weather observations to improve transportation agency operations. The research was therefore
based and developed on a presumption of data being available from CVs along with the
expansion of mobile platforms such as VIDAS and AVL. Activities undertaken as part of IMO
3.0 project were directed at applications of that data within MDOT, other transportation agencies,
and other weather-related systems.
The IMO 3.0 project expanded the volume of data available to the DUAP system by continuing to
deploy sustainable sources of data within MDOT to support transportation agency applications
along with other FWHA research initiatives through the installation of CV technologies and the
VIDAS platform. Provisions were made for collecting data from MDOT’s own fleet vehicles
equipped with these mobile platforms and RSUs installed along the Saginaw Highway in
Lansing, Michigan. The system used to collect the data has enabled the DUAP system to
demonstrate the ability to collect data, provide applications specifically related to the
improvement of DOT operations, and to provide the data to other weather systems, namely
NCAR and WxDE.
Based on this experience, it is recommended that further research using the system demonstrated
in DUAP continue to be developed in on-going programs and the expansion of the CV
deployments. Solutions will continue to be identified and developed to fulfill the data needs of the
agency to improve the cost efficiency and enhance the effectiveness of its operations, with the
emphasis on expanding the available mobile data gathered as part of MDOT’s ongoing operations
with other data sources from across the agency.
7.2 Recommendations for Implementation
Next phases of the IMO 3.0 project can continue to expand CV and other mobile platforms and to
add new data sources to increase the coverage, accuracy, and quality of the data to improve the
Michigan Department of Transportation Integrated Mobile Observations 3 (IMO)
Project Summary Report
IMO3_Final_Project_Summ_Rpt_Final.doc Page 34
.
information within the system. As installation of CV technologies continues to expand,
information available through the system will continue to provide additional benefits and increase
the value of this data. The applications presented in this document are the beginning of what they
can truly be. Continuing to evolve and expand the applications within the DUAP system, along
with more complete data coverage, will continue to increase the value of the system to the agency
and other external systems using DUAP’s information.
It is important to consider the available infrastructure at locations planed for CV deployments.
The CV devices generate a large amount of data which is valuable to the agency in monitoring
the infrastructure and the environment. The availability of sufficient communication backbone is
essential for a successful deployment. The Saginaw Highway corridor demonstrated the
importance of adequate infrastructure to support the additional devices and data associated with
CVs.
The goal of IMO is to provide accurate and pertinent information for dealing with weather threats
and hazards. Leveraging a system like DUAP helps to meet this goal along with providing the
agency additional benefits, such as:
Cost efficiencies
Improved effectiveness of its operations
More complete information concerning the transportation system
Improved public safety
Decreased environmental impacts
Continued growth of the DUAP system depends on:
Development of additional applications to meet the needs of the different functional areas
of the agency
Installation of additional fixed devices such as RSUs, weather detection, traffic sensors
Installation of additional mobile devices such as the VIDAS platform, AVL, and OBUs
IMO 3.0 has shown, through the expansion of the CV deployment, DUAP’s applications, and the
sharing of data with other systems, how these benefits can be met through continued expansion of
CVs and the coverage and accuracy of data sources continue to increase.
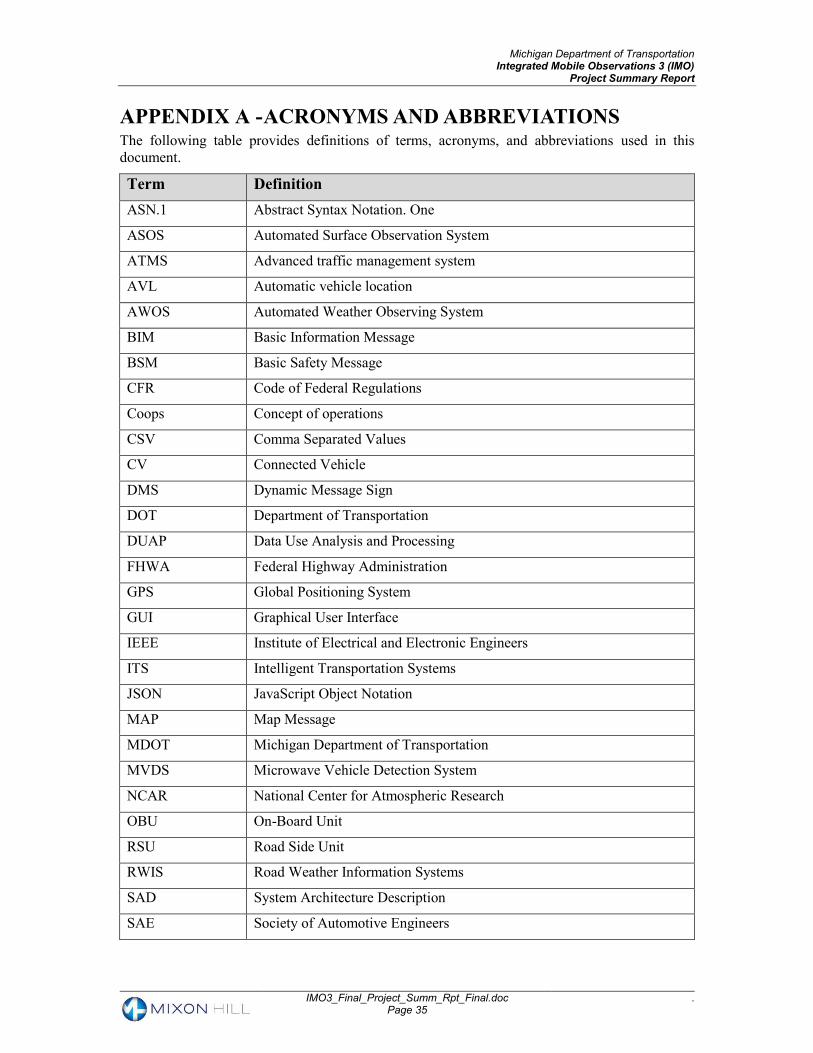
Michigan Department of Transportation Integrated Mobile Observations 3 (IMO)
Project Summary Report
IMO3_Final_Project_Summ_Rpt_Final.doc Page 35
.
APPENDIX A - ACRONYMS AND ABBREVIATIONS The following table provides definitions of terms, acronyms, and abbreviations used in this
document.
Term Definition
ASN.1 Abstract Syntax Notation. One
ASOS Automated Surface Observation System
ATMS Advanced traffic management system
AVL Automatic vehicle location
AWOS Automated Weather Observing System
BIM Basic Information Message
BSM Basic Safety Message
CFR Code of Federal Regulations
Coops Concept of operations
CSV Comma Separated Values
CV Connected Vehicle
DMS Dynamic Message Sign
DOT Department of Transportation
DUAP Data Use Analysis and Processing
FHWA Federal Highway Administration
GPS Global Positioning System
GUI Graphical User Interface
IEEE Institute of Electrical and Electronic Engineers
ITS Intelligent Transportation Systems
JSON JavaScript Object Notation
MAP Map Message
MDOT Michigan Department of Transportation
MVDS Microwave Vehicle Detection System
NCAR National Center for Atmospheric Research
OBU On-Board Unit
RSU Road Side Unit
RWIS Road Weather Information Systems
SAD System Architecture Description
SAE Society of Automotive Engineers
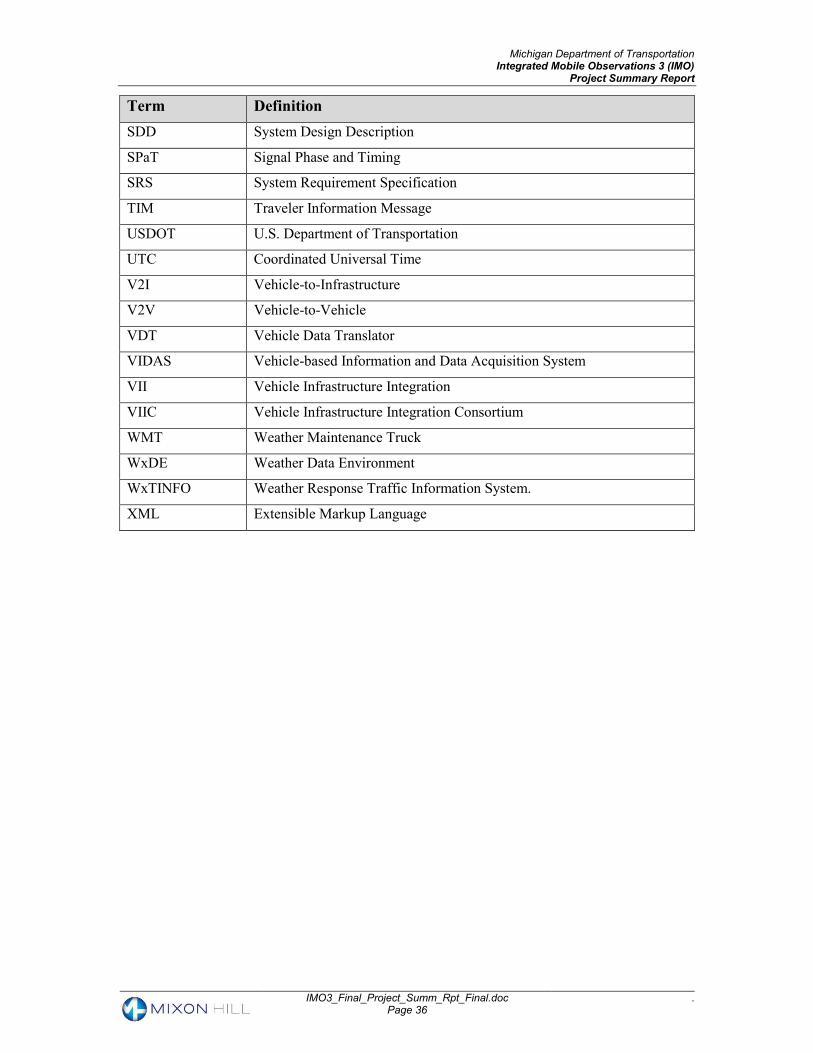
Michigan Department of Transportation Integrated Mobile Observations 3 (IMO)
Project Summary Report
IMO3_Final_Project_Summ_Rpt_Final.doc Page 36
.
Term Definition
SDD System Design Description
SPaT Signal Phase and Timing
SRS System Requirement Specification
TIM Traveler Information Message
USDOT U.S. Department of Transportation
UTC Coordinated Universal Time
V2I Vehicle-to-Infrastructure
V2V Vehicle-to-Vehicle
VDT Vehicle Data Translator
VIDAS Vehicle-based Information and Data Acquisition System
VII Vehicle Infrastructure Integration
VIIC Vehicle Infrastructure Integration Consortium
WMT Weather Maintenance Truck
WxDE Weather Data Environment
WxTINFO Weather Response Traffic Information System.
XML Extensible Markup Language
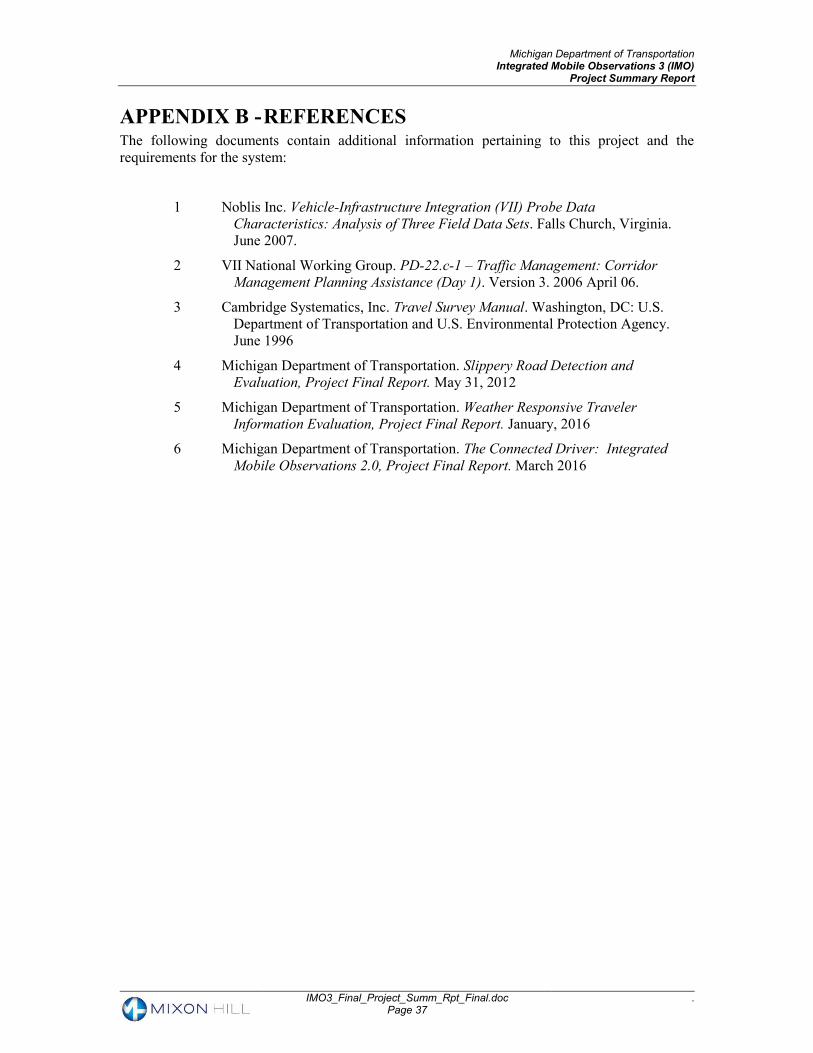
Michigan Department of Transportation Integrated Mobile Observations 3 (IMO)
Project Summary Report
IMO3_Final_Project_Summ_Rpt_Final.doc Page 37
.
APPENDIX B - REFERENCES The following documents contain additional information pertaining to this project and the
requirements for the system:
1 Noblis Inc. Vehicle-Infrastructure Integration (VII) Probe Data
Characteristics: Analysis of Three Field Data Sets. Falls Church, Virginia.
June 2007.
2 VII National Working Group. PD-22.c-1 – Traffic Management: Corridor
Management Planning Assistance (Day 1). Version 3. 2006 April 06.
3 Cambridge Systematics, Inc. Travel Survey Manual. Washington, DC: U.S.
Department of Transportation and U.S. Environmental Protection Agency.
June 1996
4 Michigan Department of Transportation. Slippery Road Detection and
Evaluation, Project Final Report. May 31, 2012
5 Michigan Department of Transportation. Weather Responsive Traveler
Information Evaluation, Project Final Report. January, 2016
6 Michigan Department of Transportation. The Connected Driver: Integrated
Mobile Observations 2.0, Project Final Report. March 2016