Embed Size (px)
Citation preview

TF t::.:_;:t ,6
i I I i I i L
'
i !
MICHIGAN DEPARTMENT . .
TRANSPORTAT\ON UBRARY lANSING 48909
/
MICHIGAN TRANSPORTATION ENERGY CONTINGENCY
ANALYSIS
Michigan Department of Transportation Bureau of Transportation Planning

MICHIGAN DEPARTMENT OF
TRANSPORTATION
In Cooperation With:
Federal Highway Administration
~1ICHIGAN TRANSPORTATION ENERGY CONTINGENCY ANALYSIS
This report represents the findings and/ or professional' opinions of the ~1ichigan Department of Transportation and not an official opinion of the State Transportation Commission.
State Transportation Commission
Hannes Meyers, Jr., Chairman Carl V. Pellonpaa, Vice Chairman
William C. Marshall Lawrence C. Patrick, Jr.
DIRECTOR
John P. Woodford
Weston E. Vivian Rodger D. Young

Technical Report Documentation Page
l 1. Report No. 2. Government Accession No. 3. Recipient's Catalog No.
FHWA-Ml-82-1 ~
4. Title ond Subtitle 5. Reporl Datu
Michigan Transportation Energy November. 1981 Contingency Analysis 6. Performing Organization Code
8. Performing Orgoni:zotion Report No. 7. Author~s) s. Mortel, S. Cornell, R. Kruse,
r, Robinson L. Averill R. Hull 9. Per_formlng Organization Nome ond Address 10~ Work Unit No. (TRAIS)
Michigan Department of Transportation Ml HPR-PR-0010(3} 425 West Ottawa 11. Contract or Grorlt No.
Lansing, Michigan 13. Type of Report and Period Covered
12. Sponsoring Agency Name and Address
Federal Highway Administration Final 315 W. Allegan St. P.O. Box 10147 14. Sponsoring Agency Code
Lansing, MI 48901 FHWA 15. Supplementary Notes
16. Abstract This report, prepared by the Michigan Department of Transportation, discusses measures intended to reduce transportation fuel consumption during an energy emergency. The measures evaluated in this study are transit, ridesharing, parking management and traffic flow improvement measures. In a 11, 26 measures were evaluated to determine their cost, feasibility, and potential fuel savings.
These evaluations were made using the Lansing, Michigan Tri-County area as a typical urban area so that actual community information could be used.
This study found that 10 of the measures can best be implemented at the state level, 9 can best be implemented at the local level, and 7 should not be implemented.
The measures implemented at the state level will save about 1.5 million gallons of gasoline in the Lansing Tri-County area during a 90 day energy emergency. Estimates were also made of savings which could accrue from local measures. These savings were not summarized since the degree of use of these measures will depend upon local conditions.
I
17. l<ey Wards 18. Distribution Statement
Energy Contingency Analysis No restrictions Shortage Response Fuel Consumption
19. Security Classif. (of this report) 20. Security Clossif. (of this poge) 21· No. of Pages 22. Price
L unclassified unclassified
Forrn DOT F 1700.7 !8-721 Reproduction of completed poge ·authorized

I : ~
Acknowledgments
Prepared by: The Bureau of Transportation Planning, Michigan Department of Transportation
In cooperation with the Energy Administration, Michigan Department of Commerce
This plan was prepared by the Energy and Air Quality Unit, Transportation Planning Services Division, Susan Mortel, supervisor, Sandra Cornell, Ron Kruse, Glenn Robinson and Lisa Averill, staff. Robert Hull performed the transit computer modeling. Staff of the Social and Economic Studies Section provided research assistance.
Jeffrey Pillon, Energy Administration also provided assistance in preparing this document, along with staff of Multi-Regional, Statewide and Modal Planning, Bureau of Transportation Planning. The Tri-County Regional Planning Commission and the Capital Area Transit Authority also provided information and expertise.
November, 1981
',-!
TABLE OF CONTENTS Chapter
EXECUTIVE SUMMARY
I. INTRODUCTION . . . • . . . . . . . . . . . . . . . . . . . . . . . . . . . . . . . . . . . . . . . . . 3
II. FUEL CONSUMPTION INVENTORY Statewide • . . . . . • • . . . . . . . . . • . . . . • • . . . . . . . . . . . • • . . . . . . . . . 9 Urban Area . . . . • • . . . . . . . . • • • . . • . . . . . . . . . . . . . • • . . . . . • • . . . 23
II I. ECONOMIC ANALYSIS . . . • • . • . . . . . . . . . . . • • . . . . • . . . . . . . . . . . . . . . 31
IV. ANALYSIS OF MEASURES ..•..••..•..•...•••.•..•........•... 43
V. TRANSIT '··1 Increase Transit Service Based On Demand . . . . . . . . . . . . . . . 49
Use School Buses as Transit Vehicles ................... 55 Use Community Organizations' Vehicles for Transit ...... 59 Move Additional Transit Equipment to Most Hard Hit Areas. . . . . . . . . . . • • . . . . . • . . . . . . . . . . . • . . . . . . . . • . . . . . . . . . . 63
Increase Park-and-Ride Facilities....................... 65 Promote Improved Taxicab Utilization . . . . . • . . . . . . . . . . . . . 67
VI. RIDESHARING Provide Public Information •............................ 75 Increase Employer Based Carpool Programs ............... 79 Increase Areawide Carpool Program . . . . . . • • . . • . . . • . . . . . . . 83 Increase Vanpool Programs for the General Public ....... 85 Increase Rural Carpool Parking Lots . . . . . . • . . . . . . . . . . . . . 91 Promote Flex-Time Scheduling for State Employees ........ 95 Promote Flex-Time Scheduling for the General Public 99
VII. PARKING MANAGEMENT Use the State Parking Structure As A Rideshare
Incentive ..••................•.....................•. 107 Provide Premium Parking for Carpools .••.•.....•........ 111 Set Differential Rate Structures for Parking ........... 113 Restrict Parking in Downtown Areas ..................... 115 Limit The Use of Parking Structures to Carpools Only ... 117 Close Parking Structures ................•.............. 119 Reduce High School Student Commuting ....•.............. 121 Charge Fees for Parking at Shopping Malls .....•.•...... 123
VIII. TRAFFIC FLOW IMPROVEMENTS Ban Parking On Major Routes ............................ 131 Switch Traffic Signals to Flashing Yellow ....•......... 133 Ban Left Turns To Improve Traffic Flow .•.•...•.•....... 137
IX. SUMMARY AND RECOMMENDATIONS .•.••..........••.•........... 141
APPENDIX A- ONGOING CONSERVATION PROGRAMS ..................... A-1
APPENDIX B - ESTIMATION OF AIR QUALITY AND FUEL CONSUMPTION BENEFITS OF EMPLOYER BASED RIDESHARING PROGRAM ..... B-1
APPENDIX C - TRANSIT - METHODOLOGY FOR FUEL SAVINGS CALCULATIONS ...................................... C-1

1 2 3
4 5 6 7 8 9
10 11 12
TABLES
Estimated Mode Split By Trip Length and Trip Purpose Statewide Fuel Consumption . . . . . . . . . Annual Vehicle Miles of Travel on Trunkline and
Se 1 ected County Roads . . . . . . . . . Lansing 1980 Fuel Consumption by Vehicle Type . . . . Lansing - 1980 Fuel Consumption - Location vs. Road Type Lansing - 2000 Fuel Consumption by Vehicle Type ... Lansing - 2000 Fuel Consumption - Location vs. Road Type. On-Road Fuel Economy Estimates • . . . . . . • . . Emergency Transit Savings . • • . . . . .. Vanpool Fuel Savings • . . . . . • . Rural Carpool Parking Lots - Costs and Fuel Savings .. Fuel Savings From Conversion of One Signal to Flashing
Yellow on a Major Arterial . . . . . . . .
Page 20 21
21 24 27 27 27 28 53 88 93
135

Figure
l 2 3 4 5
6 7
8
9 10 11
12
ILLUSTRATIONS
Michigan's Statewide Transportation Modeling System •. 547 Zone - Statewide Transportation Modeling System Map 547 Zone - Outstate Analysis Zones. Comparison of VMT Trends ...•.. Gas Consumption Per 1,000 Vehicle Miles as a
Page
. 11
. 13
. 15
. 16
Function of Speed • . . . . . . . . . . . . . .18 Multi-Modal Traffic Assignment Process ............ 19 Capitol Area Regional Transportation Study Traffic Forecasting Model Jurisdiction
Boundaries - Tri County .••........•...... 25 Capitol Area Regional transportation Study Traffic Forecasting Mode Jurisdiction Boundaries - Lansing, East Lansing •.•• Future Costs of Fuel .......•••. Estimated Gasoline Consumption in Michigan, by County Michigan Monthly Gasoline Consumption -
Moving Average of Total ......... . Capitol Area Transportation Authority System Map ...
26 36
39 5'1

EXECUTIVE SUMMARY
This report, prepared by the Michigan Department of Transportation, provides a technical discussion of measures intended to reduce transportation fuel consumption during an energy emergency. These measures were evaluated to determine which can be effectively implemented at the state level, which may be effective when implemented at the local government or business level, .and which are ineffective or too controversial to be implemented.
This work was undertaken because of the requirements of the Emergency Energy Conservation Act of 1979 (EECA) and federal Executive Order 12185 of December 17, 1979. Much of the federal energy conservation effort has been redirected by the Reagan administration which is placing the responsibility of dealing with any energy shortage with the market and states. The EECA still requires that states develop contingency plans.
Michigan has made a committment to Energy Contingency Planning through funding of the Energy Adminstration and renewal of Public Act 38, the Energy Emergency Act. This act provides for the declaration of a state energy emergency and for procedures, powers, duties, and penalities after such a declaration is made. The state of such an emergency will continue until the Governor finds that the emergency no longer exists, or until it has continued for 90 days. The Legislature can end a state of emergency at any time or can extend it for a specific period beyond the 90 day 1 imit.
During the period of this study, many transportation related demand restraint measures were suggested by various persons and organizations. All of the suggestions were considered. Many were found infeasible and were not further considered; others seemed feasible or had been suggested by many sources. All of these measures were evaluated to determine their cost, feasibility, and potential fuel savings. These measures are discussed in this report.
With the deregulation of gasoline prices, gasoline shortages will produce substantial price increases. We predict that a 20 percent shortage of gasoline will produce a retail price of $3.90 per gallon when the base price is $1.30 per gallon. This price pressure will affect the way that people respond to an energy emergency and will affect the relative attractiveness of demand restraint measures. No past periods of fuel shortage compare to the potential situation of a future shortage with unregulated prices. Past experience, therefore, can do no more than provide general guidance on the way that future emergencies will affect Michigan. Even so, it is prudent for Michigan to develop a plan for action in the event that an energy emergency disrupts the state.
The transportation demand restraint measures evaluated in this document are transit, ridesharing, parking management, and traffic flow improvement. In each category several measures were evaluated and are discussed in this report. These evaluations were made using the Lansing Tri-County area as

a sample urban area so that actual community information could be used. All of the evaluations are discussed in this report to make clear to the reader the extent of the analysis, so that the measures which were rejected and the reasons for the rejection would be clear.
Measures which are effective and can best be implemented at the state level are:
1. Use School Buses as Transit Vehicles; 2. Provide Public Information; 3. Increase Employer Based Carpool Programs; 4. Increase Areawide Carpool Programs; 5. Increase Vanpool Programs For the General Public; 6. Increase Rural Carpool Parking Lots; 7. Promote Flex-Time Scheduling For State Employees; 8. Promote Flex-Time Scheduling For the General Public; 9. Use State Parking Structures as a Rideshare Incentive; 10. Switch Traffic Signals to Flashing Yellow.
Measures which are also effective but which can best be implemented at the local government or business level are:
1. Increase Transit Service Based on Demand; 2. Use School Buses as Transit Vehicles; 3. Use Community Organizations Vehicles for Transit; 4. Increase Park-and-Ride Facilities; 5. Promote Improved Taxicab Utilization; 6. Provide Premium Parking For Carpools; 7. Reduce High School Student Commuting; 8. Ban Parking on Major Routes; 9. Switch Traffic Signals To Flashing Yellow.
The measures implemented at the state level will save about 1.5 million gallons of gasoline in the Lansing Tri-County area during a 90 day energy emergency. Estimates were also made of savings which could accrue from local measures. These savings were not summarized since the degree of use of these measures will depend upon local conditions. The state measures described in this report have the potential for greater fuel savings by showing how savings can be accomplished, by encouraging local actions, or by removing state restrictions on local initiatives. These potential effects are described in this report.
Several measures were evaluated and found to present significant implementation problems or to be relatively expensive. None of these measures saved much energy. Implementation of the following measures is not recommended:
1. Move Additional Transit Equipment to Most Hard Hit Areas; 2. Set Differential Rate Structures for Parking; 3. Restrict Parking in Downtown Areas; 4. Limit The Use of Parking Structures to Carpools Only; 5. Close Parking Structures; 6. Charge Fees For Parking at Shopping Malls; 7. Ban Left Turns To Improve Traffic Flow.
I. INTRODUCTION

7 1
\.:
. -!
I.
INTRODUCTION
This document has been prepared by the t·1ichigan Department of Transportation to meet a need for information on which to base decisions. It is the result of research, computer modeling, and analysis relating to possible demand restraint measures for the revised Michigan Gasoline Shortage Response Plan. This report provides the technical basis for decisions concerning which demand restraint measures will be included in the revised Gasoline Shortage Response Plan.
The preparation of Michigan's Gasoline Shortage Response Plan and energy planning is in response to State and Federal legislation. The Emergency Energy Conservation Act of 1979 (EECA) expanded upon the ideas of energy conservation and contingency planning first presented in the Energy Policy and Conservation Act of 1975. The EECA created three program areas: State Energy Conservation Plans, the Emergency Energy Conservation Program, and Standby Motor Fuel Rationing. State and local energy conservation and contingency planning is also required by the Federal Highway Administration (FHWA). The FHWA made this requirement in a policy statement that was issued in response to Executive Order 12185. Former President Carter signed Executive Order 12185 on December 17, 1979 requiring all federally funded programs to incorporate efficiency standards. The Michigan Gasoline Shortage Response Plan will fulfill requirements in the Emergency Energy Conservation program of the EECA and the FHWA policy statement.
The Emergency Energy Conservation Program created under EECA consists of National and State Emergency Conservation Targets, and State and Standby Federal Emergency Energy Conservation Plans. The President may establish monthly emergency conservation targets for any energy source for the nation, or for each state, upon determining that "a severe energy supply interruption ex1sts, or is imminent, or that actions to restrain domestic energy demand are required in order to fulfill the obligations of the United States under the international energy program." State conservation targets would be equal to the State base period consumption reduced by a uniform national percentage. The President may adjust any state base period consumption to the extent determined necessary. Some of the factors used in this adjustment are; reduction in energy consumption already achieved through energy conservation programs, and energy shortages which may affect energy consumption and variations in weather from seasonal norms. The States have 45 days after the date of publicati.on of a target in the Federal Register to submit proposed State Emergency Conservation Plans. If a State fails to submit a plan, or if its plan is not achieving the energy conservation target, all or part of the Standby Federal Emergency Energy Conservation Plan may be imposed by the President.
3

In January 1981, the Reagan Administration removed controls on the price of gasoline. This allows the price to be set by market forces rather than by artifical ceilings. The decontrol of gasoline also eliminated the Mandatory Petroleum Allocation Program which leaves the states unprepared to provide for services essential to the public welfare. Adding to the situation, in April, 1981, most of the measures in the Standby Federal Emergency Energy Conservation Plan were withdrawn. The only measures that survived are Public Information and Minimum Automobile Fuel Purchase. The Standby Motor Fuel Rationing Plan has not received funding for the time consuming pre-implementation work that must be completed before the plan is in standby status. The Reagan administration is placing the responsibiljty of dealing with an energy shortage with the market and the states. However, under EECA the emergency conservation targets and the requirement for state plans still exist.
Michigan has made a committment to energy contingency planning through funding of the Energy Administration and renewal of Public Act 38, the Energy Emergency Act. The Michigan Energy Emergency Act provides for the declaration of a state energy emergency, and for procedures, powers, duties, and penalities after such a declaration is made. A six member Energy Advisory Committee is created of selected department heads and the Chairperson of the Michigan Public Service Commission. The Energy Advisory Committee shall notify the Governor of an impending energy emergency based upon information from the Michigan Public Service Commission, the Energy Administration, other state agencies, federal agencies, and computer information systems. The Governor may declare a state of energy emergency upon notification by the committee, upon his own initiative, or in response to federal targets. The state of an energy emergency shall continue until the Governor finds that the emergency no longer exists, or until it has been in effect for 90 days. After 90 days, the legislature must approve an extension for a specific number of days or the state of energy emergency is terminated. The legislature may also terminate a state of energy emergency any time after it has been declared by the Governor.
The Energy Emergency Act gives the Governor specific and general powers. During an energy emergency, the governor may order restrictions on the use and sale of energy resources. These restrictions may include the following:
1. Interior temperature of public, commercial, industrial, and schoo 1 bui 1 dings.
2. Hours and days during which public, commercial, industrial, and school buildings may be open.
3. Conditions under which energy resources may be sold to consumers.
4. Lighting levels in public, commercial, industrial, and school buildings.
4

5. Use of display and decorative lighting.
6. Use of privately owned vehicles or a reduction in speed limits.
7. Use of public transportation including directions to close a public transportation facility.
8. Use of pupil transportation programs operated by public schools.
The Governor may also direct an energy resource supplier to provide an energy resource to any person or facility which provides essential services for the health, safety, and welfare of the residents of this state. By executive order the Governor may suspend a statute, rule, or order that would prevent, hinder, or delay necessary action in coping with the energy emergency. The governor may issue an executive order, proclamation, or directive having the force and effect of law to implement this act. A person who knowingly violates this act or an order, proclamation or directive issued by the Governor under this act, is guilty of a misdeameanor punishable by a fine.
The Michigan Energy Administration developed the original Gasoline Shortage Response Plan in 1980. The Plan consists of two parts. The Supply Management portion of the plan is designed to respond to gasoline distribution problems. The Demand Restraint part is a list of mandatory emergency energy conservation measures that the Governor can call upon to reduce the demand for gasoline.
The measures that are already a part of the Gas Plan are:
1. Flex-time Scheduling for State Employees- This measure allows state workers to adjust their work schedules to take advantage of ridesharing.
2. State Department Travel Budget Reductions - This measure reduces travel by state employees and will help focus attention on the importance of saving fuel.
3. Increased Enforcement of the 55 mph Speed Limit - "Points" will a 1 so be assessed against drivers who exceed the 55 mph speed limit.
4. Reduce the 55 mph Speed Limit to 50 mph. - This measure will result in "points" for speeders.
5. Extended Gasoline Purchase Plan- This plan limits the number of days private vehicle owners may purchase fuel.
This technical report will include the analysis of additional mandatory and voluntary gasoline demand restraint measures. It will include measures for implementation by the state and local urban areas. The list of measures was derived from a larger list that was a result of individual ideas, meetings, discussions, and the review of other state and local plans. The list was narrowed to exclude measures that required long lead-in times, or incurred high costs for implementation. During the analysis, if any measure was found to be inappropriate for implementation, the analysis was shortened and reasons for eliminating the program were presented.
5

The Gasoline Shortage Response Plan wi.ll be modifi.ed to incorporate measures from this document that can be implemented by the State. It will also include measures that eliminate legal barriers so it is possible for local areas to implement fuel saving actions which are currently prohibited by state law. If an enl!rgy shortage occurs, the Gasoline Shortage Response Plan will provide the Governor with a range of options; voluntary gasoline saving measures, and a list of mandatory measures. Local units of government can use this document to identify measures for inclusion in a local contingency plan. In addition, the Michigan Gasoline Shortage Response Plan will provide advance notice about the type of measures an urban area could expect the state to implement if an energy shortage occurred.
This report has been arranged in the following manner: Chapter I is the Introduction. Chapter II is a Fuel Consumption Inventory and contains fuel consumption data for the state and Lansing, the sample urban area. Data on trip purpose, trip length, and fuel use were obtained from the Statewide Transportation Modeling System, the Urban Highway Network Model and the fuel consumption calculation model; TPFUEL. Chapter III is the Economic Analysis. This section presents information about past fuel shortages, and i denti fi es economic impacts that could be expected in future shortages. The present and future economic climate, supply/demand, and fuel price fluctuations under decontrol are also discussed. Chapter IV; Analysis of Measures, presents an overview of the i ndi v·i dua 1 measures. The next four chapters of the report present the analysis of demand restraint measures grouped ·into categol"ies. The categories are Transit (V), Ridesharing (VI), Parking Management (VII), and Traffic Flow Improvements (VIII). Under each category, analysis methods and assumptions are discussed. Each measure is described in detail including data on implementation procedures, impacts, costs and expected fuel savings. Chapter IX is titled, "Summar·y and Recommendations." Each of the emergency measures will be placed iri one of 3 groups; measures recommended for inclusion in the Michigan Gasoline Shortage Response Plan, measures recommended for further analysis and implementation by local units of government, and measures that are not recommended for implementation
Appendix A is a report entitled "Transportation Energy Conservation" written by the Energy and /\ir Quality Unit staff. This is a review of ongoing conservation activities in the State of Michigan. This report is included for reference purposes.
Appendix B is titled "Estimation of Air Quality and Fuel Consumption Benefits of Employer Based Ridesharing Program". It is an excerpt from 1\ Handbook For Evaluating The A-ir Quality and Energy Impacts of Transportation. System Management Stl"ategies by the Michigan Department of Transportation.
/\ppendix C is titled "Transit-11ethodology for Fuel Savings Calculations". This describes the computer modeling that was performed for the analysis of the transit measures.
6
'
'

II. FUEL CONSUMPTION INVENTORY

II.
FUEL CONSUMPTION INVENTORY
Introduction
This section presents transportation fuel consumption inventories for the State Trunkline System and Lansing; the sample urban area. The inventories at;~. t.o..be 4sed for comparative purposes; to estimate the relative effective~e'ss 'of t~e gasoline use reduction measures. Some of the energy emergency measures are to be implemented statewide, so their effectiveness at reducing fuel use should be measured by comparing the fuel reduction to the estimated state fuel use. Since the Governor has the authority to implement other emergency programs on a case by case urban area basis, other programs must be judged for effectiveness using the Lansing inventory. Similar impacts could be expected in similar sized cities, especially where the work trip is influenced.
Statewide Inventory
The Statewide Transportation Modeling System, as outlined in the following figure, was used to estimate travel by zone, throughout t1ichigan. This model is primarily a tool for predicting travel for the purpose of evaluating highway construction proposals. The model splits the state into 508 geographic zones composed of cities, townships, or aggregates of townships. These zones are displayed on the following map. In addition, 39 zones outside of Michigan are used to account for interstate travel. The out-of-state zones become larger as their distance from ~1ichigan increases and hence their impact on travel with the state diminishes (Figure 3).
The core of the model is highway travel projections on state trunklines. The trip vo 1 ume produced in each zone is a function of zone population as estimated by the Michigan Department of Nanagement and Budget and its accessibility to neighboring population centers. Trips are distributed to the other zones using a version of the standard gravity model.
The gravity model distributes the trips so that travel from one zone to another is directly related to the number of trips generated in each zone and inversely related to the distance (travel time) between the zones. Trends in vehicle miles of travel per capita, derived from on-going Permanent Traffic Recorder and portable machine count data, are used as a control on trip-making potential (see Figure 4). These trends are updated as information becomes available, which results in the model being responsive to the effects of such external forces as increased fuel prices or decreased fuel availability.
After the trips are loaded on the shortest time zone-to-zone paths, the process then predicts for each highway link the 30th highest hourly volume in a year (design hour volume), level of service, and effective operating speed as a function of congestion, and gasoline consumption. The gasoline
9

MICHIGAN'S STATEWIDE TRANSPORTATION MODEliNG SYSTEM
-- ---------------- ---,~----;...-:--.-
liNK PlOTS
SYMAP
OTHEHS

... _,·
,. I'"/
i
s
,,
I
-'~(-1
547 ZONE STATEWIDE TRANSPORTATION
MODELING SYSTEM INSTATE ZONE MAP
MAY 1974
u p
0
0
0
0

FIGURE 3
'•
MICHIGAN'S TRANSPORTATION MODELING SYSTEM
MINNESOTA
545
IOWA 544
MlSSOURI 543
ONTARIO
511
5117 ZONE OUTSTATE ANALYSIS ZONES
KENTUCKY 542
15
NEW YORK 547

en ~ :J _I -CD
1-:::IIi >
__ -, '··-• "''"-'' ,_,_-_,_._,_._ >_<_-~-·-v ,_.,_,_.,. ,_._._, ·~_,.,., __ • -.-.- ·.·.- .-.-,-.- ·>Y•C·:
FIGURE 4
94.0
COMPARISONOF VMT TRENDS.
83.3
72.6
61.9
51.1
1965 1970 1975. 1980
YEAR
16
1985 1990 1995

consumption model was originally developed by the Federal Highway Administration as part of the Highway Investment Analysis Package (HIAP). Its input variables for each link are:
1. Average daily traffic
2. Average speed
3. Type of road (Interstate, Federal-aid Primary, Federal-aid Secondary, urban or rural)
4. Trends in fleet miles per gallon over time
Because the travel forecasting model is calibrated to traffic counts on state trunklines, th.e gasoline consumption prediction is done only for trunkline and principal county roads whose operating characteristics closely parallel .those of the Federal-aid Secondary System. For that reason, the model forecasts only a part of the state's annual fuel consumption. That share appears to be a reasonably consi.stent 47 percent of the sum of taxable gallons of gasoline and diesel fuel. Numbers in the inventory have been factored upward to reflect total highway fuel use by the formula:
Mode 1 Estimates Estimated statewide consumption ~ .47
A few words of caution are in order about certain types of "intuitive" extrapolation of gasoline-model predictions. First, generated travel is a distinctly non-linear function of population and accessibility. Therefore, incremental travel on any given link is not necessarily proportional to the increase or decrease in the population of any or all zones. For example, if the population of every zone were to increase by two percent, it is by no means certain that the travel on any given link or, for that matter, on the system as a whole would increase by exactly two percent. Second, although effective speed is a monotone-decreasing function of volume/capacity ratio, it is piecewise linear and the shape of the curve varies by road type. Thus, a two percent increase in travel will likely produce different amounts of speed reduction depending upon whether a road is multi-lane or two-lane, urban or rural, or wh.ether it was congested or free-flowing originally. Finally, a graph of gasoline consumed as a function of speed looks parabolic. ·The addition of speed change cycles looks more like a second-order polynomial skewed toward the "Y"-axis (Figure 5). Reasonable caution is required in extrapolating model results.
Adding a multi-modal dimension to the Statewide f1odel involves predicting potential diversion from highway to air, rail, and bus as a function of trip purpose and trip length (Figure 6 -Table 1 ). Original modal diversion proportions are derived by MOOT from origin-destination data, but they can be changed to answer "what if" questions from planners and administrators.
17

82
80
78
76
74
72
:l! > 70 = = =. - 68 a: w CL.
"' Q 66 ~ >= 0> "" :;;
::I
"' 64 "' Q ..., w
"' 62 ..... Q
"' <C
"' 60
58
56
54
52
n
GAS "cONSUMPTION PER 1,000 VEHICLE MILES AS A fUNCTION OF SPEED (EQUATIONS ARE TAKEN FROM HIGHWAY INVESTMENT ANALYSIS PACKAGE, APPENDIX B)
LEGEND
Road Type= f.A.J>. {Rural)
Ill OTE: Consumption due to stops & slows are included in calculations.
:::!
"' c:
"' m

STEP 1 Statewide Trip Generation-Distribution Model
Trip Table
MULTI-MODAL TRAFFIC ASSIGNMENT PROCESS
STEP 2 ·Trip Purpose Split
Work/ Shop
Vacation
Other
STEP 3 STEP 4 Mode Split T raflic Assignment
~ ..... ll .. -AJilA.O'.-.................................. .._. • . : : Auto .
Bus I L,.____;;=--
.___;_;:Ra::.il _ _JN Air
VJ~.-__ A_u_to __
: Multi-Modal Network H~.-__ _;_Bu_;_s __ ...J 1) Highway
, • -:------Jo--1 2) Bus
~ ~H: Rail 3) Rail j ~ 4) Air ' N Air ~..-__ ;:__:,:;;_ ___ ..J
• . .
. .
Auto
. ...._._. ................ ..._ ..... _.._. .... _...._ ................ ~ • 2 G c J p
c

TABLE 1
ESTIMATED MODE SPLIT BY TRIP LENGTH AND TRIP PURPOSE
~10DE SPLIT PERCENTAGES
TRIP TRAVEL TRIP LENGTH (MINUTES OF AUTO DRIVE TIME) PURPOSE REDUC. MODE 0-30 31-60 61-90 91-120 121-300 300+
AUTO 93.01 93.02 97.0 94.0 91.0 84.0
"" BUS 5.0 2.0 1.0 2.0 4.0 4.0 "" 0 3:
0% RAIL 0.0 0.0 2.0 4.0 4.0 4.0
AIR 0.0 0.0 0.0 0.0 1.0 8.0
z: AUTO 100.0 99.0 97.0 96.0 93.0 87.0 0 ~
>-- BUS 0.0 1.0 1.0 2.0 4.0 4.0 "" u
"" > 5% RAIL 0.0 0.0 2.0 2.0 2.0 2.0
AIR 0.0 0.0 0.0 0.0 1.0 7.0
AUTO 95.0 99.0 97.0 93.0 90.0 84.0
BUS 5.0 1.0 1.0 3.0 4.0 4.0 "" w :c 5% RAIL 0.0 0.0 2.0 4.0 5.0 5.0 >--0
AIR 0.0 0.0 0.0 0.0 1.0 7.0
1. Includes two percent shift to carpools
2. Includes a five percent shift to carpools
20

'
r, ''· '
TABLE 2
Statewide Fuel Consumption ( 1000 ga 1 s . )
Fuel Use Based On Fuel Use Based On Dept. of Management Fuel Use Based High Population and Budget Population Low Population
Year Projection Projection_ ______ Projection
1980 4,596,321 (2,187,849) pop. 9,258,344
1990 3,147,281 3,101,749 3,038,306 (1 ,479,222) (1,457,822) ( 1 ,428,004) pop. 10,300,000 pop. 10,045,759 pop. 9,810,000
2000 2,918,226 2,842,819 2,766,817 (1 ,371 ,566) ( 1 , 336 , 12 5) (1,300,404) pop. 10,770,000 pop. 10,504,543 pop. 1 0, 1 50 , 000
Figures in parentheses are model projections; top figures have been expanded to include fuel use on all roads.
Year
1980
1990
2000
TABLE 3
Annual Vehicle Miles of Travel on Trunk1ine and Selected County Roads
(Thousands)
VMT Based On High Population
Projection
39,466,886
44,140,1 01
VMT Based On Dept. of Management and Budget Population
Projection
38,044,151
38,914,827
42,915,287
21
VMT Based On Low Population
Projection
38,084,322
41,683,746
On

The 1980 fuel consumption estimates in Table 2 were produced by the Statewide Transportation Mode1ing System and were adjusted upward to approximate fuel use on all roads in Michigan. The 1980 es:imate is within five percent of the actual amount of gasoline and diesel fuel taxed by the State in 1980. The model does not separate gasoline and diesel fuel use.
Three population projections were used to estimate a range of future year fuel use. Note that both VMT (Table 3) and population estimates increase in the future, while fue 1 use decreases. This is because fleet fue 1 economy will increase as fuel efficient vehicles become a larger percentage of the fleet. For all cases, the U.S. Department of Energy approved fuel consumption rates were used in the calculations of total gallons. These fuel consumption rates are adjusted to reflect on-the-road fuel consumption rates, rather than the Environmental Protection Agency's estimated highway mileage rates.
The results reflect conservative fuel consumption estimates under current energy supply conditions and current mode split percentages (Table l ). The higher and lower limits of the projections can be obtained by multiplying the gallonage by 1.058 or .894.
22

Lansing Fuel Consumption Inventory
Fuel consumption inventories for the Lansing urban area (Eaton, Clinton and Ingham Counties) were prepared with estimation procedures currently used in the urban transportation planning process, undertaken cooperatively with local planning officials of the tri-county area and the Michigan Department of Transportation (Figures 7 & 8). The procedures required for the preparation of the fuel use inventories included:
1. A detailed forecast of urban travel on Lansing's streets and highways for the years 1980 and 2000.
2. The application of appropriate fuel consumption rates, encompassed in a computerized fuel consumption model, to the urban travel forecasts.
Travel Forecasts
Projections of land use variables related to trip making activities have been prepared for the Lansing urban area on a small area basis. Estimates of auto ownership, population, and employment data for each of 465 sub-areas (traffic zones) in the Lansing urban area were used to quantify the demand for travel used in the preparation of the fuel consumption inventories. Mathematically derived relationships between the levels of trip making and land use activities, developed from survey data, were used to generate travel demand in each of the region's traffic zones. The number of trips generated in each traffic zone were then distributed to other zones using a "gravity model" approach, as described in the previous section, creating interchanges of estimated trip volumes between geographic areas. The zonal interchanges of trips were then assigned to Lansing's street and highway system in coded form, via a "minimum time path" technique.
The output of this technical process is an estimate of the average daily traffic volumes which will occur on segments of the street system in the Lansing area in the forecast years.
Fuel Consumption Estimates
Fuel consumption estimation procedures for urban areas are similar.to those described in the previous section for state trunkline analysis. The input variables for fuel consumption analysis on urban street segments are:
1 0
2. 3. 4. 5.
Average daily traffic Posted speeds Type of road (freeway, ramp, major-minor arterials, collector) Location of road (CBD, urban fringe, suburban, rural) Trends in fleet miles per gallon over time
23
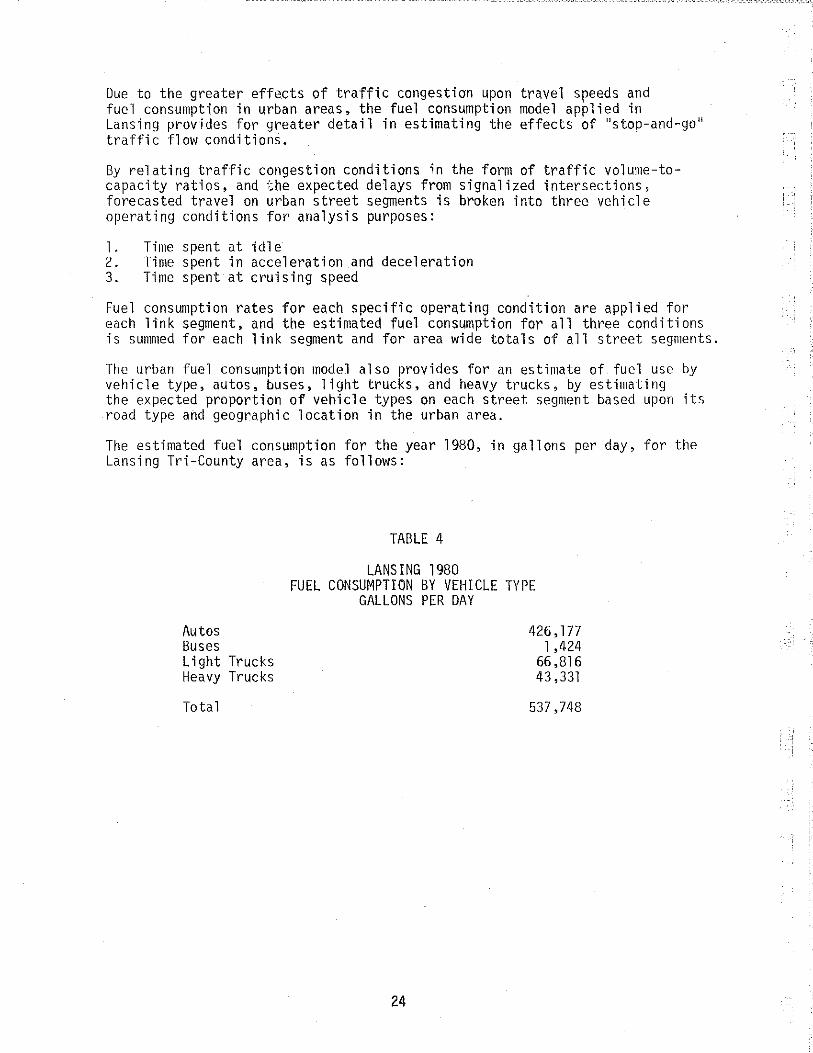
Due to the greater effects of traffic congestion upon travel speeds and fuel consumption in urban areas, the fuel consumption model applied in Lansing provides for greater detail in estimating the effects of ''stop-and-go'' traffic flow conditions.
By relating traffic congestion conditions in the form of traffic volume-tocapacity ratios, and ;;he expected delays from signalized intersections, forecasted travel on urban street segments is broken into three vehicle operating conditions for analysis purposes:
1. Time spent at idle 2. Time spent in acceleration .and deceleration 3. Time spent at cruising speed
Fuel consumption rates for each specific operating condition are applied for each link segment, and the estimated fuel consumption for all three conditions is summed for each 1 ink segment and for area wide totals of all street segments.
The urban fuel consumption model also provides for an estimate of fuel use by vehicle type, autos, buses, light trucks, and heavy trucks, by estimating the expected proportion of vehicle types on each street segment based upon its road type and geographic location in the urban area.
The estimated fuel consumption for the year 1980, in gallons per day, for the Lansing Tri-County area, is as follows:
Autos Buses Light Trucks Heavy Trucks
Total
TABLE 4
LANSING 1980 FUEL CONSUMPTION BY VEHICLE TYPE
GALLONS PER DAY
24
426,177 1 ,424
66,816 43,331
537,748
' ' '

CAPITOL AREA REGIONAL TRANSPORTATION STUDY TRAFFIC FORECASTING MODEL JURISIDICTION BOUNDARIES
! , _____________ ..,... __________ ...... _________ ""11
1...... ... "1: .. .' I· k"li.·~· · ~ ... ', v-: . .
... . ;; c"'\. ""
Key t
25 FIGURE 7
---------

CAPITOL AREA REGIONAL TRANSPORTATION STUDY TRAFFIC FORECAST! NG 'V\ODEL JURISIDICTION BOUNDARIES
26
I ® I
Key 1 • CEI\''r~AL BUSINESS
o;STRJCT
2· 5 · URBAN FRINGE
TRI·COUNTY STUDY AREA LANSING AND EAST LANSING
ldiCtl!GA~
SlATE IIOGHWA~ COidMISSIO~ ..... ,.,,.., •• ""' .... v ...
HIGH\1/A,;:..!,L~~~.~.£ .. ~l.lliVn ·:,:::::'-:::.: .::::;;:.~-;:, .. ...,,...
FIGURE 8
(. 1
\ .,
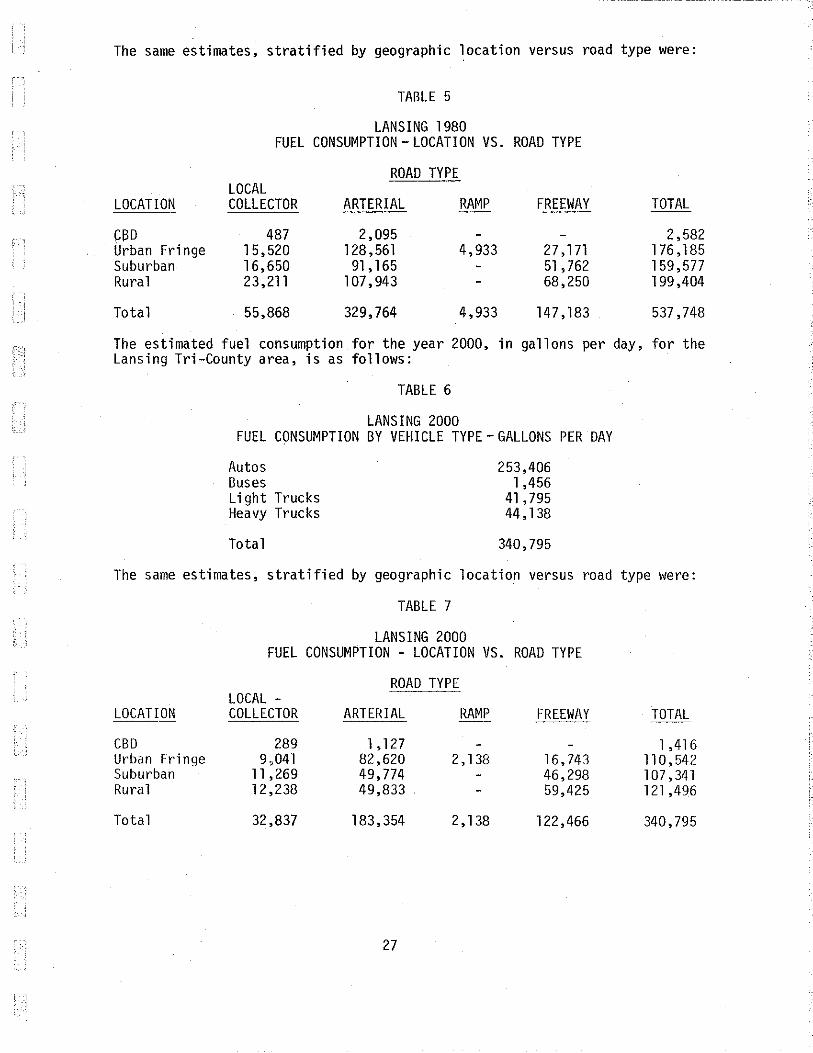
The same estimates, stratified by geographic location versus road type were:
LOCATION
CBD Urban Fringe Suburban Rural
Total
TABLE 5
LANSING 1980 FUEL CONSUMPTION- LOCATION VS. ROAD TYPE
ROAD TYPE LOCAL COLLECTOR ARTERIAL RAMP FREEWAY
487 2,095 15,520 128,561 4,933 27 '171 16,650 91 '165 51 '762 23,211 107' 943 68,250
55,868 329,764 4,933 147' 183
TOTAL
2,582 176 '185 159,577 199,404
537,748
The estimated fuel consumption for the year 2000, in gallons per day, for the Lansing Tri-County area, is as follows:
TABLE 6
LANSING 2000 FUEL CONSUMPTION BY VEHICLE TYPE- GALLONS PER DAY
Autos Buses Light Trucks Heavy Trucks
Total
253,406 1 ,456
41,795 44' 138
340,795
The same estimates, stratified by geographic location versus road type were:
LOCATION
CBD Urban Fringe Suburban Rural
Total
TABLE 7
LANSING 2000 FUEL CONSUMPTION - LOCATION VS. ROAD TYPE
ROAD TYPE LOCAL -COLLECTOR ARTERIAL RAMP FREEWAY
289 1 , 127 9,041 82,620 2' 138 16,743
11 '269 49,774 46,298 12,238 49,833 59,425
32,837 183,354 2,138 122,466
27
TOTAL
1 ,416 110,542 107,341 121 ,496
340,795

The estimates of future on-road fuel economy, given in miles per gallon, which were used in the estimation process, were as follows:l
TABLE 8
ON-ROAD FUEL ECONOMY ESTIMATES FLEET AVERAGES, IN MPG
Year Auto MPG Lt. Trk. MPG Hvy. Trk MPG
1975 1 3. 31 0 12.61 0 5.070 1976 13.490 12.740 5.050 1977 13.760 12. 960 5.090 1978 14. 120 13.260 5.160 1979 14. 530 13. 580 5.220 1980 15.110 14.040 5.300 1981 15. 920 14.700 5.390 1982 16.870 15.480 5. 510 1983 17. 930 16. 380 5.670 1984 19.150 17.400 5.850 1985 20.510 18.540 6.060 1986 22.030 19.820 6.200 1987 23.560 21.100 6.350 1988 25.080 22.390 6.490 1989 26.610 23.670 6.640 1990 28.130 24.950 6.780 1991 29.170 25.870 6.830 1992 30.210 26.790 6.880 1993 31.240 27.720 6. 930 1994 32.280 28.640 6.980 1995 33.320 29. 560 7.030 1996 33.640 29.870 7.040 1997 33.950 30.180 7.050 1998 34.270 30.480 7.070 1999 34.580 30.790 7.080 2000 34.900 31. l 00 7.090
l United States Department of Energy, Fourth Quarterly Report - Highway Fuel Consumption Model, July 2, 1981.
28

III. ECONOMIC ANALYSIS

I I I.
ECONOMIC ANALYSIS
Introduction
Three times in the last forty years there has been less gasoline available than American motorists would buy at the prevailing price. Each time this led to reduced travel, harm to business, inconvenience, and some change to behavior patterns. Short term shortages are almost certain to happen again, and the behavior of people and markets during previous shortages may offer help in planning to reduce the effect of coming shortages. The following analysis presents information about past fuel shortages, their economic consequences, and the likely effects of future shortages on the nation and on Michigan.
PREVIOUS GASOLINE SHORTAGES
1942-45
Gasoline was rationed during World War II and a national maximum speed limit of 35 mph was imposed. In comparison with the other events of the time this was only a minor irritation, but it provides the only example of highway user behavior at a time of a protracted absolute fuel shortage in America. Although the steps that were taken appear drastic now, their effect was less noticeable in the 1940's than less severe measures would be today. Roads were less adequate, speeds lower, and automobiles fewer. City mass transit systems were at the peak of their extent and capacity, and intercity trains were still available. In general, alternatives were available for many of the trips that could not be made by car. Compliance with the clumsy rationing system was good, because of the importance of saving gas. The virtual elimination of recreational travel and disarrangement of buying patterns because of the gasoline shortage was not noticeable in the larger, national shift to a war economy. Growth of all sectors of the economy after the war erased traces of the effects of gas rationing and other wartime shortages.
1973-4
Petroleum importation began in the 1950's, when oil could be produced more profitably abroad than in the United States. Importation increased when American oil fields could no longer produce the amount of fuel demanded at the regulated price. The real price of gasoline remained practically constant, and even fell a little between 1945 and the early 1970's. With rising incomes the cost of gasoline became insignificant for large segments of the population. The price of fuel was not a consideration when Americans bought large cars, built freeways and airports, built low-density suburbs, de-emphasized city transit systems, and abandoned central city merchandising and manufacturing plants. In short, most of the trillions of dollars invested in this country in the past thirty years are invested in a system of commerce that cannot be used without petroleum. Because the price of fuel was artifically low, neither business nor government had any incentive to make investments. in improved efficiencies. This incentive was provided when Arab countries ceased exporting oil to allies of Israel in October, 1973.
31
During the Arab oil embargo world production of oil dropped by 4 million barrels per day and United States imports were reduced by 18 percent. On an international level, other factors such as crop failure, devaluation of the American dollar, and phase out of wage and price controls served to worsen the economic climate and force the U.S. economy into a recession. In 1974 the Gross National Product declined at a 7.5 percent annual rate and unemployment increased by .5 percent.
The shortage caused a significant drop in highway travel, since discretionary trips were curtailed because of the inability to purchase gas, or the uncertainty of the supply away from home. The industries that were hardest hit were those directly centered around petroleum use (auto, rubber, steel) and those where consumer purchases were easily postponed. Other industries producing consumer durables also suffered.
The price of fuel also escalated. The immediate increase was caused by the shortage, but prices continued to spiral even after the embargo ended. The cost of U.S. imports of fuel and lubricants rose from $7.1 billion in 1973 to $23.9 billion in 1974. Even after oil prices stabilized in 1974, the price of petroleum based products continued to rise. The price for petrochemical feed stocks, plastics, synthetic rubber, and pharmaceutical supplies increased at double digit rates. Wage and unemployment effects were still being felt a year later. In 1974, wages el<ferienced the largest increase ever, and umemployment rose to a record 8.5 percent.
By late 1975, the supply of gasoline was again adequate, and the price was about 65¢ per gallon. Travel resumed its historic rate of increase, demand for large cars returned, and, in general, the markets dependent on petroleum behaved as before. People were aware that conditions had changed, but there was little observable change in their travel habits.
1979
In late 1978, the Iranian revolution halted exports from that country to the U.S. At the time, Iran was supplying four to five percent of American oil. Even though the absolute shortage was not as severe as the 1974 shortage, refiners diverted a greater percentage of their stocks to production of heating fuels to assure a supply during the winter. This left motorists with uncertain supplies during the early summer of 1979. The behavior of 1974 was repeated, although this time different parts of the county were affected, and for a shorter time. Discretionary travel was once again cut back. The shortage was over by the end of the summer, but, as in 1974-1975, was followed by prices up to 35 percent higher. The awareness of the fragility of gasoline supplies was reinforced. Iranian oil remains unavailable, although supplies were replaced without difficulty from other sources.
Public Perceptions of the 1973-74 and 1979 Gasoline Shortages
Public attitudes and behavior regarding energy shortages and conservation have been documented. This is especially true of the 1973-74 gasoline shortage. At the time of the Arab oil embargo, few people perceived the shortage to be
2 Congress of the United States, Congressional Budget Office, ''Managing Oi 1 Disruption; Issues and Po 1 icy Options , " September, 1981.
32
-l
-, I

as severe as reported by the press. Although the average wait in service station lines increased from zero to twenty minutes, most households felt they could purchase gasoline most of the time. Generally, the public felt that the shortage was contrived and a mere inconvenience, and would not allow it to significantly affect their lifestyles. About 22 percent of the public felt that they had been greatly affected by the shortage, or gasoline availability would remain critical in the years following. Long lines at the service stations were more important than high prices and just being able to purchase gasoline was more important than both of these factors in affecting travel demand. Inadequate gasoline supply, more than high prices, resulted in a reduction in trips and a change in travel habits. Apparently the demand for gasoline was inelastic as to' price within the 40 percent increase experienced during 1974.
The energy shortage caused some changes in driving behavior and public attitudes towards certain policies. Approximatley 80 percent of the general public felt that the way to conserve gasoline was to cut down on pleasure driving. Eighty-four percent of the car owners surveyed either drove less (74 percent) and/or drove slower (10 percent).3 In the long run, fuel price increases and energy awareness have resulted in a vehicle fleet turnover in favor of smaller, more fuel efficiert cars.
Although there were some changes in public behavior in order to conserve gasoline, in certain areas the shortage had little impact. Non-work trips showed a marked reduction, but the shortage had little effect on the journey to work. Non-discretionary trips (work trips, etc.) were evidently considered more important than discretionary trips, (recreational trips, etc.). Therefore, most travel cuts were in discretionary travel. In Michigan, this was demonstrated by decreasing traffic volumes on major tourist routes. Though households were aware of the restricted supply, only slightly less gasoline was purchased during the 1979 shortage compared to the year before.
FUTURE SHORTAGES
Current world oil production stands at approximately fifty-nine million barrels per day. Each of 16 nations produces two or more percent of this supply. Most of the suppliers are geographically remote to the U.S. and some producers are in politically unstable areas of the world. Given these conditions, instability in the world oil market may come from many countries.
At present there seems to be no reason to expect curtailment of shipments from Canada, Nigeria, Algeria, Saudia Arabia, or Venezuela. These are the United States' major foreign suppliers. Shipments from Mexico may be increased. However, world politics are unpredictable, and further war in the Middle East or other disturbances could cause another shortage at any time. Manipulation of supplies by cartels of countries, or companies could cause artifical shortages.
National Economic Effects of Future Energy Shortfalls
A petroleum shortage will affect the United States' economy in several ways. As in previous shortages, industrial output and employment will be reduced, inflation will increase, and the flow of income will be redirected.
3 Opinion Research Corporation, "General Public Attitudes and Behavior Regarding Energy Savings," April, 1975.
33

According to a recent Congressional Budget Office study, petroleum shortfalls reduce manufacturing, particularly in industries dependent on oil. Second, consumer demand is reduced due to price increases. A shortfall and subsequent price increases combine to transfer large amounts of real income from consumers to oil producers. This in turn, reduces consumer purchases, which further depresses production and employment.
As the price of oil increases during a shortage, inflation will increase. Transportation related industry and personal travel will be particularly hard-hit since there is no readily available substitute for gasoline. Certain activities requiring mobility and orivate vehicle use may be curtailed. This will further extend the economic impacts of the shortage.
The flow of income in an energ;r shortage is changed on international, national, and individual levels. Fuel price increases cause more income to flow from oil purchasing nations to oil producing nations. Large outflows of cash have a depressing effect on the United States economy and negative effects on the balance of payments. In addition, domestic oil producers experience substantial profits from abrupt price increases. Regional income distribution inequities have been a source of congressional concern for quite some time and the windfall pro"its tax was designed to limit the transfer of income resulting from the decontrol of oil prices.
Individual consumers are also affected unevenly by oil price increases. The increases force families to spend a larger portion of their real incomes on home heating and transportation fuel. The poor spend a disproportionate amount of their income on fuel. There are geographic differences too. For example, consumers in the northeast spend a larger portion of their income on fuels than do consumers in warm regions of the United States.
There are three additional factors that will influence economic conditions in an energy emergency.
l. In prior shortages stockpiles were low.
2. In prior shortages the International Energy Agency (lEA) did not invoke the energy sharing agreement to which the United States is a party.
3. Oil prices have been decontrolled.
Under the Reagan administration, the Strategic Petroleum Reserve (SPR) has been designated as a major component of the national energy policy. The reserve is to be built up to 400 million barrels of oil by 1985. The United States was caught with low reserves in 1979 due to record high fuel consumption in 1978. The SPR is supposed to protect against the reoccurance of a shortage at low reserves. Although the impact of the reserve in an energy crisis has not been tested, the reserve is expected to lessen the severity of a shortfall and provide a buffer to modify price increases.
34

I
The International Energy Agency has tried to increase the unity among oil consuming nations with an agreement which mandates oil sharing among signatory nations when any one nation experiences a seven percent oil shortage. This agreement has never been invoked. If the sharing agreement were invoked, the United States would likely be obligated to share available supplies, substantially altering the market conditions and perhaps worsening the United States' condition.
Finally, in previous shortages, artifical constraints were placed on oil prices in the form of domestic price controls. Although prices increased, prices remained within reach of most incomes and consumers continued to buy. Now the prices are decontrolled and the pricing of oil is a subject of speculation. Prices may increase at record high rates during a shortage.
Price Effects of An .Energy Shortfall
The announcement of an imminent energy shortfall will have an immediate effect of increasing the world price of crude oil in the oil spot market. This will increase the value of oil supplies and inventories held by oil companies both within the United States and en route to the United States. Because of this, oil companies will be able to charge more per barrel of oil (and hence gallon of gasoline) and will need to manage supplies domestically even before the actual shortfall is felt at United States borders. Economic effects will be felt almost as soon as the shortage is announced.
The amount of oil held by oil companies in reserve, and the extent of the price increases seen at the gasoline pump prior to actual fuel unavailability is not predicted in this report. This is because the results are highly dependent upon the Reagan Administration's future energy policy and the supply arrangements of each oil company at any given time.
An energy shortfall, for the purpose of this analysis, is defined as a condition where there is considerably less gasoline available than consumers plan to use at a particular time of year. This definition accounts for the monthly variability of gasoline consumption, and reflects consumer demands for different types of travel at different times of the year. The shortfall will not be quantified in terms of a percent reduction in availability.
The energy shortage price analysis makes the following assumptions:
1. The availability of gasoline has decreased.
2. The price of gasoline is not controlled by the government. Under previous embargo or shortfall conditions, the pump price of gasoline was regulated by the federal government. It is assumed that the price controls lifted in 1981 will not be reimposed.
3. The duration of the energy emergency is anticipated to be less than two years. A negligible improvement in fleet fuel economy is experienced during the shortage. Thus the price response is short-term rather than long-term.
Gasoline price increases can be estimated by the use of price elasticity measurements. Elasticity is a measurement of the relative change of the
35

quantity of gasoline demanded in resonse to a change in gasoline price. Various studies have been performed which estimate the price elasticity of gasoline, The use of a range of assumpt1ons, conditions, and data have generated estimates of the short-term elasticity of between -.1 and -.35.
The relationship between elasticity, shortage, and cost is indicated in Figure 9.
4.
5.
2.
1.
cosr a0x .. c OOLL..ARS 1 '•,
tGY.
...
F""XGO.WFQ:E: COi
FUTURE COSTS OF F"Wf=:L.
·- ... ·-.. ····--... ... ·····
·-..... ...... ··- ···--
.. . .. . '" S:HORTF"A\...1- .......... . ..............
. .. --. ...... .............
·······---·--···-
"'. -1--·---+----+---l-----+----+----1---·-1 "· . I .2 .6
.<115 . IG -26 . 56
ELASTICITY
For an old pr-ice of $1.30 per gallon, a shortage of 20 percent and an e·lasticity of .10, the new price would be $3.90 per gallon.
Thus the increase in gasoline prices during a shortfall may be quite dramatic. However, the actual price increase caused by an energy shortfall cannot be estimated accurately from historical information because there has never been a shortfall as large as 20 percent and because the price of gasoline was contmlled by the government unti'l late 1980. Therefore, extrapolation from historical experience is necessary and considerable precision is lost. The control of prices tends to restrict price movements, and hence causes one to overestimate elasticity, and under estimate the price increases which will occur under deregulated conditions. Consequently, the actual price increases resulting from a gasoline shortfall are more likely to be closer to the previously calculated $2.60 per gallon, than to $.74 per gallon.
If the above price elasticity is applied to '1980 fuel consumption the total increase in the cost of travel can be estimated. In 1980, 3,972 million gallons were taxed at an average pr·ice of $1.28 per gallon (December 1981 AAA Fuel Gauge Survey). Consumers spent over $5 bill ion on gasoline that year. If that supply had been cut by 20 percent and elasticity were -.10, the gaso.line price would have increased to $3.86 per gallon, and consumer·s would have had to have spent $12.2 billion on gasoline expenditures. This is an 1ncrease of 140 percent 111 cost coupled with a 20 percent reduction in travel.
36

' \
As explained previously, an increase in gasoline prices of this magnitude would have significant impacts (both short and long run) upon the consumer nomimal and real incomes, and distant family buying patterns. People will necessarily be forced to cut back on· their purchases of both gasoline (because the gasoline would not be available) and other commodities (because gasoline purchases would now constitute a much larger expenditure in their budgets).
The Effects of Price Increases on Economic Activity and Travel in Michigan
In previous energy crises, both the automobile and tourist industries were subjected to significant slowdowns. The 1974 oil embargo caused employment to fall 36 percent in the Michigan auto industry, partially because of consumer reluctance to buy large, low-mpg automobiles then made predominantly by the domestic auto producers, and partially due to their costs. In the summer 1979 crisis caused by the Iranian Revolution, auto employment fell again, and the Michigan economy fell into a recession. Both of these crises were met by United States auto producers with rebate plans designed to induce consumers to buy their inventories of larger vehicles. The latter crisis was also accompanied by comparatively lively sales of smaller, higher gas mileage foreign automobiles. This increased the market share of foreign cars in the United States market. In the event of an energy shortfall, auto industry and other consumer durable goods manufacturing industry employment will fall due to the decline in consumer purchasing power available for major expenditures. This decline in demand will occur as a nationwide phenomenon and, as historical evidence indicates, will be accentuated in the Michigan economy.
Agricultural operations will also be severely influenced by gasoline price increases, greatly increasing the costs of operating farm machinery. Hardest hit will be those who have contracted to deliver farm commodities at a future date at a price agreed to in advance. Increased costs of harvesting and transporting farm goods may make it impossible for farmers to earn an adequate return on their investments. This could lead to extensive farming losses and a decline in net farm incomes in the short run. In the long run, higher fuel prices will be reflected in the retail cost of food .
An increase in the price of gasoline will increase the amount of money spent by consumers for transportation, and reduce the amount of money available for other, non-transportation expenditures. One of the primary sources of savings will be the postponement of the purchase of major consumer durable items, such as automobiles. Although major purchases will be deferred, consumers will also attempt to minimize the amount of money spent upon transportation itself. In the short run, this may be accomplished by eliminating some trips and by combining others, by substituting a different mode of transportation for private vehicle trips, or by making shorter trips. All of these effects will reduce vehicle miles and hence gasoline consumption, which will tend to lessen the impacts upon consumer budgets.
The effects of a gasoline shortfall upon the tourist industry in Michigan will depend upon the extent to which people are willing (and able) to preserve recreational trips over the non-discretionary work and shopping trips.
37

Tourism
Fuel consumption ~n ~~ichigan, as illustrated in Figure 10, varies from county to county and, as illustrated in Figure 11, from season to season. This variation indicates that tourism in Michigan is predominantly a summer industry located in rural counties. This can be demonstrated by an examination of rural-urban, and summer-winter fuel consumption patterns. About 43 percent of Michigan's fuel is consumed during the winter. Of that, about 35 percent is consumed in rural areas. Thus, of the total fuel conserved, about 15 percent is consumed in rural areas in the winter. Of the 57 percent of the fuel consumed in the summer, about 41 percent is consumed in the rural counties which is about 23 percent of the total fuel consumed each year. Rural fuel consumption changes by 53 percent from winter to summer, while urban fuel consumption changes by only 18 percent. Tourism represents about eight percent of the fuel consumed in Michigan, which is equal to about 14 percent of the fuel consumed each summer. Since tourist trips are the first to be deferred during an energy emergency, the Michigan tourist industry will suffer substantially during a major fuel crisis.
38

\:-
"' :z 0 -' -' < <:>
"-0
"' z 0
-' -'
"'
Figure 10
Esti~attd Gasoline Consusptioft >n Hichi~an, by ceunty, 1978
15 to sa 35 ·
sea to 169 18
189 to 38a s 3SB to 1,599 3
Prepared by use of the County Data Mapping System developed by the Department of Entomology, Michigan State University.
480
440
400
360
/
320
Figure 11
MICHIGAN MONTHLY GASOLINE CONSUMPTION MOVING AVERAGE OF TOTAL
~
-~
\ ~/
/
' /
280 4---~~--~--~r---~----,---~~---r----r---~.----~.----~ 70 71 72 73 7 4 75 76 77 78 79 80
UONTHL Y • 1/70 - 6/B I
39
81

IV. ANALYSIS OF MEASURES
1

r, 'I
' '·i \' j
!- :-
IV
ANALYSIS OF MEASURES
Based on the historical information presented in the economic analysis, a reduction in discretionary travel is expected during an energy shortage. The reduction in discretionary travel is uncontrollable, because it results from the driver's apprehension of becoming stranded in a distant location, or being unable to make a necessary trip at a later date. It will be impossible to "protect" non-essential travel. It will, however, be possible to gear emergency energy reduction measures toward reductions in essential travel.
We assumed that recreational travel will decline if a fuel shortage occurs. We also assumed that personal essential trips will be combined. Therefore, the work trip offers the greatest opportunity for additional fuel savings. For this reason, we considered measures that could be implemented with a short lead time and would have the greatest impact on the work trip. The measures are separated into four sections: Transit, Rideshare, Parking Management, and Traffic Flow Improvements.
Transit
In a fuel shortage, the demand for public transit will rise and may reach the point where the capacity of the current system is exceeded. In the analysis we evaluated emergency actions that would either add transit capacity or make the most efficient use of the current system. A computer modeling approach was used to estimate fuel use on the current Lansing urban area transit system. Then, a series of service changes were tested to determine their impact on work trips and fuel use. Service changes were geared toward providing the maximum service along main commuter routes.
Ridesharing
Ridesharing measures will eliminate trips of varying lengths, but will probably be the most effective outside transit lines, within the residential bounds of the urban area. Vanpools are currently used for longer work trips and should become increasingly popular for work trips between urban areas and from locations outside urban areas into the central business district. Ridesharing offers tremendous potential for fuel savings since it can be undertaken by individuals without outside help and it can also be promoted through a variety of actions. The emergency measures in the ridesharing section present several approaches to increasing ridesharing for work trips.
Parking Management
In some cities, parking management has been used to discourage commuters from driving into the central business district. Although some of these measures are politically unpopular and may be perceived as coercive, parking management was considered because of its fuel saving potential and its ability to act as an incentive to share a ride.
43

Traffic Flow Improvements
Traffic Flow Improvements are actions that increase the efficiency of the transportation system and can cause urban area-wide fuel reductions. These measures are different than the others since traffic flow improvements do not eliminate trips, they make travel more efficient. Unlike other emergency actions, individual drivers may not experience a measurable fuel savings as they might from a carpool. This does not mean that the fuel savings are small, but that the savings are spread thinly over thousands of vehicles traveling through the improved area ..
Time and monetary constraints are severe. Under non-emergency conditions, planning for traffic flow improvements is usually time-consuming and expensive. For the purposes of emergency planning, only improvements that can be made quickly and inexpensively were considered.
Evaluation Criteria
The same criteria were used to evaluate each measure. First the description and intent of the measure were outlined. Then the transportation system and mobility impacts were identified, including an explanation of the impact on work trips and veh·i cl e occupancy. Socia 1 and economic impacts were eva 1 uated with a particular emphasis on the measures ability to minimize the disruptive effects of a fuel shortage. The implementation procedures and costs section outlined the tasks, responsibilities, and costs involved in implementing the fuel saving measure. Since some of the measures present legal problems or may raise politically sensitive issues, the analysis contains a section on these topics. Finally, the fuel saving potential, advantages, and disadvantages of each measure were presented.
All of the fuel savings estimates were calculated for Lansing; the "test area". The concept of a test urban area was used to simplify the analysis and focus on the local impacts and problems associated with implementing emergency measures in a mid-sized urban area. Since the Governor has the authority to invoke emergency measures in a single urban area or county, this is particularly appropriate.
After the analysis, each of the measures were separated into one of the following categories:
1. Measures that the Department of Transportation will recommend for inclusion in the Michigan Gasoline Shortage Response Plan.
2. Measures that require additional evaluation before a decision to implement is made by individual urban areas.
3. Measures that are not recommended for implementation.
44

I
!
,~
"_i
V. TRANSIT

~ - .
V.
TRANSIT
Introduction
The implementation of transit measures has the ability to reduce auto travel by encouraging a switch to higher occupancy modes of transportation. Past experience indicates that transit systems will be faced with increased demand for services when an energy supply disruption occurs.
Most transit systems are not used to capacity at all times. However, transit cannot accommodate all of the transportation requirements an urban area would experience during a fuel shortage. In fact, rapid purchase of additional transit vehicles in an emergency is difficult due to financial constraints and vehicle availability.
Given this situation, the analysis of emergency transit measures was targeted on two areas. First, transit modifications that would make the existing system move the largest number of people in the most efficient manner. Second, methods of. increasing the capacity of the system without purchasing additional buses.
A computer modeling approach was used to examine the current transit system in Lansing, the sample urban area. Various methods of increasing capacity were analyzed, and changes to improve the efficiency of the system were recommended.
In addition to computer modeling, data and research provided additional information which was used to assess the feasibility of transit modifications such as use of taxis, school buses, and community vehicles. Although the analysis uses the Lansing area as its reference, the energy savings from the emergency measures are applicable to other urban areas. The fuel savings may vary, but the institutional problems, procedures, and feasibility of the measures are similar.
The emergency measures do not reduce bus fuel consumption. They are geared toward maximizing auto use reductions, while making efficient use of transit. For the analysis, we assumed that diesel fuel would be available. We also assumed that excess demand would be prompted by the shortage, and that additional buses would be filled. Specific measures are described in the following analysis.
47

INCREASE TRANSIT SERVICE BASED ON DEMAND
Description
This is a voluntary measure that involves increasing transit capacity along the major routes into and out of the central business district (CBD) during peak hours. Capacity is increased by shortening headways and operating buses in tandem, along express routes.
Intent
The intent of this measure is to meet the increase in demand for transit service that is expected during a gasoline shortage. By providing the needed capacity this measure will also save the gasoline that would have been used in private cars for the work trip. This measure would be implemented whenever transit demand exceeds capacity.
Transportation System and Mobility Impacts
The primary impacts on the transportation system will be increased transit capacity and a reduction in vehicle miles traveled (VMT). A secondary result of this measure will be a reduction in air pollution, and gasoline consumption for the work trip. During peak hours, it is suggested that reserve buses, school buses, or community buses be added to the transit fleet and operated in tandem with regular transit buses. This will avoid eliminating service along less major routes which are also expected to experience an increase in demand during a shortage situation.
The mobility impacts of this measure will be positive. All routes wi11 remain and capacity will be added to major express routes.
Social and Economic Impacts
Adding capacity and reducing headways will make buses more attractive for the work trip. Transit will become more available and an easy way to save money and gasoline during a shortage or increased prices. In most cases the transit authority will have the option of increasing fares to help offset some of the costs.
Implementation Procedures and Costs
This measure ties together many of the transit measures. It demonstrates how they can be used to increase service and what fuel savings can be expected. Implementation of this measure requires the transit authority to analyze the service currently provided. The information required is routinely collected by transit authorities. The level of ridership and time schedules for each route need to be analyzed. This will enable the transit authority to decide which routes will benefit from increased capacity, express service during peaks, park-and-ride lots or combinations.
49

Data from the sample urban area, Lansing, were applied to the Urban Highway Network and UTPS computer models to test various possibilities of increasing transit capacity. The Lansing area transit system is shown on the Capitol Area Transit Authority (CATA) System map, on the next page. The most promising are presented here as suggestions, for further investigation. For a more detailed discussion of the modeling process refer to Appendix C. The actual implementation of a.ny suggestion is up to the community and transit authority. This allows a program to be developed to meet specific local needs. Five ways to increase transit service are described below.
1. Current Service at Capacity. This requires no action. It is intended to show how much fuel would be saved because of the increase in transit ridership with the present service levels. During a fuel shortage the transit system is expected to experience large increases very quickly.
2. Reduce Headways with Current Fleet. This suggestion involves removing vehicles from low ridership routes and operating them on the major routes. This action will increase headways on low ridership routes and reduce headways on major routes. This suggestion avoids eliminating routes. The analysis for Lansing showed only two vehicles could be removed from lesser routes without cutting service. Other urban areas may have more vehicles to operate on the major routes and realize more savings.
3. Express Service/Park-and-Ride. This involves adding express bus service to park-and-ride lots on the major routes into and out of the CBD. The analysis suggested four park-and-ride lots with express service in Lansing. The park-and-ride lots were located between 5.5 and 8.5 miles from the CBD. Express bus service was provided for the peak hours of 6:45 - 7:45 A.M. and 4:30 - 5:30 P.M. Ten minute headways were maintained by adding 13 reserve buses from the transit fleet. The reserve buses are idle during off peak periods.
4. Reduce Headways/Add Transit Capacity. This suggestion involves the express routes operating during peak hours. Headways are reduced to five minutes and capacity is added by operating buses in tandem. To accomplish this, reserve buses, school buses, and community buses were added to the transit fleet. The school buses and community buses were only operated in tandem with regular transit buses.
5. Expand Peak Hour Service. This suggestion involves expanding the peak hour express service, as described in 4 above, in response to area businesses allowing flex-time scheduling. Employees are allowed to work adjusted schedules to participate in ridesharing. Expanding peak hour service increases the capacity of transit available for the work trip. The analysis for Lansing expanded the peak hour service to two hours in the morning and two hours in the evening.
The costs for this measure vary greatly depending on the suggestion and how it is implemented. The costs involved in making route changes are minimal. Other costs incurred are included in the measure pertaining to the suggestion. An example is the costs for Express Service/Park-and-Ride are described in Increase Park-and-Ride Facilities.
50

Till CATA IYJTI
Use this area map to determine which buses will
meet your needs. (Numbers indicate scheduled routes)
Pick up individual route schedules/time tables
at over 40 locations around the area, on board
any bus, or phone 394-1000. Express buses are
available from Grand Ledge, Williamston, Mason,
Holt and Meridian Mall.
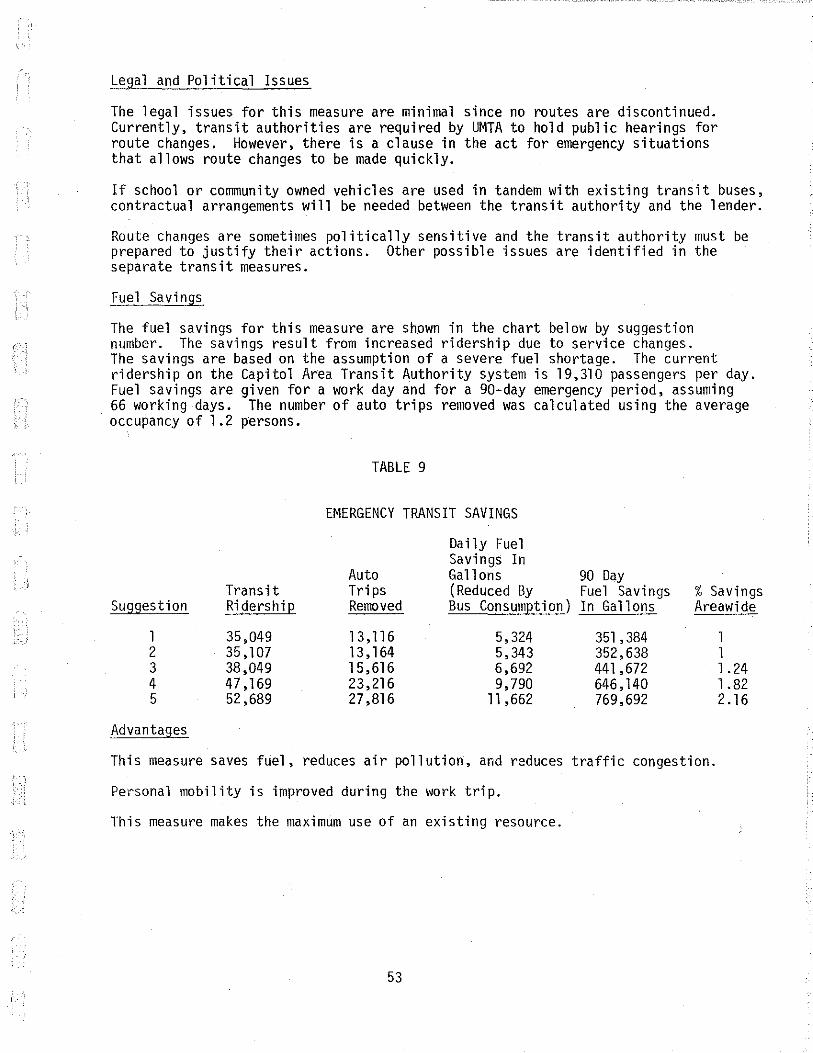
Legal and Political Issues
The legal issues for this measure are minimal since no routes are discontinued. Currently, transit authorities are required by UMTA to hold public hearings for route changes. However, there is a clause in the act for emergency situations that allows route changes to be made quickly.
If school or community owned vehicles are used in tandem with existing transit buses, contractual arrangements will be needed between the transit authority and the lender.
Route changes are sometimes politically sensitive and the transit authority must be prepared to justify their actions. Other possible issues are identified in the separate transit measures.
Fue 1 Savings
The fuel savings for this measure are shown in the chart below by suggestion number. The savings result from increased ridership due to service changes. The savings are based on the assumption of a severe fuel shortage. The current ridership on the Capitol Area Transit Authority system is 19,310 passengers per day. Fuel savings are given for a work day and for a 90-day emergency period, assuming 66 working days. The number of auto trips removed was calculated using the average occupancy of 1 . 2 persons.
TABLE 9
EMERGENCY TRANSIT SAVINGS
Daily Fuel Savings In
Auto Gallons 90 Day Transit Trips (Reduced By Fuel Savings % Savings
Suggestion Ri dershi E Removed Bus Consum[>ti on) In Gallons Areawide
1 35,049 13,116 5,324 351 '384 1 2 35 '1 07 13,164 5,343 352,638 1 3 38,049 15' 616 6,692 441 ,672 1.24 4 47,169 23,216 9,790 646 '140 1.82 5 52,689 27,816 11 ,662 769,692 2.16
Advantages
This measure saves fuel, reduces air pollution, and reduces traffic congestion.
Pel'sonal mobility is improved during the work trip.
This measure makes the maximum use of an existing resource.
53

Disadvantages
This measure requires considerable pre-implementa.tion work by local transit agencies before it can be implemented.
This measure may be politically sensitive.
Substantial costs may be involved in equipping school and community buses for transit use. These costs are identified in the next two measures.
Recommendation
This measure is recommended for local investigation and inclusion into a loca·l transportation contingency plan.
54

f_1
' i
USE SCHOOL BUSES AS TRANSIT VEHICLES
Description
This is a voluntary measure that involves adding school buses to the transit authority's f1 eet. The schoo 1 buses waul d be used in tandem with transit buses along regular transit routes.
Intent
The intent of using school buses as transit vehicles is to add needed capacity to the system when it has reached an overload situation because of an energy shortage. These additional buses would be used during summer months on essential routes into and out of the central business district. This measure will be implemented during a moderate to severe energy shortage in an urban area.
Transportation System and ~1obi lity Impacts
The impacts on the transportation system as a whole would be similar to adding new buses. It is possible that during an energy shortage additional transit buses will not be obtainable. This measure could be the only way of addressing the increased demand on transit that is expected during a shortage.
The exterior appearance of the fleet will be different. The school buses will have to be quickly recognizable by the public as transit buses.
The mobility impacts that this action is expected to produce are mixed. Transit will be available to a larger number of people but most school buses are not handicapped equipped. However, accessibility can also be a problem for regular transit vehicles. If school buses are integrated into the system, the impact on accessibility should be minimal. A school bus used in tandem with a handicapped equipped bus will make transit accessable to all.
Socia 1 and Economic Impacts
The main social impact of this measure is the public attitude toward the use of school buses as transit vehicles. For this measure to succeed, the public must accept the school bus as a transit v.ehicle. Some features of the school bus which might inhibit acceptance are the color, seat size, aisle width, head room, and door arrangements.4
The economic impacts of this measure will vary depending on the specific situation. The impact on the public shou 1 d be minor as the bus fare will be the same whether they board a regular transit vehicle or a school bus. The school district may receive income from leasing their buses to the transit authority, depending upon the contract.
4 The Use of School Buses for Public Transportat-ion, Prepared for North Central Texas Council of Governments, Reprinted by U.S. Department of Transportation (October, 1978}, p. III-13.
55

ImQlementation Procedures and Costs
For the purposes of this analysis it was assumed that school buses would only be used during summer months when they are idle. Other times of year may be possible, but that decision is left up to local discretion. Before implementation of this measure can take place the Governor must declare an energy emergency under Public Act 38, as amended. The Governor must then issue an executive order allowing school buses to be used for general public transportation. The present law allows only restricted use of school buses for purposes other than transporting chilc'ren to and from school. The executive order will open the way for transit operators and school districts to implement this measure through a negotiated contract. This is a voluntary measure; the executive order makes transit use possible but does not require it. This encourages the localities to set up programs as determined necessary for their individual situations.
Many of the costs involved in this measure are related to altering the vehicle for transit use. The installation of fareboxes and radios was viewed as mandatory by the Capitol Area Transit Authority (CATA) in Lansing. However, the expected life of fareboxes and radios is twelve years. After a 90 day emergency period the fareboxes and radios will still retain most of their original value. If the cost of these items is prorated over their expected life the cost of this measure is decreased considerably. The problem of fareboxes and radios may be surmountable during an actual shortage situation.Another major area of costs will be acquiring drivers to operate the additional buses. These costs will be incurred by the transit authority. The transit authority and the community will decide if the benefits are worth the costs. A breakdown of costs are listed below.
Costs per vehicle
Farebox (12 year life) $ Prorated farebox cost over 90 days Farebox installation Two-way radio (12 year life) Prorated radio cost over 90 days Radio installation Identification signs Destination sign Insurance for 90 days Maintenance for 90 days
Costs per driver
Assume 66 working days in a 90 day emergency period.
New driver training for 120 hours of training
Training instructor Driver hourly rate including fringes Driver salary 4 hours per working day
56
1,000.00 21 .00 30.00
1,300.00 27.00
100.00 30.00 20.00 N/A N/A
420.00 N/A 14.25
3,762.00

CATA indicated that if this measure was implemented, they would add buses during the two peak hours in the morning and the two peak hours in the afternoon. The Michigan Department of Education indicated that there are 152 school buses in the urbanized area. All of the current transit buses are diesel and CATA is not set up to repair a large number of gasoline powered buses. CATA will request maintenance to remain with the school district and will negotiate payment on a percentage basis. To avoid legal problems the transit authority will be responsible for insurance. The estimated time to negotiate such a contract between a school district and a transit authority is 60 days.
A possible problem exists involving union contracts between the transit authority and drivers. The addition of drivers or changing of part-time drivers to full-time drivers to operate the additional vehicles will have to be negotiated.
The transit authority maintains bulk storage of diesel fuel for approximately two weeks at the present consumption rate. However, they maintain only a small amount of gasoline storage. If obtaining gasoline during a shortage situation presents a problem, gasoline may be available from the state set-aside program. Other costs invo 1 ved will vary depending upon the transit authority's individual situation. For example, insurance costs are based upon the authority's past record. Leasing, maintenance, and depreciation costs will depend upon the negotiated contract with the school district.
Legal and Political Issues
The Governor's executive order will alter the state law concerning school bus use. State laws dealing with vehicle safety inspections and minimum requirements for different vehicles may have to be resolved. State passenger carrier regulations should not present problems since the school buses will be operated as transit vehicles, along regular transit routes and in previously approved service areas.
The political issues involved with this measure may be simple or entangled in many other issues. This will depend upon public political attitudes.
Fuel Savings
This measure will save the amount of gasoline that would have been used for auto trips, had space on the transit system not been available. The amount saved was calculated by figuring the amount of capacity which could be added by a school bus and the number of auto trips that would be removed. The seating capacity of a school bus is 44 adults. The total fuel saved is the auto trip gasoline not used minus the bus trip gasoline used. These calculations are for one bus, each additional bus would increase the sav·ings by a similar amount. The data and calculations for the Lansing urbanized area is shown on the following page.
57

Assume 66 working days in the 90-day energy emergency period
Current auto occupancy rate for the work trip Number of adult passengers Qer bus Average transit trip length Approximate school bus fuel corsumption Average auto fuel consumption
1.2 44 4 mi 1 es 6 mpg
15.1 mpg
If 44 passengers drove at a rate of 1.2 persons per car, 37 cars would make the work trip each day. The length of each round trip is eight miles. The total miles traveled equals: 37 X 8 X 66 = 19,536 miles. The fuel comsumed for these trips equals: 19,536 ~ 15.1 = 1,293.8 gallons.
If 44 passengers rode a school bus eight miles round trip for 66 days, the miles traveled equals: 66 X 8 = 528 miles. The fuel consumed for these trips equals: 528 • 6 = 88 gallons.
The total fuel saved by one bus equals the auto fuel not used. This equals 1,205.8 gallons.
Advantages
Using school buses as transit vehicles adds needed capacity to the transit system. In addition fuel is saved by reducing VMT.
Money received from leasing school buses could produce additional revenue for participating school districts.
Disadvantages
If a contract is not negotiated between the transit authority and school district before an energy emergency is declared, the lead time required to implement this measure will exceed the 90-day emergency period.
Since a school bus is built for children, it may not be as comfortable as a transit bus.
School buses are not constructed for regular transit use. Increased use may cause them to have excessive mechanical problems.
Recommendation
This measure is recommended for local investigation and inclusion in a local transportation contingency plan.
58

USE COMMUNITY ORGANIZATIONS' VEHICLES FOR TRANSIT
Description
This is a voluntary measure that involves adding community buses to the transit authority's fleet. The community buses would be used in tandem with transit buses along regular transit routes. This differs from the school bus measure in the method of implementation.
Intent
The intent of using community buses as transit buses is to add needed capacity to the system when it has reached an overload situation because of an energy shortage. These additional buses would be used on essential routes into and out of the central business district. This measure will be implemented in the event of a moderate or severe energy shortage in an urban area.
Transportation System and .Mobility Impacts
The impact on the transportation system will be similar to adding new transit buses. It is likely that during an energy shortage additional transit buses will not be obtainable. Using community buses could be the only way of addressing the increased demand on transit that is expected during an energy shortage.
The exterior appearance of the fleet will be different because of this measure. The community buses will have to be quickly recognizable by the public as transit buses.
The mobility impacts that this measure is expected to produce are mixed. Transit will be available to a larger number of people but most community buses are not handicapped equipped. However, accessibility can also be a problem for regular transit buses. If community buses are integrated into the system, the impact on accessibility should be minimal. A community bus used in tandem with a handicapped equipped bus will make transit accessable to all.
Social and Economic Impacts
The analysis of this measure is directed toward civic organizations and churches. These vehicles could be available for transit when not in use. Community service agencies providing transportation for special groups have been excluded. Research showed that these transportation providers are using their vehicles to the maximum and removing them from this use would affect the mobility of the special groups. As with school buses, public attitude and acceptance will determine if this measure succeeds.
The economic impacts of this measure will vary depending on the situation. The impact to the public will be minimal as the extra vehicles will collect the same fare as the regular transit buses. A reduction in personal transportation costs will be realized by people who switch from private cars to transit.
Implementation Procedures ana Costs
Implementing this measure will involve the Governor or a mayor issuing a press release asking churches and civic organizations to make their buses available for transit use.
59

They will be directed to call their 1 oca 1 trans it authority. It will be up to the transit authority to decide if and how the vehicles will be used. Contractual arrangements will be needed between the transit authority and the lender'. This encourages the localities to set up programs as determined necessary for their individual situations.
Many of the costs involved in this measure are related to altering the vehicle for transit use. The installation of fareboxes and radios was viewed as mandatory by the Capitol Area Transit Authority in Lansing. However, the expected life of fareboxes and radios is twelve years. After a 90 day emergency period, the fareboxes and radios will still retain most of their orginal value. If the cost of these items is prorated over their expected 1 ife, the cost of this measure is decreased considerably. These costs may be surmountable during an actual shortage situation. Another major area of costs will be acquiring drivers to operate the additional buses. These costs will be incurred by the transit authority. The transit authority and the community will have to decide if the benefits are worth the costs. A breakdown of costs are 1 is ted below.
Costs per vehicle
Farebox (12 year life) Prorated farebox cost over 90 days Farebox installation Two-way radio (12 year life) Prorated radio cost over 90 days Radio installation Identification signs Destination sign Insurance for 90 days Maintenance for 90 days
Costs per driver
Assume 66 working days in a 90 day emergency period.
New driver training for 120 hours of training
Training instructor Driver hourly rate including fringes Driver salary 4 hours per working day
$ 1,000.00 21.00 30.00
1 '300. 00 27.00
100.00 30.00 20.00
N/A N/A
420.00 N/A 14.25
3,762.00
CATA indicated that if this measure was implemented they would add buses during the two peak hours in the morning and the two peak hours in the afternoon. The Michigan Department of State indicated that there are 255 community buses registered in the Tri-County area. All of the current transit buses are diesel and CATA is not set up to repair a large number of gasoline powered buses. CATA will request maintenance to remain with the organization and will negotiate payment on a percentage basis. To avoid legal problems, the transit authority will be responsible for insurance.
60

A possible problem exists involving union contracts between the transit authority and drivers. The addition of drivers or changing of part-time drivers to full-time drivers to operate the additional vehicles will have to be negotiated.
The transit authority maintains bulk storage of diesel fuel for approximately two weeks at the present consumption rate. However, they maintain only a small amount of gasoline storage. If obtaining gasoline during a shortage situation presents a problem, gasoline may be available from the state set-aside program. Other costs inyolveq wil] vary depending upon the transit authority's situation. For example insurance costs, are based upon the authority's past record. Leasing, maintenance, and depreciation costs will depend upon the arrangement with the lending organization.
Legal and Political Issues
State law dealing with vehicle safety inspections and m1n1mum requirements for different vehicles may have to be resolved. State passenger carrier regulations should not present problems since the community buses will be operated as transit vehicles, along regular transit routes and in previously approved service areas.
The political issues involved with this measure may be simple or entangled in many other issues. This will depend upon public political attitudes.
Fuel Savings
This measure will save the amount of gasoline that would have been used for auto trips, had space on the transit system not been available. The amount saved was calculated by figuring the amount of capacity which could be added by a community bus and the number of auto trips that would be removed. The seating capacity of a community bus is 44 adults. The total fuel saved is the auto trip gasoline not used minus the bus trip gasoline used. These calculations are for one bus, each additional bus would increase the savings by a similar amount. The data and calculations for the Lansing urban area is shown below.
Assume 66 working days in the 90 day energy emergency period
Current auto occupany rate for the work trip Number of adult passengers per bus Average transit trip length Approximate bus fuel consumption
- Average auto fuel consumption
1.2 44 4 miles 6 mpg
15.1 mpg
If 44 passengers drove at a rate of 1.2 persons per car, 37 cars would make the work trip each day. Thirty-seven cars traveling eight miles round trip each day for 66 days. The total miles traveled equals: 37 X 8 X 66 = 19,536 miles. The fuel consumed for these trips equals: 19,536 ;- 15.1 = 1,293.8 ga1lons.
If 44 passengers rode a school bus the 8 miles round trip for 66 days, the miles traveled equals: 66 X 8 = 528 miles. The fuel consumed for these trips equals: 528 ~ 6 = 88 gallons.
The total fuel saved by one bus equals the auto fuel not used. This equals l ,205.8 ga11ons.
61

Advantages
Using community organizations' buses as transit vehcicles adds needed capacity to the transit system. In addition fuel is saved by reducing vehicle miles traveled.
Disadvantages
Many community buses are sized for children, therefore, they may not be as comfortable as a regular transit bus.
Community buses are not constructed for regular transit use. Increased use may cause them to have excessive mechanical problems.
Maintenance costs may be higher on these buses because they are usually older vehicles.
Recommendation
This measure is recommended for local investigation and inclusion in a local transportation contingency plan.
62

MOVE ADDITIONAL TRANSIT EQUIPMENT TO MOST HARD HIT AREAS
Description
If the fuel shortage was limited to a geographic area, transit authorities would transfer spare vehicles to the hard hit area. The vehicles moved will be from stockpiled buses, currently not in use. Vehicles will not be taken from transit authority reserve fleets.
Intent
The intent of this measure is to provide additional transit equipment to an area that cannot accommodate increased ridership brought on by a fuel shortage. This strategy would be implemented if a localized area was experiencing a moderate to severe shortfall.
Transportation System and Mobility Impacts
If an energy shortage occurs in a local area, the transit authority will experience an increase in ridership. High ridership routes will exceed capacity, and low ridership routes will become filled to capacity. The vehicles obtained will be used to serve excess capacity routes. This will prevent the transit authority from discontinuing less popular routes to serve more popular routes. These vehicles could also be used to increase express bus service, or to provide new routes. By adding bus service, passengers will travel more comfortably and conveniently.
Increased ridership will reduce vehicle miles of travel (VMT) and traffic congestion. In some cases mobility will be limited because commuters will not have their cars available for running errands on the way to or from work, and because their arrival and departure time from work is dictated by the bus schedule.
Social and Economic Impacts
Commuters who start to use transit as a result of the energy shortage may have to adjust personal habits and travel patterns. However, if gasoline prices increase drastically, transit may be the most convenient and economical method of commuting.
Implementation Procedures and Costs
This measure would be implemented by the Governor, under Public Act 38 as amended, ordering transit authorities to lend spare transit equipment to the hard hit area. The transit authority that receives the equipment will be required to provide drivers, and to insure and maintain the vehicles. They will also be responsible for advertising increased or new services.
Part-time drivers could be scheduled on a full-time basis during the emergency period. However, if drivers are unavailable, new drivers will have to be hir~d and trained, which will take about four weeks. Additional maintenance personnel may also have to be hired to service the borrowed vehicles.
63

Transit authorities have a reserve fleet for normal maintenance, and so that if a bus breaks down a vehicle is readily available. The size of the reserve fleet depends on the agency's reserve bus policy. Any stockpiled buses that a transit authority may have are older vehicles that are not in use. Most transit authorities keep as few vehicles in reserve as possible. Even though the shortage is in a localized area, a st~tewide increase in transit ridership due to people panicking is expected. If this happens, transit authorities will need all available vehicles to serve their customers.
Because transit authorities are not expected to have spare vehicles, this measure is not recommended for inclusion in the Michigan Gasoline Shortage Response Plan. However, transit authorities are still free to make this kind of arrangement on a voluntary basis. Fare box revenues will be paid to the transit authority operating the equipment. The cost to implement this program was not estimated.
Legal and Political Issues
Because the Governor is ordering transit authorities to trans fer vehicles, and because the vehicles will be insured, there are no legal issues involved in implementing this program. However, politically this measure is infeasible. Even though the emergency is geographically located, other areas in the state will be affected. By designating an emergency area, the Governor will be showing favoritism, which may be viewed unfavorably.
Another deterrant is that vehicles available for lending would require the most maintenance. Since the transit authority borrowing the equipment is required to provide maintenance, the additional vehicles could be more of a hindrance tha.n a help.
Fuel Savings
The fuel savings were not estimated.
Advantages
Additional transit equipment would help the local transit authority improve service.
pi sad vantages
The borrowed equipment may require a lot of maintenance.
If there were a statewide increase in ridership, transit authorities will need all of their equipment.
The transit authority may have to hire personnel to operate or maintain the additional equipment.
This measure is politically sensitive.
Recommendation
This measure is not recommended for inclusion in energy contingency plans.
64

,::
INCREASE PARK-AND-RIDE FACILITIES
Description
This measure involves designating existing available parking areas along transit routes and at least three miles from the central business district (CBD) as park-and-ride lots. Express bus service will be provided during the peak hours.
Intent ----
This measure is designed to encourage transit use and increase transit vehicle occupancy on the outer edges of the transit route, making the trip more efficient. Park-and-ride lots also make transit use easier and more attractive to a larger number of people. This measure would be implemented during a moderate shortage.
Transportation System and r.lobil ity Impacts
Impacts on the transportation system and mobility are positive. The decrease in auto trips will reduce the vehicle miles traveled (V~1T), benefit air quality, reduce traffic congestion, and reduce total fuel consumed on the transportation system. Transit will be a viable option for more people in the transit service area and surrounding area.
Social and Economic Impacts
The social and economic impacts resulting from this measure are positive.' Park-and-ride lots provide a place to leave the car while bringing in business for the facility owner. The park-and-ride lots will not charge for parking. The gas savings and elimination of paying for parking in the CBD should provide additional incentives to get people out of their cars and into multi-passenger vehicles.
Implementation Procedures and Costs
This is a voluntary measure that is being recommended to transit authorities and communities. The parking facility is usually a retail establishment that has parking spaces that are not used on a normal basis. According to A Handbook For Evaluating The Air Quality and Energy Impacts of Transportation Systems ~1anagement Strategies, park-and-ride lots should be located three to ten miles from the CBD along major routes. The analysis for Lansing located four potential park-and-ride lots on the north, south, east, and west sides of the city. The north lot was located at Eberhards on US-27 which is 5.56 miles outside of the CBD. The south lot is at ~1eijers on Cedar Street, which is 6.33 miles from the CBD. The east lot is at t"1eridian Mall on M-43 and is 8.5 miles away. The west lot was located at the Lansing Mall on t1-43 which is 5.56 miles from the CBD. Each lot will be provided with express bus service during peak travel periods.
65
To be successful, an agreement between the transit authori~y and the parking facility owner must be negotiated for the joint use of the parking lot. The transit authority must provide signs. One or two signs are needed at each park-and-ride location. A sign costs $20 plus set-up costs for the printer if it is a new order. The Capitol Area Transit Authority indicated. that their personnel install signs. In an emergency situation signs will be installed to designate park-and-ride lots. The park-and-ride lots are publicized in transit information and local public information programs concerning an energy shortage.
Legal and Political Issues
The use of privately owned parking lots for commuter lots could present a problem in negotiating their use. The transit authority in the Lansing urban area has indicated that the park-and-ride lots tha.t are now in use are based on informal agreements.
Fuel Savings
The addition of park-and-ride lots and expr.ess routes during peak hours will add passengers to the transit system. The fuel savings which result from this measure were described in the analysis of Increase Transit Service Based on Demand (suggestion number three) and were estimated at 441 ,672 gallons. The savings are the same because the park-and-ride lots provide the passengers to fill up the buses. The fuel savings for Increase Transit Service Based on Demand was calculated by removing the VMT of the parked cars from the areawide VMT.
Advantages
Park-and-ride lots encourage transit use. This reduces fuel consumption and increases the efficiency of transit. In addition, air pollution, traffic congestion and personal transportation expenses are reduced.
Disadvantages
Cars in park-and-ride lots may occupy neected parking.
Commuter travel time may increase from using transit as compared to a private car.
Recommendation
This measure is recommended for further investigation and inclusion in a local transportation contingency plan.
66
PROMOTE IMPROVED TAXICAB UTILIZATION
Description
This is a voluntary measure that involves the expansion of private transportation services presently being provided by taxicab companies.
Intent
The intent of this measure is to improve public mobility and increase the vehicle occupancy of taxicabs, while complimenting the transit service. Taxicab services can fill in transit gaps and operate where it is not economically feasible to operate a transit route. This measure will be useful when public mobility suffers because of an energy shortage.
Transportation System and Mobility Impacts
The transportation system and mobility impacts associated with this measure should be positive. This measure provides more personalized service because every passenger is guaranteed a seat, and door-to-door service is possible. This type of service is usually cheaper than traditional, exclusive ride taxi, but more expensive than transit service.
In recent years, the taxicab industry has received increasing attention as a public transportation provider. The U.S. Department of Transportation, through the Urban and Mass Transportation Authority (UMTA), has recently added taxicabs to their definition of paratransit. According to UMTA, paratransit includes mini car; ca rpoo 1 s , renta 1 cars, speci a 1 i zed commuter bus services provided on a subscription basis, taxicab, dial-a-ride, jitney, and limousine. The inclusion of taxicabs opens up the possibl ity of federal funding for innovative taxi operations. The efficiency of taxi service can be improved by permitting higher occupancy and encouraging jitney-type services.
This measure was first conceived as an open entry market situation encouraging jitney services. Research into state and local laws concerning the taxicab industry found that a closed entry market is prevelent in Michigan. Through state law, local units of government are allowed to license and regulate taxicab companies. The city licenses the number of companies and vehicles that can operate within its jurisdiction. Also, the city usually regulates the fare that can be charged. This results in the taxicab company having a "monopoly" on the market in exchange for regulation of specific segments of their operations. The time involved in changing these institutional barriers made the original measure useless in an energy emergency. Therefore, a measure that encourages innovative taxi operations using the companies presently licensed and regulated is presented.
Social and Economic Impacts
This type of paratransit service is designed to compliment the transit system. ?aratrans it provided by taxi cab companies can be attractive and convenient to more people, and a good incentive to get people into higher occupancy vehicles.
67

This reduces the number of vehicles on the road and the total miles traveled. This measure c.lso decreases congestion, parking needs, fuel consumed, and pollution produced. The public should see a net reduction in personal transportation costs as compared with thei>" own cars. Many of the options described will benefit communities without transit service.
Implementation Procedures and Costs
The implementation of this measure involves a public information program aimed at taxicab companies and local un'its of governments asking them to voluntarily improve taxicab services. This will be accomplished t;y using radio spots and press conferences consistent with the procedures outlined in the public information measure. The actual implementation of a taxicab service option is left up to local governments. This allows local governments and taxicab companies to design a program to fit the needs of their community. Six options to promote improved taxicab utilization are described below.
1. Shared-Ride Taxi Operations. This option involves instituting and promoting shared-ride taxi services. Access to the system will need to be worked out; hail, phone ahead, taxi stands, or combinations are all possibilities. Shared-ride taxi stands work well at airports or train depots where people are going to the same areas.
2. Feeder System. This service can be instituted where fixed-route conventional public transportation exists. It can be developed on a demand-responsive or subscription basis. It would pick up passengers and deliver them to a transfer point to complete their trip by bus transit. A peak hour service coordinated with express bus service into the central business district is an excellent example of a feeder system. This option can be attractive to one-car families and people who do not want to leave their car in a shopping center lot all day.
3. Route-Deviation Service. This is a type of routing configuration whereby the taxicab makes scheduled stops at certain checkpoints along a fixed-route. Upon request, the taxicab is allowed to deviate from the route a maximum set distance, to serve more patrons or provide doorstep service.
4. Shuttle Service. A shuttle service operates exclusively between two fixed stops. This is beneficial in a high density area where there is a lot of movement back and forth, such as between an airport and the central business district.
5. Loop Service. This routing configuration operates a vehicle continuously along a fixed, circuitous path, picking up and discharging passengers along the way. This type of service can provide mobility to areas where it is not economically feasible to run a full-size bus. This service could also fill in geographical gaps between transit routes. If the transit service is radially routed into the central business district, this paratransit service can provide a time-saving way to travel from suburb to suburb.
68

6. Taxi Carpool Service. This is similar to private carpooling without the responsibility for driving, parking, and added depreciation on the · personal car. Passengers agree to ride together on a regular basis along a route determined by prior arrangement with the taxicab company. With this arrangement the passengers split the metered fare. ~1onthly bi 11 i ng can usually be made to one passenger, who coordinates the paymentP
The costs involved in providing innovative taxicab services will vary depending on the situation. UMTA' s definition of paratransit makes federal funding for these types of services possible. Contracts between the local transit authority and taxicab companies for providing public transit is also a possibility. The literature indicates that a contract arrangement would make the taxicab company a transit provider and free it of taxi regulations. A fare structure for the service provided by the taxicab would have to be negotiated between the local unit of government and the taxicab company. The increased ridership that results from the innovative services are expected to cover the costs.
Legal and Political Issues
The legal and political issues involved with innovative taxicab services are local in nature. The legal issues involve city councils, taxicab companies, and city ordinances. In most cases, a city ordinance will have to be passed or amended to allow shared-ride operations. It is recommended that discussions and negotiations begin well in advance of a shortage situation. The support of both the city and the taxicab company is needed to make this measure successful. Early completion of the preimplementation work will make the implementation of this measure fast and efficient.
The political issues stem from the transit authority. The transit authority is protective of its service area and is hesitant to encourage competition. The Capitol Area Transit Authority has indicated that if this measure was used only an an emergency measure and without public funds, they would not object. Implementation problems will depend on the local situation.
Fuel Savings
The fuel saved will result from the reduction of vehicle miles traveled (V~1T} because people are using higher occupancy vehicles. Data obtained from the owner of the Courtesy/Varsity/Yellow Cab Company in Lansing was used to estimate the savings. There are 30 taxicabs in the Lansing area and they travel 1,370,772 miles a year carrying 350,000 passengers. The average taxicab trip length is 5.6 miles and the average occupancy is 1.3 passengers. The average speed used for this calculation was 22 mph. There is an average of 959 passengers traveling 3,756 miles daily, requiring 738 taxicab trips. If four passengers per vehicle is the maximum capacity, there is excess capacity for 1 ,993 more passengers. Assuming a 1:2 occupancy rate for private vehicles, the savings result from removing the 1,661 vehicles required to carry 1,993 passengers.
The fuel consumption rate and the method for calculating fuel savings came from A Handbook For Evaluating the Air Quality and Energy Impacts of Transportation Systems Management Strategies. The calculated fuel savings for this measure is as follows:
5Paratransit, State of the Art Overview, U.S. Department of Transportation, Transportation Systems Center (March, 1981 L pp. 1-44.
69

Advantages
Daily areawide VMT Private miles removed Daily VMT r.educed by X consumption rate in gallons/mile Daily fuel savings Fuel savings for 90 days
8,177,290 9,302 ,001% .05974 556 ga 11 ons 50.013 gallons
This measure i ncreas.es taxi cab efficiency, and passenger miles per ga 11 on. Parking needs, fuel consumption and air pollution are also reduced.
Local governments can implement this measure to improve citizen mobility during a shortage situation.
Disadvantages
Depending on how they are implemented, some of the suggested options may not be in the best interest of a profit oriented company.
Some passengers may object to riding with strangers.
Recommendation
This measure is recommended for local investigation and inclusion in a local transportation contingency plan.
70

VI. RIDESHARING

VI.
RIDESHARING
Introduction
Ridesharing is an energy conservation and emergency measure that offers fuel savings potential due to the flexibility of ridesharing arrangements and the ease of rapid expansion on short notice, especially for the work trip. Ridesharing promotes carpooling, vanpooling, and transit. Today, about 75 percent of the nation's commuters are solo drivers by preference, necessity, or habit. Ridesharing programs are geared toward changing these habits thus increasing vehicle occupancy and reducing vehicle miles of travel (VMT).
Several approaches to ridesharing have been successful, such as areawide and employer-based ridesharing programs, which are both geared toward matching riders for carpools and vanpools. Another approach is rural carpool parking lots, which encourages the long trip commuter to "double-up" using strategically placed parking lots along major commuter routes outside urban areas.
In addition, ff significant increase in auto occupancy could occur on an informal basis due to increased gasoline prices. The analysis of programs for the Michigan Gasoline Shortage Response Plan will be limited to the formalized methods of increasing ridesharing because it is difficult to predict the actions of people in circumstances not previously experienced, and because analysis of the informal formation of carpools requires data that is unavailable.
Formal areawide ridesharing programs are community oriented and offer information and matching services to the general public. Employer based programs are geared toward the work trip, and require a commitment from the employer to provide carpool matching assistance and information to employees. Both programs are being implemented in Michigan to varying extents. Consideration of these programs for the Michigan Gasoline Shortage Response Plan will be geared toward the procedures, cost, and fuel consumption benefits of expanding these programs during an energy shortage.
For the analysis of the rideshare measures, we assumed that demand for ridesharing services and facilities would be limited by the capacity of the state, local rideshare offices, and employers to provide these services. We also assumed a general willingness on the part of employers to cooperate and participate in ridesharing programs.
73
PROVIDE PUBLIC INFORMATION
Description
The public information program will be used to inform citizens about the energy shortage situation, and of emergency measures that are being implemented in Michigan.
Intent
The intent of this measure is to facilitate citizen participation in programs that will maintain mobility, especially for the work trip, and minimize inconveniences caused by limited fuel supplies. The main emphasis is on promoting carpooling, vanpooling, and transit. This measure will be implemented during initial stages of a fuel shortage.
Transportation System and Mobility Impacts
This measure does not have direct transportation or mobility impacts. However, as citizens start to participate in programs offered in the 1,1ichigan Gasoline Shortage Response Plan, travel patterns will change. Traffic congestion and vehicle miles of travel (VMT) will decrease, while transit use and vehicle occupancy will increase.
Social and Economic Impacts
Advertising for this program will be done through newspaper, radio, and television. Since nearly all citizens have one of these forms of media at their disposal, this measure does not pose social or economic problems.
Implementation Procedures and Costs
This program will be implemented by the Governor issuing a press release informing citizens of the energy shortage. A spokesperson will be appointed by the Governor to represent the state's position on the severity of the shortage, and to inform the public of measures being implemented to alleviate the situation. The spokesperson will hold press conferences on a regular basis, which will be dictated by the severity of the fuel shortage. The press conference will be used to the extent possible. However, if additional program promotion is needed, an advertising campaign will be launched.
The advertising campaign for the ridesharing measures will be coordinated by the Mass Transportation Planning Section, Modal Planning Division, Bureau of Transportation Planning. Two weeks lead time is required. The majority of advertising will be in newspapers because this produces the greatest response. Prime advertising days will vary depending on circulation and the area. The Michigan Press Association will be used to guide newspaper choice and the days for advertising. Generally, Sundays and either Wednesdays or Thursdays are most popular. A "MichiVan" ad has already bee11 prepared, so the cost incurred will be for placing it in newspapers. How often the ad is placed will depend on public response and the severity of the shortage.
75

Many of the newspapers that belong to the Michigan Press Association carry free ads in the classified section for people who are trying to form carpools. During an energy shortage, the demand for this service will increase to such an extent that the paper will probably discontinue the service. MOOT will request that as a replacement, these newspapers carry a ridesharing survey form. Local residents can complete the form and mail it to the local ridesharing office (LRO) for matching or transit information. This makes joining a carpool o:~ vanpool easier, and reduces calls at the LRO requesting rideshare information and survey forms. LRO staffs will have more time for keypunching data, and for providing people with potential rideshare match lists. An example survey form is provided on the following page.
The majority of radio ads will be placed between 6 and 10 a.m., and 3 and 7 p.m. to reach the largest number of commuters. A MichiVan 30 second radio ad has also been completed, so the cost involved will be for broadcasting. Television advertising of ridesharing programs is provided through public service announcements, and are developed by the Federal Highway Administration.
The cost for the advertising campaign was using the Tri-County area as an example. and radio stations may be contacted.
calculated for one week coverage In a fuel shortage, other newspapers
MichiVan Newspaper Advertising
No. of ads X cost per ad Total
Lansing State Journa 1
MichiVan Radio Advertising
Station - No.
Lansing WILS (AM) WITL (AM)
WJIM (AM)
2
of ads
20 9 9
10 10
70
X $ 784.00 $1,568.00
X cost per ad
14 .l 0 1 2. 00 l o. 50 11 . 40 10.40
282.00 108.00 94.50
114.00 104.00
702.50
$2,270.50
Transit schedules are provided by the LRO or the local transit authority on request. In addition, transit schedules are available at various locations such as banks, shopping malls, and government buildings. The Capital Area Transit Authority (CATA) operations were used as an example to estimate the cost of keeping the public informed of transit scheduling. Transit schedules cost approximately 3¢ apiece for printing and materials. Schedule racks are kept stocked by a CATA employee. The cost incurred for this program will be for printing of transit schedules. The number of schedules needed will depend on if routes or headways change, or if current supplies of transit schedules are depleted.
76

,- :)
RIDESHARING SURVEY
NAME:
ADDRESS:
CITY: STATE:
AREA CODE: HOME PHONE:
NEAREST INTERSECTION:
EMPLOYER:
EMPLOYER'S ADDRESS:
CITY: STATE:
AREA CODE: WORK PHONE:
WORKING HOURS: (Example: Begin 8 a.m. End 5 p.m.)
START TIME: END TIME:
I WORK THESE DAYS: ( Ci rc 1 e)
ZIP CODE: ___ _
ZIP CODE:
EXTENSION: __ _
SUNDAY, MONDAY, TUESDAY, WEDNESDAY, THURSDAY, FRIDAY, SATURDAY
IF NECESSARY, I COULD ADJUST MY WORK SCHEDULE:
CARPOOL
Would you like to receive a list of persons who live near you and work near you who are interested in carpooling? (Checking "yes" places you under no obligation)
VAN POOL
Are you interested in becoming a: Vanpool Passenger Vanpoo 1 Driver Back-up Driver
(you are under no obligation)
Very Interested
Yes No
Not Interested Interested
PLEASE SEND REGULAR BUS ROUTES AND SCHEDULES TO MY HOME ADDRESS LISTED ABOVE
HOW DO YOU PRESENTLY COMMUTE BET\\EEN HOME AND WORK?
DRIVE ALONE CARPOOL BICYCLE
77
BUS WALK OTHER
Specify
To change a transit route, a public hearing is usually held, theA a decision is made by the Board of Directors. If the route is changed, new schedules are printed and a sign is posted in the bus to i.nform riders. In addition, local newspa.pers and radio stations make announcements of the change as a news item. This procedure takes about two months. If there were enough advance warning of the shortfall, the same procedure would be followed. The cost incurred would be for reprinting. of transit schedules.
In the event of an emergency, traR.sit authorities could authorize temporary route changes without a public hearing. In this case, a press conference w'luld be held, and newspaper ads and radio spots would be bought to inform the public. The ads would be developed by the person responsible for marketing at the transit authority. The cost incurred would be similar to the MichiVan program, and were estimated at $2,270 •. 50.
As a public service, rideboards eould be provided at city halls, county court houses, post offices, schools, day care centers, churches, grocery stores and shopping malls. This would gi.ve residents i·n local areas an opportunity to form carpools fo.r weekly errands, for shopping trips or to dro.p students off at schools. An area map would be divided into, sections, and cards would be organized by desttnation. Carpools would be formed informally by people mctching rides. Ridesharing boards would be installed on a voluntar'y basis, and would be paid for by the sponsor.
If mandatory meas.ures are implemented, the advertising campaign will be increased to keep the public aware of changes that are occuring. The Energy Administration will coordinate this campaign. Costs incurred will be similar to the ridesharing advertising campai,gn. The amount of advertising will depend on public response and the severity of the shortage.
Legal and Political Issues
Since the ads that are going to be used for the public information program have already been used, and' because installation of the rideshare boards is on a vo 1 unta ry bas is, this prograw does not pose leg a 1 or po 1 it i ca 1 issues.
Fuel Savings
The public programs. under fuel
information program facilitates public participation in emergency The impact of these programs has been estimated and is 1 is ted savings for each measure.
Advantages
The public information program w,ill be used to get citizens to participate in emergency programs ..
Di sadvant~~
There are no disadvantages to implementin.g this program.
Recommendation
This measure is recommended for inclusion in the Michigan Gasoline Shortage Response Plan. Local planning agencies should also consider providing a public information program in their local energy emergency plan.
78

INCREASE EMPLOYER BASED CARPOOL PROGRAMS
Description
Employer based ridesharing programs provide carpool information and matching services to employees for the purpose of commuter carpooling. These programs may consist of an outside agency assisting employers in setting up these services, or may rely solely on employer initiative.
Intent
The intent of this measure is to increase vehicle occupancy for the work trip and to reduce vehicle miles of travel (VMT) to and from the work site. This program will be implemented during a moderate energy emergency, in conjunction with the areawide carpool program.
Transportation System and Mobility Impacts
Ridesharing requires an adjustment of personal mobility because many commuters have grown accustomed to controlling their arrival and departure times to and from work. Depending on whether the commuter is a part-time or full-time driver, less freedom and more responsibility results from a ridesharing arrangement.
Ridesharing increases vehicle occupancy, which reduces the number of trips made during peak period traffic. Vehicle miles of travel are also reduced, and is dependant on urban area size. Larger urban areas tend to have a larger number of commuters traveling longer distances to and from work.
Part of the transportation system impacts depend upon whether the employer offers incentives to employees to encourage ridesharing. A few examples are flexible hours, preferential parking, and increased use of company vehicles. Each of these incentives can be used alone as a method to save fuel. Study results indicate that if an employer provides these added incentives, ridesharing will be increased. For example, when flex-time was promoted at five major employers in the San Fransisco area, ridesharing increased by an average of 14 percent.6
Social and Economic Impacts
The nature of commuter's driving habits is the result of an uniquely American association between prosperity, prestige, and private vehicle ownership and use. Ridesharing requires an attitudinal change, and may also require an adjustment of per·sonal habits and travel patterns. Ridesharing provides new opportunities for socializing and also imposes new responsibilities, especially for the driver.
From an economic point of view, ridesharing reduces commuting costs. If gasoline prices increase drastically, ridesharing may be the only economical way to commute.
6 Frances Harrison, David Jones, and Paul Jovanis, "Flex-Time and Commuting Behavior in San Fransisco: Some Preliminary Findings". Summary Report, Institt.te of Transportation Studies. University of California, August, 1979.
79

Implementation Procedures and Costs
Implementation of this strategy relies on employer cooperation, and the ability of local ridesharing offices (LRO's) to rapidly expand their operations. For the purpose of this analysis, we assumed that employers with 200 or more employees will provide ridematching information to their employees, and that computerized grid maps for each of Michigan's urban areas are maintained by the state or LRO. We also assumed that the LRO is working at or near capacity due to increases in the areawide ridesharing program brought on by the energy emergency. The following procedure will be followed to implement this strategy.
Upon notification of an impending fuel shortage, the Governor will issue a press release requesting all employers with more than ~ ,000 employees to provide carpool matching services. Large employers have the highest potential for matching success. Employers will then contact their LRO to obtain carpool survey forms and instructions for their use. Forms will be distributed to employees and returned within three days. If computer systems are compatible with the LRO, the employer will keypunch the data and return the data to the LRO within one week. The LRO, or in some cases the Michigan Department of Transporation, will use the keypunched data and the computerized ride share matching program to create lists of potential carpools. These lists will be returned to the employer.
In this scenario the employer carries a large portion of the responsibility for collecting and processing data. This program requires the commitment of at least a one person week for keypunching and coordination. The cost of implementing this stragety is approximately $400 for an employer with 1,000 employees. Costs for computer matching and local rideshare/state assistance are not quantified because these costs would occur regardless of the energy shortage. If the employer provides other carpool incentives additional costs may be incurred, but were not quantified. For this program to be successful, cooperation and assistance from employers is essential.
If the fuel shortage worsens, the Governor could extend the ridesharing program to employers with 500 or more employees or to employers with 200 to 500 employees. In some cases, employers with adjacent work sites could prepare joint ride-match lists to increase the "pool" size and increase the chances of matching employees.
Legal and Political Issues
Since employers are responsible to use their personnel to distribute and collect data, this program would be implemented on a voluntary basis because there is no legal way to force participation in this program.
80

:)
Fuel Savings
Available data used to estimate the effectiveness of a ridesharing program assumes moderate fuel prices, abundant fuel supply, and the current level of employer support. In an energy shortage, these assumptions would not be appropriate and would produce a low estimate of fuel savings.
The Michigan Department of Transportation has used a computer modeling approach based on data from existing rideshare programs in Grand Rapids to estimate a range of success rates and fuel savings from ridesharing programs. These calculations are included in Appendix B. The results of the analysis provide a means of calculating fuel consumption reductions based on the number of work trips eliminated in an urban area. The fuel rates used in the following calculations have been increased from the information given in Appendix B, due to the larger size of the Lansing urban area and longer average trip length for the
·work trip.
For example, the present Capital Area Transportation Authority (CATA) ridesharing program has provided 1,774 computerized matchlists during 1981. Using a carpool formation success rate established in surveys, 20 percent of the people requesting and receiving lists will actually form carpools. The fuel consumption reduction from the current employer based rideshare program equals:
Gallons ~ .6533 (TE) Where TE ~number of trips eliminated TE ~' 2X total number of carpools TE ~ 710
Gallons ~ .6533 (710) Gallons ~ 463.9
Other survey data indicates that the current carpool formation rate equals 43 percent of those who receive computerized matchlists. If this occurs then the daily fuel savings from the current program equals:
Gallons ~ .6533 (1526) 997
This provides a range between 464 and 997 gallons per day savings for the ongoing CATA program.
In an energy shortage, both the employer participation rate (number of matchlists provided) and the carpool formation rate would increase by an unknown percentage. If the number of matchlists distributed doubles and the carpool formation success rate increases to 50 percent, the following daily fuel savings will result:
~umber of carpools equals~ 1,774 (2)(.5) TE ~ 2 (1 ,774)
~ 3,548 Gallons~ .6533 (3,548)
= 2318/day
Assuming five day work weeks, the following fuel savings would occur during the 90-day emergency period.
81

90 - 24 = 66 working days 66 ~2318) 152,988 gallons for the emergency period
This is the savings from an employer based program only, and does not include carpools formed informally, or carpools formed through the areawide rideshare program.
Advantages
Carpooling increases vehicle occupancy and reduces VMT. Traffic flow improvements and fuel saving benefits are also achieved.
Employer based carpool programs can be expanded easily and with minimum cost.
Disadvantages
This is a voluntary measure so not all employers will participate in this program.
Commuters may have less freedom of mobility and more responsibility due to carpooling arrangements.
Recommendation
This measure should be included in the Michigan Gasoline Shortage Response Plan. Local planning agencies should consider ways to assist the local rideshare office and employers in promoting ridesharing.
82

INCREASE AREAWIDE CARPOOL PROGRAM
Description
An areawide carpool program provides carpool matching by local ridesharing offices to area residents on request. This program will be expanded during a fuel shortage.
Intent
The intent of this measure is to increase carpooling for the work trip, which reduces vehicle miles of travel (VMT) and fuel consumption. This measure will be implemented during a moderate energy emergency, in conjunction with the employer based carpool programs.
Transportation System and Mobility Impacts
Increased carpooling for the work trip will increase vehicle occupancy and decrease peak hour congestion. Parking lots in urban areas will also be less crowded. In addition, VMT will be reduced. The amount depends upon urban area size. Larger urban areas tend to have more commuters traveling longer distances to and from work. In some cases, mobility is limited because most carpools have set rules that do not allow members to run errands on the way to or from work, and because members of the carpool do not have a vehicle available for midday transportation.
Social and Economic Impacts
Benefits gained from carpooling are reduced commuting costs and relaxed travel. In addition, employers find that tardiness and absenteeism decrease.
Implementation Procedures and Costs
This measure will be implemented by the Governor issuing a press release appealing to commuters to contact their local ridesharing office (LRO) to be matched in a carpool. The Michigan Department of Transportation (MOOT) provides matching in areas that are not served by a LRO. Moo; supports 20 LRO's that have the ability to expand carpool matching services. Promotion of this program is included in the public information program.
If the workload becomes too burdensome for current staff, the LRO' s can hire additional people, as needed, for the 90-day emergency period. Their duties will consist of keypunching data and providing carpool match lists to potential carpoolers. This will help free more experienced staff members to continue efforts to expand employer based ridesharing programs. These people will work full-time, and will receive minimum wage with minimum benefits. The cost for each addition a 1 person, inc 1 udj ng overhead, is estimated at $3,000. If each of the 20 LRO's hired two additional staff members for 90 davs, the total cost would be $120,000.
83

Legal and Political Issues
Since this is an ongoing program, there are no legal and political issues.
Fue 1 Savings
Benefits gained from commuter carpooling include increased vehicle occupancy, reduced vehicle miles of tr~.vel, and lowered vehicle emissions. In addition, traffic flow improves, especially during peak travel hours. Studies show the average increase in carpooling from an areawide program is about five percent, and tha.t areawide VMT is reduced by about one percent.
The Tri-County area was used as an example to estimate fuel savings for this program. The round trip distance was estimated at 19 miles, and the average speed used for this calculation was 25 mph. Assuming five-day work weeks, there would be 66 working days during the 90-day emergency period. The fuel . consumption rate and the method for calculating fuel savings came from A Handbook for Evaluating the Air Quality and Energy Impacts of Transportation Systems Management Strategies. The calculated fuel savings for this strategy is as follows:
Daily areawide VMT X Percentage reduction in areawide VMT X Consumption rate in gallons/mile Daily fuel savings X 66 Working Days
8,177,290 1% .05600 4, 579 ga 11 ons 302,214 ga 11 ons
If carpooling reduced areawide VMT by five percent, the fuel savings would be 1,511,136 for the 90-day emergency period. At a ten percent areawide VMT reduction, the fuel savings would be 3,022,338 gallons.
Advantages
Traffic flow improvements and fuel saving benefits are gained from increased carpooling.
Carpoolers enjoy reduced commuting costs and relaxed travel.
Areawide carpool programs can be expanded easily with ~inimum cost.
Disadvantages
Individual mobility may be 1 imited because most carpools have set rules that do not allow members to run errands on the way to or from work, and because each member can not dictate their own arrival and departure time from work.
Recommendation
This measure is recommended for inclusion in the Michigan Gasoline Shortage Response Plan.
84

\-_-;
i .·
INCREASE VANPOOL PROGRAMS FOR THE GENERAL PUBLIC
Description
This is a voluntary ridesharing measure that consists of rapidly expanding the state and local ridesharing agencies' existing vanpool program. The current program provides vanpool information and matching services to interested participants, and makes the necessary arrangements to provide y9ns to qualified vanpool groups.
Intent
The intent of this measure is to encourage ridesharing and to provide multioccupancy vehicles as an alternative to the solo commuting trip. Vanpools reduce the number of work trips and reduce total vehicle miles of travel. This measure will be implemented during a moderate shortage, based on demand.
Transportation System and Mobility Impacts
Vanpools remove vehicles from peak hour traffic and thereby reduce traffic congestion and improve areawide travel time. Each van removes private vehicles from the traffic stream. Vanpooling can also reduce parking demand in the central business district and at major employer parking facilities ..
There has been some concern that vanpooling may have a negative influence on mass trans it ridership if vanpoo l s are operated in areas served by buses. To guard against this, in the current vanpool program a transit service study is made prior to establishing new vanpools. This prevents duplication of services.
Since vanpool trips are usually over ten miles one way and outside of transit service areas, conflicts with bus service are rarely a problem. In an energy shortage, conflicts should not occur since buses will undoubtedly experience increased demand.
Social and Economic Impacts
Like any other ridesharing arrangement, vanpoolers must adjust their personal travel habits to conform to fixed starting and quitting times at work. Vanpoolers have less mobility during the work trip and cannot make sidetrips or personal business trips after work as solo drivers can. This requires a change in attitude.
During an energy shortage many people may be willing to make this adjustment in order to minimize commuting costs. When fuel prices rise, commuting becomes more expensive. Since the cost of operating the van is split between the vanpool riders, the incentive to participate in the vanpool pmgram will increase as the severity of the fuel shortage increases, anG the cost of solo commuting increases.
85

Implementation Procedures and Costs
The current vanpool program is sensitive to demand changes and will be increased automatically in an energ:' shortage. Action by the Governor is not required. The contractual and procedural arrangements and staff are in place. For details refer to Appendix A: Ongoing Conservation Programs. Rapid expansion of this program is dependent on the inventory of vans available and the production capabilities of the automobile industry.
The contract arrangement with Vanpool Services, Inc. that is currently in place provides for quick delivery of vans to qualified vanpool groups. In most cases a van can be provided to a group within two to three weeks of receiving a request. A provision in the contract allows for a number of vans to be held in reserve to expedite the delivery process. The number of vans held in reserve varies with the level of activity experienced statewide. During low demand periods few vans are held in reserve to minimize expense. Conversely during high demand periods as many vans as needed will be ordered.
Vanpool Services, Inc., a subsidiary of the Chrysler Corporation, operates a number of third party vanpool programs throughout the nation. Vanpool Services and Chrysler work closely to ensure that a sufficient number of vans are on hand to meet the needs of these programs. To accomplish this, an inventory of commuter vans is maintained by Chrysler at the assembly plant. At the beginning of a model year (October), van inventories are lowest due to the need to close out the previous years' inventory and begin production of new model year vehicles. Inventory of new year vehicles will be low during the first two quarters since regular production will create a sufficient number of vehicles to satisfy the needs of dealerships, special orders, and programs such as Vanpool Services. Inventories will be highest during the third quarter (April, May, June) since production orders are no longer accepted after April. Program operators estimate the number of vans needed to close out the final months of the model year and thus an appropriate inventory is created.
In the event of an energy shortage in mid-winter, for example, vans could be put on the road quickly, first by taking vans from the reserve fleet, second by taking vans from Chryler's and other manufacturer's inventories, and third by placing production orders for the number of vehicles needed. In an energy emergency, where a great demand for vans may develop, it can be expected that the automotive industry would escalate its production levels accordingly.
If the Governor wishes to emphasize the need to participate in ridesharing programs, a press conference or additional publicity could be arranged to attract attention to the vanpool program. The cost of advertising is covered under the Public Information Programs section of this report.
· Vanpool costs are divided equally among the riders. Drivers ride free. The staff necessary to process applications and make rider matching arrangements are employed by the state and local ridesharing offices. Currently, a large portion of the staff's time is devoted to ridesharing promotion.
86

In a shortage, more staff time would be spent processing driver arrangements and matching riders. Since the availability of vans automatically limits the work load, it is projected that the existing staff could handle the additional vanpool requests temporarily by deferring other tasks. The procedure for starting a vanpool is as follows:
1. An employer or group of individuals indicate interest in .starting a vanpool. The Local Ridesharing Office assists in matching riders and potential drivers.
2. A check is made on the proposed driver's driving safety record. This takes two or three days.
3. The Bureaus of Urban and Public Transportation and Transportation Planning in MDOT conduct a transit analysis to make sure the proposed vanpool is not duplicating transit service. This takes approximately eight working days.
4. The Mass Transportation Planning Section processes the necessary arrangements and arranges for the delivery of the van. Since these activites occur simultaneously, the entire vanpool arrangement will take approximately two weeks. If requests become backlogged, it may take 1 onger.
Fue 1 Savings
Since there is a wide range in the number of new vans that might be available, fuel savings for the vanpool program were calculated for the lower (20 vans) and upper (200 vans) limits of the expansion. The vanpool program is a statewide program so it is difficult to estimate how many of the new vans would operate in the Lansing area. Currently, a disproportionately large percentage (25%) of the vans operate in Lansing due to the state vanpool program and location of the state offices. For this analysis, we assumed that 25 percent of the newly formed vans would also be located in Lansing. The fuel savings are presented for the total number of vans that might be available statewide and for the number available in the Lansing area. The fuel savings for the existing vanpool program were calculated separate from the fuel savings for the expanded program.
The fuel savings estimates were calculated using the methods developed in A Handbook For Evaluatin The Air ualit and Ener Im acts of Trans ortation System Management Strategies, by the Mic igan Department of Transportation. These calculations are based on Grand Rapids data. The fuel rates have been increased from those given in Appendix B due to the larger size of the Lansing urban area, and ~he longer average trip lengths for the work trip. Refer to Appendix B -~'or an explanation of the equation used in the following calculations.
87

Daily fuel consumption reduction= 1.375 (TE) TE equals the number of round trips eliminated by the vanpool. One van eliminates 9.444 round trip work trips per day.
For example; fuel savings from the current vanpool program are based on the 450 vans currently in operation around the state. The daily fuel savings from this program equals:
(TE) = 9.444 (450) = 4249.8
Daily fuel savings= 1.375 (4250) = 5,844 gals/day
During a 90 day period the ongoing vanpool program conserves 385,704 gallons of fuel, assuming 66 working days.
TABLE 10
VANPOOL FUEL SAVINGS
Total Total Daily Fuel Daily Fuel Savings Savings
Gallons Conserved Savings from Savings From Minimum Maximum By Existing Minimum Maximum Expansion* Expansion* Vanpools (66 days) Expansion Expansion ( 66 days) . ( 66 days)
Statewide 385,687 gallons 260 2,598 402,847 557,155
Tri -County 102,820 65 649 107,110 119,980
Legal and Political Issues
MOOT's arrangement with Vanpool Services requires that vans be leased for a minimum of 50 months. If commuters make a commitment to vanpool during a fuel shortage and abandon the vanpool after the initial emergency, MOOT will face a contractual obligation for idle vans. There is presently no arrangement to ensure a long term commitment to the vanpool by any of the participants. This introduces substantial risk to MOOT.
There are no legal barriers to the implementation of this measure. Refer to Appendix A for a discussion of insurance and liability issues.
Advantages
The contractual mechanisms are in place and the staff is trained. Rapid expansion of this program could take place with a small lead time.
Substantial fuel savings result from vanpools.
* This includes gallons saved by existing vanpools.
88

]J_i _s~dva_nta_ges
There is no requirement for a long term commitment to a vanpool. If riders abandon vanpools after the shortage, MDOT will be legally obligated to continue the leasing arrangement.
The number of vans available depends on the time of year.
Recommendation
This measure is recommended for inclusion in the Michigan Gasoline Shortage Response Plan. Local planning agencies should also consider providing assistance to local rideshare offices to expand this program.
89

INCREASE RURAL CARPOOL PARKING LOTS
[)escription
Rural carpool parking lots will trunklines outside urban areas. capacity will also be expanded. parking to commuters.
Intent
be built on major commuter routes along state Existing lots that are being used at near These lots will provide convenient, free
The intent of this measure is to facilitate carpooling among commuters who live outside of transit routes. This measure will be implemented during a moderate to severe fuel shortage.
Tran_sp_o_r_t_~tiQ_rl_jy_stel!l_i!nd Mobility Impacts
Rural carpool parking lots are used as meeting places for carpoolers who work in the same area but do not live near each other. This measure reduces vehicle miles of travel (VMT) and cuts down on traffic going in and out of central business districts. Parking needs in urban areas are also decreased. In some cases, mobility may be reduced because commuters can not dictate their own arrival and departure times from work. However, carpooling can offer relaxed travel and companionship.
~_ocL<!l_apd Economic Impacts
Long distance commuters who use rural carpool parking lots can reduce their commuting costs substantially depending on how far they drive, and how many members are in their carpool. The greatest amount of expansion and the most new parking lots will probably be in the Detroit Metropolitan area, where current usage is highest. Because of this, some taxpayers may feel their area is not getting equal facilities.
Implementation Procedures and ~osts
This measure will be implemented by the Governor instructing the Michigan Department of Transportation to constr-uct rural carpool parking lots. Locations where lots will be built or expanded are designated in the July 1981 Statewide Carpool Parking Lot Program Status _Rg£Q!t. Motorist demand for parking spaces will dictate the order of construction. Parking lots that are presently used at, or near capacity will receive first priority because they are well known, and demand for these spaces will increase more rapidly than the demand for parking in new locations.
The lots will be gravel, and where necessary drainage ditches will be provided. The Michigan Department of Transportation district maintenance crews and county road commissions will construct the lots, and the Michigan Department of Transportation will furnish temporary signs. The estimated cost for each parking s~ace is $500, and the estimated cost for each sign is $75. Statewide there are 2,503 spaces that are programmed for construction. If 10 percent of these spaces were constructed, ':he cost for labor and materials
91

would be $125,000; a 20 percent increase in available parking spaces would cost $250,000. Construction time is one to two weeks, and is limited to between late spring and early fall.
Legal and Political Issues
This is an expansion of an ongoing program so there arc no legal issues. However, political problems for the Governor, and/or local officials may occur. By giving this program high priority, construction crews will be taken from planned or ongoing projects to construct parking lots. Even though it is for a short period, people who are affected by the neglected projects may disapprove.
Fuel Savings
For the fuel savings estimate the average speed used was 40 mph and the o.verage round trip distance was 60 miles. The fuel consumption rate and method of calculation was taken from f1 Handbook for Evaluating The Air Quality and Energy Impacts of Transportation System Management Strategies. During the emergency period, there would be 66 working days, assuming a 5-day work week. Fuel savings was estimated on a statewide basis, and for the Tri County area as a test area.
Statewide
capacity current usage - number of cars parked X 60 miles X .04850 fuel consumption rate X 66 working days
Tri County
capacity current usage - numbers of cars parked X 60 miles X .04850 fuel consumption rate X 66 working days
5,013 3,153
189,180 VMT saved daily 9,187 gallons saved daily
606,342 gallons saved
464 228
13,680 VMT saved daily 664 gallons saved daily
43,824 gallons saved
If rural carpool parking lots were used to capacity, the statewide savings during the emergency period would be 963,990 gallons. In the Tri-County area, if the parking lots were used to capacity, the fuel savings would be 89,232 gallons.
Fuel savings gained from providing additional parking was calculated on a statewide basis, assuming a 100 percent occupancy. If 10 percent of the • i programmed parking spaces were built, the fuel savings during the emergency period would increase to 1,012,044 gallons; a 20 percent increase in programmed parking spaces would save 1,060,158 gallons. To be cost effective in the Tri-County area, the minimum increase in programmed parking spaces would be 20 percent. This would cost $15,500 and would increase the fuel savings from this program to 95,172 gallons. A .30 percent increase in the programmed
92

spaces in the Tri-County area would cost $23,500, and the fuel savings benefits would increase to 98,274~ gallons. The following chart summarizes the costs incurred and the fuel savings from this program.
TABLE 11
RURAL CARPOOL PARKING LOTS - COSTS AND FUEL SAVINGS
% Increase In Programmed Fuel Savings Parking Fuel Savings Total # of in Gallons S[!aces New S[!aces Cost in Gallons S[!aces at 100% Occu~ancy
Statewide 10% 250 $125,000 48,048 5,263 1,012,044 20% 500 $250,000 96,162 5, 513 1 , 060,158
Tri County 20% 31 $15,500 5,940 495 95,172 30% 47 $23,500 9,042 5ll 98,274
Advantages
Rural carpool parking lots facilitate carpooling among commuters who live outside of transit routes.
This measure can be implemented quickly and with minimum funding.
Disadvantages
Work crews may be diverted from planned or ongoing projects to construct parking lots.
Construction of new parking spaces is limited to between late spring and early fall.
Recommendation
This measure is recommended for inclusion in the Michigan Gasoline Shortage Response Plan.
93

PROMOTE FLEX-TIME SCHEDULING FOR STATE EMPLOYEES
Description
Flex-time scheduling allows state employees to vary their work schedules. Starting time would be between 7 a.m. and 9 a.m., and quitting time would be between 4 p.m. and 6 p.m. All employees will be present during the "core" working hours of 9 a.m. and 4 p.m.
Intent
The intent of this measure is to encourage state employees to participate in ridesharing programs. Ridesharing includes carpooling, vanpooling and transit. This program will be implemented during a moderate energy shortage, and will be used to lead into imp-lementation of other programs contained in the gas plan.
Transportation System and Mobility Impacts
Flex-time scheduling will make transit use more convenient and less time consuming for state employees whose current work schedules conflict with bus schedules. In addition, an adjusted work schedule allows state employees to use mass transit during less crowded periods, which wou1d increase transit capacity.
Flex-time also encourages the formation of carpools and vanpools. State employees who find joining a carpool or vanpool difficult because of work schedule conflicts would be permitted to change their work schedule. In addition, flex-time promotes the formation of carpools and vanpools between state employees who work in the same area but for different departments with different work schedules.
Flex-time helps to stretch peak hour traffic over a longer period of time. The majority of state employees work at the Lansing area downtown state government complex or at the state secondary complex. Flex-time would help to decrease traffic congestiJn at these locations because state employees would be coming and leaving work at different times. Stop-and-go traffic in parking lots from cars waiting to leave would also be alleviated. This would save fuel and reduce vehicle emissions.
Implementation Procedures and Costs
This measure will be implemented by the Governor announcing to the directors of each department that state employees may adjust their work hours to participate in ridesharing programs. In addition, a letter from the Governor will be distributed with state employee paychecks to inform them of this program, and to encourage participation. Employees must obtain written approval from their supervisors to be eligible for this program. They will be allowed to arrange their own schedules, but starting and ending times must be kept on a regular basis.
95

·Some state employees, by the nature of their positions, will be exempt from this program. An example of this is employees who have regularly scheduled appointments, such as a social services caseworker. Work crews who travel to and from work sites as a unit would also be ineligible.
The following cost analysis is based on the cost of implementing flex-time for state employees. Additional building utility costs are also included. Paperwork costs of work hour rescheduling were not estimated because flex-time approval is granted by the employer's direct supervisor. The lead time required to implement this program is about two weeks.
building utility costs printing of program announcements distribution of announcements
Social and Economic Impacts
$33,000.00 655.00 150 0 00
Studies show a few benefits gained from flex-time scheduling are improved employee morale and reduced absenteeism. In addition, state employees who participate in a ridesharing program will enjoy reduced commuting costs. Some departments have opposed flex-time over concerns that productivity may be slowed during periods that employees are unsupervised. However, supervisors will be available during the core working hours of 9 a.m. and 4 p.m. to assist employees.
Legal and Political Issues
The Governor, as chief executive, has the constitutional authority to implement this measure. By promoting state employee participation in ~idesharing programs, the Governor will illustrate the state's commitment to conserve fuel. This measure will also encourage other employers to initiate flex-time scheduling to aid their employees in joining ridesharing programs.
Some state employees are union members. Due to collective bargaining issues, the state must obtain authorization from the union to allow their members to participate in this program.
Fuel Savings
Flex-time helps to increase vehicle occupancy and transit ridership, which reduces vehicle miles of travel. Traffic flow improvements and lowered vehicle emissions are also gained from reduced traffic congestion and elimination of trips during the peak hour. The average speed used in the calculation was 25 mph. The fuel consumption rare was taken from A Handbook For Evaluating the Air Quality and Energy Impacts of Transportation Systems Management Strategies. Assuming 5-day work weeks, there would be 66 working days during the 90-day emergency period. Currently, there are 64,080 state employees. The calculated fuel savings from two percent of the state employees participating in this program are as follows:
average round trip distance X consumption rate in gallons/mile x 1,282 state employees x 66 working days
96
19 miles .05600 1,364 daily fuel savings. 90,024 gallons
'----i
r :
l i
. i-- j
If five percent of the state employees participated in this program the fuel savings will be 224,998 gallons. If 10 percent of the state employees participated in this program, the fuel savings will increase to 449,995 ga 11 ons.
Advantages
Flex-time scheduling will aid state employee participation in ridesharing programs.
Fuel savings and traffic flow improvements will be achieved if state employees respond positively to this program.
Disadvantages
Productivity may be slowed during periods that state employees are unsupervised.
Recommendation
This measure is recommended for inclusion in the Michigan Gasoline Shortage Response Plan.
97

i ·. ' ;
i ~ '
PROMOTE FLEX-TIME SCHEDULING FOR THE GENERAL PUBLIC
Description
Flex-time scheduling will allow employees across the state to vary their work schedules. Employers have four recommended options to offer their employees. One option is employee-chosen staggered work hours, where starting times range between 7 a.m. and 9 a.m., with quitting time dependent on the starting time. After adjusting their hours, employees are required to keep regular daily schedules.
The other three options are less regimented. Flexible starts allows employees to start work between 7 a.m. and 9 a.m., with variable quitting times and a designated lunch hour. Flexible hours has varied starting and ending times, with a varied lunch hour. Flexible days permits an employee to vary the number of hours they work per day, as long as they work 80 hours every two weeks. During the two-week period, an employee can accumulate hours and use them to take all or part of a day off.
Intent
The intent of this measure is to encourage employers in Michigan to adopt flex-time scheduling to facilitate employee participation in ridesharing programs. Ridesharing includes carpooling, vanpooling, and transit. This program will be implemented during a moderate energy emergency.
Transporation System and Mobil tty Impacts
Flex-time scheduling makes transit use more convenient and less time consuming for workers whose current work schedules conflict with bus schedules. In addition, an adjusted work schedule will allow employees to use mass transit during less crowded periods, which increases transit capacity.
Flex-time also encourages the formation of carpools and vanpools. Employees who find joining a carpool or vanpool difficult because of work schedule conflicts v;ould be permitted to change their hours. In addition, flex-time promotes the formation of carpools and vanpools between people who work in the same area but for different employers with different work schedules.
Flex-time helps to stretch peak-hour traffic over a longer period of time, and helps to decrease traffic congestion at locations where large numbers of employees come and leave work at the same time. Stop-and-go traffic in parking lots from cars waiting to leave will also be alleviated. This will save fuel and reduce vehicle emissions.
99

Social and Economic Impacts
These four flex-time options are popular with workers. Many employers report that fl 'ex-time scheduling reduces absenteeism and improves employee mora 1 and productivity. Where business hours are extended, customer services can be improved. In addition, employees who participate in a ridesharing program enjoy reduced commuter costs.
Some employers have opposed flex-time because of concerns that productivity can be slowed during periods that employees are left unsupervised. However, supervisors could make adjustments in their schedules to be available to assist employees.
Implementation Procedures and Costs
This measure will be implemented by the Governor appealing to employers in Michigan to allow their employees to adjust their work hours to participate in ridesharing programs. Due to the diversity in business services, union contracts, and personnel policies, employers will choose the flex-time option and method of implementation.
Many employers will not be able to offer treir employees flex-time scheduling. A few examples of this are restaurants that schedule employees to work during meal-time rush~s, or department stores that schedule employees during evening hours when customer volumes are highest. Employers that schedule daily staggered work shifts to maintain continuous production will also find initiating this program difficult. Union contracts and collective bargaining issues can also prevent some employers from adopting flex-time scheduling.
The cost for rescheduling employee hours will be the responsibility of the employer, and will vary depending on how many employees there are, the flex-time option chosen, and the method of implementation. Employers will also be responsible for paying additional building utility costs.
Legal and Political Issues
Acceptance of flex-time scheduling will be on a voluntary basis. Since the employer is required to fund this program, and because not all employers will be able to institute flex-time scheduling, there is no legal way to force employers to implement this measure.
Fuel Savings
Flex-time helps to increase vehicle occupancy and transit ridership, which reduces vehicle miles of travel (VMT). Traffic flow improvements and lowered vehicle emissions are also gained from reduced traffic congestion and elimination of trips during the peak hour.
100

: -]
The Tri-County area was used as an example to estimate fuel savings from flextime scheduling. Based on a 19-mile round trip distance, the average speed used for this calculation was 25 mph. Assuming 5-day work weeks, there will be 66 working days during the 90-day emergency period. The fuel consumption rate and method for calculating fuel savings came from A Handbook for Evaluating the Air Quality and Energy Impacts of Transportation Systems Management Strategies. If this measure reduces areawide VMT by five percent, the fuel savings would equa 1 :
Daily areawide VMT X percent reduction in areawide VMT X consumption rate in gallons/mile Daily fuel savings X 66 working days
8,177,290 5% .05600 22,896 gallons
l,5ll,l36 gallons
The Urban Network and UTPS computer models for Lansing were used to estimate fuel savings from increasing peak hour transit service to two hours in the morning and two hours in the evening in response to area businesses allowing employee flex-time scheduling. Results indicated that 27,816 auto trips would be removed, which would save 769,692 gallons of gasoline during the 90-day emergency period. This is 2.16 percent of the areawide fuel consumption and is included in the fuel savings listed above.
Advantages
Flex-time scheduling aids employee participation in ridesharing programs.
Fuel savings and traffic flow improvements are achieved.
The cost and time required to implement this program are minimal.
Disadvantages
Flex-time scheduling could slow employee productivity when workers are left unsupervised.
Some employers in Michigan will not participate in this program.
Recommendation
This measure is recommended for inclusion in the Michigan Gasoline Shortage Response Plan.
101

VI I. PARKING MANAGEMENT

I._·-,
' C.--
VII
PARKING MANAGEMENT
Introduction
Parking management measures work to reduce vehicle trips by reducing the ease and convenience of solo trips. This is accomplished by reducing or eliminating parking available to solo vehicles and by increasing parking available to multiple occupancy vehicles. This may be accomplished in several ways and this section discusses the more common measures. Parking management measures can range from mild, voluntary programs such as suggestions that parking in certain areas be reserved for multiple-occupancy vehicles, to severe, mandatory programs such as prohibitions against all parking in specified large areas.
While parking management is an independent tool for reducing vehicle miles of travel, its effects cannot be easily separated from other forces which work to the same end. In fact, the effect of parking management will depend upon the circumstances. For example, if parking is adequate under normal conditions and shortage conditions cause a reduction of 20 percent in the number of solo vehicles, then closing 15 percent of the parking spaces to those vehicles will have no effect.
Since the effect of parking management measures is unpredictable and dependent upon other forces, these measures will be considered to produce an additional incremental improvement in vehicle occupancy. The effect required to produce that incremental improvement will be evaluated.
Take as an example, the situation where an employer has 120 employees and the vehicle occupancy for their work trips is 1.2. The employer supplies 100 parking spaces. During a fuel shortage, vehicle occupancy goes up to 1.3 as a result of the increased price and decreased availability of fuel. Now the 120 workers use 92 vehicles, leaving eight vacant parking spaces. If the employer wants to increase vehicle occupancy an additional .1 person, he will need to eliminate those 8 parking spaces and 6 additional spaces. Removing 14 parking spaces would improve vehicle occupancy by .2 persons, from 1.2 to 1.4, but only .1 of the .2 would result from the parking management measure of eliminating those 14 parking spaces.
All of the acceptable parking manage~ent measures will be applied in a way that increases vehicle occupancy by a fixed amount above the amount caused by other forces. The effort required to produce this incremental change will be eva·l uated.
105

. 1 '
t_ ·.'
USE THE STATE PARKING STRUCTURE AS A RIDESHARE INCENTIVE
Description
Reserved parking in the downtown Lansing state government complex parking structure will be offered to state employees as a rideshare incentive. About 100 spaces will be made available by removing state motorpool vehicles .to surface lots. Employees who currently park in the structure will be encouraged to double-up to make additional parking available to other rideshare vehicles.
Intent
The intent of to rideshare. shortage.
this measure is to save gasoline by encouraging state employees This measure will be implemented during a moderate energy
Tr_a.n2!JQ_r_til t i o fl_~s_:t;~_lll__i!_Tl_<1_]'1o b i lJk Impacts
This measure is directed at the work trip. It will and vanpools, reducing the number of vehicle trips. will reduce congestion during peak traffic periods.
move employees into carpools This reduction in trips
The effects on mobility are mixed. The state worker no longer has ready access to a vehicle at lunch and for errands on the way home, but the other household members have all-day access to a vehicle which was previously unaccessable during each work day.
Social and Economic Impacts
Commuters who continue to ride alone will be unaffected by this measure. Commuters who rideshare as a result of this measure will save on their commuting costs.
Implementation Procedure and Costs
State employees located at the state office complex will be notified of this measure in their pay checks immediately following an energy emergency declaration. Information will also be available from the Parking Management Office which will be staffed full-time during the emergency. The notification will indicate that 100 new indoor parking spaces will be made available for rideshare parking during the emergency. The spaces will first be available to the owners of vans with eight or more occupants and then to the owners of vehicles with three or more occupants. These commuters will pay the standard parking rate through payroll deductions and parking will be available only for the dul"ation of the emergency.
This measure will also encourage rideshare participation by employees with regular reserved parking. As a part of the information package, each of these drivers will receive a carpool card and instructions for its use. Each driver will be requested to start a carpool of at least three occupants and to have ~ach participant list their name and office telephone number on the card. The driver will then place the card in the windshield of the car.
107

Drivers will be encouraged to make their vacant spaces available informally, for the duration of the emergency, to other rides hare drivers. In this way they can recover their parking costs while they are temporarily ridesh()ring with someone else, and still retain control of their park4ng space for use wh.en the emergency is over.
The degree of participation will be periodically determined by sampling vehicles parked in the parking structure and randomly contacting rideshare members listed on the cards to verify their participation. Th~ degree of participation will be publici~ed.
Total information dist.ribution costs will be about $1 ,000 and the three month increase in the parking management staff of two full time positions will cost about $8,000.
Since this procedure allows the employee to form a carpool and retain a parking space, no provision is made to change parking payments.
Legal and Political Issues
All of the issues for this measure deal with the relationship between employer and employee. This measure does not raise issues with local units of government or businesses.
For most employees working most places, easy access to employer-owned employee parking is recognized, either tacticly or explicitly, as a fringe benefit of employment. For employees working in state-owned buildings, the state provides about 4,500 parking spaces. About 2,200 of these spaces are assigned spaces located in the state parking structure, for which employees pay 66 cents per day. These spaces are considered so desirable that the waiting period for assignment to a reserved space is about three years.
Employees who have waited a long time for the privilege of parking in the parking structure and who pay for that privilege must consider the privilege to be a valuable fringe benefit. These employees will probably strongly resist state attempts to manipulate their parking spaces. Voluntary implementation of this measure will avoid any adverse reaction.
Fuel Savings
The fuel savings depends upon the number of solo work trips eliminated by the measure. As discussed in the introduction to this section, this depends upon the effect of other rideshare measures.
The June 1980 report, "Secondary Complex Occupancy Study" found an overall vehicle occupancy of 1.33 for vehicles at the secondary complex. If downtown vehicle occupancy is also 1.33 and if rideshare measures increase it to 1.43, 154 vehicles will be removed from the 2,200 vehicle parking structure. If parking management then increases occupancy from 1.43 to 1.53, it will remove 134 vehicles from the parking structure. The 134 fewer work trips attributable to parking management represent a three percent reduction in work trip fuel consumption for state employees parking in state parking spaces.
108
I '- i
·-.)
If the 288 parking spaces vacated by rideshare and parking management are made available to new rideshare vehicles from the state-owned surface lots,
.. an additional 461 work trips will be saved. This level of parking control will save a total of 595 work trips for a 13 percent reduction in state employee work trips.
In addition, if the 100 state vehicle parking spaces are used for van parking with an average van occupancy of seven, 600 more trips can be saved.
If each work commute is 19 miles round-trip and fuel consumption is .0560 gallons/mile, daily fuel savings will be:
(134+461+600) x 19 x .0560 = 1271 gallons, with a total of 83,918 gallons for the 66 work days during the emergency.
Advantages
This measure provides direct encouragement for state employees to rideshare and should increase the fuel savings resulting from ridesharing.
This measure represents positive action by the state and sets an example for others.
Disadvantages
Changing the rules for· assigning parking spaces may cause disorder.
Recommendation
This measure should be included in the Michigan Gasoline Shortage Response Plan.
109

, I
')
PROVIDE PREMIUM PARKING FOR CARPOOLS
Description
For this measure, the most desired parking spaces will be reserved for, or otherwise made .available to rideshare vehicles. Both municipal and private parking areas will be included in the measure.
Intent
This measure will increase the appeal of ridesharing by taking preferred parking spaces from single occupancy vehicles and supplying them to rideshare vehicles. This measure is only an inducement to carpool and cannot force shifts from single occupancy vehicles. This measure will be implemented during a moderate energy shortage;
Transportation System and Mobility Impacts
The effect that this measure will have will depend, in part, upon the number of parking spaces compared to the number of rideshare vehicles. This measure would tend to reduce congestion and might reduce transit ridership.
Of the employer·s located in the Lansing central business district, only 15 percent provide employee parking and 32 percent pay for employee parking. Most employer parking lots are small and spaces set aside for rideshare parking would be no more desirable than any other spaces in the parking lot since walking time to work would be nearly the same for all spaces in the lot.
The city provides in this measure. incentives in the
2,093 monthly parking spaces which could be used Lansing has indicated that it may implement rideshare future to balance parking supply with demand.
The private parking system provides 405 spaces for monthly public parking. These spaces can also be used in this measure.
Social and Economic Impacts
Th.is measure is expected to have no social or economic impacts beyond those normally related to ridesharing.
Implementation Procedures and Costs
This measure will be one of the voluntary measures recommended to the local units of government and major employers by the governor when he declares an energy emergency. This measure can be implemented either by reserving selected parking locations for rideshare vehicles or by allowing rideshare drivers f·)rst choice of the parking 1 ocations. Either method of impl ementati ng this measure requires a minimum administrative cost and no new personnel.
The si:".1plest implementation would be to set aside special days during which only rideshare drivers could rent parking space for the following month. After the rideshare drivers had rented their spaces, the rest of the spaces would be available to the general public.
1:1

Legal and Political Issues
To impose this measure on local units of government and employer~, as a mandatory demand restraint measure would create more problems than the benefits would warrant. Lansing, for example, must repay the bonds which financed the municipal parking structures from funds generated by th0 pa.rking system. If a mandatory parking restraint measure resulted in a s·ignificant loss in parking revenue, Lansing would be unable to fulfill its parking bond obligation.
About 15 percent of the downtown Lansing employers supply free employee pQrking and 32 percent pay for employee parking. Free parking probably represents a negotiable employee fringe benefit, not to be tampered with lightly.
As a voluntary program, this measure should not create legal or political issues.
Fuel Savings
Since most downtown employers do not provide employee parking, and those that do have small parking lots, fuel savings will be based upon the 2,093 municipal ~nd 405 private monthly parking spaces. According to the Lansing downtown parking study, 14.2 percent of downtown employees rideshare, 60.1 percent ride alone and the rest take the bus, walk, or bicycle. If the 14.2 percent ~ho rideshare have the same occupancy as ridesharers to the secondary complex; 2.60, the 14.2 percent who rideshare represent 5.46 percent of the vehicles. For the 2,498 monthly parking spaces, 2,286 will be single occupancy parking and 212 will be for rideshare vehicles, for an average occupancy of 1.14. Remember that more than 25 percent of the downtown employees use other modes tc commute. If other rideshare measures increase vehicle occupancy from 1.14 to 1.3, those 2,837 employees will ride to work in 2,182 vehicles,. leaving 316 vacant spaces for transient parking. If this measure increases vehicle occupancy to 1.4, 156 additional spaces will be vacant, which is a reduction in daily work trips of 6.2 percent.
For 156 daily 19 mile round trip commute trips, with an average fuel consumption of .0560 gallons per mile, the fuel savings for 66 working days during the emergency is a follows:
156 X 19 X .0560 x 66 = 10,955 gallons
Advantages
This measure provides incentives for downtown workers to rideshare and should increase the fuel savings resulting from ridesharing.
This is a low-cost, easily implemented measure.
Disadvantages
Results depend upon public acceptance, which is unpredictable.
Recommendation
This measure should be evaluated for inclusion in local contingency plans.
112

i
.· .. I
SET DIFFEREIHTAL RATE STRUCTURES FOR PARKING
Description
This measure will lower the monthly parking rates of rideshare vehicles, compared to rates for single occupancy vehicles.
Intent
This measure will use a financial incentive, lower parking cost, to encourage increased ridesharing. This measure can be used as an alternate to the premium parking for carpools measure since both are directed at the same group of drivers. This measure will be implemented during a severe energy emergency.
Transportation System and Mobility Impacts
This measure will likely have little effect upon the transportation system. Parking costs are a small part of the costs of commuting to work and reductions in parking costs for rideshare vehicles will do little to encourage the drive-alone commuter to' ~ange, especially when fuel costs are rapidly increasing because of an energy crisis.
Social and Economic Impacts
Parking is managed by local businesses or local units of government. These business and municipal parking facilities are intended to produce income or serve a public need. State modification of the parking rates can disrupt the whole parking management system. For the city of Lansing, the bond ordinance under which the 1966 parking structure construction bonds were issued contains numerous constraints on the operation of the municipal parking system. The system must generate the revenue needed to satisfy the parking bonds. Money from other sources cannot be used. This, plus the fact that the state has no way to directly control the price structure of private parking facilities, makes a variable pricing structure a difficult short-term measure to implement.
Urban parking is a dynamic, emotional problem. State intervention, even in time of crisis, will result in political repercussions.
Implementation Procedure and Costs
This measure will be implemented on a voluntary basis. The measure will not change the operation of the parking system and implementation costs should be minimal.
Legal and Political Issues
Parking is a major urban problem, many urban areas have spent much money and time in the development of parking management programs. Urban businesses believe that their livelihood depends on how well parking is managed. In almost every community, parking 'is a very intense po 1 itica 1 issue. Any attempt by the state to change loca 1 parking management decisions, even during a temporary crisis, will produce political problems.
113

Municipal parking bond iss.ues may carry with them rules which effectively preclude the use of differential rc~te structures, especially as quickresponse emergency measures. Private facilities ho.ve their own rate schedules and the state may be constitutionally unable, even under Pu~lic Act 38 as amended, to impose parking rates on them.
Fuel Savi~
Since ':his measure de.als with the same parking system considered in the preferential parking measure, potential fuel savings are the same. However, as fuel prices increase and p.arkin.g costs r.emain relatively fixed, the percentage of total commuti n.g costs devoted to parking decreases. The desirabi 1 ity of a, parking location or the availability of parking a.re much stronger inducements to ri deshare. This measure wi 11 n.ot save much fuel.
Advantages
This measure provides incentives fo.r downto,wn workers to rideshare and should increase the fuel savings resulting from ridesharing.
Disadvantages
Because of the relative low cost. of parking, any discount which could be given for ridesharing would be small <~nd would provide little incentive to rideshare.
This measure could decrease parking revenue which could cause financial and legal problems for parking structure owners.
Downtown businesses wi 11 oppose restrictive changes to the parking system.
Recommendation
This measure is not re.commended for inclusion in energy contingency plans.
114

RESTRICT PARKING IN DOWNTOWN AREAS
Description
This measure will eliminate on-street parking during daily peak traffic periods.
Intent
The measure is intended to reduce the amount of parking available to commuters so that they will rideshare or use transit, and to improve peak hour traffic flow by removal of parking on congested through-streets during that time. This measure will be implemented during a severe energy emergency.
Transportation System and Mobility Impacts
Lansing provides about 1,300 metered parking spaces on downtown streets. Of these, about 430 have time limits of more than two hours, the remainder. are intended for shoppers and other short term users. On-street parking represents about 30 percent of the parking spaces available in the municipal system. Parking is allowed throughout the day at most parking spaces. A few spaces near the state office building are restricted from 7 to 9 a.m. and 4 to 6 p.m.
A Lansing survey of downtown worker commuting habits indicates that only 3.3 percent of the commuters park on the street.
This measure will increase ridesharing and transit demand during peak traffic periods. Illegal parking can also be expected, while customer mobility during early morning and late afternoon business hours will be reduced. Downtown shopping may diminish as a result of this measure.
Social and Economic Impacts
With on-street parking eliminated between 7 and 9 a.m. and 4 and 6 p.m., people will tend to restrict their shopping to between 9 a.m. and 4 p.m. They may also choose to shop where parking is more convenient. The most probable result is a loss of downtown business.
Assuring that curb lanes are free of parked vehicles will require increased enforcement of parking regulations. Doubling the parking meter checking staff for the duration of the three-month energy emergency would cost about $40,500. .
Implementation Procedures and Costs
This measure will be implemented by executive order. Increased enforcement of parking regulations will cost $40,500.
115

This measure will be implemented under Public Act 38, as amended. This measure will cause confusion and controversy, since it will be perceived as a threat to the 1 i vel i hood of the downtown business community. Si nee most commuters use off-street parking, this measure will have little effect upon their driving habits.
Fue 1 Savings
Indications are that about 400 downtown employees park on Lansing streets. This measure can save as many as 400 trips per day.
Advantages
This measure will decrease congestion slightly during peak traffic periods.
Disadvantages
This measure can only have a minimal impact on work trips and may do damage to downtown businesses.
To be effective, this measure requires strict enforcement since even one parked vehicle can disrupt traffic flow.
Since the few commuters who park on the street can probably find off street parking, this measure will not encourage ridesharing.
Recommendation
This measure is not recommended for inclusion in energy contingency plans.
116

LIMIT THE USE OF PARKING STRUCTURES TO CARPOOLS ONLY
Description
This measure will prohibit non-rideshare vehicles from parking in parking structures.
Intent
The intent of this measure is to make commuter parking readily available for rideshare vehicles and relatively unavailable for driver-only vehicles. This measure is an extension of the measure; Premium Parking For Carpools. This measure will be implemented during a severe energy shortage.
Transportation System and Mobility Impacts
Municipal parking structures offer l ,512 monthly parking spaces. Of these, 215 are currently rideshare spaces (14.2 percent). Transformation of the remaining 1,297 spaces would affect all other travel modes.
It is difficult to know how people who insist on driving to work alone will react to an emergency measure which is intended, at least in the short run, to discourage drive-alone trips. Many of the 1,297 drivers who drive alone will probably be disinclined to change their driving habits but will rather find new parking places. Some others wi 11 rides hare or change to trans it or other modes.
Those drivers who intend to continue to drive alone will probably find ample parking in the transient parking areas, which will create a shortage of parking for downtown customers. A shortage of customer parking will prompt the conversion of unused monthly parking spaces to transient parking.
Social and Economic Impacts
This measure will force downtown employees to either change their commuting habits or their parking habits, depending on whether they intend to comply with or evade the measure. This degree of compliance will determine the type and extent of other effects on the transportation system. Every commuter who decides to continue to drive alone will either use a transient parking space or will park illegally. Either will increase congestion; the former because transient parkers will spend more time looking for parking spaces, the latter because illegal parking disrupts traffic flow. This non-comp1iance will create an economic hardship for downtown businesses by making travel and parking more difficult. This detrimental effect can be overcome by strict enforcement of all parking regulations.
This measure may simply result in a redistribution of parking, with more transient parking and less monthly parking in the parking structures. If so, the measure will not have an economic effect upon the municipal parking system. If the measure produces many vacant parking spaces, it may put Lansing in danger of defaulting on its parking structure bonds.
ll7

Implementation Procedures and Cost
This measure will be implemented by executive order. Costs will be local costs to administer and enforce the program. The major enforcement effort will be to increase enforcement of onc•street parking regulations, to minimize evasion of the measure. Lansing employs six parking meter checkers at an annual cost of about $27,000 each. Doubling the enforcement for three months would cost about $40,000.
Legal and Political Issues
Management of downtown parking is a sensitive issue which affects the livelihood of downtown businesses and the viability of the whole downtown area. In Lansing, as in most cities, control of downtown parking is a continual planning process stretching over 20 or 30 years and involving financial obligations and legal restrictions not easily changed.
If the measure is anticipated to result in a loss of parking revenue, Lansing may be legally unable to implement it. If the measure is perceived to reduce available parking capacity and, as a result, curtail downtown business, a will create a major political confrontation.
Since the governor has no authority to change the operation of privately run facilities, the monthly parking structure spaces controlled by private industry a.re not affected by this measure.
Fuel Savings
This measure deals with the 1,512 municipal parking structure monthly parking spaces. Of these spaces, 1,297 are used for single-occupancy vehicle parking. If this measure forced all 1,297 of these drivers to rideshare at the 2.6 rate found in the Secondary Complex study, 714 vehicles would be used and 583 spaces would be vacated and available for transient parking. This is the maximum expected trip savings. Actual trip reductions would be substantially less.
Advantages
This measure forces drive-alone commuters to take some form of action and has the potential to save a substantial amount of fuel.
Disadvantages
Drivers can easily evade the intent of the measure by parking in transient parking areas.
Parking revenues may decline.
Businesses will perceive the measure as discriminatory against the downtown business community.
Recommendation
This measure is not recommended for inclusion in energy contingency plans.
118

' l l '
(-·
CLOSE PARKING STRUCTURES
Description
In the event of a severe gasoline emergency, this measure will close all parking structures.
Intent
This measure will force downtown employees and shoppers to shift to transit and to high occupancy ridesharing by eliminating about 5,575 parking spaces by closing all municipal, private, and state parking structures. Surface lots and street parking will not be controlled. This measure will be implemented during a severe energy shortage.
Transportation System and Mobility Impacts
The state, city, and private parking structures supply about 5,575 parking spaces. Closing these structures will have a major effect upon 3,877 commuters and l ,698 shoppers in the downtown area. These drivers will fill available surface parking spaces and will then compete with other commuters and shoppers for the remaining parking spaces, will change travel modes, or will not make trips downtown.
Downtown workers will rideshare, or because of their numbers, overload the transit system and saturate the parking system.
The principal effect of this measure will be to substantially reduce downtown shopping trips with a corresponding increase in trips to shopping centers.
Social and Economic Impacts
The application of this measure will affect the Lansing downtown area. Removal of about half of the available parking in the downtown area will make working and shopping difficult and unattractive.
Parking availability and accessability are the major differences between central business districts and shopping centers. Customers will shop wherever parking is most accessable. This measure will substantially reduce the amount of transient parking available downtown, but will not affect shopping-center parking. The result ',~ill be a shift of business from downtown to suburban shopping centers.
During the three-month duration of an energy emergency this measure could result in a permanent shift of business from the downtown area, resulting in irreparable harm to the central business community,
This measure would also cause a substantial loss in parking revenue. Lansing would lose about $290,000.
119

Implementation Proced~res and Costs
This measure win be implemented by executive order. Since this measure involves closing parking structures and reducing parking services, no additional costs are anticipated beyond the revenue lost by the city which is about $290,000 for three months.
Legal and Political Issues
While the state has legal i!Uthor':ty to close parking structures during an energy emergency, it may have to PaY the structure owners the revenues lost because of the state's action. For Lansing, the loss of revenue WOI!ld be about $290,000.
This measure will be amon.g the most repressive and politically unpopular measures which could be taken. The economic disruptions that it will cause will create political factions and generate turmoil.
Fuel Savings
Since the response to this measure is unpredictable, fuel savings can not be estimated.
Advantages
Downtown employees and shoppers will be forced to change their modes of travel and reduce the number of trips.
Disadvantages
Transit and the parking system will be overloaded and congestion will increase.
Lansing will lose more than a quarter of a million dollars in parking revenue.
Business will shift from downtown to fringe shopping centers.
This measure will create substantial legal and political problems.
f<ecommendation
This measure is not recommended for inclusion in energy contingency plans.
120
' /
REDUCE HIGH SCHOOL STUDENT COMMUTING
Description
Students, parents, and school administrators will work together to provide essential transportation services and minimize student driving.
Intent
This measure will reduce high-school student commuter trips by encouraging students to ride school buses and by providing transportation for extracurricular activities. This measure will be implemented during initial stages of an energy emergency.
Transportation System and Mobility Impacts
Depending on whether the school systems provide transportation for all students who live beyond walking distance, the school system may need to arrange for more capacity to accommodate the increased ridership caused by this measure. Although this measure may reduce peak-hour congestion near the schools, its main effect will be the reduction in student home-to-school trips. Efforts will also be made to supply transportation for extracurricular activities, to minimize the need for student driving.
Social and Economic Impacts
Teenagers find that high school represents their first opportunity to increase their mobility. To fulfill their own need for mobility and to respond to peer pressures, high school students make whatever arrangements they can for access to automobiles. In the Lansing tri-county area about 2,400 students drive to school.
Many of these students drive so that they have a way home after participating in extra curricular activities or so that they can drive to work after school. For many others, driving to school with a car load of friends is a major social activity.
In any case, students are likely to respond poorly to school imposed driving restriction such as bans on student parking.
Rather than lose their opportunities to drive, students will probably park on neighborhood streets, with resulting friction among the students, property owners, and school administration. These battles have been fought before and the result is student parking.
School systems which do not provide enough bus capacity to transport all of their students will need to make arrangements "nr additional transportatjon.
Implementation Procedure and Cost
This measure will be most effective when implemented as a cooperative effort of the students, their parents, and the school administration. Students and
121

:-·--.·:·:·--·; .-.-.-.;.·.:-:-:•:-:,c·_~<--:·~":·;-_-._.: .. :-c,-:::;_1
their parents need to be convinced of the need to conserve gasoline and of the merit of reducing student driving. Actions must be organized so that parental and peer pressures work to discourage student driving. The school system may need to reroute busses, rearrange schedules or school hours, or offer carpool computer matching if' order to have the capacity needed to transport all of the students. In addition, the school administration should offer positive methods to provide transportation home after extracurricular activities, such as the use of school buses or computer matched carpools.
This voluntary action will have negligible implerrentation costs.
Legal and Political Issues
As a voluntary measure, this measure presents no legal or political problems.
Fuel Savings
In the ' .. ansing area about 2,400 students drive about 8 miles each day to and from school. Potential savings for the 66 school-day duration of the emergency at a consumption rate of .06622 gallons per mile is:
2400 X 8 X .06622 X 66 = 83,920 gallons
Advantages
This measure will encourage high school students to ride school buses and rideshare, and thus reduce student commut'ng.
Disadvantages
To be effective this measure requires a coordinated effort of students, parents, and school administrators.
This measure may require schools to increase transportation capacity.
This measure may conflict with using school buses as transit vehicles.
Recommendation
This measure is recommended for inclusion in local contingency plans. Local planners will have to coordinate this program with area school districts.
122

••• -- ·-~.··· • '-:",'0-'"'''""'" '' .-.-.... ::_:-::::·
CHARGE FEES FOR PARKING AT SHOPPING MALLS
Description
A parking fee, by time or at a set rate, would be established at urban area shopping malls.
Intent
The intent of this measure is to reduce discretionary travel and to encourage carpooling for the shopping trip. This measure would be implemented under a severe energy emergency.
Transportation System and Mobility Impacts
This program would not necessarily reduce discretionary travel or encourage carpooling. To avoid paying for parking, shoppers may divert trips to stores with free parking, which could increase vehicle miles of travel (VMT). In addition, this measure does not provide an incentive to combine trips to reduce discretionary travel, because shoppers will be charged for parking regardless of trip purpose.
Since parking rates are based on time or at a set rate, this measure does not offer shoppers an incentive to carpool. Almost all shoppers will find it easier to pay the fee instead of carpooling to the mall. However, mall employees may form carpocls to share the expense.
This measure would also affect peak-hour traffic. Decreased commuter bus ridership or decreased vehicle occupancy will cause increased traffic congestion and VMT.
Social and Economic Impacts
One of the main customer draws to shopping malls is convenient, free parking. Currently, the cost of operating and maintaining the parking lot is included in the rental rates of the stores in the malls. By charging for parking, mall business could be decreased because shoppers will be inclined to go to stores where they have free parking and the same items.
This measure also conflicts with using portions of shopping mall parking lots for park-and-ride lots. Carpoolers who have free parking where they work might find it more economical to drive to work separately rather than pay for parking at the shopping mall to be able to carpoo·,. In addition, rural carpool parking lots have free parking, so commuters who park at designated areas in malls are at a disadvantage.
SincE. some commuters drive to shopping malls located along bus routes to utilize mass transit, this measure could deter ridership. With the added expense of parking, commuters might elect to drive the total distance to work, instead of riding part of the way on a bus.
123

Implementatic.n Procedures and Costs
A fee-calculation computer is used to assess parking fees based on how long the car is parked in the lot. This method calls for an attendant to collect the parking fees at mall exits. If the fee is based on a set rate, a gate can be used that will raise when a car is leaving the parking lot, after the correct payment has been made. The lead time required to insta'l equipment for either of these systems is two to three weeks.
A fee-calculation computer costs approximately $15,000, including installation. An attendant booth costs approximately $1,500, and a gate cost approximately $5,000. Currently, minimum wage is $3.35 an hour, (plus an additional .067% social security tax provided by the employer) and during the 90-day emergency period an attendant at each mall exit would have to be on duty about 960 hours.
Mall owners would be responsible to purchase and install the parking fee equipment. If they decided to use fee-calculation computers, they would also be required to hire parking attendants. Mall owners will receive revenues from parking fees. The administrative costs that mall owners will incur from this measure were not estimated.
The following cost analysis is based on the cost of implementing mall parking fees at the Lansing Mall and at the Meridian ~1all in the Tri-County area. Similar costs would be experienced in other areas depending on the number of malls, and the number of entrances and exits. Parking revenues were not estimated.
Lansing Mall Fee-Calculation Computer
fee-calculation computers attendant booths wages
Totai
Gate Parking gates
Meridian Mall Fee-Calculation Computer
fee-calculation computers attendant booths wages
Total
Gate Parking gates
124
5 exits x $15,000 ~ $75,000.00 5 exits x 1,500 ~ 7,500.00 5 exits x 3431.47 = 17~157.35
$99,657.35
5 exits x. $ 5,000 ~ $25,000.00
4 exits x $15,000 = $60,000.00 4 exits X 1 '500 ~ 6,000.00 4 exits X 3431.47 ~ 13,725.88
$79 '725..88
4 exits x 5,000 = $20,000.00
!-

Legal and Political Issues
Because malls are privately owned, they are exempt from city ordinances that set parking rates and require that parking fees be collected. Therefore, implementation of this measure would be on a voluntary basis because there is no legal way to force mall owners to charge for parking. In addition, because the stores within the malls are paying for the parking lots through their rental fees, the mall owners would be GOllecting double payments on the parking lots. The fees collected would have to be distributed among the store owners, or the leasing arrangements would have to be changed. The administrative work to make these changes cannot be accomplished within the 90-day emergency period.
Fuel Savings
Fuel savings for this measure were not quantified. If shoppers were to carpool or combine shopping trips, fuel would be saved. However, if lines occur at the mall exits of cars waiting to pay to leave, fuel would be consumed and vehicle emissions would be increased. If shoppers drive to different stores to avoid paying for parking, discretionary travel may also be increased, which would cause an increase in fuel consumption. In addition, if commuters find it more economical to drive to work singly than to pay for parking at shopping malls, VMT, congestion, and vehicle emissions would increase during peak hour traffic, while transit ridership and vehicle occupancy would decrease.
Advantages
This measure will promote mall employees to form carpools.
Disadvantages
This program could decrease business in shopping malls.
This measure may increase discretionary travel, VMT, and traffic congestion.
Recommendation
This measure is not recommended for inclusion in energy contingency plans.
125

VIII. TRAFFFIC FLOW IMPROVEMENTS

VIII
TRAFFIC FLOW IMPROVEMENTS
Introduction
Traffic Flow Improvements are a category of transportation measures that offer a significant opportunity for fuel savings. These improvements fall into the general program called Transportation System Management (TSM); an ongoing responsibility of state and local transportation agencies. TSM is the process of planning and implementing low capital transportation improvements that improve the efficiency of the existing transportation network. Traffic signal timing and optimization, and lane widenings, are examples of TSM.
Although TSM actions require less planning and funding than the construction of new highways, they do require substantial lead-time and planning before implementation. In addition, the number of projects undertaken is limited by funding restrictions, and projects are scheduled long in advance of implementation. For these reasons, many TSM projects can be considered fuel conservation actions but not energy shortage contingency measures.
Projects that require major construction or long term planning were eliminated when considering TSM measures for possible emergency implementation. This limited consideration to the manipulation of traffic signal timing, on-street parking, and left turn prohibitions. These projects require planning and careful analysis but need a smaller lead time and incur fewer costs.
In the following section, three traffic flow improvement measures will be evaluated for possible emergency application. These ares; Ban Parking on Major Routes, Switch Traffic Signals to Flashing Yellow, and Ban Left Turns to Improve Traffic Flow.
129
BAN PARKING ON MAJOR ROUTES
Description
This measure refers to the elimination of curb-side parking within 250 feet of intersections on major central business district arterials during the peak hours. This eases traffic congestion by reducing the vehicle travel time delay associated with stop and go traffic. The net result is an increase in the average operating speed and a reduction in fuel consumption.
Intent
Many of the major arterials within cities the size of Lansing allow peak hour parking within 250 feet of intersections. Studies on traffic flow conducted by MOOT in A Handbook For Evaluating The Air Quality and Energy Impacts of Transportation Systems Management Strategies, have shown that parking bans within 250 feet of intersections can improve traffic flow and reduce fuel consumption. This measure will be implemented during a moderate to severe shortage.
Transportation System and Mobility Impacts
Parking restrictions increase street capacity and simultaneously improve vehicular speed and travel time. The capacities of major streets are significantly affected by curb parking. Parking bans can increase intersection capacity by approximately 25 percent and average speed by approximately 13 percent.
Peak hour parking bans as described in this section improve the mobility of commuters with little inconvenience to the retail outlet and consumer. Many retail outlets have access to some off-street parking and it is generally agreed that drivers plan around anticipated peak hour traffic conditions.
Social and Economic Impacts
This measure could reduce the supply of metered parking spaces on the affected road segment by ten spaces. However, since the parking ban is for peak hour traffic only, the loss in municipal revenue associated with metered parking would be minimal.
Implementation Procedures and Cost
Local planners can determine from existing street classification and land use maps where the removal of on-street parking within 250 feet of the intersection would conflict least with public and private needs. The two main costs associated with a ban on parking are capital costs and operating costs. The capital costs consist of sign costs. The estimated cost to install a standard no parking sign is $30 to $60. The operating costs are associated with enforcement. An effective enforcement policy that includes a tow-away policy should be implemented with this measure to gain the most benefit.
131

Legal and Political T.ssues
Banning on street parking is a feasible parking control measure because implementation and enforcement can be integrated· into existing governmental agencies. During an energy emergency, no legal challenge is anticipated.
Fuel Savings
The following calculations for the potential impact of a peak hour parking ban are based on MOOT's Handbook for Evaluating the Air Quality and Energy Impacts of Transportation SysteJl' f't.anagement Strategies.
Approach width Service volume Peak hour volume Affected VMT Consumption rate gallons/mile
with parking without parking daily saving per intersection 66 working days savings
36 ft. 3,072 2,304
108.9
.07534
.06709 1.8 gallons
118.2 gallons
The above calculations are based on a single intersection. The calculated saving for a range of intersection are shown below:
Advantages
No. of Intersections
20 30 40 50
Savings in Gallons For Emergency Period
2,364 3,546 4,728 5, 910
The benefits gained from banning peak hour parking include the following:
l. Less traffic congestion 2. Reduction in travel time delay 3. Fewer accidents 4. Reduced fuel consumption.
It is estimated that a peak hour parking ban on major arterials could reduce fuel consumption by as much as ll percent per intersection.
Disadvantages
The commercial and institutional needs for parking make parking removal a sensitive issue. Given the existing budget cuts, any reduction in metered parking revenues might incur political opposition.
Recommendation
Prior to an energy emergency local planning agencies should evaluate on street parking conditions and identify locations where parking can be eliminated.
132

' '
!_.·'.
SWITCH TRAFFIC SIGNALS TO FLASHING YELLOW
Description
This program consists of switching traffic signals to yellow/red flashers in main corridors into and out of major urban areas. Comprehensive application of this measure would primarily affect roads with under 25,000 vehicles average daily traffic and approximately half of the signals in an urban area. Depending on the signal location, these modifications will be made during peak and/or off-peak hours. In each case, the corridor with the highest amount of traffic w·ill be favored.
Intent
The intent of this measure is to improve the average speed and reduce travel time along urban corridors by reducing the number of vehicle stops, accelerations, and decelerations. This measure will be implemented during a moderate to severe shortage.
Transportation System and Mobility Impacts
This measure does not change a person's decision to travel or forego travel. It should positively influence a driver's ability to reach a particular destination quickly by favoring traffic flow in the "dominant" direction. If a driver wishes to use a 1 ess-used route that intersects major corridors, more stops might occur.
Few traffic or transportation agencies have actively pursued programs to remove traffic signals. Signals are usually left in place once they are installed. Safety may be cited as a reason for keeping signals. This may be a valid concern especially where traffic volumes exceed 25,000 vehicles per day. Currently, the criteria for determining where signals are needed for safety varies, therefore urban areas usually judge safety on a case by case basis. In Michigan, the Michigan ~lanual of Uniform Traffic Control Devices is used to guide signal placement.? Removal of signals would have to follow the same procedure since the safety of the travel corridor must be maintained. A recent study written for the Institute of Transportation Engineers indicated that of 191 urban intersections converted from signal control to two way stop control, neither total accidents, or total injury accidents were affected significantly by signal removal.B Another study of changeover to night time flashers indicated an increase in right angle collisions where main-to-side street volume ratios were less than 30 percent. This suggests a criteria for deciding which intersections to change to flashers.
If the signals in a corridor are coordinated to promote smooth traffic flow, removal of signals may necessitate retiming of the remaining signals. On the other hand, if signalization is not optimal, removal of signals should improve speeds and reduce fuel consumption along the affected routes without retiming the remair:ing signals. Signal control replacement with red flashers or four-way stop signs will usually result in increased fuel consumption because all vehicles must stop.
7 Michigan Departments of Transportation and State Police, "Michigan Manual cif Uniform Traffic Control Devices", Fifth Edition, August, 1981.
8 Frederick A. Wagner, Energy Impacts of Urban T',"ansportation Improvements, prepared for the Institute of Transportation Engin2ers, Wagner-f1cGee Associates, Inc. At:gust, 1980.
133

Social and Ecoromic Impacts
Social and economic impacts resulting from the implementation of this strategy would be minimal.
Imjl}_ementation Procedures and Costs
Comprehensive implementation of this strategy would include a combination of full time signal flashers, and flashers during the night and off-peak hours.
In an aggressive areawide signal removal and flashing strategy:
1. Ei£ht to sixteen percent of the signals on state trunklines are flashed during all hours.
2. Signals are flashed from 6 p.m. to 6 a.m. at 50 to 75 percent of the intersections under local jurisdiction.
This measure will be implemented in.two stages, commensurate with the extent of the energy shortage. First, the Governor will request the State Department of Transportation and responsible local road agencies to modify signalization in the urban area or part of the state experiencing the fuel shortage. This request will be made prior to the declaration of an energy emergency under Public Act 38, as amended. Second, after an energy emergency is declared, the Governor will issue an executive order requiring the aggressive signal modification program outlined above, in the affected urban areas. The Michigan Manual of Uniform Traffic Control Devices will be used to guide signal modification decisions.
A signal flashing program will require the cooperation of local traffic agencies and may cause work scheduling problems, especially if other priority projects must be deferred to signal modifications. The cost associated with changing the signals would be minimal.
Legal and Political Issues
There is a popular bias in favor of traffic signals. Regardless of whether or not a signal is justifie~ from a traffic engineering viewpoint, signals are often viewed as a solution to traffic congestion or traffic accident problems. It may be difficult to modify signal operations in many instances due to political pressure brought about by the fear of accidents.
Control of traffic signals is divided between state, county and city agencies. Although there are specific engineering criteria to guide signalization, there are differences of opinion and no binding criteria for determining signal placement. Implementation of this strategy may cause conflicts between the various jurisdictions.
There are no legal barriers preventing the implementation of this strategy.
134

Fue 1 Savings
The fuel consumption savings calculated in the following table are based on the difference in average speed that occurs when the distance between signals is increased by flashing (the equivalent to removal) a single traffic light. It is estimated. that if 10 percent of the Lansing urban area central business district trunkline arterial signals were flashed, approximately 20,700 gallons could be saved. If 75 percent of the major arterial signals under local jurisdiction were put on flashing during the off peak hours, approximately
. 49,500 gallons could be saved during the emergency period.
TABLE 12
FUEL SAVINGS FROM CONVERSION OF ONE SIGNAL TO FLASHING YELLOW ON A MAJOR ARTERIAL
Average speed before change Average Speed after change Traffic volume affected Signal spacing distance Fuel Consumption rate (gal/mi)
before conversion Fuel consumption rate (gal/mi)
after conversion Daily savings 90-day emergency period savings 66 Working day savings
Advantages
24 Hr. Signal Conversion
16 MPH 19 MPH 25,000 660 feet
. 07225
. 06493 23 gallons 2,070 gallons
NA
Off Peak Hour Signal Conversion
19 MPH 22 MPH 7,200
660 feet
.06493
.05974 5 gallons NA 330 gallons
Areawide signal modification programs result in fuel savings, are easily implemented, and are applicable in all urban areas. Although individual motorists may not experience a notable decrease in fuel consumption, areawide fuel consumption will drop.
Disadvantages
This measure requires action after the energy shortage to change signals back to normal operation.
Recommendation
This measure should be included in the Michigan Gasoline Shortage Response Plan. Local agencies should also include signal modifications in local contingency plans.
135

BAN LEFT TURNS TO IMPROVE TRAFFIC FLOW
Description
To implement this measure, the Governor will instruct the Michigan Department of Transportation to ban left turns at state trunkline intersections in the centra·! business district of urban areas and elsewhere if such a ban would improve traffic flow.
Intent
The intent of this measure is to improve traffic flow through the central business district and to decrease travel time and idling at traffic signals. This measure will be implemented during a moderate to severe shortage.
Transportation System and Mobility Impacts
About half of the traffic signals in an average urban area are coordinated through interconnection and many include left turn phases. Signal coordination is highest in the central city. As travel moves out farther toward the suburbs, fewer signals are coordinated.
Left turn prohibitions are an integral part of some cities' traffic patterns, but not of others. Signalization reflects drivers' habits: for example, left turns are allowed where travelers demand the left turn. Banning the left turn does not change the driver's destination, only their route. Banning left turns will cause the driver to change routes or make an illegal turn. Both options disrupt traffic flow and may cause additional travel. It is unlikely that banning left turns at signalized central-city intersections will improve traffic flow or reduce travel times. The decrease in travel time experienced by the straight-through driver will be offset by the longer route taken by the driver wishing to turn left.
It is possible that in some instances left turns at unsignalized intersections will cause increased delay for the through-lane driver. In this instance, left turn prohibitions may decrease vehicle delay time and save fuel. Turns such as these, however, are more likely to occur outside the central city where traffic is lighter, making the inconvenience of the left turn prohibition unjustifiable. In addition, left turn prohibitions where there is no perceived "pressure" from following vehicles will be ignored.
It would be very difficult to set uniform criteria for eliminating turns. This means that case by case evaluation is necessary.
Social and Economic Impacts
Implementation of this measure may require a change in personal travel habits. The changes in travel route caused by the prohibited turn may prompt increased travel on neighborhood streets. In the past, traffic engineering changes that cause traffic increases in predominantly residential areas have met with stiff resistance from residents.
Where state trunklines cross county or city streets, the Michigar. Department of Transportation usually coordinates any signal changes with the appropriate local agency. Gaining mutual agreement on signal c~anges may prove to be time-consuming and difficult.
137

lll1_plelll~rl_!:a ti on Procedures and Costs
The Michigan Department of Transportation, Traffic and Safety Division, W8Uld identify trunk1ine intersections and left turn sites on a case by case basis and eliminate 'ieft turns where appropriate. Due to the number of evaluations, several months lead time and the full attention of MDOT trafHc engineers would be required. After identification of appropriate locations, the Department will contact the local traffic agency for comment.
Since part of the traffic analysis will require computer traffic flow simulations, considerable costs in staff and computer time would be incurred. The actual signal modifications and process of putting signs up will require the time and effort of road maintenance crews.
Legal and Political Issues
The cooperative process of consulting local agencies before changing state trunklines where they intersect local roads could become politically controversial. Other changes causing excessive traffic on residential streets may also generate local opposition.
There is no law prohibiting the state from modifying signals or abolishing left turns at sites on state trunklines.
Fuel Savings
It is unlikely that banning left turns at signalized intersections will save fuel. The benefit of restricting left turns at mid-block is also doubtful. The likely outcome is that additional travel caused by the route change will offset any fuel consumption reduction experienced by through-1 ane drivers. There is no benefit in pro hi biting 1 eft turns along five-lane roads where a center turn lane is provided.
Advantages
Through-lane drivers may experience improved traffic flow at points where left turns are prohibited.
Disadvantages
This measure will not necessarily save fuel.
Traffic engineering studies are time-consuming. The diversion of staff from more productive tasks is of questionable value.
Left turning vehicles may be forced to increase travel distance to avoid the left turn site.
The lead time for implementation is not conducive to a quick start up in an energy emergency.
Recommendation
This measure is not recommended for inclusion in energy contingency plans.
138

IX. SUMMARY AND RECOMMENDATIONS

l,-
1
SUMMARY AND RECOMMENDATIONS
The transportation demand restraint measures evaluated in this document are transit, ridesharing, parking management, and traffic flow improvement. In each category several measures were evaluated and are discussed in this report. These evaluations were made using the lansing Tri-County area as a typical urban area so that actual community information could be used. All of the evaluations are discussed in this report to make clear to the reader the extent of the analysis, and so that the measures which were rejected and the reasons for the rejection would be clear. All of the proposed energy emergency measures fall into one of three categories:
1.
2.
Measures that the Michigan Department of Transportation will recommend for inclusion in the Michigan Gasoline Shortage Response Plan;
Measures that require additional evaluation before a decision about implementation is made by individual urban areas;
3. Measures that are not recommended for implementation.
I. Measures to be included in the Michigan Gasoline Shortage Response Plan
Measures will be included in the Michigan Gasoline Shortage Response Plan based upon their ability to reduce fuel use, their low implementation costs, their short lead time, and their minimum disruption of personal life styles. Some measures will also be included so that legal obstacles to their use at the local level can be removed at the state level.
Many of the measures which will be implemeted at the state level are voluntary and are implemented at the state level so that they will receive the widest possible coverage. Implementation of these measures at the local level may produce additional reductions in fuel use. If so, they should be considered for use at the local level as well as at the state 1 evel.
Measures which are effective and can best be implemented at the state level are:
1) Use School Buses as Transit Vehicles; 2) Provide Public Information; 3) Increase Employer Based Carpool Programs; 4) Increase Areawide Carpool Programs; 5) Increase Vanpool Programs For the General Public; 6) Increase Rural Carpool Parking lots; 7) Promote Flex-Time Scheduling For State Employees; 8) Promote Flex-Time Scheduling For the General Pubcic; 9) Use the State Parking Structure As A Rideshare Incentive;
10) Switch Traffic Signals to Flashing Yellow.
141

The potential fuel savings attributable to these measures are not strictly additive, although an increment of fuel-use-reduction should occur for each additional measure implemented. Implementation of the more restrictive measures in the existing state plan (e.g. extended fuel purchase plan) will influence the effectiveness of the other measures.
It is possible that the state services provided by the carpool and vanpool '"' programs will be overwhelmed in times of fuel shortage. It is also possible that rideshilring will increase dramatically without state or local government action. Each of the following fuel saving estimates reflects the degree of implementation presented in the body of this report. Additional benefits will result from expanded application of the measures.
These estimates apply to the implementation of the measures in an urban area the ·size of Lansing, ~1ichigan. The numbers represent a conservative estima.te. Urban areas of similar size can expect similar results.
Use School Buses as Transit Vehicles
Provide Public Information Increase Employer Based Carpool
Programs Increase Areawide Carpool Programs Increase Vanpoo1 Programs for
the General Public Increase Rural Carpool Parking
Lots Promote Flex-Time Scheduling for
State Employees Promote Flex-Time Scheduling for
the General Public Use the State Parking Structure
as a Rideshare Incentive Switch Traffic Signals to
Fl as hi ng Yell ow
Daily Gallons Of Fuel Saved
455
2,318 464*
22,896 65
1 , 558* l ,442 l , 352*
3,409
22,896
1 ,271
1 ,064
* Fuel savings from existing program
Gallons of Fuel Saved During A 90 Day Emergency (66 Working Days)
30,125
152,988 30,624*
l,5ll,l36 4,290
102,820* 95,172 89,232*
224,998
1,511,136
83,918
70,200
II. Measures which can best be considered for use at the local level
Several of the measures evaluated in this study were found to be effective, but only when implemented at the local level. This was the case when either the state had no authority to regulate that activity, or state intervention would cause misunderstandings and confusion. Some measures which can best be implemented at the local level still require state action to allow local action. These measures are listed in both the state and local sections.
142

' !"
t·1easures which are also effective, but wh.ich can best be implemented at the local government or business level are:
1. Increase Transit Service Based on Demand; 2. Use School Buses as Transit Vehicles; 3. Use Community Organization's Vehicles for Transit; 4. Increase Park-and-Ride Facilities; 5. Promote Improved Taxicab Utilization; 6. Provide Premium Parking for Carpools; 7. Reduce High School Student Commuting; 8. Ban Parking on Major Routes; 9. Switch Traffic Signals to Flashing Yellow.
During the development of this report, estimates were made of the fuel savings which could accrue from local measures. These savings were not summarized s i nee the degree of use of these measures wi 11 depend upon 1 oca 1 conditions. The state measures described in this report have the potential for greater fuel savings by either showing by example how savings can be accomplished and encouraging local actions, or by removing state restrictions on local initiatives. These potential effects are described in this report.
III. f1easures that are not recommended for implementation
Several measures were evaluated and found to present significant implementation problems, or to be relatively expensive. None of these measures saved much energy. Implementation of the following measures is not recommended:
1 . Move Addition a 1 Trans it Equipment to r1os t Hard Hit Areas; 2. Set Differentii\1 Rilte Structures for Parking; 3. Restrict Pilrking in Downtown Areas; 4. Limit the Use of Parking Structures to Cilrpools Only; 5. Close Parking Structures; 6. Charge Fees for Parking at Shopping f·1alls; 7. Ban Left Turns To Improve Traffic Flow.
142i

:, __ \
SELECTED BIBLIOGRAPHY
1. Cooper, Lawrence C. The Use of School Buses for Public Transportation. North Central Texas Council of Governments, 1978.
2. Congress of the United States, Congressional Budget Office, "Managing Oil Disruptions: Issues and Policy Options", September 1981.
3. "Downtown Parking Study- Phase II, Final Report", Lansing, Michigan June, 1981 (unpublished).
4. "Downtown Parking Study- Phase II: Technical Work Papers", Lansing, Michigan, June, 1981, (unpublished).
5. Kirby, Ronald F.; Bhatt, Kiran U.; Kemp, Michael A; McGillivray, Robert G.; and Wohl, Martin. Para-transit: Neglected Options For Urban Mobility. The Urban Institute, Rept UI-4800-8-2, 1976.
6. LaGasse, II I, Alfred B. "Taxicabs Are Paratransit". Taxicab Management, April, 1981, p. 10.
7. Michigan Department of Transportation and State Pol ice, "Manual of Uniform Traffic Control Devices" Fifth Edition, August, 1981.
8. Michigan Department of Transportation " A Handbook for Evaluating the Air Quality and Energy Impacts of Transportation Systems Management Strategies", Draft Report, August, 1981.
9. National Research Council Transportation Research Board, Special Report 154, Demand-Reponsive Transportation Systems and Services. Washington, D.C., 1974.
10. Opinion Research Corporation, General Public Attitudes and Behavior Regarding Energy Savings,April, 1975.
11. Transportation Research Board, Transportation Energy Conservation and Demand, Transportation Research Record 561, 1976
12. Wagner, Frederick A., Energy Impacts of Urban Transportation Improvements, prepared for the Institute of Transportation Engineers, Wagner-McGee Associates Alexandria, Virginia August, 1980.
13. Wirsching, Ing A. "Extending the Use of Taxis as a Part of Urban Passenger Transport". Report of the Fourtieth Round Table.on Transport Economics Held in Paris on 26th- 27th January, 1978 on the following topic: Paratransit, pp. 51-64, France: ECMT, 1979.
14. United States Department of Energy, Fourth Quarterly Report - Highway Fuel Consumption Model, July 2, 1981.
15. United States Depa¥"tment of Transportation, Paratransit-State of the Art Overview, Transportation Systems Center, March, 1981.
145

APPENDIX A
TRANSPORTATION ENERGY CONSERVATION
ONGOING CONSERVATION PROGRAMS

i .:
f _' 1
!-;
: -.)
TABLE OF CONTENTS
Introduction
Ridesharing Programs •••••••• 0 •• 0 • 0 ••••• 0 ••••••••••••• 0 •••••••• A-1
Vanpools ...............•..........•.•.....•..•..•........... A-1
State Employee Rideshari ng Program .. .. .. . . .. .. .. .. • .. .. .. .. • A-7
Public Transportation
Rural Carpool Parking Lot Program ......•......••••.•.••.....••
Non-Motorized Program
A-8
A-10
A-13
Right-Turn-On-Red ............................................. A-16
Enforcement and Camp 1 i ance With The 55 MPH Speed Limit .. .. .. .. A-18

HHRODUCTION
In 1977, the Michigan Department of Transportation submitted a Transportation Energy Conservation Plan to the r,lichigan Energy Administration. This plan contained descriptions of various conservation measures and set goals for their implementation. Since 1977, progress has been made in implementing these programs. The following report describes the ongoing and planned energy conservation programs, and outlines the benefits and fuel saving potential of each measure. Where possible, fuel conservation estimates and plans for future expansion of programs have been made.

I
i
: .i
RIDESHARING PROGRAMS
Vanpooling, carpooling, and public transportation are components of the ridesharing program. Two benefits from ridesharing are alleviated
·--··.;-·,··-
parking problems and increased capacity along congested roads. In addition, air poll uti on is decreased and gaso 1 ine is conserved. The primary concern of this program is to provide an efficient mix of all ridesharing modes.
VAN POOLS
Description
The Michigan Department of Transportation sponsors a vanpool program for state employees. Participants usually travel ten or more miles to work. Occupancy levels average ten passengers per vehicle. Vanpool participants enjoy relaxed travel to and from work. They also profit from shared commuting costs. In addition, their car insurance rates may be lowered because they drive their cars less. In some cases, families no longer need a second car.
Employers find promoting vanpools is relatively inexpensive and boosts employee morale. Absenteeism and tardiness is frequently reduced. One of the most significant benefits is reduced parking costs. 3-M Corporation estimates that through vanpooling they saved $2.5 million in construction costs for 1,500 parking spaces. Estimated costs for land and construction of a surface parking space range from $1,000 to $2,000.
In September of 1976, the Michigan Department of Transportation obtained approval from the State Highway Commission to sponsor a State Employees Vanpool Program (SEVP). The program is managed and administered by the Mass Transportation Planning Section, Modal Planning Division, Bureau of Transportation Planning.
The SEVP is the largest public employee program in the nation and is available to state employees throughout Michigan. Approximately seventy-five percent of the vanpools operate within 20 to 80 miles from their destination, with the majority of vans serving the Lansing state offices and the Detroit area. The program began in April of 1977 with three vans and 31 participants. Since that time, the program has grown to 100 vans and 1,000 employee participants. In addition to providing a service to state employees, the program advertises the advantages of vanpooling and serves as a model for other state vanpool programs. By sponsoring the SEVP, practical experience in vanpooling has been acquired by the Mass Transportation Planning Section.
Fares are collected through the payroll deduction process, administered by the Department of Management and Budget. The rate charged participants is based on nine fares per van, with no allowances made for missed trips. Fares are computed by lease period, the vehicle type selected and mileage. Fares are designed to recover al: costs associated with acquiring and operating the vans.
A-1

The vanpool driver has many responsibilities. Besides picking up and dropping off passengers, the driver must keep ridership at or above the minimum of n·ine people. In addition, the driver must keep records of vanpool operations, provide routine maintenance, and store the van in a safe place. He/she must fuel and clean the van when necessary. The driver must select a backup driver. In the event of a traffic violation, the driver is held accountable. Vanpool drivers and backup drivers must participate in a Fleet Safety Program. As a reward for these services, the vanpool drivers get free transportation to and from work, and perso1al use of the van up to 3,000 miles annually, at the rate of 15¢ per mile.
A "third-party" vanpool program, known as MichiVan, was started on March 12, 1980. To increase vanpooling, MDOT signed a year contract for $125,000 with Vanpool Services Incorporated, a subsidiary of Chrysler Corporation. These funds cover administration of the program, provision of vans and, if requested, installation of handicapper accessibility equipment. The purpose of the agreement is to provide vanpool services to interested individuals throughout the state.
Vanpool Services is responsible for making adequately insured vans available on short notice. They are also requested to report mileage, occupancy levels, costs, and accidents to MOOT monthly. If participants should have to use cars to get to and from work, Vanpool Services will reimburse three carpool drivers at 15¢ per mile.
Vanpooi participants are charged monthly in advance. A standard rate is assessed riders to cover the fixed costs of the vans. In addition, they are charged for oil, maintenance, repair, and tires based on daily round trip miles. The price for gasoline is also added" As in the SEVP, the driver rides for free.
The co-ordinator of ~his program is responsible for collecting passenger fares, and for keeping records or mileage, and expenses. This information along with passenger fares is sent to Vanpool Services each month. If a rider should drop out of the program, the driver may contact a local ridesharing office for assistance in filling the vacant seat. Each month up to 200 miles personal use is awarded the driver for performing these duties. Eight cents per mile is charged for travel beyond this limit. The driver must provide the gas for personal use.
Background
To provide statewide coverage of ridesharing programs, the Michigan Legislature has appropriated $500,000 to establish local ridesharing offices (LRO). The Michigan Energy Administration has allocated an additional $273,600. Of this, $93,600 is used for marketing ridesharing programs, and the remaining $180,000 is used to sponsor six of the LRO's. The Mass Transportation Planning Section oversees this program. MOOT provides technical assistance and materials to .. , support LRO staffs. Some LRO's do not have computer capabilities, MDOT provides those LRO's with carpool computer matchlists. A list of LRO locations and contact persons is found on the following pages.
A-2

' .
!
LOCAL RIDESHARING AGENCIES & CONTACT PERSONS
1. Ann Arbor Transportation Authority 331 S. Fourth Avenue
2.
Ann Arbor, MI 48104
Joan Singer, Ridesharing Coordinator (313) 973-6500
Bay County Metropolitan Transportation Authority
1510 N. Johnson Street Bay City, MI 48706
Pat Roach ( 517) 894-2909
3. Calhoun County County Building Marsha 11 , MI ~·9068
8. Isabella County Transportation Commission
301 E. Broadway - Suite 212 Mt. Pleasant, MI 48858
Sue Knight, Ridesharing Coordi.nator ( 517) 773-1677
9. Jackson Commuter Pool 2350 E. High Jackson, MI 49203
Dave Vas sa 1 (517) 788-7844 or 787-8363 - Ext. 25
10. Kalamazoo Area Transportation Study P. 0. Box 2826 Kalamazoo, MI 49003
Suzanne C. Brown, Ridesharing Coordinator Dept. of Planning & Development Coordination
Claudia Wink-Basing, Ridesharing Coordinator (616) 342-7433
(616) 781-0825
4. Capital Area Transportation Authority 4615 Tranter Avenue Lansing, MI 48910
Vicki Vegis (517) 394-7665
5. Central Upper Peninsula Planning & Development Regional Commission
2415 14th Avenue South Escanaba, MI 49829
Charles Bear ( 906) 786-9234
6. Eastern Upper Peninsula Regional Planning & Development Region
416 Ashum Sault Ste. Marie, MI 49783
Dave Neiger ( 906) 635-1581
7. Genesee County Metropolitan Planning Commission
1101 Beach Street Flint, MI 48502
Cindy Mislik (313) 257-3010
A-3
11. Muskegon Area Ridesharing Service 923 Witham Drive Muskegon, MI 49445
Susan Sugarbaker, Ridesharing Coordinator
( 616) 744-3333
12. Northeast Michigan Community Service Agency, Inc.
P.O. Box 297 Alpena, MI 49707
Julie P. Broadfoot Community Development Division (517) 356-3474
13. Northwest Michigan Regional Planning & Development Commission
160 E. State Street Traverse City, MI 49684
Steve Warren (616) 946-5922
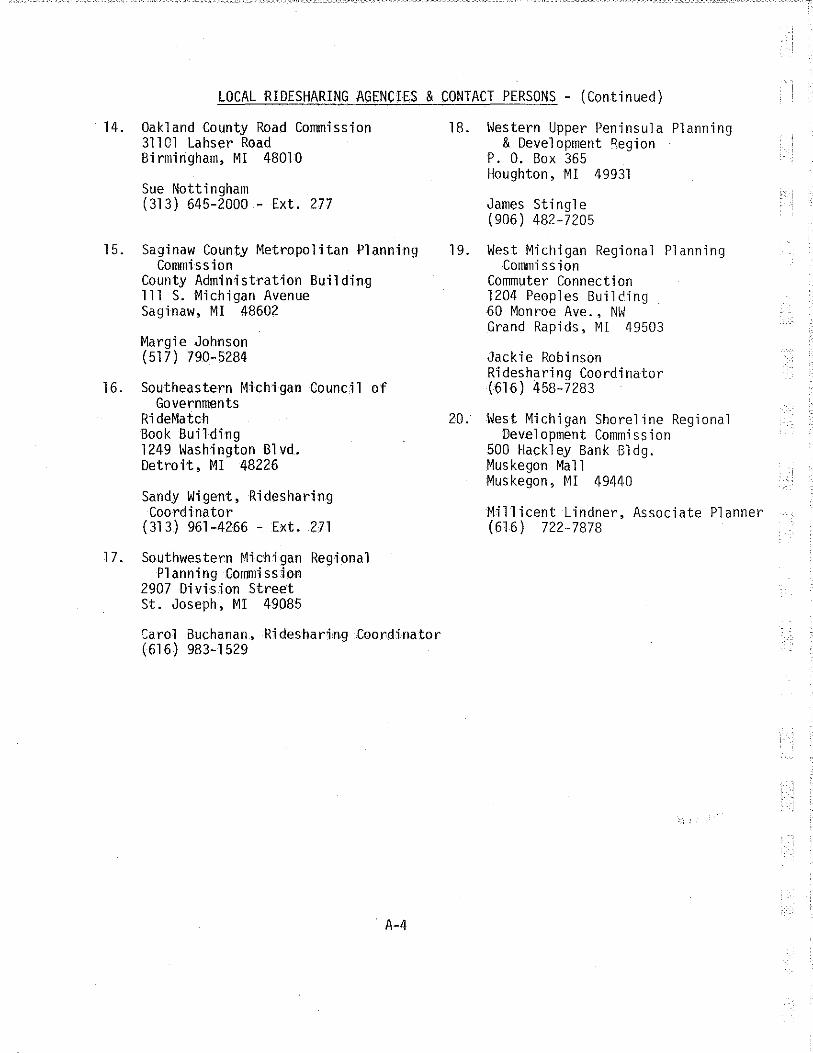
LOCAL RIDESHARING AGENCIES & CONTACT PERSONS - (Continued)
14. Oakland County Road Commission 31101 Lahser Road Birmingham, MI 48010
Sue Nottingham (313) 645-2000 - Ext. 277
15. Saginaw County Metropolitan Planning Commission
County Administration Building 111 S. Michigan Avenue Saginaw, MI 48602
Margie Johnson (517) 790-5284
16. Southeastern Michigan Council of Governments
RideMatch Book Building 1249 Washington Blvd. Detroit, MI 48226
Sandy Wigent, Ridesharing Coordinator
(313) 961-4266 - Ext. 271
17. Southwestern Michigan Regional Planning Commission
2907 Divis.ion Street St. Joseph, MI 49085
Carol Buchanan, Ridesharing Coordinator ( 616) 983-1529
A-4
18. Western Upper Peninsula Planning & Development ~egion
P. 0. Box 365 Houghton, MI 49931
James Stingle ( 906) 482-7205
19. West Michigan Regional Planning Commission
Commuter Connection 1204 Peoples Builcing 60 Monroe Ave., NW Grand Rapids, MI 49503
Jackie Robinson Ridesharing Coordinator (616) 458-7283
20. West Michigan Shoreline Regional Development Commission
500 Hackley Bank Bldg. Muskegon Ma 11 Muskegon, ~1! 49440
Millicent Lindner, Associate Planner ( 616) 722-7878
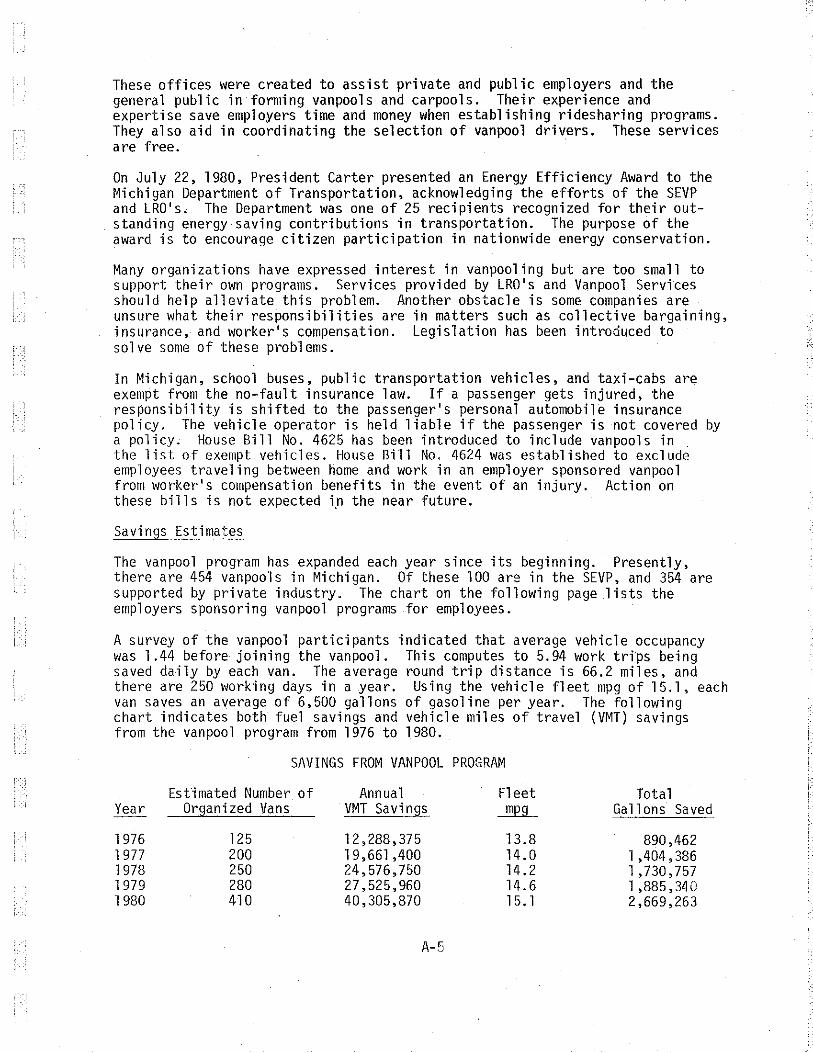
These offices were created to assist private and public employers and the general public in forming vanpools and carpools. Their experience and expertise save employers time and money when establishing ridesharing programs. They also aid in coordinating the selection of vanpool drivers. These services are free.
On July 22, 1980, President Carter presented an Energy Efficiency Award to the Michigan Department of Transportation, acknowledging the efforts of the SEVP and LRO' s. The Department was one of 25 recipients recognized for their outstanding energy saving contributions in transportation. The purpose of the award is to encourage citizen participation in nationwide energy conservation.
Many organizations have expressed interest in vanpooling but are too small to support their own programs. Services provided by LRO's and Vanpool Services should help alleviate this problem. Another obstacle is some companies are unsure what their responsibilities are in matters such as collective bargaining, insurance, and worker's compensation. Legislation has been introduced to solve some of these problems.
In Michigan, school buses, public transportation vehicles, and taxi-cabs are exempt from the no-fault insurance law. If a passenger gets injured, the responsibility is shifted to the passenger's personal automobile insurance policy. The vehicle operator is held liable if the passenger is not covered by a policy. House Bill No. 4625 has been introduced to include vanpools in the list of exempt vehicles. House Bill No. 4624 was established to exclude employees traveling between home and work in an employer sponsored vanpool from worker's compensation benefits in the event of an injury. Action on these bi 11 s is not expected i.n the near future.
Savings Estimates
The vanpool program has expanded each year since its beginning. Presently, there are 454 vanpools in Michigan. Of these 100 are in the SEVP, and 354 are supported by private industry. The chart on the following page lists the employers sponsoring vanpool programs for employees.
A survey of the vanpool participants indicated that average vehicle occupancy was 1.44 before joining the vanpool. This computes to 5.94 work trips being saved daily by each van. The average round trip distance is 66.2 miles, and there are 250 working days in a year. Using the vehicle fleet mpg of 15.1, each van saves an average of 6,500 gallons of gasoline per year. The following chart indicates both fuel savings and vehicle miles of travel (VMT) savings from the vanpool program from 1976 to 1980.
SAVINGS FROM VANPOOL PROSRAM
Estimated Number. of Year Organized Vans
1976 125 1977 200 1978 250 1979 280 1980 410
Annual VMT Savings
12,288,375 19,661 ,400 24,576,750 27,525,960 40,305,870
Fleet ~
13.8 14.0 14.2 14.6 15. 1
Total Ga 11 ons Saved
890,462 1 ,404,386 1,730,757 1 ,885, 340 2,669,263

EMPLOYER-SPONSORED VANPOOLS
Southeast Michigan # of
Em~lo)"er Location Vans Contact Phone
Chrysler Highland Park 160 Ken Sieloff ( 313) 497-0802 Detroit Edison Detroit CBD 12 Dennis Giffen ( 313) 237-7763 University of MI Ann Arbor 11 John Ellsworth or
Michelle Moskwiak ( 313) 764-3427 Michigan Bell Detroit, CBD, 13
Southfield Thomas Ni gl ( 313) 424-4717
American Natural Greg McCaffrey or Industries Detroit CBD 9 Carol Thibeault ( 31 3) 965-2430 Ex. 387
Blue Cross/Slue Shield Detroit CBD 8 Margaret Wimmer ( 313) 225-9604
Rockwell Inter-national Troy 2 Jerry Morgan ( 313) 435-1076
Ford Motor Company Detroit-Metro 28 Robert Quade or Ed Schneider ( 313) 322-9600
Henry Ford Hospital New Center Area 12 Bob Studen ka ( 313) 876-1119
West Michigan
Steel case Grand Rapids 22 Karen Zimmerman ( 616) 247-3045 Herman Miller Zeeland 20 Kay Vredeve 1 d ( 616) 772-3319 Amway Grand Rapids 13 Carol Hunt ( 616) 676-7001
Tri-Countt (Lansing & Vicinit,}')
State of Michigan Statewide 100 Steve Vertalka (517) 373-8258
Kalamazoo County
Upjohn Company Ka 1 amazoo a rea Marilyn Hardin (616) 323·5137
Central Michigan
Dow Chemica 1 Midland 3 Diane Murray (517) 636-0732
Statewide Third Party
MichiVan Statewide 40 Ro 11 and Henning ( 313) 557-01 01
CURRENT TOTAL: 454
A-6

'•!
State Employee Ridesharing Program
Description
To help coordinate ridesharing activities in Lansing, state employees were issued a ridesharing survey. In this voluntary survey, employees were asked which of the ridesharing modes they preferred. They were requested to locate where they lived and worked on the provided grid map of the Lansing area. In addition, they were requested to provide their work schedules.
This data was processed by a computer to match people by mode choice, location, and work schedule. Potential carpoolers were provided with a list of names of people with similar travel patterns and work schedules. They were encouraged to start their own carpools. If participants opted to vanpool, selected drivers organized vanpools. CATA bus service information was sent to those interested in utilizing existing public transportation.
Background
This survey was taken in 1978 at state offices in downtown Lansing. To update matching information, another survey was taken in 1981. In January of 1980, a similar survey was conducted at the State Secondary Governmental Complex. In June, after the results were issued to employees, a study was conducted to determine the average vehicle occupancy for work trips at the Secondary Complex. The survey was taken along five work trip routes heading into the complex.
The results showed 79. 3 percent of the vehicles were single occupant. The average vehicle occupancy was 1.33; if vanpools were excluded the average was 1.26. ~1ultiple occupant vehicles had an average of 2.60 passengers. The average vanpool occupancy was 7.61.
A-7

PUBLIC TRANSPORTATION
Description
A goal of the ~ichigan Department of Trar.sportation is to provide public transportation services throughout the state. This is accomplished by sponsoring bus systems in metropolitan areas and by offering dial-a-ride transit (DART) ir medium and small urban areas, as well as in rural areas. As of December 31, 1979, a total of 2,427 buses and DART vans were in operation across the state. Of these, 1,918 serve ll metropolitan areas.
Metropolitan transit authorities provide convenience, comfort, proper scheduling, and dependability in order to encourage motorists to switch from their cars to public transit. In addition, bus shelters are found along major bus routes to protect riders from inclement weather.
Smaller urban areas may provide some fixed-route bus service; however, DART is the major public transit program.. Riders call a DART office and state when and where they would 1 ike to be picked up. A DART van will then come and drive them to their destinations. In rural areas, one-day advance notice is usually required. In small cities, 30 minutes is usually enough advance notice. In larger metropolitan areas, DART provides an expanded small-bus service, but it is used on a limited basis.
Background
The DART program has been in existence since 1976, and served 2,093,758 passengers between 1976 and 1979. During this time period there were 4,957,900 vehicle miles of travel and 350,227 vehicle hours of service. The total operating cost was $3,801,179, or $1.82 per passenger. The cost per vehicle hour of service was $10.85, whereas, the average cost to operate a public bus system is 96¢ per passenger or $29.02 per vehicle hour of service over a four year period. The cost per person for a DART system may be greater than the cost per person for a public bus system, but when considering the area of service, the DART system is more economi ca 1 .
Transit ridership has varied from year to year. Generally, higher gas prices and shortages in gasoline availability caused an increase in ridership. However, as motorists became accustomed to higher gas prices and fuel. became available, ridership has slackened off. Another reason ridership volumes have varied is due to different levels of unemployment.
The fo 11 owing chart describes statewide trends in mass transit ridership.
SUMMARY OF STATEWIDE MASS TRANSIT RIDERSHIP
Detroit ~1etropol itan ~1etropo 1 i tan
Year Area Areas Statewide Total
1976 94 ,871., 300 17,748,276 112,619,576 1977 98,443,104 21,155,380 119,598,484 1978 93,597,008 20,834,164 114,431,172 1979 88,047,612 22,371,020 110,418,632
A-8
! i

i· L
There are many benefits gained from mass transit programs. Fewer parking spaces are needed in urban areas, along with increased capacity along congested streets. In addition, citizens that are unable to supply their own transportation are given mobility.
Programs to purchase additional transit buses and vans have been slowed due to federal and state budgetary constraints. In addition, many of the programs which provide operating funds to transit agencies have been eliminated. Budgetary cutbacks may have to be made up with increased passenger fares, which many cause a decrease in ridership.
Savings Estimates
Average passenger miles per gallon varies by size of the vehicle and by passenger occupancy. The following chart provides a miles-per-gallon comparjson by bus size and engine type, along •!lith the selective automobile average miles-per-gallon.
FUEL EFFICIENCY OF BUS TRANSIT
Average Average Average Passenger Consumption Passenger Number of Passenger Capacity mQg CaQacit,)' Passengers mQg mQg
Full Size - Diesel 4. 1 41-53 22 90 217 Medium Size - Diesel 5.5 25-33 13 70 182 Medium Size- Gasoline 4.5 25-33 13 60 149 Minibus-Gasoline 7.2 15-25 9 65 180 Van-Gasoline 9.0 6-10 3.5 32 90 Automobile Fleet
.Average 15. 1 4 1.2 18 60 Midsize - Chevrolet
Citation 22 4 1.2 26 88 Compact - Rabbit diesel 42 4 1.2 59 168
When transit vehicles are filled to capacity, they are more energy efficient than most cars. However, due to deadhead mileage and low off peak hour ridership, their efficiency is reduced by more than half. As automobiles become more fuel
. efficient, their passenger mpg is competitive with transit vehicle passenger mpg.
Two occupants in a vehicle which gets 15.1 mpg gets 30.2 passenger mpg. If the occupancy is increased to four, the passenger mpg is increased to 60.4 which is higher than the passenger mpg for a gasoline van, and competitive with the passenger mpg for both a medium size diesel bus and a medium size gasoline bus at average occupancy. A Chevrolet-Citation with four occupants gets 88 passenger mpg, which is competitive with a full size diesel bus at average occupancy. A Rabbit diesel gets 168 passenger mpg, whicf. is only 47 passenger mpg less than a full size diesel bus filled to capacity. Along with saving fuel from increased vehicle capacity, corridor capacity is improved, fewer parking spaces are required, and air pollution is reduced.
A-9

,._,,._-... ,~~_,_-.,~
RURAL CARPOOL PARKING LOT PROGRAM
Description
As a result of the Araq oil embargo of 1973 and the following fuel shortage, many motorists parked their cars along the shoulders of ;tate highways during work hours to participate in carpools. In response, MOOT initiated the rural carpool parking lot program. The purpose was to provide commuters a safe place to leave their cars and to promote carpooling.
Background
State funds are used to acquire land and build parking lots. An acre of land is equivalent to 100 parking spaces. The average price for a paved parking space is $1,500, while a gravel parking space costs about $500. The following chart lists by district the actual and programmed expenditures for parking lots from 1974-1982. These funds are used for construction and maintenance.
District
1 2 3 4 5 6 7 8 9
CARPOOL PARKING LOTS - IMPROVEMENT COSTS
Actual & Programmed Expenditures 1974 - 1980
TOTAL
$ 58,000 8,000
36,000 16,000
246,000 270,000 163,000 438,000 316,000
$1 , 551 ,000
Programmed Construction 1981 1982
$ 4,000
14,000
83,000 32,000
135,000 76,000
200,000
$ 544,000
60,000
$ 60,000
As demand increased and funds have been made available, additional spaces and lots have been provided. Currently, there are 146 carpool parking lots contributing 5,013 spaces. Forty=three more lots are programmed, which will add another 2,503 spaces. There are 98 lot locations under study.
Locations selected are on majo,r commuter routes. Many of the parking lots are at selected interchanges on the freeway system. The lots are designed for safe and easy access to the roadway. The July 1981 Statewide Carpool Parking Lot Program Status Report 1 i sts by district the exact 1 ocation of carpool parking lots and possible future sites. The capacity and occupancy of each lot is also included.
A-10
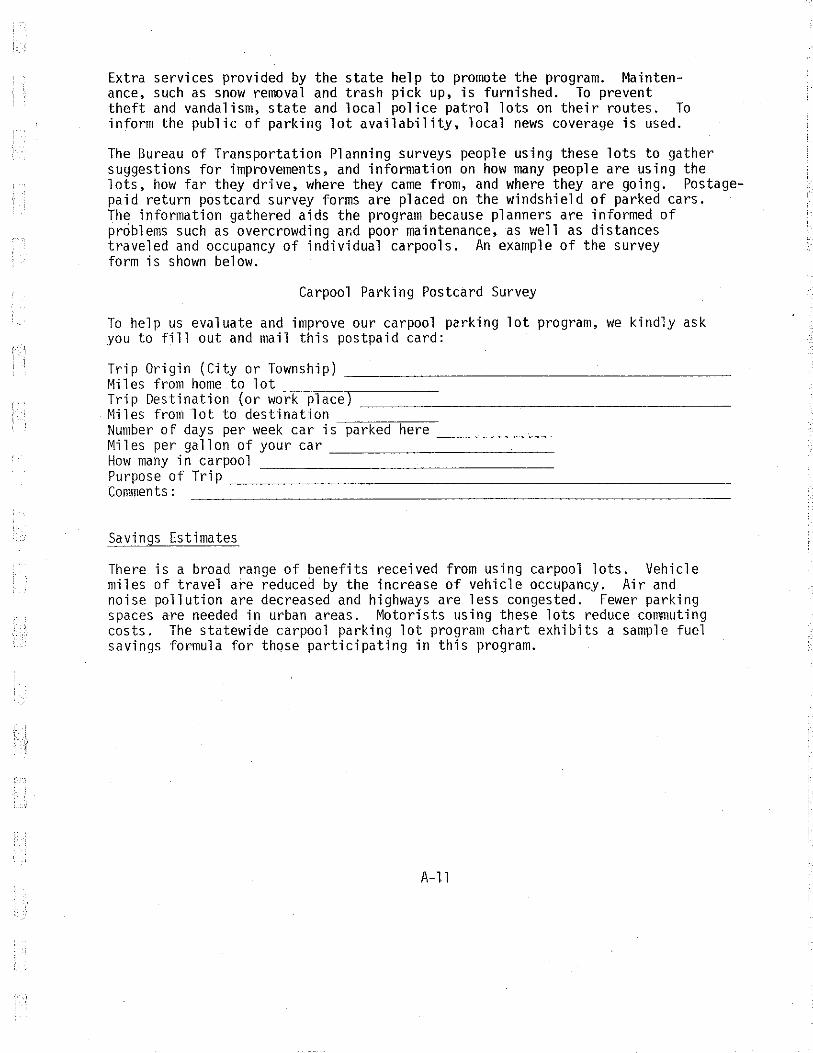
~- i
Extra services provided by the state help to promote the program. Maintenance, such as snow removal and trash pick up, is furnished. To prevent theft and vandalism, state and local police patrol lots on their routes. To inform the public of parking lot availability, local news coverage is used.
The Bureau of Transportation Planning surveys people using these lots to gather suggestions for improvements, and information on how many people are using the lots, how far they drive, where they came from, and where they are going. Postagepaid return postcard survey forms are placed on the windshield of parked cars. The information gathered aids the program because planners are informed of problems such as overcrowding and poor maintenance, as well as distances traveled and occupancy of individual carpools. An example of the survey form is shown below.
Carpool Parking Postcard Survey
To help us evaluate and improve our carpool pa.rking lot program, we kindly ask you to fill out and mail this postpaid card:
Trip Origin (City or Township)--------------------Miles from home to lot Trip Destination (or wo-r'k~pl'a-c-e')-_-_-_-_-_-_-_-_-__________________ _ ~1iles from lot to destination--.-...--.--Number of days per week car is parked here Miles per gallon of your car --~--~-How many in carpool Purpose of Trip ----------------------------Comments:
Savings Estimates
There is a broad range of benefits received from using carpool lots. Vehicle miles of travel are reduced by the increase of vehicle occupancy. Air and noise pollution are decreased and highways are less congested. Fewer parking spaces are needed in urban areas. Motorists using these lots reduce commuting costs. The statewide carpool parking lot program chart exhibits a sample fuel savings formula for those participating in this program.
A-ll

STATEWIDE CARPOOL PARKING LOT PROGRAM
Home to Lot Lot to Work to Lot X 5 days per week X 50 weeks pr2r year • 15 Miles per gallon
Lot to work to Lot X 3,000 (#of cars parked) X 5 days per week X 50 weeks per year ~ 1 5 mpg
= =
=
= = =
=
Average Carpooler
5 miles 60 miles per day 300 miles per week 15,000 miles per year 1,000 gallons per year or over $1,000 per year
Statewide
60 miles 180,000 miles per ~saved 900,000 miles oer week saved 45,000,000 miles pe~ year saved 3,000,000 gallons per year saved or 60,000 gallons per week saved or 12,000 gallons per day saved
As the chart shows, the fuel savings potential of this program is substantial. The average person using a rural carpool pil.rking lot saves 1000 gallons of gasoline per year. At the current level of use on a statewide basis, the annual fuel savings is 3,000,000 gallons, or 12,000 gallons daily.
A-12

,: .. :.
NON-MOTORIZED PROGRAM
Description
By adopting section lOK of Public Act 51 in 1973, the State Legislature initiated a non-motorized program. The Modal Planning Division within the Bureau of Transportation Planning is responsible for administering the program. The Department's primary goal is to increase bicycling safety by providing a variety of bicycle facilities and to encourage bicycle use as an alternative to the automobile.
These facilities include paved shoulders, lane widenings, and separate bicycle paths. Utilization of abandoned railroad lines to construct paths is also being considered. As an additional service to cyclist£, MOOT provides, upon request, free county maps showing road surface types and recreational facilities.
Background
Section lOK allocates one percent of the Michigan Transportation funds to provide facilities and services for non-motorized transportation. However, this requirement does not have to be fulfilled annually as long as an average of one percent of the funds is used over a 10 year period. Due to budget cutbacks, only $500,000 was appropriated for non-motorized transportation for the 1981 fi sea 1 year.
In addition, the State Legislature passed Public Act 295 in 1976. This gives the State Transportation Commission the first option to purchase abandoned rail lines to convert to non-motorized paths. MOOT has purchased the right of way from an abandoned Grand Trunk Railroad line that runs between Jackson and Lakeland. Construction of a 29 mile bike path is being considered.
The I-·275 bikepath, located on the western side of the Detroit Metropnl itan area, is an 8-foot-wide asphalt-surfaced path. The route is 41.5 miles long and cost $2,876,100.00 to build. Cyclists obtain access to the path at freeway interchanges or freeway rest areas where parking is available. This path has been in operation since 1978.
The non-motorized program also includes provisions for horse drawn vehicles. In response to a safety problem between motorists and Amish travelers using horse drawn carriages, MOOT sponsored a program to pave an 8-foot-wide shoulder on both sides of M-91 in Montcalm County. The shoulder stretches a half mile south of Dickerson Lake Roac to Kendall Road, and cost approximately $200,000.
Future considerations for promoting bicycling as a means for commuting to work are to provide bike racks at rural carpool parking lots and at park and ride lots. In addition, encouraging employers to furnish storage areas for bikes, along with employee locker rooms, would prompt people to ride bikes to work.
A-13

Expenditures for building these facilities to date is $3,588,800. Bicycle paths and paved shoulders, <: ~ ong with programmed projects, are 1 ocated as follows:
Existing
Route
M-11 M-18 M-20 M-20 M-21 M-22 M-25 M-35 M-35 M-43 M-43 M-43 M-45 M-50 M-50 M-55 M-59 M-59 M-66 M-66 M-96 M-99 M-99 M-104 M-116 M-137 US-2 US-12 US-31 US-41 US-41, M-35 US-131 US-131 BR US-31 1-94 I-94 BL 1-96 BL 1-275
Location
Remembrance Rd.-Riverbend, Walker, Kent M-55-Co. Rd. 100 Houghton Lake, Roscommon Co. Meridian Rd.-Sandow Rd., Midland Co. Sandow Rd.-Currie Parkway-Midland, Midland Co. Near Ada, 2 Segments, Kent Co. N.C.L. Frankfort Co. Rd. 704, Benzie Sebewaing, Huron Co. Ford River Bridge northerly to US-2 Ludington St.-12th Ave.-Escanaba, Delta Co. Along Gull Lake, Kalamazoo and Barry Co. Meridian Townshio Line Marsh Rd., Ingham Co. Sage to Waldo St., Kalamazoo, Kalamazoo Co. Allendale-52nd St., Grand Rapids, Ottawa Dixie Hwy. E., City of Monroe, Monroe Co. Lake Odessa- Lakewood Hills High School, Ionia Co. Tawas City West, Iosco Co. Cass Lake Rd. US-10, Oakland Co. M-275 to Williams, Lake Rd., Oakland Co. David Highway N. to Ionia, Ionia Co. Ionia N. to M-44, Ionia Co. 1-94-Augusta Dr. and Ft. Custer Hillsdale-Jonesville, Hillsdale Co. US-12 N. , Jonesville Hi 11 sda 1 e Co. Fruitport E. to 144th Avenue., Spring Lake, Ottawa Co. Ludington to State Park, Mason Co. Interlochen- US-31, Traverse Co.
·Iron River, Iron Co. City of Saline, Washtenaw Co. N.C.L. Niles-Walton Rd., Berrien Co. Lake St.-M-28 Marquette, Marquette Co. 20th Ave. to M-35 to End Curb Section Menominee, Menominee Big Rapids and Vicinity, Various Segments, ~1ecosta Co. 14 Mi.-S.C.L. Big Rapids, Mecosta Co. E. of Hall St.-US-31 Whitehall, Muskegon Co. Stone School Rd., Ann Arbor, Washtenaw Co. 1-94 BL Kalamazoo-Calhoun Chestnut-Highlander, Howell, Livingston Co. Monroe Co., Oakland Co., Wayne Co.
A-14

i
i <
' \
- r
Programmed
M-59 Waterford Township, Oakland Co. M-90 Croswell to Lexington, Saniac Co. M-153 City of Westland, Wayne Co. US-23 BR Stadium to Arborland, Ann Arbor, Washtenaw Co. I-496, US-127 Bikepath through Interchange, Ingham Co. Jackson-Lakeland Trail Bicycle Trail, Jackson, Ingham
Livingston Cos.
Savings Estimates
$ 46,000 125,000
36,000 125,000 46,000
903,000
$ 1 , 301 ,000
People use bicycles for recreation or purposeful trips, such as to get to school, the store, or work. Benefits received from cycling are reduced fuel consumption and reduced air and noise pollution. The U.S. Department of Transportation in 1973 estimated that if five percent of the motorists making 2.5 to 3.5 mile trips would convert to bicycles, approximately 780 million gallons of gas would be saved annually.
Due to the energy intensity of short distance trips, a vehicle which averages 18 mpg, making a 1.4 mile trip, will reduce the mpg to 5.4. If 2065 trips of this 1 ength were diverted to bi eye 1 es annua 11 y, the gasol i ne savings would compute to approximately 535 gallons.
A-15
< '-~, • 'l-:

RIGHT TURN ON RED
Description
Every state has enacted right turn on red (RTOR) legislation in an effort to reduce time delays, vehicle emissions and energy consumption at traffic lights. On March 31, 1976, the State of Michigan adopted a permissive turn-on-red law. After stopping for a red light, motorists >re allowed to turn right, or turn left onto a one-way street, unless there is a sign prohibiting such a movement. Michigan is one of five states that permits left turns on red that are made from a two-way street onto a one-way street. Motorist compliance with this law is about 80 percent.
Background
A network simulation model (NETSIM) was used to test the sensitivity of turning on red under different traffic conditions. A few of the variables used to determine time delays were a right-turn lane, number of lanes and approach volume. The following table is a summary of the simulation testing of one approach with a right-turn lane, for one hour and an average of 700 vehicles per hour. The results are from 500 test runs.
Summary of Simulation Testing
Mean total savings in delay (seconds) 927 sec.
~ean total saving in fuel (gallons) 0.21 gal.
Mean saving in delay per approach vehicle 1.32 sec/veh.
Mean saving in delay per right turn vehicle 6.05 sec/veh.
Results are for one hour and one approach with the assumption of one approach lane, one right-turn lane, and an arrival rate of 700 vehicles per hour.
To study safety and delay-time aspects of allowing right turns on red, the American Association of State Highway and Transportation Officials (AASHTO) organized a National Task Force in August of 1978. Each state, its largest city, and every city with a population over 500,000 submitted data on signalized intersections under their jurisdiction. Information on ten percent (or a maximum of 200) of the intersections was requested.

: ' i -
The data were to reflect traffic conditions before and after the rightturn-on-red law was enacted. If a jurisdiction failed to submit both before and after accident data, those intersections were excluded from the accident analysis. However, all available data were used for studying interactions at signalized intersections, such as green time for approach, cycle length, and crossroad volume.
The AASHTO Task Force concluded that right turns on red reduces time delays, vehicle emissions, and fuel consumption. They also found that the average number of accidents per signalized intersection was reduced from 12.6 per year to 11.9 per year. In t1ichigan there was essentially no change in the number of accidents at traffic lights.
The Task Force recommends that each jurisdiction review those locations where RTOR is prohibited to see if the restriction is necessary. They also encourage states that prohibit left turns on red to enact legislation to allow left turns on red from a one-way street onto a one-way street.
Savings Estimates
Motorists save an average of six seconds delay time for each turn on red. In addition each subsequent vehicle benefits because they can clear the intersection faster. If a car turns onto a street with signal progression, an added time savings of up to 30 seconds can be obtained. Rather than getting to the next signalized intersection and stopping, the light will be green due to the signal coordination. For an individual driver this may not seem significant, but the fuel savings from redu~jng time delays is impressive.
An average of one-fifth of a gallon of gasoline per signalized intersection approach is saved in an hour's time. This computes to an average annual savings of 2000 gallons of gas per intersection which allows turns on red. In Michigan alone, this adds up to an estimated fuel savings of 10-l/2 million gallons of gas per year.
A-17

Description
ENFORCEMENT AND COMPLIANCE WITH THE 55 MPH SPEED LIMIT
To reduce fuel consumption, the Emergency Highway Energy Conservation Act was estab:ished in January 1974. The purpose was to temporarily change the highway speed limit from 70 mph to 55 mph. Not only did this measure save fuel, but traffic accidents along state trunkline were substantially decreased. For these reasons, Title 23, CFR 141 was enacted to make the 55 mph speed limit a national law.
Background
Section 205 of the Surface Transportation Act of 1978 sets the guidelines for monitoring motorist compliance of the 55 mph speed limit. For the 1981 fiscal year, the law allows up to 60 percent of the motorists to exceed 55 mph. This percentage decreases by 10 percent each year until 1983. Functional groupings of highways are used for the analysis. Factors are appli~d to the data to account for peak hour traffic conditions and seasonal fluctuations. The sections of trunkline studied are selected at random.
The speed monitoring program is intended to provide reliable data for annual certification of speed limit enforcement. Data submitted to the U.S. Department of Transportation reflect motorist compliance of the 55 mph speed 1 imit, effectiveness of enforcement strategies, effectiveness of public awarePess programs, and speed trends.
The following chart is a speed summary report indicating motorist compliance of the 55 mph speed limit by road type.
SPEED SUMMARY REPORT
Number of Percent Percent Percent Mi 1 es of Vehicles Average Exceeding Exceeding Exceedi 1 .. ··•·
System Highway Observed Speed 55 mph 60 mph 65 mf!n
Interstate Urban 424.4 16,228 56.0 55.8 16.7 2.4
Interstate rural 756.7 17,793 58.1 72.5 28.0 5.5
Multi-lane divided 234.0 17,839 57.3 67.1 23.1 3.5
Multi-lane undivided 204.8 9,818 52.5 32.5 6.4 .5
Two-lane rural 5541.6 27,406 53.9 39.1 9.6 1.4
Statewide totals 7161 . 5 89,084 54.7 47.9 13.9 2.0
A-18

'. '
,{'
t.
The Highway Safety Act of 1978 allows the U.S. Department of Transportation to penalize states that do not enforce compliance of the 55 mph speed limit by withholding federal aid highway funds under sections l04(b)(l }, (2), and (6) of Title 23 (excluding Interstate). In 1981, the funding penality will be five percent and increases to ten percent thereafter. In Michigan, a five percent reduction in highway funding would amount to $5.3 million.
In addition, the Highway Safety Act permits the U.S. Department of Transportation to reward incentive grants equal to ten percent of the apportionment made under Section 402(c), to states which do enforce the 55 mph speed limit. Grants may be used for carrying out any provision of Section 402, Title 23. However, to date, Congress has not funded any incentive grants and are not expected to in the foreseeable future. Table I-1 summarizes the required levels of speed limit compliance and the consequent Federal aid withholding or incentive grants.
TABLE 1-l
STATUTORY LEVEl OF SPEED liMIT COMPLIANCE FOR SANCTIONS OR INCENTIVE GRANTS
--··---~~ctio'"'"''----
For Period Ending % Exceeding 55 m.p.h .
Amount Withheld1 % Exceeding 55 m.p.h.
Amount of Grant2
.. -· ··- ------------------
9/30/79 >10% 5% <601.
9/30/RO >60% 5% <SO%
9/30/81 >SO% S% <40%
9/30/02 >401. 10% <30%
9/30/83 :'>30% 10% < 20% and thereafter
2
Federnl-rdd highway funds under Sections 104 (b) (1), 104 (b) (2), and 104 {b) (6) of Title 23 (exr:ludinq lnterst.ilte).
Incentive grant shall be eqi1al to 10'.!: of the apportionment made under Section 402 (c). Grants lllil.Y he used for carrying out any provision ·of Section 402, T1tle 23.
Savings Estimates
10%
10%
10%
10%
10%
Fuel saving benefits from the 55 mph speed limit equal about 5.8 percent of the total gallons of motor fuel taxed in 1979. Fuel consumption rates are based on a 4,000 pound passenger car operating on a level tangent. Catagories for speed reporting are by jurisdiction rather than by road class, as in the speed summary report. However, the two catagories can be closely compared. Jurisdiction 01 is comparable to road type interstate rural, 02 is comparable to interstate urban, 03 is comparable to multi-lane divided and 07 is comparable to two lane rural and multi-lar,e undivided combined. The fuel savings from the 55 mph speed limit, by jurisdiction, is as follows:
A-19

Gallons Giill ons 1979 VMT Without 55 mph With 55 mph Gallons
Jurisdiction (mill ions) S~eed Limit Speed Limit Savings
01 3,231 205,950,000 135,240,000 70,710,000 02 5,505 256,120,000 178,257,000 77,863,000 03 8,431 376,420,000 332 ,A 50,000 60,988,000 07 5,237 185,.712,000 ll6 ,803,000 68,909,000
TOTAL 22,404 1,024,202,000 762,750,000 278,470,000
Michigan gasoline consumption has decreased in the past two years, due to reduced travel, the 55 mph speed limit, and the increased fuel efficiency of vehicles. The taxable gasoline in 1978 was 4,658 million gallons. In 1979, the taxable gasoline was 4,438 million gallons. In 1980 the gasoline taxed dropped to 3,973 million gallons which is about 15 percent less than 1978 and about 11 percent less than 1979. Around 50 percent of the gas purchased is unleaded.
A-20

r::-- APPENDIX B
ESTIMATION OF AIR QUALITY AND FUEL CONSUMPTION BENEFITS OF
EMPLOYER BASED RIDESHARING PROGRAM
From: "A Handbook For Evaluating The Air Quality and Energy Impacts of Transportation System ~1anagement Strategies." by The t1i chi gan Department of Transportation, Bureau of Transportation Planning, November, 1981.

:-_
' '
APPENDIX B
ESTIMATION OF AIR QUALITY AND FUEL CONSU~1PTION BENEFITS OF EMPLOYER BASED RIDESHARING PROGRAMS
Methodology
A computer modeling approach was used to estimate air quality and energy impacts of employer based ridesharing programs. Using the existing transportation planning models available for the Grand Rapids urbanized area, test simulations were developed to measure the impacts of varying levels of carpool/vanpool participation at major employer sites throughout the area. The procedure used required the identification of all employers with 200 or more employees per geographic zone, and the number of work trips to and from those zones. Using the procedures and formulas discussed in the following pages, participation rates per employer size for typical carpool and vanpool programs were derived. The percent participation for each employer was then multiplied by the total number of work trips to determine the potential reduction in vehicle work trips per zone. Using zonal trip tables of daily work trips for 1982 developed in the Grand Rapids 3-C urban area planning process, the potential work trips eliminated by ridesharing were then subtracted from the original trip totals. Before the subtractions were made, the zonal reduction were first stratified into the following mile range categories to show the effects of longer vanpool trip lengths:
One-Way
TABLE B-1
EMPLOYER BASED RIDESHARE, TRIPS ELIMINATED BY TRIP LENGTH
Percent of Trips Eliminated
Trip Length, in Miles Carpools Van[>oo 1 s
1 - 5 6 - 10
11 - 15 16 - 20 21 - 25 26 - 99
66% 21% 10%
3% .5% NIL
0% 60% 25% 10%
5% NIL
The carpool trip length percentages are the same as for existing work trips in the Grand Rapids area. The longer trip lengths assumed for vanpools reflects an average one-way trip length of approximately 10 miles for that portion of the trip occurring within urban area boundaries.
After the trip table adjustments were made the computer programs TPEMIS and TPFUEL were run from the reduced trip tables to quantify the air quality and fuel savings for each ridesharing alternative. The emission and fuel consumption levels associated with the number of trips eliminated were then
B-1

plotted on a gra.;>h to depict the benefits of employer based rideshari ng efforts. This graph, which appears at the end of the sectior;, can be used to specifically calculate the emission reductions and fuel savings for a local employer based ridesharing program.
Assumptions of Analysis
To determine expected carpool and vanpool participation rates for employer based programs, the following procedures were used. For the carpool program, it was hypothesized that the success rate is a function of employer size. This hypothesis is based on results obtained from Gregory K. Ingram, in "Reductions in Automobile Use in Four Major Cities As A Result of Car Pooling and Improved Transit". The study surveyed changes in auto-occupancy for forty-two New Jersey firms that participated in a carpool matching program. The results of that study were aggregated by employer size for the purposes of computing the average percent increase in auto occupancy. The results from this exercise are found in Table B-2.
TABLE B-2
Data for Carpool Success Rate Equations
Employer Size Midpoint (weighted Average percent change Categor.)l avg. in size categor.)l) in auto occupanC.)I
0-500 250 -0.5
500-1000 750 3.1
1000-1500 1250 5.3
1500-2000 1750 2.7
2000-3000 2500 6.3
3000+ 5700 4.7
Source: Ingram, Gregory K., "Reductions in Automobile Use in Four t~ajor Cities As a Result of Carpooling and Improved Transit".
The average percent increase in auto occupancy was then evaluated using regression analysis. The results are shown in Figure B-1.
B-2

8 / /
FIGURE 8 - 1 / CARPOOL SUCCESS RATES /
7 THREE RESPONSE CURVES / /""2.- OPTIMISTIC RESPONS/
/
/ ~ /'
6 / / /
/ >- /.c
4__ ~ . REGRESSION
u / Z5
<( a. / :J u
/ u 0 a:
f <( / u4
/ z -w Ul <( / w r:r::
·b/ u ~3
"" 0
/ PESSIMISTIC RESPONSE
.. d
2
1
0~------.-------.-------.-------.-------~~------.-----~ 1 2 3 4 5 6
•a EMPLOYEES (T.-IOUSANDS)
-1
B-3

In order to generate a range of possible outcomes, three lines were drawn through these points. lhe middle line is simply the least squares regression. To get an optimistic forecast, this line was shifted vertically until it passed through the highest success rate point. To get a pessimistic forecast, a line was drawn through the origin and the data point which would yield the smallest slope. By inserting employer size into Figure B-1, the percent increase in auto occupancy can be estimated.
Equations were then developed to translate the percent increase in auto occupancy shown in Figure B•l into the expected number Of vehicle trips eliminated per employer. This can be quantified by knowing the following variables:
1. The average car occupancy before the program. 1. 2 was assumed for work trips.
2. The average car occupancy among shared ride vehicles. 2.4 was assumed for employer-based carpool formations.
3. The number of employees per site.
4. The proportional increase in auto occupancy by employer size, from Figure B-1.
After many transformations, the following equation was developed' for employer sites with low levels of transit work trips:
FIGURE B-2
VEHICLE TRIPS ELIMINATED BY CARPOOLS i=:quation 1
EV = EM 5 6
( PR ) 1 + PR
Where EV = vehicle trips eliminated, PR = percent increase in auto occupancy from Figure B-1, and EM= number of einployees arriving by automobile before the program.
Using each of three response curves in Figure B-1, (low, medium, and high) three values for vehicle trips eliminated from carpool use were calculated for each employer location. lhe reductions in vehicle trips were then aggregated by zone to yield "Plans" 1, 3 and 5 shown in Table B-3. Plans 2 and 4 were computed as simple arithmetic averages of the adjacent columns.
Vanpool Procedures
For the estimation of vanpool participation rates, the process begins by developing a graph similar to the one in Figure B-1.
B-4
,--.j
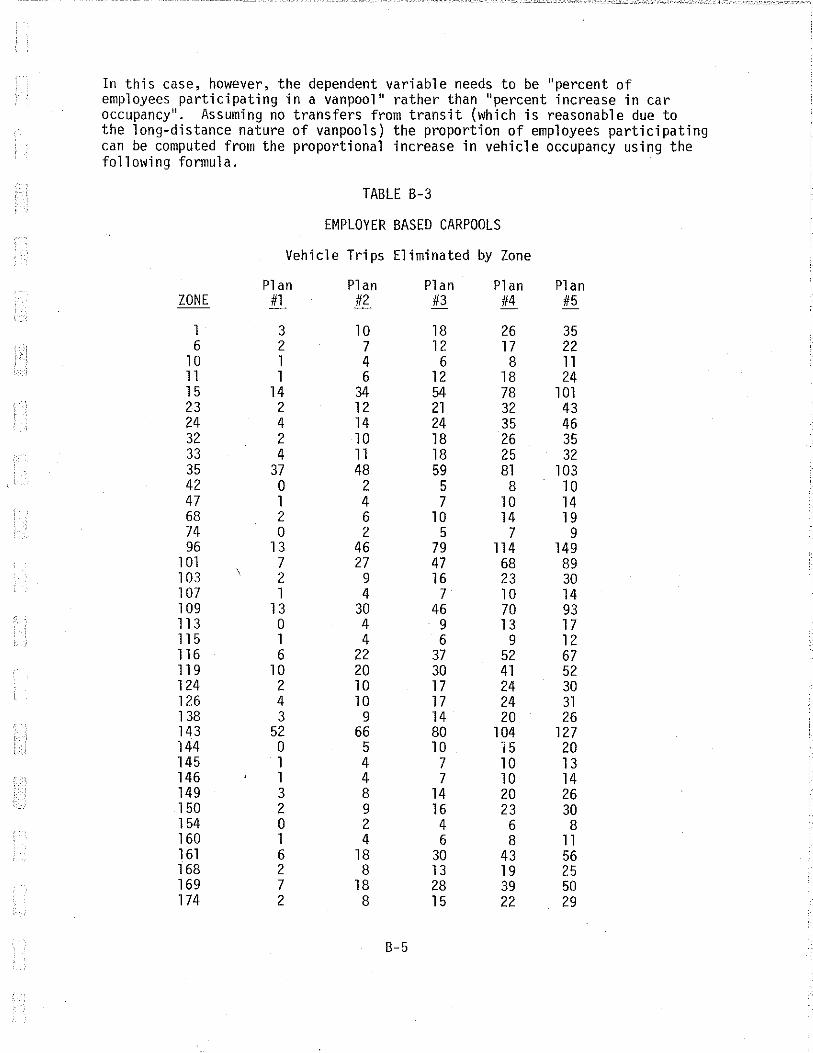
In this case, however, the dependent variable needs to be "percent of employees participating in a vanpool" rather than "percent increase in car occupancy". Assuming no transfers from transit (which is reasonable due to the long-distance nature of vanpools) the proportion of employees participating can be computed from the proportional increase in vehicle occupancy using the following formula.
TABLE B-3
EMPLOYER BASED CARPOOLS
Vehicle Trips Eliminated by Zone
Plan Plan Plan Plan Plan ZONE iLl !R #3 114 #5
1 3 10 18 26 35 6 2 7 12 17 22
10 1 4 6 8 11 11 1 6 12 18 24 15 14 34 54 78 101 23 2 12 21 32 43 24 4 14 24 35 46 32 2 10 18 26 35 33 4 11 18 25 32 35 37 48 59 81 103
'', 42 0 2 5 8 10 47 1 4 7 10 14 68 2 6 10 14 19 74 0 2 5 7 9 96 13 46 79 114 149
1 01 7 27 47 68 89 103 2 9 16 23 30 1 07 1 4 7 10 14 109 13 30 46 70 93 113 0 4 9 13 17 115 1 4 6 9 12 116 6 22 37 52 67 119 10 20 30 41 52 124 2 10 17 24 30 126 4 10 17 24 31 138 3 9 14 20 26 143 52 66 80 104 127 144 0 5 10 15 20 145 1 4 7 10 13 146 1 4 7 10 14 149 3 8 14 20 26 150 2 9 16 23 30 154 0 2 4 6 8 160 1 4 6 8 11 161 6 18 30 43 56 168 2 8 13 19 25 169 7 18 28 39 50 174 2 8 15 22 29
B-5

TABLE B-3
CARPOOLS (continued)
Plan Plan Plan Plan Plan ZONE #l #2 _jl]__ #4 Ji__
175 0 2 5 7 9 176 l 5 9 14 18 178 2 8 15 22 28 179 l 4 6 9 12 180 27 42 58 76 94 181 l 4 6 8 11 182 14 28 41 56 72 183 2 6 11 15 20 196 Q 4 9 14 18 197 2 8 14 21 28 198 0 2 4 6 9 202 51 68 86 113 140 201 6 14 21 30 38 20} 6 20 33 47 61 208 30 46 61 80 100 209 4 12 20 28 36 210 ' 4 7 10 12 211 3. 9 15 22 28 215 172 206 240 293 346 218 50 75 lOQ 130 159 224 1 4 8 12 16 242 11 26 40 5.6 71 243 0 2 4 6 8 25.7 3. 8 14 20 25 270. 67 94 120 154 189 274 15 27 39 53 67 320 1 6 12 18 24 328 15. 86 158 196 233 330 3 12 20 28 37 336 1 4 7 10 13 338 3 8 14 20 25 342 1 4 6 9 12 364 10 24 37 52 66
TOTALS 716 13.91 2064 2807 3548
B-6
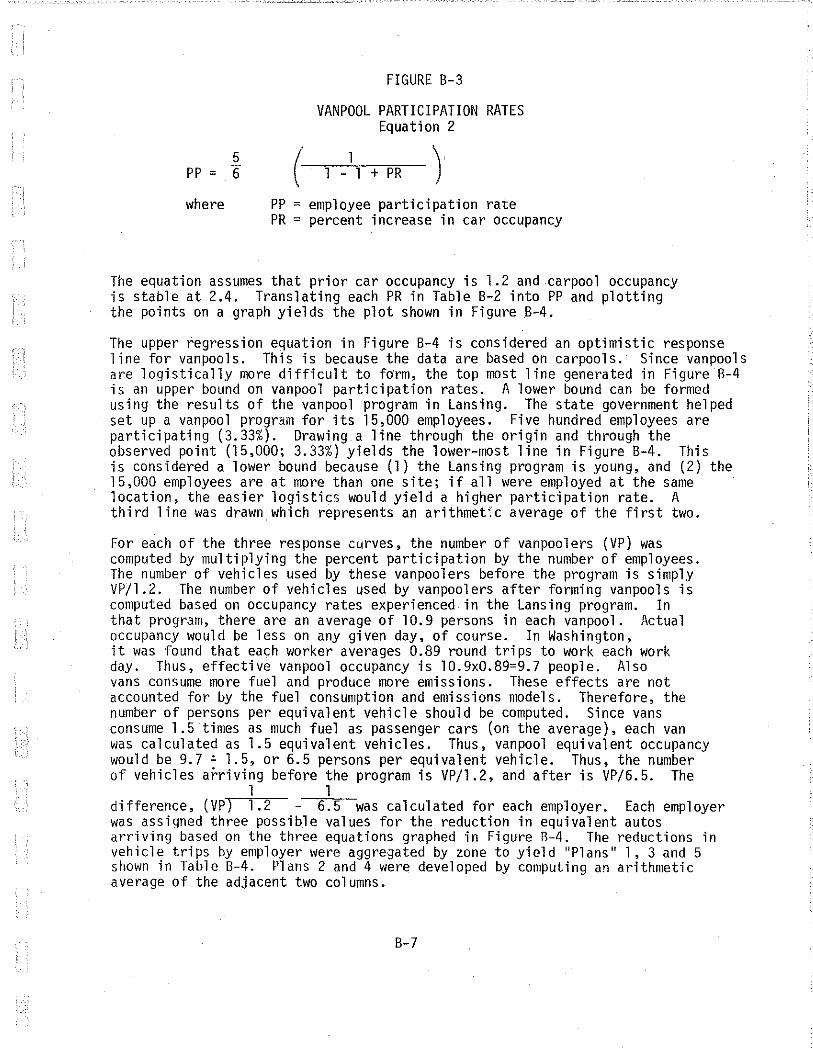
' ': 1
. !
5 pp = 6
where
FIGURE B-3
VANPOOL PARTICIPATION RATES Equation 2
(
------.--· .....:.-.--:--1 =----- \ 1 - 1 + PR )
PP = employee participation rate PR = percent increase in car occupancy
The equation assumes that prior car occupancy is 1.2 and carpool occupancy is stable at 2.4. Translating each PR in Table B-2 into PP and plotting the points on a graph yields the plot shown in Figure .B-4.
The upper regression equation in Figure B-4 is considered an optimistic response line for vanpools. This is because the data are based on carpools. Since vanpools are logistically more difficult to form, the top most line generated in Figure B-4 is an upper bound on vanpool participation rates. A lower bound can be formed using the results of the vanpool program in Lansing. The state government helped set up a vanpool program for its 15,000 employees. Five hundred employees are participating (3.33%). Drawing a line through the origin and through the observed point (15,000; 3.33%) yields the lower-most line in Figure B-4. This is considered a lower bound because (1) the Lansing program is young, and (2) the 15,000 employees are at more than one site; if all were employed at the same location, the easier logistics would yield a higher participation rate. A third line was drawn which represents an arithmet~c average of the first two.
For each of the three response curves, the number of vanpoolers (VP) was computed by multiplying the percent participation by the number of employees. The number of vehicles used by these vanpoolers before the program is simply VP/1.2. The number of vehicles used by vanpoolers after forming vanpools is computed based on occupancy rates experienced in the Lansing program. In that program, there are an average of 10.9 persons in each vanpool. Actual occupancy would be less on any given day, of course. In Washington, it was found that each worker averages 0.89 round trips to work each work day. Thus, effective vanpool occupancy is 10.9x0.89=9.7 people. Also vans consume more fuel and produce more emissions. These effects are not accounted for by the fuel consumption and emissions models. Therefore, the number of persons per equivalent vehicle should be computed. Since vans consume 1.5 times as much fuel as passenger cars (on the average), each van was calculated as 1.5 equivalent vehicles. Thus, vanpool equivalent occupancy would be 9.7 ~ 1.5, or 6.5 persons per equivalent vehicle. Thus, the number of vehicles arriving before the program is VP/1.2, and after is VP/6.5. The
1 1 difference, (VP) 1.2 6.5 was calculated for each employer. Each employer was assigned three possible values for the reduction in equivalent autos arriving based on the three equations graphed in Figure B-4. The reductions in vehicle trips by employer were aggregated by zone to yield "Plans" 1, 3 and 5 shown in Table B-4. Plans 2 and 4 were developed by computing an arithmetic average of the adjacent two columns.
B-7

5
4
3
z 0 1-<( a. u 1-0: <( a. ,..
/ 2
/
1
••
FIGURE B - 4 VANPOOL RESPONSE CURVES
/ /~
/ /
/
/ OPTIMISTIC RESPONSE
/
/ /
/ // / ""'z...AVERAGE RESPONSE
/ /
/
PESSIMISTIC RESPONSE (MICH EXPER- 15,009
STATE EMPL. 3 1(3% PART.)
1000 :'000 3000 4000
EMPLOYER SIZE (EMPLOYEES)
B-8
5000 6000

TABLE B-4
EMPLOYER BASED VANPOOLS
Vehicle Trips Eliminated by Zone
Plan Plan Plan Plan Plan Zone #1 #2 #3 #4 #5
1 0 4 7 10 13 6 0 2 4 6 8
10 0 1 2 3 4 11 0 2 5 6 8 15 2 11 20 29 38 23 0 4 8 11 14 24 1 4 8 12 17 32 0 3 6 9 12 33 1 4 6 9 12 35 7 16 25 34 43 42 0 1 2 2 3 47 0 2 3 4 5 68 0 2 4 6 7 74 0 1 2 2 3 ,. 96 2 16 29 36 54 '
1 01 0 8 15 24 32 1 03 0 3 6 8 10 1 07 0 2 3 4 5 109 2 10 17 24 31 113 0 2 3 4 6 115 0 1 2 3 4 116 1 8 14 20 25 119 2 6 11 16 20 124 0 2 5 8 11 126 1 4 6 8 11 138 1 3 5 8 10 143 10 21 32 43 54 144 0 2 4 5 6 145 0 1 2 4 5 146 0 2 3 4 5 149 1 3 5 8 10 150 0 2 5 8 10 154 0 0 1 2 3 160 0 1 2 3 4 161 0 6 11 16 20 168 0 2 4 6 9 169 1 6 10 14 19 174 0 4 6 8 10 175 0 1 3 2 3 176 0 2 3 4 6 178 0 2 5 8 10 179 0 1 2 3 4 180 6 14 22 30 39 181 0 1 2 3 4 182 3 9 15 21 27 183 0 2 4 6 7
B-9

TABLE B-4 (continued)
Plan Plan Plan Plan Plan Zone __it!_ #2 #3 #4 #5
196 0 2 3 5 7 197 0 2 5 8 10 198 0 l 2 2 3 202 9 22 34 46 58 203 l 4 8 11 14 207 l 6 12 17 22 208 7 16 24 32 41 209 1 4 7 10 13 210 0 1 2 3 4 211 l 4 6 8 10 215 40 70 101 132 162 218 12 26 39 53 67 224 0 2 3 4 6 242 2 8 15 20 26 243 0 l 2 2 3 257 1 3 5 7 9 270 15 32 48 64 81 274 3 9 17 21 27 320 0 2 5 7 9 328 24 44 65 86 107 330 1 4 7 10 14 336 0 1 2 3 4 338 1 3 5 7 9 342 0 1 2 3 4 364 2 6 10 14 18
Tota 1 s 162 477 785 1079 1389
Stud.)! Results
The air quality and fuel consumption reductions for the ten employer based rideshare simulations are presented in Tables B-5 and B-6. The VMT, emission, and fuel reductions were quantified on an area wide basis by assigning the trip tables adjusted for ridesharing elimination to a 1982 highway network for Grand Rapids. The results were then compared to an assignment of the original, unaltered trip table, as listed under the "Do-Nothing" heading in the tab 1 es.
A plot of the daily emission and fuel reductions versus the number of trips eliminated by the ridesharing alternatives appears in Figures B-5 and B-6.
B-1 0

TABLE B-5
CARPOOL ALTERNATIVE RESULTS GRANO RAP IDS
All Figures Are For 1982
DO-NOTHING PLAN 1 PLAN 2 PLAN 3 PLAN 4 PLAN 5
Total Vehicle Trips Assigned 1 ,543,698 1 ,542,982 1 , 542,307 1 ,541,636 1 ,540,890 1 ,540,148 Reductions 716 1 ,398 2,062 2,808 3,550
Daily VMT 8,485,270 8,481,590 8,478,220 8,474,780 8,471 ,050 8,467,170 Reductions 3,680 7,050 10,490 14,220 18,1 00
Duily Vehicle Emissions (in kilograms)
l. Non-Methane HC 22,834 22,824 22,815 22,806 22,796 22,786 Reductions 10 19 28 38 48
"" I ~ 2. co 232,293 232,193 232,1 00 232,006 231 ,904 231 , 799 ~
Reductions 100 193 287 389 494
3. NOX 23,598 23,588 23,579 23,569 23,558 23,547 Reductions 10 19 29 40 51
Daily Fuel Consumption 501 ,606 501 , 286 500,993 500,694 500,370 500,033 (in gallons) Reductions 320 613 912 1 ,236 1 ,573

TABLE B-6
VAN POOL ALTERNATIVE RESULTS GRAND RAPIDS
All F·! gures Are For 1982
DO-NOTHING f'.LAN 1 PLAN 2 PLAN 3 PLAN 4 PLAN 5
Total Vehicle Trips Assigned 1 ,543,698 1 ,543, 535 1 ,543,221 1,542,912 1 ,542,620 1,542,310 Reductions 163 477 78£ 1 ,078 1 ,388
Daily VMT 8,485,270 8,483,540 8,480,160 8,47:6,940 8,473, 720 8,470,370 Reductions l '730 5,11'0 8,330 11,550 1'1,900
Da'~y Ve.hicle Emissions (in ki1 ograms)
L Non~Methane HC 22,834 22,830 22,821 22,813 22,805 22,797 Reductions 4 13 21 29 37
"" ' ~ 2. co 232,293 232,248 232,1:65 232,083 231 ,004 231 ,921 N
Reductions 45 128 210 289 372
3. NOX 23,598 23,593 23,583 23,574 23,5:64 23,554 Reductions 5 15 24 34 44
Daily Fuel Consumption 501 ,606 501,455 501 , 162 500,882 500,602 500,311 (in gallons) Reductions 151 444 724 1 ,004 1 ,295
~:
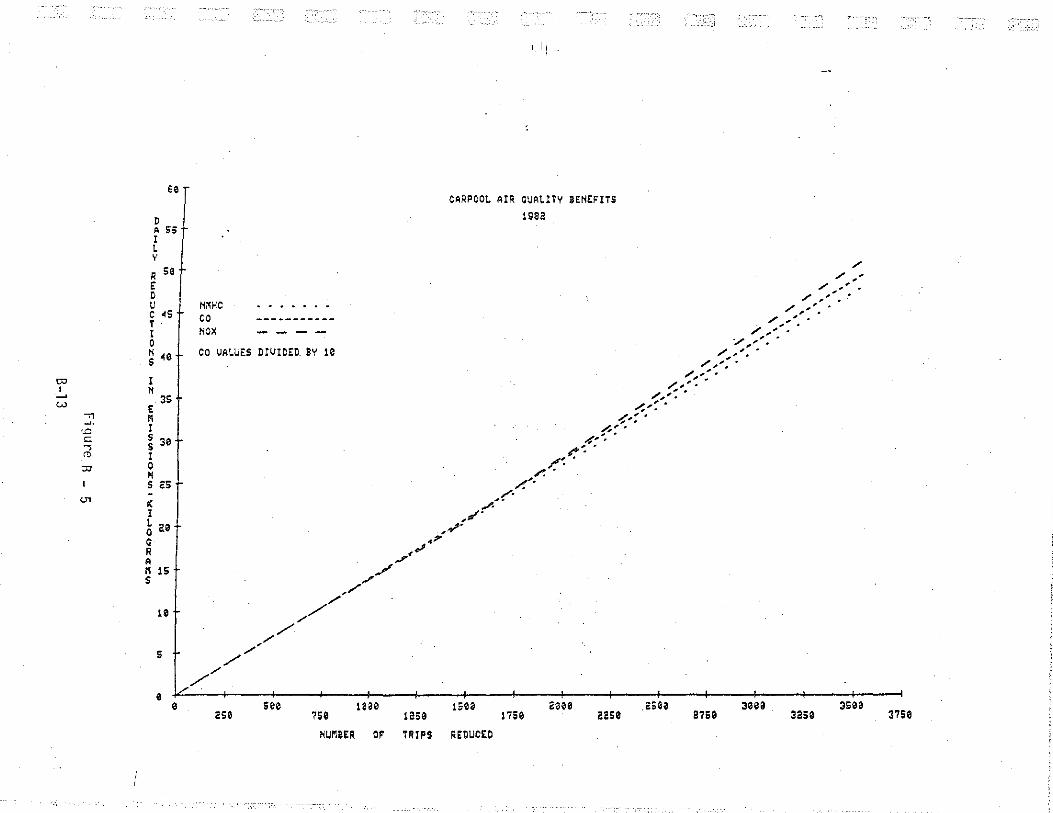
60
D • ss I L y
R sa
• D u c 45 T I 0 N 40 s
"" I I H w 35
E ..,., M
<0 I <:: s 30 -s s ro I ::0 0
" s 25
"' K I L ae 0 Q R • " 15 s
10
i
e e
N~HC
co HOX
CO VALUES DIVIDED BV 10
see 250 750
1130
r lr '
CARPOOL AIR OUAL!TV BENEFITS 1gsa
15U 2G30 1750 aase
NUMitR OF TRIPS REDUCED
.2SU 9750 395~ 3750

60
D A 55 I t v R 50 E D u c 45 T I 0 N 49 s I N
E M I
JS
s 30 s I 0 N s 25
K I t 20 0 G R A M 15 s
5
HMHC co KCX
VANPOOl AI' QUALITY BENEFITS 1saa
CO VALUES DIVID!D BY ~0
aee 600
NUMEER OF TRIPS REDUCED
,,'
~aee !600 1<!0 IS00

Calculations
The results of the case study for Grand Rapids indicate that the relationship between air quality improvements and the number of trips reduced by ridesharing is linear. For each additional increment of trips reduced, an almost constant improvement in air quality is to be expected. Linear regression analysis on the results shown in Figures B-5 and B-6 produced the following equations, which may be used to quantify the impacts of employer based ridesharing programs:
FIGURE B-7
EMPLOYER BASED RIDESHARING BENEFITS ESTIMATION EQUATIONS
Non-Methane Hydrocarbon Reductions (KG)
1. Vanpool = .02676 (TE) 2. Carpool = .01355 (TE)
Where TE = the number of one-way vehicle work trips eliminated.
Carbon Monoxide Reduction (KG)
3. Vanpool =· .26798 (TE) 4. Carpool= .13896 (TE)
Nitros Oxides Reductions (KG)
5. Vanpool = .03145 (TE) 6. Carpool = .01423 (TE)
Fuel Consumption Reduction (Gallons)
7. Vanpool = .93049 (TE) 8. Carpool = .44202 (TE)
All quantities calculated are for daily reductions. To convert daily kilograms to tons per year multiply the emission equation results by 4.02 x lo-4. Multiplying daily fuel savings by 365 gives annual results.
These calculations must be based on an assumed reduction in the number of trips produced by the ridesharing program (TE). For carpools, that reduction can be calculated from Figures B-1 and B-2, and for vanpools it can be calculated from Figures B-3 and B-4. These figures provide estimates which may not be appropriate for all employer-based ridesharing programs. If more detailed
B-15
···---·-- --- ·.·~--.... --.. ·· ------·--~ .. --_ .. , .... ---
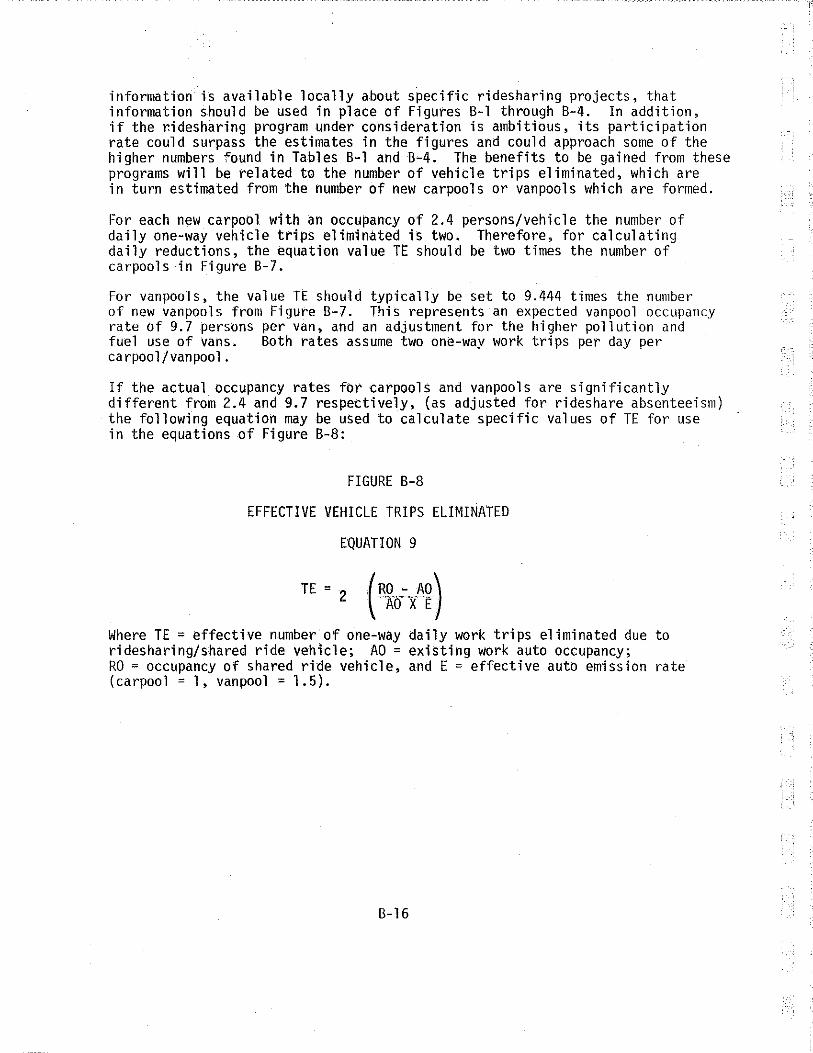
information is available locally about specific ridesharing projects, that information should be used in place of Figures B-1 through B-4. In addition, if the r.idesharing program under consideration is ambitious, its participation rate could surpass the estimates in the figures and could approach some of the higher numbers found in Tables B-1 and B-4. The benefits to be gained from these programs will be related to the number of vehicle trips eliminated, which are in turn estimated from the number of new carpools or vanpools which are formed.
For each new carpool with an occupancy of 2.4 persons/vehicle the number of daily one-way vehicle trips eliminated is two. Therefore, for calculating daily reductions, the equation value TE should be two times the number of carpools in Figure B-7.
For vanpools, the value TE should typically be set to 9.444 times the number of new vanpools from Figure B-7. This represents an expected vanpool occupancy rate of 9. 7 persons per van, and an adjustment for the higher po 11 uti on and fuel use of vans. Both rates assume two one-way work trips per day per carpool/vanpool.
If the actual occupancy rates for carpools and vanpools are significantly different from 2.4 and 9.7 respectively, (as adjusted for rideshare absenteeism) the following equation may be used to calculate specific values of TE for use in the equations of Figure B-8:
FIGURE B-8
EFFECTIVE VEHICLE TRIPS ELIMINATED
EQUATION 9
TE = 2 (RO - AO)
AO X E
Where TE =effective number of one-way daily work trips eliminated due to ridesharing/shared ride vehicle; AO = existing work auto occupancy; RO = occupancy of shared ride vehicle, and E = effective auto emission rate (carpool = 1, vanpool = 1.5).
B-16

APPENDIX C
TRANSIT
METHOLODOLGY FOR FUEL SAVINGS CALCULATION

APPENDIX C
TRANSIT - METHODOLOGY FOR FUEL SAVINGS CALCULATIONS
The UMTA Transportation Planning System (UTPS) package of computer si mul at ion programs was utilized to analyze the operational and fuel use impacts of various energy emergency measures for the Lansing transit system. These programs have been designed by the federal Urban Mass Transportation Administration (UMTA) for the purpose of simulating the operational characteristics of urban mass transit systems. After computer simulation of the existing transit system in an urban area, the UTPS program package can be used to assess the impacts of various transit system service modifications such as route changes, additions and deletions; fare structures and service improve-ments in headway operations and daily scheduling.
To enter the UTPS package, each of the Capitol Area Transit Authority's (CATA) 26 bus routes operating in mid 1980 were computer coded, describing their distances, operating speeds, stops, headways, starting and ending time, and hours of daily operation.l For increased accuracy, where transit headways varied during the day, existing routes were stratified into multiple routes with different operating characteristics, resulting in the coding of a total of 100 individual routes. The run times and vehicle requirements calculated in the network portion of UTPS for each route were then checked for accuracy against actual transit operating data provided by CATA for the year 1980. After an accurate simulation of existing transit service was established, the following analysis procedure was used to calculate the fuel savings for the five suggestions presented in Chapter V; "Increase Transit Service Based on Demand".
Step 1: Calculate estimated daily ridership by, route for each suggested change during an emergency.
The following assumption of bus occupancies during an energy emergency were used for analysis of all suggestions:
CATA PRIORITY
High Medium Low
60 50 40
TABLE C-1
ESTIMATED BUS OCCUPANCIES PER TRIP
TYPE OF SERVICE OFF-PEAK tUXED OPERATION
30 25 20
37 31 25
Figures are given in average passengers per trip for the entire length of the bus route. These figures were based on a knowledge of existing CATA occupancy rates, the maximum seating capacity of an average bus assuming standees (60-80 per bus), and the assumption of excess demand for transit service during an energy emergency. Peak hour operation was defined as 3 hours daily and 2 hours- 6:45- 7:45AM, 4:30- 5:30PM for express bus service.
See Transit Network Analysis- INET, U.S. Department of Transportation, UMTA, July, 1979, for a description of transit network coding, inputs and outputs.
C-1

Route priorities reflect existing ridership levels and occupancy rates and frequency of daily service. Using the number of daily bus trips per route from UTPS results, estimated ridership can be obtained by:
ESTIMATED RIDERSHIP = ESTIMATED OCCUPANCY X DAILY TRIPS
Step 2: Comparing estim11ted ridership with existing ridership yields the expected number of person trips diverted from auto travel.
ESTIMATED RJOERSHIP - PRESENT RIDERSHIP (AS OF JANUARY 1980) = PERSON TRIPS DIVERTED TO TRANSIT
Step 3: Adjusting trips diverted by an average auto occupancy for work trips in Lansing of 1 •. 2 person per car yields the number of auto trips diverted by increased transit usage.
TRIPS DIVERTED FROM AUTOS ._ 1.2 = AUTO TRIPS REMOVED FROM INCREASED TRANS IT USE. .
Step 4: Calculate auto vehicle miles of travel reduced.
AUTO TRIPS REMOVED X llUS ROUTE MILES = AUTO VEHICLE MILES OF TRAVEL REDUCED.
Step 5: Calculate fuel savings from reduced auto travel.
AUTO FUEL SAVED = AUTO VMT REDUCED X FUEL CONSUMPTION FOR AUTOS @ AVERAGE SPEED OF 20 MPH {1980 = .06822 GALLONS PER MILE)
Step 6: Adjust fuel savings from auto travel reductions for any additional diesel fuel consumed by buses for each suggestion. Bus fuel consumption was estimated from the following equation, relating fuel consumption and the number of stops for a typical bus.2
GALLONS/MILE = .• 13071 + .03071 (STOPS/MILE) -.00089 (STOPS/MILE)2
Step 7. Net fuel S<!vings is the (!mount of fuel saved from auto trips diverted to transit usage minus any additional bus fuel expended in implementing each suggestion.
BUS FUEL = GALLONS/MILE X BUS VEHICLE MILES OF TRAVEL
For the simulation of the flex-time measures, peak hour travel was defined as occurring between 7 to 9 AM and 4 to 6 PM and estimated bus occupancies were reduced to reflect lower averages for a longer peak period of operation (2 hours each for AM and PM).
2 Federal Highway Administration, Energy Requirements for Transportation Systems - Workshop Notes, June 12, 1979 page A-72.
C-2
[--_,
I

!
!.
CATA PRIORITY
High Medium Low
TABLE C-2
FLEXTIME ESTIMATED BUS OCCUPANCIES
PEAK
45 37 30
TYPE OF SERVICE OFF-PEAK
30 25 20
C-3
MIXED OPERATION
37 31 25