Embed Size (px)
Citation preview

8/6/2019 MfM Jul 8 2011
http://slidepdf.com/reader/full/mfm-jul-8-2011 1/14
MACRO FOR MARKETS
mfglobal.com
Disappointing Employment ReportThe June employment report was much weaker than expected. While disappointed, we caution
against simply extrapolating. Yes, there has clearly been some loss of momentum in the last few
months, but (a) we see good reasons to believe that the latest employment data exaggerate the
falloff in the underlying trend, and, (b) there are also good reasons to expect momentum to turn
more positive in coming months. That said, risks are rising that we will have to pare our growth
projections.
The 22,000 per month average gain in payrolls in the last two months is down sharply from a
179,000 per month pace in the first four months of the year. In our view, that degree of slowing is
much greater than seems consistent with other data, including the employment indexes in the
ISM surveys and jobless claims. We continue to expect the unemployment rate to trend lower in
the next year and a half, although we have adjusted our forecast slightly to reflect the higher than
expected level in June. We now forecast a decline to 8.8% at the end of 2011 (instead of 8.6%)
and 7.9% at the end of 2012 (instead of 7.8%). At 9.2%, the June reading was up from a low of
8.8% in March but still down from 9.6% in Q4 of 2010 and 10.0% in Q4 of 2009.
Preview: Lots of Key GDP Input Data + Fed Chairman TestimonyWe will review our estimate for Q2 real GDP growth after some key input data are reported in the
upcoming week—most important will be foreign trade, federal outlays, retail sales, and
inventories. Currently, risks appear firmly on the downside relative to our 3.5% estimate for the
annualized pace, although we expect many forecasters will have to raise their estimate in the
week ahead. The consensus appears to be close to 2.0%. Also of note: the PPI and CPI, claims,
industrial production, and the Michigan sentiment survey. The Fed chairman will testify.
The weakness in payrolls in the last two months has contrasted with the relative strength
being signaled by the ISM employment indexes.
* Based on a 2003-09 regression of payrolls changes vs. the two individual ISM employment indexes; the regressionimplies a 26% weight for manufacturing and 74% for nonmanufacturing.Note: Shaded bars represent periods of recession.Source: Bureau of Labor Statistics, Institute for Supply Management, and MF Global
Economic Analysis | US
JAMES F. O’SULLIVAN STEPHANIE S. CHENG
Chief Economist Economist
+1 212 589 6479 +1 212 589 6373
[email protected] [email protected]
CONTENTS
Pg. 2 | Disappointing EmploymentReport
Pg. 6 | Forecast Summary
Pg. 7 | Data Preview
Pg. 14 | Calendar
JULY 8, 2011 INSTITUTIONAL USE ONLY MF Global Weekly Report
0 1 0 1 0 1 0 1 0 1 0 1 0 2 0 2 0 2 0 2 0 2 0 2 0 3 0 3 0 3 0 3 0 3 0 3 0 4 0 4 4 0 4 0 4 0 4 0 5 0 5 0 5 0 5 0 5 0 5 0 6 0 6 0 6 0 6 0 6 0 6 0 7 0 7 0 7 0 7 0 7 0 7 0 8 0 8 0 8 0 8 0 8 0 8 0 9 0 9 0 9 0 9 0 9 0 9 1 0 1 0 1 0 1 0 1 0 1 0 1 1 1 1 1 1 1 1 1 1 1 1 1 2 1 2
30
35
40
45
50
55
60
-840
-630
-420
-210
0
210
420
01 02 03 04 05 06 07 08 09 10 11 12
Payroll s ex census
Model estimate for p ayrolls based on regression of ISM employment data*
ch, 000s per month, sa
Jun

8/6/2019 MfM Jul 8 2011
http://slidepdf.com/reader/full/mfm-jul-8-2011 2/14
Economic Analysis | US
7/8/2011 | MACRO FOR MARKETS
DISAPPOINTING EMPLOYMENT REPORT
The June employment report was much weaker than expected, in
contrast to somewhat stronger than expected data in the last few
weeks. Payrolls were reported up just 18,000 in June following a
downward-revised 25,000 increase in May (revised from 54,000).The unemployment rate rose to 9.2% from 9.1%. While
disappointed, we caution against simply extrapolating. Yes, there
has clearly been some loss of momentum in growth in the last few
months, but (a) we see good reasons to believe that the latest
employment data exaggerate the falloff in the underlying trend,
and, (b) there are also good reasons to expect momentum to turn
more positive in coming months. That said, risks are rising that
we will have to pare our growth projections.
How disappointing was the report? Along with weaker than
expected readings for payrolls and the unemployment rate, the
workweek fell 0.1 hour and average hourly earnings were only
flat. Moreover, the rise in the unemployment rate was despite a272,000 decline in the labor force; the household survey
employment measure was reported down 445,000.
Some Positive Signs, too
More positively, jobless claims fell in the latest week (to 418,000
from 432,000) and the employment component of the
nonmanufacturing ISM survey rose slightly in June from an
already high level in May (to 54.1 from 54.0), even as the overall
nonmanufacturing ISM index slipped (to 53.3 from 54.6). The
weakness in the employment report also contrasted with the
pickup signaled by the ADP survey (which showed a 157,000 rise
in private payrolls in June following 36,000 in May).
Within the employment report, one positive takeaway was the
pickup in hours worked and wage income in Q2 as a whole. The
index of private sector hours worked rose at a 3.3% annual rate in
Q2, up from a 2.0% pace in Q1 and 1.9% in all of 2010 (Q4/Q4).
Total private sector wage income (combining average hourly
earnings and hours worked) rose at a 5.1% annual rate in Q2, up
from a 4.3% pace in Q2 and 3.7% in 2010 (Q4/Q4).
Were the Last Two Months Really that Weak?
On that smoothed, quarterly average basis, the data look
encouraging. Unfortunately, the last two months alone look much
less encouraging, which raises the question: How much has the
trend deteriorated in the last couple of months?
The 22,000 per month average gain in payrolls in the last two
months is down sharply from a 179,000 per month pace in the
first four months of the year. In our view, that degree of slowing is
much greater than seems consistent with other data, including the
employment indexes in the ISM surveys (see bottom chart) and
jobless claims. (And also the ADP report.)
Bond yields continue to track the surprises in the economic data.
The weaker than expected employment report reversed some—
but not all—of the recent turnaround in the economic surprise
index calculated by Citigroup.
The economic surprise index, calculated by Citig roup, reflects “weighted standarddeviations of data surprises relative to Bloomberg median expectations in rollingthree-month windows”Source: Citigroup Global Markets Inc., Federal Reserve Board, and Bloomberg
The weakness in payrolls in the last two months has contrastedwith the relative strength being signaled by the ISM employmentindexes.
* Based on a 2003-09 regression of payrolls changes vs. the two individual ISMemployment indexes; the regression implies a 26% weight for manufacturing and
74% for nonmanufacturing.Note: Shaded bars represent periods of recession.Source: Bureau of Labor Statistics, Institute for Supply Management, and MFGlobal
0 1 0 1 0 1 0 1 0 1 0 1 0 2 0 2 0 2 0 2 0 2 0 2 0 3 0 3 0 3 0 3 0 3 0 3 0 4 0 4 0 4 0 4 0 4 0 4 0 5 0 5 0 5 0 5 0 5 0 5 0 6 0 6 0 6 0 6 0 6 0 6 0 7 0 7 0 7 0 7 0 7 0 7 0 8 0 8 0 8 0 8 0 8 0 8 0 9 0 9 0 9 0 9 0 9 0 9 1 0 1 0 1 0 1 0 1 0 1 0 1 1 1 1 1 1 1 1 1 1 1 1 1 2 1 2
30
35
40
45
50
55
60
-840
-630
-420
-210
0
210
420
01 02 03 04 05 06 07 08 09 10 11 12
Payrolls ex census
Model estimate for payrolls based on regression of ISMemployment data*
ch, 000s per month, sa
Jun
2.4
2.8
3.2
3.6
4.0
-126
-63
0
63
126
Oct-09 Feb-10 Jun -10 Oct-10 Feb-11 Jun -11
U.S. Econo mic Surprise Index (l)
10-year Treasury yield (r)
index
Jul 8
%

8/6/2019 MfM Jul 8 2011
http://slidepdf.com/reader/full/mfm-jul-8-2011 3/14
Economic Analysis | US
7/8/2011 | MACRO FOR MARKETS
Could the 179,000 average in the first four months of the year
have been exaggerated on the strong side, with some of the
slowing in the last two months reflecting “payback”? Yes, that is
possible. For the first half of 2011 as a whole, gains averaged
126,000 per month, which was a pickup from 103,000 per monthon average on an ex-census basis in the second half of 2010,
56,000 per month on that basis in the first half of 2010, and
-196,000 per month in the second half of 2009. In turn, we expect
the second half of 2011 to show clear further improvement
relative to the first half, consistent with the unemployment rate
continuing to trend lower.
The unemployment rate also showed improvement in the first half
of 2011 as a whole. At 9.2%, the June reading was up from a low
of 8.8% in March but still down from 9.6% in Q4 of 2010 and
10.0% in Q4 of 2009.
We expect the unemployment rate to continue to trend lower in
the next year and a half, although we have adjusted our forecast
slightly to reflect the higher than expected level in June. We now
forecast a decline to 8.8% at the end of 2011 (instead of 8.6%)
and 7.9% at the end of 2012 (instead of 7.8%).
Realization of our forecast will likely require a resumed downtrend
in jobless claims soon. At 425,000, the latest four-week average
in claims is down from as high as 440,000 in May, although it is
still up from just under 400,000 in February and March. Note,
though, that the level is still down from the 448,000 per week
average in the second half of 2010, when the trend in payrolls
gains was around 100,000 per month—consistent with the
weakness in payrolls in the last two months being exaggerated.
Payrolls gains averaged just 22,000 per month in May and June, down from a 179,000 per month average from Januarythrough April. The 126,000 average for first half of the year was still a pickup from a 103,000 per month (ex-census) average inthe second half of 2010 and 56,000 in the first half of 2010.
000s per month, sa unless noted 2010 10H1 10H2 11H1 11Q1 11Q2 APR 2011 MAY 2011 JUN 2011
PAYROLLS 78 110 47 126 166 87 217 25 18
CENSUS 2010 -1 54 -57 0 1 -1 -3 0 0
EX CENSUS 2010 80 56 103 126 165 88 220 25 18
GOVERNMENT -19 40 -79 -31 -26 -37 -24 -48 -39
EX CENSUS 2010 -18 -14 -22 -31 -27 -36 -21 -48 -39
FEDERAL 3 4 1 -4 -1 -7 -5 -2 -14STATE & LOCAL -21 -18 -23 -28 -26 -29 -16 -46 -25
PRIVATE 98 71 125 158 191 124 241 73 57
MANUFACTURING 9 15 3 24 37 11 28 -2 6
MOTOR VEHICLES & PARTS 2 4 0 3 7 0 2 -4 1
OTHER 7 11 3 20 30 11 26 2 5
MINING & LOGGING 6 7 5 9 8 9 11 9 7
CONSTRUCTION -12 -23 -2 3 8 -3 4 -4 -9
WHOLESALE TRADE 1 -4 5 11 14 7 7 7 7
RETAIL TRADE 8 10 6 15 8 22 64 -4 5
TRANS & WAREHOUSING 7 -2 15 0 -7 7 6 12 4
UTILITIES 0 -1 0 0 0 0 1 0 0
INFORMATION -4 -7 -1 -1 -4 1 1 2 0
FINANCIAL ACTIVITIES -5 -9 -2 -1 -2 0 1 14 -15
PROF. & BUS. SERVICES 35 34 37 44 55 34 45 45 12
TEMPORARY HELP 26 30 22 4 13 -6 -5 -2 -12EDUC. & HEALTH SERVICES 34 31 38 27 35 19 40 18 0
LEISURE & HOSPITALITY 12 14 9 23 32 13 29 -24 34
OTHER SERVICES 8 4 13 5 7 3 3 2 5
HOUSEHOLD SURVEY EMPLOYMENT* 120 225 15 100 377 -177 -190 105 -445
PAYROLLS EQUIVALENT PORTION 149 271 27 87 249 -76 50 123 -401
*Adjusted by BLS for series breaks due to new population assumptions. Source: Bureau of Labor Statistics
8/6/2019 MfM Jul 8 2011
http://slidepdf.com/reader/full/mfm-jul-8-2011 4/14
Economic Analysis | US
7/8/2011 | MACRO FOR MARKETS
The ISM employment indexes are also suggesting that the
weakness in payrolls in May and June was exaggerated. Based
on a regression of the data for most of the past decade, the June
readings were consistent with a trend in payrolls gains of more
than 200,000 per month. While those indexes also overstatedstrength in the first four months of the year, they were quite
accurate in 2010 and 2009.
Don’t Blame the Seasonal Factors
Note that we are not attributing the weakness in payrolls to overly
aggressive seasonal adjustment factors. (Apparently, some
analysts have used that explanation.) While the June seasonal
factors were more aggressive this year than last year, the change
reflected a later cutoff point for the sample (June 18 vs. June 12)
in a month when not seasonally adjusted private payrolls rise
sharply. (Specifically, applying last year’s seasonal factors would
have boosted total payrolls by 59,000 and private payrolls by
75,000.)
In short, we have no excuses for the much weaker than expected
report other than to say that the data can be volatile and even two
months combined are not necessarily representative of the trend.
Also, other data are starting to suggest that momentum is turning
positive again, with a number of factors that have contributed to
weakness now fading—including Japan supply chain effects, the
Q1 spike in oil prices, and some extreme weather. Among the
positive signs have been a decline in jobless claims from their
high, stronger-than-expected chain store sales in late June, and
strength in the equity market (even with a selloff after the
employment data).
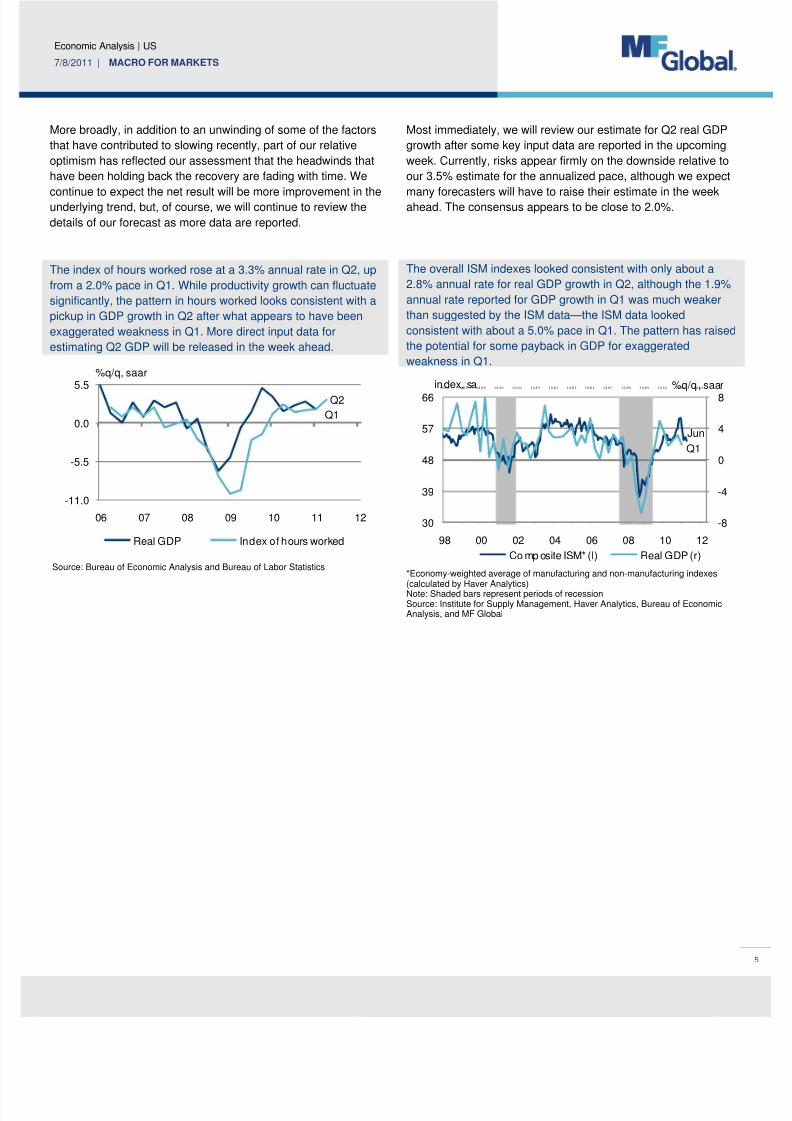
The y/y pace in average hourly earnings appears to have
stabilized at just under 2%. It was 1.9% in June.
Source: Bureau of Labor Statistics
At 9.2%, the June reading for the unemployment rate was up
from 9.1% in May and 9.0% in April, but it was still down sharply
from 9.6%, on average, in Q4. The broader, and more cyclical,
U-6 underemployment series rose to 16.2% in June from 15.8%
in May; it is down from 16.9% in Q4.
*Along with the total unemployed from the official unemployment rate (reflectingindividuals who say they have looked for a job in the last month), the broader U-6rate also includes (1) all "marginally attached" potential workers, and (2) workersemployed “part time for economic reasons,” as a percent of the civilian labor forceplus all “marginally attached” potential workers. Marginally attached potentialworkers are persons who currently are neither working nor looking for work butindicate that they want and are available for a job and have looked for worksometime in the past year. Persons employed part time for economic reasons arethose who say they want and are available for full-time work but have to settle for apart-time schedule.Note: Shaded bars represent periods of recession.Source: Bureau of Labor Statistics and MF Global
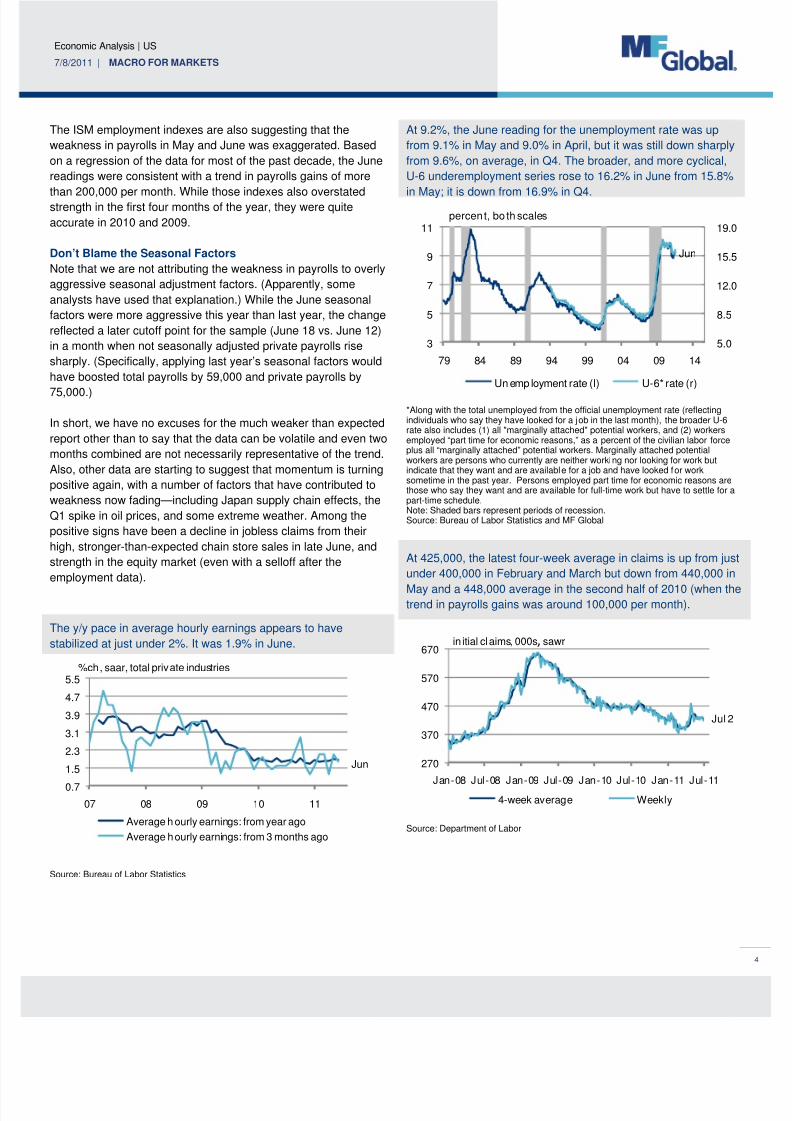
At 425,000, the latest four-week average in claims is up from just
under 400,000 in February and March but down from 440,000 in
May and a 448,000 average in the second half of 2010 (when thetrend in payrolls gains was around 100,000 per month).
Source: Department of Labor
5.0
8.5
12.0
15.5
19.0
3
5
7
9
11
79 84 89 94 99 04 09 14
Un emp loyment rate (l) U-6* rate (r)
percent, bo th scales
Jun
270
370
470
570
670
Jan-08 Jul-08 Jan-09 Jul-09 Jan-10 Jul-10 Jan-11 Jul-114-week average Weekly
in itial claims, 000s, sawr
Jul 2
0.7
1.5
2.3
3.1
3.9
4.7
5.5
07 08 09 10 11
Average h ourly earnings: from year ago
Average hourly earnings: from 3 months ago
%ch, saar, total private industries
Jun
8/6/2019 MfM Jul 8 2011
http://slidepdf.com/reader/full/mfm-jul-8-2011 5/14
Economic Analysis | US
7/8/2011 | MACRO FOR MARKETS
More broadly, in addition to an unwinding of some of the factors
that have contributed to slowing recently, part of our relative
optimism has reflected our assessment that the headwinds that
have been holding back the recovery are fading with time. We
continue to expect the net result will be more improvement in theunderlying trend, but, of course, we will continue to review the
details of our forecast as more data are reported.
The index of hours worked rose at a 3.3% annual rate in Q2, up
from a 2.0% pace in Q1. While productivity growth can fluctuate
significantly, the pattern in hours worked looks consistent with a
pickup in GDP growth in Q2 after what appears to have been
exaggerated weakness in Q1. More direct input data for
estimating Q2 GDP will be released in the week ahead.
Source: Bureau of Economic Analysis and Bureau of Labor Statistics
Most immediately, we will review our estimate for Q2 real GDP
growth after some key input data are reported in the upcoming
week. Currently, risks appear firmly on the downside relative to
our 3.5% estimate for the annualized pace, although we expect
many forecasters will have to raise their estimate in the weekahead. The consensus appears to be close to 2.0%.
The overall ISM indexes looked consistent with only about a
2.8% annual rate for real GDP growth in Q2, although the 1.9%
annual rate reported for GDP growth in Q1 was much weaker
than suggested by the ISM data—the ISM data looked
consistent with about a 5.0% pace in Q1. The pattern has raised
the potential for some payback in GDP for exaggerated
weakness in Q1.
*Economy-weighted average of manufacturing and non-manufacturing indexes(calculated by Haver Analytics)Note: Shaded bars represent periods of recessionSource: Institute for Supply Management, Haver Analytics, Bureau of EconomicAnalysis, and MF Global
-11.0
-5.5
0.0
5.5
06 07 08 09 10 11 12
Real GDP Index of hours worked
%q/q, saar
Q1
Q2
3 /1 /9 8 3 /1 /9 9 3 /1 /0 0 3 /1 /0 1 3 /1 /0 2 3 /1 /0 3 3 /1 /0 4 3 /1 /0 5 3 /1 /0 6 3 /1 /0 7 3 /1 /0 8 3 /1 /0 9 3 /1 /1 0 3 /1 /1 1 3 /1 /1 2
-8
-4
0
4
8
30
39
48
57
66
98 00 02 04 06 08 10 12
Co mp osite ISM* (l) Real GDP (r)
index, sa %q/q, saar
Jun
Q1
8/6/2019 MfM Jul 8 2011
http://slidepdf.com/reader/full/mfm-jul-8-2011 6/14
Economic Analysis | US
7/8/2011 | MACRO FOR MARKETS
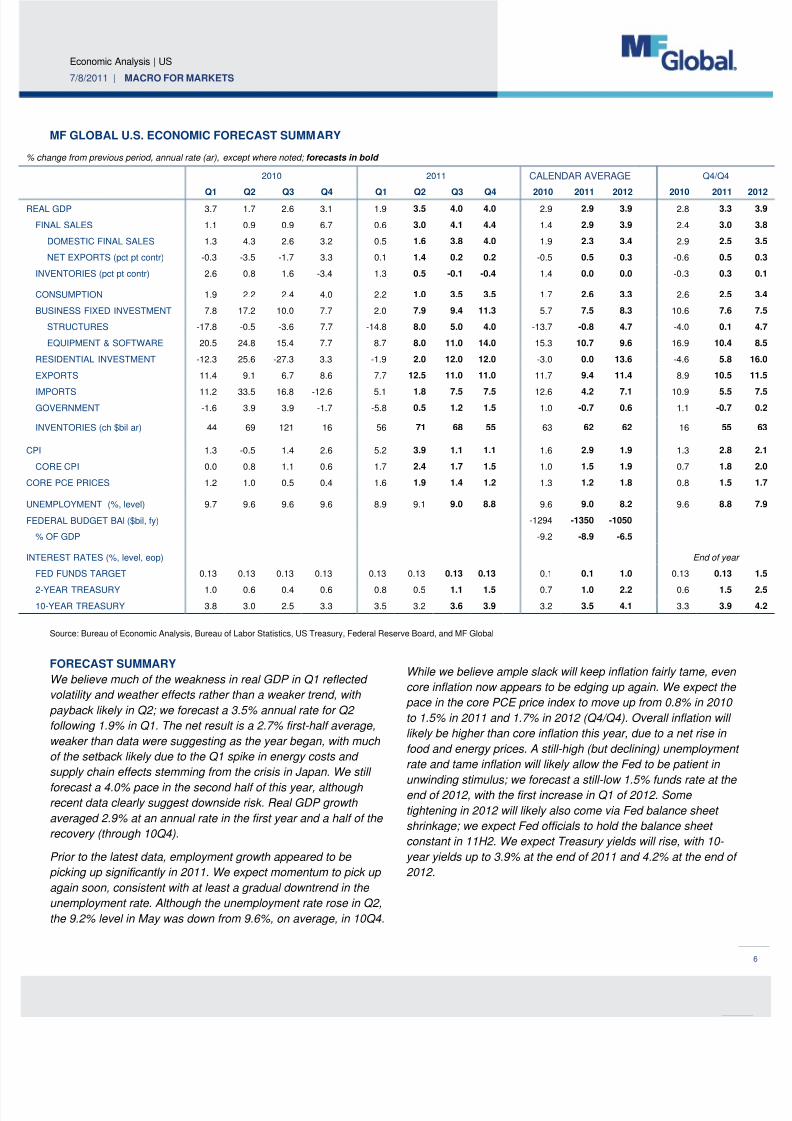
MF GLOBAL U.S. ECONOMIC FORECAST SUMMARY
% change from previous period, annual rate (ar), except where noted; forecasts in bold
2010 2011 CALENDAR AVERAGE Q4/Q4
Q1 Q2 Q3 Q4 Q1 Q2 Q3 Q4 2010 2011 2012 2010 2011 EAL GDP 3.7 1.7 2.6 3.1 1.9 3.5 4.0 4.0 2.9 2.9 3.9 2.8 3.3
FINAL SALES 1.1 0.9 0.9 6.7 0.6 3.0 4.1 4.4 1.4 2.9 3.9 2.4 3.0
DOMESTIC FINAL SALES 1.3 4.3 2.6 3.2 0.5 1.6 3.8 4.0 1.9 2.3 3.4 2.9 2.5
NET EXPORTS (pct pt contr) -0.3 -3.5 -1.7 3.3 0.1 1.4 0.2 0.2 -0.5 0.5 0.3 -0.6 0.5
INVENTORIES (pct pt contr) 2.6 0.8 1.6 -3.4 1.3 0.5 -0.1 -0.4 1.4 0.0 0.0 -0.3 0.3
CONSUMPTION 1.9 2.2 2.4 4.0 2.2 1.0 3.5 3.5 1.7 2.6 3.3 2.6 2.5
BUSINESS FIXED INVESTMENT 7.8 17.2 10.0 7.7 2.0 7.9 9.4 11.3 5.7 7.5 8.3 10.6 7.6
STRUCTURES -17.8 -0.5 -3.6 7.7 -14.8 8.0 5.0 4.0 -13.7 -0.8 4.7 -4.0 0.1
EQUIPMENT & SOFTWARE 20.5 24.8 15.4 7.7 8.7 8.0 11.0 14.0 15.3 10.7 9.6 16.9 10.4
RESIDENTIAL INVESTMENT -12.3 25.6 -27.3 3.3 -1.9 2.0 12.0 12.0 -3.0 0.0 13.6 -4.6 5.8
EXPORTS 11.4 9.1 6.7 8.6 7.7 12.5 11.0 11.0 11.7 9.4 11.4 8.9 10.5
IMPORTS 11.2 33.5 16.8 -12.6 5.1 1.8 7.5 7.5 12.6 4.2 7.1 10.9 5.5
GOVERNMENT -1.6 3.9 3.9 -1.7 -5.8 0.5 1.2 1.5 1.0 -0.7 0.6 1.1 -0.7
INVENTORIES (ch $bil ar) 44 69 121 16 56 71 68 55 63 62 62 16 55
PI 1.3 -0.5 1.4 2.6 5.2 3.9 1.1 1.1 1.6 2.9 1.9 1.3 2.8
CORE CPI 0.0 0.8 1.1 0.6 1.7 2.4 1.7 1.5 1.0 1.5 1.9 0.7 1.8
ORE PCE PRICES 1.2 1.0 0.5 0.4 1.6 1.9 1.4 1.2 1.3 1.2 1.8 0.8 1.5
NEMPLOYMENT (%, level) 9.7 9.6 9.6 9.6 8.9 9.1 9.0 8.8 9.6 9.0 8.2 9.6 8.8
EDERAL BUDGET BAl ($bil, fy) -1294 -1350 -1050
% OF GDP -9.2 -8.9 -6.5
NTEREST RATES (%, level, eop) End of year
FED FUNDS TARGET 0.13 0.13 0.13 0.13 0.13 0.13 0.13 0.13 0.1 0.1 1.0 0.13 0.13
2-YEAR TREASURY 1.0 0.6 0.4 0.6 0.8 0.5 1.1 1.5 0.7 1.0 2.2 0.6 1.5
10-YEAR TREASURY 3.8 3.0 2.5 3.3 3.5 3.2 3.6 3.9 3.2 3.5 4.1 3.3 3.9
Source: Bureau of Economic Analysis, Bureau of Labor Statistics, US Treasury, Federal Reserve Board, and MF Global
FORECAST SUMMARY
We believe much of the weakness in real GDP in Q1 reflected
volatility and weather effects rather than a weaker trend, with
payback likely in Q2; we forecast a 3.5% annual rate for Q2
following 1.9% in Q1. The net result is a 2.7% first-half average,
weaker than data were suggesting as the year began, with much
of the setback likely due to the Q1 spike in energy costs and
supply chain effects stemming from the crisis in Japan. We still
forecast a 4.0% pace in the second half of this year, although recent data clearly suggest downside risk. Real GDP growth
averaged 2.9% at an annual rate in the first year and a half of the
recovery (through 10Q4).
Prior to the latest data, employment growth appeared to be
picking up significantly in 2011. We expect momentum to pick up
again soon, consistent with at least a gradual downtrend in the
unemployment rate. Although the unemployment rate rose in Q2,
the 9.2% level in May was down from 9.6%, on average, in 10Q4.
While we believe ample slack will keep inflation fairly tame, even
core inflation now appears to be edging up again. We expect the
pace in the core PCE price index to move up from 0.8% in 2010
to 1.5% in 2011 and 1.7% in 2012 (Q4/Q4). Overall inflation will
likely be higher than core inflation this year, due to a net rise in
food and energy prices. A still-high (but declining) unemployment
rate and tame inflation will likely allow the Fed to be patient in
unwinding stimulus; we forecast a still-low 1.5% funds rate at the end of 2012, with the first increase in Q1 of 2012. Some
tightening in 2012 will likely also come via Fed balance sheet
shrinkage; we expect Fed officials to hold the balance sheet
constant in 11H2. We expect Treasury yields will rise, with 10-
year yields up to 3.9% at the end of 2011 and 4.2% at the end of
2012.

8/6/2019 MfM Jul 8 2011
http://slidepdf.com/reader/full/mfm-jul-8-2011 7/14
Economic Analysis | US
7/8/2011 | MACRO FOR MARKETS
DATA PREVIEW
CONFERENCE BOARD CEO CONFIDENCE SURVEY
(MON, JUL 11, 13:00) index 10Q3 10Q4 11Q1 11Q2
CEO CONFIDENCE INDEX 50 62 67
CURRENT ECONOMIC CONDITIONS
VS. 6 MONTHS AGO50 62 72
EXPECTATIONS FOR ECONOMY, 6
MONTHS AHEAD49 62 68
EXPECTATIONS FOR OWN
INDUSTRY, 6 MONTHS AHEAD51 61 62
CURRENT ECONOMIC CONDITIONS IN
OWN INDUSTRY VS. 6 MONTHS AGO52 60 65
Source: The Conference Board
The Conference Board’s CEO confidence index, which mainlytracks large businesses, probably slipped to a still-high level in
Q2, consistent with the pattern already reported in the Business
Roundtable survey. The Q1 reading was the highest since Q2 of
2004. In general business confidence has recovered much more
than consumer confidence—at least for large firms.
Business confidence has likely held up better than consumer
confidence in recent months—at least for large businesses. The
Q2 Conference Board CEO index will be reported on July 11.
Source: The Conference Board
NFIB SMALL BUSINESS SURVEY (TUE, JUL 12, 07:30)
sa MAR APR MAY JUN
OPTIMISM INDEX 91.9 91.2 90.9
HIRING PLANS (net %) 2 2 -1 3
CREDIT HARDER TO GET (net %) 8 9 10
Source: National Federation of Independent Business (NFIB)
The NFIB small business optimism index was historically low
even before the declines in the last few months. It probably
started to recover in June. A rise in the hiring plans component
has already been reported.
GDP has consistently shown less weakness than implied by the
NFIB index since the recovery began (see chart below). In part,
the divergence likely reflects larger credit crunch effects for small
businesses than large businesses, although we believe the NFIB
index has also overstated weakness in the small business sector
recently.
The relationship between GDP growth and the NFIB index has
broken down in the current cycle, with much less weakness in
growth than implied by the index.
Note: Shaded bars represent periods of recession.Source: National Federation of Independent Business (NFIB), Bureau of Economic
Analysis, and MF Global
WEEKLY STORE SALES (TUE, JUL 12, 07:45/08:55)
JUN 18 JUN 25 JUL 2 JUL
WEEKLY ICSC, %w/w, sa -0.7 2.9 1.5
WEEKLY ICSC, %y/y 2.2 3.0 3.5
REDBOOK, %y/y 4.2 2.5 5.2
APR MAY JUNJU
THRU
WEEKLY ICSC, %m/m, sa 2.5 -2.3 0.1
REDBOOK, %m/m, sa 1.3 -2.7 0.9
MONTHLY ICSC, %m/m, sa 0.3 -2.6 1.8
WEEKLY ICSC, %y/y 3.0 3.0 2.7
REDBOOK, %y/y 5.1 3.9 3.8
MONTHLY ICSC, %y/y 8.5 5.4 6.9
Note: monthly data are based on the retail industry's fiscal calendar, the fiscal monthof July ends on July 30.Source: International Council of Shopping Centers, Instinet, and MF Global
-10
-5
0
5
10
74
84
94
104
114
80 83 86 89 92 95 98 01 04 07 10 13
NFIB index (l) Real GDP (r)
ind ex, sa
Q1
May
%q/q, saar
20
36
52
68
84
100
116
22
31
40
49
58
67
76
02 03 04 05 06 07 08 09 10 11 12
Con ference Board: CEO confidence (l)Con ference Board: consumer expectations (r)
index, monthlyind ex, quarterly
Jun
Q1

8/6/2019 MfM Jul 8 2011
http://slidepdf.com/reader/full/mfm-jul-8-2011 8/14
Economic Analysis | US
7/8/2011 | MACRO FOR MARKETS
The comprehensive monthly ICSC store sales index showed
much more strength than the narrower weekly index in June,
although even the weekly index picked up sharply at the end of
the month. The Redbook index also showed strength in June.
FOREIGN TRADE (TUE, JUL 12, 08:30)
MAY EST
billions of dollars, sa FEB MAR APR CONS MF
BALANCE -46.0 -46.8 -43.7 -44.1 -44.5
NONPETROLEUM -20.8 -16.6 -17.6
GOODS -59.7 -61.1 -58.1
SERVICES 13.7 14.3 14.4
EXPORTS 165.2 173.4 175.6
IMPORTS 211.3 220.2 219.2
PETROLEUM 32.9 38.1 36.0
NONPETROLEUM 178.4 182.1 183.2
REAL GOODS BAL. ($2005) -49.9 -49.7 -44.2
EXPORTS 96.6 101.0 101.7
IMPORTS 146.5 150.6 146.0
Source: Census Bureau, Bloomberg, and MF Global
Most of the sharp decline in the inflation-adjusted (real) trade
deficit in April was probably sustained in May, consistent with net
exports adding more than a percentage point to annualized real
GDP growth in Q2. The contribution reflects strength in exports
and weakness in imports, with the weakness in imports
concentrated in motor vehicles from Japan and oil (in real terms).
JOB OPENINGS AND LABOR TURNOVER (JOLTS) (TUE, JUL 12, 10:00)
sa FEB MAR APR MAY
JOB OPENINGS RATE (%) 2.3 2.3 2.2
HIRES RATE (%) 3.1 3.1 3.0
SEPARATIONS RATE (%) 2.9 2.9 2.9
JOB OPENINGS (000s) 3025 3123 2972
HIRES (000s) 3986 4067 3972
SEPARATIONS (000s) 3825 3805 3743
MEMO: NET JOB CREATION (000s)
JOLTS (HIRES-SEPARATIONS) 161 262 229
PAYROLLS (000s) 235 194 217 25
Source: Bureau of Labor Statistics
Job openings probably picked up again in June after dropping in
May.
IBD/TIPP ECONOMIC OPTIMISM (TUE, JUL 12, 10:00)
APR MAY JUN JUL
TOTAL INDEX 40.8 42.8 44.6
Source: Investor's Business Daily/TechnoMetrica Institute of Policy and Politics
At 44.6, the June reading for the IBD/TIPP index was up from
42.8 in May but down from 48.6, on average, in Q1. Meanwhile,
the Rasmussen index is on track for a decline in July, with data
available through July 8.
MORTGAGE APPLICATIONS (WED, JUL 13, 07:00)
MBA indexes PURCHASE
INDEXREFI INDEX 30-YEAR
MORTGAGERATE %WKLY
4-WKAVG
WKLY 4-WK AVG
JUN 10 191.1 189.2 2883.7 2598.5 4.51
JUN 17 185.8 187.8 2675.2 2619.4 4.57
JUN 24 180.3 185.0 2604.4 2659.8 4.46
JUL 1 188.9 186.5 2363.6 2631.7 4.69
JUL 8
Source: Mortgage Bankers' Association
The purchase index continues to show little net change,
consistent with a near-flat trend in home sales. It averaged 189.4
in Q2 following 186.4 in Q1.
IMPORT & EXPORT PRICES (WED, JUL 13, 08:30)
JUN ESTnsa MAR APR MAY CONS MF
IMPORT PRICES (%m/m) 3.0 2.1 0.2 -0.6 -0.8
NONOIL 0.5 0.6 0.4
NONFUEL 0.8 0.6 0.4
NONAUTO CONSUMER GOODS -0.2 0.5 0.3
MOTOR VEHICLES 0.5 0.2 0.5
EXPORT PRICES (%m/m) 1.5 0.9 0.2
IMPORT PRICES (%y/y) 10.3 11.4 12.5 13.2 12.9
NONOIL 4.3 4.4 4.5
NONFUEL 4.4 4.4 4.4NONAUTO CONSUMER GOODS 0.2 0.7 0.9
MOTOR VEHICLES 1.9 1.8 2.3
EXPORT PRICES (%y/y) 9.5 9.3 9.0
Source: Bureau of Labor Statistics, Bloomberg, and MF Global
Some of the recent commodity-led surge in import prices was
probably reversed in June.

8/6/2019 MfM Jul 8 2011
http://slidepdf.com/reader/full/mfm-jul-8-2011 9/14
Economic Analysis | US
7/8/2011 | MACRO FOR MARKETS
Nonauto consumer goods import prices show a net pickup in
recent months, consistent with dollar depreciation, although they
are still up just 0.9% y/y. The recent pickup has been led by
imports from China (see charts).
At 0.9%, the y/y change in nonauto consumer goods import prices
in May was up from -0.2% y/y six months earlier, likely accounting
for some of the recent acceleration in the core goods CPI.
Source: Federal Reserve Board and Bureau of Labor Statistics
Prices for goods from China were up 2.8% y/y in May, up from
0.7% y/y six months earlier. Prices have risen at a 4.6% annual
rate in the last six months.
Source: Federal Reserve Board and Bureau of Labor Statistics
FEDERAL BUDGET (WED, JUL 13, 14:00)
JUN EST
billions of dollars, nsa MAR APR MAY CONS MF
MONTHLY BALANCE -188.2 -40.4 -57.6 x -45.0
YEAR-AGO LEVEL -65.4 -82.7 -135.9 -68.4 -68.4 FY-TO-DATE BALANCE* -829.4 -869.8 -927.4 -972.4
YEAR-AGO LEVEL -717.0 -799.7 -935.6 -1004.0 -1004.0 *Fiscal year starts in October.Source: US Treasury, Congressional Budget Office, Bloomberg, and MF Global
The June budget report will provide some important input data fo
adding up Q2 GDP; weakness in defense spending looked
exaggerated in Q1.
RETAIL SALES (THU, JUL 14, 08:30)
JUN EST
sa MAR APR MAY CONS MF
TOTAL (%m/m) 0.8 0.3 -0.2 x -0.2
EX AUTOS 1.2 0.5 0.3 x -0.1
EX AUTOS & GAS 0.8 0.3 0.3 x 0.5
EX AUT, BLDG MATS, & GAS 0.6 0.3 0.2 0.5
MOTOR VEHICLES & PARTS -1.4 -0.7 -2.9 -0.6
FURNITURE & FURNISHINGS 2.7 -1.2 -0.7
ELECTRONICS AND APPLIANCES 2.7 -1.2 -1.3
BLDG MATS, GARDEN EQUIP 3.0 0.5 1.2 0.5
FOOD & BEVERAGE 0.3 1.2 -0.5HEALTH & PERSONAL CARE 0.6 -1.0 0.8
GASOLINE STATIONS 3.8 1.4 0.3 -3.5
CLOTHING & ACCESSORY 1.0 0.1 0.2
SPORT, HOBBY, BOOKS, MUSIC 0.7 -0.3 -0.4
GENERAL MERCHANDISE 0.4 0.6 -0.1
MISCELLANEOUS -2.0 2.0 2.1
NONSTORE RETAILERS 0.4 1.3 1.2
FOOD & DRINKING PLACES 1.1 -0.8 0.6
TOTAL (%y/y) 7.5 7.3 7.7 7.9
EX AUTOS 6.9 6.8 8.2 8.
EX AUTOS & GAS 5.3 4.9 6.2 6.3
EX AUT, BLDG MATS, & GAS 5.3 5.7 6.1 6.2
Source: Bureau of the Census, Bloomberg, and MF Global
Retail sales likely fell again in June, dragged down by a decline in
auto sales and price-related weakness in the gasoline
component. (The data are nominal.) Excluding autos and gas,
sales probably picked up.
We estimate our June forecast is consistent with total real
consumption increasing by less than 1% at an annual rate in Q2,
a slowing from the 2.2% pace in Q1. We expect growth to re-
accelerate in Q3, helped by the boost to real spending power
from declining gasoline prices.
-12
-7
-2
3
8
13
18-8
-6
-4
-2
0
2
4
07 08 09 10 11
Non auto consumer goods import price (l)Core goods CPI (l)Real broad dollar index (r)
%y/y %y/y, in verted
May
Jun
-4
-2
0
2
4
6
8-10
-8
-6
-4
-2
0
2
05 06 07 08 09 10 11 12
Yuan/U.S. dol lar (l )
Prices fo r U.S. goods imports from China (r)
Jul 8
% y/y, both scales
May

8/6/2019 MfM Jul 8 2011
http://slidepdf.com/reader/full/mfm-jul-8-2011 10/14

8/6/2019 MfM Jul 8 2011
http://slidepdf.com/reader/full/mfm-jul-8-2011 11/14
Economic Analysis | US
7/8/2011 | MACRO FOR MARKETS
Our estimate implies a slight slowing in total inventories from the
1.0% per month pace averaged in Q1. However, the deceleration
has likely been more than accounted for by a slowing in price
gains, particularly for commodities. (The data are nominal.) In real
terms, inventories appear to have picked up in Q2.
FED BALANCE SHEET (THU, JUL 14, 16:30)
billions of dollars unless noted, nsa JUN 22 JUN 29 JUL 6 JUL 13
TOTAL FED ASSETS 2860 2869 2874
%y/y 21.8 22.9 23.1
SECURITIES HELD OUTRIGHT 2635 2643 2648
US TREASURIES 1602 1617 1625
FEDERAL AGENCY 118 117 115
MORTGAGE-BACKED 914 909 909
OTHER LOANS 13 13 13
PRIMARY CREDIT 0 0 0
TALF 13 13 12
MAIDEN LANE LLC (I*, II**, &
III***)61 61 60
CENTRAL BANK LIQ’Y SWAPS 0 0 0
OTHER ASSETS 152 153 153
MONETARY BASE (2-wk avg) 2629 2629
% y/y 31.9 31.9
* Bear Stearns assets. ** AIG CDO assets. *** RMBS assets.Source: Federal Reserve Board
Fed officials have been assuming that every $200 billion increasein total Fed assets provides stimulus equivalent to 25 bps on the
funds rate. Based on that arithmetic, the $2 trillion increase since
2008 has provided stimulus equivalent to around 250 bps on the
funds rate. (See our Taylor Rule analysis in the June 24, 2011
issue.)
MONETARY AGGREGATES (THU, JUL 14, 16:30)
JUN 13 JUN 20 JUN 27 JUL 4
M1 (billions of $, saar) 1936 1946 1955
%ch from 13 weeks ago, saar 15.6 11.9 11.2
%y/y 12.8 12.4 12.3
M2 (billions of $, saar) 9038 9068 9144
%ch from 13 weeks ago, saar 6.5 7.8 11.6
%y/y 5.4 5.4 6.0
Source: Federal Reserve Board
At 6.0%, the y/y change in M2 is up from 4.3% in Q1 and 2.3% in
all of 2010.
N.Y. FED MANUFACTURING SURVEY (FRI, JUL 15, 08:30) JUL EST
indexes, sa APR MAY JUN CONS MF
CURRENT ACTIVITY 21.7 11.9 -7.8 x 7.0
NEW ORDERS 22.3 17.2 -3.6
EMPLOYMENT 23.1 24.7 10.2
PRICES PAID 57.7 69.9 56.1
PRICES RECEIVED 26.9 28.0 11.2
6-MONTH OUTLOOK 47.4 52.7 22.5
6-MONTH CAPEX PLANS 29.5 30.1 26.5
Source: Federal Reserve Bank of New York, Bloomberg, and MF Global
The national ISM index showed improvement in June, in contrast
to the sharp weakening in the New York Fed survey. To some
extent, the contrast may have reflected momentum turning from
negative to positive during the month—since the cutoff point
came later in the ISM sample than the NY Fed sample. We
expect the NY survey will start showing improvement in July.
CONSUMER PRICE INDEX (FRI, JUL 15, 08:30)
JUN EST
%m/m, sa, unless noted MAR APR MAY CONS M
TOTAL CPI 0.5 0.4 0.2 -0.1 -0.
FOOD 0.8 0.4 0.4 0.
ENERGY 3.5 2.2 -1.0 -4.
CORE 0.1 0.2 0.3 0.2 0.
CORE (before rounding) 0.135 0.185 0.287
COMPONENTS(% of core)
SHELTER (41.6%) 0.1 0.1 0.2
RESID’L RENT (7.7%) 0.1 0.1 0.1
OER (32.4%) 0.1 0.1 0.1
LODGING (1.0%) 0.8 0.0 2.9
FURNISH/OPS (5.9%) -0.1 0.2 0.2
APPAREL (4.8%) -0.5 0.2 1.2
NEW VEHICLES (5.6%) 0.7 0.7 1.1
USED VEHICLES (2.6%) 0.8 1.2 1.1
AIRFARES (1.0%) 1.9 0.3 -1.3
MEDICAL CARE (8.4%) 0.2 0.4 0.2
RECREATION (8.3%) 0.0 0.0 0.3
EDUC, COMMUN (8.3%) 0.1 0.1 0.1OTHER (4.5%) -0.1 0.1 -0.2
TOTAL CPI (%y/y, nsa) 2.7 3.2 3.6 3.6 3.
CORE 1.2 1.3 1.5 1.6 1.
GOODS 0.2 0.7 1.2
SERVICES 1.6 1.6 1.6
TOTAL CPI (index, nsa) 223.467 224.906 225.964 224
%m/m 1.0 0.6 0.5 -0.
Source: Bureau of Labor Statistics, Bloomberg, and MF Global

8/6/2019 MfM Jul 8 2011
http://slidepdf.com/reader/full/mfm-jul-8-2011 12/14
Economic Analysis | US
7/8/2011 | MACRO FOR MARKETS
The total CPI probably fell in June, led by a sharp drop in gasoline
prices. Core prices probably continued to show a net pickup,
albeit not to the degree implied by last month’s 0.3% m/m rise.
That 0.3% increase boosted the year-to-date pace in core prices
to 2.4% at an annual rate from 2.1% through May; the core CPIrose just 0.8% in 2010 (December to December). Moreover, the
pickup has been fairly broad-based (see table).
The recent weakening in commodity prices will likely contribute to
some slowing in core prices in coming months, to the extent the
recent acceleration in core prices may have reflected some “pass-
through” effects. Both new and used vehicles prices are also
likely to slow, with the sharp pickup recently probably
exaggerated by inventory shortages related to Japan supply-
chain effects. Conversely, the trend in import prices suggests
further acceleration in the apparel component (see chart), while
rents are likely to continue accelerating if the labor market
continues to show net improvement, as we expect.
The overall CPI was up 3.6% y/y in May, a pickup from 1.5% y/y
in December. It has risen at a 5.1% annual rate so far this year
(May vs. December). The recent decline in oil prices is likely to
lead to a reversal of some of that pickup in coming months—
starting with the upcoming report for June.
The core CPI has also accelerated this year, to 1.5% y/y in May
from 0.8% y/y in December.
Source: Bureau of Labor Statistics
The core CPI shows a 2.4% annual rate so far this year (May vs.
December), up from 0.8% in 2010 (December to December).The
pickup has been fairly broad-based, although two categories have
been especially important contributors: shelter (mainly rents) and
vehicles.
% ch, annual rate,unless noted
2010*2011THRUMAY**
ACCEL/DECEL.(2011 vs.
2010,pct pcts)
CONTRIBUTTO
ACCEL/DECEpct pts.)
CORE CPI 0.8 2.4 1.6 1.
SHELTER (41.6%) 0.4 1.3 0.9 0.
RESID’L RENT (7.7%) 0.8 1.5 0.7 0.
OER (32.4%) 0.3 1.1 0.9 0.
LODGING (1.0%) 2.5 6.3 3.8 0.
FURNISH/OPS (5.9%) -2.5 1.1 3.6 0.
APPAREL (4.8%) -1.1 2.3 3.4 0.
NEW VEHICLES (5.6%) -0.2 8.4 8.6 0.
USED VEHICLES (2.6%) 3.7 7.2 3.5 0.
AIRFARES (1.0%) 5.8 13.1 7.3 0.
MEDICAL CARE (8.4%) 3.3 3.2 -0.1 0.
RECREATION (8.3%) -0.8 1.7 2.4 0.
EDUC, COMMUN (8.3%) 1.3 1.6 0.3 0.
OTHER (4.5%) 1.9 0.2 -1.7 -0.
*December 2010 vs. December 2009 (nsa)**May 2011 vs. December 2010 (sa)Source: Bureau of Labor Statistics and MF Global
A pickup in apparel prices in the CPI looks consistent with the
pattern in import prices. Indeed, apparel import prices are
signaling further acceleration.
Source: Bureau of Labor Statistics
-3
0
3
6
05 06 07 08 09 10 11
Total CPI Core CPI
%y/y, nsa
May
-2
0
2
4
6
8
07 08 09 10 11CPI: apparel
Import p rices: apparel & accessories, manufactured goods
% y/y, nsa
May
8/6/2019 MfM Jul 8 2011
http://slidepdf.com/reader/full/mfm-jul-8-2011 13/14
Economic Analysis | US
7/8/2011 | MACRO FOR MARKETS
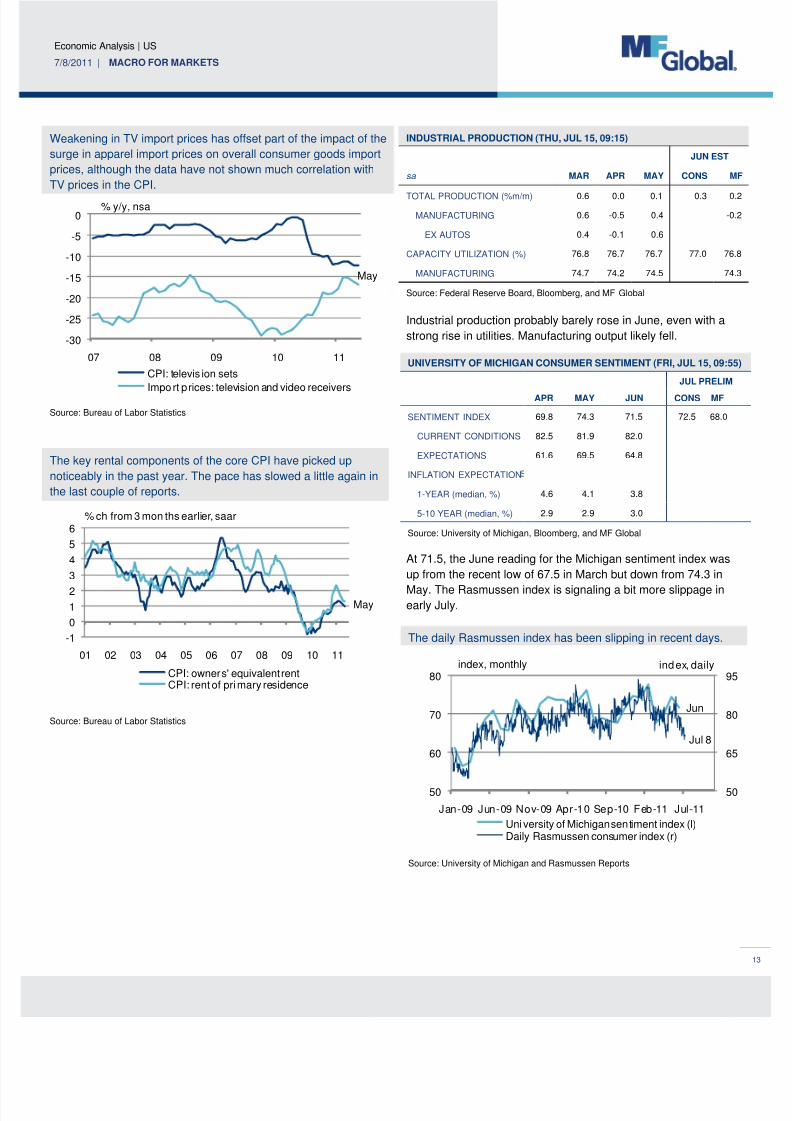
Weakening in TV import prices has offset part of the impact of the
surge in apparel import prices on overall consumer goods import
prices, although the data have not shown much correlation with
TV prices in the CPI.
Source: Bureau of Labor Statistics
The key rental components of the core CPI have picked up
noticeably in the past year. The pace has slowed a little again in
the last couple of reports.
Source: Bureau of Labor Statistics
INDUSTRIAL PRODUCTION (THU, JUL 15, 09:15) JUN EST
sa MAR APR MAY CONS MF
TOTAL PRODUCTION (%m/m) 0.6 0.0 0.1 0.3 0.2
MANUFACTURING 0.6 -0.5 0.4 -0.2
EX AUTOS 0.4 -0.1 0.6
CAPACITY UTILIZATION (%) 76.8 76.7 76.7 77.0 76.8
MANUFACTURING 74.7 74.2 74.5 74.3
Source: Federal Reserve Board, Bloomberg, and MF Global
Industrial production probably barely rose in June, even with a
strong rise in utilities. Manufacturing output likely fell.
UNIVERSITY OF MICHIGAN CONSUMER SENTIMENT (FRI, JUL 15, 09:55)
JUL PRELIM
APR MAY JUN CONS MF
SENTIMENT INDEX 69.8 74.3 71.5 72.5 68.0
CURRENT CONDITIONS 82.5 81.9 82.0
EXPECTATIONS 61.6 69.5 64.8
INFLATION EXPECTATION
1-YEAR (median, %) 4.6 4.1 3.8
5-10 YEAR (median, %) 2.9 2.9 3.0
Source: University of Michigan, Bloomberg, and MF Global
At 71.5, the June reading for the Michigan sentiment index was
up from the recent low of 67.5 in March but down from 74.3 in
May. The Rasmussen index is signaling a bit more slippage inearly July.
The daily Rasmussen index has been slipping in recent days.
Source: University of Michigan and Rasmussen Reports
-30
-25
-20
-15
-10
-5
0
07 08 09 10 11
CPI: televis ion sets
Import prices: television and video receivers
% y/y, nsa
May
-1
0
1
2
3
4
5
6
01 02 03 04 05 06 07 08 09 10 11
CPI: owners' equivalent rentCPI: rent of primary residence
% ch from 3 mon ths earlier, saar
May
50
65
80
95
50
60
70
80
Jan-09 Jun-09 Nov-09 Apr-10 Sep-10 Feb-11 Jul-11
Uni versity of Michigan sentiment index (l)Daily Rasmussen consumer index (r)
index, monthly index, daily
Jul 8
Jun
8/6/2019 MfM Jul 8 2011
http://slidepdf.com/reader/full/mfm-jul-8-2011 14/14