Embed Size (px)
Citation preview
HOPE CONSULT ING
NOV 2011
H O P E C O N S U LT I N G
2011
MONEY FOR GOOD II DRIVING DOLLARS TO THE HIGHEST-
PERFORMING NONPROFITS
Summary Report
HOPE CONSULT ING
NOV 2011
Contents
1
1. Project Overview | Origins, Objectives, Structure
2. Findings from MFG1 | Donor Interest and Research Behavior
3. Findings from MFG2 | Motivations, Desires, and Opportunities
4. Implications and Next Steps | Where We Go From Here
HOPE CONSULT ING
NOV 2011
The Motivation for the Money for Good Research
2
1. Money for Good also looked at impact investing, though it is not relevant for this discussion. 2. “The Nonprofit Marketplace: Bridging the Information Gap in Philanthropy”, The Hewlett Foundation and McKinsey & Company, 2008
It is our nature to see the world based on our own context, experiences, and points of view. People in all walks of life struggle with this bias every day. How can a new product fail when you and your cohort believed that it was a great idea? The need to understand the world as it is – not as we wish it were – has caused primary market research to become a multi-billion dollar industry.
The motivation behind the original Money for Good project (MFG1) was to seek the ‘voice of the customer’ for charitable giving.1 This perspective has been lacking in the sector to date. As the Hewlett Foundation and McKinsey & Co. noted in their report “The Nonprofit Marketplace,” there is a need to “invest in research that clarifies donors’ motivations, needs, and decision-making criteria.”2
Hope Consulting conducted the original MFG1 research in early 2010, which included a comprehensive study of donor behavior, motivations, and preferences for charitable giving. Money for Good II (MFG2) began in late 2010 in order to build on the initial fact-base, further our understanding of charitable giving, and look at ways in which we could influence giving behaviors.
HOPE CONSULT ING
NOV 2011
The Objectives of Money for Good II
3
In MFG1 we found that donors say that how well a nonprofit performs is important, but few actively try to fund the highest performing nonprofits • 9 out of 10 donors say that nonprofit performance is important
• But only 3 out of 100 research to find the “most effective” nonprofit
Money for Good II (MFG2) came about to dive further into those findings, and to expand the scope to include those who advise donors and foundation grant-makers. The specific objectives for MFG2: • Determine how Individuals, Foundations, Advisors research nonprofits
• Quantify the interest within each user group to fund HPNPs
• Determine what type of information, packaging, and channel are of greatest interest to each user group, and will drive giving to HPNPs
• Define how organizations throughout the sector can use this information
HOPE CONSULT ING
NOV 2011
Project Structure
4
MFG2 has been led by GuideStar and Hope Consulting, with generous support from The Bill and Melinda Gates Foundation, The William and Flora Hewlett Foundation, and Liquidnet
The project has also benefited from the input and guidance of its advisory council, which included: • Katya Andresen, Network for Good
• Laura McKnight, Greater Kansas City Community Foundation
• Katherina Rosqueta, Center for High Impact Philanthropy, University of PA
• Cynthia Strauss, Fidelity Charitable Gift Fund
• Kim Wright-Violich, Schwab Charitable
HOPE CONSULT ING
NOV 2011
How We Are Going About It
5
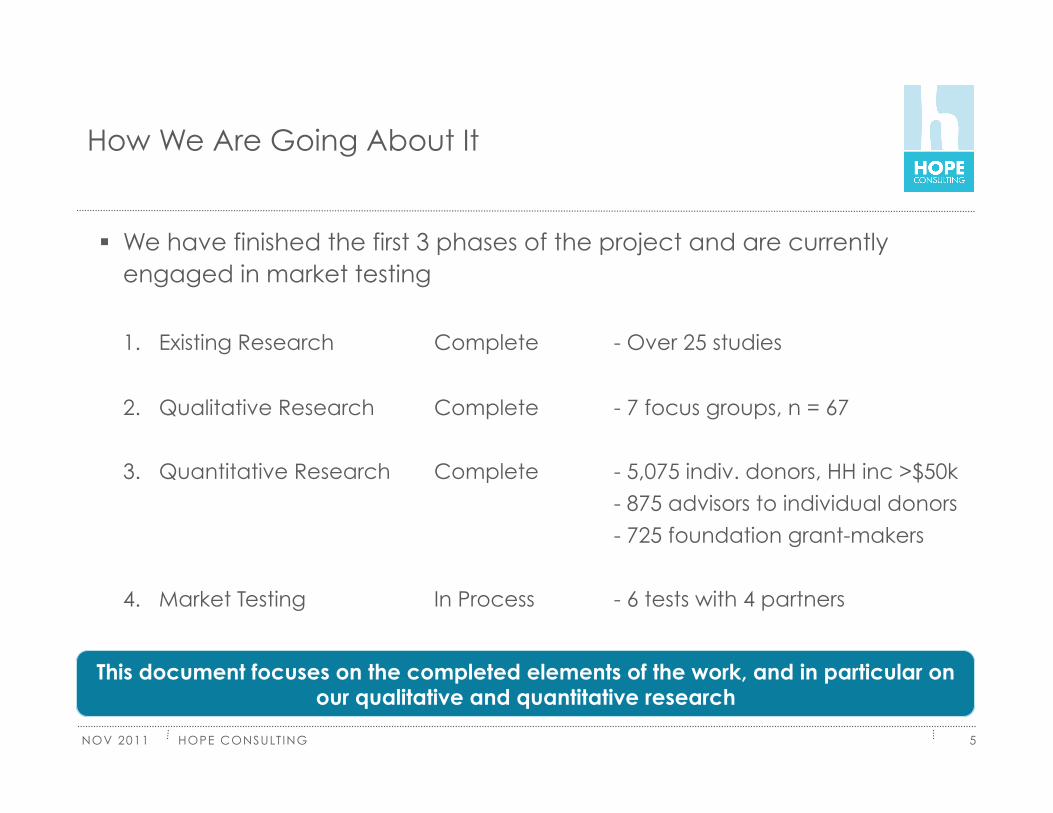
We have finished the first 3 phases of the project and are currently engaged in market testing
1. Existing Research Complete - Over 25 studies
2. Qualitative Research Complete - 7 focus groups, n = 67
3. Quantitative Research Complete - 5,075 indiv. donors, HH inc >$50k
- 875 advisors to individual donors
- 725 foundation grant-makers
4. Market Testing In Process - 6 tests with 4 partners
This document focuses on the completed elements of the work, and in particular on our qualitative and quantitative research
HOPE CONSULT ING
NOV 2011
Contents
6
1. Project Overview | Origins, Objectives, Structure
2. Findings from MFG1 | Donor Interest and Research Behavior
3. Findings from MFG2 | Motivations, Desires, and Opportunities
4. Implications and Next Steps | Where We Go From Here
HOPE CONSULT ING
NOV 2011
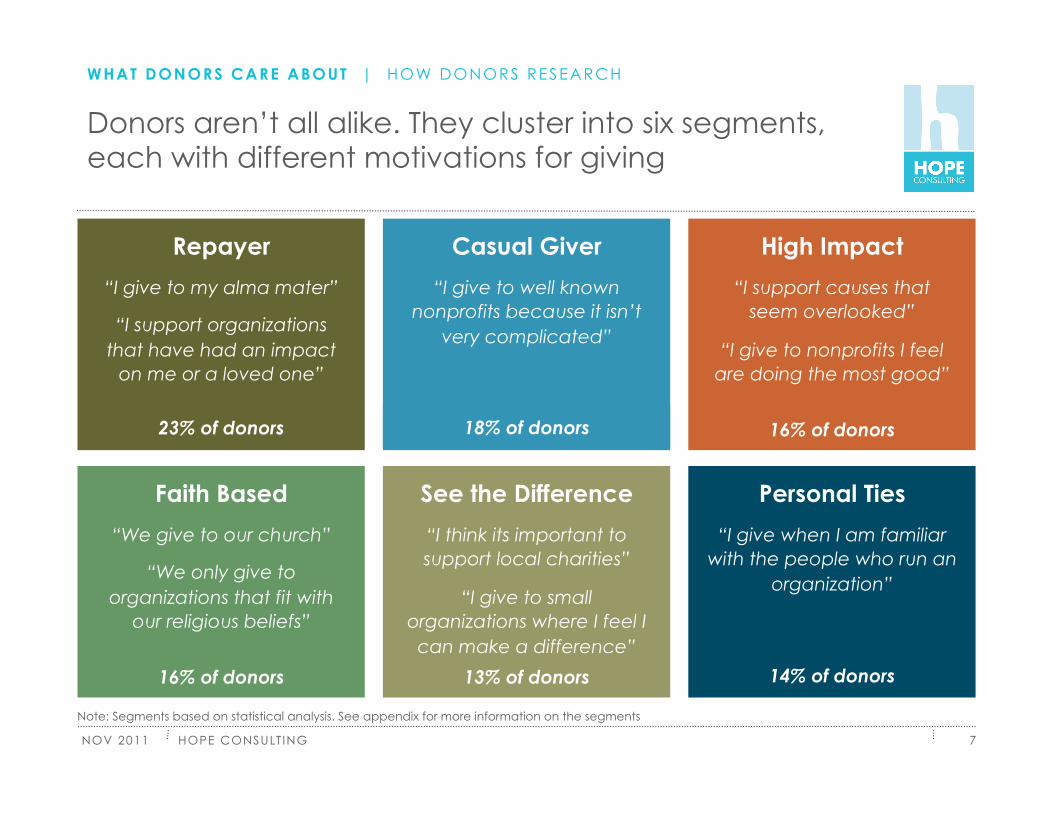
Donors aren’t all alike. They cluster into six segments, each with different motivations for giving
7
Note: Segments based on statistical analysis. See appendix for more information on the segments
WHAT DONORS CARE ABOUT | HOW DONORS RESEARCH
Casual Giver
“I give to well known nonprofits because it isn’t
very complicated”
18% of donors
Repayer
“I give to my alma mater”
“I support organizations that have had an impact
on me or a loved one”
23% of donors
High Impact
“I support causes that seem overlooked”
“I give to nonprofits I feel are doing the most good”
16% of donors
Faith Based
“We give to our church”
“We only give to organizations that fit with
our religious beliefs”
16% of donors
See the Difference
“I think its important to support local charities”
“I give to small organizations where I feel I can make a difference”
13% of donors
Personal Ties
“I give when I am familiar with the people who run an
organization”
14% of donors
HOPE CONSULT ING
NOV 2011 8
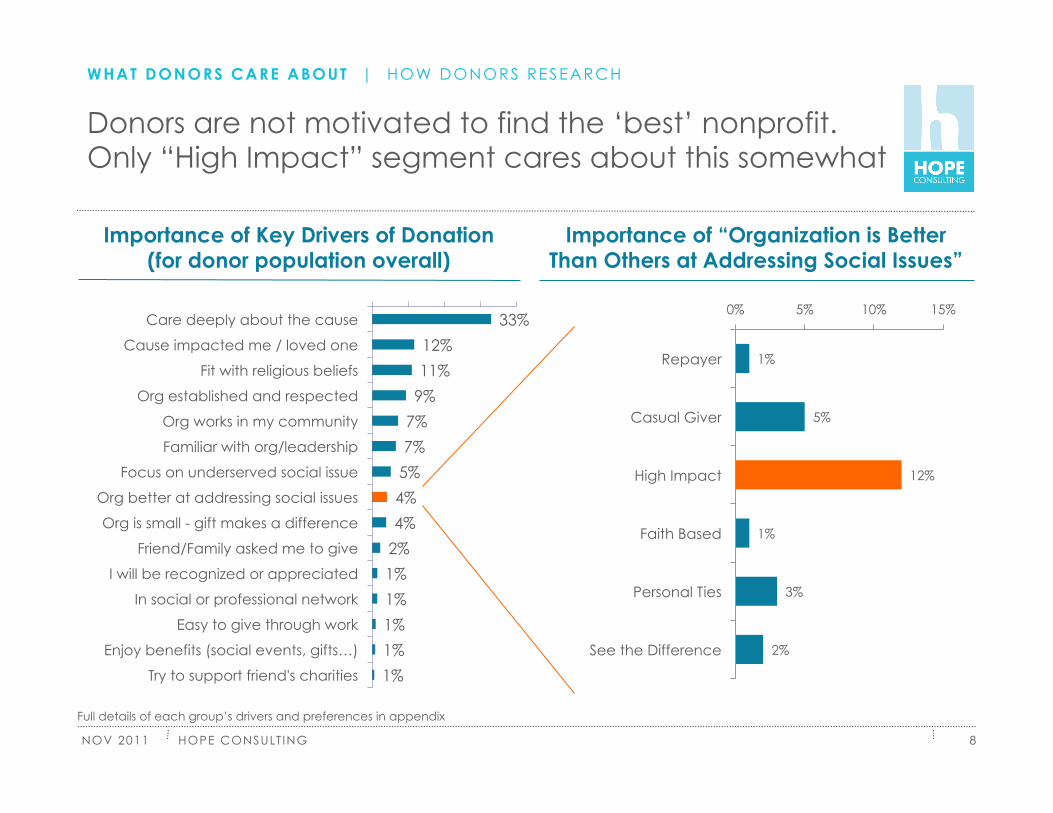
Donors are not motivated to find the ‘best’ nonprofit. Only “High Impact” segment cares about this somewhat
33%
12%
11%
9%
7%
7%
5%
4%
4%
2%
1%
1%
1%
1%
1%
Care deeply about the cause
Cause impacted me / loved one
Fit with religious beliefs
Org established and respected
Org works in my community
Familiar with org/leadership
Focus on underserved social issue
Org better at addressing social issues
Org is small - gift makes a difference
Friend/Family asked me to give
I will be recognized or appreciated
In social or professional network
Easy to give through work
Enjoy benefits (social events, gifts…)
Try to support friend's charities
Importance of Key Drivers of Donation (for donor population overall)
Importance of “Organization is Better Than Others at Addressing Social Issues”
1%
5%
12%
1%
3%
2%
0% 5% 10% 15%
Repayer
Casual Giver
High Impact
Faith Based
Personal Ties
See the Difference
WHAT DONORS CARE ABOUT | HOW DONORS RESEARCH
Full details of each group’s drivers and preferences in appendix
HOPE CONSULT ING
NOV 2011
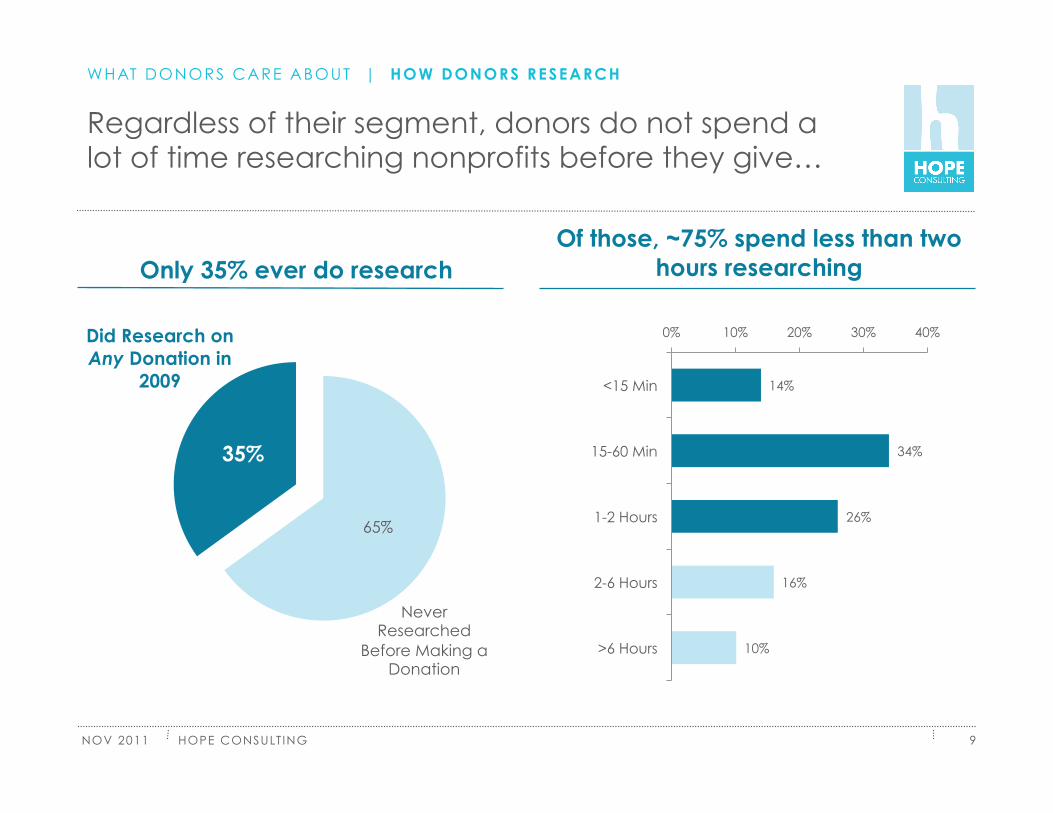
Regardless of their segment, donors do not spend a lot of time researching nonprofits before they give…
9
14%
34%
26%
16%
10%
0% 10% 20% 30% 40%
<15 Min
15-60 Min
1-2 Hours
2-6 Hours
>6 Hours
Never Researched
Before Making a Donation
Did Research on Any Donation in
2009
35%
65%
Only 35% ever do research Of those, ~75% spend less than two
hours researching
WHAT DONORS CARE ABOUT | HOW DONORS RESEARCH
HOPE CONSULT ING
NOV 2011 10
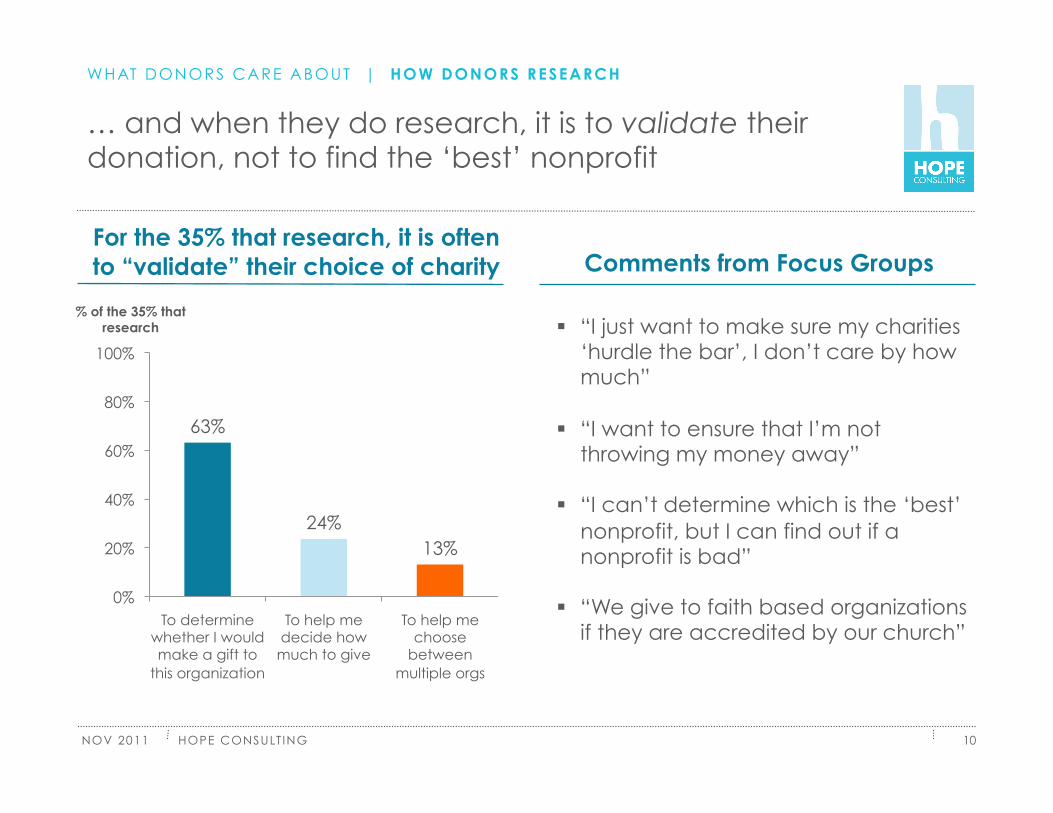
… and when they do research, it is to validate their donation, not to find the ‘best’ nonprofit
For the 35% that research, it is often to “validate” their choice of charity
63%
24% 13%
0%
20%
40%
60%
80%
100%
To determine whether I would make a gift to
this organization
To help me decide how much to give
To help me choose
between multiple orgs
% of the 35% that research “I just want to make sure my charities
‘hurdle the bar’, I don’t care by how much”
“I want to ensure that I’m not throwing my money away”
“I can’t determine which is the ‘best’ nonprofit, but I can find out if a nonprofit is bad”
“We give to faith based organizations if they are accredited by our church”
Comments from Focus Groups
WHAT DONORS CARE ABOUT | HOW DONORS RESEARCH

HOPE CONSULT ING
NOV 2011
Where MFG1 left us
11
MFG1 led to some valuable insights: • There are different segments of donors that are driven by different interests
• In general, donors are not motivated by maximizing social impact
• Few donors (~1/3) ever research a charity before donating
• When they do research it is to validate the organization is acceptable, not to try to find the “best nonprofit” to which they could give
But it did not address the following (which led to MFG2): • What do those who research want in terms of information about nonprofits
• How can we motivate donors to become more informed about their donations
• How do others (foundations, advisors) behave, and what can motivate them
• Full presentation at: http://www.hopeconsulting.us/money-for-good/
• Contact Greg Ulrich at [email protected] For More on MFG1:
HOPE CONSULT ING
NOV 2011
Contents
12
1. Project Overview | Origins, Objectives, Structure
2. Findings from MFG1 | Donor Interest and Research Behavior
3. Findings from MFG2 | Motivations, Desires, and Opportunities
4. Implications and Next Steps | Where We Go From Here
HOPE CONSULT ING
NOV 2011
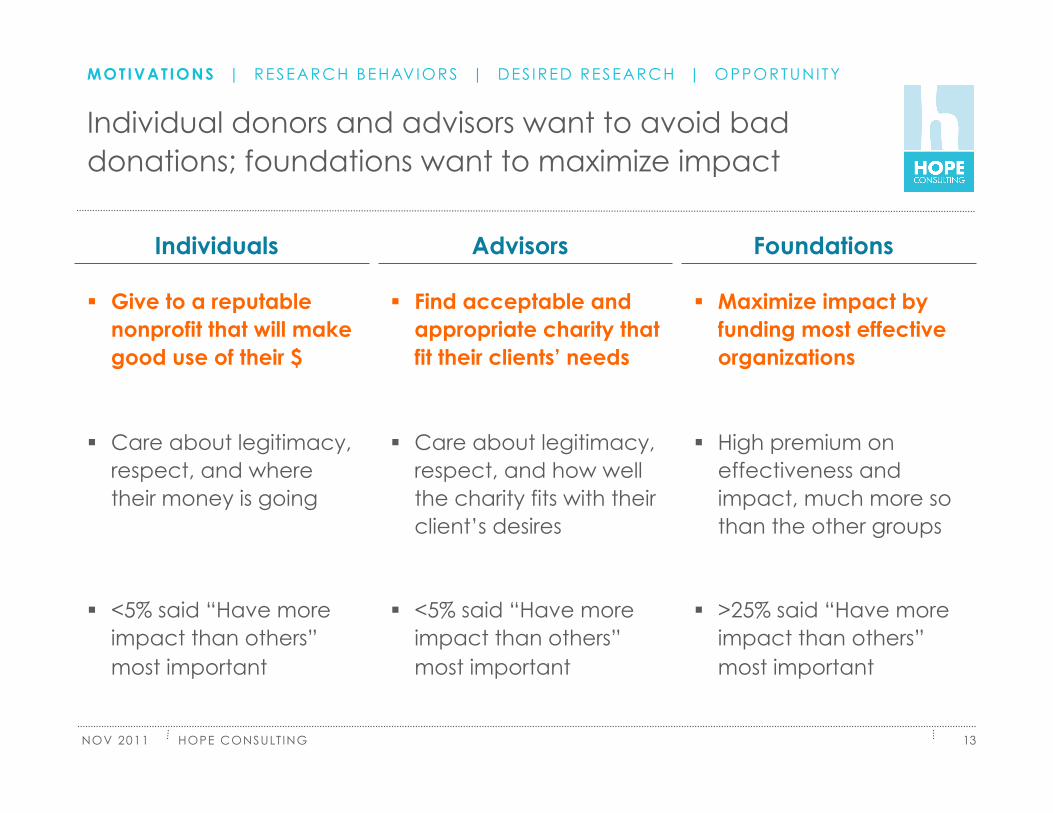
Individual donors and advisors want to avoid bad donations; foundations want to maximize impact
13
Give to a reputable nonprofit that will make good use of their $
Care about legitimacy, respect, and where their money is going
<5% said “Have more impact than others” most important
Find acceptable and appropriate charity that fit their clients’ needs
Care about legitimacy, respect, and how well the charity fits with their client’s desires
<5% said “Have more impact than others” most important
Maximize impact by funding most effective organizations
High premium on effectiveness and impact, much more so than the other groups
>25% said “Have more impact than others” most important
Foundations Advisors Individuals
MOTIVAT IONS | RESEARCH BEHAVIORS | DES IRED RESEARCH | OPPORTUNITY
HOPE CONSULT ING
NOV 2011
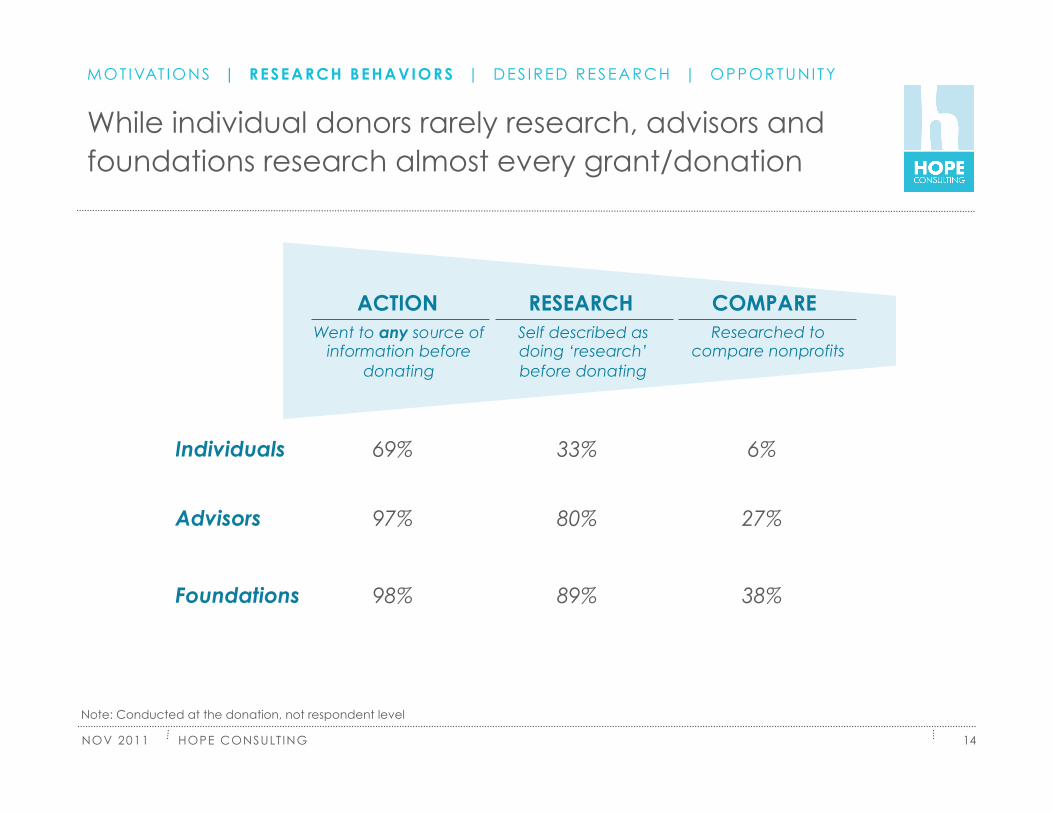
While individual donors rarely research, advisors and foundations research almost every grant/donation
14
COMPARE RESEARCH ACTION Went to any source of
information before donating
Self described as doing ‘research’ before donating
Researched to compare nonprofits
69% 33% 6%
97% 80% 27%
98% 89% 38%
Individuals
Advisors
Foundations
Note: Conducted at the donation, not respondent level
MOT IVAT IONS | RESEARCH BEHAVIORS | DES IRED RESEARCH | OPPORTUNITY
HOPE CONSULT ING
NOV 2011 15
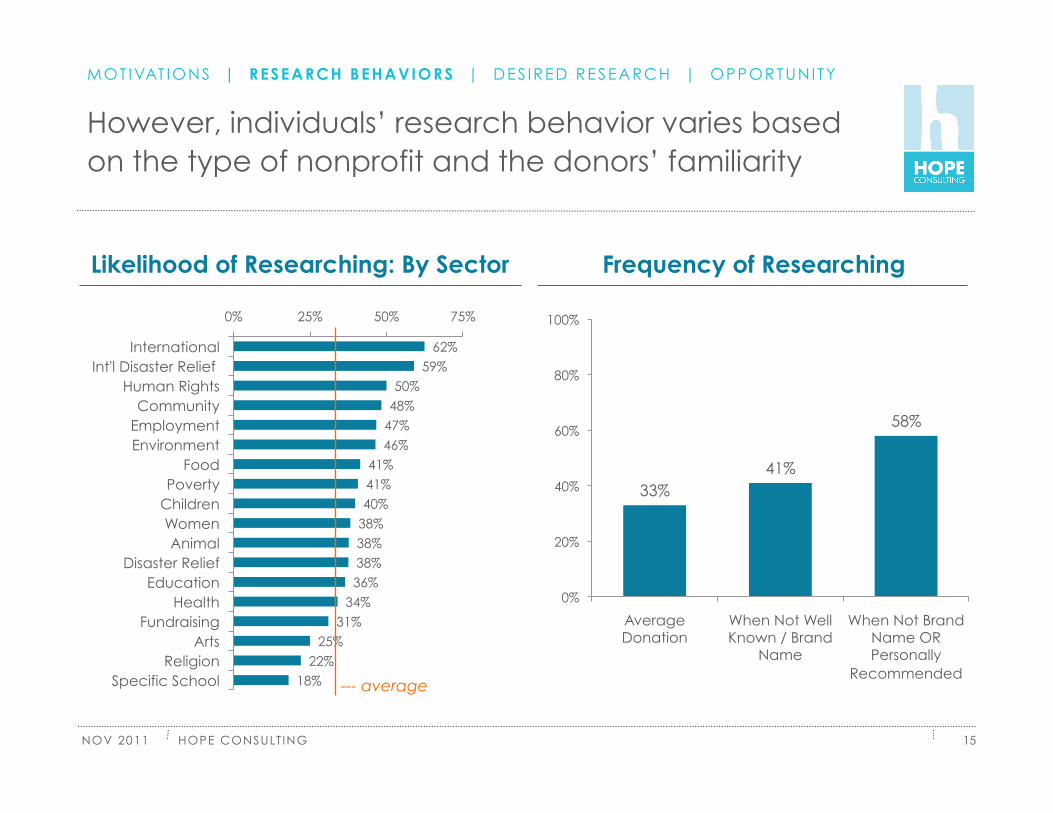
Likelihood of Researching: By Sector
62% 59%
50% 48%
47% 46%
41% 41% 40%
38% 38% 38% 36%
34% 31%
25% 22%
18%
0% 25% 50% 75%
International Int'l Disaster Relief
Human Rights Community
Employment Environment
Food Poverty
Children Women Animal
Disaster Relief Education
Health Fundraising
Arts Religion
Specific School --- average
However, individuals’ research behavior varies based on the type of nonprofit and the donors’ familiarity
33% 41%
58%
0%
20%
40%
60%
80%
100%
Average Donation
When Not Well Known / Brand
Name
When Not Brand Name OR Personally
Recommended
Frequency of Researching
MOTIVAT IONS | RESEARCH BEHAVIORS | DES IRED RESEARCH | OPPORTUNITY
HOPE CONSULT ING
NOV 2011 16
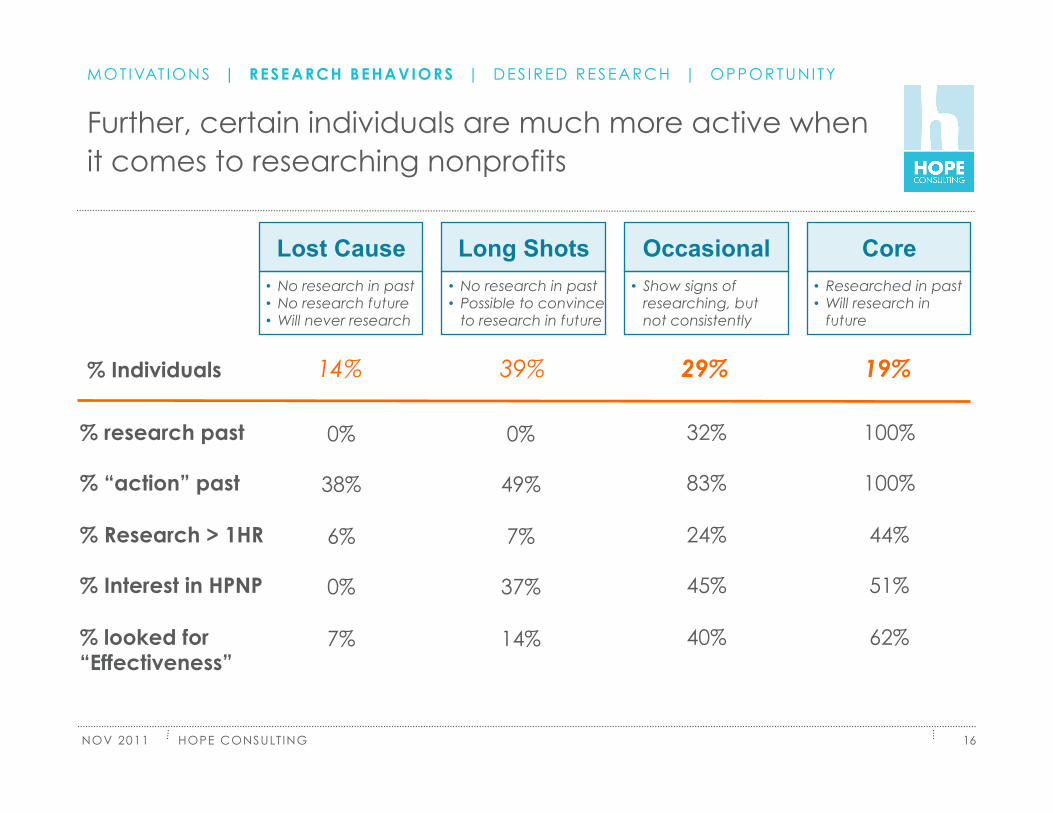
Lost Cause Long Shots Occasional Core • No research in past • No research future • Will never research
• No research in past • Possible to convince
to research in future
• Show signs of researching, but not consistently
• Researched in past • Will research in
future
% research past
% “action” past
% Research > 1HR
% Interest in HPNP
% looked for “Effectiveness”
14% 39% 19% 29% % Individuals
0%
38%
6%
0%
7%
0%
49%
7%
37%
14%
32%
83%
24%
45%
40%
100%
100%
44%
51%
62%
Further, certain individuals are much more active when it comes to researching nonprofits
MOTIVAT IONS | RESEARCH BEHAVIORS | DES IRED RESEARCH | OPPORTUNITY
HOPE CONSULT ING
NOV 2011
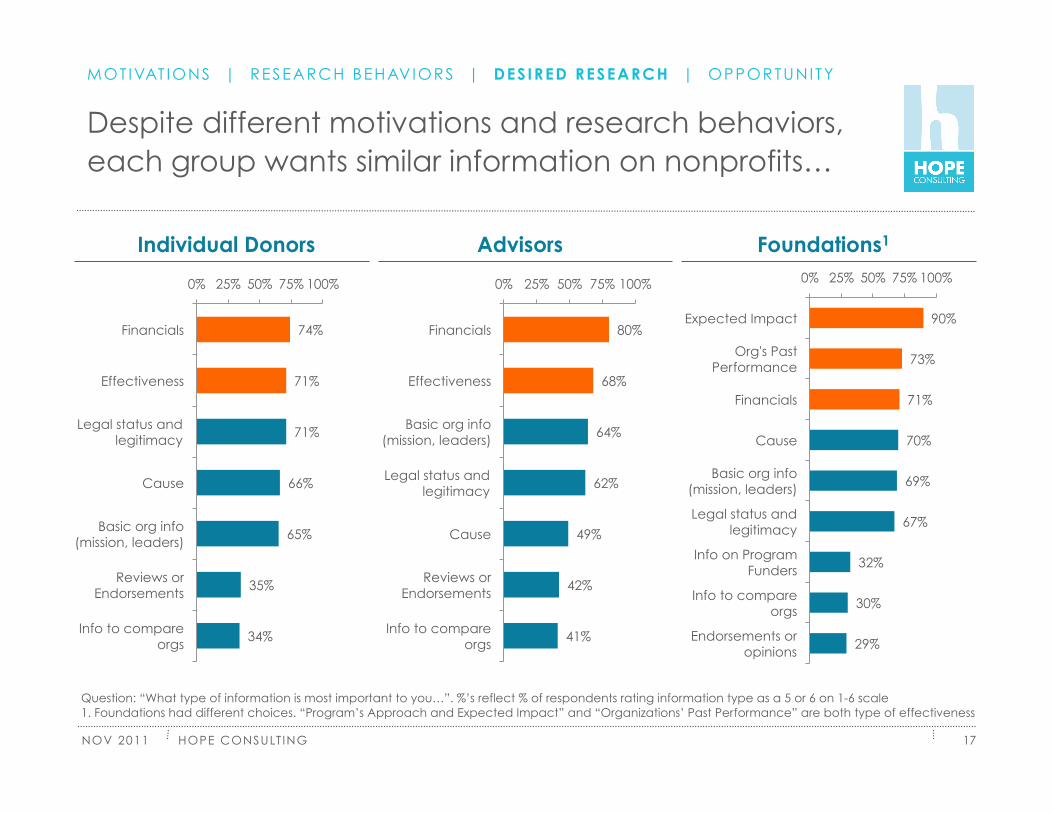
Despite different motivations and research behaviors, each group wants similar information on nonprofits…
17
MOT IVAT IONS | RESEARCH BEHAVIORS | DESIRED RESEARCH | OPPORTUNITY
Question: “What type of information is most important to you…”. %’s reflect % of respondents rating information type as a 5 or 6 on 1-6 scale 1. Foundations had different choices. “Program’s Approach and Expected Impact” and “Organizations’ Past Performance” are both type of effectiveness
Foundations1 Advisors Individual Donors
80%
68%
64%
62%
49%
42%
41%
0% 25% 50% 75% 100%
Financials
Effectiveness
Basic org info (mission, leaders)
Legal status and legitimacy
Cause
Reviews or Endorsements
Info to compare orgs
74%
71%
71%
66%
65%
35%
34%
0% 25% 50% 75% 100%
Financials
Effectiveness
Legal status and legitimacy
Cause
Basic org info (mission, leaders)
Reviews or Endorsements
Info to compare orgs
90%
73%
71%
70%
69%
67%
32%
30%
29%
0% 25% 50% 75% 100%
Expected Impact
Org's Past Performance
Financials
Cause
Basic org info (mission, leaders)
Legal status and legitimacy
Info on Program Funders
Info to compare orgs
Endorsements or opinions
HOPE CONSULT ING
NOV 2011
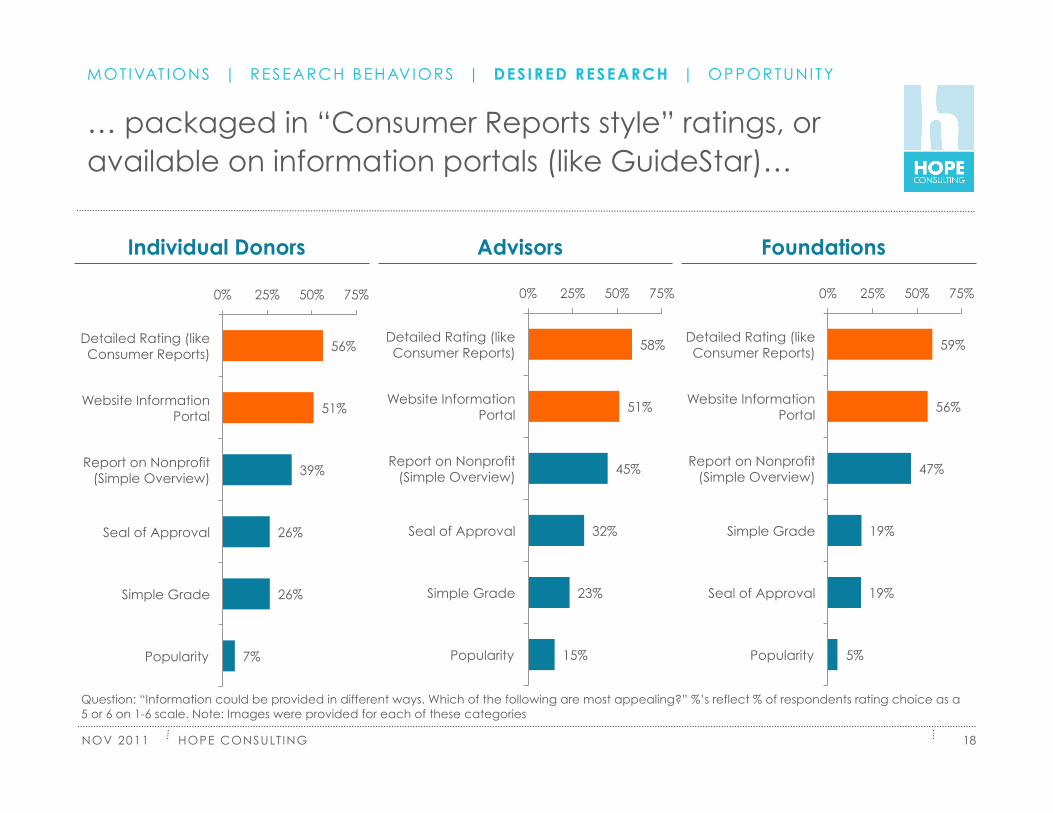
… packaged in “Consumer Reports style” ratings, or available on information portals (like GuideStar)…
18
Question: “Information could be provided in different ways. Which of the following are most appealing?” %’s reflect % of respondents rating choice as a 5 or 6 on 1-6 scale. Note: Images were provided for each of these categories
Foundations Advisors Individual Donors
58%
51%
45%
32%
23%
15%
0% 25% 50% 75%
Detailed Rating (like Consumer Reports)
Website Information Portal
Report on Nonprofit (Simple Overview)
Seal of Approval
Simple Grade
Popularity
59%
56%
47%
19%
19%
5%
0% 25% 50% 75%
Detailed Rating (like Consumer Reports)
Website Information Portal
Report on Nonprofit (Simple Overview)
Simple Grade
Seal of Approval
Popularity
56%
51%
39%
26%
26%
7%
0% 25% 50% 75%
Detailed Rating (like Consumer Reports)
Website Information Portal
Report on Nonprofit (Simple Overview)
Seal of Approval
Simple Grade
Popularity
MOT IVAT IONS | RESEARCH BEHAVIORS | DESIRED RESEARCH | OPPORTUNITY

HOPE CONSULT ING
NOV 2011
… and sourced from organizations that specialize in providing information on, or evaluating, nonprofits
19
Foundations Advisors Individual Donors
51%
47%
41%
40%
37%
28%
26%
26%
23%
23%
22%
22%
15%
14%
12%
11%
0% 25% 50% 75% 100%
Nonprofit info/evaluation org
Nonprofit itself
Certification org (ex. BBB)
Evaluation org (e.g., Consumer Reports)
People involved with org.
My clients
Evaluation org (ex. Mathematica)
Leading foundations
Expert panel
Nonprofit council
Government agency
Nonprofit sector media
Think tank
General public
Leading university
Media
80%
53%
50%
48%
48%
43%
32%
30%
27%
25%
24%
23%
20%
7%
0% 25% 50% 75% 100%
Nonprofit itself
Nonprofit info/evaluation org
People involved with org.
Expert panel
Leading foundations
Nonprofit council
Evaluation org (ex. Mathematica)
Nonprofit sector media
Evaluation org (e.g., Consumer Reports)
Think tank
Certification org (ex. BBB)
Leading university
Government agency
Media
53%
48%
47%
39%
32%
28%
28%
24%
18%
18%
16%
12%
10%
0% 25% 50% 75% 100%
Nonprofit info/evaluation org
Evaluation org (e.g., Consumer Reports)
Certification org (ex. BBB)
Family and Friends
Nonprofit itself
Leading foundations
People involved with org.
Media
Expert panel
Government agency
Local community foundation
Leading university
General public
Question: “Who would you trust to provide the information that you are looking for?” %’s reflect % of respondents rating choice as a 5 or 6 on 1-6 scale
MOT IVAT IONS | RESEARCH BEHAVIORS | DESIRED RESEARCH | OPPORTUNITY

HOPE CONSULT ING
NOV 2011 20
Met and Unmet Information Needs (data for Foundations)
Info Does Not Meet My Needs
Info
Im
po
rta
nt
Info Meets My Needs
Info
No
t Im
po
rta
nt
Comp. Info
Endorsements
Info Other Funders
Approach/ Expected Impact
Past Performance Info on
Cause
Financials
Legal Status / Legit
Basic Info on Org
Relative to other areas, effectiveness and impact data are the areas where users say the information is important AND is not meeting their needs today
• 25% said expected impact info did not meet their needs; 33% for past performance
Of the information available today, we see that it is effectiveness/impact data that is the key unmet need
MOTIVAT IONS | RESEARCH BEHAVIORS | DESIRED RESEARCH | OPPORTUNITY
HOPE CONSULT ING
NOV 2011
As we dive deeper1, we see that important nuances arise regarding each groups specific preferences
21
Each group has a significant preference for the “Consumer Reports style” ratings • Ranked highest not only in stated preferences (page 18) but also in focus groups and
forced ranking tests; in fact, in other tests preference even more stark
• Ranked first both for those that research today, and in terms of what would get ‘non researchers’ to look at information
• Preferences driven by trust (additional transparency drives trust in rating), and fact that it keeps decision personal (provides info but lets user determine how to use it)
While the groups share broad information preferences, the specific types of information and data that they are looking for differs • Individuals and advisors look for data that helps them ensure they aren’t wasting their
money: how much going to OH, how donation will be used, fraud accusations, etc
• Foundations look at specific impact and effectiveness data
Foundations are much more information hungry than advisors or individuals • Foundations desire 2-3x the amount of information as the other groups
MOT IVAT IONS | RESEARCH BEHAVIORS | DESIRED RESEARCH | OPPORTUNITY
1. These points are elaborated in the appendix
HOPE CONSULT ING
NOV 2011
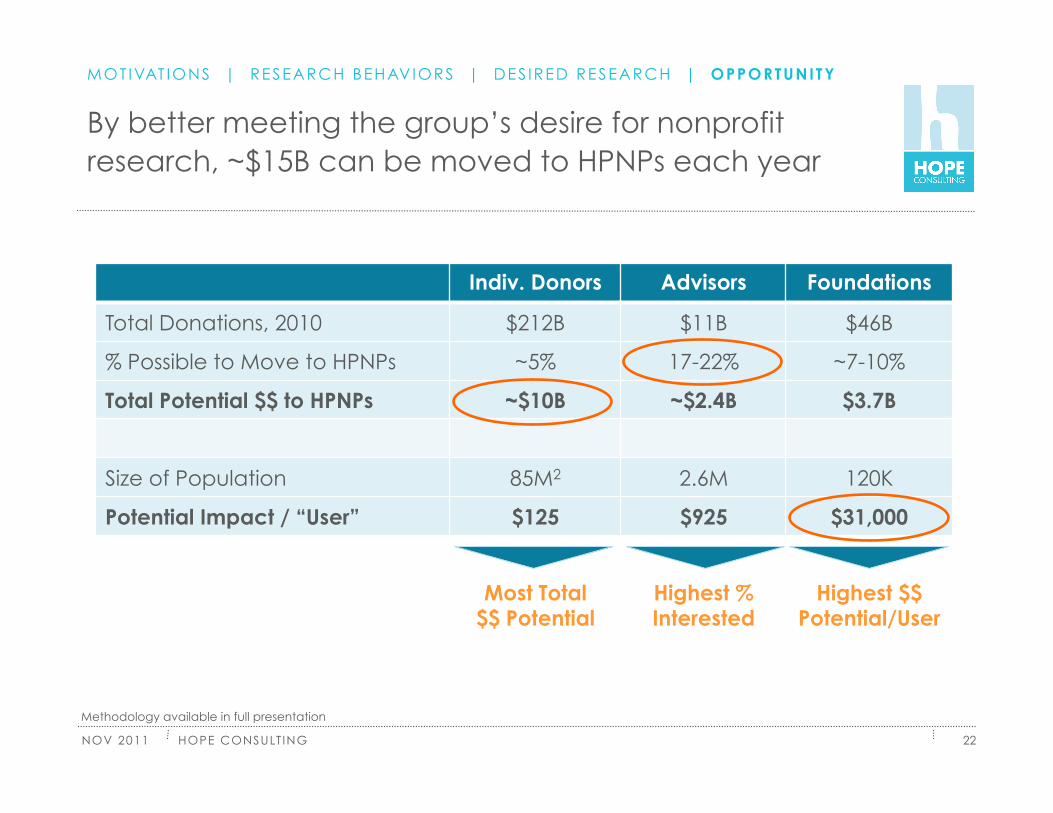
By better meeting the group’s desire for nonprofit research, ~$15B can be moved to HPNPs each year
22
MOT IVAT IONS | RESEARCH BEHAVIORS | DES IRED RESEARCH | OPPORTUNITY
Methodology available in full presentation
Indiv. Donors Advisors Foundations
Total Donations, 2010 $212B $11B $46B
% Possible to Move to HPNPs ~5% 17-22% ~7-10%
Total Potential $$ to HPNPs ~$10B ~$2.4B $3.7B
Size of Population 85M2 2.6M 120K
Potential Impact / “User” $125 $925 $31,000
Most Total $$ Potential
Highest % Interested
Highest $$ Potential/User
HOPE CONSULT ING
NOV 2011
Of course, changing behaviors to get donors, advisors, or foundations to give more to HPNPs is difficult
23
Each group is very loyal with their giving • 75-85% of the total money in each of these groups is ‘loyal’ to particular nonprofits
• Drops the potential opportunity from the $270B these groups influence today to <$70B
The groups do not display significant pain points with researching today • <5% of respondents in each group did not research because of issues with the availability
of information, the quality of information, or the time it took them to research
Individual donors and advisors in particular are difficult to address (and reach!) • Different motivations. For most, finding HPNPs neither the goal nor highly desired outcome
• No downside. Giving to a “low” performing nonprofit has no real impact to them, and there is no feedback loop to inform them of this ex-post or ex-ante
• Fragmented. There are over 110M households – most of which have no interest finding HPNPs, and over 2.5M advisors – many of whom don’t advise clients on where to donate
MOTIVAT IONS | RESEARCH BEHAVIORS | DES IRED RESEARCH | OPPORTUNITY
HOPE CONSULT ING
NOV 2011
Summary of MFG2 findings
24
Individual donors and advisors want to give to reputable organizations that won’t ‘waste’ their $; foundations want to maximize impact
Individual donors rarely research, whereas Advisors and Foundations research almost every recommendation / grant
Despite these different motivations and behaviors, there are consistent broad preferences for research packages across the groups… • Information: Financials, effectiveness, legitimacy, basic information • Format: Detailed ’Consumer Reports’ style ratings, web portals • Channel/Source: 3rd party NP info/evaluation org (e.g., GuideStar)
…But also important nuances • Foundations want more information, and are focused on impact/effectiveness • Indiv. donors and advisors looking for assurance that organizations are acceptable
Effectively meeting the users’ preferences can motivate the user groups to move up to $15B to HPNPs
HOPE CONSULT ING
NOV 2011
Contents
25
1. Project Overview | Origins, Scope, Objectives, Structure
2. Findings from MFG1 | Donor’s Interest and Behaviors
3. Findings from MFG2 | Motivations, Desires, Opportunities
4. Implications and Next Steps | Where We Go From Here

HOPE CONSULT ING
NOV 2011
Emerging implications – How we can move $ to HPNPs
26
The Right Actions
More $ to HPNPs
+ More awareness of current solutions
More research on causes and charities
More demand for information, creating a positive cycle
Changed giving behaviors
1. Better information, focused on impact
2. In a format that provides enough detail
3. Available through appropriate channels
The Right Focus
4. Focused on key causes
5. And target audiences
The Right Process
6. Adapting constantly
+
IMPL ICAT IONS | NEXT STEPS
HOPE CONSULT ING
NOV 2011
Emerging implications: The Right Actions
27
1. Better information, focused on impact • Need to provide users with a complete picture of nonprofit organizations – they desire for
info on financials, impact, legitimacy, and more, not just one data point • Most critical need is for effectiveness / impact information – desired by each group, is
highest unmet need, and critical to identifying which organizations are “high performing” • Better information must be done in a way that is efficient for nonprofits, and leads to cost-
efficient, quality, standardized information for the sector
2. In a format that provides enough detail • Experiment with more detailed “Consumer Reports”-style formats – they are the most
desired format by each group, and by researchers and non-researchers alike − Partnerships with brand like Consumer Reports could drive impact with donors, advisors
• Portals like GuideStar, and self-reported summaries like Charting Impact, also very valuable
3. Available through appropriate channels • People rarely “shop” for charities, so need to push information to where people look for it
today – in particular to nonprofit’s websites and solicitations − Will reach more people, and utilize the natural incentives that HPNPs have to publish
• Build awareness of portals/evaluators that are desired but suffer from lack of awareness • DAFs and community foundations can help reach donors efficiently
IMPL ICAT IONS | NEXT STEPS
HOPE CONSULT ING
NOV 2011
Emerging implications: The Right Focus and Process
28
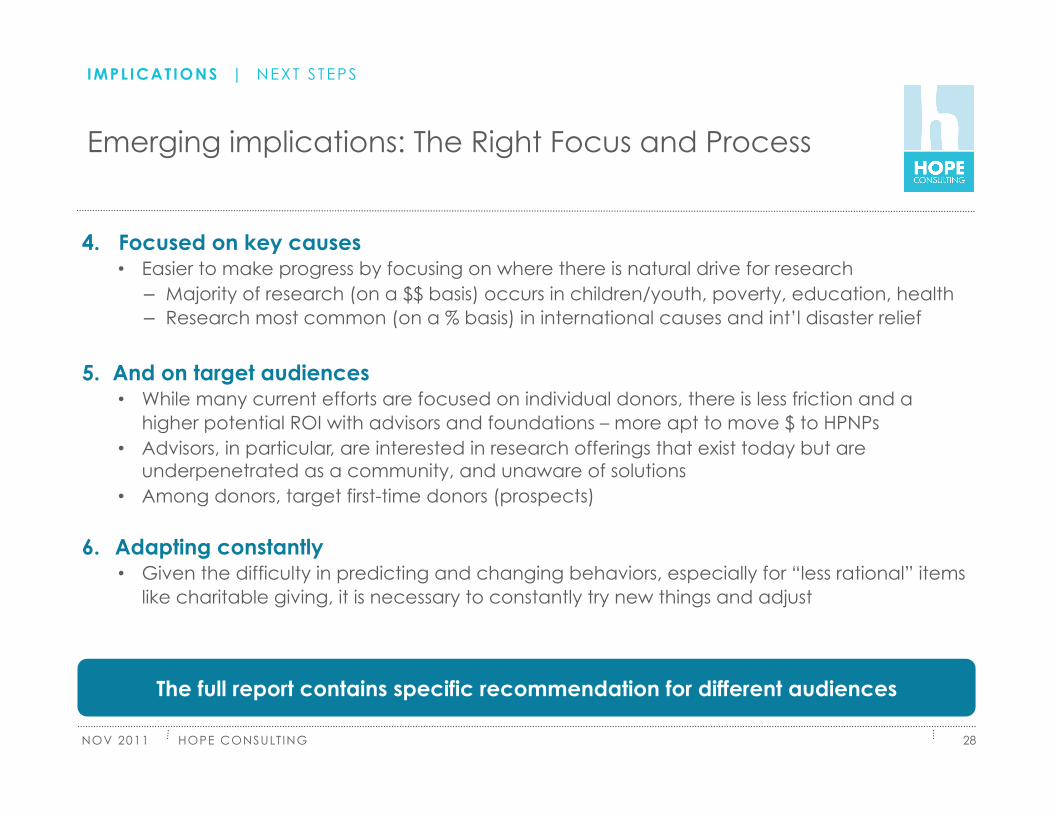
4. Focused on key causes • Easier to make progress by focusing on where there is natural drive for research − Majority of research (on a $$ basis) occurs in children/youth, poverty, education, health − Research most common (on a % basis) in international causes and int’l disaster relief
5. And on target audiences • While many current efforts are focused on individual donors, there is less friction and a
higher potential ROI with advisors and foundations – more apt to move $ to HPNPs • Advisors, in particular, are interested in research offerings that exist today but are
underpenetrated as a community, and unaware of solutions • Among donors, target first-time donors (prospects)
6. Adapting constantly • Given the difficulty in predicting and changing behaviors, especially for “less rational” items
like charitable giving, it is necessary to constantly try new things and adjust
The full report contains specific recommendation for different audiences
IMPL ICAT IONS | NEXT STEPS
HOPE CONSULT ING
NOV 2011
Next Steps: Market Testing
29
The next phase is to test some of these findings in live environments
Market testing will allow us to build on the qualitative and quantitative findings to dive deeper and test other drives of behavior, including “less rational” approaches to decision making
Ultimately, the market tests will provide us with: • Actual data on how people behave, which will ensure that our findings are
not in any way biased • Proof in the results, which will encourage more organizations to adopt the
findings, and will lend important credibility for dissemination • Examples of how testing and trialing can be done – and done easily –
encouraging this productive behavior in the future within the sector
IMPL ICAT IONS | NEXT STEPS
HOPE CONSULT ING
NOV 2011
Next Steps: Examples of Market Tests
30
IMPL ICAT IONS | NEXT STEPS
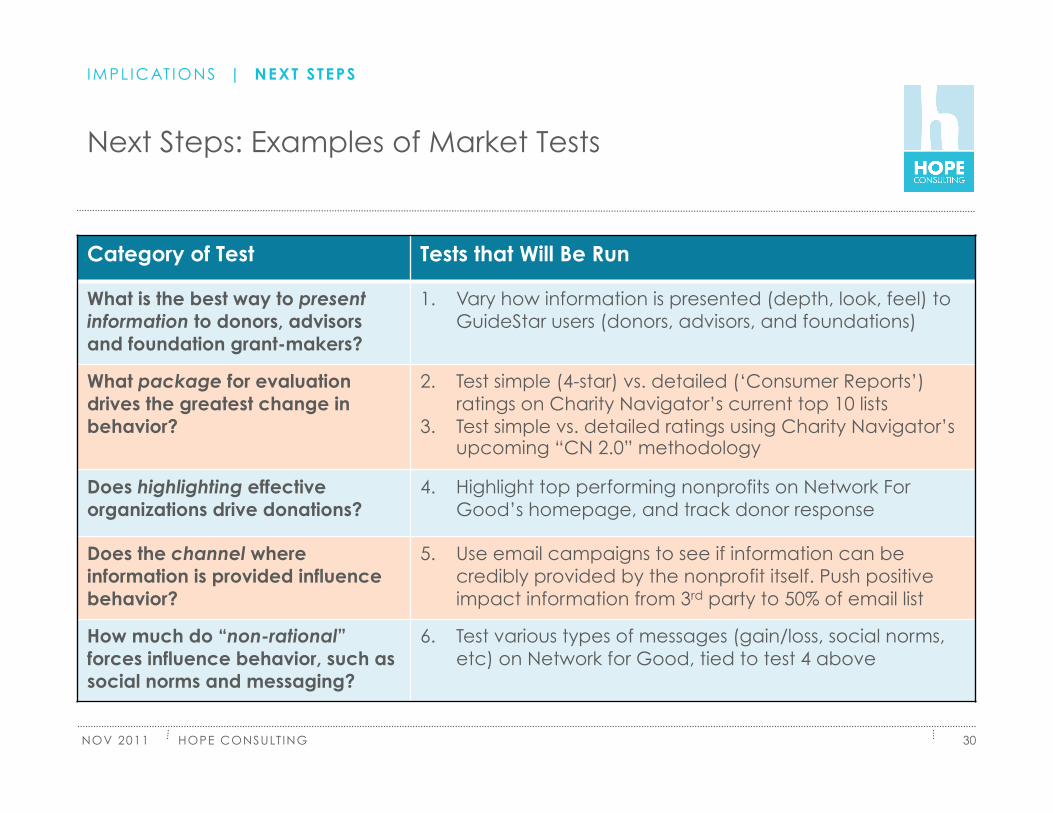
Category of Test Tests that Will Be Run
What is the best way to present information to donors, advisors and foundation grant-makers?
1. Vary how information is presented (depth, look, feel) to GuideStar users (donors, advisors, and foundations)
What package for evaluation drives the greatest change in behavior?
2. Test simple (4-star) vs. detailed (‘Consumer Reports’) ratings on Charity Navigator’s current top 10 lists
3. Test simple vs. detailed ratings using Charity Navigator’s upcoming “CN 2.0” methodology
Does highlighting effective organizations drive donations?
4. Highlight top performing nonprofits on Network For Good’s homepage, and track donor response
Does the channel where information is provided influence behavior?
5. Use email campaigns to see if information can be credibly provided by the nonprofit itself. Push positive impact information from 3rd party to 50% of email list
How much do “non-rational” forces influence behavior, such as social norms and messaging?
6. Test various types of messages (gain/loss, social norms, etc) on Network for Good, tied to test 4 above
HOPE CONSULT ING
NOV 2011
Money for Good II: Driving Dollars to the Highest-Performing Nonprofits
31
For more information, please contact:
Greg Ulrich
Director, Hope Consulting
Email: [email protected]
HOPE CONSULT ING
NOV 2011 32
APPENDIX
A. Detail on the Donor Segments
B. Additional Detail on MFG2
C. Hope Consulting Overview

HOPE CONSULT ING
NOV 2011
Repayer has the largest number of donors; Personal Ties has the largest amount of donations
33
% POPULATION
% DONATIONS
MEAN DONATION1
MEDIAN DONATION2
Repayer 23% 17% $11,000 $1,800
Casual Giver 18% 18% $15,000 $2,500
High Impact 16% 12% $11,000 $3,500
Faith Based 16% 18% $18,000 $7,700
See the Difference 14% 10% $10,000 $2,500
Personal Ties3 13% 25% $27,000 $3,700
1. Refers to all donations. 2. Refers to all donations. Estimated as people entered their giving in ranges (e.g., $1,000 - $2,499) vs. directly inputting the amount. 3. The reason that Personal Ties has such a large % of donations is because, in our survey, a disproportionate # of people who gave >$1M / year fell into this category. This may be unsurprising, as many other reports discuss the importance of personal connections for very high net worth donors
APPENDIX : DETAIL ON THE DONOR SEGMENTS
HOPE CONSULT ING
NOV 2011
2%
7%
0%
0%
0%
18%
12% 2%
3%
2%
2%
1%
0%
0%
6%
7%
1%
1%
0%
4%
3%
3%
30%
16% 5%
1%
1%
0%
7%
8%
1%
1%
1%
2%
2%
2%
5%
3%
26%
10%
5%
3%
2%
3%
0%
0%
0%
1%
1%
65%
3%
1%
3%
0%
0%
0%
4%
27%
4%
3%
3% 4%
5%
2%
4%
2%
4%
1%
1%
0%
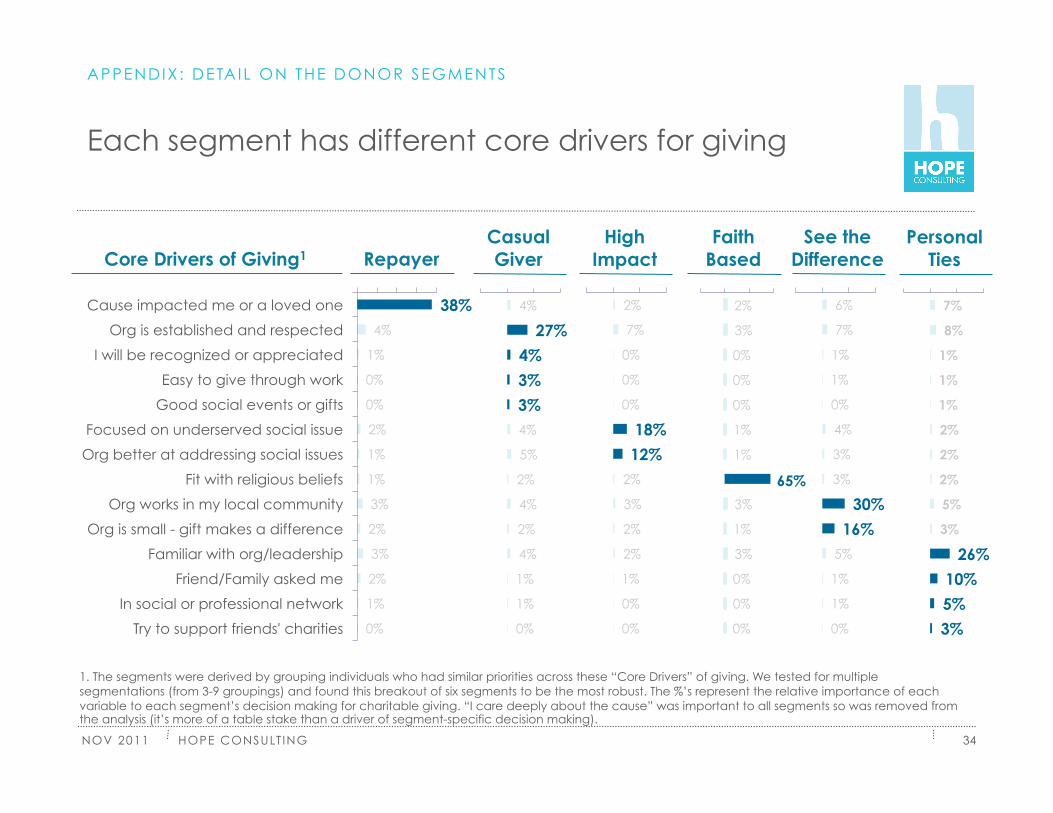
Each segment has different core drivers for giving
34
1. The segments were derived by grouping individuals who had similar priorities across these “Core Drivers” of giving. We tested for multiple segmentations (from 3-9 groupings) and found this breakout of six segments to be the most robust. The %’s represent the relative importance of each variable to each segment’s decision making for charitable giving. “I care deeply about the cause” was important to all segments so was removed from the analysis (it’s more of a table stake than a driver of segment-specific decision making).
Core Drivers of Giving1 Repayer Casual Giver
High Impact
Faith Based
Personal Ties
See the Difference
38% 4%
1%
0%
0%
2%
1%
1%
3%
2%
3%
2%
1%
0%
Cause impacted me or a loved one
Org is established and respected
I will be recognized or appreciated
Easy to give through work
Good social events or gifts
Focused on underserved social issue
Org better at addressing social issues
Fit with religious beliefs
Org works in my local community
Org is small - gift makes a difference
Familiar with org/leadership
Friend/Family asked me
In social or professional network
Try to support friends' charities
APPENDIX : DETAIL ON THE DONOR SEGMENTS
HOPE CONSULT ING
NOV 2011
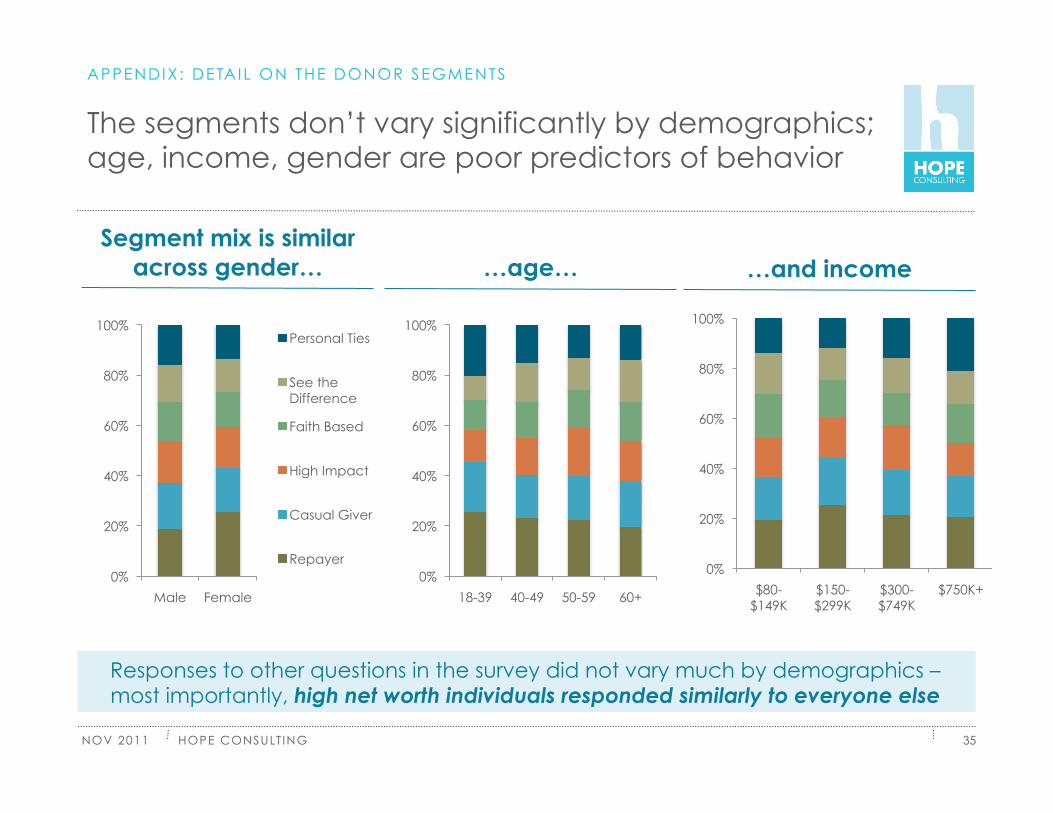
The segments don’t vary significantly by demographics; age, income, gender are poor predictors of behavior
35
Segment mix is similar across gender… …age… …and income
Responses to other questions in the survey did not vary much by demographics – most importantly, high net worth individuals responded similarly to everyone else
0%
20%
40%
60%
80%
100%
18-39 40-49 50-59 60+
0%
20%
40%
60%
80%
100%
$80- $149K
$150- $299K
$300- $749K
$750K+ 0%
20%
40%
60%
80%
100%
Male Female
Personal Ties
See the Difference
Faith Based
High Impact
Casual Giver
Repayer
APPENDIX : DETAIL ON THE DONOR SEGMENTS
HOPE CONSULT ING
NOV 2011
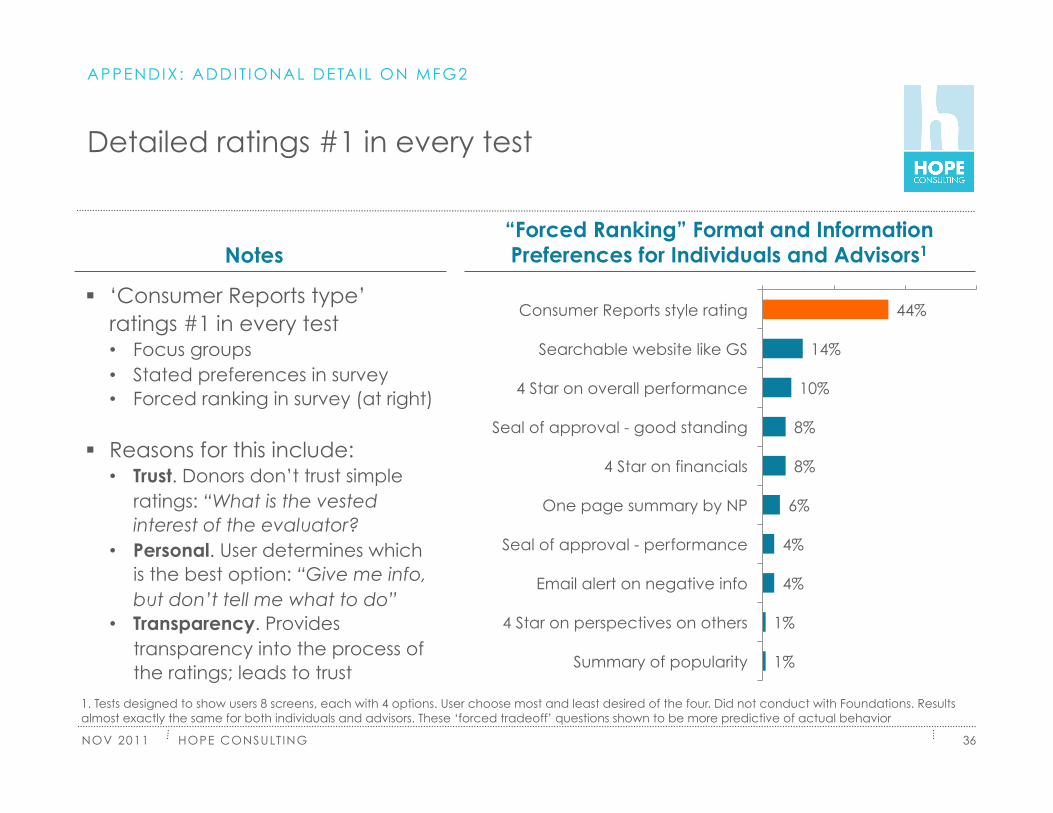
Detailed ratings #1 in every test
36
“Forced Ranking” Format and Information Preferences for Individuals and Advisors1 Notes
‘Consumer Reports type’ ratings #1 in every test • Focus groups • Stated preferences in survey • Forced ranking in survey (at right)
Reasons for this include: • Trust. Donors don’t trust simple
ratings: “What is the vested interest of the evaluator?
• Personal. User determines which is the best option: “Give me info, but don’t tell me what to do”
• Transparency. Provides transparency into the process of the ratings; leads to trust
1. Tests designed to show users 8 screens, each with 4 options. User choose most and least desired of the four. Did not conduct with Foundations. Results almost exactly the same for both individuals and advisors. These ‘forced tradeoff’ questions shown to be more predictive of actual behavior
44%
14%
10%
8%
8%
6%
4%
4%
1%
1%
Consumer Reports style rating
Searchable website like GS
4 Star on overall performance
Seal of approval - good standing
4 Star on financials
One page summary by NP
Seal of approval - performance
Email alert on negative info
4 Star on perspectives on others
Summary of popularity
APPENDIX : ADDIT IONAL DETAIL ON MFG2
HOPE CONSULT ING
NOV 2011 37
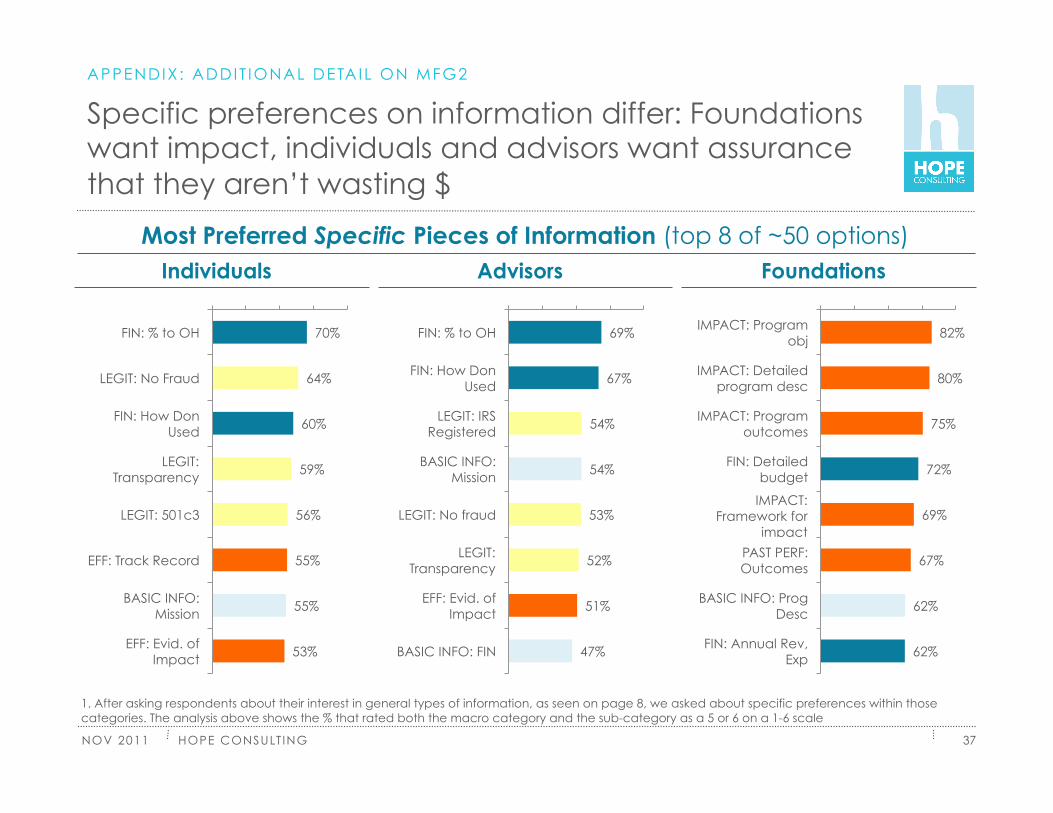
Specific preferences on information differ: Foundations want impact, individuals and advisors want assurance that they aren’t wasting $
Most Preferred Specific Pieces of Information (top 8 of ~50 options)
1. After asking respondents about their interest in general types of information, as seen on page 8, we asked about specific preferences within those categories. The analysis above shows the % that rated both the macro category and the sub-category as a 5 or 6 on a 1-6 scale
Foundations Advisors Individuals
70%
64%
60%
59%
56%
55%
55%
53%
FIN: % to OH
LEGIT: No Fraud
FIN: How Don Used
LEGIT: Transparency
LEGIT: 501c3
EFF: Track Record
BASIC INFO: Mission
EFF: Evid. of Impact
69%
67%
54%
54%
53%
52%
51%
47%
FIN: % to OH
FIN: How Don Used
LEGIT: IRS Registered
BASIC INFO: Mission
LEGIT: No fraud
LEGIT: Transparency
EFF: Evid. of Impact
BASIC INFO: FIN
82%
80%
75%
72%
69%
67%
62%
62%
IMPACT: Program obj
IMPACT: Detailed program desc
IMPACT: Program outcomes
FIN: Detailed budget
IMPACT: Framework for
impact
PAST PERF: Outcomes
BASIC INFO: Prog Desc
FIN: Annual Rev, Exp
APPENDIX : ADDIT IONAL DETAIL ON MFG2
HOPE CONSULT ING
NOV 2011 38
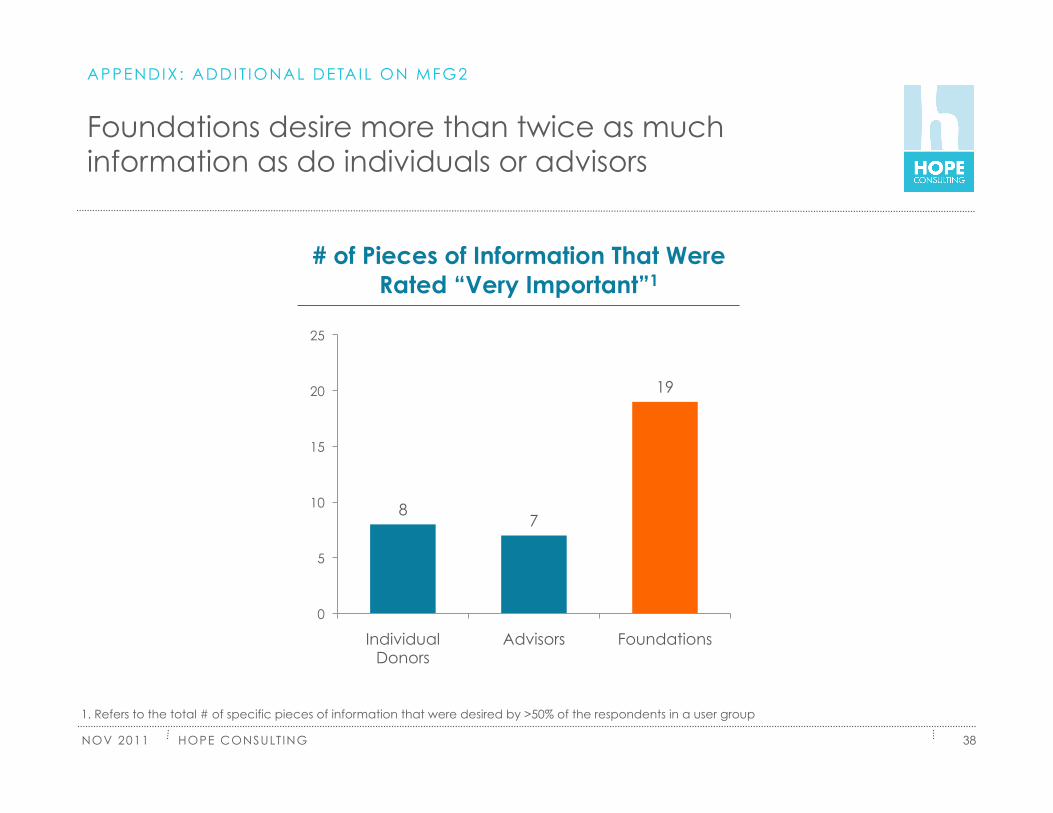
Foundations desire more than twice as much information as do individuals or advisors
APPENDIX : ADDIT IONAL DETAIL ON MFG2
1. Refers to the total # of specific pieces of information that were desired by >50% of the respondents in a user group
# of Pieces of Information That Were Rated “Very Important”1
8 7
19
0
5
10
15
20
25
Individual Donors
Advisors Foundations
HOPE CONSULT ING
NOV 2011
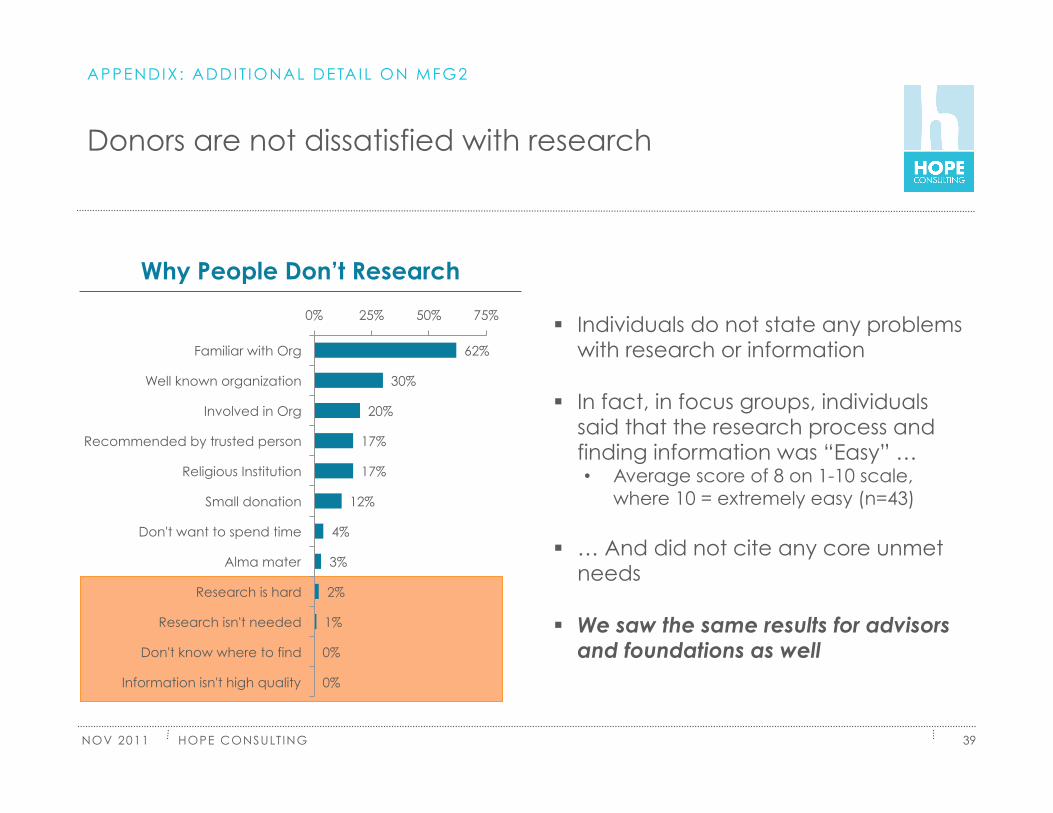
Donors are not dissatisfied with research
39
62%
30%
20%
17%
17%
12%
4%
3%
2%
1%
0%
0%
0% 25% 50% 75%
Familiar with Org
Well known organization
Involved in Org
Recommended by trusted person
Religious Institution
Small donation
Don't want to spend time
Alma mater
Research is hard
Research isn't needed
Don't know where to find
Information isn't high quality
Why People Don’t Research
Individuals do not state any problems with research or information
In fact, in focus groups, individuals said that the research process and finding information was “Easy” … • Average score of 8 on 1-10 scale,
where 10 = extremely easy (n=43)
… And did not cite any core unmet needs
We saw the same results for advisors and foundations as well
APPENDIX : ADDIT IONAL DETAIL ON MFG2
HOPE CONSULT ING
NOV 2011
Hope Consulting Overview
40
WHAT WE DO
We’re a boutique strategy consulting firm with a focus on consumer/customer insights
We work with clients to identify and capitalize opportunities to drive profitable growth and/or social impact over time
INDICATIVE CLIENTS & FUNDERS
APPENDIX : HOPE CONSULT ING OVERVIEW