Embed Size (px)
Citation preview

European Journal of Business and Management www.iiste.org
ISSN 2222-1905 (Paper) ISSN 2222-2839 (Online)
Vol.5, No.9, 2013
13
Merger of Bank of Karad Ltd. (BOK) with Bank of India (BOI): A
Case Study
Dr. Brajesh Kumar Tiwari
Assistant Professor, Department of Commerce, Guru Ghasidas Central University, Bilaspur (C.G)
E.Mail: [email protected]
Abstract
In an increasingly globalized and competitive world, it is imperative that all institutions not only follow global
practices, but also that they are globally competitive, efficient and sound. In the corporate world it is said if you can’t
beat your competitor then go with them i.e. merge your company with your rival or take them over. So all it boils down
to is the survival of the fittest. This process helps in attaining greater market share, acquiring additional brands,
cannibalizing competing brands, realizing improved infrastructure, creating new synergies, and capitalizing on
efficiencies and economies of scale or to globalize in the shortest span of time. A banking merger is just the same as the
merger of two companies except that it involves banks. Mergers and Acquisitions (M&A) in the banking sector may be
in the form of amalgamation, absorption, consolidation, acquisition or takeover. The important point in the bank
merger is that banking activities of the participants will always be regulated. The present research paper delineates
the effects of M&A on the Financials of the Merger of Bank of Karad Ltd. (BOK) with Bank of India (BOI) before
and after merger. For this purpose various variables namely, capital, deposits, investments, advances, interest earned,
interest paid, total income, total expenditure and net profit have been identified. In the analysis of variables figures
for four year prior to merger and figures of variables for four years after the merger have been taken. Figures prior to
merger are the total of value of variables of both amalgamating bank (the bank which loses its identity) and
amalgamated bank (the bank which continues its existence). The result of regression equation has been found
effective after merger of BOI and BOK from the point of view of capital, deposits, investments, advances, fixed
assets, interest earned, total income, net profit and total assets. In the case of interest expenditure and total expenditure
result of regression equation has been found ineffective. The Null Hypothesis is rejected in all variables except interest
expenditure.
Key Words: Merger, Acquisition, Capital, Deposits, Investments, Advances, Fixed Assets, Interest Earned, Interest
Paid, Total Income, Total Expenditure, Net Profit and Total Assets
Objective of the Study:
The study has been under taken to examine to evaluate the effectiveness of mergers and acquisitions of the BOK
with BOI on the basis of selected variables prior and after mergers and acquisitions.
Period of Study: In order to make a comparison of the performance of the BOK with BOI, data for four years prior to
merger and data for four years after the merger have been analyzed. Thus, a period of nine years has been analyzed.
Methods of Analysis: The analysis has been made on the basis of the Mean, Standard Deviation, Growth Rate and‘t’
Test of different variables before and after merger. In order to ensure the significance of change in mean value before
and after merger t-test has been used at 5% level of significance and 8 Degree of freedom. The predicted values of
identified variables have been calculated by using regression equation (y = a + bx) and presented in tables and charts.
Hypothesis: The present work is essentially based on secondary sources; hence hypothesis is being tested by using
published materials. For the purpose of study Null Hypothesis is that there is no difference in mean value of selected
variables before merger and after merger and Alternate Hypothesis is that there is difference in mean value of selected
variables before merger and after merger.
Let Mean value before merger be X1
Mean value after merger be X2

European Journal of Business and Management www.iiste.org
ISSN 2222-1905 (Paper) ISSN 2222-2839 (Online)
Vol.5, No.9, 2013
14
Ho: X1 = X2 Null Hypothesis: There is no difference in mean value of selected variables before merger and after
merger.
H1: X1≠ X2 Alternate Hypothesis: There is difference in mean value of selected Variables before merger and after
merger.
Variables:
In order to judge the effectiveness of mergers and acquisitions of Merger of Bank of Karad Ltd. (BOK) with Bank of
India (BOI) following 11 variables have been identified:
� Capital: Capital represents the resources contributed by owners. The capital includes share capital and
undistributed profits. The growth of capital indicates capacity of banks to attract deposits, lend to the business
unit and to borrow from the public. One of the aims of merger is to increase the capital base of the banks. It is
expected that the banks after merger would have sufficient capital base.
� Deposits: The important element of conventional banking business is to accept deposits from the customers.
One of the important sources of lending money is deposit. Without deposits the bank cannot provide the loan
in different sectors. For the purpose the study the deposits refer to the bank balances in different accounts.
� Investments: Investment refers to the investment of funds in the different areas such as government
securities, subsidiary companies, mutual funds and others which are shown in the assets side of balance sheet
of banks. The main purpose of such investment is either to earn a return or/ and to control another company.
The investment helps to increase the total revenue and profit of the banking industry.
� Advances: Advances is the another important aspect of conventional banking operations. In this study total
advances include term advances, short term advances, advances to assisted company, advances to priority
sector, advances in public sector etc
� Fixed Assets: Fixed assets represent the economic resources that are used to generate future earnings. Fixed
assets refer to the net fixed assets. Without fixed assets it is impossible to run the banking industry. It is
assumed that there would be positive impact on the fixed assets after the merger.
� Interest Earned: One of the main sources of income of banking industry is the interest earned.
� Total Income: The revenue earned from the different sources is total income. In the case of banking industry
interest income is the main income. However, for the purpose of this study, total income refers to interest
received, dividend received, security transactions, exchange transaction, commission and brokerage etc. it is
expected that the total income will be increased after the merger and acquisition.
� Interest expenditure: Interest provided to customer in different saving and fixed deposits accounts and
interest of debt capital is the interest expenditure. The interest expenditure can be minimized by increasing the
operating efficiency. The operating efficiency can be increased by merger and acquisition.
� Total Expenditure: The expense incurred to operate the bank is the total expenditure. The total expenditure
should be controlled to increase the profitability. By increasing the operating efficiency the total expenditure
can be reduced. It is possible by M&A.
� Net Profit: The profit is an indicator of the efficiency with which the business operations are carried out by
corporate sector. The poor operational performance may result in poor sales leading to poor profits. The
merger intends to boost profits through elimination of overlapping activities and to ensure savings through
economies of scale. The amount of profit may be increased through reduction in overheads, optimum
utilization of facilities, raising funds at lower cost and expansion of business.
� Total Assets: Assets represent economic resources that are the valuable possessions owned by a firm. Assets
are mainly used to generate earnings. The total assets refer to net fixed assets and current assets. One aim of
business strategy namely, merger and acquisition is, the maximization of total assets of merged banks i.e.,
firms’ ability to produce large volume of sales revenue. It is expected that the bank units after merger would
function efficiently.
BANK OF INDIA (BOI) was founded on 7th September, 1906 by a group of eminent businessmen from Mumbai.
The Bank was under private ownership and control till July 1969 when it was nationalized along with 13 other banks.

European Journal of Business and Management www.iiste.org
ISSN 2222-1905 (Paper) ISSN 2222-2839 (Online)
Vol.5, No.9, 2013
15
Beginning with one office in Mumbai, with a paid-up capital of Rs.50 lakh and 50 employees, the Bank has made a
rapid growth over the years and blossomed into a mighty institution with a strong national presence and sizable
international operations. In business volume, the Bank occupies a premier position among the nationalized banks at 5th
rank. The bank has been ranked 239th biggest bank in the world by The Bankers (June 2009), London. The Bank has
3021 branches in India spread over all states/ union territories including 136 specialized branches. These branches are
controlled through 48 Zonal Offices. There are 28 branches/ offices (including three representative offices)
abroad. The Bank has been the first among the nationalized banks to establish a fully computerized branch and ATM
facility at the Mahalaxmi Branch at Mumbai way back in 1989. The Bank is also a Founder Member of SWIFT in India
which facilitates provision of cost-effective financial processing and communication services. Bank of India was the
first Indian Bank to open a branch outside the country, at London, in 1946. The Bank completed its first one hundred
years of operations on 7 September, 2006. The bank head office is situated in Mumbai.
BANK OF KARAD (BOK), the old private sector bank started in 1946 from Karad, Maharashtra. It was a victim of
the 1992 securities scam. The bank was used by stock brokers like Bhupen Dalal during the infamous Harshad
Mehta-led scam in 1991-92.
The Bank of Karad (BOK) was placed under liquidation at the instance of the Reserve Bank by the High Court of
Bombay by its ad-interim order dated May 27, 1992. The bank was finally wound up vide winding up order of the
Bombay High Court dated July 20, 1994 and the BOI has took over 48 branches of BOK. It was a forced merger under
the direction of Reserve Bank of India (RBI) and Government of India (GOI).
Main Reasons/ Motives of Merger:
� RBI merged sick bank with healthy bank to protect depositor's interests.
� BOK was a victim of 1992 Securities scam.
� The bank was used by stock brokers like Bhupen Dalal during the infamous Harshad Mehta-led scam in
1991-92. Scamsters persuaded Bank of Karad and the Metropolitan Cooperative Bank (MCB) to issue bank
receipts (BR) as and when required. These BRs could then be used to do ready-forward deals with other
banks. The cheques in favour of BOK were credited into the brokers’ accounts.
� Only option left out was either liquidation or merger with another bank.
(i) Capital: Table 1 presents the actual capital and its predicted value of BOI and BOK during the period under review.
The Table shows that the difference of capital and its trend value is negative in the year 1989, 1990, 1991, 1992, 1993,
1996 and 1997 while these are positive in 1994 and 1995. The positive difference in 1995 is very large while the
negative difference is very large in 1998. The actual capital is lower than predicted value throughout study period
except 1994 and 1995. With regard to the capital, the result shows that the good performance of the Bank of India
during post merger period.
Figure 1 shows the actual and predicted value of capital. The curve of actual value indicates a fluctuating trend. It
increases slightly till 1993 and it grows sharply in 1994 and 1995 after that it declines sharply. The curve of actual
capital is higher than the curve of trend value in 1994 and 1995.
(ii) Deposits: Table 2 portrays the actual value of deposits and its predicted value of BOI and BOK during the study
period. The Table clearly discloses that the difference of deposits and its trend value is negative in the year 1993, 1994,
1995 and 1996 while these are positive in the year 1989 to 1992, 1997, 1998. The positive difference is largest in 1998
while the negative difference is very large in 1994. The actual deposit is higher than predicted value before merger
where it is lower than predicted value after merger except in 1997. The result shows that the good performance of the
Bank of India after merger in comparison to before merger.
The Figure 2 shows a continuous increasing trend of deposits. The curve of actual deposits is higher than the curve of
trend value in 1989 to 1992 and 1997 and 1998.
(iii) Investments: Table 3 demonstrates the actual investment and its predicted value of BOI and BOK during the
study period. The table reveals that the difference of investment and its trend value is negative in the year 1991, 1992,
1993 and 1994 while these are positive in the year 1989, 1990, 1995, 1996, 1997 and 1998. The positive difference in
1998 is very large while the negative difference is very large in 1993. The actual investment is higher than predicted
value after merger except in 1993 and 1994. With regard to the investments, the result shows that the performance of
the Bank has been improved after post merger period.

European Journal of Business and Management www.iiste.org
ISSN 2222-1905 (Paper) ISSN 2222-2839 (Online)
Vol.5, No.9, 2013
16
Figure 3 shows that the actual and trend values of investment. The curve of actual value indicates a continuous
increasing trend. The curve of actual investment is higher than the curve of trend value in 1989, 1990, 1995, 1996, 1997
and 1998.
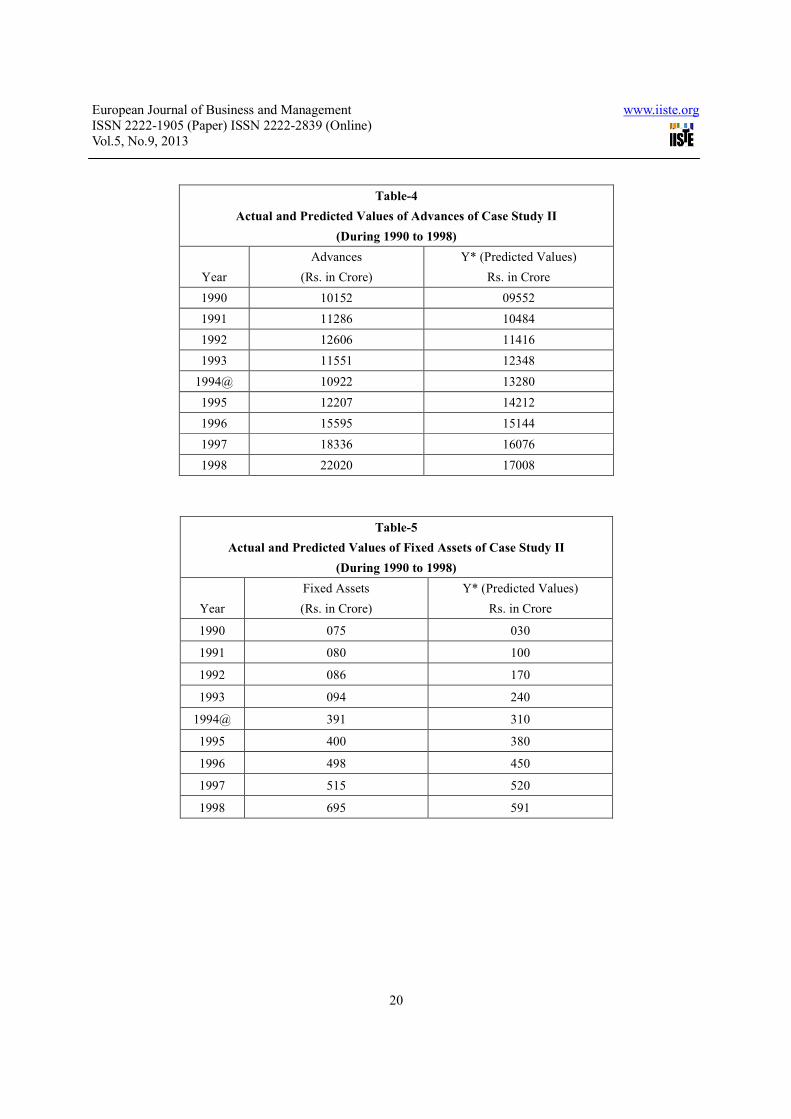
(iv) Advances: Table 4 contains the actual value of advances and its predicted value of BOI and BOK over a period of
study. The Table shows that the negative difference of actual value advances and its trend values has found in the years
1989, 1993, 1994 and 1995 while the positive has found in the year 1990, 1991, 1992, 1996 and 1997. The largest
positive difference has been recorded in 1998 while the largest negative difference has been recorded in 1994. The
actual value of advances is higher than predicted value after merger except in 1994 and 1995. The result shows that the
operating efficiency of the Bank of India has increased during post merger period.
Figure 4 shows that the actual and trend value of advances. The curve of actual value indicates a fluctuating trend. It
increases slightly till 1992 and it declines in 1993 and 1994 after that it begins to rise. The curve of actual advances is
higher than the curve of trend value in 1990, 1991, 1992, 1996, 1997 and 1998.
(v) Fixed Assets: Table 5 illustrates the actual value of fixed assets and its predicted values of BOI and BOK during
the period under review. The difference of actual value of fixed assets and its trend value is negative in the year 1991,
1992, 1993 and 1997 while these are positive in the year 1989, 1990, 1994, 1995, 1996 and 1998. The positive
difference in 1998 is very large while the negative difference is very large in 1993. The actual value of fixed assets is
lower than predicted value before merger except 1990 whereas it is higher than predicted value after merger except in
1993 and 1997. The result shows that the Bank of India is able to increase the value of fixed assets after merger.
Figure 5 shows that the actual and trend value of fixed assets. The curve of actual value indicates a fluctuating trend. It
increases slightly till 1993 and it increases sharply in 1994 and after. The curve of actual fixed assets is higher than the
curve of trend value in 1990, 1994, 1995, 1996 and 1998.
(vi) Interest Earned: Table 6 delineates the actual value of interest income and its predicted value of BOI and BOK
over a period of study. The Table reveals that the difference of interest income and its trend value is negative in the year
1990, 1993, 1994, 1995 and 1996 while these are positive in the year 1989, 1991, 1992, 1997 and 1998. The positive
difference in 1998 is very large while the negative difference is very large in 1994. The result shows that the
performance of the Bank of India regarding the interest income was good during the post merger period.
Figure 6 shows that the actual and trend value of interest income. The curve of actual value indicates a fluctuating
trend. It increases slightly till 1992 and it declines in 1993 and 1994 after that it begins to rise. The curve of actual
interest income is higher than the curve of trend value in 1989, 1991, 1992, 1997 and 1998.
(vii) Total Income: Table 7 exhibits the actual value of total income and its predicted value of BOI and BOK over a
period of study. The negative difference of total income and its trend values has been observed in the year 1990, 1991,
1993, 1994 and 1995 while the positive difference has been observed in the year 1992, 1996, 1997 and 1998. The
positive difference in 1998 is very large while the negative difference is very large in 1994. The actual total income is
higher than predicted after merger in 1996, 1997 and 1998. The result shows that the performance of the Bank of India
with regard to total income has found good during the post merger period.
Figure 7 shows that the actual and trend value of total income. The curve of actual value indicates a fluctuating trend. It
increases slightly till 1992 and it declines in 1993 and 1994 after that it begins to rise. The curve of actual total income
is higher than the curve of trend value in 1989, 1992, 1996, 1997 and 1998.
(viii) Interest Expenditure: Table 8 displays the actual value of interest expenditure and its predicted value of BOI
and BOK during the period under review. The difference of interest expenditure and its trend value is negative in the
year 1990, 1994, 1995, and 1996 while these are positive in the year 1991, 1992, 1993, 1997 and 1998. The positive
difference in 1998 is very large while the negative difference is very large in 1995. With regard to interest expenditure,
the performance of the Bank of India has found unsatisfactory during post merger period except 1995.
Figure 8 shows the actual and trend value of interest expenditure. The curve of actual value indicates a fluctuating
trend. It increases slightly till 1992 and it declines in 1993 and 1994 after that it begins to rise. The curve of actual
interest expenditure is higher than the curve of trend value in 1991, 1992, 1993, 1997 and 1998.
(ix) Total Expenditure: Table 9 discloses the actual value of total expenditure and its predicted value of BOI and
BOK during the study period. The Table shows that the difference of total expenditure and its trend value is negative in
the year 1990, 1993, 1994, 1995 and 1996 while these are positive in the year 1991, 1992, 1997 and 1998. The positive

European Journal of Business and Management www.iiste.org
ISSN 2222-1905 (Paper) ISSN 2222-2839 (Online)
Vol.5, No.9, 2013
17
difference in 1998 is very large while the negative difference is very large in 1994. With regard to the total expenditure
performance of the Bank of India has found unsatisfactory during post merger period.
Figure 9 shows the actual and trend value of total expenditure. The curve of actual value indicates a fluctuating trend.
It increases slightly till 1992 and it declines in 1993 and 1994 after that it begins to rise. The curve of actual total
expenditure is higher than the curve of trend value in 1991, 1992, 1997 and 1998.
(x) Net Profit: Table 10 depicts the actual value of net profit and its predicted values of BOI and BOK over a period of
study. The Table reveals that the difference of profit and its trend value is negative in the year 1993, 1994 and 1995
while these are positive in the year 1990, 1991, 1992, 1996, 1997 and 1998. The positive difference in 1998 is very
large while the negative difference is very large in 1994. The actual profit is higher than predicted value after merger
except in 1994 and 1995. The actual value of profit has been increased in most recent years. The result shows that the
profitability of the Bank of India-1994 has increased during post merger period.
Figure 10 shows the actual and trend value of net profit. It increases slightly till 1992 and it starts to decline till 1994
after that it begins to increase sharply. The curve of actual net profit is higher than the curve of trend value in 1990,
1991, 1992, 1996, 1997 and 1998.
(xi) Total Assets: The actual value of total assets and its predicted value of BOI and BOK are presented in table 11
during the period under review. The Table reveals that the difference of total assets and its trend value is negative in the
year 1990, 1991, 1993, 1994 and 1995 while these are positive in the year 1992, 1996, 1997 and 1998. The positive
difference in 1998 is very large while the negative difference is very large in 1994. The actual value of total assets is
lower than predicted value before merger except in 1989 whereas it is higher than predicted value after merger except
in 1994 and 1995. The result shows effective performance of the Bank of India with regard to total assets during post
merger period.
Figure 11 shows the actual and trend value of total assets. The curve of actual value indicates the continuous increasing
trend except 1993. The curve of actual total assets is higher than the curve of trend value in 1989, 1996 and 1997.
Analysis of “t” Test: In this section, the mean, standard deviation, growth rate and ’t’ values of different variables
have been calculated and presented, before merger and after merger, to examine the impact of M&A on different
variables. For the processing of the data, Excel and SPSS-10 package in computer have been used. In order to ensure
the significance of change in mean values before and after merger’t’ test has been used.
Table 12 shows the mean value of capital, deposits, investments, advances, fixed assets, interest earned, interest paid,
total income, total expenditure, net profit and total assets before and after merger and its variability, growth rate of
average value of 11 variables before and after merger and ‘t' values. The result presented in table clearly shows that all
11 variables have shown a significant growth during post-merger period than the average value during pre-merger
period. It shows that merger of BOK with BOI have earned significant growth in Net profits (580%) and Advances
(496%) than other 9 variables. The Null Hypothesis is rejected in all variables except interest expenditure.
Summary/Findings : The result of regression equation has been found effective after merger of BOI and BOK from
the point of view of capital, deposits, investments, advances, fixed assets, interest earned, total income, net profit and
total assets. In the case of interest expenditure and total expenditure result of regression equation has been found
ineffective. The Null Hypothesis is rejected in all variables except interest expenditure.
Notes: Y*: Regression equation (y = a + bx), @-: Year of Merger, Source of data Extracted and computed from the
annual reports of RBI and IBA
About the Author: With First Class academic record Dr. Brajesh Kumar Tiwari has
completed his B.Com (Hons.), M.Com, M.Phil and Ph.D Degree from Banaras Hindu
University. Dr. Tiwari is serving, Department of Commerce, Guru Ghasidas Central
University Bilaspur in the capacity of Assistant Professor. He has attended more than
thirty seven International and National seminars & conferences and has presented

European Journal of Business and Management www.iiste.org
ISSN 2222-1905 (Paper) ISSN 2222-2839 (Online)
Vol.5, No.9, 2013
18
around three dozen papers therein. He also holds several of national publications, three international books
from USA and Germany and one national book from Delhi and has three chapter contributions in edited
books to his research basket. He was awarded as “Yuva Kashi-Gaurav” by Purvanchal Vikas Samiti,
Varanasi and “Best Volunteer” in Faculty Annual Day by Faculty of Commerce BHU. He got Best Research
Paper Award in International Conference in Nepal and one of his Research Paper was selected for Best
Business Academic of the Year Award “BBAY Award” in 58th All India Commerce Conference. Being a
Research Fellow, he represented the Faculty of Commerce before NAAC (UGC) in 2006. During his Ph.D
he got UGC Research fellowship. He is life member of Indian Commerce Association, Indian Accounting
Association and Indian Economic Association. His interest areas include Banking and Finance.
Financials of the Bank of Karad Ltd. and Bank of India
at the time of Merger (1992-93)
S.No. Financial
Indicators of
Banks
Bank of karad Ltd
(Rs. in crore)
Bank of India
(Rs. in crore)
1. Capital 0000.30 00469.00
2. Deposits 0076.86 19209.55
3. Investments 0030.13 05260.78
4. Advances 0034.06 12572.06
5. Total assets 0086.85 23214.07
6. Net Profit 0000.82 0056.62
Table-1
Actual and Predicted Values of Capital of Case Study II
(During 1990 to 1998)
Year
Capital
(Rs. in Crore)
Y* (Predicted Values)
Rs. in Crore
1990 259 321
1991 359 433
1992 469 545
1993 469 656
1994@ 1104 768
1995 1952 880
1996 582 991
1997 596 1103
1998 637 1215

European Journal of Business and Management www.iiste.org
ISSN 2222-1905 (Paper) ISSN 2222-2839 (Online)
Vol.5, No.9, 2013
19
Table-2
Actual and Predicted Values of Deposits of Case Study II
(During 1990 to 1998)
Year
Deposits
(Rs. in Crore)
Y* (Predicted Values)
Rs. in Crore
1990 15571 14713
1991 17584 16852
1992 19286 18992
1993 19517 21131
1994@ 21419 23271
1995 24480 25410
1996 27522 27549
1997 31972 29689
1998 39338 31828
Table-3
Actual and Predicted Values of Investments of Case Study II (During
1990 to 1998)
Year
Investments
(Rs. in Crore)
Y* (Predicted Values)
Rs. in Crore
1990 03805 03715
1991 04638 04670
1992 05290 05625
1993 05570 06579
1994@ 07295 07534
1995 08995 08489
1996 09583 09443
1997 10671 10398
1998 13030 11353
European Journal of Business and Management www.iiste.org
ISSN 2222-1905 (Paper) ISSN 2222-2839 (Online)
Vol.5, No.9, 2013
20
Table-4
Actual and Predicted Values of Advances of Case Study II
(During 1990 to 1998)
Year
Advances
(Rs. in Crore)
Y* (Predicted Values)
Rs. in Crore
1990 10152 09552
1991 11286 10484
1992 12606 11416
1993 11551 12348
1994@ 10922 13280
1995 12207 14212
1996 15595 15144
1997 18336 16076
1998 22020 17008
Table-5
Actual and Predicted Values of Fixed Assets of Case Study II
(During 1990 to 1998)
Year
Fixed Assets
(Rs. in Crore)
Y* (Predicted Values)
Rs. in Crore
1990 075 030
1991 080 100
1992 086 170
1993 094 240
1994@ 391 310
1995 400 380
1996 498 450
1997 515 520
1998 695 591

European Journal of Business and Management www.iiste.org
ISSN 2222-1905 (Paper) ISSN 2222-2839 (Online)
Vol.5, No.9, 2013
21
Table-6
Actual and Predicted Values of Interest Income of Case Study II
(During 1990 to 1998)
Year
Interest Earned
(Rs. in Crore)
Y* (Predicted Values)
Rs. in Crore
1990 1432 1498
1991 1739 1727
1992 2370 1955
1993 2086 2183
1994@ 1988 2411
1995 2338 2639
1996 2830 2867
1997 3513 3095
1998 3935 3323
Table-7
Actual and Predicted Values of Total Income of
Case Study II
(During 1990 to 1998)
Year
Total Income
(Rs. in Crore)
Y* (Predicted Values)
Rs. in Crore
1990 1546 1629
1991 1893 1905
1992 2666 2181
1993 2318 2457
1994@ 2260 2733
1995 2649 3009
1996 3311 3285
1997 4003 3561
1998 4515 3837

European Journal of Business and Management www.iiste.org
ISSN 2222-1905 (Paper) ISSN 2222-2839 (Online)
Vol.5, No.9, 2013
22
Table-8
Actual and Predicted Values of Interest Expenditure of Case Study II
(During 1990 to 1998)
Year
Interest Expenditure
(Rs. in Crore)
Y* (Predicted Values)
Rs. in Crore
1990 1189 1273
1991 1482 1390
1992 1845 1508
1993 1665 1625
1994@ 1461 1742
1995 1557 1859
1996 1938 1977
1997 2373 2094
1998 2651 2211
Table-9
Actual and Predicted Values of Total Expenditure of Case Study II
(During 1990 to 1998)
Year
Total Expenditure
(Rs. in Crore)
Y* (Predicted Values)
Rs. in Crore
1990 1528 1604
1991 1870 1812
1992 2338 2020
1993 2210 2228
1994@ 2055 2436
1995 2332 2644
1996 2837 2852
1997 3424 3059
1998 3818 3267

European Journal of Business and Management www.iiste.org
ISSN 2222-1905 (Paper) ISSN 2222-2839 (Online)
Vol.5, No.9, 2013
23
Table-10
Actual and Predicted Values of Net Profit of Case
Study II
(During 1990 to 1998)
Year
Net Profit
(Rs. in Crore) Y* (Predicted Values) Rs. in Crore
1990 018 (-) 018
1991 023 017
1992 057 052
1993 (-) 003 088
1994@ (-) 010 123
1995 050 159
1996 276 194
1997 360 230
1998 364 266
Table-11
Actual and Predicted Values of Total Assets of Case Study II
(During 1990 to 1998)
Year
Total Assets
(Rs. in Crore)
Y* (Predicted Values)
Rs. in Crore
1990 17116 17414
1991 19690 20010
1992 23300 22607
1993 23178 25203
1994@ 25485 27799
1995 30158 30396
1996 33145 32992
1997 37945 35589
1998 42172 38185

European Journal of Business and Management www.iiste.org
ISSN 2222-1905 (Paper) ISSN 2222-2839 (Online)
Vol.5, No.9, 2013
24
Table 12
Changes in Average Value of Capital and its Variability in Sample Merged Bank
S.
No Name of the Bank
Mean
t Value Growth Rate Before After
1
Capital
389.21
(148.93)
974.71
(616.3) 3.01 150%
2
Deposits
17989.91
(2779.03)
28946.85
(4952.94)
3.10
61%
3
Investment
4826.48
(859.52)
9915.19
(2008.67)
3.82
105%
4
Advances
11399.01
(1750.46)
15816.60
(3148.56)
2.75
39%
5
Fixed Assets
83.99
(31.49)
500.27
(169.22)
3.62
496%
6
Interest Earned
1907.19
(464.45)
2921.35
(628.71)
2.39
53%
7
Total Income
2106.20
(548.69)
3348.11
(741.07)
2.38
59%
8
Interest Expenditure
1545.73
(331.17)
1996.42
(367.15)
1.65*
29%
9
Total Expenditure
1986.88
(405.76)
2893.62
(559.30)
2.32
46%
10
Net Profit
-33.19
(19.29)
159.30
(171.92)
4.21
580%
11
Total Assets
20821.38
(3008.20)
33781.53
(5915.49) 3.28 62%
@Figures in bracket are Standard Deviation. *insignificant

European Journal of Business and Management www.iiste.org
ISSN 2222-1905 (Paper) ISSN 2222-2839 (Online)
Vol.5, No.9, 2013
25
Figure-1
Capital and its Predicted Values in Case Study II
Figure-2
Deposits and its Predicted Values in Case Study II
Figure-3
Investments and its Predicted Values in Case Study II
Capital
0.00
500.00
1000.00
1500.00
2000.00
2500.00
1988 1990 1992 1994 1996 1998 2000
Fiscal Year
Rs. in
Cro
re
Actual Values Predicted Values
Deposits
0.00
5000.00
10000.00
15000.00
20000.00
25000.00
30000.00
35000.00
40000.00
45000.00
1988 1990 1992 1994 1996 1998 2000Fiscal Year
Rs. in
Cro
re
Actual Values Predicted Values
Investments
0.00
2000.00
4000.00
6000.00
8000.00
10000.00
12000.00
14000.00
1988 1990 1992 1994 1996 1998 2000
Fiscal Year
Rs. in
Cro
re
Actual Values Predicted Values

European Journal of Business and Management www.iiste.org
ISSN 2222-1905 (Paper) ISSN 2222-2839 (Online)
Vol.5, No.9, 2013
26
Figure-4
Advances and its Predicted Values in Case Study II
Figure-5
Fixed Assets and its Predicted Values in Case Study II
Advances
0.00
5000.00
10000.00
15000.00
20000.00
25000.00
1988 1990 1992 1994 1996 1998 2000
Fiscal Year
Rs. in
Cro
re
Actual Values Predicted Values
Fixed Assets
0.00
100.00
200.00
300.00
400.00
500.00
600.00
700.00
800.00
1988 1990 1992 1994 1996 1998 2000
Fiscal Year
Rs. in
Cro
re
Actual Values Predicted Values

European Journal of Business and Management www.iiste.org
ISSN 2222-1905 (Paper) ISSN 2222-2839 (Online)
Vol.5, No.9, 2013
27
Figure-6
Interest Income and its Predicted Values in Case Study II
Figure-7
Total Income and its Predicted Values in Case Study II
Figure-8
Interest Expenditure and its Predicted Values in Case Study II
Interest Earned
0.00
500.00
1000.00
1500.00
2000.00
2500.00
3000.00
3500.00
4000.00
4500.00
1988 1990 1992 1994 1996 1998 2000Fiscal Year
Rs. in
Cro
re
Actual Values Predicted Values
Total Income
0.00
500.00
1000.00
1500.00
2000.00
2500.00
3000.00
3500.00
4000.00
4500.00
5000.00
1988 1990 1992 1994 1996 1998 2000Fiscal Year
Rs. in
Cro
re
Actual Values Predicted Values
Interest Paid
0.00
500.00
1000.00
1500.00
2000.00
2500.00
3000.00
1988 1990 1992 1994 1996 1998 2000Fiscal Year
Rs. in
Cro
re
Actual Values Predicted Values

European Journal of Business and Management www.iiste.org
ISSN 2222-1905 (Paper) ISSN 2222-2839 (Online)
Vol.5, No.9, 2013
28
Figure-9
Total Expenditure and its Predicted Values in Case Study II
Figure-10
Net Profit and its Predicted Values in Case Study II
Figure-11
Total Assets and its Predicted Values in Case Study II
Total Expenditure
0.00
500.00
1000.00
1500.00
2000.00
2500.00
3000.00
3500.00
4000.00
4500.00
1988 1990 1992 1994 1996 1998 2000
Fiscal Year
Rs. in
Cro
re
Actual Values Predicted Values
Profit
-300.00
-200.00
-100.00
0.00
100.00
200.00
300.00
400.00
1988 1990 1992 1994 1996 1998 2000
Fiscal Year
Rs. in
Cro
re
Actual Values Predicted Values
Total Assets
0.00
5000.00
10000.00
15000.00
20000.00
25000.00
30000.00
35000.00
40000.00
45000.00
1988 1990 1992 1994 1996 1998 2000Fiscal Year
Rs. in
Cro
re
Actual Values Predicted Values

This academic article was published by The International Institute for Science,
Technology and Education (IISTE). The IISTE is a pioneer in the Open Access
Publishing service based in the U.S. and Europe. The aim of the institute is
Accelerating Global Knowledge Sharing.
More information about the publisher can be found in the IISTE’s homepage:
http://www.iiste.org
CALL FOR PAPERS
The IISTE is currently hosting more than 30 peer-reviewed academic journals and
collaborating with academic institutions around the world. There’s no deadline for
submission. Prospective authors of IISTE journals can find the submission
instruction on the following page: http://www.iiste.org/Journals/
The IISTE editorial team promises to the review and publish all the qualified
submissions in a fast manner. All the journals articles are available online to the
readers all over the world without financial, legal, or technical barriers other than
those inseparable from gaining access to the internet itself. Printed version of the
journals is also available upon request of readers and authors.
IISTE Knowledge Sharing Partners
EBSCO, Index Copernicus, Ulrich's Periodicals Directory, JournalTOCS, PKP Open
Archives Harvester, Bielefeld Academic Search Engine, Elektronische
Zeitschriftenbibliothek EZB, Open J-Gate, OCLC WorldCat, Universe Digtial
Library , NewJour, Google Scholar