Embed Size (px)
Citation preview

MENA HealthcareSector Report | 18 September, 2013
MENA HealthcareNo Better Time to be Overweight
S e c t o r C o v e r a g e
S e p t e m b e r 1 8 2 0 1 3
Mohammad Kamal [email protected] +9714 507 1743
Dahlia Sabaayon, CFA Arqaam Capital Research Offshore s.a.l
MENA Healthcare No better time to be overweight
Lifestyle-related diseases are highly prevalent in MENA, and particularly in KSA and the UAE: sedentary lifestyles and poor dietary habits linked to diabetes, cardiovascular diseases, and cancer have rendered KSA and UAE exposed to elevated incidence rates of key diseases. As a general data point, the obesity rate among Saudi adults, according to the WHO, is 3x the global rate, on par with the US (36%) and ahead of MENA (<30%). The UAE faces a similar situation, with 36% of the population classified as obese. Perhaps most striking is the incidence of diabetes among young (<39) residents in KSA, which stands at >2x the US rate at 32% of the overall diabetic population (14% US).
Chronic underinvestment and over-expenditure: The KSA bed/1,000 ratio of 2.2 (1.7 beds provided by the government, 0.5 by the private sector) is below the global average of 3.0, and far below the average of 5.5 in developed countries. The UAE is structurally similar, at 1.9 beds/1,000 in 2011. National spending on healthcare in KSA and UAE has been between 4.0% and 2.5% of GDP over the past 5 years, roughly in-line with the MENA average, but low by developed market standards (18% in the US, 11% in France and Germany, 8% in the UK). Conversely, the expenditure on medical treatments abroad for KSA and UAE nationals has cost both countries an average of USD 5bn in the past 10 years, as a consequence of insufficient domestic healthcare infrastructure and a shortage of qualified specialised doctors. Healthcare policy in both countries has stimulated private sector investment in capacity, while new regulation regarding insurance cover should prove a sizable catalyst. A combination of (i) reforms, (ii) public spending packages, and (iii) special lending terms targeting new medical facilities have spurred private sector participation. In the UAE, the introduction of mandatory health cover in Abu Dhabi in 2007 catalysed a 4x growth in inpatient claims, and 8x in outpatients. Dubai and the Northern Emirates are due to follow suit, releasing 50% in additional insured patients which to date have met treatment costs out-of-pocket. Discounted valuation despite superior quality: We are positive on NMC UH (Buy, GBp 440), MOUWASAT AB (Buy, SAR 103) and DALLAH AB (Buy, SAR 88). We find fundamentals priced in at current price for CARE AB (Hold, SAR 48) and ANH LN (Hold, GBp 840). KSA and UAE healthcare plays offer value in an EM context, as the sector trades at a 20% discount to EM peer fwd P/E, while generating stronger equity returns (1.5x), a 500bps EBITDA margin differential, and industry ROIC that is 6% higher on average. Risks: Geopolitics, sufficiency of government spending packages, and adoption of key regulation.
Bloomberg code MOUWASAT AB
Company name Al Mouwasat Medical Services Company Price target SAR 103
Rating 30% upside, Buy
Bloomberg code DALLAH AB Company name Dallah Healthcare Holding Company
Price target SAR 88
Rating 40% upside, Buy
Bloomberg code NMC LN Company name NMC Health
Price target GBp 440
Rating 40% upside, Buy
Bloomberg code CARE AB Company name National Medical Care Company
Price target SAR 48
Rating 12% downside, Hold
Bloomberg code ANH LN Company name Al Noor Hospitals Group
Price target GBp 840
Rating 0% upside, Hold
© Copyright 2013, Arqaam Capital Limited. All Rights Reserved. See Important Notice.
Summary of recommendations

September 18 2013
MENA – Healthcare and Pharmaceuticals
Healthcare and Pharmaceuticals © Copyright 2013, Arqaam Capital Limited. All Rights Reserved. See Important Notice. 2
Contents Summary of recommendations ....................................................................................... 3
Key Performance Indicators ............................................................................................ 4
Valuation: ........................................................................................................................ 5
KSA and UAE Healthcare ................................................................................................. 6
The healthcare opportunity in KSA ................................................................................. 7
Key private healthcare groups in KSA ........................................................................... 13
The healthcare opportunity in the UAE ........................................................................ 14
Key UAE healthcare indicators ...................................................................................... 20
Al Mouwasat Medical Services Co................................................................................. 21
Dallah Healthcare Holding Co........................................................................................ 30
NMC Health ................................................................................................................... 39
National Medical Care Co. ............................................................................................. 50
Al Noor Hospitals Group ................................................................................................ 59

September 18 2013
MENA – Healthcare and Pharmaceuticals
Healthcare and Pharmaceuticals © Copyright 2013, Arqaam Capital Limited. All Rights Reserved. See Important Notice. 3
Summary of recommendations
Exhibit 1: Summary of recommendations
Company Price target Rating Up (down) side ADTV, USDmn EV*, USDmn Index Free float
Dallah Healthcare SAR 88 Buy 40% 11.7 707.1 SASEIDX 37.9%
Mouwasat SAR 103 Buy 30% 3.4 1,099.4 SASEIDX 43.8%
National Medical Care SAR 48 Hold (12%) 12.5 607.4 SASEIDX 38.3%
NMC Health GBp 440 Buy 40% 0.6 983.4 ASX 33.0%
Al Noor Hospitals Group Plc GBp 840 Hold 0% 0.8 1,012.8 ASX 29.1%
Company EV/EBITDA FY 14e P/E FY 13e P/E FY 14e P/E FY 15e P/B FY 13e RoE Div yield
Dallah Healthcare 14.0x 26.0x 19.3x 15.7x 2.5x 10% 1.7%
Mouwasat 12.2x 18.1x 15.2x 14.2x 4.1x 23% 1.7%
National Medical Care 15.7x 24.8x 23.4x 20.9x 2.9x 12% 2.2%
NMC Health 9.8x 13.7x 12.7x 11.5x 2.4x 18% 1.5%
Al Noor Hospitals Group Plc 10.0x 23.5x 17.5x 17.2x 8.8x 37% 1.7%
Source: Company Data, Arqaam Capital Research *at recent market prices
Dallah Healthcare (Buy, SAR 88): direct exposure to premium segment of KSA private healthcare sector. 2x expansion in bed capacity should translate into FY 13-18e EPS CAGR of 20%, which is further supported by double-digit growth in pharmaceuticals business (17% 5-yr revenue CAGR). Current market valuation implies 15% discount to EM peers on FY 14/15e EPS. We believe the market is overlooking the role of bed capacity growth on EPS at current multiples. We initiate with a Buy rating and SAR 88 FVE.
Mouwasat (Buy, SAR 103): unique positioning vis-a-vis KSA oil industry communities. Key growth catalysts overlooked at current valuation: 85% bed capacity increase over 5 years, roll out of facilities in dense, underserviced urban centers (Riyadh), and upward re-pricing of agreements with insurers. Mouwasat currently trades at 15.2x FY 14e EPS vs. 17.6x and 19.3x for regional and local peers, implying discounts of 15% and 20%, respectively. We believe the stock should re-rate and trade in-line with sector multiples, at the very least. We initiate with a Buy rating and SAR 103 FVE.
NMC Health (Buy, GBp 440): Well-positioned for mandatory health cover in Dubai & Northern Emirates, bed capacity in utilization should improve as a result. Bed capacity roll-out (+100%) should drive revenue CAGR of 16%. NMC holds the cheapest valuation profile within our healthcare coverage space (12.7x FY 14e EPS, 9.8x EV/EBITDA), despite superior healthcare EBITDA margins of 28% (vs. 25% regional peers, 20% EM). We value NMC at GBp 440/share, implying c. 40% in upside potential from current price, using DCF, and initiate with Buy.
National Medical Care- CARE (Hold, SAR 48): Pure play on the middle income segment of the Saudi healthcare sector. 48% bed capacity additions to bolster market share, going forward, and support 5-yr revenue CAGR of 9% on a rise in inpatient as well as outpatient visitation. Valuation: We initiate with a Hold recommendation and SAR 48 FVE. At 23.4x FY 14e EPS, CARE trades at 35% and 20% premiums to regional and local peers. Valuations are stretched but tolerable, given the business’s strong domestic positioning (16% Riyadh market share in FY 14e).
Al Noor Hospitals (Hold, GBp 840): Leading private healthcare provider in Abu Dhabi, dominant share of inpatient (39%) and outpatient (35%) market. Modest revenue growth outlook (5% CAGR 5-yr), medical staff costs to impact margins. Market valuation adequately captures fundamentals at c. 24x/18x FY 13e/14e P/E. We initiate coverage with Hold and GBp 840 FVE.

September 18 2013
MENA – Healthcare and Pharmaceuticals
Healthcare and Pharmaceuticals © Copyright 2013, Arqaam Capital Limited. All Rights Reserved. See Important Notice. 4
Key Performance Indicators
Exhibit 2: Summary of key operating and performance indicators across the UAE and KSA healthcare coverage space
NMC Dallah Mouwasat CARE Noor
Operations
Location- country UAE KSA KSA KSA UAE
Location-city Abu Dhabi, Dubai, Sharjah Riyadh Eastern province, Riyadh (FY 13e) Riyadh Abu Dhabi, Oman
Number of hospitals 7 2 6 2 3
Number of clinic centers na 284 376 175 na
Number of other centers 3 na 2 dispensaries 4 dispensaries 12 medical centers
Obstetrics Y Y N N N
Paediatrics N Y N N N
Owns land under premises? N Y Y Y N
bed count 230 352 594 420 225
bed count incoming, % 109% 105% 83% 48% 0%
Doctors employed 382 113 429 237 434
Inpatient capacity/annum
57,693
52,539
86,724
24,795
45,880
outpatients treated, FY 12A
1,853,655
684,000
1,550,835
523,258
1,505,518
Outpatients/doctor
4,853
6,053
3,615
2,208
3,469
Pharmaceuticals capability? Y Y Y Y N
Pharmaceuticals/revenues 11% 8% 19% 21% na
Other ancillary? O&M O&M N MDU Y
Other ancillary % revenues 1% 3% na 3% 3%
Revenues and receivables
Insured patients, % of revenues 82% 46% 40% 34% 91%
Direct payment patients, % of revenues
18% 20% 40% 33% 9%
Govt entities, % of revenues 60% 3% 40% 20% 70%
Top 5 clients >40% revenues Y N Y Y Y
Receivables days
130 92 99 134 93
working capital/revenues 39% 22% 21% 32% 12%
Returns, growth and margins
RoE 18% 10% 23% 12% 37%
Rev CAGR 12% 16% 13% 9% 5%
EPS CAGR 15% 20% 15% 10% 8%
D/E 84% 4% 19% 12% 0%
GPM (%) 35% 42% 48% 24% 41%
EBITDAM (%) 17%* 22% 30% 24% 20%
NPM (%) 13%* 15% 23% 17% 17%
Source: Company Data, Arqaam Capital Research *Blended

September 18 2013
MENA – Healthcare and Pharmaceuticals
Healthcare and Pharmaceuticals © Copyright 2013, Arqaam Capital Limited. All Rights Reserved. See Important Notice. 5
Valuation: sector valuation undemanding in EM context, catalysts
support 14% EPS CAGR and 20% average RoE, vs. 15% EM
Valuation across the UAE and KSA healthcare space is undemanding at 17.6x/15.9x FY 14e P/E,
12.3x/11.1x EV/EBITDA, as the sector continues to trade at a discount to EM comparables (21.5x/18.5x FY
14e/15e P/E, 12.9x/14.1x FY 14e/15e EV/EBITDA). This is despite (i) markedly better margin profiles on
aggregate (EBITDA margin 25% vs. 20%, net margins 20% vs. 15%), on a combination of higher operating
leverage and lower financial leverage, (ii) better RoE profiles (20% vs. 15%, and particularly in the UAE at
a 28% average) and (iii) regulatory catalysts in support of growth.
Exhibit 3: Performance and valuation summary
Rev CAGR EPS CAGR EBITDA margin
Net margin
RoE Div Yield P/E EV/EBITDA
BBG code Name Country FY 13-18e FY 13-18e FY 13e FY 13e FY 13e FY 13e FY 14e FY 15e FY 14e FY 15e
DALLAH AB Dallah Healthcare Holding Co SAUDI ARABIA 16% 20% 22% 15% 10% 1.7% 19.3 15.7 14.0 11.4
MOUWASAT AB Al Mouwasat Medical Services Co SAUDI ARABIA 13% 15% 30% 23% 23% 1.7% 15.2 14.2 12.2 11.9
CARE AB National Medical Care Co SAUDI ARABIA 9% 10% 24% 17% 12% 2.2% 23.4 20.9 15.7 13.9
NMC LN NMC Health PLC UAE 12% 15% 28% 25% 18% 1.5% 12.7 11.5 9.8 8.5
ANH LN Al Noor Hospitals Group Plc UAE 5% 8% 20% 17% 37% 1.7% 17.5 17.2 10.0 9.7
Average- coverage 11% 14% 25% 20% 20% 1.8% 17.6 15.9 12.3 11.1
DALLAH AB Dallah Healthcare Holding Co SAUDI ARABIA 16% 20% 22% 15% 10% 1.7% 19.3 15.7 14.0 11.4
MOUWASAT AB Al Mouwasat Medical Services Co SAUDI ARABIA 13% 15% 30% 23% 23% 1.7% 15.2 14.2 12.2 11.9
CARE AB National Medical Care Co SAUDI ARABIA 9% 10% 24% 17% 12% 2.2% 23.4 20.9 15.7 13.9
Average- KSA 13% 15% 25% 19% 15% 1.9% 19.3 16.9 14.0 12.4
NMC LN NMC Health PLC UAE 12% 15% 28% 25% 18% 1.5% 12.7 11.5 9.8 8.5
ANH LN Al Noor Hospitals Group Plc UAE 5% 8% 20% 17% 37% 1.7% 17.5 17.2 10.0 9.7
Average- UAE 8% 12% 24% 21% 28% 1.6% 15.1 14.4 9.9 9.1
MDC SJ Equity MEDICLINIC INTERNATIONAL LTD South Africa
20% 17% 15% 1.3% 21.4 18.6 14.1 14.1
LHC SJ Equity LIFE HEALTHCARE GROUP HOLDIN South Africa
24% 19% 37% 2.9% 19.3 16.7 11.3 12.6
ODPV3 BZ Equity ODONTOPREV S.A. Brazil
21% 15% 18% 3.5% 22.1 19.9 15.2 17.6
APHS IN Equity APOLLO HOSPITALS ENTERPRISE India
14% 10% 11% 0.7% 33.5 27.3 17.3 17.3
DASA3 BZ Equity DIAGNOSTICOS DA AMERICA SA Brazil
17% 12% 5% 0.6% 16.2 14.0 8.1 9.5
RFMD SP Equity RAFFLES MEDICAL GROUP LTD Singapore
23% 18% 15% 1.4% 22.8 20.0 16.2 18.3
FLRY3 BZ Equity FLEURY SA Brazil
20% 13% 6% 2.8% 15.5 12.9 8.0 9.4
Average- EM 20% 15% 15% 1.9% 21.5 18.5 12.9 14.1
Source: Bloomberg, Company Data, Arqaam Capital Research

September 18 2013
MENA – Healthcare and Pharmaceuticals
Healthcare and Pharmaceuticals © Copyright 2013, Arqaam Capital Limited. All Rights Reserved. See Important Notice. 6
KSA and UAE Healthcare
No better time to be overweight
Hereditary and lifestyle-related diseases are highly prevalent in MENA, and particularly in KSA
and UAE: The obesity rate among Saudi adults, according to the WHO, is 3x the global rate, on par
with the US (36%) and ahead of MENA (<30%). The UAE faces a similar situation, with 36% of the
population classified as obese. The incidence of diabetes is particularly high in both countries, at
c.1.5x the US rate and 1.7x the broader MENA rate. 12% (3.4mn) of the KSA population and 16% of
the UAE population are diabetic (0.9mn), vs. 10% and 9% in the US and broader MENA, according to
the WHO. Perhaps most striking is the incidence of diabetes among young (<39) residents in KSA,
which stands at >2x the US rate at 32% of the overall diabetic population (14% US).
Chronic underinvestment, reactive over-expenditure: The KSA bed/1,000 ratio of 2.2 (1.7 beds
provided by the government, 0.5 by the private sector) is below the global average of 3.0, and far
below the average of 5.5 in developed countries. The UAE is structurally similar, at 1.9 beds/1,000 in
2011. National spending on healthcare in KSA and UAE has been between 4.0% and 2.5% of GDP
over the past 5 years, roughly in-line with the MENA average, but low by developed market
standards (18% in the US, 11% in France and Germany, 8% in the UK). Governmental hospitals still
account for the bulk (65%) of bed capacity in KSA, and 50% in UAE. Conversely, the expenditure on
medical treatments abroad for KSA and UAE nationals has cost both countries an average of USD
5bn in the past 10 years, as a consequence of insufficient domestic healthcare infrastructure and a
shortage of qualified specialised doctors.
The policy response in both countries has stimulated private sector investment in healthcare
capacity, primarily via the phased introduction of mandatory health cover. In KSA, the
government introduced a series of (i) reforms, that have mandated insurance cover for public sector
employees (both Saudi and expatriate), working in the private sector since 2011. The next leg will
address public sector employees along with their dependants, which accounts for 10% of the KSA
workforce, and 22% of the population. (ii) Public spending packages, which focus on upgrading
healthcare infrastructure and domestic medical capability, and (iii) special lending terms targeting
new medical facilities. In the UAE, the introduction of mandatory health cover in Abu Dhabi in 2007
catalysed a 4x growth in inpatient claims, and 8x in outpatients. Dubai and the Northern Emirates
are due to follow suit, releasing 50% in additional insured patients which to date have either met
treatment costs out-of-pocket or via private cover.
This in our view is an industry game-changer that will add further pressure on existing bed
capacity in the UAE, and stimulate demand for qualified medical personnel. Mandatory insurance
cover should in our view lower real treatment costs to patients, raise the volume of health
premiums written substantially for insurers, and compromise margins for healthcare providers who
typically collect a smaller proportion of dues from insurers than from out-of-pocket patients (due to
negotiated agreements with insurers). The volume upside however, is more than sufficient to drive
earnings growth and largely override the compression in margins.
We initiate coverage of 5 key healthcare plays in KSA and UAE. We are positive on NMC UH (Buy,
GBp 440), MOUWASAT AB (Buy, SAR 103) and DALLAH AB (Buy, SAR 88). We find fundamentals
priced in at current price for CARE AB (Hold, SAR 48) and ANH LN (Hold, GBp 840). KSA and UAE
healthcare plays offer value in an EM context, as the sector trades at a 20% discount to EM peer
fwd P/E, while generating stronger equity returns (1.5x) and a 500bps EBITDA margin differential,
on average. Risks: Geopolitics, sufficiency of government spending packages, adoption of key
regulation.

September 18 2013
MENA – Healthcare and Pharmaceuticals
Healthcare and Pharmaceuticals © Copyright 2013, Arqaam Capital Limited. All Rights Reserved. See Important Notice. 7
The healthcare opportunity in KSA
Key drivers: demographics, disease incidence, reform and capacity additions
The KSA Government aims to raise the national bed/patient ratio to 3.3/1,000
residents from 2.2 in FY 08A, by adding 44k beds by FY 17e, via a mix of public
and private facilities
Expatriates are fully covered by mandatory employer-based health insurance.
Mandatory health cover for public sector employees is expected to be rolled out
starting 2014, and represents the next leg up for demand (we estimate +50%)
1-Demographic and epidemiological trends
(i) Population growth: The KSA population base has grown at an average of
3.3%/annum (CAGR FY 08-12e), expanding by c.3.2mn residents in total. Going
forward, the IMF forecasts an overall growth rate of 9% in FY 13-17e, well-ahead
of BRICS (4%), but behind neighboring GCC countries- Qatar (17%), Oman (13%),
and UAE (13%). The UAE and Qatar have generally been larger importers of
regional human capital than KSA in the past 10 years.
Exhibit 4: KSA GDP/capita growth in line with population
growth
Source: IMF
Exhibit 5: 30% of KSA population is <15 years of age, while 5%
is > 60
Source: UNDP
(ii) The proportion of residents > 60 is rising: While Saudi Arabia holds a relatively
young population base (39% below 18, 5% above 60), the portion of elderly
residents is growing, in absolute numbers. As the overall Saudi population base
grew at an average rate of 2.2% between 1990 and 2012, the 60+ age group
expanded by 0.8mn people (+10%) between 1990 and 2012.
Algeria
Bahrain
Jordan
Tunisia
Iraq
Egypt Kuwait LebanonLibya Morocco
Oman
Qatar
KSA
Sudan
Iran
UAE
(4%)
(2%)
--%
2%
4%
6%
8%
10%
12%
14%
(6%) (4%) (2%) --% 2% 4% 6% 8%
5-year population growth
5-year GDP/capita growth
27% 20%31%
43%
23%36%
27% 24%31% 27% 27%
14%30%
40%23%
14%
59% 72% 52%
48%
62%52% 65%
55%55% 55%
64%81%
65% 49%
56%85%
14% 8%17%
10% 16% 12% 8%21%
14% 17%9% 5% 5% 11%
21%
1%
0%
20%
40%
60%
80%
100%
Alg
eri
a
Bah
rain
Egyp
t
Iraq
Iran
Jord
an
Ku
wai
t
Leb
ano
n
Lib
ya
Mo
rocc
o
Om
an
Qat
ar
KSA
Sud
an
Tun
isia
UA
E
Population breakdown by age (FY 12)
< 15 years 15-60 years > 60 years

September 18 2013
MENA – Healthcare and Pharmaceuticals
Healthcare and Pharmaceuticals © Copyright 2013, Arqaam Capital Limited. All Rights Reserved. See Important Notice. 8
(iii) Lifestyle-related disease incidence: sedentary lifestyles, given regional weather
conditions that prohibit extensive outdoor activity, and poor dietary habits linked
to diabetes, cardiovascular diseases, and cancer have rendered KSA exposed to
elevated incidence rates of lifestyle-related diseases. As per data from the World
Health Organisation (WHO), the obesity rate among Saudi adults is 35% (vs. 11%
global, 36% US, <30% MENA), while around 37% of adults have elevated
cholesterol levels (vs. 39% global, 48% US, 40% MENA), and 12% or 3.4mn people
are diabetic (vs. 10% US, 9% MENA). The incidence rate of diabetes among young
(<39 year old) residents however, is particularly high, at 32% (vs. 14% US) of the
overall diabetic population.
Exhibit 6: The 60+ demographic is expected to reach 8% of the
KSA population base by FY 20e
Source: BMI
Exhibit 7: 12% of the KSA population is diabetic, well ahead of
MENA (9%) and the US (10%)
Source: WHO
Exhibit 8: 32% of diabetic patients are <39 years of age
Source: WHO
Exhibit 9: The KSA obesity rate of 35% is among the highest
globally (MENA 30%, global 11%)
Source: WHO
51% 51% 48% 43% 41% 39% 37% 37%
34% 33% 34%36% 39% 38% 38% 34%
11% 12% 13% 17% 16% 18% 19% 21%
0%
20%
40%
60%
80%
100%
120%
FY 90A FY 95A FY 00A FY 05A FY 10A FY 12A FY 15e FY 20e
KSA population breakdown by age
0-19 20-39 40-59 60-75+
16%
12% 12%
10% 9%
5%
9%10%
0%
2%
4%
6%
8%
10%
12%
14%
16%
18%
UAE KSA Lebanon Kuwait Egypt Jordan MENA US
Diabetic incidence as a % of total population
23% 19%35%
11%
32%40%
14%
49%50%
52%
47%
51%
55%
44%
28% 31%
13%
42%
16%5%
42%
0%
10%
20%
30%
40%
50%
60%
70%
80%
90%
100%
Egypt Jordan Kuwait Lebanon KSA UAE USA
Diabetes patients age structure
20-39 40-59 60-79
45%
36% 36% 35% 35% 34%
28%30%
11%
0%
5%
10%
15%
20%
25%
30%
35%
40%
45%
50%
Kuwait UAE US KSA Egypt Jordan Lebanon MENA Global
Obesity rates

September 18 2013
MENA – Healthcare and Pharmaceuticals
Healthcare and Pharmaceuticals © Copyright 2013, Arqaam Capital Limited. All Rights Reserved. See Important Notice. 9
2-Regulation and government spending as a supply–side catalyst
(i) Reform
Major structural changes have positively impacted the healthcare sector in Saudi Arabia over
the past decade. Healthcare reform has been focused on solutions that address rapidly
growing demand, while concurrently effecting improvements to the quality of healthcare
services provided by the public and private sectors. Key reform steps in the past 10 years have
been:
The enforcement of mandatory health insurance for expatriates and nationals
working in the private sector. Introduced a decade ago, this package of reforms
catalysed corporate/private sector demand for healthcare services.
Public spending packages on core healthcare needs: In 2012, the Saudi Government
allocated SAR 61bn (USD 16bn) towards health services and social development, up
from SAR 52bn a year earlier. This accounted for c. 70% of total healthcare
expenditure and constituted 9% of overall government spending. This has helped in:
(i) establishing medical universities and research facilities, (ii) increasing the breadth
and coverage of childhood vaccination programs, and (iii) improving the quality and
availability of care for pregnant mothers and newborns. Life expectancy in the country
has consequently risen to 74 years (vs. 64 in 1990) and infant mortality has dropped
significantly (17 per 1,000 from 26 previously), as of 2010.
Nevertheless, supply shortages remain massive. The KSA bed/patient ratio of 2.2 (1.7 beds
provided by the government, 0.5 by the private sector) is below the global the average of 3.0,
and far below the average of 5.5 in developed countries. As such, we believe that the
structural deficit in healthcare infrastructure prevalent in KSA will continue to (i) require
substantial budget allocations over the next 10 years, (ii) experience continued reform, and (iii)
experience a substantial upgrade in the quality and availability of healthcare services.
Exhibit 10: 2.2 beds per 1,000 patients is low vs. developed
markets
Source: World Bank
Exhibit 11: KSA healthcare per capita expenditure is well-below
global levels (-c.30%)
Source: BMI, OECD Health data
8.3
6.6
3.0 3.0
2.2 2.1 1.9
0
1
2
3
4
5
6
7
8
9
Germany France US UK KSA MENA UAE
Hospital beds per 1,000
3,537
2,373
1,640
1,030 758 709
209 99
-
500
1,000
1,500
2,000
2,500
3,000
3,500
4,000
US Europe UAE Global KSA Western Pacific Eastern Mediterranean
Africa
Healthcare expenditure per capita FY 11A (USD)
September 18 2013
MENA – Healthcare and Pharmaceuticals
Healthcare and Pharmaceuticals © Copyright 2013, Arqaam Capital Limited. All Rights Reserved. See Important Notice. 10
(ii) Mandatory health insurance cover for public sector employees
Phased introduction of mandatory health cover: Towards the end of the 1990s, the Saudi
government rolled out a health insurance system over 3 key phases. More than a decade
following the introduction of mandatory healthcare insurance, the first leg of a 3-phased
health insurance system was completed by 2011.
Phase 1: Covering expatriate workers and their dependents, in addition to Saudi
nationals working in the private sector
Phase 2: Covering public sector employees
Phase 3: Covering other groups, including pilgrims visiting the holy cities.
The implementation of Phase 1 in 2007-12 was instrumental in unlocking demand for
healthcare services in KSA. As insurance policy holders rose 4x to approximately 8.4mn (7mn
expats and 1.4mn Saudi nationals) in 2007-12, aggregate health insurance premiums spiked
from SAR c. 3.1bn in FY 07A to SAR 11.2bn in FY12A. The largest gainers in terms of market
share were Tawuniya 32% (Buy, SAR 37), and Medgulf 22% (Hold, SAR 26), and Bupa 20%
(Hold, SAR 34) which combined have emerged as leaders in the Saudi health insurance market.
Please refer to our coverage of GCC Insurers – Selection is Key, published July 4, 2013.
Phase 2 of the KSA health insurance regulatory system, which mandates cover for public
sector employees with their dependants by insurance providers, is in our view the next leg of
the KSA opportunity healthcare providers, as well as insurers. Public sector employees with
their dependants (10% of workforce, 22% population) have recourse to healthcare services via
the system of public hospitals in the Kingdom. But the opportunity, in our view, is also within
the network of private sector healthcare providers. Given new cover by private insurance
providers, demand for private healthcare in KSA should grow exponentially, albeit from a very
low base. As per SAMA data, the number of Saudi nationals employed in the public sector
stood at 1mn (with 5mn dependants) in FY 11A. Assuming an average health premium of SAR
1,000, the implementation of phase 2 would release c.SAR 6.0bn in new premiums written
(+55% growth vs. FY 12A). We expect this to translate into a 50% rise in the number of patients
seeking treatment within the private healthcare sector of Saudi Arabia.
(iii) Soft loans from the Ministry of Finance to fund private sector capacity roll out
Credit ceiling for soft loans raised in 2011: Given that the initial investment necessary to
acquire a land plot to build a hospital in the vicinity of a major city in KSA is sizable, the Saudi
Ministry of Finance raised the credit ceiling imposed on soft loans offered to the private
healthcare sector to SAR 200mn (vs. SAR 50mn previously), in 2011. Soft loans can be used to
finance up to 50% of the setup cost of a new hospital, covering construction, land acquisition,
medical equipment and maintenance. Soft loans are currently interest-free and typically
offered at 25-yr tenors and 5-yr grace periods. As per SAMA data, the KSA Ministry of Finance
has so far issued 143 loans towards healthcare projects, totalling SAR 2.5bn (USD 680mn) in FY
11A, ( 7% CAGR in FY 07-11A).

September 18 2013
MENA – Healthcare and Pharmaceuticals
Healthcare and Pharmaceuticals © Copyright 2013, Arqaam Capital Limited. All Rights Reserved. See Important Notice. 11
Sizing the impact- soft loans alone to produce 3k new beds (+5%): Assuming an average
development cost/bed of SAR 1.5mn, we believe a medium size hospital in a prime urban
location in KSA runs a development bill of c.SAR 300mn. As the lower of either SAR 200mn or
50% of the total cost of a facility can be financed through a soft loan from the MoF, we
estimate that if an equivalent (SAR 2.5bn) book of loans is issued over the next 5 years, this
should produce an additional 15 hospitals (3k beds) by 2017e, raising the bed/patient ratio to
2.3 (+5% vs. today’s 2.2).
Exhibit 12: Healthcare insurance premiums issued in KSA have
risen at a CAGR of c.30% since FY 07A, driven by
regulation stipulating mandatory health cover
Source: SAMA
Exhibit 13: Government funding of private health projects: 143
loans, SAR 2.5bn issued since 2007
Source: SAMA
3- A closer look at government spending on healthcare services
Government spending remains the primary source of industry capacity growth: National
spending on healthcare has varied between 3.0% and 4.0% (of GDP) over the past 5 years,
largely in line with the regional average, but low by developed market standards (18% in the
US, 11% in France and Germany, 8% in the UK). Though public spending on healthcare by the
government has fluctuated, it remains the main source of healthcare financing, accounting for
c. 70% of total expenditure in 2012. Governmental hospitals still constitute more than 65% of
total hospital beds in the Kingdom.
Exhibit 14: KSA government healthcare spend
Source: SAMA, IMF
Exhibit 15: Public healthcare spending vs. private
Source: SAMA
3.1
4.8
7.3
8.7
9.7
11.2
0.0
2.0
4.0
6.0
8.0
10.0
12.0
FY 07A FY 08A FY 09A FY 10A FY 11A FY 12A
Medical Insurance Premiums in KSA (SAR bn)
1,962
2,195 2,358
2,536 2,536
-
20
40
60
80
100
120
140
160
-
500
1,000
1,500
2,000
2,500
3,000
FY 07A FY 08A FY 09A FY 10A FY 11A
(SAR mn)
Soft loans for health projects Number of loans
34.4
40.4
46.6
52.4
61.0
0.0%
0.5%
1.0%
1.5%
2.0%
2.5%
3.0%
3.5%
4.0%
4.5%
0.0
10.0
20.0
30.0
40.0
50.0
60.0
70.0
FY 08A FY 09A FY 10A FY 11A FY 12A
(SAR bn)
Healthcare spending As a percentage of GDP
67% 66% 66% 69% 70%
33% 34% 34% 31% 30%
0%
20%
40%
60%
80%
100%
120%
FY 08A FY 09A FY 10A FY 11A FY 12A
Public spending Private spending

September 18 2013
MENA – Healthcare and Pharmaceuticals
Healthcare and Pharmaceuticals © Copyright 2013, Arqaam Capital Limited. All Rights Reserved. See Important Notice. 12
As per the KSA government’s 9th Development Plan for 2010-2014, KSA aims to raise the
hospital bed/patient ratio to 3.3 per 1,000 from 2.2 in FY 08A (vs. 3.0 US, 8.3 Germany, 2.1
MENA). With the country’s population expected to reach 30mn by next year, the initial plan
mandated the addition of 44k beds (34k government and 10K private) by 2014, reflecting an
80% growth in the total bed capacity of the country vs. 2008. We currently find the plan
ambitious and unlikely to be met by 2014, as 10k beds (or +20%) have been introduced over
the past 3-4 years, leaving a huge pipeline due over the next 18 months. The private sector’s
share of the industry has remained unchanged at c.22% since 2011, while we estimate its share
of new capacity at around 25%.
Exhibit 16: 52 hospital added since 2006, of which 9 are private
Source: CARE and MoH
Exhibit 17: 19% overall growth in bed count since 2008
Source: CARE and MoH
218 225 231 244 249 261
39 39 39 39 39 39
127 123 123 125 127136
0
50
100
150
200
250
300
350
400
450
500
FY 06A FY 07A FY 08A FY 09A FY 10A FY 11A
Hospitals by sector
Ministry of health hospitals Other Gov. Hospitals Private hospitals
31 31 32 33 34 38
10 11 11 11 11 12
13 11 11 12 13
14
-
10
20
30
40
50
60
70
FY 06A FY 07A FY 08A FY 09A FY 10A FY 11A
Beds by sector ('000)
Ministry of health hospitals Other Gov. Hospitals Private hospitals

September 18 2013
MENA – Healthcare and Pharmaceuticals
Healthcare and Pharmaceuticals © Copyright 2013, Arqaam Capital Limited. All Rights Reserved. See Important Notice. 13
Key private healthcare groups in KSA
Exhibit 18: KSA outpatient visits by sector
Source: CARE prospectus Arqaam Capital Research
Exhibit 19: KSA inpatient visits by sector
Source: CARE prospectus Arqaam Capital Research
Exhibit 20: Top 10 private hospitals in Riyadh
Hospitals No. of
beds Market
share Specialty
Dr. Sulaiman Al-Habib Medical Group
655
18% Pediatrics, obstetrics & gynecology, IVF, orthopaedics, ophthalmology, dermatology, plastic
surgery
National Medical Care Company
420 12% Pediatrics, obstetrics & gynecology, orthopaedics, ophthalmology, dermatology
Dallah Hospital
400 11% Pediatrics, obstetrics & gynecology, IVF, orthopaedics, ophthalmology, cardiology
Specialized Medical Center Hospital
400 11% Ophthalmology, pediatrics, cardiology, dermatology, dentistry, and internal medicine
Saudi German Hospital Riyadh
300 8% Cardiology, neurology & neurosurgery, opthalmology, orthopaedics and traumatology
Al Hammadi Hospital
275 8% Obstetrics & gynecology, cardiology, orthopaedics, dermatology, pediatrics
Kingdom Hospital Consulting Clinics
125 3% Surgical & medical obesity, anesthesiology, dentistry
Dr Abdul Rahman Al-Mishari Hospital
122
3% Nursery & neonatal intensive care, obstetrics & gynecology, pediatrics
Al-Mouwasat Hospital
120 3% Pediatrics, obstetrics & gynecology, IVF, orthopaedics, ophthalmology, cardiology
Obeid Specialized Hospital
120 3% Pediatrics, ophthalmology, cardiology, dermatology, gastroenterology, dentistry
Others
708 19%
Total
3,645 100%
Source: Company Data, Arqaam Capital Research
Private inpatient visits,
91%
Public inpatient visits, 9%
FY 10A
Private outpatient visits, 86%
Public outpatient visits, 14%
FY 10A

September 18 2013
MENA – Healthcare and Pharmaceuticals
Healthcare and Pharmaceuticals © Copyright 2013, Arqaam Capital Limited. All Rights Reserved. See Important Notice. 14
The healthcare opportunity in the UAE
Drivers: Demographics, sedentary lifestyles, rising health awareness, shortages in
specialised services, the introduction of mandatory health insurance
Healthcare indicators are generally good in the UAE, but there exists evidence of a rapid
increase in lifestyle diseases (diabetes and obesity) over the past 10 years. The UAE
Ministry of Health-MOH is due to expand health programmes and introduce new
measures aiming at reducing mortality rates
The MOH will address the need to expand healthcare infrastructure over the next 5
years. Shortages exist in (i) bed supply and clinics (UAE bed/patient ratio 1.9 vs 2.1
MENA, 3.0 US) and (ii) specialised doctors (physician/patient 1.9/1000). The UAE
Government has encouraged private participation through PPP programs
The Abu Dhabi population is fully covered by mandatory employer-based health
insurance. Dubai is expected to introduce a similar scheme by the end of 2013.
Mandatory health cover is expected to be rolled out across remaining emirates going
forward
Mandatory insurance cover will catalyse demand and prompt substantial new supply-
we estimate 40% growth in bed count by 2018. (including AD)
1-Demographics and epidemiological trends
Population growth: The UAE population will expand by an annual average of 3% over the
coming 5 years, reaching 6.4mn in FY 17e (an aggregate increase of 0.8 mn). Major age groups
(0-14 and 15-64 years) will expand markedly, whereas the 65+ segment will account for only
1.1% of total population by FY 17e. As opposed to KSA, we believe the UAE will face no
material pressure from an aging population, as expatriates (85% of the workforce) typically
leave the country upon retirement.
Rising incidence of lifestyle-related diseases: Lifestyles, environmental conditions and
dietary habits have been the major causes for diabetes, cardiovascular diseases, and cancer in
the UAE. 36% of the UAE population is obese, as per data from the WHO (vs. 11% global, 36%
US, 30% MENA), 27% of adults have elevated cholesterol levels (vs. 39% global, 48% US, 40%
MENA), and 16% or 0.9mn people are diabetic (vs. 10% US, 9% MENA).
Exhibit 21: UAE Population to grow at c. 3% annually
...............................
Source: World Bank, BMI
Exhibit 22: 1% of overall population is >60, but segment growth >10% 5-
yr CAGR
Source: BMI
5.1 5.2 5.4 5.5 5.7 5.9 6.0 6.2 6.4
2.0%
2.5%
3.0%
3.5%
4.0%
0.0
1.0
2.0
3.0
4.0
5.0
6.0
7.0
FY 09A FY 10A FY 11A FY 12A FY 13e FY 14e FY 15e FY 16e FY 17e
mn
UAE population Population growth (RHS)
0-14, 14%
15-60, 85%
>60, 1%
UAE population breakdown by age group

September 18 2013
MENA – Healthcare and Pharmaceuticals
Healthcare and Pharmaceuticals © Copyright 2013, Arqaam Capital Limited. All Rights Reserved. See Important Notice. 15
2-Public expenditure on healthcare infrastructure
Expenditure on healthcare in the UAE accounted for 2.0% of GDP in FY 12A (vs. 18% US, 11%
Germany, 8% UK) according to OECD Health data, down from 2.4% in FY 11A. Low healthcare
spending in previous years has stimulated demand for treatment overseas, primarily at
neighbouring countries in MENA (Jordan, Lebanon). Consequently, the UAE’s expenditure on
overseas treatment for its nationals has reached AED 15bn over the past 10 years, by our
estimates.
On the other hand, UAE per capita healthcare spending is considered high on a regional level,
at USD 1,640. This is behind Qatar (USD 1,965) and Kuwait (USD 1,671), which hold smaller
population bases, but ahead of KSA (USD 758) and Oman (USD 415).
As with KSA, public spending remains the main source of healthcare spending in the UAE,
accounting for 73% of total expenditure in FY 12A. Going forward, and as per EIU, health
expenditure is expected to double reaching USD 30bn by FY 17e as (i) the UAE Government
continues to encourage private sector participation through public/private partnerships (PPP),
and (ii) mandatory insurance cover encourages greater use of health services. Among UAE
emirates, private healthcare spending is by far the highest in Abu Dhabi, reaching USD 8.0bn in
FY 10A (vs. 2.0bn for Dubai) as the result of the implementation of mandatory health cover.
Exhibit 23: The UAE public healthcare bill is c. 2% of GDP today
…
Source: BMI, IMF
Exhibit 24: Per-capita healthcare spend is however above the
global average
Source: OECD Health data
10.211.7
12.814.3
15.717.2
18.720.4
22.0
0.0%
0.5%
1.0%
1.5%
2.0%
2.5%
3.0%
0.0
5.0
10.0
15.0
20.0
25.0
FY 09A FY 10A FY 11A FY 12A FY 13e FY 14e FY 15e FY 16e FY 17e
(USD bn)
Government spending on healthcare as a % of GDP
3,537
2,373
1,640
1,030 758 709
209 99
-
500
1,000
1,500
2,000
2,500
3,000
3,500
4,000
US Europe UAE Global KSA Western Pacific Eastern Mediterranean
Africa
Healthcare expenditure per capita FY 11A (USD)

September 18 2013
MENA – Healthcare and Pharmaceuticals
Healthcare and Pharmaceuticals © Copyright 2013, Arqaam Capital Limited. All Rights Reserved. See Important Notice. 16
3-Healthcare policy
Healthcare policy in the UAE will focus on the expansion of infrastructure (new hospitals and
clinics), and the recruitment of specialised doctors, over the next 5 years. Health authorities
in Abu Dhabi estimate the demand for an additional 1,600 beds (vs. 4,700 beds currently) over
the period. This is underscored by the fact that only 2.0 physicians are currently available in
the emirates per 1,000 residents today, and severe shortages exists specifically in the
availability of specialists in emergency care, cardiology, critical and intensive care.
Exhibit 25: Physicians/1,000 residents: UAE remains behind global average, but ahead of KSA
Source: World Bank
Exhibit 26: 1.9 beds/1,000 residents: particularly low vs. developed markets and MENA average
Source: World Bank
4-Regulatory structure
The UAE Ministry of Health (MoH) is the regulator at the federal level, while public health
services are governed by different regulatory bodies at the emirate level. The UAE is
generally transitioning from a mono-regulatory system to a more decentralised structure in
which each emirate houses an autonomous health authority, supported by its own
infrastructure of institutions.
The Health Authority of Abu Dhabi (HAAD) was established in order to administer all
public healthcare institutions in Abu Dhabi, and to improve medical standards and
regulate policies. In addition, the Abu Dhabi Health Services Company (SEHA) was
established to act as the execution arm of HAAD policies and regulations. SEHA owns
and operates 12 hospital facilities and over 40 primary healthcare clinics in Abu Dhabi.
As the main health authority for the Emirate of Dubai, the Dubai Health Authority
(DHA) was created to regulate and deliver health services in Dubai, including free
zones. DHA owns and operates a network of hospitals and healthcare medical centers.
Mandated with the same objectives as HAAD and DHA, the Emirates Health Authority (EHA) is
responsible for the Northern emirates, including Ajman, Sharjah, Ras Al Khaima, Umm al
Quwain, and Fujairah.
4.3
3.73.4
2.8
2.4
1.91.7
0.9
0
0.5
1
1.5
2
2.5
3
3.5
4
4.5
5
Russia Germany France UK US UAE Turkey KSA
Physicians per 1,000
8.3
6.6
3.0 3.0
2.2 2.1 1.9
0
1
2
3
4
5
6
7
8
9
Germany France US UK KSA MENA UAE
Hospital beds per 1,000

September 18 2013
MENA – Healthcare and Pharmaceuticals
Healthcare and Pharmaceuticals © Copyright 2013, Arqaam Capital Limited. All Rights Reserved. See Important Notice. 17
5-Mandatory health cover: substantial demand catalyst to play out in 2014-15
Implemented in Abu Dhabi since 2007, mandatory health insurance cover is expected to be
rolled out across the remainder of the UAE by 2014. In the 3 year period between 2007 and
2010, the number of insurance claims processed in Abu Dhabi jumped 8x to 13.1mn in FY 10A
(98% CAGR). We expect private insurers to be the largest providers of new healthcare policies
going forward.
Exhibit 27: The number of inpatient claims expanded 4x as a result of mandatory health cover…
Source: HAAD
Exhibit 28: …similarly, outpatient claims grew 8x
Source: HAAD
The precedent: the Abu Dhabi health insurance system
Exhibit 29: Abu Dhabi insurance schemes by enrolment..
Source: HAAD
Exhibit 30: …and by claim value
Source: HAAD
There are 3 types of health insurance schemes in operation in Abu Dhabi. These address the
different social demographic groups that reside within the emirate:
Thiqa (UAE Nationals): All UAE nationals residing within the emirate are covered by a broad
scheme that administers a wide range of free treatments (including screening and dentistry),
at all private and public healthcare facilities in Abu Dhabi. It is provided by the National Health
Insurance Company (Daman). The number of UAE Nationals enrolled under Thiqa reached
588k in FY 11A. The program accounts for 16% of the enrolment base in Abu Dhabi in terms of
membership, but accounts for 48% of all claims processed.
42
166
-
20
40
60
80
100
120
140
160
180
FY 07A FY 10A
Inpatient Claims in AD ('000)
CAGR 58%
1.6
12.9
0
2
4
6
8
10
12
14
FY 07A FY 10A
Outpatient Claims in AD (mn)
CAGR 98%
Thiqa, 16%
Enhanced, 37%
Basic, 47%
(FY 11A)
Thiqa, 48%
Enhanced, 36%
Basic, 16%
(FY 11A)

September 18 2013
MENA – Healthcare and Pharmaceuticals
Healthcare and Pharmaceuticals © Copyright 2013, Arqaam Capital Limited. All Rights Reserved. See Important Notice. 18
Enhanced package (Expatriate residents): This is the insurance scheme offered to expatriates
that earn monthly salaries above AED 5k. It is an employer-based scheme offered by all
insurance companies, covering a spouse and 2 dependants with annual limits on payouts,
depending on the premium paid by employers. 37% of insured residents in Abu Dhabi fall
under the ‘Enhanced’ category, and account for a commensurate share of claims (36%).
Basic package (Expatriate residents): Expatriates who earn monthly salaries below AED 5k are
eligible for basic insurance cover. The scheme is employer-based and covers an annual benefit
limit of AED 250k, provided by Daman. It covers inpatient and outpatient care, maternity care
(in-patient maternity treatments subject to pre-approval), and emergency care. We note that
the package covers 47% of individuals enrolled in the program, but accounts for 16% of claims
processed in FY 11A.
The opportunity: Dubai and Northern Emirates
According to the Dubai Health Authority- DHA, 40% of the Dubai population (including 25%
of its expatriate residents) is covered by government and private health insurance schemes
today. That equates to 0.8mn residents, of which we estimate c.40% are UAE nationals, and
c.60% expatriates. We believe that at current, AED 1.32bn in insurance claims are collected in
Dubai, accounting for 30% of the UAE total.
Taking precedent from the growth in insurance claims processed in Abu Dhabi, in the 3 years
following the implementation of mandatory health cover in 2007 (4.0x), we calculate that
patient claims in Dubai should follow suit and reach AED 4.8bn (3.6x FY 11A) by FY 16e
(corresponding to the 3-year period during which the scheme is scheduled to be rolled out).
The jump in UAE claims is in our view a function of (i) higher health insurance premiums
(+150%) and (ii) a rise in claims per patient (+45% over the past 4 years in the UAE).
Accordingly, we expect healthcare demand in Dubai to pressure bed capacity, which will need
to grow by at least 50% (1,700 beds) in the coming 5 years to absorb incoming patients on
aggregate.
Exhibit 31: UAE health insurance premiums grew 2.7x over the past 4 years…
Source: National Bureau of statistics
Exhibit 32: …while claims expanded by 4x
Source: National Bureau of statistics
1.1
2.1
3.1
4.1
5.0
5.6
-
1.0
2.0
3.0
4.0
5.0
6.0
FY 06A FY 07A FY 08A FY 09A FY 10A FY 11A
UAE written premiums (AED bn)
0.5
1.1
1.6
2.5
3.6
4.4
-
0.5
1.0
1.5
2.0
2.5
3.0
3.5
4.0
4.5
5.0
FY 06A FY 07A FY 08A FY 09A FY 10A FY 11A
UAE claims paid (AED bn)

September 18 2013
MENA – Healthcare and Pharmaceuticals
Healthcare and Pharmaceuticals © Copyright 2013, Arqaam Capital Limited. All Rights Reserved. See Important Notice. 19
Medical tourism flows can reverse course as bed capacity and service quality improve The UAE aims to transition towards becoming a recipient, rather than a supplier, of medical
tourism flows in MENA. As an initial step, Dubai has introduced a 3-month visa (extendable to
9) designed for foreign visitors seeking medical treatment in the emirate. Though the
necessary infrastructure is gradually being installed, we believe inbound medical tourism will
remain muted in the near term, as shortage in bed capacity and the availability of specialised
doctors remain in place. It is worth noting that according to the Abu Dhabi Health Authority,
outbound patients seeking treatment abroad have retracted by 50% as of 2011, to reach 1,451
Emirati nationals (equivalent 3.4 per 1000).

September 18 2013
MENA – Healthcare and Pharmaceuticals
Healthcare and Pharmaceuticals © Copyright 2013, Arqaam Capital Limited. All Rights Reserved. See Important Notice. 20
Key UAE healthcare indicators
Exhibit 33: Healthcare indicators in Dubai and Abu Dhabi
Dubai Abu Dhabi
Private hospitals 19 17
Public hospitals 5 18
Total hospitals 24 35
Public beds 2,006 1,765
Private beds 1,238 2,984
Total bed capacity 3,244 4,749
Beds/1,000 people 1.9 2.1
Physicians/1,000 people 2.9 2.0
Source: HAAD, DHA, WHO
Exhibit 34: Abu Dhabi inpatients by sector
Source: HAAD
Exhibit 35: Abu Dhabi outpatients by sector
Source: HAAD
Exhibit 36: Abu Dhabi hospitals by sector
Source: HAAD, company data
Exhibit 37: Dubai hospitals by sector
Source: DHA, company data
Exhibit 38: Abu Dhabi hospital beds by sector
Source: HAAD, company data
Exhibit 39: Dubai hospital beds by sector
Source: DHA, company data
Public, 65%
Private, 35%
FY 11A
Public, 40%
Private, 60%
FY 11A
Private hospitals, 49%Public
hospitals, 51%
FY 11A
Private hospitals, 79%
Public hospitals, 21%
FY 11A
Private hospital beds, 2,984 ,
63%
Public hospital beds, 1,765 ,
37%
FY 11A
Private hospital beds, 1,238 ,
38%Public hospital beds, 2,006 ,
62%
FY 11A

I n i t i a t i o n R e p o r t
S e p t e m b e r 1 8 2 0 1 3
Mohammad Kamal [email protected] +9714 507 1743
Dahlia Sabaayon, CFA Arqaam Capital Research Offshore s.a.l
Saudi Arabia – Healthcare and Pharmaceuticals Al Mouwasat Medical Services Co.
BUY
Healthcare and Pharmaceuticals / Saudi Arabia Bloomberg code MOUWASAT AB
Market index SASEIDX
Price target (local) 103
Upside (%) 30.9
Market data 12/09/2013
Last closing price 79.00
52 Week range 48.2-85.0
Market cap (SARmn) 3,950
Market cap (USDmn) 1,053
Average daily traded value (SARmn) 12.6
Average daily traded value (USDmn) 3.4
Year-end (local mn) 2012 2013e 2014e 2015e
Revenues 796.5 943.7 1,114.6 1,199.1
EBITDA 224.7 280.6 337.7 345.9
Net income 171.6 217.7 260.5 279.1
EPS 3.43 4.35 5.21 5.58
P/E (current price) 23.0 18.1 15.2 14.2
BVPS 16.3 19.3 22.7 26.2
P/B (current price) 4.9 4.1 3.5 3.0
EV/EBITDA (current price) 18.3 14.7 12.2 11.9
Div. yield (%) 1.9 1.7 2.2 2.6
FCF margin (%) (1.2) 2.7 2.1 9.4
Net debt/EBITDA (x) 0.4 0.4 0.6 0.5
Net debt/Capital (%) 7.6 10.8 13.7 11.7
Interest cover (x) 164.5 95.8 76.3 58.5
RoAA (%) 15.6 17.2 18.1 16.8
RoAE (%) 22.5 24.5 24.8 22.8
RoIC (%) 18.2 21.7 21.4 20.1
Core growth drivers are in an even blend of volume (bed capacity +85%) and pricing elements (re-pricing of insurance contracts +20%) Cheap in peer context: 23%+ RoE at 15.2x FY 14e P/E, 15% discount to peers. Initiate with Buy, SAR 103 FVE
Mouwasat Medical Services is a broad play on the Saudi healthcare
sector. We believe Mouwasat is trading at an unwarranted 15% discount
to regional peer set multiple of 17.6x/15.9x, given its (i) superior returns
(23% FY 13e RoE vs. 15% for local peers, (ii) EPS outlook at 15% CAGR, and
(iii) unique growth catalysts. We value Mouwasat at SAR 103/share,
implying 30% in upside from current market price, using DCF. We initiate
with a Buy rating and a FVE of SAR 103.
The business enjoys 3 key growth catalysts that in our view are currently
foregone in current share price: (i) Bed capacity expansion to 1,089 beds
(c. 85% growth) by FY 18e, translating into an 5-yr revenue CAGR of 13%,
(ii) A departure from its core market towards the urban center of Riyadh,
through the roll out of an additional 175 beds (23% of total bed capacity)
by the end of FY 13e. Both volume elements above should produce a 75%
growth in revenues over the next 5 years. (iii) Agreements with insurers
regarding the collection of patient claims, which constitute 40% of
revenues, have recently been re-priced upwards by an average of 20%.
This is a negotiated process that adjusts the collection ratios applied on
inpatient and outpatient services administered to patients that enjoy
health insurance cover. Contract prices have not been reset since 1994,
and we model for a 2% increase in FY 14e onwards. This should translate
into 8% incremental revenues, and consequently a 160bps expansion in
blended margins. Both volume and price elements combined will in our
view drive 13% revenue CAGR.
Revenue visibility is strong on corporate client base: 40% of revenues
derive from corporate clients (Aramco, GOSI and other large corporates).
The company’s broad presence in the eastern province has resulted in a
disproportionately large share of the healthcare industry in the region, at
28% (inpatients) and 16% (outpatients).
Cheap in peer context: Mouwasat currently trades at 15.2x FY 14e EPS vs.
17.6x and 19.3x for regional and local peers, implying a discount of 15%
and 20%, respectively. We believe the stock should re-rate and trade in-
line with sector multiples, at the very least. Risks: Delays, Saudisation
laws.
SAR 103
© Copyright 2013, Arqaam Capital Limited. All Rights Reserved. See Important Notice.
Price Performance
81
99
117
135
153
171
Sep-12 Dec-12 Mar-13 Jun-13
MOUWASAT AB SASEIDX
September 18 2013
Al Mouwasat Medical Services Co. © Copyright 2013, Arqaam Capital Limited. All Rights Reserved. See Important Notice. 22
Abacus Arqaam Capital Fundamental Data
Profitability
Growth
Gearing
Valuation
0%
20%
40%
2012 2013e 2014e 2015e 2016e
EBITDA Margin Net Margin
0%
10%
20%
30%
2012 2013e 2014e 2015e 2016e
Revenues Assets
0%
5%
10%
15%
0.0
0.2
0.4
0.6
2012 2013e 2014e 2015e 2016e
Net Debt/Capital Net Debt/EBITDA
0
10
20
30
2012 2013e 2014e 2015e 2016e
P/E P/E Sector
Al Mouwasat Medical Services Co.
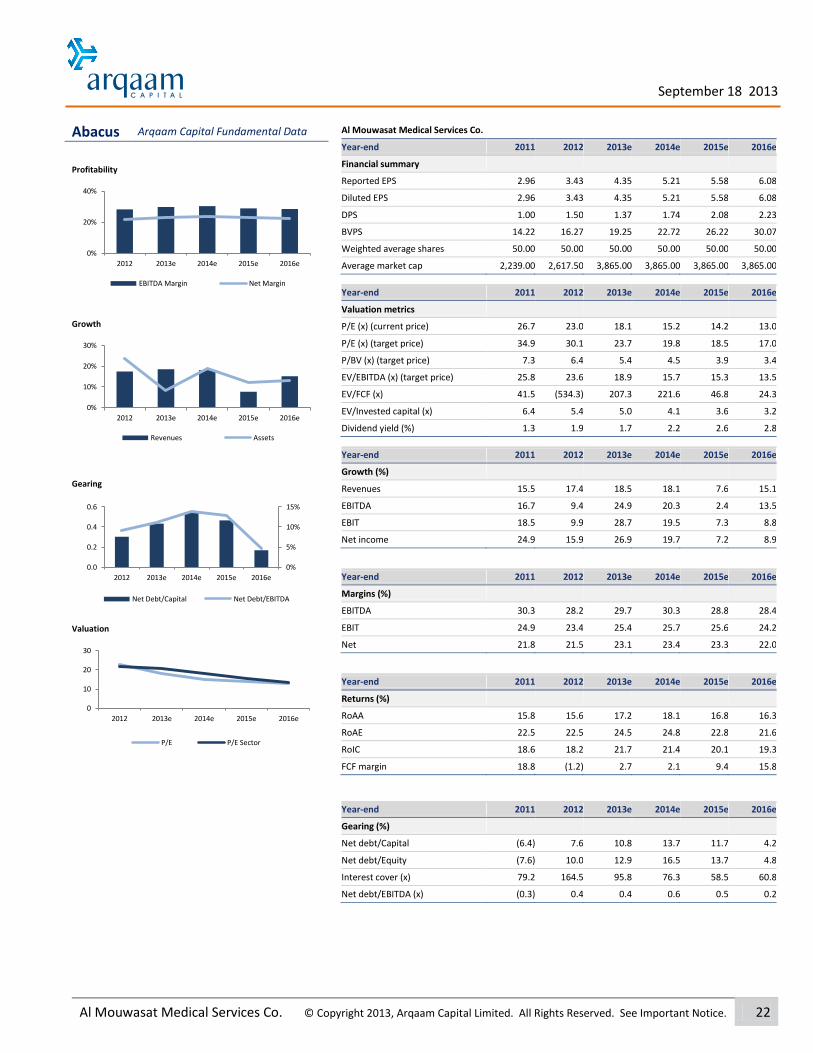
Year-end 2011 2012 2013e 2014e 2015e 2016e
Financial summary
Reported EPS 2.96 3.43 4.35 5.21 5.58 6.08
Diluted EPS 2.96 3.43 4.35 5.21 5.58 6.08
DPS 1.00 1.50 1.37 1.74 2.08 2.23
BVPS 14.22 16.27 19.25 22.72 26.22 30.07
Weighted average shares 50.00 50.00 50.00 50.00 50.00 50.00
Average market cap 2,239.00 2,617.50 3,865.00 3,865.00 3,865.00 3,865.00
Year-end 2011 2012 2013e 2014e 2015e 2016e
Valuation metrics
P/E (x) (current price) 26.7 23.0 18.1 15.2 14.2 13.0
P/E (x) (target price) 34.9 30.1 23.7 19.8 18.5 17.0
P/BV (x) (target price) 7.3 6.4 5.4 4.5 3.9 3.4
EV/EBITDA (x) (target price) 25.8 23.6 18.9 15.7 15.3 13.5
EV/FCF (x) 41.5 (534.3) 207.3 221.6 46.8 24.3
EV/Invested capital (x) 6.4 5.4 5.0 4.1 3.6 3.2
Dividend yield (%) 1.3 1.9 1.7 2.2 2.6 2.8
Year-end 2011 2012 2013e 2014e 2015e 2016e
Growth (%)
Revenues 15.5 17.4 18.5 18.1 7.6 15.1
EBITDA 16.7 9.4 24.9 20.3 2.4 13.5
EBIT 18.5 9.9 28.7 19.5 7.3 8.8
Net income 24.9 15.9 26.9 19.7 7.2 8.9
Year-end 2011 2012 2013e 2014e 2015e 2016e
Margins (%)
EBITDA 30.3 28.2 29.7 30.3 28.8 28.4
EBIT 24.9 23.4 25.4 25.7 25.6 24.2
Net 21.8 21.5 23.1 23.4 23.3 22.0
Year-end 2011 2012 2013e 2014e 2015e 2016e
Returns (%)
RoAA 15.8 15.6 17.2 18.1 16.8 16.3
RoAE 22.5 22.5 24.5 24.8 22.8 21.6
RoIC 18.6 18.2 21.7 21.4 20.1 19.3
FCF margin 18.8 (1.2) 2.7 2.1 9.4 15.8
Year-end 2011 2012 2013e 2014e 2015e 2016e
Gearing (%)
Net debt/Capital (6.4) 7.6 10.8 13.7 11.7 4.2
Net debt/Equity (7.6) 10.0 12.9 16.5 13.7 4.8
Interest cover (x) 79.2 164.5 95.8 76.3 58.5 60.8
Net debt/EBITDA (x) (0.3) 0.4 0.4 0.6 0.5 0.2

September 18 2013
Al Mouwasat Medical Services Co. © Copyright 2013, Arqaam Capital Limited. All Rights Reserved. See Important Notice. 23
Abacus Arqaam Capital Fundamental Data
Company overview
Established in 1974, Mouwasat Hospital owns and operates 4 hospitals and 2 dispensaries in the eastern province of KSA with a total bed capacity of 594 beds and 227 clinics as of FY 12A. The company is also in the process of launching a new hospital in Riyadh at a total bed capacity of 175 beds. SABIC and Saudi Aramco are the company’s two largest clients, generating 40% of its healthcare revenues.
Ownership and management
Shareholders
Mohammed Sultan Hammad Al Subaie 17.5%
Nasser Sultan Fahad Al Subaie 17.5%
Suleiman Mohammed Suleiman Al Saleem 17.5%
Public 47.5%
Source: Zawya
Board of Directors
Mr. Mohammed Sultan Hammad Al Subaie Chairman
Mr. Nasser Sultan Fahad Al Subaie Director
Mr. Mohammed Bin Suleiman Al Saleem Director
Mr. Khaled Bin Suleiman Al Saleem Director
Mr. Ibrahim Hamad Al Babtain Director
Mr. David Anthony Price Director
Mr. Abdulaziz Saad Al Mangoor Director
Source: Company data
Al Mouwasat Medical Services Co.
Year-end 2011 2012 2013e 2014e 2015e 2016e
Income statement (SAR mn)
Sales revenue 678.4 796.5 943.7 1,114.6 1,199.1 1,380.3
Gross profit 324.0 372.7 456.5 542.5 582.9 651.6
SG&A (154.7) (186.7) (217.1) (256.4) (275.8) (317.5)
EBITDA 205.5 224.7 280.6 337.7 345.9 392.5
Depreciation & Amortisation (36.2) (38.7) (41.2) (51.6) (38.8) (58.3)
EBIT 169.3 186.0 239.4 286.1 307.1 334.1
Net interest income(expense) (2.1) (1.1) (2.5) (3.8) (5.3) (5.5)
Associates/affiliates — — — — — —
Exceptionals/extraordinaries — — — — — —
Other pre-tax income/(expense) 8.5 8.7 8.7 8.7 8.7 8.7
Profit before tax 175.6 193.6 245.6 291.0 310.5 337.3
Zakat (16.0) (8.6) (10.8) (12.9) (13.7) (14.9)
Minorities (11.5) (13.4) (17.0) (17.7) (17.7) (18.5)
Other post-tax income/(expense) — — — — — —
Net profit 148.1 171.6 217.7 260.5 279.1 303.9
Arqaam adjustments (including dilution) — — — — — —
Arqaam Net profit 148.1 171.6 217.7 260.5 279.1 303.9
Year-end 2011 2012 2013e 2014e 2015e 2016e
Balance sheet (SAR mn)
Cash and equivalents 192.7 177.7 63.0 44.6 45.5 153.2
Receivables 183.5 215.7 255.6 301.9 324.8 373.9
Inventories 58.6 62.6 72.0 84.5 91.1 107.7
Tangible fixed assets 525.6 688.0 852.9 1,059.3 1,214.4 1,272.8
Other assets including goodwill 24.5 75.1 75.1 75.1 75.1 75.1
Total assets 984.8 1,219.2 1,318.6 1,565.4 1,750.9 1,982.6
Payables 108.3 115.2 132.5 155.6 167.5 198.1
Interest bearing debt 138.5 259.1 187.6 232.3 224.5 225.9
Other liabilities 27.2 31.2 35.9 41.5 47.9 55.3
Total liabilities 274.0 405.6 355.9 429.4 439.9 479.3
Shareholders equity 710.9 813.6 962.7 1,136.1 1,311.0 1,503.3
Minorities — — — — — —
Total liabilities & shareholders equity 984.8 1,219.2 1,318.6 1,565.4 1,750.9 1,982.6
Year-end 2011 2012 2013e 2014e 2015e 2016e
Cash flow (SAR mn)
Cashflow from operations 221.9 192.8 231.6 281.9 306.9 334.5
Net capex (94.2) (202.7) (206.1) (258.0) (193.9) (116.6)
Free cash flow 127.7 (9.9) 25.5 23.9 113.0 217.9
Equity raised/(bought back) — — — — — —
Dividends paid (50.0) (75.0) (68.6) (87.1) (104.2) (111.6)
Net inc/(dec) in borrowings (28.2) 120.6 (71.6) 44.8 (7.9) 1.4
Other investing/financing cash flows 6.1 (50.7) — — — —
Net cash flow 55.5 (15.0) (114.7) (18.4) 0.9 107.6
Change in working capital 21.6 (27.1) (32.0) (35.7) (17.4) (35.1)
Mohammad Kamal Dahlia Sabaayon, CFA [email protected] Arqaam Capital Research Offshore s.a.l +9714 507 1743

September 18 2013
Al Mouwasat Medical Services Co. © Copyright 2013, Arqaam Capital Limited. All Rights Reserved. See Important Notice. 24
Bed capacity expansion (+85%) and the re-pricing of insurance
contracts (+20%) drive 15% EPS CAGR
Cheap in peer context: 15.2x FY 14e EPS 15% discount to comparables. Initiate with
Buy, SAR 103 FVE
Al Mouwasat is a medical services provider that operates 6 facilities in the Eastern province
of KSA (Dammam, Jubail, Qatif, and Madina). We believe that the company is very well
positioned to capitalise on (i) its geographical presence in the Eastern Province (largest oil
industry community in the Kingdom; population of 4.3mn) and its strategic relationships with
insurance companies and direct corporate clients, which offer medium-term visibility on
revenue growth, (ii) the recent re-pricing of contracts with insurance companies, which should
support revenues from insurance (40% in FY 12A) by 20%+, (iii) expansion plans to raise its bed
capacity to 1,089 beds (c. 90% growth) by FY 18e, translating into a 5-yr revenue CAGR of 13%,
and (iv) future plans to expand to Riyadh by operating 175 beds (23%) by the end of FY 13e.
We initiate coverage on Mouwasat with a Buy recommendation and a fair value estimate of
SAR 103, offering 30% in upside potential vs. current market price.
Exhibit 40: KSA beds by sector
Source: Company Data, Arqaam Capital Research
Exhibit 41: Mouwasat market share (based on inpatient admissions)
Source: Company Data, Arqaam Capital Research
Riyadh Hospital to expand foothold in the Saudi Capital: The company is currently
establishing 2 new hospitals in Riyadh (which houses 26% of the Saudi population) and Khobar
(4%) in a step intended to expend into a relatively underpenetrated, highly concentrated urban
(2.6x bed per 1,000 residents (vs. 2.1 MENA, 3.0 US, 5 mn residents). Additionally, Mouwasat
intends to raise total bed capacity to 1,089 beds by FY 18e (+85%, vs. 594 beds in FY 12A) by
expanding its existing 4 hospitals in the Eastern Province (Dammam, Jubail, Qatif and Madina).
Riyadh hospital is expected to constitute 15% of the company’s total revenues by FY 18e.
Overall CAPEX in relation to both the new hospitals and bed capacity expansions amounts to
SAR 770mn, and will be financed through (i) SAR 240mn from the company’s operation (net
cash as of H1 13A is 240mn), (ii) a soft loan from the Ministry of Finance (SAR 200mn), (iii) and
the remaining 330mn from conventional loans.
Private hospital beds, 23%
Public hospital beds, 77%
22.9%24.1%
25.8%26.7% 27.5%
14.4% 14.5% 14.9%16.5%
19.2%
0.0%
5.0%
10.0%
15.0%
20.0%
25.0%
30.0%
FY 08A FY 09A FY 10A FY 11A FY 12A
East region Madinah

September 18 2013
Al Mouwasat Medical Services Co. © Copyright 2013, Arqaam Capital Limited. All Rights Reserved. See Important Notice. 25
Exhibit 42: 495 new beds over the next five years drive patient admissions
FY 10A FY 11A FY 12A FY 13e FY 14e FY 15e FY 16e FY 17e
Number of clinics 188 188 188 253 253 253 376 376
Number of beds 594 594 594 769 869 869 1,089 1,089
Inpatient admissions (000') 37 39 42 44 59 66 72 78
Outpatient admissions (000') 1,316 1,341 1,454 1,402 1,525 1,550 1,912 2,121
Source: Company Data, Arqaam Capital Research
Revenue visibility is high, given corporate client base: As 40% of revenues are driven by
corporate clients (Aramco, GOSI and other large corporations), Mouwasat enjoys a degree of
revenue visibility absent among comparable healthcare providers. The company’s broad
presence in the Eastern Province has resulted in strong relationships with direct corporate
clients. There exists a direct correlation between the proportion of corporate clientele
contributing to revenues (40%), and the degree of exposure to insurance-based patient
visitation (40%), as mandatory health cover in KSA since 2007 has mandated insurance cover
for all residents employed in the private sector.
Exhibit 43: Revenue visibility is high given corporate client base
Source: Company Data, Arqaam Capital Research
Exhibit 44: 1,089 bed capacity by FY 17e
Source: Company Data, Arqaam Capital Research
Re-pricing continues to drive revenue in FY 13e: The business posted robust revenue growth
in the past 3 years (FY 10-12A CAGR 17%), mainly due to (i) higher healthcare charges imposed
on cash business (20% in FY 12A) , and (ii) rising patient visitation (+11%), as a result of a ramp
up in utilisation rates (53% in FY 12A) across facilities. In FY 11, the business received approval
from the Ministry of Health to raise its charges on medical services by 25%, and in April of this
year announced a 20-25% increase on insurance premiums, effective January 2013. The
increase in premiums will be passed on to all insured clients, with the exception for Medgulf,
which had its charges revised in 2011 (as Mouwasat’s SABIC account became insurance-based,
and covered by Medgulf). The account was previously a direct corporate client of Mouwasat’s).
We expect average claims/patient to grow by 8% in FY 13e, and to subsequently settle at an
average growth of 2% thereafter. We expect Mouwasat to register revenue CAGR of c.12%
over the next 3 years via (i) a ramp up in utilisation rates within existing hospitals, (and ii) the
launch of 2 new hospitals by 2016 (driving c.10% of revenue growth by 2016).
Insurance companies, 40%
Corporates (inlcuding
Aramco) , 40%
Cash business, 20%
Revenue breakdown by client FY 12A
188 188 188 253 253 253
376 376
594 594 594
769
869 869
1,089 1,089
--
200
400
600
800
1,000
1,200
FY 10A FY 11A FY 12A FY 13e FY 14e FY 15e FY 16e FY 17e
Number of clinics Number of beds

September 18 2013
Al Mouwasat Medical Services Co. © Copyright 2013, Arqaam Capital Limited. All Rights Reserved. See Important Notice. 26
Valuation: trades at 15% discount to lower-margin peer set, RoE
superiority should command premium
30% in potential upside on DCF-based price target of SAR 103; initiate with Buy
Cheap in peer context: Mouwasat currently trades at 15.2x FY 14e EPS vs. 17.6x and 19.3x for
regional and local peers, implying a discount of 15% and 20%, respectively. We believe
Mouwasat should re-rate to trade to trade in-line with domestic peers at the very least, given
its (i) stronger growth (5-yr EPS CAGR of 15%, vs. 14% peers), (ii) leading position in the Saudi
healthcare market (28% and 16% in the eastern region in terms of inpatients and outpatients
respectively, in FY 12A), (iii) superior profitability (23% FY 14e RoE vs. 15% for local peers).
Exhibit 45: Unwarranted 15% discount to regional peers
P/E EV/EBITDA
At market price FY 13e FY 14e FY 15e FY 13e FY 14e FY 15e
Dallah Healthcare 26.0 19.3 15.7 16.8 14.0 11.4
Mouwasat 18.1 15.2 14.2 14.7 12.2 11.9
National Medical Care 24.8 23.4 20.9 17.1 15.4 13.6
NMC Health 13.8 12.7 11.5 10.7 9.8 8.5
Al Noor Hospitals Group 23.1 17.5 17.2 12.5 10.0 9.7
Average regional peers 21.2 17.6 15.9 14.3 12.3 11.1
Premium/ (discount) -14% -14% -11% 2% -1% 7%
Source: Company Data, Arqaam Capital Research
Exhibit 46: Attractively priced despite RoE differential…
Source: Company Data, Arqaam Capital Research
Exhibit 47: …And EPS growth (5-yr forward CAGR)
Source: Company Data, Arqaam Capital Research
DALLAH
MOUWASAT
CARE
NMC
Al Noor
10
12
14
16
18
20
22
24
26
0% 10% 20% 30% 40%
FY 14e RoE (%)
PE 14e
DALLAH
MOUWASAT
CARE
NMC
Al Noor
10
12
14
16
18
20
22
24
26
0% 5% 10% 15% 20%
5-yr EPS CAGR
P/E 14e

September 18 2013
Al Mouwasat Medical Services Co. © Copyright 2013, Arqaam Capital Limited. All Rights Reserved. See Important Notice. 27
We value Mouwasat at SAR 103/share, implying 30% in upside potential from current market
price, using DCF. We apply a WACC of 9.5% (11.0% Re, 0.85 Beta, 5% Rd) and a terminal growth
rate of 4%. We believe current market valuation (At 15.2x/14.2x FY 14e/15e P/E) does not
reflect business fundamentals, catalysts in the coming 12 months, growth (13% FY 13-18e
revenue CAGR) and comparatively superior returns (+23% RoE).
Exhibit 48: DCF summary
Source: Company Data, Arqaam Capital Research *FCF calculation based on adjusted EBIT rather than net income
Risks
Delays in the launch of facilities in Riyadh and Madina could be material to growth forecasts.
Saudisation requirements may become more demanding, and this is material to margins. We
estimate that for every 5% increase in staff costs, a 130bps compression in EBITDA margins is
likely. This on aggregate cam cut our FVE by 7%.
DCF summary
SARmn unless otherwise stated FY 13e FY 14e FY 15e FY 16e FY 17e FY 18e FY 19e FY 20e
EBIT (1-τ) 229 273 294 319 385 454 470 479
Depreciation & Amortization 41 52 39 58 54 61 63 64
EBITDA 270 325 332 378 439 514 532 543
Working Capital Changes (32) (36) (11) (28) (29) (31) (1) 6
Operating Cash Flow 238 289 321 350 410 484 532 549
Purchase of PPE (206) (258) (194) (117) (108) (121) (125) (128)
Free Cash Flow to Firm 32 31 127 233 301 362 406 421
Discount Factor using WACC at 9.5% 0.97 0.89 0.81 0.74 0.68 0.62 0.56 0.51
PV of Visible FCFF 10 28 103 173 204 224 229 217
Terminal Value 7,958
Equity Valuation WACC parameters
PV of Visible FCFF 1,186 22% Rf 4.2%
PV of Terminal Value 4,094 78% EMRP 8.0%
Enterprise Value 5,280 Adjusted Beta 0.85
Cost of Equity 11.0%
Cash & Cash Equivalents 178
Less: Net (Debt) Funds (259) Marginal tax rate 2.50%
Investments in associates 8
NCI (50) Cost of Debt 5.00%
D/C (market) 25.00%
Equity Value 5,156 WACC 9.50%
NOSH 50 Perpetual grow th 4.00%
Equity Value per Share 103
Implied multiples
EV/EBITDA 19.6 16.2 15.9 14.0 12.0 10.3 9.9 9.7
P/E 23.7 19.8 18.5 17.0 14.0 11.8 11.4 11.2
P/B 5.4 4.5 3.9 3.4 2.9 2.5 2.2 2.0
September 18 2013
Al Mouwasat Medical Services Co. © Copyright 2013, Arqaam Capital Limited. All Rights Reserved. See Important Notice. 28
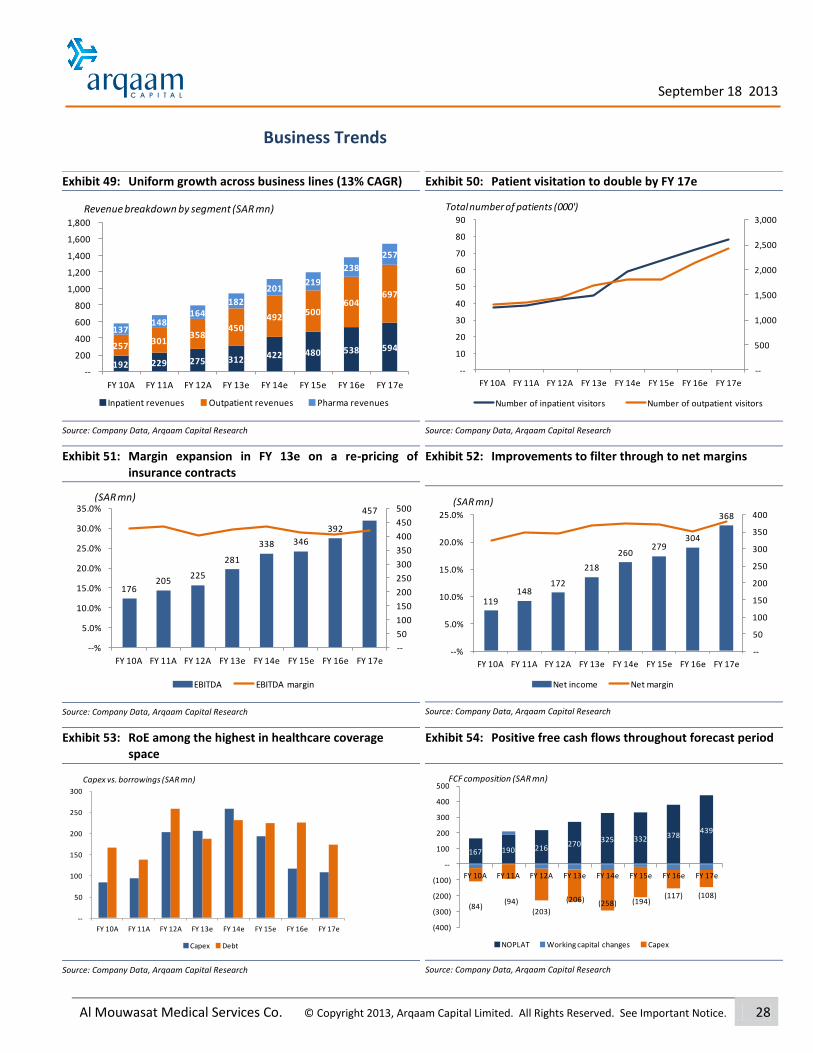
Business Trends
Exhibit 49: Uniform growth across business lines (13% CAGR)
Source: Company Data, Arqaam Capital Research
Exhibit 50: Patient visitation to double by FY 17e
Source: Company Data, Arqaam Capital Research
Exhibit 51: Margin expansion in FY 13e on a re-pricing of insurance contracts
Source: Company Data, Arqaam Capital Research
Exhibit 52: Improvements to filter through to net margins
Source: Company Data, Arqaam Capital Research
Exhibit 53: RoE among the highest in healthcare coverage space
Source: Company Data, Arqaam Capital Research
Exhibit 54: Positive free cash flows throughout forecast period …….
Source: Company Data, Arqaam Capital Research
192 229 275 312 422 480 538 594 257 301
358 450
492 500
604 697
137 148
164 182
201 219
238
257
--
200
400
600
800
1,000
1,200
1,400
1,600
1,800
FY 10A FY 11A FY 12A FY 13e FY 14e FY 15e FY 16e FY 17e
Revenue breakdown by segment (SAR mn)
Inpatient revenues Outpatient revenues Pharma revenues
--
500
1,000
1,500
2,000
2,500
3,000
--
10
20
30
40
50
60
70
80
90
FY 10A FY 11A FY 12A FY 13e FY 14e FY 15e FY 16e FY 17e
Total number of patients (000')
Number of inpatient visitors Number of outpatient visitors
176 205
225
281
338 346
392
457
--
50
100
150
200
250
300
350
400
450
500
--%
5.0%
10.0%
15.0%
20.0%
25.0%
30.0%
35.0%
FY 10A FY 11A FY 12A FY 13e FY 14e FY 15e FY 16e FY 17e
(SAR mn)
EBITDA EBITDA margin
119 148
172
218
260 279
304
368
--
50
100
150
200
250
300
350
400
--%
5.0%
10.0%
15.0%
20.0%
25.0%
FY 10A FY 11A FY 12A FY 13e FY 14e FY 15e FY 16e FY 17e
(SAR mn)
Net income Net margin
--
50
100
150
200
250
300
FY 10A FY 11A FY 12A FY 13e FY 14e FY 15e FY 16e FY 17e
Capex vs. borrowings (SAR mn)
Capex Debt
167 190 216 270
325 332 378 439
(84)(94)
(203)
(206) (258) (194)(117) (108)
(400)
(300)
(200)
(100)
--
100
200
300
400
500
FY 10A FY 11A FY 12A FY 13e FY 14e FY 15e FY 16e FY 17e
FCF composition (SAR mn)
NOPLAT Working capital changes Capex

September 18 2013
Al Mouwasat Medical Services Co. © Copyright 2013, Arqaam Capital Limited. All Rights Reserved. See Important Notice. 29
Appendix 1: Financials and forecasts Revenues
Revenues have reflected solid growth as of FY 09A, on the back of (i) a strengthening in
hospital charges (+20%, starting 2011), (ii) improving bed utilisation rates on account of growth
in inpatient and outpatient visitation (+11%), (iii) and a slight improvement in pharmaceuticals
revenues, driven by higher volume.
(i) Hospital revenues grew at a CAGR of 19% over the past three years, driven by (i)
the re-pricing of patient visitation charges applied on cash and direct corporate
clients along with (ii) a rise in overall patient visitation (+11%). We forecast 5-yr
inpatient revenue CAGR of 14%, reaching SAR 590mn by FY 17e. This would in our
view be the result of the addition of 100 beds (+88%) in incremental capacity at
Jubail hospital (214 beds by FY 14e), 175 beds at Riyadh hospital (Q1 14e), and
220 beds (FY 16e) via the new hospital in Khobar. For Mouwasat’s outpatient
segment, we forecast a 5-yr outpatient revenue CAGR of 10%, driven by the rise
in outpatient visits that we expect to materialize via the launch of 65 clinics at
both Riyadh hospital (FY 14e) and Khobar hospital (FY 16e), and a further 68
clinics by FY 15e at existing hospitals and dispensaries.
(ii) Pharmaceuticals revenues have exhibited 35% CAGR (FY10-12A), largely driven
by volumes and minor support from pricing elements. We see a robust 3-year
CAGR (FY 13-16e) of 24% in pharmaceuticals-related revenues (SAR 103mn in FY
16e), and see the segment constituting 9% of overall revenues by FY 16e, vs. 7.5%
in Q1 13A.
Margins We expect an improvement in margins starting FY 13e, supported by a rise in the pricing of
patient claims that would precipitate from the re-negotiation of insurance claim collections,
starting Q2 13A. This rise will however be partially offset by the start-up cost behind Riyadh
Hospital, which we expect to be inaugurated in Q1 14e as well. We further forecast a degree of
margin compression in FY 16e, with the launch of the Khobar Hospital, which will operate 220
beds and 65 clinics. Overall, we see a drop in blended gross margins to 47% in FY 16e followed
by a 200bps expansion by FY 18e.
Balance sheet The bulk of expansion CAPEX will be debt-financed, and that is no material strain on the
balance sheet: At the end of H1 13A, Mouwasat held a cash position of SAR 240mn, vs. total
debt of SAR 290mn. We expect the company to deploy c. SAR 450mn over the next four years
towards: (i) the Jubail Hospital expansion (SAR 110mn), (ii) Khobar Hospital (SAR 320mn), and
(iii) Riyadh Hospital (SAR 20mn). We model for maintenance CAPEX of 7% of total revenues
thereafter. We estimate overall leverage of c. SAR 110mn by FY 17e, consisting mostly of a soft
loan from the Ministry of Finance. Interest cover (73x) and net debt/EBITDA (45%) in the
medium term remain comfortable.

I n i t i a t i o n R e p o r t
S e p t e m b e r 1 8 2 0 1 3
Mohammad Kamal [email protected] +9714 507 1743
Dahlia Sabaayon, CFA Arqaam Capital Research Offshore s.a.l
Saudi Arabia – Healthcare and Pharmaceuticals Dallah Healthcare Holding Co.
BUY
Healthcare and Pharmaceuticals / Saudi Arabia Bloomberg code DALLAH AB
Market index SASEIDX
Price target (local) 88
Upside (%) 40.0
Market data 12/09/2013
Last closing price 61.75
52 Week range 51.0-96.8
Market cap (SARmn) 2,915
Market cap (USDmn) 777
Average daily traded value (SARmn) 45.1
Average daily traded value (USDmn) 12.0
Year-end (local mn) 2012 2013e 2014e 2015e
Revenues 637.1 732.4 773.7 880.9
EBITDA 159.9 157.9 189.0 233.2
Net income 133.4 112.1 151.1 185.8
EPS 2.83 2.38 3.20 3.94
P/E (current price) 21.9 26.0 19.3 15.7
BVPS 23.6 24.9 26.9 29.4
P/B (current price) 2.6 2.5 2.3 2.1
EV/EBITDA (current price) 16.7 16.9 14.2 11.5
Div. yield (%) 0.2 1.7 2.1 2.2
FCF margin (%) 8.8 (17.3) (3.1) 2.6
Net debt/EBITDA (x) (3.5) (1.7) (1.0) (0.6)
Net debt/Capital (%) (49.6) (21.8) (13.7) (9.1)
Interest cover (x) 48.6 63.1 36.4 23.2
RoAA (%) 13.5 8.4 10.5 11.6
RoAE (%) 16.8 9.8 12.4 14.0
RoIC (%) 11.6 8.8 11.3 13.1
2x expansion in bed capacity drives 20% 5-yr EPS CAGR, as substantial cash position (27% assets) is deployed
Strong pricing power vs. cash-paying patients
Initiate with Buy and SAR 88 FVE
Dallah offers an access point into the premium segment of the KSA healthcare sector, which enjoys particularly strong margins, and operating leverage. The business is linked with a strong domestic brand name, and holds 16% of the market for private hospital beds in Riyadh, which is substantial. Dallah’s planned 2x expansion in bed capacity should translate into FY 13-18e EPS CAGR of 20%, which is further supported by double-digit growth in its pharmaceuticals business (17% 5-yr revenue CAGR), when accounting for newly-introduced manufacturing capability (in addition to Dallah’s existing distribution business). IPO proceeds of SAR 540mn raised in December 2012 should be deployed towards growth within the next 2 years. We initiate with Buy and an FVE of SAR 88, offering 40% in upside potential from current price.
We see highly-defendable revenue CAGR of 16% CAGR in FY 13-18e: the business’s healthcare segment is the largest contributor to overall revenues (90% today, 88% in FY 15e), and we project growth at a 5-yr CAGR of 16% (driven by 100% expansion in bed capacity). We also expect double-digit growth in Dallah’s pharmaceuticals business (17% 5-yr revenue CAGR). Newly-introduced manufacturing business lines should supplement ancillary income to the overall business.
30% of revenues generated by cash-paying patients- this produces superior claims/patient when compared to insurance-heavy local comparables: Dallah’s average claim/patient is 65% higher than the average at Mouwasat and CARE, at SAR 10,430 (inpatients) and SAR 525 (outpatients) in FY 12A. This is due to Dallah’s price-setting power vs. cash-paying patients (30% at Dallah vs. 16% elsewhere).
Current market price reflects discount to Emerging peer set: current
market valuation implies a 15% discount to EM peers on FY 15e EPS. We
argue for superior multiples in favour of Dallah, given its substantial
margin advantage (net margin 21% vs. 10% EM) and higher EPS growth
(18% vs.14% EM). We believe the market is overlooking the role of bed
capacity growth on EPS at current multiples. We initiate with a Buy
recommendation and SAR 88 FVE.
Risks: Target clientele impacted by health insurance coverage in KSA. Saudisation: a 10% increase in staff wages produces 6% cut to EV.
SAR 88
© Copyright 2013, Arqaam Capital Limited. All Rights Reserved. See Important Notice.
Price Performance
89
119
149
179
209
239
Dec-12 Mar-13 Jun-13
DALLAH AB SASEIDX

September 18 2013
Dallah Healthcare Holding Co. © Copyright 2013, Arqaam Capital Limited. All Rights Reserved. See Important Notice. 31
Abacus Arqaam Capital Fundamental Data
Profitability
Growth
Gearing
Valuation
0%
10%
20%
30%
2012 2013e 2014e 2015e 2016e
EBITDA Margin Net Margin
0%
50%
100%
2012 2013e 2014e 2015e 2016e
Revenues Assets
-60%
-40%
-20%
0%
-4.0
-2.0
0.0
2012 2013e 2014e 2015e 2016e
Net Debt/Capital Net Debt/EBITDA
0
10
20
30
2012 2013e 2014e 2015e 2016e
P/E P/E Sector
Dallah Healthcare Holding Co.
Year-end 2011 2012 2013e 2014e 2015e 2016e
Financial summary
Reported EPS 2.40 2.83 2.38 3.20 3.94 5.05
Diluted EPS — 2.83 2.38 3.20 3.94 5.05
DPS 2.23 0.14 1.07 1.28 1.38 2.53
BVPS 9.93 23.64 24.94 26.86 29.42 31.95
Weighted average shares — 23.60 47.20 47.20 47.20 47.20
Average market cap — 3,024.10 2,935.84 2,935.84 2,935.84 2,935.84
Year-end 2011 2012 2013e 2014e 2015e 2016e
Valuation metrics
P/E (x) (current price) 25.7 21.9 26.0 19.3 15.7 12.2
P/E (x) (target price) 36.7 31.2 37.1 27.5 22.4 17.4
P/BV (x) (target price) 8.9 3.7 3.5 3.3 3.0 2.8
EV/EBITDA (x) (target price) 30.6 23.6 23.9 20.0 16.2 13.0
EV/FCF (x) 57.1 67.0 (29.7) (156.6) 163.0 21.0
EV/Invested capital (x) 8.0 3.4 3.2 3.0 2.7 2.5
Dividend yield (%) 3.6 0.2 1.7 2.1 2.2 4.1
Year-end 2011 2012 2013e 2014e 2015e 2016e
Growth (%)
Revenues 11.6 20.8 15.0 5.6 13.9 18.1
EBITDA 14.9 29.5 (1.2) 19.7 23.3 24.5
EBIT 10.2 33.8 (7.4) 21.4 26.5 29.9
Net income 20.0 17.6 (15.9) 34.7 23.0 28.3
Year-end 2011 2012 2013e 2014e 2015e 2016e
Margins (%)
EBITDA 23.4 25.1 21.6 24.4 26.5 27.9
EBIT 18.6 20.6 16.6 19.0 21.1 23.2
Net 21.5 20.9 15.3 19.5 21.1 22.9
Year-end 2011 2012 2013e 2014e 2015e 2016e
Returns (%)
RoAA 19.1 13.5 8.4 10.5 11.6 13.5
RoAE 27.5 16.8 9.8 12.4 14.0 16.5
RoIC 20.1 11.6 8.8 11.3 13.1 15.6
FCF margin 12.5 8.8 (17.3) (3.1) 2.6 17.3
Year-end 2011 2012 2013e 2014e 2015e 2016e
Gearing (%)
Net debt/Capital (1.5) (49.6) (21.8) (13.7) (9.1) (12.4)
Net debt/Equity (1.7) (49.8) (22.6) (14.3) (10.0) (13.3)
Interest cover (x) 44.7 48.6 63.1 36.4 23.2 24.9
Net debt/EBITDA (x) (0.1) (3.5) (1.7) (1.0) (0.6) (0.7)
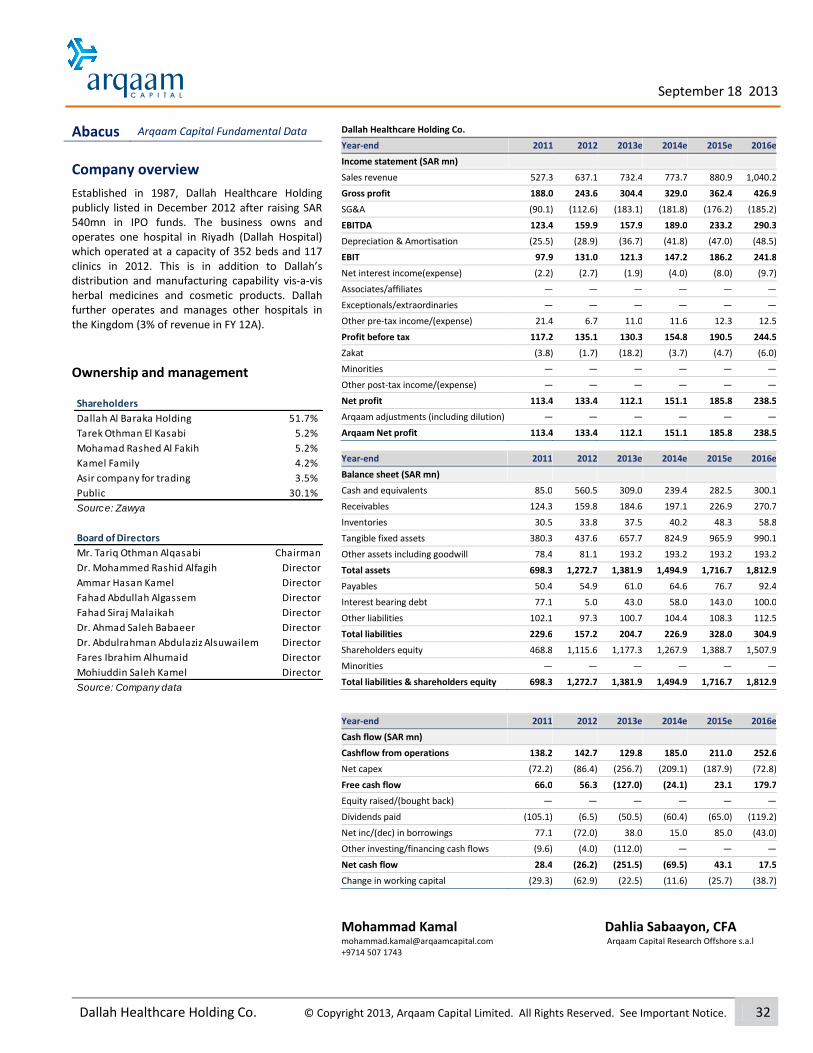
September 18 2013
Dallah Healthcare Holding Co. © Copyright 2013, Arqaam Capital Limited. All Rights Reserved. See Important Notice. 32
Abacus Arqaam Capital Fundamental Data
Company overview
Established in 1987, Dallah Healthcare Holding publicly listed in December 2012 after raising SAR 540mn in IPO funds. The business owns and operates one hospital in Riyadh (Dallah Hospital) which operated at a capacity of 352 beds and 117 clinics in 2012. This is in addition to Dallah’s distribution and manufacturing capability vis-a-vis herbal medicines and cosmetic products. Dallah further operates and manages other hospitals in the Kingdom (3% of revenue in FY 12A).
Ownership and management
Shareholders
Dallah Al Baraka Holding 51.7%
Tarek Othman El Kasabi 5.2%
Mohamad Rashed Al Fakih 5.2%
Kamel Family 4.2%
Asir company for trading 3.5%
Public 30.1%
Source: Zawya
Board of Directors
Mr. Tariq Othman Alqasabi Chairman
Dr. Mohammed Rashid Alfagih Director
Ammar Hasan Kamel Director
Fahad Abdullah Algassem Director
Fahad Siraj Malaikah Director
Dr. Ahmad Saleh Babaeer Director
Dr. Abdulrahman Abdulaziz Alsuwailem Director
Fares Ibrahim Alhumaid Director
Mohiuddin Saleh Kamel Director
Source: Company data
Dallah Healthcare Holding Co.
Year-end 2011 2012 2013e 2014e 2015e 2016e
Income statement (SAR mn)
Sales revenue 527.3 637.1 732.4 773.7 880.9 1,040.2
Gross profit 188.0 243.6 304.4 329.0 362.4 426.9
SG&A (90.1) (112.6) (183.1) (181.8) (176.2) (185.2)
EBITDA 123.4 159.9 157.9 189.0 233.2 290.3
Depreciation & Amortisation (25.5) (28.9) (36.7) (41.8) (47.0) (48.5)
EBIT 97.9 131.0 121.3 147.2 186.2 241.8
Net interest income(expense) (2.2) (2.7) (1.9) (4.0) (8.0) (9.7)
Associates/affiliates — — — — — —
Exceptionals/extraordinaries — — — — — —
Other pre-tax income/(expense) 21.4 6.7 11.0 11.6 12.3 12.5
Profit before tax 117.2 135.1 130.3 154.8 190.5 244.5
Zakat (3.8) (1.7) (18.2) (3.7) (4.7) (6.0)
Minorities — — — — — —
Other post-tax income/(expense) — — — — — —
Net profit 113.4 133.4 112.1 151.1 185.8 238.5
Arqaam adjustments (including dilution) — — — — — —
Arqaam Net profit 113.4 133.4 112.1 151.1 185.8 238.5
Year-end 2011 2012 2013e 2014e 2015e 2016e
Balance sheet (SAR mn)
Cash and equivalents 85.0 560.5 309.0 239.4 282.5 300.1
Receivables 124.3 159.8 184.6 197.1 226.9 270.7
Inventories 30.5 33.8 37.5 40.2 48.3 58.8
Tangible fixed assets 380.3 437.6 657.7 824.9 965.9 990.1
Other assets including goodwill 78.4 81.1 193.2 193.2 193.2 193.2
Total assets 698.3 1,272.7 1,381.9 1,494.9 1,716.7 1,812.9
Payables 50.4 54.9 61.0 64.6 76.7 92.4
Interest bearing debt 77.1 5.0 43.0 58.0 143.0 100.0
Other liabilities 102.1 97.3 100.7 104.4 108.3 112.5
Total liabilities 229.6 157.2 204.7 226.9 328.0 304.9
Shareholders equity 468.8 1,115.6 1,177.3 1,267.9 1,388.7 1,507.9
Minorities — — — — — —
Total liabilities & shareholders equity 698.3 1,272.7 1,381.9 1,494.9 1,716.7 1,812.9
Year-end 2011 2012 2013e 2014e 2015e 2016e
Cash flow (SAR mn)
Cashflow from operations 138.2 142.7 129.8 185.0 211.0 252.6
Net capex (72.2) (86.4) (256.7) (209.1) (187.9) (72.8)
Free cash flow 66.0 56.3 (127.0) (24.1) 23.1 179.7
Equity raised/(bought back) — — — — — —
Dividends paid (105.1) (6.5) (50.5) (60.4) (65.0) (119.2)
Net inc/(dec) in borrowings 77.1 (72.0) 38.0 15.0 85.0 (43.0)
Other investing/financing cash flows (9.6) (4.0) (112.0) — — —
Net cash flow 28.4 (26.2) (251.5) (69.5) 43.1 17.5
Change in working capital (29.3) (62.9) (22.5) (11.6) (25.7) (38.7)
Mohammad Kamal Dahlia Sabaayon, CFA [email protected] Arqaam Capital Research Offshore s.a.l +9714 507 1743

September 18 2013
Dallah Healthcare Holding Co. © Copyright 2013, Arqaam Capital Limited. All Rights Reserved. See Important Notice. 33
2x expansion in bed capacity drives 20% 5-yr forecast EPS CAGR,
as substantial cash position (27% assets) is deployed
Initiate with Buy and SAR 88 FVE Dallah Healthcare Holding offers direct exposure to private healthcare in KSA, and in
particular the premium healthcare industry in Riyadh. We believe that the premium
healthcare industry in KSA is attractive due to the marked differential in average claims (SAR
940/patient visit, vs. SAR 570, 65%), which in turn implies superior operating leverage. The
business is linked with a strong domestic brand name, and holds 16% of the market for private
hospital beds in Riyadh, which is substantial.
Exhibit 55: 46% of revenues are generated by insurance claimants, cash-paying patients accounted for 30% of revenues in FY 12A
Source: Company Data, Arqaam Capital Research
Exhibit 56: Business volumes to double by FY17e; revenue mix to remain unchanged ………………………………………………………..
Source: Company Data, Arqaam Capital Research
Exhibit 57: 370 new beds (2x) over the next 5 years drive patient admissions
FY 10A FY 11A FY 12A FY 13e FY 14e FY 15e FY 16e FY 17e
Number of clinics 103 113 113 139 139 284 284 284
Number of beds 361 352 352 422 422 422 722 722
Inpatient admissions growth 1.5% (2.8%) 9.5% 11.3% 3.8% 1.8% 12.7% 10.8%
Outpatient admissions growth 9.0% 7.2% 12.1% 8.8% 2.4% 1.2% 14.9% 12.9%
Source: Company Data, Arqaam Capital Research
Bed capacity rollout to produce 16% 5-yr revenue CAGR in primary business lines: We expect
inpatient as well as outpatient visitation to rise c.2x by FY 17e following the planned expansion
in bed capacity (722 beds in FY 17e vs. 352 in H1 13A, 100% growth). Concurrently, the total
number of clinics operating within the Dallah network should reach 284 (vs. 139 clinics in FY
12A, +105%). Dallah intends to (i) launch a new paediatric building adjacent to its existing
hospital in Riyadh with a total capacity of 60 beds and 20 clinics, and (ii) build a new hospital in
West Riyadh with 300 beds and 80 outpatient clinics, which we expect to launch operations in
FY 16e.
Insurance companies
46%
Cash clients 30%
Companies 20%
Government 3%
Others 1%
Revenue breakdown by client FY 12A
264 265 313 355 376 397 463 536 261 304
359 399 416
501 605
713
27 32 49
57 65 81
102
115
--
200
400
600
800
1,000
1,200
1,400
1,600
FY 10A FY 11A FY 12A FY 13e FY 14e FY 15e FY 16e FY 17e
Gross revenue breakdown by segment (SAR mn)
Inpatient revenues Outpatient revenues Pharma revenues Others

September 18 2013
Dallah Healthcare Holding Co. © Copyright 2013, Arqaam Capital Limited. All Rights Reserved. See Important Notice. 34
The company’s pharmaceuticals vertical holds potential to post 5-yr CAGR of 17% as a result
of Dallah’s foray into the manufacture of medical and herbal products: Dallah initially held
exclusive distribution rights for 57 pharmaceutical and medical products and 8 cosmetic
brands, across the Kingdom. In H1 13A, the business acquired a manufacturing facility in
Jeddah for SAR 38mn, which allowed access to a portfolio of 30 medical and herbal products.
We expect the distribution portfolio and the newly introduced manufacturing line to
contribute 10% of revenues in FY 16e (currently 7%).
A mix of IPO proceeds and new debt to fund the roll out of Dallah’s growth strategy: The
CAPEX bill behind all projects amounts to SAR 610mn, of which SAR 100mn has been incurred,
with the remaining SAR 510mn financed through (i) SAR 360mn from IPO proceeds, (ii) an SAR
100mn soft loan from the Ministry of Finance at favorable terms, and (iii) SAR 49mn via
operations.
We warrant premium multiples: Our price target implies a c. 30% premium to the regional
peer group on FY 14e PE, which we find appropriate given (i) capacity-led growth, and (ii)
stronger pricing power vs. peers (30% cash-paying clients) at Dallah.
Exhibit 58: At par with local peers on FY 14e EPS
PE EV/EBITDA
At market price FY 13e FY 14e FY 15e FY 13e FY 14e FY 15e
Dallah Healthcare 26.1 19.3 15.7 16.8 14.0 11.4
Average local peers 23.0 19.3 16.9 16.2 13.9 12.3
Premium/ (discount) 13% 0% -7% 4% 1% -7%
Average regional peers 21.0 17.6 15.9 14.3 12.3 11.1
Premium/ (discount) 24% 11% -1% 18% 15% 4%
Source: Company Data, Arqaam Capital Research

September 18 2013
Dallah Healthcare Holding Co. © Copyright 2013, Arqaam Capital Limited. All Rights Reserved. See Important Notice. 35
Valuation: Strongest EPS CAGR in our healthcare coverage space
warrants premium to regional peer set
40% upside potential to our FVE of 88/share; Initiate with Buy
15% discount to EM peers is unwarranted in context of margin strength and growth
Current market price reflects discount to Emerging peer set: current market valuation implies
a 15% discount to EM peers on FY 15e EPS. We argue for superior multiples in favour of
Dallah, given its substantial margin advantage (net margin 21% vs. 10% EM) and higher EPS
growth (18% vs.14% EM). We believe the market is overlooking the role of bed capacity growth
on EPS at current multiples. We initiate with a Buy recommendation and SAR 88 FVE.
Exhibit 59: Dallah trades at 10% discount to EM peers on FY 14e P/E, 15% on FY 15e P/E
Mkt Cap P/E EV/EBITDA RoE EBITDA margin Net margin EPS growth
Short Name Country (USDmn) FY 13e FY 14e FY 15e FY 13e FY 14e FY 15e FY 12A FY 12A FY 12A FY 12A
MEDICLINIC South Africa 6,197 21.4 21.4 18.6 12.9 14.1 14.1 12% 21% 6% 20%
LIFE HEALTHCARE South Africa 3,811 22.2 19.3 16.7 10.0 11.3 12.6 40% 26% 14% 17%
ODONTOPREV S.A. Brazil 2,137 25.4 22.1 19.9 13.2 15.2 17.6 20% 22% 15% 4%
APOLLO HOSPITALS India 1,885 33.5 33.5 27.3 14.1 17.3 17.3 10% 18% 7% 13%
DIAGNOSTICOS D.A. Brazil 1,521 24.7 16.2 14.0 7.0 8.1 9.5 3% 18% 4% NA
RAFFLES MEDICAL Singapore 1,329 25.9 22.8 20.0 14.1 16.2 18.3 16% 22% 18% 11%
FLEURY SA Brazil 1,262 20.1 15.5 12.9 6.8 8.0 9.4 6% 21% 7% 17%
EM average
24.8 21.5 18.5 11.2 12.9 14.1 15% 21% 10% 14%
Dallah KSA 777 26.0 19.3 15.7 16.8 14.0 11.4 12% 25% 21% 18%
Premium/(discount)
5% (10%) (15%) 50% 9% (20%)
Source: Bloomberg, Company Data, Arqaam Capital Research

September 18 2013
Dallah Healthcare Holding Co. © Copyright 2013, Arqaam Capital Limited. All Rights Reserved. See Important Notice. 36
DCF summary
Exhibit 60: DCF summary
Source: Company Data, Arqaam Capital Research *FCF calculation based on adjusted EBIT rather than net income
We value Dallah at SAR 88/share, implying 40% upside potential from current market price,
using DCF. We apply a WACC of 9.5% (11.0% Re, 0.85 Beta, 5% Rd) and a terminal growth rate
of 4%. Our price target implies a c.30% premium to regional peer group on FY 14e PE, which
we find appropriate given strong growth potential (20% 5-yr EPS CAGR) and higher price-
setting power vs. peers (30% cash-paying clients).
Risks Client composition: Dallah’s target patient subset (30% cash business) may drop in numbers
due to rising health insurance coverage among Saudis, affecting margins and working capital.
Delays in the launch of the West Riyadh Hospital (15% revenues in FY 17e).
Saudisation requirements may become more stringent, impacting EBITDA margins. A 10%
increase in wages produces a 1.5% cut to EBITDA margins and 6% to EV.
DCF summary
SARmn unless otherwise stated FY 13e FY 14e FY 15e FY 16e FY 17e FY 18e FY 19e FY 20e
EBIT (1-τ) 103 144 182 236 251 309 369 392
Depreciation & Amortization 37 42 47 49 56 70 74 76
EBITDA 140 185 229 284 307 379 443 467
Working Capital Changes (22) (12) (26) (39) (45) (92) (33) (32)
Operating Cash Flow 117 174 203 246 262 287 410 435
Purchase of PPE (257) (209) (188) (73) (83) (106) (111) (114)
Free Cash Flow to Firm (139) (35) 15 173 179 182 299 322
Discount Factor using WACC at 9.5% 0.97 0.89 0.81 0.74 0.68 0.62 0.56 0.52
PV of Visible FCFF (41) (31) 12 128 121 112 169 166
Terminal Value 6,082
Equity Valuation WACC parameters
PV of Visible FCFF 636 Rf 4.20%
PV of Terminal Value 3,135 EMRP 8.00%
Enterprise Value 3,771 Adjusted Beta 0.85
Cost of Equity 11.00%
Cash & Cash Equivalents 272
Less: Net (Debt) Funds (9) Marginal tax rate 2.50%
Investments in associates 124
NCI -- Cost of Debt 5.00%
D/C (market) 25.00%
Equity Value 4,158 WACC 9.50%
NOSH 47 Perpetual grow th 4.00%
Equity Value per Share 88
Implied multiples
EV/EBITDA 27.0 20.3 16.5 13.3 12.3 9.9 8.5 8.1
P/E 37.1 27.5 22.4 17.4 16.2 13.0 10.8 10.2
P/B 3.5 3.3 3.0 2.8 2.5 2.3 2.1 1.9

September 18 2013
Dallah Healthcare Holding Co. © Copyright 2013, Arqaam Capital Limited. All Rights Reserved. See Important Notice. 37
Business trends
Exhibit 61: Outpatient visitation to nearly double by FY 17e
Source: Company Data, Arqaam Capital Research
Exhibit 62: Inpatient visitation to rise on the launch of new facilities (namely West Riyadh Hospital, FY 16e)
Source: Company Data, Arqaam Capital Research
Exhibit 63: Margins likely to dip on higher pre-operating costs of current expansion
Source: Company Data, Arqaam Capital Research
Exhibit 64: Margins to revert to 20%+ NPM by FY 15e
Source: Company Data, Arqaam Capital Research
Exhibit 65: We model for further leverage to fund growth
Source: Company Data, Arqaam Capital Research
Exhibit 66: Free cash flow to turn positive by FY 15e
Source: Company Data, Arqaam Capital Research
261 304 359 399 416 430
504 580
--
200
400
600
800
1,000
1,200
--
100
200
300
400
500
600
700
FY 10A FY 11A FY 12A FY 13e FY 14e FY 15e FY 16e FY 17e
(SAR mn)
Outpatient revenues Outpatient admissions ('000)
264 265 313
355 376 390 449
507
--
5
10
15
20
25
30
35
40
45
50
--
100
200
300
400
500
600
FY 10A FY 11A FY 12A FY 13e FY 14e FY 15e FY 16e FY 17e
(SAR mn)
Inpatient revenues Inpatient admissions ('000)
107 123
160 158
189
233
290 313
--
50
100
150
200
250
300
350
--%
5.00%
10.00%
15.00%
20.00%
25.00%
30.00%
FY 10A FY 11A FY 12A FY 13e FY 14e FY 15e FY 16e FY 17e
(SAR mn)
EBITDA EBITDA margin
94 113
133 112
151
186
238 257
--
50
100
150
200
250
300
--%
5.0%
10.0%
15.0%
20.0%
25.0%
FY 10A FY 11A FY 12A FY 13e FY 14e FY 15e FY 16e FY 17e
Net income Net margin
--
50
100
150
200
250
300
FY 10A FY 11A FY 12A FY 13e FY 14e FY 15e FY 16e FY 17e
Capex vs. borrowings (SAR mn)
Capex Debt
103 120 158 139 172 213 262 279
(30)(72)
(86)
(257)
(209) (188)
(65) (73)
(400)
(300)
(200)
(100)
--
100
200
300
400
FY 10A FY 11A FY 12A FY 13e FY 14e FY 15e FY 16e FY 17e
FCF composition
NOPLAT Working capital changes Capex

September 18 2013
Dallah Healthcare Holding Co. © Copyright 2013, Arqaam Capital Limited. All Rights Reserved. See Important Notice. 38
Appendix1: Financials and forecasts
Revenues: volume and pricing elements have driven 16% 3-yr CAGR
Over the past 3 years, revenue growth, which has been solid (16% CAGR) was driven by (i) rising inpatient
and outpatient visitation (89% revenues, 13% CAGR), (ii) a 7% increase in average fees, (iii) growth in
pharmaceuticals revenues (35% CAGR), and (iv) the introduction of the Operations and Management
segment (3% revenues).
-Hospital revenues grew at a CAGR of 13% over the past three years, driven mainly by rising patient
numbers, coupled with a 7% average increase in fees. Going forward, we forecast a 5-year inpatient
revenue CAGR of 17%, reaching SAR 771mn by FY 18e. This is the result of the addition of 70 beds within
a new pediatric unit (H2 13e), and 300 beds (FY 16e) at the West Riyadh hospital. With regards to the
outpatient segment, we forecast a 5-year outpatient revenue CAGR of 16%, as we expect outpatient
visitation to marginally outpace the growth in inpatient revenues. This is the result of the addition of 26
specialty clinics (in the pediatric unit) in FY 13e, 65 clinics by FY 15e within Riyadh hospital, and 80 clinics
by FY 16e in West Riyadh.
- Pharmaceutical revenues have exhibited a 35% CAGR (FY10-12A) on the back of volume growth during
the period. We see a robust 5-year CAGR (FY 13-18e) of 17% in pharmaceutical revenues (SAR 125mn in
FY 18e) going forward. Overall, we see the segment constituting 10% of overall revenues by FY 17e, vs.
7% in H1 13A.
-Operations and Management fees will contribute additional ancillary revenues, as Dallah has entered
into commercial agreements to manage hospitals owned by other parties, as part of its brand promotion
strategy. Currently, Dallah manages Al Khafgy hospital for an average annual fee of SAR 67mn, operating
100 beds and 13 clinics. In addition, Dallah manages the Mahayel Assir hospital at 100 beds and 25 clinics
at a total contract value of SAR 4.5mn, over and above the 10% fee it claims on the facility’s revenues.
The contracts generate recurring income until their expiration in 2016.
Margins
Our margin forecasts suggest EBITDA margin compression in FY 13-14e to 24%, as we assume a
weakening in blended bed utilization rates (along with a rise in operating costs) upon the launch of
Dallah’s pediatric unit (FY 13e), West Riyadh hospital (FY 16e) and the additional 65 beds (FY 15e) at its
existing facility (Riyadh Hospital). Overall, we see a drop in blended EBITDA margins to 22% in FY 13e and
24% in FY 14e.
We see an improvement in margins thereafter as we believe that (i) the pharmaceuticals business (10%
of revenues, FY 16e) should provide margin support in the long run, and (ii) the utilisation rate for the 65
beds and West Riyadh Hospital should gradually ramp up to normalized levels, at c. 55% on average.
Balance sheet
We expect further borrowings to fund expansion CAPEX: By H1 13A, Dallah held a net cash position of
SAR 272mn, having deployed c.50% of IPO proceeds. We expect the business to roll out c.SAR 600mn in
CAPEX over the next 3 years (SAR 508mn on West Riyadh Hospital and SAR 85mn on the addition of 65
clinics within the existing hospital in Riyadh). We incorporate a soft loan from the Ministry of Finance into
our leverage assumptions, which take total debt to c.SAR 150mn by FY 15e (10% D/E, 23x Interest cover).
We consequently expect pressure on free cash flows until FY 15e, largely due to the construction of the
West Riyadh Hospital. We model for positive free cash flow following the completion of the facility, which
we model for in FY 16e.
Dividends
We expect modest dividend payouts in the coming 4 years, as a result of Dallah’s CAPEX program, but
model for better dividend payouts (60%) starting FY 16e.

I n i t i a t i o n R e p o r t
S e p t e m b e r 1 8 2 0 1 3
Mohammad Kamal [email protected] +9714 507 1743
Dahlia Sabaayon, CFA Arqaam Capital Research Offshore s.a.l
UAE – Healthcare and Pharmaceuticals
NMC Health
BUY
Healthcare and Pharmaceuticals / UAE Bloomberg code NMC LN
Market index ASX Index
Price target (local) 440
Upside (%) 40.0
Market data 13/09/2013
Last closing price 314.30
52 Week range 168.7-360.0
Market cap (GBPmn) 584
Market cap (USDmn) 927
Average daily traded value (GBPmn) 0.35
Average daily traded value (USDmn) 0.56
Year-end (local mn) 2012 2013e 2014e 2015e
Revenues 490.1 538.1 594.8 676.8
EBITDA 79.6 91.5 99.9 115.2
Net income 58.9 67.7 73.3 80.4
EPS 0.32 0.36 0.39 0.43
P/E (current price) 15.8 13.8 12.7 11.6
BVPS 1.8 2.1 2.4 2.7
P/B (current price) 2.8 2.4 2.1 1.8
EV/EBITDA (current price) 12.2 10.7 9.8 8.5
Div. yield (%) — 1.5 1.6 1.7
FCF margin (%) (13.0) (17.0) (12.2) (3.9)
Net debt/EBITDA (x) 0.6 1.7 2.4 2.5
Net debt/Capital (%) 7.3 22.2 33.0 35.7
Interest cover (x) 5.3 4.4 4.9 5.5
RoAA (%) 11.0 9.0 9.0 9.1
RoAE (%) 27.3 19.0 17.8 17.0
RoIC (%) 16.1 16.1 16.2 15.7
Well-positioned for mandatory health cover in Northern Emirates
Cheapest valuation profile in our healthcare coverage space (12.7x FY 14e EPS, 9.8x EV/EBITDA): Initiate with Buy and GBp 440 FVE NMC Health offers diversified exposure to the UAE healthcare sector. NMC is a leading domestic healthcare provider with a solid track record of growth (EPS 3-yr CAGR 45%, nearly 2x peer average). We see the business as a strong beneficiary of mandatory health insurance coverage in Dubai and the Northern Emirates, regulation that is expected to be in effect in FY 14e. Taking precedent from Abu Dhabi’s introduction of similar regulation in 2007, we expect the process to catalyse a 4x increase in demand for medical services within a 3-year window across the industry. The business’s positioning via its (i) large presence in the UAE (3 Emirates), and (ii) aggressive expansion (+100% bed capacity, +115% healthcare revenues FY 18e) render it well-positioned for demand growth, and a direct beneficiary of regulatory catalysts. We initiate coverage on NMC with a Buy recommendation and a fair value estimate of GBp 440, offering 40% in upside potential vs. current price. Bed capacity roll out produces 5-yr healthcare revenue CAGR of 17%, but margins to remain flat. We see this resulting from (i) the launch of 4 new medical facilities (Brightpoint Hospital, DIP Hospital, Mussafah Day patient center, and Khalifa City Hospital), coupled with (ii) a ramp up in occupancy rates at existing hospitals- and in particular Al Ain Hospital and Dubai Hospital (on higher healthcare demand following the implementation of mandatory healthcare cover). To fund expansion, NMC raised USD 168mn in IPO capital in March 2012, which we believe will cover 55% of planned CAPEX. Margins: though we expect bed occupancy at existing medical facilities (Dubai and Al Ain) to improve in the short run, we suspect that pre-operating costs at Brightpoint hospital will render margins flat over the next 2 years. We see blended EBITDA margin at 17.6% in FY 16e (+140bps vs. FY 12A). Stock offers deep value, trades at deep discount to EM and regional peers: At 12.7x FY 14e P/E, NMC is the cheapest stock in our healthcare coverage space. We believe NMC is trading at an unwarranted 30% discount to peers, given its domestic footprint, access and exposure to regulatory catalysts, growth (3-yr EPS CAGR of 15%), and superior healthcare EBITDA margins of 28% (vs. 25% regional peers). We value NMC at GBp 440/share, implying 40% in upside potential from current price, using DCF.
Risks: Concentration risk: >30% of NMC’s distribution revenues dependent on 5 customers. Specialized doctor costs, which remain variable, may materially impact margins.
GBp 440
© Copyright 2013, Arqaam Capital Limited. All Rights Reserved. See Important Notice.
Price Performance
79
101
123
145
167
189
Sep-12 Dec-12 Mar-13 Jun-13
NMC LN

September 18 2013
NMC Health © Copyright 2013, Arqaam Capital Limited. All Rights Reserved. See Important Notice. 40
Abacus Arqaam Capital Fundamental Data
Profitability
Growth
Gearing
Valuation
0%
10%
20%
2012 2013e 2014e 2015e 2016e
EBITDA Margin Net Margin
0%
50%
100%
150%
2012 2013e 2014e 2015e 2016e
Revenues Assets
0%
20%
40%
0.0
1.0
2.0
3.0
2012 2013e 2014e 2015e 2016e
Net Debt/Capital Net Debt/EBITDA
0
10
20
30
2012 2013e 2014e 2015e 2016e
P/E P/E Sector
NMC Health
Year-end 2011 2012 2013e 2014e 2015e 2016e
Financial summary
Reported EPS 0.23 0.32 0.36 0.39 0.43 0.52
Diluted EPS 0.23 0.32 0.36 0.39 0.43 0.52
DPS — — 0.07 0.08 0.09 0.10
BVPS 0.54 1.79 2.06 2.37 2.72 3.14
Weighted average shares 185.71 185.71 185.71 185.71 185.71 185.71
Average market cap — 356 539 539 539 539
Year-end 2011 2012 2013e 2014e 2015e 2016e
Valuation metrics
P/E (x) (current price) 21.7 15.8 13.8 12.7 11.6 9.6
P/E (x) (target price) 30.2 22.0 19.2 17.7 16.1 13.4
P/BV (x) (target price) 12.9 3.9 3.4 2.9 2.6 2.2
EV/EBITDA (x) (target price) 18.6 16.5 14.3 13.1 11.4 9.7
EV/FCF (x) (218.4) (32.6) (22.7) (28.7) (79.6) 124.8
EV/Invested capital (x) 15.3 4.6 4.1 3.8 3.3 3.0
Dividend yield (%) — — 1.5 1.6 1.7 2.1
Year-end 2011 2012 2013e 2014e 2015e 2016e
Growth (%)
Revenues 14.8 10.4 9.8 10.5 13.8 13.3
EBITDA 24.9 13.0 15.0 9.1 15.3 17.0
EBIT 36.5 24.3 11.1 10.3 10.3 17.0
Net income 103.8 37.0 15.0 8.2 9.7 20.2
Year-end 2011 2012 2013e 2014e 2015e 2016e
Margins (%)
EBITDA 15.9 16.2 17.0 16.8 17.0 17.6
EBIT 13.2 14.8 15.0 15.0 14.5 15.0
Net 9.7 12.0 12.6 12.3 11.9 12.6
Year-end 2011 2012 2013e 2014e 2015e 2016e
Returns (%)
RoAA 11.1 11.0 9.0 9.0 9.1 9.9
RoAE 42.3 27.3 19.0 17.8 17.0 17.8
RoIC 43.0 16.1 16.1 16.2 15.7 16.4
FCF margin (2.1) (13.0) (17.0) (12.2) (3.9) 2.2
Year-end 2011 2012 2013e 2014e 2015e 2016e
Gearing (%)
Net debt/Capital 45.3 7.3 22.2 33.0 35.7 32.8
Net debt/Equity 127.6 13.9 40.8 55.1 56.5 49.4
Interest cover (x) 3.4 5.3 4.4 4.9 5.5 6.3
Net debt/EBITDA (x) 1.8 0.6 1.7 2.4 2.5 2.1

September 18 2013
NMC Health © Copyright 2013, Arqaam Capital Limited. All Rights Reserved. See Important Notice. 41
Abacus Arqaam Capital Fundamental Data
Company overview
NMC is a leading integrated healthcare provider in the UAE. The business is organised along 2 main segments: healthcare, and distribution and services. NMC currently operates 3 specialty hospitals in Abu Dhabi, Dubai and Al Ain, 1 general hospital in Dubai, 1 day patient medical center in Sharjah, and 8 pharmacies. In 2012, the company acquired an operating day patient medical center in Dubai- the BR Medical Suites in Dubai Healthcare City. In addition, the company plans to develop 2 new hospitals, and 2 medical centers. In 2012, the company’s facilities treated 1.27mn outpatients and 35.2k inpatients, operating 230 beds.
Ownership and management
Shareholders
Bin Butti Saeed 28%
Shetty B R 20%
Bin Butti Khalifa 10%
Infinite Investments LLC 7%
Blackrock 4%
Others 1%
Public 30%
Source: Zawya
Board of Directors
Mr H J Mark Tompkins Chairman
Mr Khalifa Bin Butti Vice Chairman
Mr Justin A S Jew itt Director
Mr Patrick James Meade Director
Mr Heather Law rence Obe Director
HE Saeed Bin Butti Director
Mr Prasanth Manghat Board Secretary
Source: Zawya
NMC Health
Year-end 2011 2012 2013e 2014e 2015e 2016e
Income statement (USD mn)
Sales revenue 443.7 490.1 538.1 594.8 676.8 766.9
Gross profit 137.4 160.3 188.4 206.9 226.8 261.3
SG&A (66.9) (80.6) (96.9) (107.1) (111.7) (126.5)
EBITDA 70.5 79.6 91.5 99.9 115.2 134.7
Depreciation & Amortisation (12.0) (7.0) (10.9) (10.9) (17.0) (19.8)
EBIT 58.4 72.6 80.7 89.0 98.2 114.9
Net interest income(expense) (17.0) (13.7) (18.3) (18.0) (18.0) (18.3)
Associates/affiliates — — — — — —
Exceptionals/extraordinaries — — — — — —
Other pre-tax income/(expense) 2.4 0.9 6.0 3.0 1.0 1.0
Profit before tax 43.8 59.8 68.4 74.0 81.2 97.6
Income tax expenses — — — — — —
Minorities 0.8 0.9 0.7 0.7 0.8 1.0
Other post-tax income/(expense) — — — — — —
Net profit 43.0 58.9 67.7 73.3 80.4 96.6
Arqaam adjustments (including dilution) — — — — — —
Arqaam Net profit 43.0 58.9 67.7 73.3 80.4 96.6
Year-end 2011 2012 2013e 2014e 2015e 2016e
Balance sheet (USD mn)
Cash and equivalents 54.1 257.5 164.2 51.9 9.7 7.0
Receivables 153.5 181.4 206.4 236.3 274.4 315.2
Inventories 54.2 72.5 79.5 91.4 110.9 128.8
Tangible fixed assets 94.9 201.7 339.5 459.1 526.9 566.6
Other assets including goodwill — 2.6 2.6 2.6 2.6 2.6
Total assets 356.6 715.6 792.2 841.3 924.6 1,020.3
Payables 63.9 68.6 76.6 90.3 107.2 123.3
Interest bearing debt 182.2 303.6 320.0 295.0 295.0 295.0
Other liabilities 10.1 11.7 13.3 15.1 17.1 19.5
Total liabilities 256.2 384.0 409.9 400.4 419.4 437.8
Shareholders equity 100.3 331.6 382.3 440.9 505.2 582.5
Minorities 1.1 1.9 2.6 3.4 4.2 5.2
Total liabilities & shareholders equity 356.6 715.6 792.2 841.3 924.5 1,020.3
Year-end 2011 2012 2013e 2014e 2015e 2016e
Cash flow (USD mn)
Cashflow from operations 10.9 41.4 56.1 57.9 58.6 76.2
Net capex (20.4) (105.3) (147.7) (130.5) (84.8) (59.5)
Free cash flow (9.5) (63.9) (91.6) (72.6) (26.1) 16.7
Equity raised/(bought back) — 186.3 — — — —
Dividends paid — — (13.7) (14.7) (16.1) (19.3)
Net inc/(dec) in borrowings (39.9) 90.6 16.4 (25.0) — —
Other investing/financing cash flows 25.0 (152.8) — — — —
Net cash flow (24.4) 60.2 (89.0) (112.3) (42.2) (2.6)
Change in working capital (62.1) (40.1) (24.0) (28.1) (40.8) (42.6)
Mohammad Kamal Dahlia Sabaayon, CFA [email protected] Arqaam Capital Research Offshore s.a.l +9714 507 1743
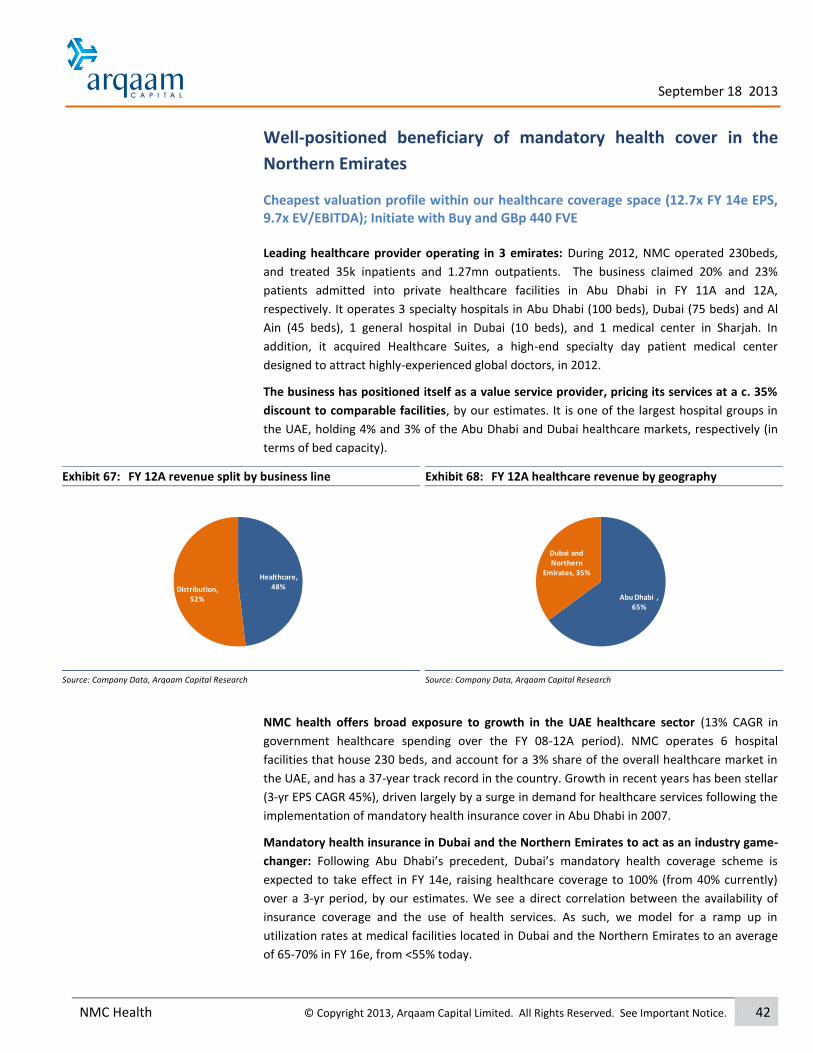
September 18 2013
NMC Health © Copyright 2013, Arqaam Capital Limited. All Rights Reserved. See Important Notice. 42
Well-positioned beneficiary of mandatory health cover in the
Northern Emirates
Cheapest valuation profile within our healthcare coverage space (12.7x FY 14e EPS, 9.7x EV/EBITDA); Initiate with Buy and GBp 440 FVE Leading healthcare provider operating in 3 emirates: During 2012, NMC operated 230beds,
and treated 35k inpatients and 1.27mn outpatients. The business claimed 20% and 23%
patients admitted into private healthcare facilities in Abu Dhabi in FY 11A and 12A,
respectively. It operates 3 specialty hospitals in Abu Dhabi (100 beds), Dubai (75 beds) and Al
Ain (45 beds), 1 general hospital in Dubai (10 beds), and 1 medical center in Sharjah. In
addition, it acquired Healthcare Suites, a high-end specialty day patient medical center
designed to attract highly-experienced global doctors, in 2012.
The business has positioned itself as a value service provider, pricing its services at a c. 35%
discount to comparable facilities, by our estimates. It is one of the largest hospital groups in
the UAE, holding 4% and 3% of the Abu Dhabi and Dubai healthcare markets, respectively (in
terms of bed capacity).
Exhibit 67: FY 12A revenue split by business line
Source: Company Data, Arqaam Capital Research
Exhibit 68: FY 12A healthcare revenue by geography
Source: Company Data, Arqaam Capital Research
NMC health offers broad exposure to growth in the UAE healthcare sector (13% CAGR in
government healthcare spending over the FY 08-12A period). NMC operates 6 hospital
facilities that house 230 beds, and account for a 3% share of the overall healthcare market in
the UAE, and has a 37-year track record in the country. Growth in recent years has been stellar
(3-yr EPS CAGR 45%), driven largely by a surge in demand for healthcare services following the
implementation of mandatory health insurance cover in Abu Dhabi in 2007.
Mandatory health insurance in Dubai and the Northern Emirates to act as an industry game-
changer: Following Abu Dhabi’s precedent, Dubai’s mandatory health coverage scheme is
expected to take effect in FY 14e, raising healthcare coverage to 100% (from 40% currently)
over a 3-yr period, by our estimates. We see a direct correlation between the availability of
insurance coverage and the use of health services. As such, we model for a ramp up in
utilization rates at medical facilities located in Dubai and the Northern Emirates to an average
of 65-70% in FY 16e, from <55% today.
Healthcare, 48%Distribution,
52% Abu Dhabi , 65%
Dubai and Northern
Emirates, 35%

September 18 2013
NMC Health © Copyright 2013, Arqaam Capital Limited. All Rights Reserved. See Important Notice. 43
Exhibit 69: 4 new facilities over the next 4 years produce 2x growth in bed capacity
FY 12A FY 13e FY 14e FY 15e FY 16e FY 17e
Healthcare revenues (USD mn) 252 272 311 353 404 425
% growth 15% 8% 14% 14% 14% 5%
bed capacity 230 280 415 465 640 640
% growth 0% 22% 48% 12% 38% 0%
Total patients (mn) 1.89 1.94 2.15 2.42 2.70 2.91
% growth 10% 3% 11% 13% 12% 8%
Source: Company Data, Arqaam Capital Research
Bed capacity roll out to produce 5-yr healthcare revenue CAGR of 17%:. We see this resulting
from (i) the launch of 4 new medical facilities (Brightpoint Hospital, DIP Hospital, Mussafah Day
patient center, and Khalifa City Hospital), coupled with (ii) a ramp up in occupancy rates at
existing hospitals- and in particular Al Ain Hospital and Dubai hospital (on higher healthcare
demand following the implementation of mandatory healthcare cover).
Margins: though we expect bed occupancy at existing medical facilities (Dubai and Al Ain) to
improve in the short run, we suspect that pre-operating costs at Brightpoint and DIP hospitals
will render margins flat over the next 2 years. We see EBITDA margin at 18% in FY 16e
(+180bps vs. FY 12A).
Discount to regional and emerging peers is unwarranted: We value NMC at GBp 440/share,
implying 40% in upside potential from current market price, using DCF. We believe NMC is
trading at an unwarranted 30% and 40% discounts to regional and emerging peers,
respectively, given (i) its access and exposure to regulatory catalysts, (ii) strong growth outlook
(5-yr revenue CAGR of 17%, a result of the 4 new facilities that will be launched in the coming
year), and (iii) superior healthcare EBITDA margins of 28% (vs. 25% for regional peers).
Exhibit 70: NMC currently trades at a deep discount to EM on FY 13-14e EPS
P/E EV/EBITDA RoE EBITDA margin Net margin EPS growth
FY 13e FY 14e FY 15e FY 13e FY 14e FY 15e FY 12A FY 12A FY 12A FY 12A
EM healthcare peers 24.8 21.5 18.5 11.2 12.9 14.1 15% 21% 10% 14%
NMC Health 13.8 12.7 11.5 10.7 9.8 8.5 18% 28% 12% 37%
Premium/(discount) to peers (44%) (41%) (38%) (6%) (24%) (40%)
Source: Bloomberg, Company Data, Arqaam Capital Research

September 18 2013
NMC Health © Copyright 2013, Arqaam Capital Limited. All Rights Reserved. See Important Notice. 44
Valuation: 30% discount to regional peer group, 40% to EM set. Stock
should re-rate on multiple expansion. Market yet to acknowledge
superior growth (15% EPS CAGR) and EBITDA margins (28% vs. 25%
peers)
40% upside to current market price; Initiate with Buy and GBp 440/share FVE
Exhibit 71: Unwarranted 30% discount to regional peer group on FY 14e current P/E
PE EV/EBITDA
At market price FY 13e FY 14e FY 15e FY 13e FY 14e FY 15e
Dallah Healthcare 26.0 19.3 15.7 16.8 14.0 11.4
Mouwasat 18.1 15.2 14.2 14.7 12.2 11.9
National Medical Care 24.8 23.4 20.8 17.1 15.5 13.6
NMC Health 13.8 12.7 11.5 10.7 9.8 8.5
Al Noor Hospitals Group 23.1 17.5 17.2 12.5 10.0 9.7
Average regional peers 21.2 17.6 15.9 14.3 12.3 11.1
Premium/ (discount) -35% -28% -27% -26% -20% -23%
Source: Company Data, Arqaam Capital Research
At 12.7x FY 14e P/E, NMC is the cheapest stock in our healthcare coverage space. We believe
the market has assigned an unwarranted 30% discount on NMC vs. regional peers. The
business continues to exhibit growth on par with the industry, and margins that are ahead of
comparable businesses. Regulatory change will act as a positive demand catalyst in the next 2
years, and no other healthcare stock in MENA affords access to the implementation of
mandatory health cover in Dubai and the Northern Emirates.
Exhibit 72: Market discounting NMC on low blended margins (due to
distribution business) but ignores (i) superior healthcare margins (28% NMC vs. 25% peers) and (ii) strategic value of distribution business
Source: Company Data, Arqaam Capital Research
Exhibit 73: Attractive in terms of EPS CAGR: growth outlook second only to Dallah (Buy, SAR 88), but market valuation remains cheapest among peers …………………………………………………………
Source: Company Data, Arqaam Capital Research
DALLAH
MOUWASAT
CARE
NMC
Al Noor
10.0
12.0
14.0
16.0
18.0
20.0
22.0
24.0
15% 20% 25% 30% 35%
FY 14e EBITDA margin
PE 14e
DALLAH
MOUWASAT
CARE
NMC
Al Noor
10
12
14
16
18
20
22
24
5% 10% 15% 20% 25%
5-yr EPS CAGR
PE 14e

September 18 2013
NMC Health © Copyright 2013, Arqaam Capital Limited. All Rights Reserved. See Important Notice. 45
Cheap in EM context We place our valuation in an EM context: current market valuation implies a >35% discount to
EM peers on FY 13-15e EPS, which we find offers a highly attractive entry point given superior
margins (EBITDA margin 28% vs. 21% EM) and above-average returns (RoE 18% vs.15% EM).
Exhibit 74: NMC currently trades at a deep discount to EM on FY 13-14e EPS
Mkt Cap P/E EV/EBITDA RoE EBITDA margin Net margin EPS growth
Short Name Country (USDmn) FY 13e FY 14e FY 15e FY 13e FY 14e FY 15e FY 12A FY 12A FY 12A FY 12A
MEDICLINIC South Africa 6,197 21.4 21.4 18.6 12.9 14.1 14.1 12% 21% 6% 20%
LIFE HEALTHCARE South Africa 3,811 22.2 19.3 16.7 10.0 11.3 12.6 40% 26% 14% 17%
ODONTOPREV S.A. Brazil 2,137 25.4 22.1 19.9 13.2 15.2 17.6 20% 22% 15% 4%
APOLLO HOSPITALS India 1,885 33.5 33.5 27.3 14.1 17.3 17.3 10% 18% 7% 13%
DIAGNOSTICOS D.A. Brazil 1,521 24.7 16.2 14.0 7.0 8.1 9.5 3% 18% 4% NA
RAFFLES MEDICAL Singapore 1,329 25.9 22.8 20.0 14.1 16.2 18.3 16% 22% 18% 11%
FLEURY SA Brazil 1,262 20.1 15.5 12.9 6.8 8.0 9.4 6% 21% 7% 17%
EM average
24.8 21.5 18.5 11.2 12.9 14.1 15% 21% 10% 14%
NMC Health UAE 919 13.8 12.7 11.4 10.7 9.8 8.5 18% 28% 12% 37%
Premium/(discount)
(45%) (41%) (38%) (13%) (24%) (40%)
Source: Bloomberg, Company Data, Arqaam Capital Research
Risks Further delays in the launch of Brightpoint hospital (FY 17e 10% healthcare revenues, 22%
bed count), which was initially set for opening in H2 12. Concentration: With >30% of NMC’s
distribution revenues dependent on 5 customers, this suggests downside risk in the event of a
loss of exclusive distribution rights for this specific subset of suppliers. Higher than expected
specialised doctors costs could materially impact margin and cash flows.
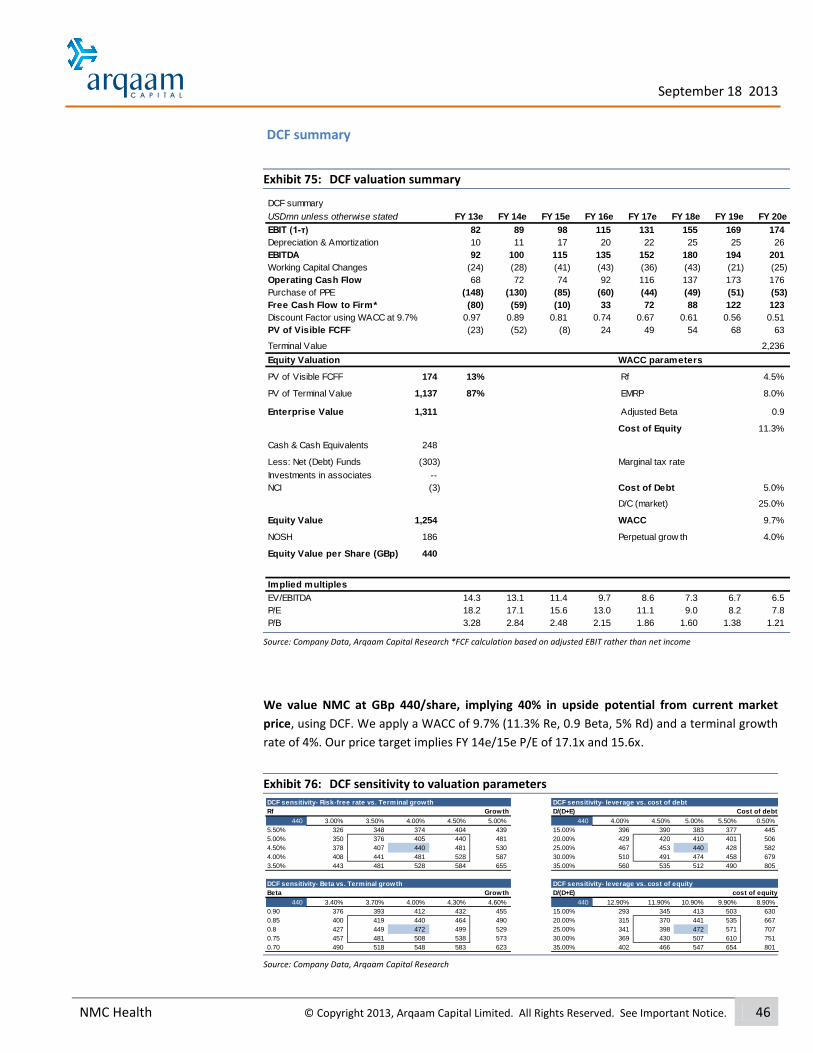
September 18 2013
NMC Health © Copyright 2013, Arqaam Capital Limited. All Rights Reserved. See Important Notice. 46
DCF summary
We value NMC at GBp 440/share, implying 40% in upside potential from current market
price, using DCF. We apply a WACC of 9.7% (11.3% Re, 0.9 Beta, 5% Rd) and a terminal growth
rate of 4%. Our price target implies FY 14e/15e P/E of 17.1x and 15.6x.
Exhibit 75: DCF valuation summary
Source: Company Data, Arqaam Capital Research *FCF calculation based on adjusted EBIT rather than net income
Exhibit 76: DCF sensitivity to valuation parameters
Source: Company Data, Arqaam Capital Research
DCF summary
USDmn unless otherwise stated FY 13e FY 14e FY 15e FY 16e FY 17e FY 18e FY 19e FY 20e
EBIT (1-τ) 82 89 98 115 131 155 169 174
Depreciation & Amortization 10 11 17 20 22 25 25 26
EBITDA 92 100 115 135 152 180 194 201
Working Capital Changes (24) (28) (41) (43) (36) (43) (21) (25)
Operating Cash Flow 68 72 74 92 116 137 173 176
Purchase of PPE (148) (130) (85) (60) (44) (49) (51) (53)
Free Cash Flow to Firm* (80) (59) (10) 33 72 88 122 123
Discount Factor using WACC at 9.7% 0.97 0.89 0.81 0.74 0.67 0.61 0.56 0.51
PV of Visible FCFF (23) (52) (8) 24 49 54 68 63
Terminal Value 2,236
Equity Valuation WACC parameters
PV of Visible FCFF 174 13% Rf 4.5%
PV of Terminal Value 1,137 87% EMRP 8.0%
Enterprise Value 1,311 Adjusted Beta 0.9
Cost of Equity 11.3%
Cash & Cash Equivalents 248
Less: Net (Debt) Funds (303) Marginal tax rate
Investments in associates --
NCI (3) Cost of Debt 5.0%
D/C (market) 25.0%
Equity Value 1,254 WACC 9.7%
NOSH 186 Perpetual grow th 4.0%
Equity Value per Share (GBp) 440
Implied multiples
EV/EBITDA 14.3 13.1 11.4 9.7 8.6 7.3 6.7 6.5
P/E 18.2 17.1 15.6 13.0 11.1 9.0 8.2 7.8
P/B 3.28 2.84 2.48 2.15 1.86 1.60 1.38 1.21
DCF sensitivity- Risk-free rate vs. Terminal growth DCF sensitivity- leverage vs. cost of debt
Rf Growth D/(D+E) Cost of debt
440 3.00% 3.50% 4.00% 4.50% 5.00% 440 4.00% 4.50% 5.00% 5.50% 0.50%
5.50% 326 348 374 404 439 15.00% 396 390 383 377 445
5.00% 350 376 405 440 481 20.00% 429 420 410 401 506
4.50% 378 407 440 481 530 25.00% 467 453 440 428 582
4.00% 408 441 481 528 587 30.00% 510 491 474 458 679
3.50% 443 481 528 584 655 35.00% 560 535 512 490 805
DCF sensitivity- Beta vs. Terminal growth DCF sensitivity- leverage vs. cost of equity
Beta Growth D/(D+E) cost of equity
440 3.40% 3.70% 4.00% 4.30% 4.60% 440 12.90% 11.90% 10.90% 9.90% 8.90%
0.90 376 393 412 432 455 15.00% 293 345 413 503 630
0.85 400 419 440 464 490 20.00% 315 370 441 535 667
0.8 427 449 472 499 529 25.00% 341 398 472 571 707
0.75 457 481 508 538 573 30.00% 369 430 507 610 751
0.70 490 518 548 583 623 35.00% 402 466 547 654 801

September 18 2013
NMC Health © Copyright 2013, Arqaam Capital Limited. All Rights Reserved. See Important Notice. 47
Business trends
Exhibit 77: NMC revenues evenly split between healthcare and distribution business lines
Source: Company Data, Arqaam Capital Research
Exhibit 78: Expansions and improvement in bed utilisation rates drive healthcare revenue CAGR > 14%
Source: Company Data, Arqaam Capital Research
Exhibit 79: Margins to remain flat with the opening of new hospitals…
Source: Company Data, Arqaam Capital Research
Exhibit 80: ...but are expected to improve as utilization rates on new facilities ramp up in FY 15e
Source: Company Data, Arqaam Capital Research
Exhibit 81: Leverage to rise to fund expansion (USD 290mn CAPEX)
Source: Company Data, Arqaam Capital Research
Exhibit 82: FCF to turn positive in FY 15e+
Source: Company Data, Arqaam Capital Research
182 219 252 274 313 377 448 506
229 253
271 294
316 339
364 387
--
100
200
300
400
500
600
700
800
900
1,000
FY 10A FY 11A FY 12A FY 13e FY 14e FY 15e FY 16e FY 17e
Revenue breakdown by segment (USD mn)
Healthcare revenues Distrubution revenues
--
50
100
150
200
250
300
350
400
450
FY 10A FY 11A FY 12A FY 13e FY 14e FY 15e FY 16e FY 17e
Healthcare revenues by hospital (USD mn)
AD specialty Dubai specialty Al Ain specialty Dubai general Sharjah MC
Health Suites Brightpoint Mussafah DIP Khalifa City
10%
11%
12%
13%
14%
15%
16%
17%
18%
19%
20%
--
20
40
60
80
100
120
140
160
180
FY 10A FY 11A FY 12A FY 13e FY 14e FY 15e FY 16e FY 17e
(USD mn)
EBITDA EBITDA margin
5%
6%
7%
8%
9%
10%
11%
12%
13%
14%
--
20
40
60
80
100
120
FY 10A FY 11A FY 12A FY 13e FY 14e FY 15e FY 16e FY 17e
(USD mn)
Net income Net margin
-
0.5
1.0
1.5
2.0
2.5
--
20
40
60
80
100
120
140
160
FY 10A FY 11A FY 12A FY 13e FY 14e FY 15e FY 16e FY 17e
(USD mn)
Capex Net D/E
-20%
-15%
-10%
-5%
0%
5%
10%
15%
(100)
(80)
(60)
(40)
(20)
--
20
40
60
80
100
FY 10A FY 11A FY 12A FY 13e FY 14e FY 15e FY 16e FY 17e
(USD mn)
FCF FCF margin

September 18 2013
NMC Health © Copyright 2013, Arqaam Capital Limited. All Rights Reserved. See Important Notice. 48
Appendix 1: Leading healthcare provider and distributor
NMC is a leading integrated private healthcare provider in the UAE, in terms of patient
visitation and bed capacity. During FY 12A, the business operated 230 beds and treated
c.1.5mn patients at its network of facilities in the UAE. The network includes hospitals, a day
patient medical center, and pharmacies across the UAE, placing it as one of the largest
integrated private sector healthcare companies in the region.
The business is best viewed as 2 distinct segments: (i) healthcare, and (ii) distribution and
services.
Healthcare
Existing facilities
NMC currently operates 3 specialty hospitals in Abu Dhabi, Dubai and Al Ain, 1 general hospital
in Dubai, and 1 medical center in Sharjah. During 2012, the company acquired healthcare
Suites from Dr. B.R Shetty, current NMC CEO, for a total consideration of USD 9mn. Thereafter,
NMC incurred a further c.USD 5mn on equipment and refurbishment costs related to the
facility. Healthcare Suites is a high-end specialty day patient medical center in Dubai
Healthcare City launched in 2011. The 3 specialty hospitals enjoy high bed occupancy rates
(with the Abu Dhabi NMC facility registering the highest rates, at 68% in FY 12A), and provide
treatments in over 30 medical departments. Medical departments include specialty services in
cardiology, cardiothoracic surgery, endocrinology, gastroenterology, in-vitro fertilisation,
nephrology and dialysis, neurology and neurosurgery, oncology, paediatrics and neonatology,
pulmonology and urology. Medical centers in the NMC network, on the other hand, offer
general medical services serving residents in the emirates of Dubai, Sharjah and Ajman.
Exhibit 83: NMC- existing healthcare facilities
Existing facilities Region Date of
establishment No. Of
beds Bed
occupancy Total patient
admissions
Abu Dhabi Specialty hospital
Abu Dhabi 1976 100 68% 911,172
Dubai Specialty hospital Dubai 2004 75 56% 305,776
Al Ain Specialty hospital Al Ain 2008 45 56% 367,811
Dubai General hospital Dubai 1999 10 38% 201,308
Sharjah Medical Center Sharjah 1996 NA NA 121,171
Source: Company Data, Arqaam Capital Research
Expansion plans
(i) Brightpoint Maternity Hospital (Abu Dhabi): NMC is developing a specialty
hospital focused on maternity and pediatric care, and aimed at capitalizing on the
demand for maternity services in the UAE. While the hospital is licensed to
operate 100 beds, only 50 beds will be operational by the launch of the facility in
H2 13e.

September 18 2013
NMC Health © Copyright 2013, Arqaam Capital Limited. All Rights Reserved. See Important Notice. 49
(ii) Mussafah Medical Center (Abu Dhabi): NMC is also developing a new day patient
medical center in Mussafah, a suburb of Abu Dhabi, which we expect to begin
operations later this year. The Mussafah facility will be a general practice day
patient medical center, serving as a group of referral clinics to NMC’s specialty
hospitals. The facility consists of a 2-floor center supported by a pharmacy.
(iii) Dubai Investment Park Hospital (Dubai): Originally planned for launch as a
medical center, the DIPH facility is a general hospital aimed at catering to the
suburban industrial zones on the outskirts of Dubai. Management guidance is for
launch in Q2 14e, at a capacity of 60 beds.
(iv) Khalifa City Hospital: Catering to the growing population of Abu Dhabi’s suburbs,
such as Mussafah, Baniyas and Shahama, NMC is developing a new hospital
facility in Khalifa City, Abu Dhabi. The land for the Khalifa City Hospital has been
granted by the Abu Dhabi Municipality for a nominal annual fee. Construction
work began in 2012, and is due for completion by mid-2014. Khalifa City Hospital
will open at a capacity of 100 beds, and focus on 4 medical specialties
(paediatrics, endocrinology, oncology and cardiology). The hospital is later
expected to expand its bed capacity to 250.
Exhibit 84: 4 new facilities over the next 2 years
Under construction facilities Region Timeline Remaining capex No. Of beds
Brightpoint Hospital Abu Dhabi Q3 13e 20 50
Mussafah Medical Center Abu Dhabi Q4 13e 10 10
DIP Hospital Dubai Q1 14e 40 30
Khalifa City Hospital Abu Dhabi Q1 15e 220 250
Source: Company Data, Arqaam Capital Research
Distribution and services
The segment entails distributing pharmaceutical products, FMCGs (which include both food
and non-food items), educational supplies, cosmetic products, medical and scientific
equipment and veterinary products- over 50,000 products in total, across the UAE. The
segment represents 52% of NMC’s revenues, and 30.5% of EBITDA, as of FY 12A. NMC’s D&S
segment is vertically integrated, and supplies all of the hospitals operated by NMC, in
additional to a broad platform of other hospitals, pharmacies, laboratories, government
institutions (such as the Ministry of Health), and retail outlets in the UAE (such as Boots and
Carrefour).
Exhibit 85: Top 5 suppliers of D&S business in FY 11A
Supplier Segment % of FY 11A distribution revenues
Beiersdorf FMCG 18%
Pfizer Pharma 12%
Jamjoom Pharma 4%
Himalaya FMCG 4%
Unza FMCG 3%
Source: Company Data, Arqaam Capital Research

I n i t i a t i o n R e p o r t
S e p t e m b e r 1 8 2 0 1 3
Mohammad Kamal [email protected] +9714 507 1743
Dahlia Sabaayon, CFA Arqaam Capital Research Offshore s.a.l
Saudi Arabia – Healthcare and
Pharmaceuticals National Medical Care Co.
HOLD
Healthcare and Pharmaceuticals / Saudi Arabia Bloomberg code CARE AB
Market index SASEIDX
Price target (local) 48
Upside (%) -11.5
Market data 12/09/2013
Last closing price 53.75
52 Week range 49.6-200.0
Market cap (SARmn) 2,411
Market cap (USDmn) 643
Average daily traded value (SARmn) 46.9
Average daily traded value (USDmn) 12.5
Year-end (local mn) 2012 2013e 2014e 2015e
Revenues 524.7 557.7 600.5 676.8
EBITDA 131.9 134.9 145.5 163.7
Net income 105.0 97.1 103.0 115.6
EPS 2.34 2.16 2.30 2.58
P/E (current price) 23.0 24.8 23.4 20.9
BVPS 13.6 18.5 19.6 20.9
P/B (current price) 4.0 2.9 2.7 2.6
EV/EBITDA (current price) 17.3 16.9 15.7 13.9
Div. yield (%) 2.0 2.2 2.1 2.4
FCF margin (%) (0.7) (2.6) (2.2) 10.7
Net debt/EBITDA (x) (0.3) (1.1) (0.6) (0.6)
Net debt/Capital (%) (6.2) (16.0) (8.0) (8.9)
Interest cover (x) — 20.5 16.5 15.1
RoAA (%) 14.2 10.3 8.9 9.2
RoAE (%) 18.1 13.5 12.0 12.7
RoIC (%) 15.4 10.6 10.1 10.7
Fundamentals fully priced in at 23.4x FY 14e P/E, 15.7x EV/EBITDA; Initiate with a Hold recommendation and SAR 48 FVE National Medical Care- CARE holds the second largest network of
hospital bed in the Kingdom (420 in FY 12A), and is active in the
wholesale and distribution of pharmaceutical and medical products in the
country. We believe that the market is fully pricing in the impact of bed
capacity additions on growth. We initiate coverage on CARE with a Hold
recommendation and a fair value estimate of SAR 48.
Growth is a function of bed capacity expansion, which will total 200
additional beds at its National hospital facility (+48%), taking its share of
the Riyadh market to 16% from 12% today. Coupled with the roll out of 4
family health centers in the city by FY 16e, we expect the business’s
capacity roll out generating 9% revenue CAGR over the next 5 years. We
expect operating margins to reflect mild compression in FY 13-15e (-
140bps in GPM, -90bps in EBITDA margins) as we forecast (i) a rise in
staffing costs, associated with the launch of the new building at National
Hospital (H1 14e), and (ii) greater revenue contribution from CARE’s PDM
unit, which operates at vastly lower margins (2%). We expect a degree of
margin support starting FY 16e, as we believe scale economies and rising
bed utilisation rates will begin to filter through P&L on the launch of a new
wing at the National Hospital, which will include a premium healthcare
offering.
Corporate accounts represent 53% of client base, and service
agreements are periodically renewed. The General Organisation for
Social Insurance- GOSI, is CARE’s largest shareholder (35% stake), and
accounts for 20% of client business. We believe that as large corporate
entities continue to migrate towards greater and more sophisticated
insurance cover for their employees, healthcare providers will experience
a degree on P&L pressure as payments collected from insurers are
typically lower (we estimate as much as 25%) than what is otherwise
collected from ‘direct payment’ clients.
Valuation: We value CARE at SAR 48/share, using DCF and a WACC of
9.8% (11.4% Re, 0.9 Beta, 5% Rd) and a terminal growth rate of 4%. At
23.4x FY 14e, EPS, CARE trades at 35% and 20% premiums to regional and
local peers which we warrant on CARE’s competitive position (16% market
share in Riyadh, FY 14e). We initiate with a Hold recommendation. Risk:
The shift to insurance-based patient collections may cut EBITDA margin by
150bps+ on average.
SAR 48
© Copyright 2013, Arqaam Capital Limited. All Rights Reserved. See Important Notice.
Price Performance
90
158
226
294
362
430
Mar-13 Jun-13 Sep-13
CARE AB SASEIDX

September 18 2013
National Medical Care Co. © Copyright 2013, Arqaam Capital Limited. All Rights Reserved. See Important Notice. 51
Abacus Arqaam Capital Fundamental Data
Profitability
Growth
Gearing
Valuation
0%
10%
20%
30%
2012 2013e 2014e 2015e 2016e
EBITDA Margin Net Margin
0%
20%
40%
2012 2013e 2014e 2015e 2016e
Revenues Assets
-20%
-10%
0%
-1.5
-1.0
-0.5
0.0
2012 2013e 2014e 2015e 2016e
Net Debt/Capital Net Debt/EBITDA
0
10
20
30
2012 2013e 2014e 2015e 2016e
P/E P/E Sector
National Medical Care Co.
Year-end 2011 2012 2013e 2014e 2015e 2016e
Financial summary
Reported EPS 2.11 2.34 2.16 2.30 2.58 2.82
Diluted EPS 2.11 2.34 2.16 2.30 2.58 2.82
DPS 0.64 1.06 1.17 1.15 1.29 1.41
BVPS 12.32 13.60 18.50 19.65 20.94 22.35
Weighted average shares 44.85 44.85 44.85 44.85 44.85 44.85
Average market cap — — 2,472 2,472 2,472 2,472
Year-end 2011 2012 2013e 2014e 2015e 2016e
Valuation metrics
P/E (x) (current price) 25.5 23.0 24.8 23.4 20.9 19.0
P/E (x) (target price) 22.5 20.3 22.0 20.7 18.4 16.8
P/BV (x) (target price) 3.9 3.5 2.6 2.4 2.3 2.1
EV/EBITDA (x) (target price) 16.4 15.2 14.8 13.7 12.2 11.3
EV/FCF (x) 77.8 (543.2) (139.0) (153.7) 27.5 18.4
EV/Invested capital (x) 3.6 3.2 2.2 2.0 1.8 1.7
Dividend yield (%) 1.2 2.0 2.2 2.1 2.4 2.6
Year-end 2011 2012 2013e 2014e 2015e 2016e
Growth (%)
Revenues 7.5 14.5 6.3 7.7 12.7 9.7
EBITDA 13.7 8.4 2.3 7.8 12.6 8.2
EBIT 16.0 9.3 (2.6) 8.1 13.9 9.4
Net income 11.8 10.8 (7.5) 6.1 12.2 9.6
Year-end 2011 2012 2013e 2014e 2015e 2016e
Margins (%)
EBITDA 26.6 25.1 24.2 24.2 24.2 23.9
EBIT 20.8 19.8 18.2 18.2 18.4 18.4
Net 20.7 20.0 17.4 17.2 17.1 17.1
Year-end 2011 2012 2013e 2014e 2015e 2016e
Returns (%)
RoAA 14.7 14.2 10.3 8.9 9.2 9.5
RoAE 18.2 18.1 13.5 12.0 12.7 13.1
RoIC 16.1 15.4 10.6 10.1 10.7 10.9
FCF margin 5.6 (0.7) (2.6) (2.2) 10.7 14.6
Year-end 2011 2012 2013e 2014e 2015e 2016e
Gearing (%)
Net debt/Capital (16.2) (6.2) (16.0) (8.0) (8.9) (12.3)
Net debt/Equity (16.2) (6.6) (17.9) (9.5) (10.5) (14.3)
Interest cover (x) — — 20.5 16.5 15.1 16.8
Net debt/EBITDA (x) (0.7) (0.3) (1.1) (0.6) (0.6) (0.8)

September 18 2013
National Medical Care Co. © Copyright 2013, Arqaam Capital Limited. All Rights Reserved. See Important Notice. 52
Abacus Arqaam Capital Fundamental Data
Company overview
National Medical Care owns and operates 2 hospitals in Riyadh with a total capacity of 420 beds and 100 clinics. Both hospitals were owned by the General Organisation for Social Insurance (GOSI) prior to 2003. In March 2013, National Medical Care Company launched an Initial Public Offering and raised SAR 175mn in the process.
Ownership and management
Shareholders
General Organization for Social Insurance- Saudi Arabia35.1%
Fal Holdings Arabia Company 26.6%
Public 38.3%
Source: Zawya
Board of Directors
AbdullahBinMOhammed Al Issa Chairman
Adbulaziz Saif Al Saif Director
Yasser Saqr Al Otaibi Director
Bader Fahad Al Athel Director
Adeeb AbdulrahmanAl Sowailim Director
Dr. Shwaimi Hwaimel Al Fowiz Director
Adel Mohammed Al Krashe Director
Source: Company data
National Medical Care Co.
Year-end 2011 2012 2013e 2014e 2015e 2016e
Income statement (SAR mn)
Sales revenue 458.3 524.7 557.7 600.5 676.8 742.5
Gross profit 122.4 135.1 134.8 145.6 165.4 181.1
SG&A (27.3) (31.1) (33.5) (36.0) (40.6) (44.6)
EBITDA 121.7 131.9 134.9 145.5 163.7 177.2
Depreciation & Amortisation (26.5) (27.9) (33.6) (35.9) (39.0) (40.6)
EBIT 95.2 104.0 101.4 109.6 124.8 136.5
Net interest income(expense) — — (4.9) (6.7) (8.3) (8.1)
Associates/affiliates — — — — — —
Exceptionals/extraordinaries — — — — — —
Other pre-tax income/(expense) 5.9 7.4 7.4 7.4 7.4 7.4
Profit before tax 101.1 111.4 103.8 110.3 123.9 135.8
Zakat (6.3) (6.4) (6.8) (7.3) (8.3) (9.1)
Minorities — — — — — —
Other post-tax income/(expense) — — — — — —
Net profit 94.7 105.0 97.1 103.0 115.6 126.7
Arqaam adjustments (including dilution) — — — — — —
Arqaam Net profit 94.7 105.0 97.1 103.0 115.6 126.7
Year-end 2011 2012 2013e 2014e 2015e 2016e
Balance sheet (SAR mn)
Cash and equivalents 89.6 71.8 247.1 250.9 261.4 306.6
Receivables 165.5 190.6 204.7 225.4 257.7 284.8
Inventories 27.8 35.3 41.7 47.4 54.6 61.5
Tangible fixed assets 365.9 459.1 559.8 660.4 679.9 679.9
Other assets including goodwill 35.8 37.9 37.9 37.9 37.9 37.9
Total assets 684.6 794.7 1,091.3 1,221.9 1,291.5 1,370.7
Payables 48.9 62.1 68.4 74.8 85.5 95.4
Interest bearing debt — 31.7 98.9 167.1 162.9 162.9
Other liabilities 83.0 90.7 94.4 98.8 104.2 110.2
Total liabilities 131.8 184.6 261.7 340.8 352.6 368.4
Shareholders equity 552.8 610.1 829.7 881.2 939.0 1,002.3
Minorities — — — — — —
Total liabilities & shareholders equity 684.6 794.7 1,091.3 1,221.9 1,291.5 1,370.7
Year-end 2011 2012 2013e 2014e 2015e 2016e
Cash flow (SAR mn)
Cashflow from operations 89.6 117.2 120.0 123.5 131.0 149.2
Net capex (63.9) (120.9) (134.3) (136.5) (58.4) (40.6)
Free cash flow 25.7 (3.7) (14.4) (13.0) 72.6 108.6
Equity raised/(bought back) — — — — — —
Dividends paid (28.6) (47.6) (52.5) (51.5) (57.8) (63.3)
Net inc/(dec) in borrowings — 31.7 67.2 68.2 (4.3) —
Other investing/financing cash flows (0.6) — — — — —
Net cash flow (3.5) (19.6) 0.3 3.7 10.5 45.2
Change in working capital (42.3) (19.3) (14.3) (19.9) (28.9) (24.1)
Mohammad Kamal Dahlia Sabaayon, CFA [email protected] Arqaam Capital Research Offshore s.a.l +9714 507 1743

September 18 2013
National Medical Care Co. © Copyright 2013, Arqaam Capital Limited. All Rights Reserved. See Important Notice. 53
Market fully pricing in expansion growth; Initiate with a Hold
recommendation and SAR 48 FVE
National Medical Care- CARE is a pure play on the middle income segment of the Saudi
healthcare sector, particularly in Riyadh, where it ranks second in terms of bed capacity (420
beds in FY 12A). CARE has expanded its capacity in National Hospital threefold to 300 beds,
and is due to establish 4 dispensaries by FY 16e (line 1 in H2 13e). The business is further
deploying capital towards its Pharmaceutical and Medical Distribution unit, which was
established in FY 11A as a local wholesaler. The unit has acquired exclusive distribution rights
for medical drugs and equipment in KSA. We initiate coverage on CARE with a Hold
recommendation and a fair value estimate of SAR 48, as we believe that the market is pricing
in the impact of capacity additions (+48%) on growth.
Exhibit 86: Bed capacity adds (+48%) by FY 14e
FY 10A FY 11A FY 12A FY 13e FY 14e FY 15e FY 16e FY 17e
Number of clinics 175 175 175 192 209 226 243 243
Number of beds 420 420 420 420 620 620 620 620
Inpatient admissions (000') 18 18 20 20 20 22 23 24
Outpatient admissions (000') 512 500 523 539 581 628 673 712
Source: Company Data, Arqaam Capital Research
48% bed capacity additions to bolster market share: Care will add 200 beds at National
Hospital (+48%), raising its total bed capacity across its facilities to 620 by FY 14e (16% share of
the Riyadh market). Furthermore, it intends to build 4 fully-serviced family healthcare centers
in Riyadh, and management expects to open its first dispensary later this year. The 4 centers
are due for launch in FY 16e. The impact on revenues should be tangible, as we expect 5-yr
revenue CAGR of 9% on a rise in inpatient as well as outpatient visitation.
Exhibit 87: The proportion of revenues derived from insurance-based patients is associated with lower margins (due to discounts), contributing least to EBITDA levels
Source: Company Data, Arqaam Capital Research
34% 32%
34% 36%
39%
33%
14% 18%
20%
16% 12% 13%
--%
5%
10%
15%
20%
25%
30%
35%
40%
45%
FY 10A FY 11A H1 12A
Revenue breakdown by client
Insurance companies Direct companies GOSI Cash clients

September 18 2013
National Medical Care Co. © Copyright 2013, Arqaam Capital Limited. All Rights Reserved. See Important Notice. 54
Corporate clients and the General Organisation for Social Insurance (GOSI) are the largest
contributor to revenues at 53% of CARE’s client base: GOSI (20%) and Aramco (16%) are core
clients. This introduces earnings visibility as service agreements are renewed over 5-year
periods. The 5-yr contract with GOSI (CARE’s largest shareholder with a 35% stake) expires in
FY 15e. Despite medium term visibility on revenue growth, we remain cautious on the impact
of the shift in corporate clients towards insured health cover, which would impact CARE’s
margins due to (i) the higher discounts granted to insurance companies on patient claims (we
estimate 25%), and (ii) higher working capital requirements.
We value CARE at SAR 48/share and initiate coverage with a Hold recommendation. Our DCF
exercise suggests that the business is trading at the upper end of the multiple range for the
KSA healthcare sector, which in an EM and regional context, remains defendable.
Exhibit 88: CARE currently trades at <10% premium to EM comparables on FY 14e EPS
Mkt Cap P/E EV/EBITDA RoE EBITDA mgn Net mgn EPS grwth
Short Name Country (USDmn) FY 13e FY 14e FY 15e FY 13e FY 14e FY 15e FY 12A FY 12A FY 12A FY 12A
EM average
24.8 21.5 18.5 11.2 12.9 14.1 15% 21% 10% 14%
CARE KSA 643 24.8 23.4 20.9 16.9 15.7 13.9 17% 25% 20% 11%
Premium/(discount)
0% 9% 13% 51% 21% (2%)
Source: Bloomberg, Company Data, Arqaam Capital Research

September 18 2013
National Medical Care Co. © Copyright 2013, Arqaam Capital Limited. All Rights Reserved. See Important Notice. 55
Valuation: At 23.4x/20.9x FY 14e/15e P/E, CARE trades at the
upper end of the KSA healthcare multiple range. Initiate with
Hold, SAR 48 FVE
We value CARE at SAR 48/share, using DCF and a WACC of 9.8% (11.4% Re, 0.9 Beta, 5% Rd)
and a terminal growth rate of 4%. Our price target implies FY 14e P/E of 20.7x, at par with
CARE’s regional peer group (20.6x FY 14e).
Exhibit 89: DCF summary
Source: Company Data, Arqaam Capital Research *FCF calculation based on adjusted EBIT rather than net income
Risks
Downside risk: Delays in the launch of a new wing at the National Hospital could negatively
impact our revenue forecasts as early as FY 14e. The shift towards insurance-based patient
collections may drive down EBITDA margin by 150bps annually. Upside risk: higher bed
occupancy and clinic utilisation rates than anticipated.
DCF summary
SARmn unless otherwise stated FY 13e FY 14e FY 15e FY 16e FY 17e FY 18e FY 19e FY 20e
EBIT (1-τ) 95 102 116 127 141 156 163 170
Depreciation & Amortization 34 36 39 41 45 55 57 59
EBITDA 128 138 155 168 185 210 220 229
Working Capital Changes (14) (20) (29) (24) (22) (26) (12) (11)
Operating Cash Flow 114 118 127 144 163 184 208 217
Purchase of PPE (134) (136) (58) (41) (40) (44) (45) (47)
Free Cash Flow to Firm (20) (18) 68 103 123 140 163 171
Discount Factor using WACC at 9.8% 0.97 0.89 0.81 0.74 0.67 0.61 0.56 0.51
PV of Visible FCFF (6) (16) 55 76 83 85 90 86
Terminal Value 3,058
Equity Valuation WACC parameters
PV of Visible FCFF 454 23% Rf 4.2%
PV of Terminal Value 1,547 77% EMRP 8.0%
Enterprise Value 2,000 Adjusted Beta 0.9
Cost of Equity 11.40%
Cash & Cash Equivalents 231
Less: Net (Debt) Funds (98) Marginal tax rate 2.50%
Investments in associates --
NCI -- Cost of Debt 5.00%
D/C (market) 25.00%
Equity Value 2,133 WACC 9.80%
NOSH 45 Perpetual grow th 4.00%
Equity Value per Share 48
Implied multiples
EV/EBITDA 15.6 14.5 12.9 11.9 10.8 9.5 9.1 8.8
P/E 22.0 20.7 18.5 16.8 15.3 13.8 13.1 12.6
P/B 2.6 2.4 2.3 2.1 2.0 1.9 1.7 1.6
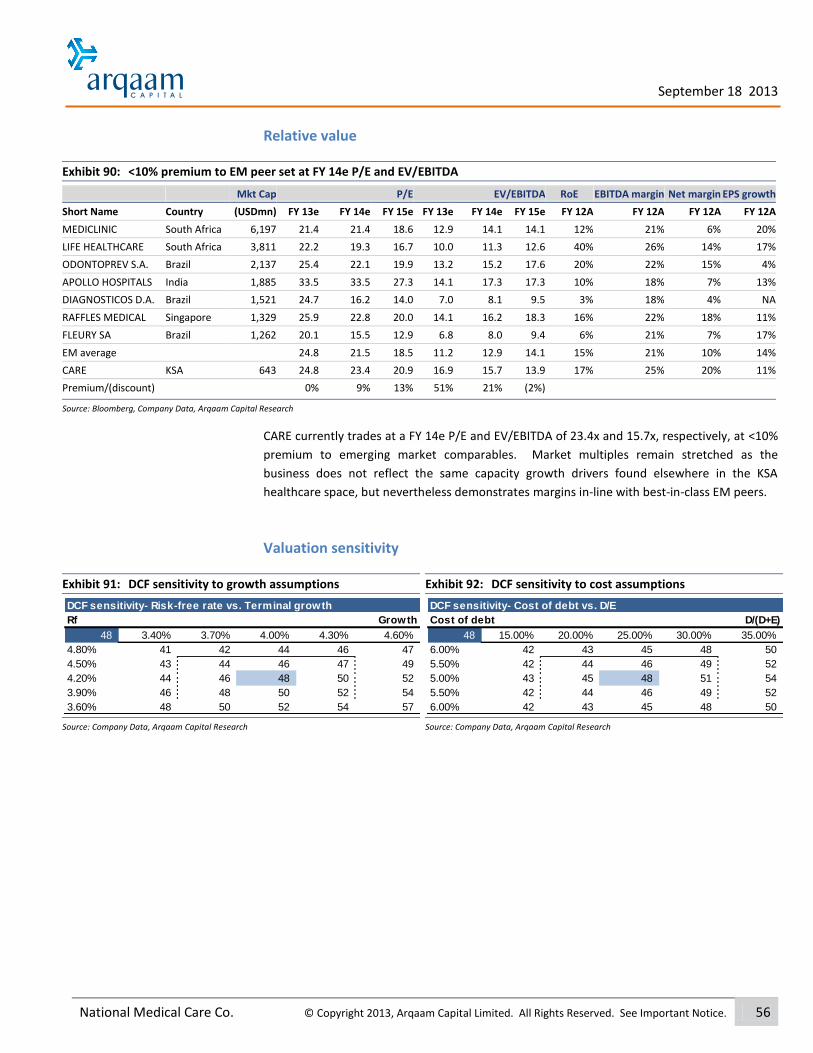
September 18 2013
National Medical Care Co. © Copyright 2013, Arqaam Capital Limited. All Rights Reserved. See Important Notice. 56
Relative value
Exhibit 90: <10% premium to EM peer set at FY 14e P/E and EV/EBITDA
Mkt Cap P/E EV/EBITDA RoE EBITDA margin Net margin EPS growth
Short Name Country (USDmn) FY 13e FY 14e FY 15e FY 13e FY 14e FY 15e FY 12A FY 12A FY 12A FY 12A
MEDICLINIC South Africa 6,197 21.4 21.4 18.6 12.9 14.1 14.1 12% 21% 6% 20%
LIFE HEALTHCARE South Africa 3,811 22.2 19.3 16.7 10.0 11.3 12.6 40% 26% 14% 17%
ODONTOPREV S.A. Brazil 2,137 25.4 22.1 19.9 13.2 15.2 17.6 20% 22% 15% 4%
APOLLO HOSPITALS India 1,885 33.5 33.5 27.3 14.1 17.3 17.3 10% 18% 7% 13%
DIAGNOSTICOS D.A. Brazil 1,521 24.7 16.2 14.0 7.0 8.1 9.5 3% 18% 4% NA
RAFFLES MEDICAL Singapore 1,329 25.9 22.8 20.0 14.1 16.2 18.3 16% 22% 18% 11%
FLEURY SA Brazil 1,262 20.1 15.5 12.9 6.8 8.0 9.4 6% 21% 7% 17%
EM average
24.8 21.5 18.5 11.2 12.9 14.1 15% 21% 10% 14%
CARE KSA 643 24.8 23.4 20.9 16.9 15.7 13.9 17% 25% 20% 11%
Premium/(discount)
0% 9% 13% 51% 21% (2%)
Source: Bloomberg, Company Data, Arqaam Capital Research
CARE currently trades at a FY 14e P/E and EV/EBITDA of 23.4x and 15.7x, respectively, at <10%
premium to emerging market comparables. Market multiples remain stretched as the
business does not reflect the same capacity growth drivers found elsewhere in the KSA
healthcare space, but nevertheless demonstrates margins in-line with best-in-class EM peers.
Valuation sensitivity
Exhibit 91: DCF sensitivity to growth assumptions
Source: Company Data, Arqaam Capital Research
Exhibit 92: DCF sensitivity to cost assumptions
Source: Company Data, Arqaam Capital Research
DCF sensitivity- Risk-free rate vs. Terminal growth
Rf Growth
48 3.40% 3.70% 4.00% 4.30% 4.60%
4.80% 41 42 44 46 47
4.50% 43 44 46 47 49
4.20% 44 46 48 50 52
3.90% 46 48 50 52 54
3.60% 48 50 52 54 57
DCF sensitivity- Cost of debt vs. D/E
Cost of debt D/(D+E)
48 15.00% 20.00% 25.00% 30.00% 35.00%
6.00% 42 43 45 48 50
5.50% 42 44 46 49 52
5.00% 43 45 48 51 54
5.50% 42 44 46 49 52
6.00% 42 43 45 48 50

September 18 2013
National Medical Care Co. © Copyright 2013, Arqaam Capital Limited. All Rights Reserved. See Important Notice. 57
Business trends
Exhibit 93: Inpatient and surgery contributions to remain >50%
Source: Company Data, Arqaam Capital Research
Exhibit 94: Patient treatments to reach 735K by FY 17e
Source: Company Data, Arqaam Capital Research
Exhibit 95: Slight margin compression in FY 13e with the launch of the new wing at the National Hospital
Source: Company Data, Arqaam Capital Research
Exhibit 96: Which will filter through to net income
Source: Company Data, Arqaam Capital Research
Exhibit 97: Capex vs. borrowings
Source: Company Data, Arqaam Capital Research
Exhibit 98: Free cash flows to turn positive by FY 15e
Source: Company Data, Arqaam Capital Research
271 298 342 349 366 407 436 459
58 60
62 65 71 79
86 93
98 97
106 117 129
141 153
166
--3
15 27
34
50 68
86
--
100
200
300
400
500
600
700
800
900
FY 10A FY 11A FY 12A FY 13e FY 14e FY 15e FY 16e FY 17e
Revenue breakdown by segment (SAR mn)
Inpatients and surgeries outpatients Pharmacy Medical distribution unit
--
100
200
300
400
500
600
700
800
--
5
10
15
20
25
FY 10A FY 11A FY 12A FY 13e FY 14e FY 15e FY 16e FY 17e
('000)('000)
Number of inpatient visits Number of outpatient visits
107 122
132 135 145
164 177
195
--
50
100
150
200
250
--%
5.0%
10.0%
15.0%
20.0%
25.0%
30.0%
FY 10A FY 11A FY 12A FY 13e FY 14e FY 15e FY 16e FY 17e
(SAR mn)
EBITDA EBITDA margin
85 95
105 97
103 116
127 140
--
20
40
60
80
100
120
140
160
--%
5.0%
10.0%
15.0%
20.0%
25.0%
FY 10A FY 11A FY 12A FY 13e FY 14e FY 15e FY 16e FY 17e
(SAR mn)
Net income Net margin
--
20
40
60
80
100
120
140
160
180
FY 10A FY 11A FY 12A FY 13e FY 14e FY 15e FY 16e FY 17e
(SAR mn)
Capex Debt
101 115 125 128 138 155 168 185
(60)
(64)(121)
(134) (136) (58)(41) (40)
(200)
(150)
(100)
(50)
--
50
100
150
200
250
FY 10A FY 11A FY 12A FY 13e FY 14e FY 15e FY 16e FY 17e
FCF composition (SAR mn)
NOPLAT Working capital changes Capex

September 18 2013
National Medical Care Co. © Copyright 2013, Arqaam Capital Limited. All Rights Reserved. See Important Notice. 58
Appendix 1: Financials and forecasts
Revenues
Over the past 3 years, revenues have grown at a modest CAGR of 11% driven by (i) a rise in
inpatient admissions and surgeries (+7%), (ii) outpatient visits (+2%), (iii) pharmaceutical
revenues (+8%). In 2011, the business introduced a new distribution unit for medical products,
which produced 3% in revenue accretion in FY 12A.
(i) Inpatients and surgeries: inpatient and surgery revenues grew at a CAGR of 12% over
the past 3 years, driven largely by bed utilization, and a 9% average increase in claims
per patients. We forecast a 3-year inpatient revenue CAGR of 8%, reaching SAR 440n
by FY 16e. This is the result of the addition of 200 beds to CARE’s National Hospital
(H1 14e), which we expect to operate at comparatively low (but rising) bed utilization
over the coming 4 quarters.
(ii) Outpatients: Outpatient revenues have demonstrated relatively weaker growth (3%
3-yr CAGR FY10-12A), as outpatient volumes and claims remained largely flat during
the past 3 years. Going forward, we expect outpatient revenue to grow at a CAGR of
10% as the business rolls out 4 family healthcare centers near its existing hospitals,
with the first center expected to be launched Q4 13e.
(iii) Pharmaceutical revenues have exhibited a 4% CAGR (FY10-12A, largely on volumes
sold rather than any strengthening in product prices. We see a modest 3-year CAGR
(FY 13-16e) of 9% in pharmaceutical revenues (SAR 153mn in FY 16e), totaling 20% of
aggregate sales, going forward.
(iv) Pharmaceutical and medical distribution (PMD): in 2011, CARE established a
distribution unit dedicated to medical and pharmaceutical products. The unit
generated SAR 15mn in sales in FY 12A (3% of revenues). Management is planning to
expand the scope of the unit by bidding for exclusive distribution rights for medical
drugs and equipment in the country, rather than its current role as a local wholesaler.
We expect the PMD unit to contribute SAR c.68mn to revenues, or 9%, by FY 16e.
(Currently 3%).
Margins
We expect operating margins to reflect mild compression in FY 13-15e (-140bps in GPM, -
90bps in EBITDA margins) as we forecast (i) a rise in staffing costs, associated with the launch
of the new building at National Hospital (H1 14e), and (ii) greater revenue contribution from
CARE’s PDM unit, which operates at far lower margins. Overall, we see a drop in blended gross
margins to 24.9% and 25.1% in FY 14e and FY 15e, respectively. We expect a degree of margin
support starting FY 16e, as we believe scale economies and rising bed utilisation rates will
begin to filter through P&L.

I n i t i a t i o n R e p o r t
S e p t e m b e r 1 8 2 0 1 3
Mohammad Kamal [email protected] +9714 507 1743
Dahlia Sabaayon, CFA Arqaam Capital Research Offshore s.a.l
UAE – Healthcare and Pharmaceuticals
Al Noor Hospitals Group
HOLD
Healthcare and Pharmaceuticals / UAE Bloomberg code ANH LN
Market index ASX
Price target (local) 840
Upside (%) -0.4
Market data 13/09/2013
Last closing price 843.00
52 Week range 570.0-860.0
Market cap (GBPmn) 985
Market cap (USDmn) 1,565
Average daily traded value (GBPmn) 0.0
Average daily traded value (USDmn) 0.0
Year-end (local mn) 2012 2013e 2014e 2015e
Revenues 324.4 391.0 437.8 451.4
EBITDA 70.6 79.7 101.4 104.5
Net income 60.3 66.7 89.3 90.7
EPS 0.52 0.57 0.76 0.78
P/E (current price) 26.0 23.5 17.5 17.2
BVPS — 1.5 2.0 2.4
P/B (current price) (539.9) 8.8 6.8 5.5
EV/EBITDA (current price) 14.3 12.7 10.0 9.7
Div. yield (%) 2.0 1.7 2.3 2.3
FCF margin (%) 15.8 14.9 17.2 20.2
Net debt/EBITDA (x) 1.0 (1.3) (1.4) (1.9)
Net debt/Capital (%) 57.0 (57.7) (61.4) (68.9)
Interest cover (x) 25.3 21.9 — —
RoAA (%) 34.0 31.2 32.0 26.7
RoAE (%) 119.9 76.1 43.5 35.0
RoIC (%) 65.9 38.5 38.0 31.3
We acknowledge market leadership and growth, but stock performance suggests it is all in the price at 17.5x FY 14e P/E, 10.0x EV/EBITDA
Initiate with Hold and GBp 840/share FVE
Al Noor is a leading private healthcare provider in Abu Dhabi, with a dominant share of the market for outpatients (35%) and inpatients (39%). The company operates 3 hospitals and 10 medical centers at a total capacity of 227 beds. Going forward, the business plans to (i) add 2 new centers to its network in each year, and (ii) raise its roster of revenue-generating doctors to 445 (+30%) by the end of FY 16e. We believe that this would result in 5-yr revenue CAGR of c.5%, at the very least. To fund its current expansion, Al Noor has raised USD 150mn in new capital through an IPO in June of this year, which we think will be sufficient in meeting 45% of CAPEX rollout. We believe that the market has fully priced in growth at current multiples (17.5x/17.2x FY 14e/15e P/E). We initiate with Hold and an FVE of GBp 840. We expect modest revenue CAGR of 5% driven by (i) the 5 new medical facilities due for launch by FY 13e (Mamoura, Sanaya and Oman), (ii) the launch of 2 facilities each year thereafter, on average, (iii) the introduction of new services including obstetrics, gynaecology and paediatrics, at existing facilities and (iv) the addition of 100 revenue-generating doctors to its roster (+30%) as part of the ‘Programme Leaders’ initiative (of which 45 doctors have been employed). Growth in medical staff costs to challenge margins in the short term: We expect EBITDA margins to fall by 140bps to 20.4% in FY 13e, due to additional staff costs (100 medical doctors) during the year.
Market valuation adequately captures fundamentals: We value Al Noor at GBp 840/share, via a DCF exercise. We apply a WACC of 9.4% (10.9% Re, 0.8 Beta, 5% Rd) and a terminal growth rate of 4%. Our price target implies a P/E 14e of 17.5x, and 14.5x FY 14e EV/EBITDA- at par with local peer NMC. We believe that the market has fully priced in business fundamentals at current valuation. Al Noor trades at a 20% discount to EM peers, which we think is fair given muted growth (5% CAGR) and margin pressure.
Risks: Delays in the launch of new medical facilities. Costs related to specialised doctors could materially impact margin. For every 5% increase in medical staff costs, we estimate a 170bps compression in EBITDA margin and a 5% cut to our FVE.
GBp 840
© Copyright 2013, Arqaam Capital Limited. All Rights Reserved. See Important Notice.
Price Performance
88
100
112
124
136
148
Jun-13
ANH LN ASX

September 18 2013
Al Noor Hospitals Group © Copyright 2013, Arqaam Capital Limited. All Rights Reserved. See Important Notice. 60
Abacus Arqaam Capital Fundamental Data
Profitability
Growth
Gearing
Valuation
0%
10%
20%
30%
2012 2013e 2014e 2015e 2016e
EBITDA Margin Net Margin
0%
20%
40%
60%
2012 2013e 2014e 2015e 2016e
Revenues Assets
-100%
-50%
0%
50%
100%
-4.0
-2.0
0.0
2.0
2012 2013e 2014e 2015e 2016e
Net Debt/Capital Net Debt/EBITDA
0
10
20
30
2012 2013e 2014e 2015e 2016e
P/E P/E Sector
Al Noor Hospitals Group
Year-end 2011 2012 2013e 2014e 2015e 2016e
Financial summary
Reported EPS 0.43 0.52 0.57 0.76 0.78 0.82
Diluted EPS — — 0.57 0.76 0.78 0.82
DPS 0.20 0.26 0.23 0.31 0.31 0.33
BVPS 0.89 (0.02) 1.52 1.98 2.45 2.94
Weighted average shares — — 58.44 116.87 116.87 116.87
Average market cap — — 1,205.74 1,215.02 1,224.30 1,233.58
Year-end 2011 2012 2013e 2014e 2015e 2016e
Valuation metrics
P/E (x) (current price) 30.8 26.0 23.5 17.5 17.2 16.4
P/E (x) (target price) 30.6 25.8 23.3 17.4 17.1 16.3
P/BV (x) (target price) 15.1 (537.8) 8.7 6.7 5.4 4.5
EV/EBITDA (x) (target price) 24.9 20.7 18.4 14.5 14.0 13.4
EV/FCF (x) 33.5 28.6 25.1 19.5 16.0 15.9
EV/Invested capital (x) 14.0 15.7 8.2 6.3 5.1 4.3
Dividend yield (%) 1.5 2.0 1.7 2.3 2.3 2.4
Year-end 2011 2012 2013e 2014e 2015e 2016e
Growth (%)
Revenues 21.4 10.7 20.6 12.0 3.1 3.1
EBITDA 30.4 20.1 12.9 27.2 3.1 4.4
EBIT 33.3 22.2 11.5 28.4 1.7 5.3
Net income 33.2 18.7 10.6 33.9 1.7 5.3
Year-end 2011 2012 2013e 2014e 2015e 2016e
Margins (%)
EBITDA 20.1 21.8 20.4 23.2 23.2 23.5
EBIT 17.2 19.0 17.5 20.1 19.8 20.3
Net 17.3 18.6 17.0 20.4 20.1 20.5
Year-end 2011 2012 2013e 2014e 2015e 2016e
Returns (%)
RoAA 32.4 34.0 31.2 32.0 26.7 23.7
RoAE 56.6 119.9 76.1 43.5 35.0 30.3
RoIC 48.1 65.9 38.5 38.0 31.3 27.5
FCF margin 14.9 15.8 14.9 17.2 20.2 19.8
Year-end 2011 2012 2013e 2014e 2015e 2016e
Gearing (%)
Net debt/Capital (55.0) 57.0 (57.7) (61.4) (68.9) (73.2)
Net debt/Equity (56.5) (2,410.6) (57.7) (61.4) (68.9) (73.2)
Interest cover (x) 90.0 25.3 21.9 — — —
Net debt/EBITDA (x) (1.0) 1.0 (1.3) (1.4) (1.9) (2.3)

September 18 2013
Al Noor Hospitals Group © Copyright 2013, Arqaam Capital Limited. All Rights Reserved. See Important Notice. 61
Abacus Arqaam Capital Fundamental Data
Company overview
Established in 1985, Al Noor hospital is the largest private healthcare provider in Abu Dhabi in terms of the number of patients treated. It owns and operates 3 hospitals and 9 medical centers, with a 35% share of the market for outpatients and 39% for inpatients in Abu Dhabi. In 2012, it operated 227 beds and treated 1.5mn patients.
Ownership and management
Shareholders
Sheikh Butti Al Hamed Moha 28.4%
Astro II SPV 28.3%
Alom Kassem 10.5%
Govt of Singapore Inv. Corp. 3.5%
Public 29.5%
Source: Zawya
Board of Directors
Ian Tyler Chairman
Dr. Kassem Alom Chief Executive Officer
Seamus Keating Independent Director
Sheikh Mansoor Bin Butti Al Hamed Non-Executive Director
Ahmad Nimer Non-Executive Director
Faisal Belhoul Non-Executive Director
Bill Ward Non-Executive Director
Mubarak Matar Al Hamiri Non-Executive Director
Source: Company data
Al Noor Hospitals Group
Year-end 2011 2012 2013e 2014e 2015e 2016e
Income statement (USD mn)
Sales revenue 292.9 324.4 391.0 437.8 451.4 465.3
Gross profit 117.7 135.7 158.5 188.7 191.1 196.7
SG&A (67.4) (74.2) (89.9) (100.7) (101.6) (102.4)
EBITDA 58.8 70.6 79.7 101.4 104.5 109.1
Depreciation & Amortisation (8.5) (9.1) (11.1) (13.3) (15.0) (14.8)
EBIT 50.3 61.5 68.6 88.0 89.5 94.3
Net interest income(expense) (0.6) (2.4) (3.1) — — —
Associates/affiliates — — — — — —
Exceptionals/extraordinaries — — — — — —
Other pre-tax income/(expense) 1.0 1.2 1.2 1.2 1.2 1.2
Profit before tax 50.8 60.3 66.7 89.3 90.7 95.5
Income tax expense — — — — — —
Minorities — — — — — —
Other post-tax income/(expense) — — — — — —
Net profit 50.8 60.3 66.7 89.3 90.7 95.5
Arqaam adjustments (including dilution) — — — — — —
Arqaam Net profit 50.8 60.3 66.7 89.3 90.7 95.5
Year-end 2011 2012 2013e 2014e 2015e 2016e
Balance sheet (USD mn)
Cash and equivalents 61.3 55.5 102.9 142.3 197.3 251.3
Receivables 75.7 82.8 100.7 113.9 118.7 122.4
Inventories 14.3 14.2 19.1 21.2 22.8 23.6
Tangible fixed assets 22.8 20.6 19.4 26.1 26.1 31.3
Other assets including goodwill 0.6 6.2 6.2 6.2 6.2 6.2
Total assets 174.7 179.4 248.4 309.8 371.2 434.8
Payables 51.6 43.6 54.2 58.7 62.0 64.8
Interest bearing debt 2.9 125.4 — — — —
Other liabilities 16.7 13.3 16.0 19.3 22.9 26.5
Total liabilities 71.3 182.3 70.2 78.0 85.0 91.3
Shareholders equity 103.5 (2.9) 178.2 231.7 286.2 343.5
Minorities — — — — — —
Total liabilities & shareholders equity 174.7 179.4 248.3 309.8 371.2 434.8
Year-end 2011 2012 2013e 2014e 2015e 2016e
Cash flow (USD mn)
Cashflow from operations 51.9 58.0 68.3 95.2 106.3 112.3
Net capex (8.2) (6.8) (10.0) (20.0) (15.0) (20.0)
Free cash flow 43.8 51.2 58.3 75.2 91.3 92.3
Equity raised/(bought back) — — 141.1 — — —
Dividends paid (23.5) (30.6) (26.7) (35.7) (36.3) (38.2)
Net inc/(dec) in borrowings (2.3) (15.9) (125.4) — — —
Other investing/financing cash flows 1.0 (5.0) — — — —
Net cash flow 19.0 (0.3) 47.3 39.5 55.0 54.1
Change in working capital (9.6) (15.5) (12.2) (10.7) (3.1) (1.7)
Mohammad Kamal Dahlia Sabaayon, CFA [email protected] Arqaam Capital Research Offshore s.a.l +9714 507 1743

September 18 2013
Al Noor Hospitals Group © Copyright 2013, Arqaam Capital Limited. All Rights Reserved. See Important Notice. 62
Valuation: Fundamentals fully priced in at 17.5x FY 14e P/E and
10.0x EV/EBITDA
Price performance suggests adequate market valuation. Initiate with Hold
and GBp 840/share FVE
Exhibit 99: Al Noor trades at 20% discount to EM peer set
Mkt Cap P/E EV/EBITDA RoE EBITDA margin Net margin EPS growth
Short Name Country (USDmn) FY 13e FY 14e FY 15e FY 13e FY 14e FY 15e FY 12A FY 12A FY 12A FY 12A
MEDICLINIC South Africa 6,197 21.4 21.4 18.6 12.9 14.1 14.1 12% 21% 6% 20%
LIFE HEALTHCARE South Africa 3,811 22.2 19.3 16.7 10.0 11.3 12.6 40% 26% 14% 17%
ODONTOPREV S.A. Brazil 2,137 25.4 22.1 19.9 13.2 15.2 17.6 20% 22% 15% 4%
APOLLO HOSPITALS India 1,885 33.5 33.5 27.3 14.1 17.3 17.3 10% 18% 7% 13%
DIAGNOSTICOS D.A. Brazil 1,521 24.7 16.2 14.0 7.0 8.1 9.5 3% 18% 4% NA
RAFFLES MEDICAL Singapore 1,329 25.9 22.8 20.0 14.1 16.2 18.3 16% 22% 18% 11%
FLEURY SA Brazil 1,262 20.1 15.5 12.9 6.8 8.0 9.4 6% 21% 7% 17%
EM average
24.8 21.5 18.5 11.2 12.9 14.1 15% 21% 10% 14%
AL Noor UAE 1,565 23.5 17.5 17.2 12.7 10.0 9.7 NM 22% 19% 11%
Premium/(discount)
(5%) (19%) (7%) 14% (22%) (31%)
Source: Bloomberg, Company Data, Arqaam Capital Research
Better value elsewhere in the MENA healthcare space: We believe the market has fairly
valued Al Noor at 17.5x/17.2x FY 14e/15e EPS, as growth remains modest beyond the impact
of new staff hires, and margins remain subject to downside risks.
Exhibit 100: Lowest 5-yr EPS CAGR within our MENA healthcare coverage space
Source: Company Data, Arqaam Capital Research
Exhibit 101: Cash flow margins sit mid-table, valuation appears appropriate at current P/OCF multiple
Source: Company Data, Arqaam Capital Research
We value Al Noor at GBp 840/share, via a DCF exercise. We apply a WACC of 9.4% (11.0% Re,
0.80 Beta, 5% Rd) and a terminal growth rate of 4%. Our price target implies FY 14e P/E of
17.4x, and 14.5x FY 14e EV/EBITDA- at par with local peer NMC. We initiate coverage with a
Hold recommendation and GBp 840/share FVE.
DALLAH
MOUWASAT
CARE
NMC
Al Noor
12
14
16
18
20
22
24
5% 7% 9% 11% 13% 15% 17% 19% 21% 23%
5-yr EPS CAGR
P/E 14e
DALLAH
MOUWASAT
CARE
NMC Al Noor
12
13
14
15
16
17
18
19
20
5% 10% 15% 20% 25% 30%
CFO/sales
P/OCF

September 18 2013
Al Noor Hospitals Group © Copyright 2013, Arqaam Capital Limited. All Rights Reserved. See Important Notice. 63
DCF summary
Exhibit 102: DCF summary
Source: Company Data, Arqaam Capital Research *FCF calculation based on EBIT rather than net income
Risks Delays in the launch of new medical facilities (+40% capacity) would materially defer growth.
Specialised doctors, the cost of which remains variable, could materially impact margins: for
every 5% increase in medical staff costs, we estimate a 170bps compression in EBITDA margin
and 5% cut to our FVE.
DCF summary
USDmn unless otherwise stated FY 13e FY 14e FY 15e FY 16e FY 17e FY 18e FY 19e FY 20e
EBIT (1-τ) 69 88 90 94 95 97 100 103
Depreciation & Amortization 11 13 15 15 15 15 15 15
EBITDA 80 101 105 109 110 112 115 118
Working Capital Changes (12) (11) (3) (2) (2) (4) (1) 0
Operating Cash Flow 68 91 101 107 108 108 114 118
Purchase of PPE (10) (20) (15) (20) (20) (15) (15) (15)
Free Cash Flow to Firm 58 71 86 87 88 93 99 103
Discount Factor using WACC at 9.5% 0.97 0.89 0.81 0.74 0.68 0.62 0.57 0.52
PV of Visible FCFF 16 63 70 65 60 58 56 53
Terminal Value 1,973
Equity Valuation WACC parameters
PV of Visible FCFF 442 Rf 4.5%
PV of Terminal Value 1,023 EMRP 8.0%
Enterprise Value 1,465 Adjusted Beta 0.80
Cost of Equity 10.9%
Cash & Cash Equivalents 88
Less: Net (Debt) Funds -- Marginal tax rate 2.50%
Investments in associates --
NCI -- Cost of Debt 5.00%
D/C (market) 25.00%
Equity Value (USD) 1,553 WACC 9.4%
NOSH 117 Perpetual grow th 4.00%
Equity Value per Share (GBp) 840
Implied multiples
EV/EBITDA 18.4 14.5 14.0 13.4 13.3 13.1 12.7 12.4
P/E 23.3 17.4 17.1 16.3 16.1 15.8 15.3 14.9
P/B 8.7 6.7 5.4 4.5 3.9 3.4 3.0 2.7

September 18 2013
Al Noor Hospitals Group © Copyright 2013, Arqaam Capital Limited. All Rights Reserved. See Important Notice. 64
Business trends
Exhibit 103: Revenues growth driven by fee-generating doctors. We expect a 5-yr revenue CAGR of 9%
Source: Company Data, Arqaam Capital Research
Exhibit 104: 30% increase in income-generating doctors is expected in FY 13e
Source: Company Data, Arqaam Capital Research
Exhibit 105: EBITDA forecasts
Source: Company Data, Arqaam Capital Research
Exhibit 106: Net income forecasts
Source: Company Data, Arqaam Capital Research
Exhibit 107: Superior RoE on low equity base
Source: Company Data, Arqaam Capital Research
Exhibit 108: We expect working capital stability at 17% revenues
Source: Company Data, Arqaam Capital Research
234
284 315
381 428 442 456 469 479
-
0.5
1.0
1.5
2.0
2.5
--
100
200
300
400
500
600
FY 10A FY 11A FY 12A FY 13e FY 14e FY 15e FY 16e FY 17e FY 18e
(USD mn)
Revenues Number of patients
(mn)
325 325 332 334
434 439 444 449
7 2
100 5 5 5 3
--
50
100
150
200
250
300
350
400
450
500
FY 10A FY 11A FY 12A FY 13e FY 14e FY 15e FY 16e FY 17e
Revenue-generating doctors Additions
45
59
71 80
101 105 109 110 112
--%
5.0%
10.0%
15.0%
20.0%
25.0%
--
20
40
60
80
100
120
FY 10A FY 11A FY 12A FY 13e FY 14e FY 15e FY 16e FY 17e FY 18e
(USD mn)
EBITDA EBITDA margin
38
51 60
67
89 91 96 97 98
--%
5.0%
10.0%
15.0%
20.0%
25.0%
--
20
40
60
80
100
120
FY 10A FY 11A FY 12A FY 13e FY 14e FY 15e FY 16e FY 17e FY 18e
(USD mn)
Net income Net margin
50% 49%
37% 39%
32% 28%
24% 27% 29%
34%
27% 29%
25% 22%
20%
--%
10%
20%
30%
40%
50%
60%
FY 10A FY 11A FY 12A FY 13e FY 14e FY 15e FY 16e FY 17e
RoE RoA
12% 13%
16% 16% 17% 17%
--%
2%
4%
6%
8%
10%
12%
14%
16%
18%
FY 10A FY 11A FY 12A FY 13e FY 14e FY 15e
WC/revenues
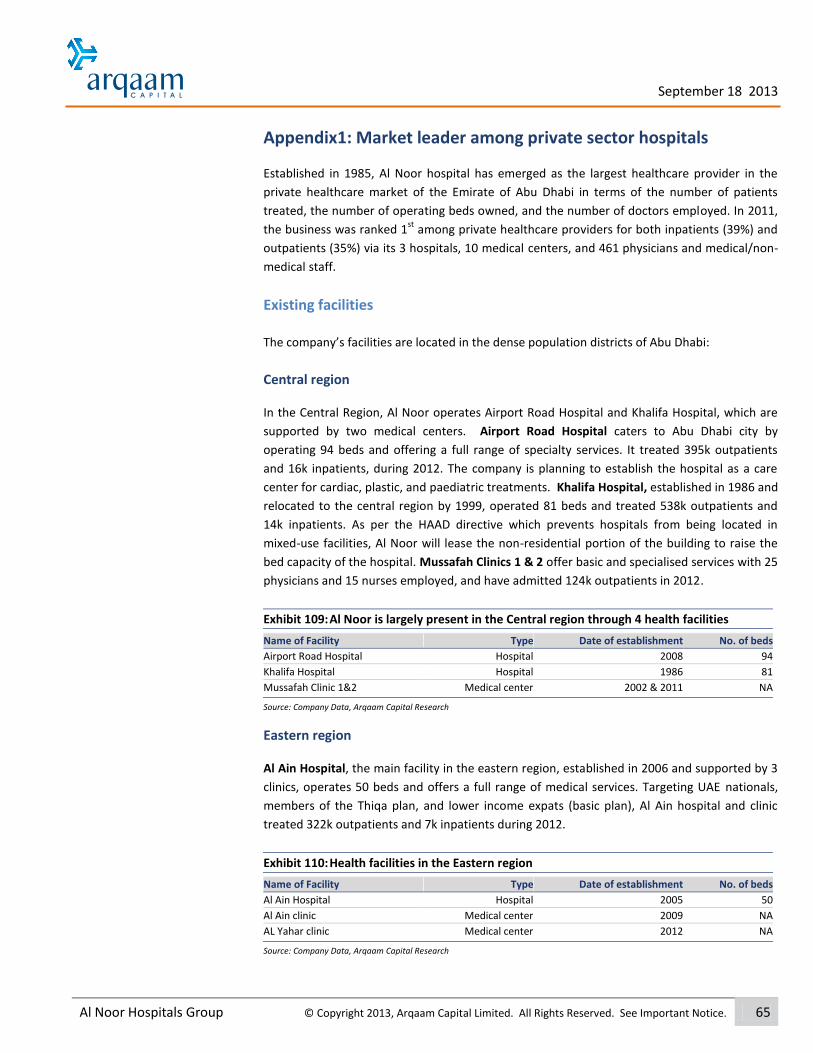
September 18 2013
Al Noor Hospitals Group © Copyright 2013, Arqaam Capital Limited. All Rights Reserved. See Important Notice. 65
Appendix1: Market leader among private sector hospitals
Established in 1985, Al Noor hospital has emerged as the largest healthcare provider in the
private healthcare market of the Emirate of Abu Dhabi in terms of the number of patients
treated, the number of operating beds owned, and the number of doctors employed. In 2011,
the business was ranked 1st
among private healthcare providers for both inpatients (39%) and
outpatients (35%) via its 3 hospitals, 10 medical centers, and 461 physicians and medical/non-
medical staff.
Existing facilities The company’s facilities are located in the dense population districts of Abu Dhabi:
Central region
In the Central Region, Al Noor operates Airport Road Hospital and Khalifa Hospital, which are
supported by two medical centers. Airport Road Hospital caters to Abu Dhabi city by
operating 94 beds and offering a full range of specialty services. It treated 395k outpatients
and 16k inpatients, during 2012. The company is planning to establish the hospital as a care
center for cardiac, plastic, and paediatric treatments. Khalifa Hospital, established in 1986 and
relocated to the central region by 1999, operated 81 beds and treated 538k outpatients and
14k inpatients. As per the HAAD directive which prevents hospitals from being located in
mixed-use facilities, Al Noor will lease the non-residential portion of the building to raise the
bed capacity of the hospital. Mussafah Clinics 1 & 2 offer basic and specialised services with 25
physicians and 15 nurses employed, and have admitted 124k outpatients in 2012.
Exhibit 109: Al Noor is largely present in the Central region through 4 health facilities
Name of Facility Type Date of establishment No. of beds
Airport Road Hospital Hospital 2008 94
Khalifa Hospital Hospital 1986 81
Mussafah Clinic 1&2 Medical center 2002 & 2011 NA
Source: Company Data, Arqaam Capital Research
Eastern region
Al Ain Hospital, the main facility in the eastern region, established in 2006 and supported by 3
clinics, operates 50 beds and offers a full range of medical services. Targeting UAE nationals,
members of the Thiqa plan, and lower income expats (basic plan), Al Ain hospital and clinic
treated 322k outpatients and 7k inpatients during 2012.
Exhibit 110: Health facilities in the Eastern region
Name of Facility Type Date of establishment No. of beds
Al Ain Hospital Hospital 2005 50
Al Ain clinic Medical center 2009 NA
AL Yahar clinic Medical center 2012 NA
Source: Company Data, Arqaam Capital Research

September 18 2013
Al Noor Hospitals Group © Copyright 2013, Arqaam Capital Limited. All Rights Reserved. See Important Notice. 66
Western region
Constituting merely 6% of the Abu Dhabi population base, the western region is characterized
by a low population density (150k or 6% of AD population) and a household size of 4.1. Al Noor
has established 3 standalone medical centers in the region, acting as inpatient referral centers
for the 3 hospitals in Abu Dhabi. The centers offer ancillary and diagnostic services including
radiology and laboratory.
Exhibit 111: Presence extends to the Western region through 3 facilities
Name of Facility Type Date of establishment No. of beds
Al Mirfa clinic Medical center 2011 50
Beda Zayed clinic 1 &2 Medical center 2003 NA
Source: Company Data, Arqaam Capital Research
Expansion plans Khalifa Hospital: Since this facility is a mixed use building that includes residential segments, Al
Noor is planning to lease this segment to be in compliance with the HAAD regulations.
Additionally, the company is considering a new purpose-built facility located near Khalifa
hospital for leasing purposes.
Inorganic growth: Al Noor intends to explore strategic investments in Abu Dhabi by acquiring
specialised hospitals and medical centers, such as oncology and long-term care facilities. Also,
it plans to expand within the UAE to benefit from the implementation of the mandatory
healthcare coverage.
Medical centers: Al Noor already added 3 medical facilities earlier this year and intends to add
two more later this year and each year until FY 16e. It also plans to raise the average number
of its staff by 60 physicians by FY 13e (29 added so far) as part of its current recruitment phase
of c. 100 physicians.

September 18 2013
Al Noor Hospitals Group © Copyright 2013, Arqaam Capital Limited. All Rights Reserved. See Important Notice. 67
Important Notice 1. Author, regulator and responsibility
Arqaam Capital Limited (“Arqaam”) is incorporated in the Dubai International Financial Center (“DIFC”) and is authorised and regulated by the Dubai Financial Services Authority ("DFSA") to carry on financial services in
and from the DIFC. Arqaam publishes and distributes (i.e. issues) all research.
Arqaam Capital Research Offshore s.a.l. is a specialist research center in Beirut, Lebanon, which assists in the production of research issued by Arqaam.
2. Purpose This document is provided for informational purposes only. Nothing contained in this document constitutes investment, legal, tax or other advice or guidance and should be disregarded when considering or making
investment decisions. In preparing this document, Arqaam did not take into account the investment objectives, financial situation and particular needs of any particular person. Accordingly, before acting on this
document, investors should independently evaluate the investments and strategies referred to herein and make their own determination of whether it is appropriate in light of their own financial circumstances and
objectives.
3. Rating system Arqaam investment research is based on the analysis of regional and country economics, industries and company fundamentals. Arqaam company research reflects a long-term (12-month) fair value target for a
company or stock. The ratings bands are:
Buy Total return > 20%
Hold -10% < Total return < 20%
Sell Total return < -10%
In certain circumstances, ratings may differ from those implied by a fair value target using the criteria above. Arqaam policy is to maintain up-to-date fair value targets on the companies under its coverage, reflecting
any material changes to the analyst’s outlook on a company. Share price volatility may cause a stock to move outside the rating range implied by Arqaam’s fair value target. Analysts may not necessarily change their
ratings ifn this happens, but are expected to dislcose the rationale behind their view to Arqaam clients.
4. Accuracy of information The information contained in this document is based on current trade, statistical and other public information we consider reliable. We do not represent or warrant that such information is accurate or complete and it
should not be relied upon as such. Any mention of market rumours has been derived from the markets and is not purported to be fact or reflect our opinions. Arqaam has no obligation to update, modify or amend this
document or to otherwise notify a recipient thereof in the event that any opinion, forecast or estimate set forth herein, changes or subsequently becomes inaccurate. In accordance with Regulation AC of the 1934
Exchange Act, the views expressed in this research report accurately reflect the research analysts’ personal views about the subject securities or issuers and are subject to change without notice. No part of the research
analysts’ compensation is related to the specific recommendations or views in the research report.
5. Recipients and sales and marketing restrictions 5.1 Nothing in this document should be construed as a solicitation or offer, or recommendation, to acquire or dispose of any investment or to engage in any other transaction, or to provide any investment advice or
service.
5.2 This document is directed at Professional Clients and not Retail Clients within the meaning of DFSA rules. Any investments or financial products referred to herein will only be made available to clients who Arqaam is
satisfied qualifies as Professional Clients. Any other persons in receipt of this document must not rely upon or otherwise act upon it.
5.3 This document is only being distributed to investors who meet certain qualifications and to whom an investment or service may be offered or promoted in accordance with relevant country restrictions. This
excludes the US except for SEC registered broker-dealers (or banks in permissable”broker” or “dealer” capacity) acting on a principal or agency capacity, and major US institutional investors in accordance with SEC Rules
15a-6(a)(2). Details of other relevant country restrictions are set out on our website at http://www.arqaamcapital.com/english/system/footer/terms-of-use.aspx. Persons into whose possession this document comes
are required to inform themselves about, and observe, such restrictions and should not rely upon or otherwise act upon this document where it is unlawful to make to such person such an offer or invitation or
recommendation without compliance with any authorisation, registration or other legal requirements.
6. Risk warnings 6.1 Any prices, valuations or forecasts are indicative and are not intended to predict actual results, which may differ substantially from those reflected.
6.2 The value of an investment may go up as well as down. The value of and income from any investment may fluctuate from day to day as a result of changes in relevant economic markets (including, without
limitation, foreseeable or unforeseeable changes in interest rates, foreign exchange rates, default rates, prepayment rates, political or financial conditions, etc.).
6.3 Past performance is not indicative of future results. Any opinions, estimates, valuations or projections (target prices and ratings in particular) are inherently imprecise and a matter of judgement. They are
statements of opinion and not of fact, based on current expectations, estimates and projections, and rely on beliefs and assumptions. Actual outcomes and returns may differ materially from what is expressed or
forecasted. There are no guarantees of future performance.
6.4 Certain transactions, including those involving futures, options, and other derivatives, give rise to substantial risk and are not suitable for all investors.
6.5 This document does not propose to identify or to suggest all of the risks (direct or indirect) which may be associated with the investments and strategies referred to herein.
7. Conflict 7.1 Arqaam and its affiliates provide full investment banking services, and they and their directors, officers and employees, may take positions which conflict with the views expressed in this document. Our salespeople,
traders, and other professionals may provide oral or written market commentary or trading strategies to our clients and our proprietary trading desks that reflect opinions that are contrary to the opinions expressed in
this document. Our asset management area, our proprietary trading desks and investing businesses may make investment decisions that are inconsistent with the recommendations or views expressed in this
document.
7.2 Arqaam may have or seek investment banking or other business relationships for which it will receive compensation from the companies that are the subject of this document.
7.3 Facts and views presented in this document have not been reviewed by, and may not reflect information known to, professionals in other Arqaam business areas, including investment banking personnel.
7.4 Emirates NBD PJSC owns 8.32% of Arqaam and Commercial Bank International PJSC owns 6.35%.
8. No warranty Arqaam makes no representations or warranties and, to the fullest extent permitted by applicable law, we hereby expressly disclaim any and all express, implied and statutory representations and warranties of any kind,
including, without limitation, any warranty as to accuracy, timeliness, completeness, merchantability, fitness for a particular purpose and/or non-infringement.
9. No liability Arqaam will accept no liability in any event including (without limitation) negligence for any damages or loss of any kind, including (without limitation) direct, indirect, incidental, special or consequential damages,
expenses or losses arising out of, or in connection with your use or inability to use this document, or in connection with any error, omission, defect, computer virus or system failure, or loss of any profit, goodwill or
reputation, even if expressly advised of the possibility of such loss or damages, arising out of or in connection with your use of this document. We do not exclude our duties or liabilities under binding applicable law.
10. Copyright and Confidentiality The entire content of this document is subject to copyright with all rights reserved and the information is private and confidential for your own personal use only. This document and the information contained herein
may not be reproduced, distributed or transmitted to any other person or incorporated in any way into another document or other material without our prior written consent.
11. Governing law English law governs this document and these disclaimers and any dispute in relation thereto shall be exclusively referred to the English Courts.


![Press Review Spring 2011 - Al Akhawayn University · 2015-09-02 · Press Review Spring 2011 [Winner of Arqaam Capital MENA Investment Challenge, May] Al Akhawayn University | Department](https://img.dokumen.tips/doc/110x75/5e70e26ad8f6c827744c8494/press-review-spring-2011-al-akhawayn-2015-09-02-press-review-spring-2011-winner.jpg)