Embed Size (px)
Citation preview

Concordia University
Department of Mechanical, Industrial and
Aerospace Engineering
MECH 390 – Mechanical
Engineering Design Project
Lecture 3
Shaft Analysis and Fatigue Failure
Fall 2017
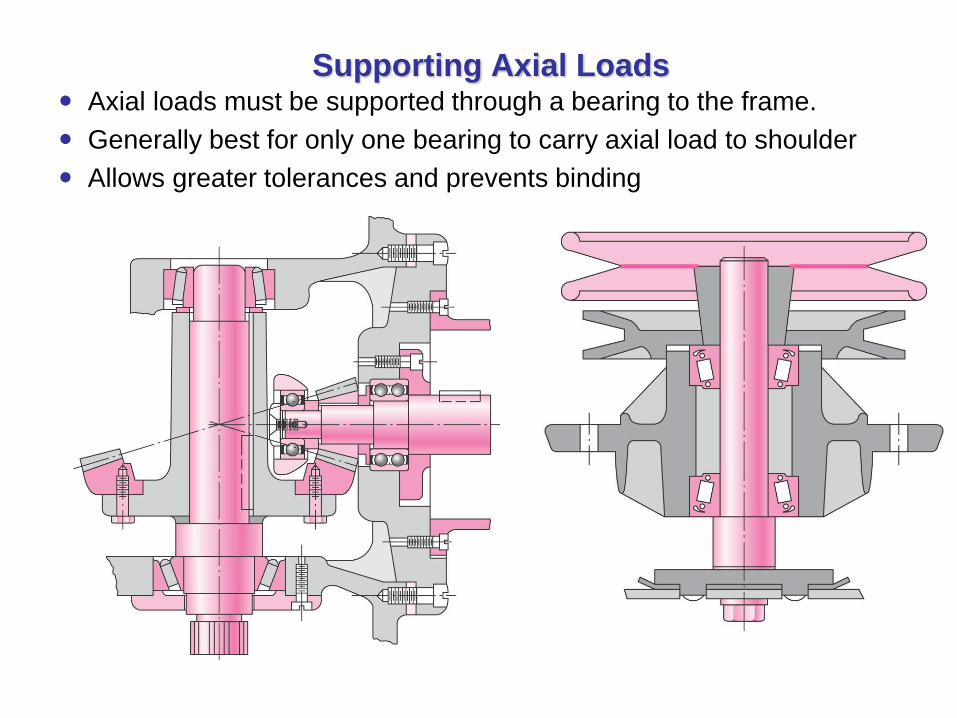
Supporting Axial Loads Axial loads must be supported through a bearing to the frame.
Generally best for only one bearing to carry axial load to shoulder
Allows greater tolerances and prevents binding

Providing for Torque Transmission
• Common means of transferring torque to shaft
– Keys
– Splines
– Setscrews
– Pins
– Press or shrink fits
– Tapered fits
• Keys are one of the most effective
– Slip fit of component onto shaft for easy assembly
– Positive angular orientation of component
– Can design key to be weakest link to fail in case of overload
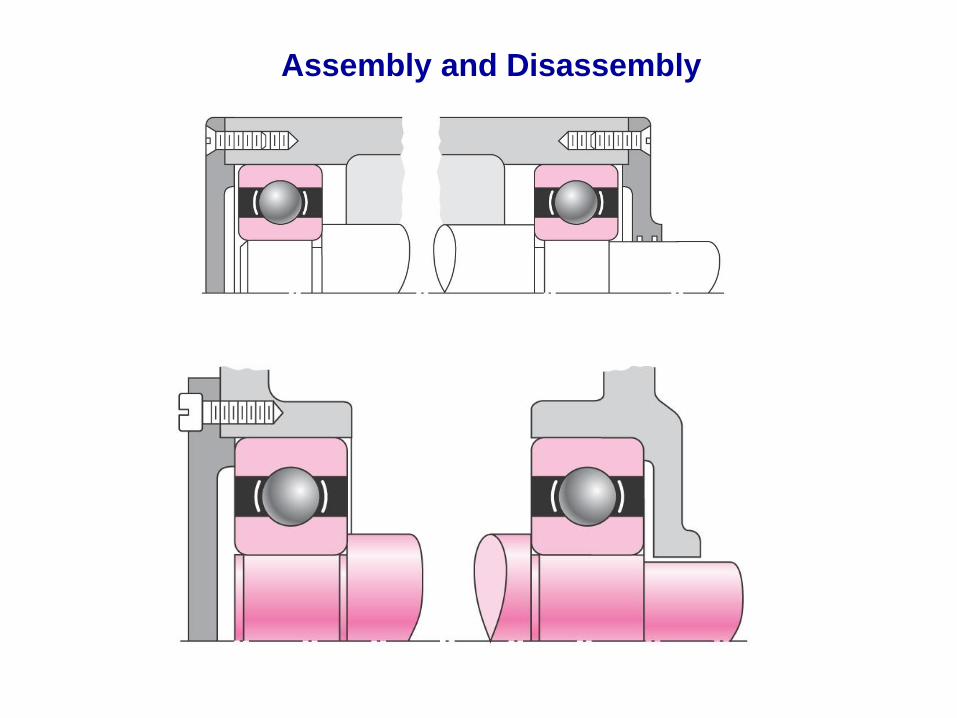
Assembly and Disassembly
Shaft Design for Stress
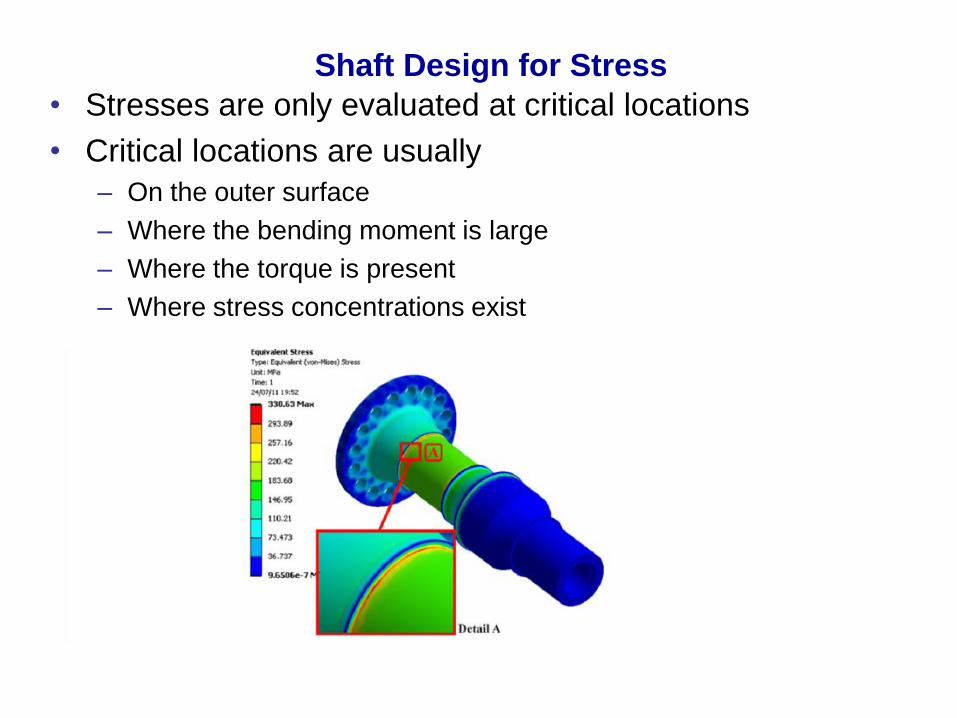
• Stresses are only evaluated at critical locations
• Critical locations are usually
– On the outer surface
– Where the bending moment is large
– Where the torque is present
– Where stress concentrations exist
Shaft Design Procedure
1. Determine the rotational speed of the shaft.
2. Determine the power or the torque to be transmitted by the shaft.
3. Determine the design of the power-transmitting components or other devices that will be
mounted on the shaft, and specify the required location of each device.
4. Specify the location of bearings to support the shaft. Normally two and only two bearings
are used to support a shaft. The reactions on bearings supporting radial loads are
assumed to act at the midpoint of the bearings.
5. Propose the general form of the geometry for the shaft, considering how each element on
the shaft will be held in position axially and how power transmission from each element to
the shaft is to take place.
6. Determine the magnitude of torque that the shaft sees at all points.
7. Determine the forces that are exerted on the shaft, both radially and axially.
8. Resolve the radial forces into components in perpendicular directions, usually vertically
and horizontally.
9. Solve for the reactions on all support bearings in each plane.
10. Produce the complete shearing force and bending and torque moment diagrams to
determine the distribution of torque bending moments in the shaft.
Shaft Design Procedure
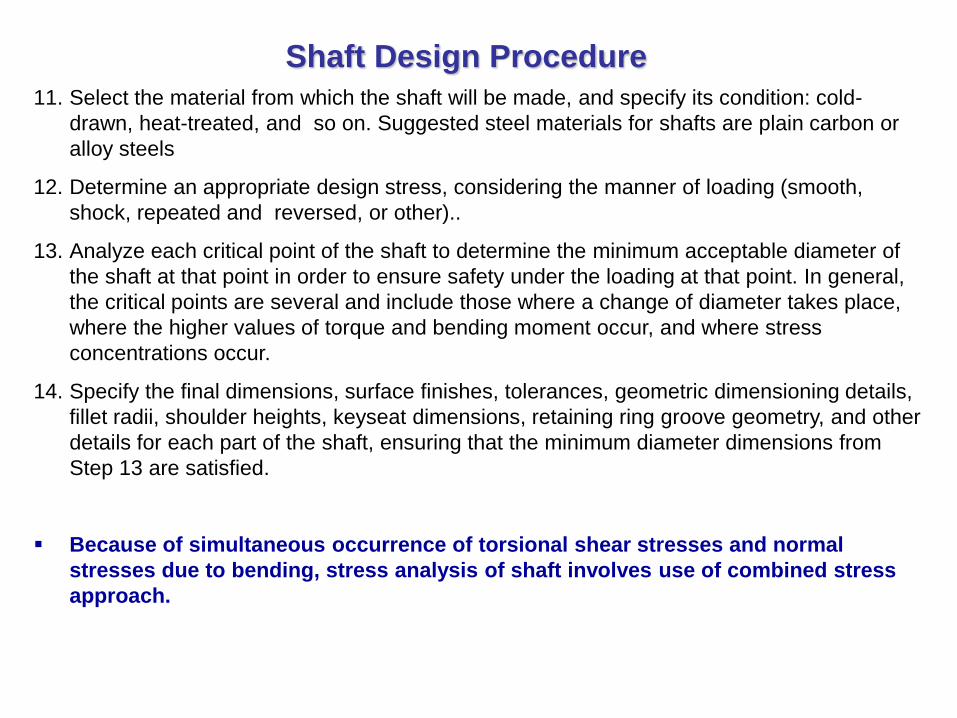
11. Select the material from which the shaft will be made, and specify its condition: cold-
drawn, heat-treated, and so on. Suggested steel materials for shafts are plain carbon or
alloy steels
12. Determine an appropriate design stress, considering the manner of loading (smooth,
shock, repeated and reversed, or other)..
13. Analyze each critical point of the shaft to determine the minimum acceptable diameter of
the shaft at that point in order to ensure safety under the loading at that point. In general,
the critical points are several and include those where a change of diameter takes place,
where the higher values of torque and bending moment occur, and where stress
concentrations occur.
14. Specify the final dimensions, surface finishes, tolerances, geometric dimensioning details,
fillet radii, shoulder heights, keyseat dimensions, retaining ring groove geometry, and other
details for each part of the shaft, ensuring that the minimum diameter dimensions from
Step 13 are satisfied.
Because of simultaneous occurrence of torsional shear stresses and normal
stresses due to bending, stress analysis of shaft involves use of combined stress
approach.
Shaft Design Procedure
Shaft Design Procedure
Shaft Design Procedure
• Typically the torque comes into the shaft at one gear and leaves the shaft at another gear.
A free body diagram of the shaft will allow the torque at any section to be determined. The
torque is often relatively constant at steady state operation. The shear stress due to the
torsion will be greatest on outer surfaces.
• The bending moments on a shaft can be determined by shear and bending moment
diagrams. Since most shaft problems incorporate gears or pulleys that introduce forces in
two planes, the shear and bending moment diagrams will generally be needed in two
planes. Resultant moments are obtained by summing moments as vectors at points of
interest along the shaft.
• Axial stresses on shafts due to the axial components transmitted through helical gears or
tapered roller bearings will almost always be negligibly small compared to the bending
moment stress. They are often also constant, so they contribute little to fatigue.
Consequently, it is usually acceptable to neglect the axial stresses induced by the gears
and bearings when bending is present in a shaft

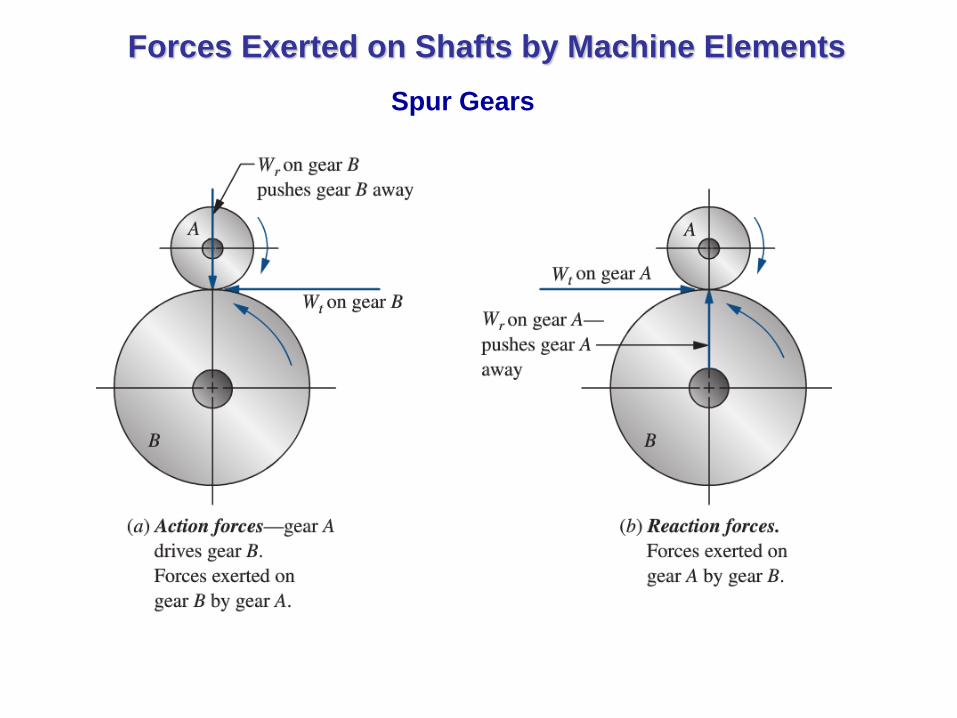
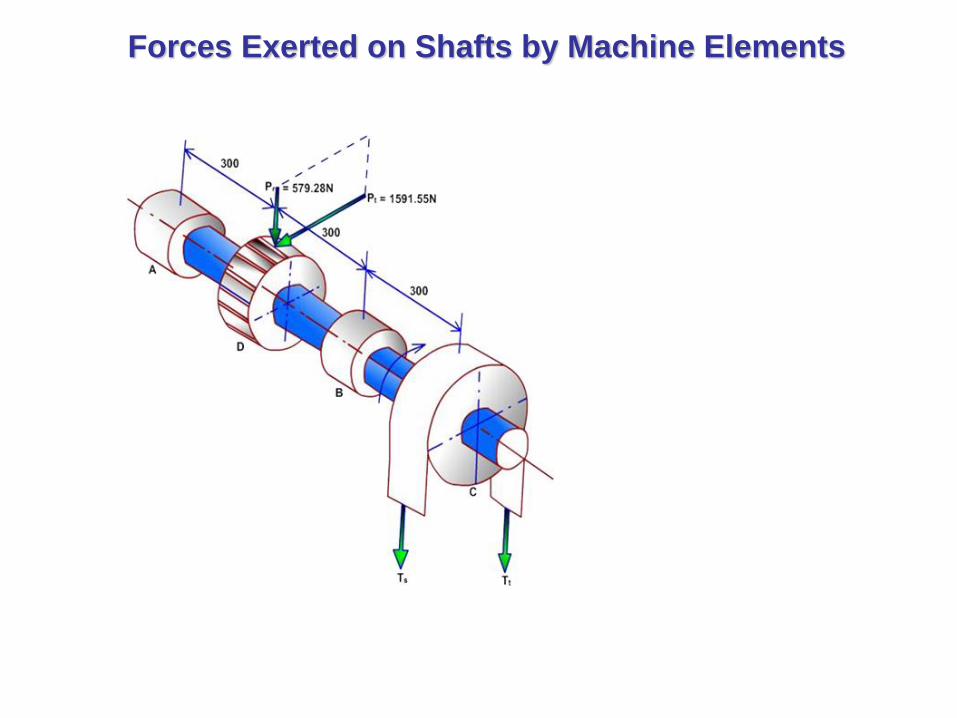
Forces Exerted on Shafts by Machine Elements
Spur Gears
Torque:
T = 63 000 (P)/n
Tangential Force:
Wt = T/(D/2)
Radial Forces:
Wr = Wt tan ϕ
where P = power being transmitted in
hp
n = rotational speed in rpm
T = torque on the gear in lb.in
D = pitch diameter of the gear in inches
Forces Exerted on Shafts by Machine Elements
Spur Gears

Forces Exerted on Shafts by Machine Elements
Helical Gears
Torque: T = 63 000(P) / n [lb . In]
Tangential force:
Wt = (33 000)(P) / vt [lbf]
Axial force:
Wx = Wt tan ψ
Radial force:
Wr = Wt tan Φn
Φn is the normal pressure angle
ψ is the helix angle
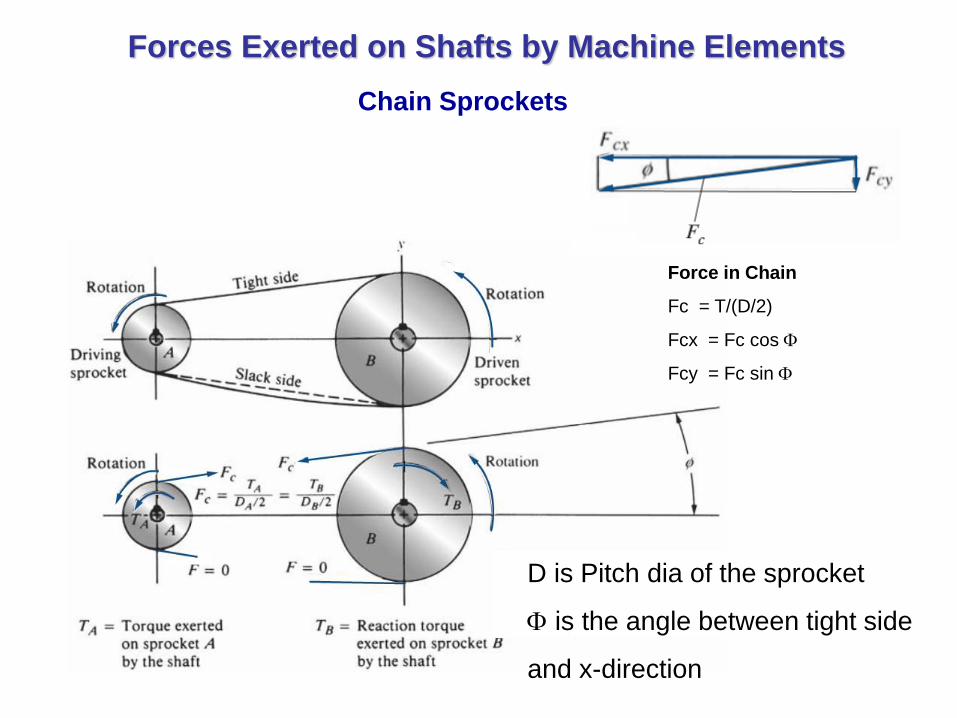
Forces Exerted on Shafts by Machine Elements
Chain Sprockets
Force in Chain
Fc = T/(D/2)
Fcx = Fc cos
Fcy = Fc sin
D is Pitch dia of the sprocket
is the angle between tight side
and x-direction

Forces Exerted on Shafts by Machine Elements
V-Belt SheavesNet Driving Force
FN = F1 - F2
Net Driving Force
FN = T/(D/2)
Bending Force on the shaft carrying the
sheave is dependent on the sum,
FB= F1 + F2
For V-belt drives, the ratio is normally
taken to be
F1/F2 = 5
FB = C.FN
Bending Force on Shaft for V-Belt
Drive
FB = 1.5 FN = 1.5T/(D/2)
Bending Force on Shaft for Flat-Belt
Drive
FB = 2.0 FN = 2.0T/(D/2)

Stress Concentrations in Shafts
• Shafts typically contain:
Several diameters
Keyseats
Ring grooves
Other geometric discontinuities
• Stress concentration factors typically based on
diameter which is the objective of the design
Stress Concentrations in Shafts
• Stress analysis for shafts is highly dependent on stress
concentrations.
• Stress concentrations depend on size specifications, which
are not known the first time through a design process.
• Standard shaft elements such as shoulders and keys have
standard proportions, making it possible to estimate stress
concentrations factors before determining actual sizes.

Stress Concentrations in Shafts
Keyseats
Kt = 2.0 (profile)
Kt = 1.6 (sled runner)
A key.seat is a longitudinal groove cut into a
shaft for the mounting of a key
The profile keyseat is milled into the shaft,
using an end mill having a diameter equal to
the width of the key. The resulting groove is
flat-bottomed and has a sharp, square corner at
its end.
The sled runner keyseat is produced by a
circular milling cutter having a width equal to
the width of the key. As the cutter begins or
ends the keyseat, it produces a smooth radius.
For this reason, the stress concentration factor
for the sled runner keyseat is lower than that
for the profile keyseat.

Stress Concentrations in Shafts
Fillets
Kt = 2.5 (sharp fillet)
Kt = 1.5 (well-rounded fillet)
When a change in diameter occurs to
create a shoulder, a stress concentration
dependent on the ratio of the two
diameters and on the fillet radius occurs.
fillets classified in two categories:
sharp (Low fillet radii)
well-rounded (Large fillet radii)
Stress Concentrations in Shafts

Forces Exerted on Shafts
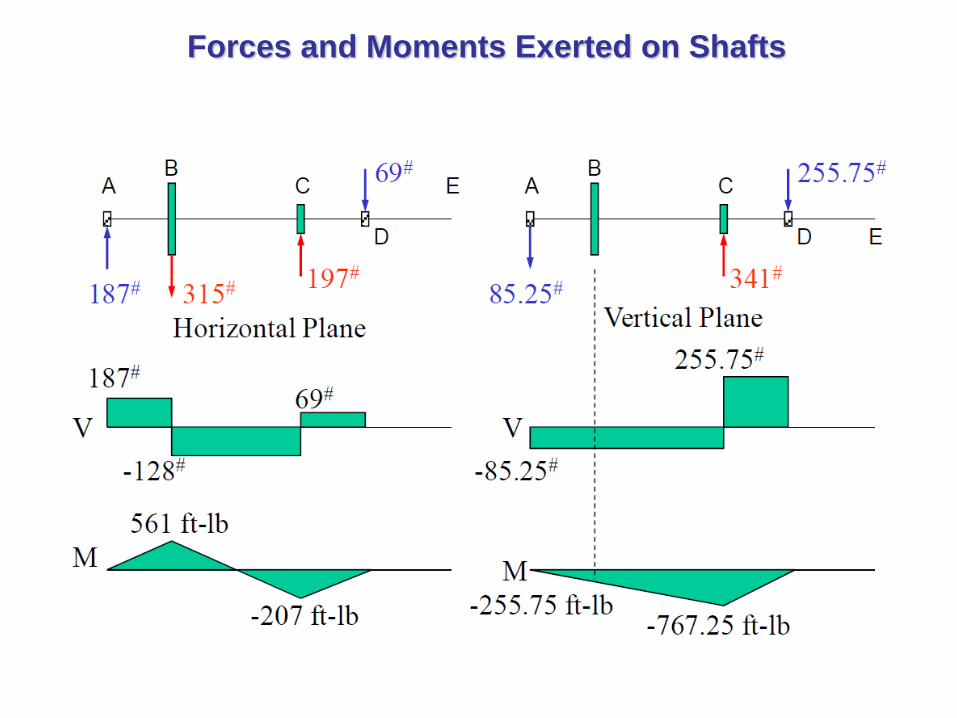
Forces and Moments Exerted on Shafts
Forces Exerted on Shafts by Machine Elements
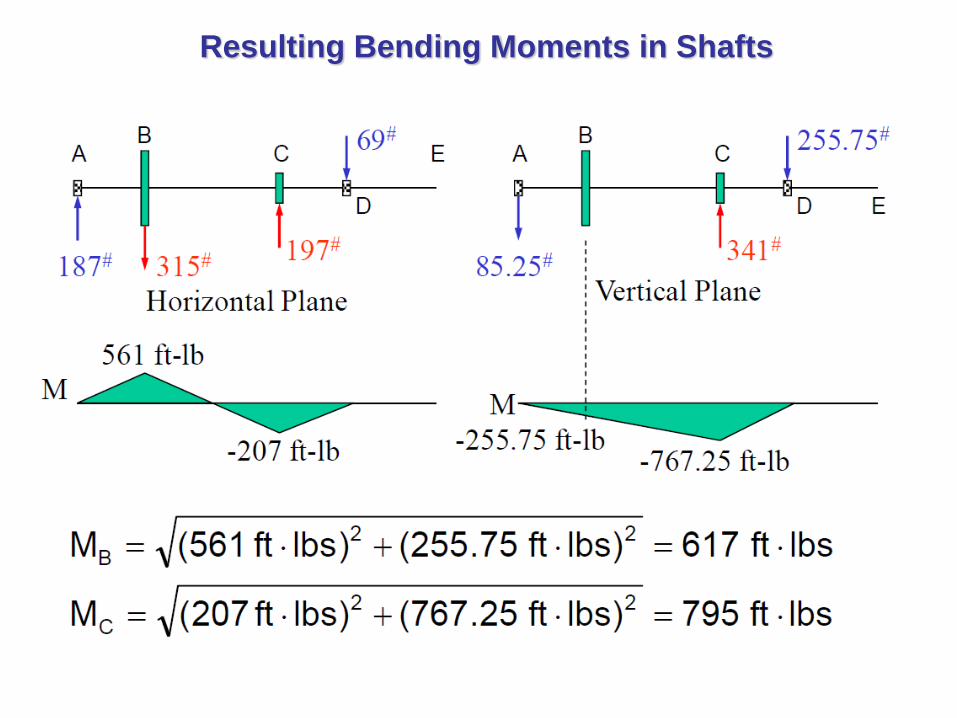
Resulting Bending Moments in Shafts
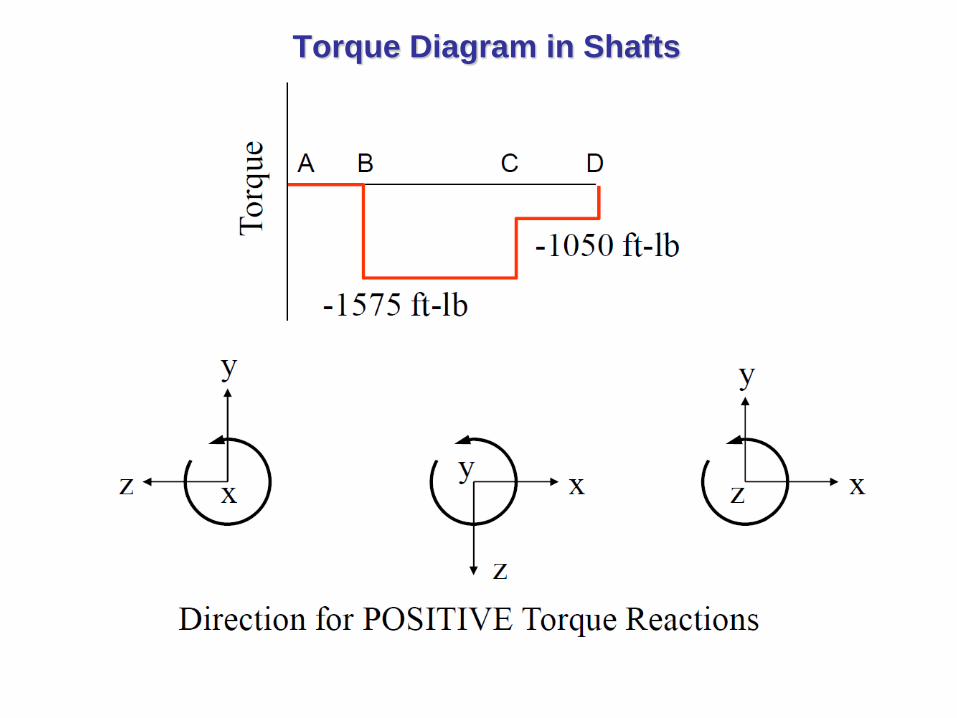
Torque Diagram in Shafts

Torque Diagram in Shafts

Stresses in Shaft
Torsional shear stress
Bending stress
Axial tension/compression
Vertical shear stress
• Stresses are only evaluated at critical locations
• Critical locations are usually
– On the outer surface
– Where the bending moment is large
– Where the torque is present
– Where stress concentrations exist

Stresses in Shaft
• Standard stress equations can be customized for shafts
for convenience
• Axial loads are generally small and constant, so will be
ignored in this section
• Standard alternating and mean stresses
• Customized for round shafts

Stresses in Shaft
Combine stresses into von Mises stresses
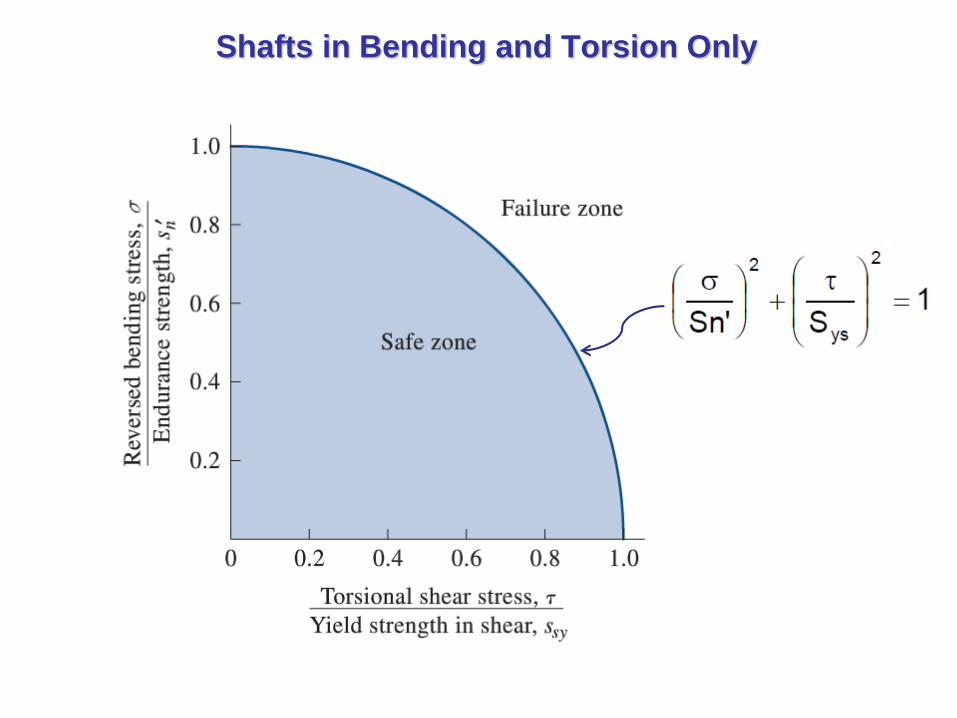
Shafts in Bending and Torsion Only

Shafts in Bending and Torsion Only
• Substitute von Mises stresses into failure criteria equation.
For example, using modified Goodman line,
• Solving for d is convenient for design purposes
Shafts in Bending and Torsion Only
• For rotating shaft with steady bending and torsion
Bending stress is completely reversed, since a stress
element on the surface cycles from equal tension to
compression during each rotation
Torsional stress is steady
Previous equations simplify with Mm and Ta equal to 0
• Always necessary to consider static failure, even
in fatigue situation
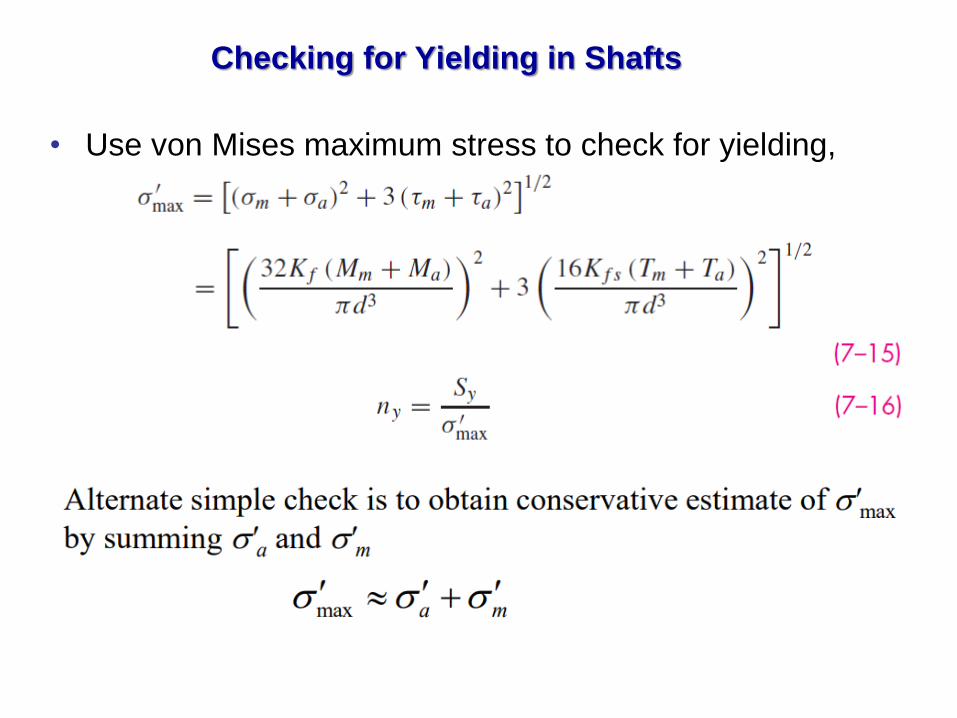
Checking for Yielding in Shafts
• Use von Mises maximum stress to check for yielding,

Shafts Design for Fatigue Life
• Shaft Design Equation for Alternating Bending Moment (M) and Torque T

Design Procedure
• Find rotational speed and design power
• Find forces on shafts
components and reactions
• Draw torque, shear and moment diagrams
• Pick a material – ductile w/ %E ≥ 12%
Get Sy and compute Sn’ (Se)
• Determine initial design configuration
• Analyze each critical point
Change in diameter, large T, large M, Kt
Specify appropriate diameters
• Should check deflections at the end of the design

Design Procedure
• Stress analysis for shafts is highly dependent on stress concentrations.
• Stress concentrations depend on size specifications, which are not
known the first time through a design process.
• Standard shaft elements such as shoulders and keys have standard
proportions, making it possible to estimate stress concentrations
factors before determining actual sizes.
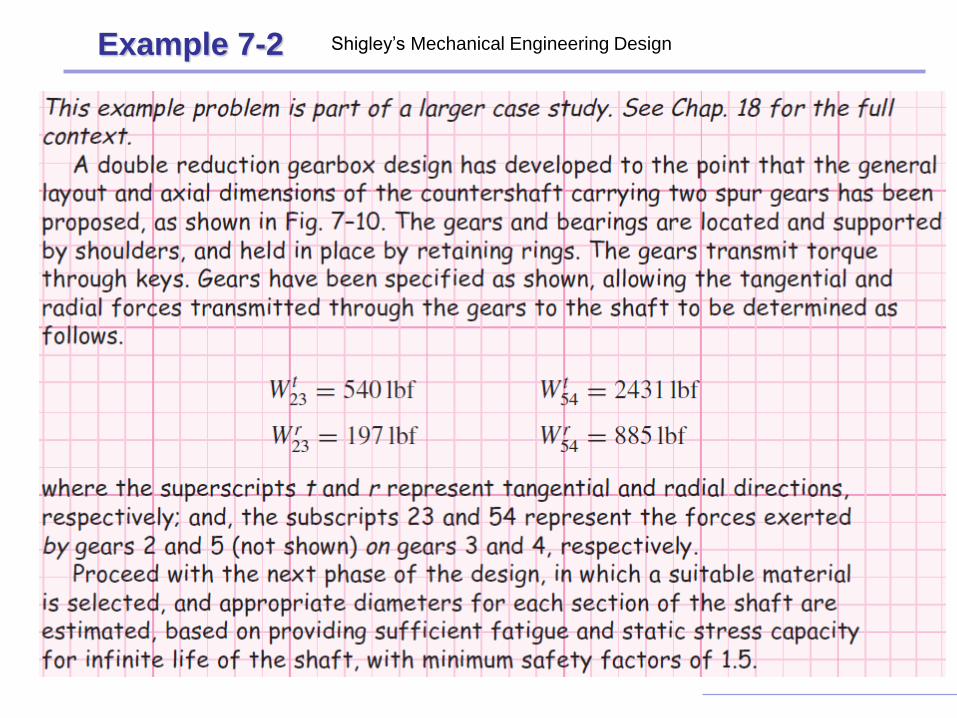
Example 7-2 Shigley’s Mechanical Engineering Design

Example 7-2Shigley’s Mechanical Engineering Design
Fig. 7-10
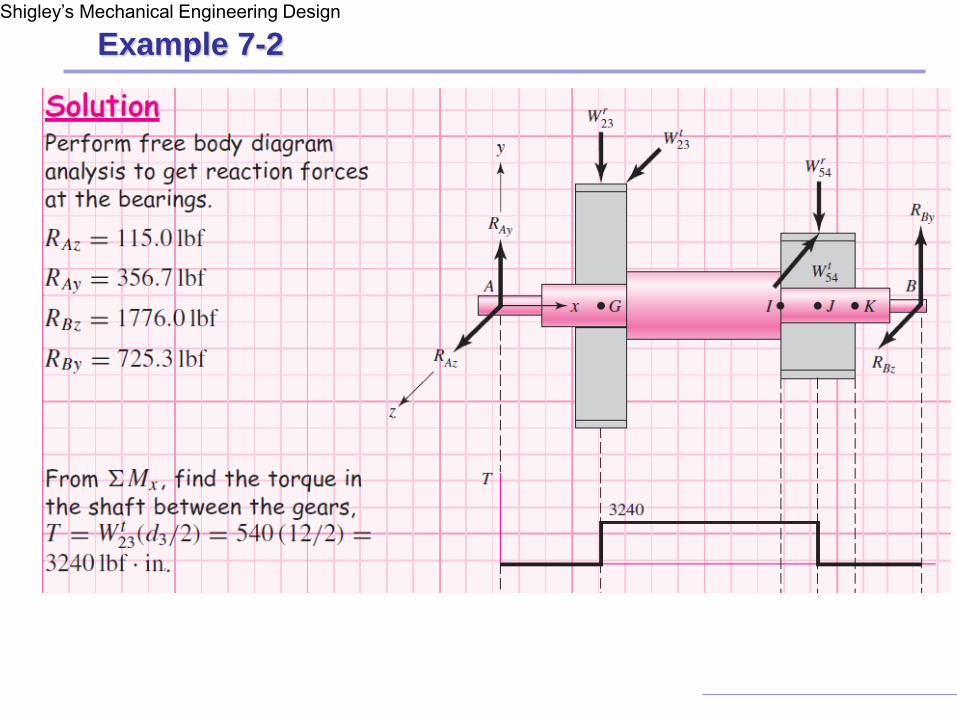
Example 7-2Shigley’s Mechanical Engineering Design

Example 7-2Shigley’s Mechanical Engineering Design
197 885
2” 5.75” 2.25”
R1R2
10*R2 = (197*2) + (885*7.75)
R2 = 725.3 and R1 = 356.7
540 2431
2” 5.75” 2.25”
R1R2
10*R2 = (2431*7.75) - (540*2))
R2 = 1776 and R1 = 115
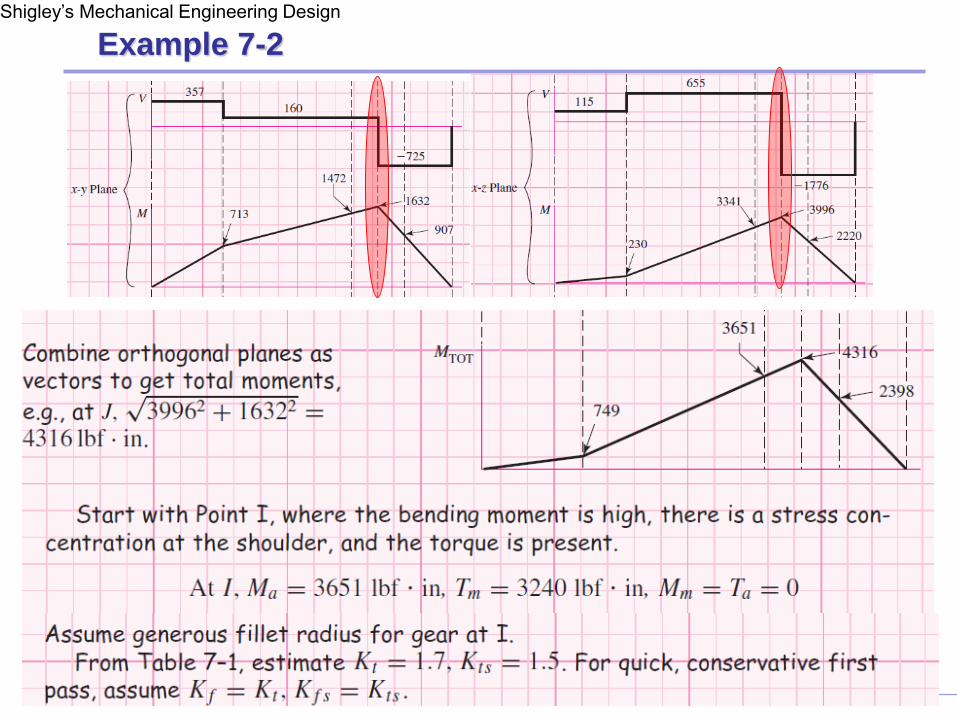
Example 7-2Shigley’s Mechanical Engineering Design
Example 7-2Shigley’s Mechanical Engineering Design
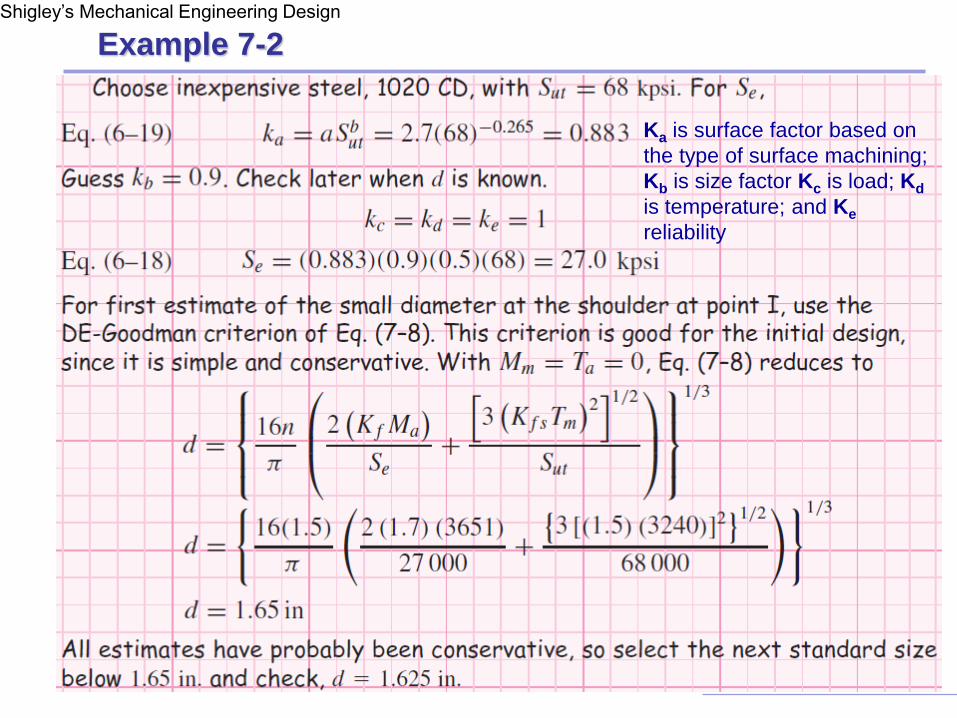
Ka is surface factor based on
the type of surface machining;
Kb is size factor Kc is load; Kd
is temperature; and Ke
reliability

Example 7-2Shigley’s Mechanical Engineering Design
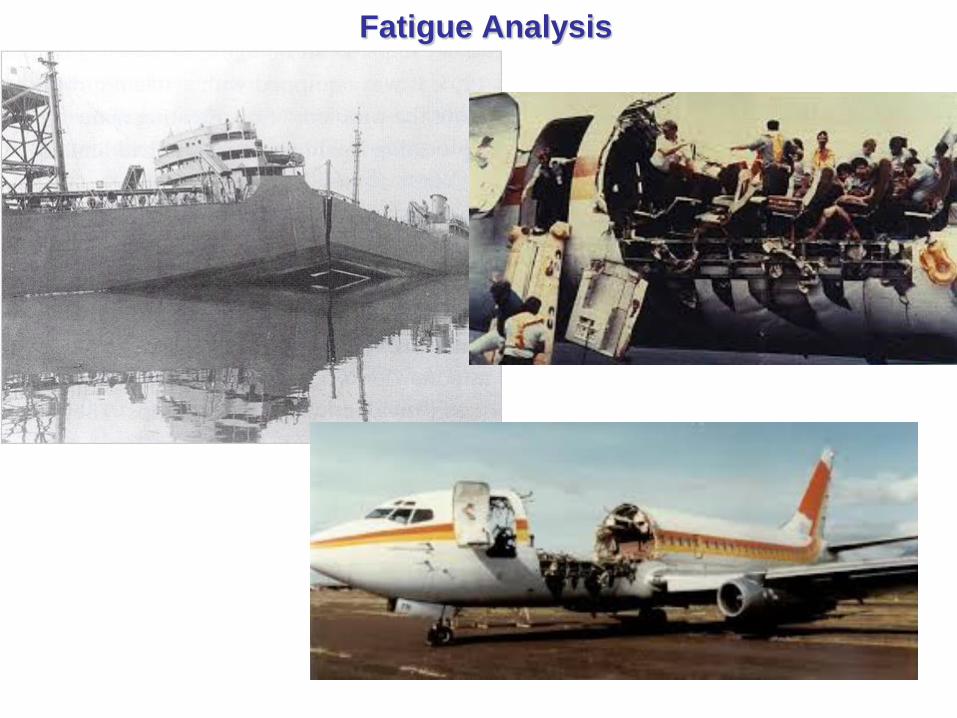
Fatigue Analysis
Fatigue Failure under Dynamic Loads
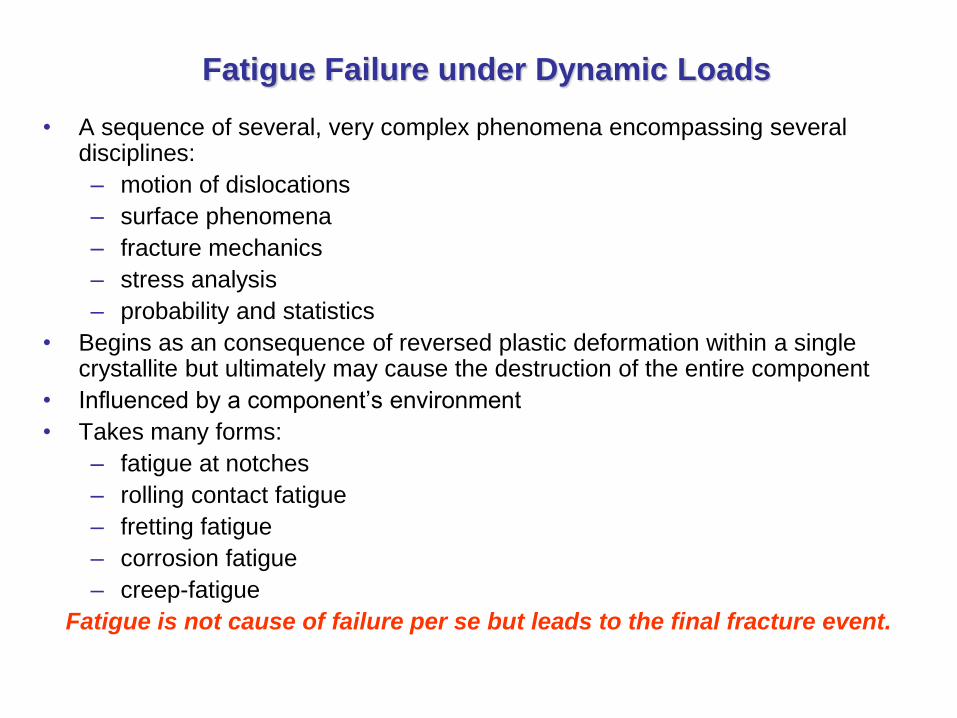
• A sequence of several, very complex phenomena encompassing several disciplines:
– motion of dislocations
– surface phenomena
– fracture mechanics
– stress analysis
– probability and statistics
• Begins as an consequence of reversed plastic deformation within a single crystallite but ultimately may cause the destruction of the entire component
• Influenced by a component’s environment
• Takes many forms:
– fatigue at notches
– rolling contact fatigue
– fretting fatigue
– corrosion fatigue
– creep-fatigue
Fatigue is not cause of failure per se but leads to the final fracture event.
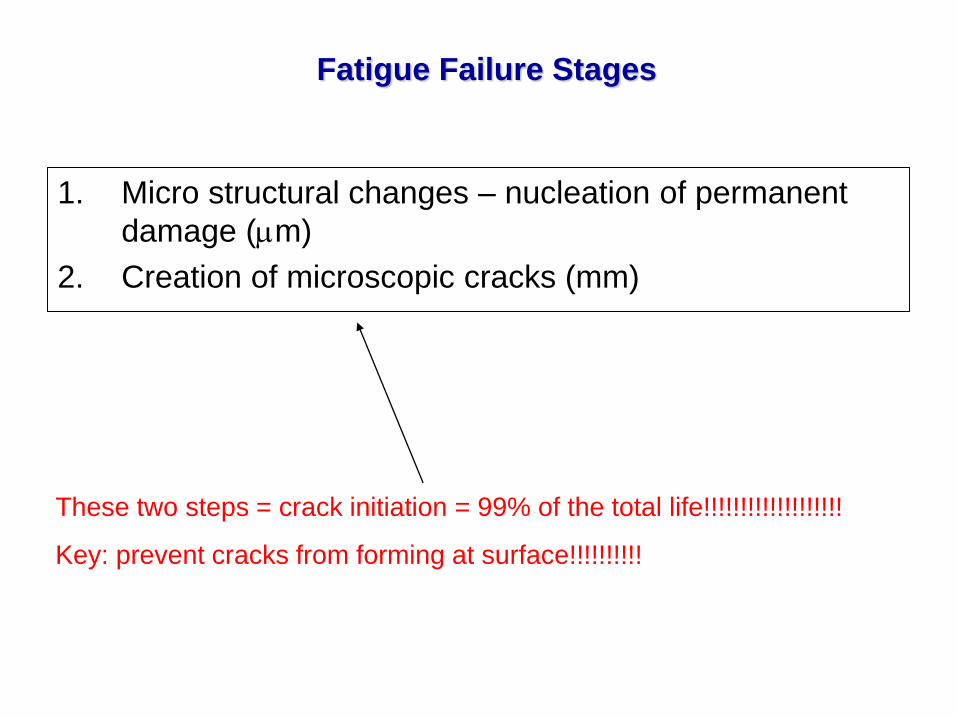
Fatigue Failure Stages
1. Micro structural changes – nucleation of permanent
damage (mm)
2. Creation of microscopic cracks (mm)
These two steps = crack initiation = 99% of the total life!!!!!!!!!!!!!!!!!!!
Key: prevent cracks from forming at surface!!!!!!!!!!
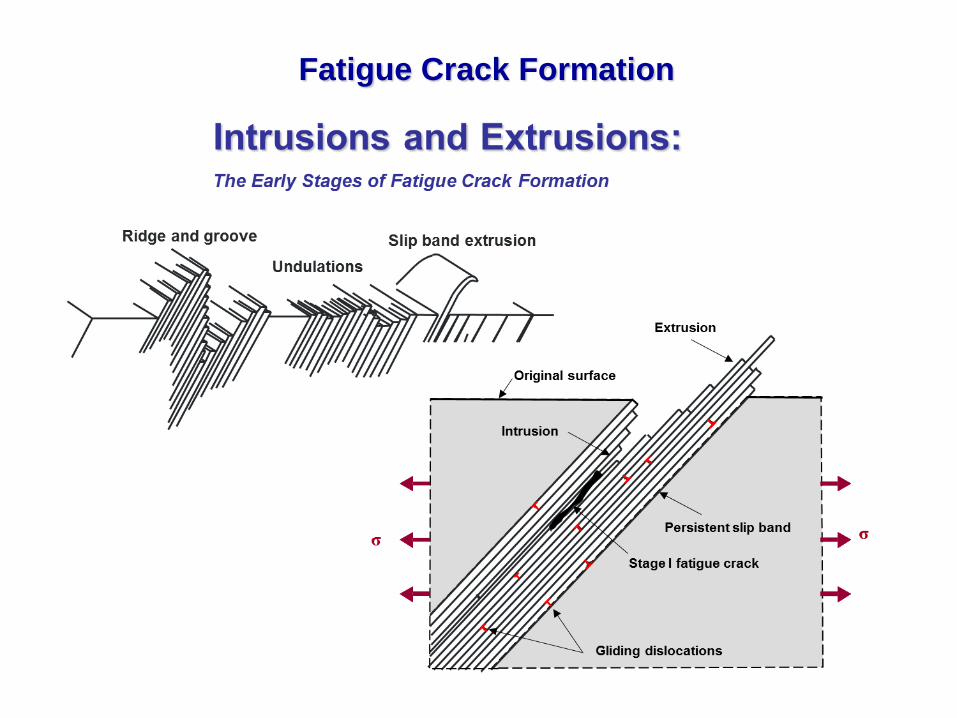
Fatigue Crack Formation

Information Path for Strength and Fatigue Life Analysis
Component
Geometry
Loading
History
Stress-Strain
Analysis
Damage Analysis
Fatigue Life
Material
Properties
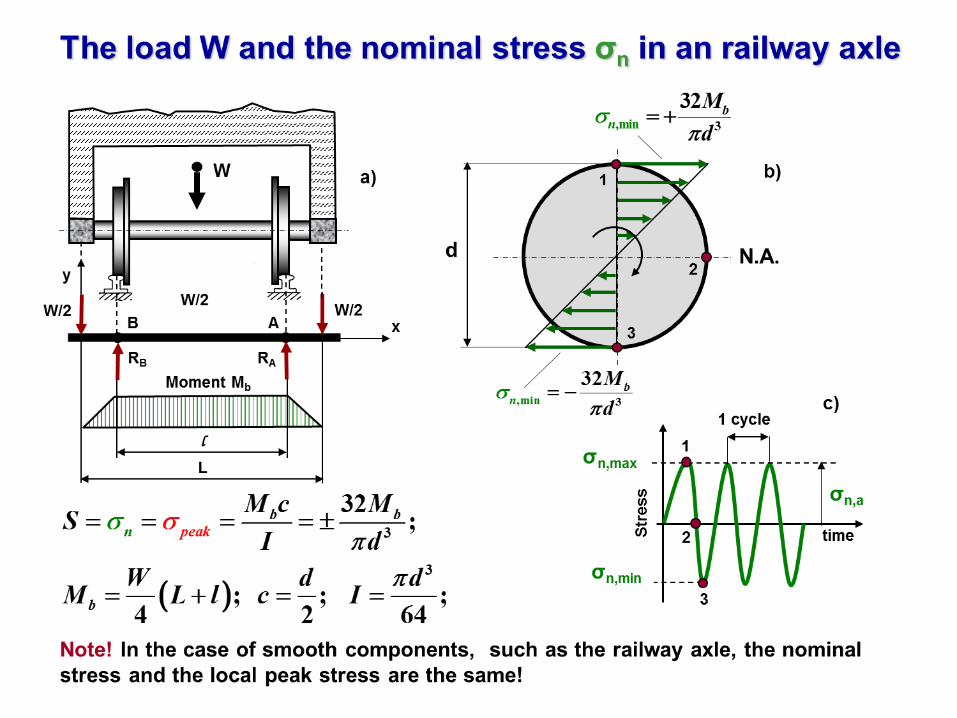

Characteristic parameters of the S - N curve are:
Se - fatigue limit corresponding to N = 1 or 2106 cycles for
steels and N = 108 cycles for aluminum alloys,
S103 - fully reversed stress amplitude corresponding to N = 103 cycles
m - slope of the high cycle regime curve
Fully reversed axial S-N curve for AISI 4130 steel. Note the break at the LCF/HCF transition and the endurance limit
10m A m
aS C N N
The S-N fatigue curve
Number of cycles, N
Str
ess a
mp
litu
de
, S
a(k
si)
Low cycle fatigue
Part 1
Infinite life
Part 3
100 101 102 103 104 105 106 107 10830
40
50
60
70
80
90
100
120
140
High cycle fatigue
Part 2
Sy
Se
Su
S103
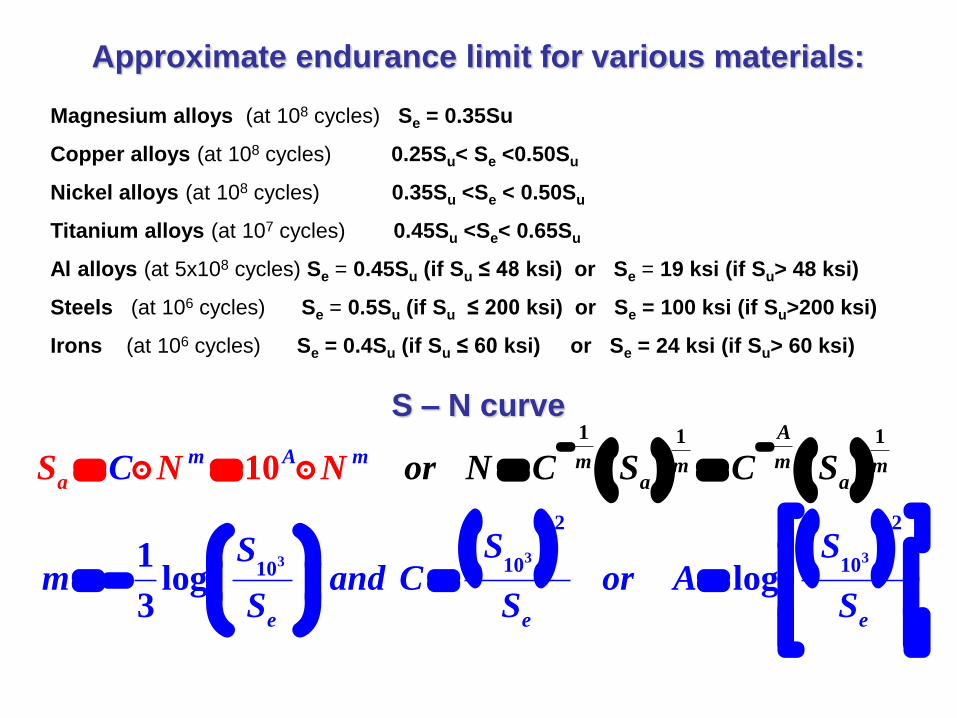
Approximate endurance limit for various materials:
Magnesium alloys (at 108 cycles) Se = 0.35Su
Copper alloys (at 108 cycles) 0.25Su< Se <0.50Su
Nickel alloys (at 108 cycles) 0.35Su <Se < 0.50Su
Titanium alloys (at 107 cycles) 0.45Su <Se< 0.65Su
Al alloys (at 5x10⁸ cycles) Se = 0.45Su (if Su ≤ 48 ksi) or Se = 19 ksi (if Su> 48 ksi)
Steels (at 106 cycles) Se = 0.5Su (if Su ≤ 200 ksi) or Se = 100 ksi (if Su>200 ksi)
Irons (at 106 cycles) Se = 0.4Su (if Su ≤ 60 ksi) or Se = 24 ksi (if Su> 60 ksi)
S – N curve
3 33
2 2
10 1010
1 1 1
10
1log log
3
A
m mmm mA m
e e e
aa aC
S SSm and C
or N C S
or AS S
S N N S
S
C
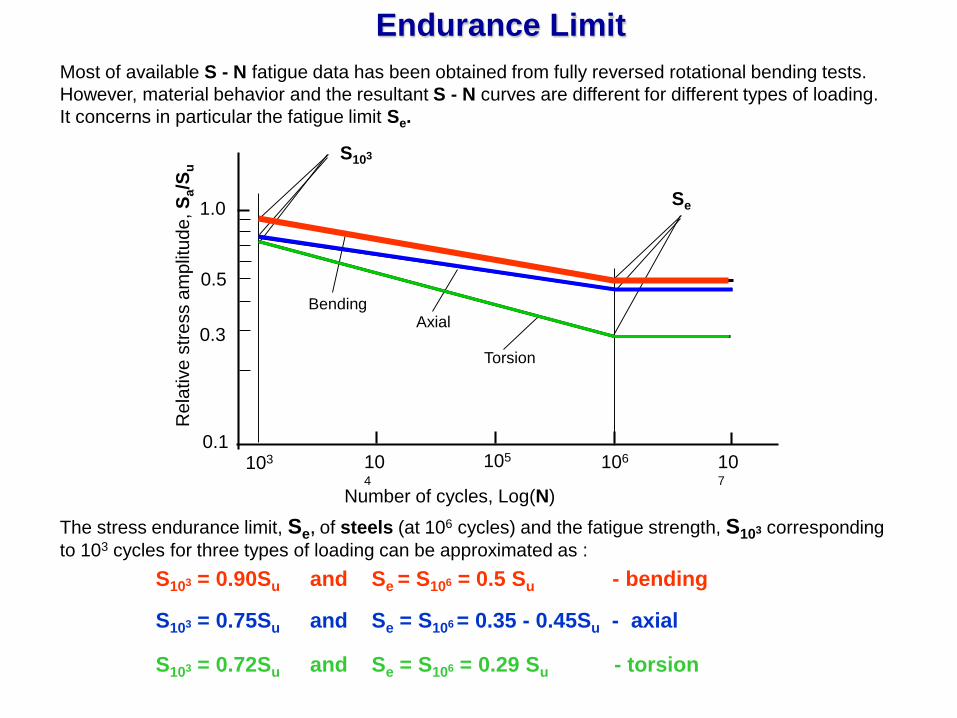
Endurance Limit
Most of available S - N fatigue data has been obtained from fully reversed rotational bending tests.
However, material behavior and the resultant S - N curves are different for different types of loading.
It concerns in particular the fatigue limit Se.
The stress endurance limit, Se, of steels (at 106 cycles) and the fatigue strength, S103 corresponding
to 103 cycles for three types of loading can be approximated as :
S103 = 0.90Su and Se = S106 = 0.5 Su - bending
S103 = 0.75Su and Se = S106 = 0.35 - 0.45Su - axial
S103 = 0.72Su and Se = S106 = 0.29 Su - torsion
103 104
105 106 107
0.1
0.3
0.5
1.0
S103
Se
Number of cycles, Log(N)
Re
lative
str
ess a
mp
litu
de
, S
a/S
u
Torsion
AxialBending

Mean Stress Effect
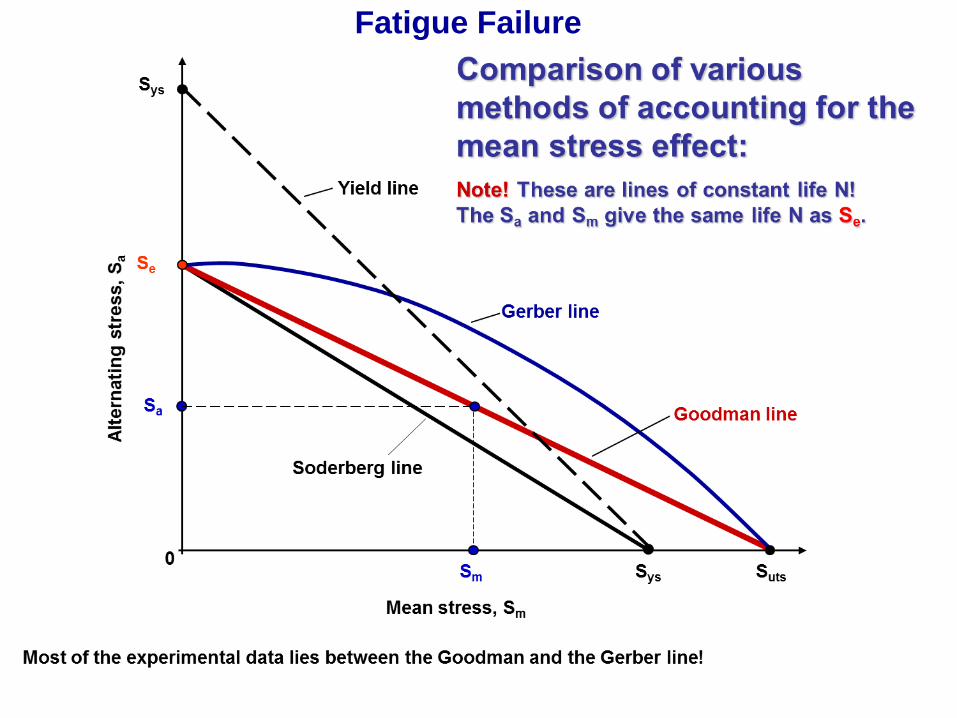
Fatigue Failure
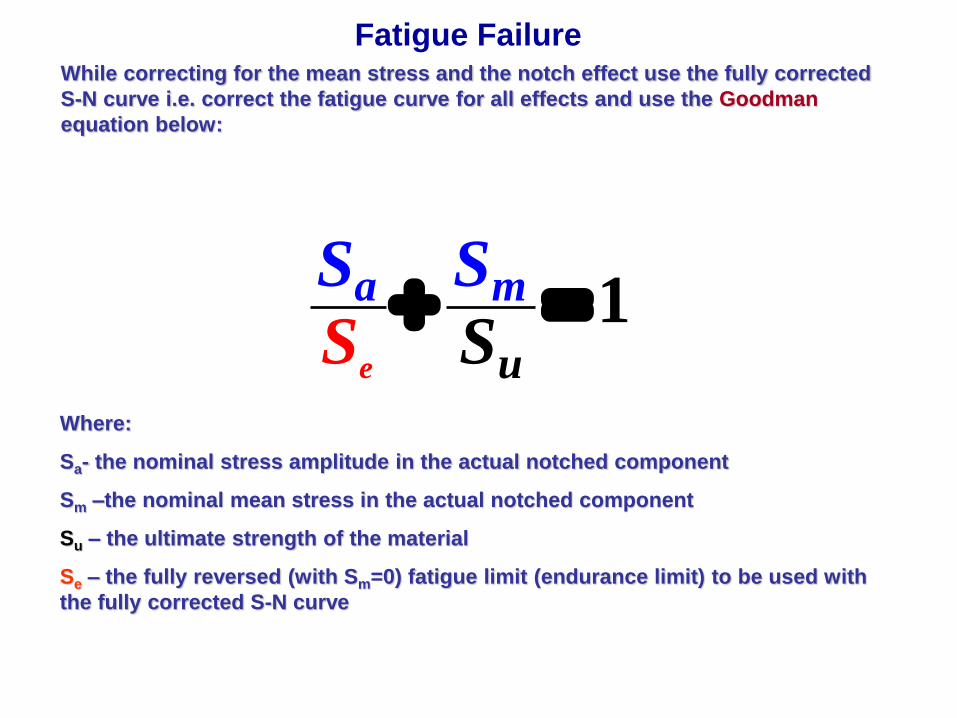
Fatigue FailureWhile correcting for the mean stress and the notch effect use the fully corrected
S-N curve i.e. correct the fatigue curve for all effects and use the Goodman
equation below:
Where:
Sa- the nominal stress amplitude in the actual notched component
Sm –the nominal mean stress in the actual notched component
Su – the ultimate strength of the material
Se – the fully reversed (with Sm=0) fatigue limit (endurance limit) to be used with
the fully corrected S-N curve
1e
a m
u
S S
SS
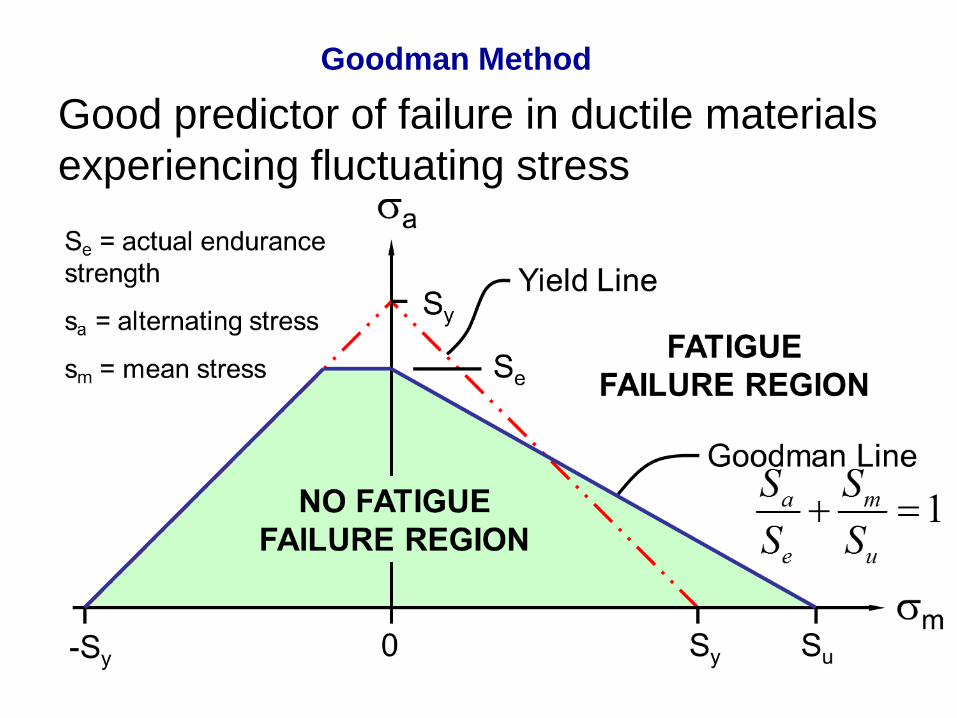
Goodman Method
Good predictor of failure in ductile materials
experiencing fluctuating stress

Goodman Method