Embed Size (px)
Citation preview

EXECUTIVE SUMMARY The MASP 2008 represents a unique and valuable asset management tool for MDOT staff involved in state airport system planning and airport capital development. It documents the planning process that identifies the aviation role of public-use airports in Michigan through the year 2030. MASP 2008 is the culmination of a coordinated review and modification of MASP 2000, a plan that has provided MDOT with a unique and valuable programming tool for the development of the system of public-use airports in Michigan. As with MASP 2000, the MASP 2008 presents the results of a system planning process that has been aligned with the goals and objectives of MDOT’s State Long Range Plan. The MASP 2008 supports programming decisions and is useful in evaluating programming actions related to airport system and airport facility deficiencies. A diverse group of individuals was assembled into a MASP 2008 Steering Committee that provided valuable input and direction over the course of the study. This board-based group included representatives from both within and outside the aviation community. Michigan currently has 235 public-use airports. Omitted from the MASP 2008 are private-use airfields, heliports, seaplane bases, hospital helistops, and military facilities, albeit joint-use public/military facilities are included in the system plan. Of the 235 public-use airports, 129 (55 percent) are publicly owned and 106 (45 percent) are privately held. Although both types of facilities are open to the public, ownership plays an important role in at least two ways; first, publicly owned airports tend to continue functioning as airports over the long haul with a sense of stability that is important to users of the airport. They are also more readily accepted as a community asset. Privately owned airports are far more likely to drift into and out of public use and, consequently, are less reliable as long-term transportation resources. Privately owned airports are often under extreme pressure from developers and others for conversion into non-aviation uses, such as housing or commercial development. Once converted to another use, the likelihood of restoring the airport to its former use is remote, at best. A severe strain on the aviation industry as relates to current economic trends has caused the FAA to modify its forecasting procedures since MASP 2000. For the period 2008-2025, the FAA projects 22 percent growth nationwide in total airport operations and 1.3 percent average annual growth. In the Great Lakes region, the FAA projects 18 percent total growth and 1.1 percent average annual growth. Similar to operations forecasts, the FAA’s based aircraft projections show minor growth for the period 2008-2025. The FAA projects 16 percent total growth nationwide in based aircraft and 0.9 percent average annual growth. In the Great Lakes region, the FAA projects 13 percent total growth and 0.8 percent average annual growth. Among the key functions of the MASP 2008 is, from a state perspective, identifying those airports that can best respond to state goals and objectives. To that end, a series of system goals were identified as an outcome of an issue identification process related to the State Long Range Plan. System goals identified were . . .
Airports should serve significant population centers

Airports should serve significant business centers Airports should serve significant tourism/convention centers Airports should provide access to the general population Airports should provide adequate land area coverage Airports should provide adequate regional capacity, and Airports should serve seasonally isolated areas.
In turn, all airports, following a rigorous analytical process, were assigned to one of three tiers based on their contribution to the system goals. Tier 1 airports respond to critical/essential state airport system goals. These airports should be developed to their full and appropriate level. Tier 2 airports complement the essential/critical state airport system and/or respond to local community needs. Focus at these airports should be on maintaining infrastructure with a lesser emphasis on facility expansion. Tier 3 airports duplicate services provided by other airports and/or respond to specific needs of individuals and/or small business. The following table summarizes the system standards and indicated the number of airports included in Tier 1 or Tier 2 for each system goal. A number of airports respond to more than one system goal. Composite Alternative Summary System Goal Apt Class Service
Area Service
Goal Tier 1 Tier 2
Population Centers C-II 30 min 95% 32 10
Business Centers C-II 30 min 95% 36 14
Tourism Centers B-II 30 min 95% 39 9
General Population Access B-II 45 min 95% 28 4
Land Area Coverage B-I 30 miles 95% 50 0
Regional Capacity B-I NA 125% 64 15
Isolation B-I or Heliport NA 100% 7 0
Overall 87 24 In addition to establishing system goals, a series of facility goals were developed that identify the basic components of an airport. These facility goals are specific for each airport classification. Facility goals are . . .
Primary Runway System Pavement Condition Lighting and Visual Aids Approach Protection Basic Pilot and Aircraft Services

All-Weather Access Year-Round Access Landside Access
All airports were evaluated to determine whether they currently meet each facility standard and the extent and cost associated with responding to deficiencies through the year 2030. The following table identifies the number of Tier 1 airports meeting the facility standards: Number of Airports Meeting Facility Goal Standards
System Goal Facility Goal Population
Centers Business Centers
Tourism Centers
General Population
Land Cover
Regional Capacity Isolation
Number of Tier 1 Airports 32 36 39 28 50 64 7
Primary Runway System 84% 75% 77% 96% 94% 94% 57%
Pavement Condition 88% 83% 87% 93% 82% 86% 57%
Lighting and Visual Aids 78% 64% 79% 82% 80% 85% 43%
Approach Protection 100% 100% 100% 100% 100% 100% 100%
Basic Pilot & Aircraft Svs. 88% 89% 82% 89% 84% 88% 43%
All-Weather Access 91% 67% 92% 96% 84% 77% 43%
Year-Round Access 100% 100% 95% 100% 96% 100% 57%
Landside Access 97% 97% 95% 96% 86% 89% 57% Many of the goals included in the MASP 2008 are broad in scope, which makes it difficult to create or define metrics that can be used to measure or assess progress in attaining the goals. Likewise, it would be equally difficult to assess the funding necessary to fully and completely meet the goals described in this document. However, MDOT’s long-range plan, “MI Transportation Plan,” includes an estimate of the funding necessary to meet the capital improvement needs of Michigan’s airports through 2030, as requested by individual airport sponsors. If funding were identified to meet all the capital needs required to keep Michigan’s airports running safely and efficiently, it would likely ensure that virtually all the goals of this plan are met. The goals described in this plan, coupled with the individual facility requests submitted to MDOT by airport sponsors, will culminate in an aviation investment strategy. This strategic plan, developed subsequent to the MASP 2008, will aid in determining project selection priorities.


INTRODUCTION The methods established in the year 2000 version of the Michigan Airport System Plan represented a novel, new approach to airport planning and programming for the Michigan Department of Transportation (MDOT). This new approach resulted in the documentation of airport-related facilities necessary to meet both current and future air transportation needs of the state. The 2008 version of the Michigan Airport System Plan, or MASP 2008, uses the framework established in the 2000 edition, reexamines the premises of that plan, and adjusts the plan accordingly to insure applicability for the time frame 2008 through 2030. MASP 2008 identifies the aeronautical role of existing and recommended (new) airports and examines the components of both the airport system and individual airports required to serve that system. State system planning is accomplished within a comprehensive planning framework consistent with state goals and objectives for economic development and transportation. Such planning also provides direction for airport master planning. The purpose of airport system planning, described in its broadest sense, is to determine the extent, type, nature, location, and timing of airport development needed in the state to establish a viable, balanced, and integrated system of airports to provide adequate service to Michigan residents and business. MASP 2008 includes the following features:
Goals and measurable objectives with respect to airport development and the relationship to Michigan's economic development and transportation infrastructure. Aviation oriented objectives regarding the safety and level of service of Michigan's airports. Policy and technical direction for airport master planning to be undertaken by individual airport sponsors. Provision of a management and coordinative resource to complement and support urban and regional planning.
Michigan has a continuing obligation with the Federal Aviation Administration (FAA) to develop and maintain a current state system plan. MASP 2008 represents that plan. It has been aligned with the goals and objectives of MDOT's State Long-Range Plan. The MASP 2008 supports programming decisions and is useful in evaluating programming actions related to the airport system and airport facility deficiencies.


SYSTEM DESCRIPTION Three areas will be examined in regards to the description of the airport system in Michigan: ■ Number and Location of Existing Airport Facilities ■ Airport Classifications ■ Airport Service Areas Number and Location of Existing Airport FacilitiesMichigan currently has 235 public-use airports. Omitted from the MASP 2008 are private-use airfields, heliports, seaplane bases, hospital helistops, and military facilities, although joint-use public/military facilities are included in the system plan. Of the 235 public-use airports, 129 (55 percent) are publicly owned and 106 (45 percent) are privately held. Although both types of facilities are open to the public, ownership plays an important role in at least two ways; first, publicly owned airports tend to continue functioning as airports over the long haul with a sense of stability that is important to users of the airports. They are also more readily accepted as a community asset. Privately owned airports are far more likely to drift into and out of public use and, consequently, are less reliable as a long-term transportation resource. Privately owned airports are often under extreme pressure from developers and others for conversion into non-aviation uses, such as housing or commercial development. Once converted to another use, the likelihood of restoring the airport to its former use is remote, at best. Table 1 illustrates the number of public-use airports by ownership in each county in 2008. Two counties, Arenac and Keweenaw, are without a public-use airport. Counties without publicly owned airports are Baraga and Missaukee. Clinton County and St. Clair County both have the largest number of public-use airports, at ten each.
1

Map 1 Public Use Airports in Michigan, 2008
2

Table 1
County Public Private Total County Public Private Total Alcona Alger
Allegan Alpena Antrim Baraga Barry Bay
Benzie Berrien Branch Calhoun
Cass Charlevoix Cheboygan Chippewa
Clare Clinton
Crawford Delta
Dickinson Eaton
Emmet Genesee Gladwin Gogebic
Grand Traverse Gratiot
Hillsdale Houghton
Huron Ingham Ionia Iosco Iron
Isabella Jackson
Kalamazoo Kalkaska
Kent Lake
Lapeer
1 2 3 1 2 0 1 1 2 3 1 2 1 4 2 3 2 2 1 1 1 1 2 3 1 1 2 1 1 1 2 1 1 2 2 2 1 1 1 3 1 1
1 0 2 1 2 1 0 1 0 1 0 0 0 2 2 0 0 8 0 0 0 3 0 3 1 0 1 2 0 1 2 3 0 1 0 2 4 3 0 2 0 0
2 2 5 2 4 1 1 2 2 4 1 2 1 6 4 3 2 10 1 1 1 4 2 6 2 1 3 3 1 2 4 4 1 3 2 4 5 4 1 5 1 1
Leelanau Lenawee
Livingston Luce
Mackinac Macomb Manistee Marquette
Mason Mecosta
Menominee Midland
Missaukee Monroe
Montcalm Montmorency
Muskegon Newaygo Oakland Oceana
Ogemaw Ontonagon
Osceola Oscoda Otsego Ottawa
Presque Isle Roscommon
Saginaw Sanilac
Schoolcraft Shiawassee
St Clair St Joseph Tuscola
Van Buren Washtenaw
Wayne Wexford
2 1 1 1 4 1 1 1 1 2 1 1 0 1 2 2 1 2 3 1 1 1 1 2 1 2 2 4 3 2 1 1 1 2 1 1 1 5 1
2 5 6 0 0 1 0 1 0 2 0 0 2 4 1 0 0 1 0 1 0 0 1 1 0 5 0 0 1 5 0 3 9 0 1 1 3 0 1
4 6 7 1 4 2 1 2 1 4 1 1 2 5 3 2 1 3 3 2 1 1 2 3 1 7 2 4 4 7 1 4 10 2 2 2 4 5 2
Public-Use Airports by County 2008
3

Airport ClassificationThe FAA uses an Airport Reference Code (ARC) system that classifies airports by the operational and physical characteristics of the most demanding aircraft intended to operate at the facility. This system has two components: 1) approach category, which relates to the operational characteristics of aircraft; and 2) design group, which relates to the physical characteristics of aircraft. Approach Category An aircraft approach category is a grouping of aircraft based on 1.3 times the stall speed in landing configuration at maximum certified landing weight. This aircraft group must generate or be forecasted to generate at least 500 total annual operations. The highest category of aircraft to meet this standard is established as the critical aircraft at an airport. Table 2 - Approach Category Standards
FAA Approach Category Approach Speed A Less than 91 knots B 91 to 120 knots C 121 to 140 knots D 141 to 165 knots E 166 knots or more
Design Group Airplane design group is a grouping of airplanes based on wingspan. The design group of the critical aircraft determines the geometrics of the airport. Runway and taxiway widths, apron sizes, turning radii, and other airport physical characteristics are based on design group designation. Table 3 – Design Group Standards
FAA Design Group Wingspan I Less than 49 feet II 49 to 78 feet III 79 to 117 feet IV 118 to 170 feet V 171 to 213 feet VI 214 to 261 feet
4

MASP Airport Classification For the MASP, all airports are classified by approach category and design group of the primary runway. The following summarizes the classification of Michigan’s 235 public-use airports by approach category/design group and by public or private ownership. Characteristics Approach Category Design Group Typical Runway Length A I 3,000 feet or less B I 3,000 to 3,500 feet B II 3,500 to 5,000 feet C II 5,000 feet C III (+) More than 5,000 feet D III (+) More than 6,000 feet
Other approach category-design group combinations are possible. Actual and recommended airport designations are based on the fleet mix of aircraft currently operating, or forecasted to operate, at a particular airport.
Runway Length Runway Surface Number of Airports (ownership) Public Private
1,500 feet or more Turf 35 100 3,500 feet or less Paved 10 5 3,500 to 4,300 feet Paved 49 1 4,300 to 5,000 feet Paved 12 0 More than 5,000 feet Paved 10 0 More than 6,000 feet Paved 13 0
Examples of common aircraft found in each Airport Reference Code (ARC) follow: A-I Beech Bonanza, Cessna 172, Piper Cherokee, Eclipse 500 B-I Cessna 310, Beech Baron, Piper Navajo B-II Beech King Air 200, Cessna Citation II, Dassault Falcon 20 C-II Canadair CRJ, Canadair Challenger, Grumman Gulfstream II, Learjet 25 & 55,
Hawker 125 C-III Boeing 727 & 737, McDonnell Douglas DC-9 D-IV/V Airbus 320 & 330, Boeing 747 & 777, McDonnell Douglas DC-10, MD-11
MASP Classification and Priorities The MASP 2008, from a state perspective, assigns airports to one of three tiers based on an airport’s ability to respond to state goals and objectives, as described in Chapter 5.
5

Tier 1 Airports respond to essential/critical state airport system goals and objectives. These core airports should be developed to their full and appropriate level.
Tier 2 Airports complement the essential/critical state airport system and/or respond to local community needs. Focus at these facilities should be on maintaining infrastructure with less emphasis on facility expansion.
Tier 3 Airports duplicate services provided by other airports and/or respond to specific needs of individuals and/or small businesses. These facilities are secondary to meeting the overall state system goals and only receive minimal safety enhancements, such as runway cones and wind socks.
Airport Service AreasThe value of aviation facilities is related to its proximity to population centers, business centers, tourism/convention centers, and other aviation related traffic generators. The closer an airport is located to these areas, the greater its value as a transportation resource. Beyond certain travel thresholds, airports may have a reduced transportation value. The analytical tool used in alternative development and analysis within MASP 2008 utilizes the “Statewide Travel Demand Model,” which has been used historically for highway analysis in Michigan. The model divides the state into 2,307 Transportation Analysis Zones (TAZ), each generally a township or smaller in size. Each of the zones has a variety of socioeconomic data assigned to it, including current and forecasted population, employment, et cetera. Each TAZ is connected to all other zones using the actual highway network with appropriate speeds and travel times. This permits an analysis of travel time between all zones.
6

FORECAST OF FUTURE ACTIVITY This section is a brief summary of projection-related information from the FAA regarding airport operations and based aircraft. In consideration of current trends, projection methods had to be altered from procedures that were used in past editions of the MASP. This particular section includes forecast data that the FAA has gathered, taking into account nationwide trends. These projections have not been specifically calculated for Michigan, but some include Great Lakes regional forecasts. A more detailed airport-by-airport list of projections for Michigan can be found in Volume II. A severe strain on the aviation industry as relates to current economic trends has caused the FAA to modify its forecasting procedures. The rising price of crude oil has become the most significant economic factor impacting the aviation industry today and threatens airport operations. Because of it, some airlines have been forced into restructuring. Following the lead of the well-known consulting firm Global Insight, Inc., the FAA has factored in the possibility of a future recession in the US economy; and under this scenario, the FAA’s forecasted figures for the period 2008-2025 are lower than the original projections. FAA 2008-2025 Operations Forecast The FAA has predicted moderate growth in airport operations. Projections show slightly more growth nationwide than at airports in the Great Lakes region. Local Operations * The FAA projects 13 percent growth and 0.8 percent average annual growth in local operations between 2008 and 2025, at airports with a combination of FAA Traffic Control Service (FTCS) and Contract Traffic Control Service (CTCS).
2008-2025 Operations Forecast
15,000,00015,500,00016,000,00016,500,00017,000,00017,500,00018,000,00018,500,000
2008201120142017202020232025
LocalOperationsForecast
*Regional growth not projected by FAA for Local Operations
1

Itinerant Operations The FAA projects 27 percent growth nationwide in itinerant operations between 2008 and 2025, and 1.6 percent average annual growth. In the Great Lakes region, the FAA projects 24 percent total growth and 1.4 percent average annual growth.
2008-2025 Itinerant Operations Forecast
0
20,000,000
40,000,000
60,000,000
80,000,000
100,000,000
2008
2011
2014
2017
2020
2023
2025NationwideForecast
Great LakesRegionForecast
Total Airport Operations For the period 2008-2025, the FAA projects 22 percent growth nationwide in total airport operations and 1.3 percent average annual growth. In the Great Lakes region, the FAA projects 18 percent total growth and 1.1 percent average annual growth.
2008-2025 Total Airport Operations Forecast
020,000,00040,000,00060,000,00080,000,000
100,000,000120,000,000140,000,000160,000,000
2008
2011
2014
2017
2020
2023
2025
NationwideForecast
Great LakesRegionForecast
2

FAA 2008-2025 Based Aircraft Forecast Similar to operations forecasts, the FAA’s based aircraft projections show minor growth for the period 2008-2025. The FAA projects 16 percent total growth nationwide in based aircraft and 0.9 percent average annual growth. In the Great Lakes region, the FAA projects 13 percent total growth and 0.8 percent average annual growth.
2008-2025 Based Aircraft Forecast
0
50,000
100,000
150,000
200,000
250,000
2008
2011
2014
2017
2020
2023
2025
NationwideForecast
Great LakesRegionForecast
3

Period Prior to Forecast Range FAA’s projections show improvement when contrasted with the period 2002-2007, which indicated a decline in operations figures and minimal growth in based aircraft numbers. National Figures The period from 2002-2007 saw a 4.7 percent decline in total airport operations and a 0.9 percent drop in average annual growth. Itinerant operations experienced a 4.3 percent drop and 0.9 percent decrease in average annual growth. Local operations at FTCS and CTCS airports, combined, experienced a 14 percent drop in growth and a decrease of 1.9 percent in average annual growth. Based aircraft grew by only a 5.3 percent total during the period and experienced 1.1 percent average annual growth.
2002-2007 National Operations
020,000,00040,000,00060,000,00080,000,000
100,000,000120,000,000140,000,000
2002
2003
2004
2005
2006
2007
Total AirportOperationsLocal Operations
ItinerantOperations
4

2002-2007 National Based Aircraft
186,000188,000190,000192,000194,000196,000198,000200,000202,000204,000
2002 2003 2004 2005 2006 2007
Num
ber o
f Airc
raft
Great Lakes Region Figures The period 2002-2007 saw a 9.6 percent decline in total airport operations and a 1.9 percent drop in average annual growth. Itinerant operations experienced a 9 percent drop and a decrease of 1.8 percent in average annual growth. Based aircraft dropped by a 0.04 percent total during the period and experienced a decrease of 0.01 percent in average annual growth.
2002-2007 Great Lakes Region Operations
0
5,000,000
10,000,000
15,000,000
20,000,000
25,000,000
2002 2003 2004 2005 2006 2007
ItinerantOperationsTotal AirportOperations
5

2002-2007 Great Lakes Region Based Aircraft
31,60031,80032,00032,20032,40032,60032,80033,00033,200
2002 2003 2004 2005 2006 2007
Num
ber o
f Airc
raft
6

GOALS AND OBJECTIVES ISSUE IDENTIFICATION As part of the development of MASP 2008, the study team, including both MDOT staff and the Steering Committee, examined issues affecting air transportation in Michigan. The results of that examination are summarized below. Preservation of Endangered Airports Currently, there are 235 public-use airports in operation throughout Michigan. At any given time several of these facilities are under pressure from local officials and/or developers to close and be converted to an alternate use. Pressure is most often exerted on small general aviation airports operating in or adjacent to their service communities. This is a particular concern to airports operating in southeast Michigan, where additional airport closures would threaten overall regional capacity. Generally, public-use airports, from a preservation perspective, fall into one of four categories: The airport is the only public-use facility serving the area and should be preserved because of
the access it provides to the community and access it provides the community to outside services.
The airport is in an area where regional aircraft capacity is stressed and the facility needs to be
preserved to assure continued regional capacity.
The airport functions as a reliever to a larger airport by allowing lower performance aircraft to utilize the smaller airport rather than the larger airport, where the number of operations by high performance aircraft would be inhibited by the smaller aircraft. At busy airports, a mix of slower and faster aircraft adversely impacts operational capacity. Preservation of a smaller airport that would provide an alternative to a very busy airport would benefit both types of aircraft operations.
The airport duplicates service that is already provided by another airport in reasonable
proximity. Where a community is served by more than one airport, care should be taken to assure the continued operation of the airport that is best suited to respond to the current and ultimate aviation needs of the community.
Emerging Aviation Technologies National projections show that air traffic volume will double by the year 2025. The Federal Aviation Administration (FAA) estimates that present national air system capacity will reach maximum by 2015. To handle demand and improve operational capacity, the FAA has implemented the “Next Generation Air Transportation System,” as authorized by Congress in 2003 in the VISION 100, “Century of Aviation Reauthorization Act” (P.L. 108-176). The goal of NextGen is to implement new technologies, such as satellite-based navigation, surveillance, and networking to safely and efficiently improve operational capacity at the nation’s airports and to be responsive to evolving business models utilizing aviation transportation.
1

Two of these technologies are now being implemented, both of which have received FAA funding. First, the “Automatic Dependent Surveillance Broadcast” is a satellite-based system that will allow the controller, the pilot, and other aircraft to see the same information at the same time, thereby offering significant safety and efficiency improvements over traditional land-based radar systems. Secondly, the “System-Wide Information Management” is part of implementing NextGen’s network-enabled operations. This system will link information of all kinds (position, weather, restricted airspace notices, et cetera) to all relevant users in the system. Beyond the NextGen initiatives, projected development of Very Light Jet (VLJ) aircraft could significantly expand the availability of charter jet service to general aviation airports with runway lengths of approximately 3,000 feet. Some analysts project that VLJs could compete as an alternative to commercial air travel. Assuming VLJ service becomes more widely available over the next decade, some general aviation airports may choose to make jet fuel and other services available to accommodate this market. Widespread availability of VLJs as an air-taxi alternative to commercial airline regional and hub service will depend on low cost projections and high demand to become a reality. These uncertainties keep the future viability of VLJs an open question among aviation experts. Early on in developing the MASP 2008, discussions were held on the feasibility of adopting a facility goal for promoting statewide availability of jet fuel at all airports having a minimum runway length of 4,000 feet. This discussion resulted in a decision not to set a statewide goal for fuel availability because, 1) it is difficult to predict the demand for jet fuel at specific airports of this size; and 2) on-site jet fuel at locations where no regular demand develops could result in significant economic hardship to airport operators and environmental impacts that result from the need to dispose of unused fuel stored beyond its useful life. It was determined that a better strategy would be to monitor increased demand for jet fuel in annual programming meetings between MDOT, Bureau of Aeronautics and Freight Services, staff and local airport sponsors and thereby plan for availability of this fuel as demand develops in various areas of the state. Airport Security The September 11, 2001 attacks on America focused increased national and international attention on airport security issues, particularly on the security of passengers boarding larger commercial aircraft. Airports of all sizes play a central role in interstate commerce and national economic activity. Airport security policy requires broad national uniformity. Government policy and planning for increased airport and aviation security is an important area for federal action and leadership. The federal Transportation Safety Administration has established a nationwide program for air passenger screening and airport perimeter security at commercial service airports. States and individual airport facilities may also play a role in promotion of security related activities. Following the September 11, 2001 attacks, a variety of Michigan-based professional aviation organizations, including the Michigan Association of Airport Executives and the General Aviation Committee of the Michigan Aeronautics Commission, met to discuss issues and possible actions to improve security at the state’s general aviation airports. The consensus view resulting from these discussions was that increased vigilance for unusual or suspicious
2

activity, and consistent reporting by airport staff and aircraft operators, was the single most effective security measure to be undertaken by the aviation industry at the state level. The MASP core team (MDOT Aeronautics and Planning staff) carefully evaluated the potential for adding a specific facilities’ goal to install airport perimeter fencing at selected facilities statewide. Initially, the intention was to target fencing to address two separate security issues: 1) prevention of animal incursion onto airport runways; and 2) reduction in likelihood of incursions onto airport property by unauthorized persons. After careful consideration, the core team concluded that attempting a blanket statewide policy goal for perimeter fences would be counterproductive, because 1) the incidence of animal incursion varies widely, depending on locality; and 2) determinations of likelihood of unauthorized incursions onto airport property and the general status of security measures at individual facilities can more properly be assessed on a case-by-case basis due to the unique features and characteristics of each facility. Accordingly, it was determined that careful annual assessment of individual airport fencing needs should more properly be addressed in annual programming meetings conducted by MDOT, Bureau of Aeronautics and Freight Services, staff with individual airport sponsors.
Preservation of Airport Infrastructure MDOT’s emphasis on maintaining the integrity of pavement at airports throughout Michigan should continue. As pavement ages, more and more funding resources are being focused on reconstructing airport pavement. In 2006, MDOT authorized a three-year agreement with AP Tech, Inc. to survey and evaluate the pavement condition at 80 airports in the state. The resulting data will provide the department and local airport sponsors with the information needed to assist in management of pavement life and the appropriate timing of pavement rehabilitation/reconstruction actions. Access to Population Centers Significant population centers generate and attract a wide range of general aviation operations, including flights for business, freight, cargo, medical emergencies, search and rescue, law enforcement training, et cetera. The presence of a year-round general aviation facility to serve these trip needs is an essential component of a well-rounded, full-service community. Access to Business Centers Significant economic and manufacturing production centers require a wide range of transportation facilities to respond to product and people-moving needs. Airports can respond to product movement needs by permitting the rapid, timely movement of parts and products critical to economic vitality. Timely movement of executives, key personnel, and clients between production centers can also be accomplished through development of general aviation airport facilities that provide a full range of services. Access to Tourism/Convention Areas In Michigan, the tourism and convention industry is a four-season, rapidly expanding component of the state's overall economic well-being. Access to tourist and convention areas, not only from within Michigan but also from throughout the midwest and the nation, can be effectively provided through properly developed airport facilities. In a number of locations, primarily in northern Michigan and in shoreline communities, the local area is as dependent on the
3

tourism/convention industry as the Detroit area has historically been dependent on the automobile industry. Access to Isolated Areas There are seven populated Great Lakes islands that for at least a portion of the winter months are without ferry service and, consequently, seasonally isolated. During these periods, air transportation provides the only reliable access between the mainland and the island. Island populations are dependent on aviation to provide emergency and other essential access. In 1996, both the Michigan State Transportation Commission and the Michigan Aeronautics Commission adopted an Island Transportation Policy. Islands affected by this include Beaver, Bois Blanc, Drummond, Harsens, Mackinac, Neebish and Sugar. Compatible Land Use and Zoning Historically, airports were developed in rural areas near the communities they serve. Over time, urban development has grown out to the airport environs, often resulting in commercial and residential land use not ideally compatible with airport operations and raising concern regarding safety and noise. Effective local zoning can help prevent these problems by adopting reasonable and enforceable standards that include compatible land use near airports. To that end, the state provides that the Michigan Aeronautics Commission may adopt an airport approach plan, which includes compatible land use near airports, for each public-use airport. These airport approach plans shall be provided to each affected (zoned) municipality to be included in their master plan. Each publicly owned airport may also adopt its own zoning guidelines. These plans shall also be included in the community’s master plan. Zoning decisions are the responsibility of the local government and local airport zoning board. Interface with Other Modes of Transportation Rather than viewing an airport as the beginning or ending point of a trip, an airport should be viewed as a transfer point from one mode of transportation to another. Not only is the efficient and effective movement of people and goods dependent on an appropriately developed airport, but on appropriate access to the airport and efficient transfer from surface mode to air mode. At the most demanding airports, this may entail highways that can accommodate significant traffic volumes, public transportation services, and significant passenger and cargo movements. A variety of access enhancement actions may be appropriate, ranging from infrastructure improvements to traffic control devices. All-Weather Airport Access During periods of low clouds and reduced visibility, an airport can only be used with the aid of instruments which allow flight through poor weather conditions. By using Instrument Flight Rules (IFR), a pilot can fly an aircraft safely when cloud ceilings and visibility limits do not allow flight by visual means. The precision of the navigational landing aids, both in the cockpit and on the ground, determines the minimum altitude and visibility a pilot can safely encounter and see the runway to land. The higher the minimums, the more frequently a pilot has to divert to an alternate airport during periods of adverse weather conditions. An airport's utility to the business community, as well as other users, is enhanced by increasing the precision of the navigational landing aids available. In
4

Michigan, this is particularly important where the Great Lakes often influence weather conditions that impact aircraft operations. With that in mind, the Michigan Aeronautics Commission, in 1999, adopted an All Weather Airport Access Plan. Features of the plan are incorporated into the MASP 2008. Airport Services The range of service provided at airports varies significantly. Basic aircraft services include fuel, aircraft repair, and hangar facilities available during normal business hours. Basic pilot services include telephone, restrooms, and access to shelter. MI Transportation Plan The MI Transportation Plan 2005–2030, “State Long-Range Plan,” identifies key goals and strategies to support the essential role of transportation in Michigan’s economy. Part of the MI Transportation Plan process was the development of a variety of technical reports, including an Aviation Technical Report. The report identifies several aviation-related segments that directly contribute to Michigan’s economic performance. Key segments included are: recreational, business, charter, and on-demand shipping. As stated in the Aviation Technical Report, “In order to support the state’s economic vitality, Michigan’s transportation system must ensure the aviation system provides seamless and complete access to key activities.” Key activities include the provision of high-value economic services, business hospitality, recreation, just-in-time inventory systems, and other supply chain activities. All key activities are directly supported by Michigan’s aviation system. In developing the MI Transportation Plan, MDOT sought extensive public involvement from stakeholders from a wide variety of organizations representing both providers and consumers of transportation services, including aviation services. MDOT met and discussed transportation issues and developed the following four statewide transportation goals, which have since been adopted by the State Transportation Commission:
1. Stewardship: Preserve transportation system investments, protect the environment, and
utilize public resources in a responsible manner (previously Environment and Aesthetics; Preservation; Land Use Coordination; Moving into 21st Century).
2. System Improvement: Modernize and enhance the transportation system to improve mobility and accessibility (previously Basic Mobility; Service Coordination; Intermodalism; Moving into 21st Century). 3. Efficient and Effective Operations: Improve the efficiency and effectiveness of the transportation system and transportation services and expand MDOT’s coordination and collaboration with partners (previously Service Coordination; Land Use Coordination; Basic Mobility; Intermodalism; Moving into 21st Century). 4. Safety and Security: Continue to improve transportation safety and ensure the security of
the transportation system.
5

In addition to the aforementioned goals, the MI Transportation Plan 2005-2030 identifies the following six key strategies to help achieve Michigan’s transportation goals: 1. Focus Improvements on Corridors of Highest Significance: In order to be an appropriate
steward of the public trust and make the most effective use of limited transportation revenue, MDOT will focus on improvement to the condition and efficient operation of multimodal corridors of highest significance to the Michigan economy.
2. Measure Performance for all modes: MDOT will set goals for highway condition and
operation safety, and set goals for condition and performance of other transportation modes, by establishing targets, measuring performance, and investing appropriately to achieve improvement.
3. Integrate the Transportation System: The public has expressed a wish for more modal
choices. Michigan must plan and invest now to ensure a greater array of well-connected transportation options.
4. Encourage Context Sensitive Solutions: MDOT will engage in dialogue with local entities
and groups to ensure that transportation projects “fit into local communities,” including consideration of community values, while making sound design choices that follow federal standards and meet or exceed regulatory requirements. Stakeholder input is a key component for good transportation decision-making.
5. Avoid, Minimize or Mitigate for Adverse Impacts: MDOT will work closely with federal,
state, and local agencies and groups, beginning in the initial stages of planning, to ensure appropriate stewardship and preservation of Michigan’s cultural and natural resources.
6. Identify Appropriate Funding: Current transportation revenue projections over the next 30
years are not sufficient to sustain good conditions of highways and bridges, or to improve operations, integration among modes, or the performance of non-highway modes. The public supports new and innovative transportation funding solutions, as necessary, but a new focus on operations and integrated transportation will help move Michigan closer to its goals regardless of the level of funding.
Michigan Airport System Plan Goals The Michigan Airport System Plan goals established in MASP 2008 continue to reflect the ongoing direction of aviation and airport service needs in Michigan. These goals are closely aligned with the above transportation goals and strategies established in MDOT’s MI Transportation Plan 2005-2030, “State Long-Range Plan.” The MASP 2008 goal statements can be divided into “system goals” and “facility goals.” System goals relate to the capability of system airports to respond to the air transportation needs of Michigan's residents, visitors, and the business community. Facility goals relate to the establishment of minimum airport development standards that adequately describe essential airport facility characteristics.
6

MASP System Goals
Serve Significant Population Centers - Provide service to significant population centers through year-round general aviation facilities. This goal directly facilitates the MI Transportation Plan goals for System Improvement and Safety and Security, and is supported by the key strategy of focusing improvements on the Corridors of Highest Significance. Serve Significant Business Centers - Support an airport system that adequately and effectively responds to the critical business aviation needs of the state. This goal also directly facilitates the MI Transportation Plan goals for System Improvement and is supported by the key strategy of focusing improvements on the Corridors of Highest Significance. Serve Significant Tourism/Convention Centers - Support an airport system that adequately and effectively responds to the significant tourism/convention aviation needs of the state. This goal also directly facilitates the MI Transportation Plan goals for System Improvement and is supported by the key strategy of focusing improvements on the Corridors of Highest Significance. Provide the General Population Access to the Aviation System - Preserve and develop the system of airports necessary to respond to basic aviation needs of the general population. This goal directly facilitates the MI Transportation Plan goal for Stewardship and is supported by the key strategy of integrating the transportation system. Provide Adequate Land Area Coverage - Preserve and develop the system of airports necessary to provide basic land area coverage. This goal directly facilitates the MI Transportation Plan goals for System Improvement, Safety and Security, and Efficient and Effective Operations, and is supported by the key strategy of integrating the transportation system. Preserve Regional Capacity - Preserve adequate airport capacity in each region of the state to assure continued, effective air transportation. This goal directly facilitates the MI Transportation Plan goals for System Improvement, Safety and Security, and Efficient and Effective Operations, and is supported by the key strategies of focusing improvements in Corridors of Highest Significance and integrating the transportation system. Serve Isolated Areas - Support aviation facilities capable of providing essential transportation services during times of the year when other transportation modes are unavailable to isolated areas. This goal directly facilitates the MI Transportation Plan goals for System Improvement, and Safety and Security, and is supported by the key strategy of integrating the transportation system.
7
MASP Facility Goals 1. Primary Runway System
Tier 1, Tier 2, and Tier 3 category airports should have a complete primary runway system, including a paved runway of appropriate length and width, and a parallel taxiway, if warranted by activity level or other standards. This goal directly facilitates the MI Transportation Plan goals for System Improvement, Safety and Security, and Efficient and Effective Operations and is supported by the key strategy of focusing improvements in Corridors of Highest Significance.
2. Pavement ConditionTier 1, Tier 2, and Tier 3 category airports should have pavement in their primary runway system in good or better condition. This goal directly facilitates the MI Transportation Plan goals for System Improvement, Safety and Security, and Efficient and Effective Operations, and is supported by the key strategy of focusing improvements in Corridors of Highest Significance.
3. Lighting and Visual Aids Tier 1, Tier 2, and Tier 3 category airports should have appropriate runway edge lighting systems and visual aids, including a rotating beacon, Precision Approach Path Indicator (PAPI) lights, Runway End Identifier Lights (REIL), a segmented circle, and lighted wind indicator.
4. Approach Protection
Tier 1, Tier 2, and Tier 3 category airports should have a current approach protection plan, approved by the Michigan Aeronautics Commission, filed with the appropriate local authorities.
5. Basic Pilot and Aircraft ServicesTier 1, Tier 2, and Tier 3 category airports’ basic services should include a 24-hour accessible shelter, a telephone, a restroom, fuel, and aircraft parking. Tier 1 and Tier 2 category airports should also include aircraft maintenance and airport staff availability. This goal facilitates the MI Transportation Plan goal for System Improvement.
6. All-Weather AccessTier 1 and Tier 2 category airports should be accessible in all types of weather conditions. Every airport should have an appropriate, published Instrument Approach Procedure, an Automated Weather Observation System (AWOS), and a weather briefing system for pilots. This goal directly facilitates the MI Transportation Plan goals for System Improvement, Safety and Security, Efficient and Effective Operations and is supported by the key strategy of integrating the transportation system.
8

7. Year-Round AccessTier 1 and Tier 2 category airports should be open throughout the year. Each airport should have timely snow removal capabilities and a primary runway that is unaffected by spring thaw conditions. This goal facilitates the MI Transportation Plan goals for system improvement and safety and security, and is supported by the key strategy of integrating the transportation system.
8. Landside Access
Tier 1 and Tier 2 category airports should have at least one mode of landside transportation service between the airport and the surrounding community, whether those services are made available by private firms or public transportation systems. This goal directly facilitates the MI Transportation Plan goals for System Improvement, Safety and Security, and Efficient and Effective Operations, and is supported by the key strategies of integrating the transportation system and focusing improvements on Corridors of Highest Significance.
9
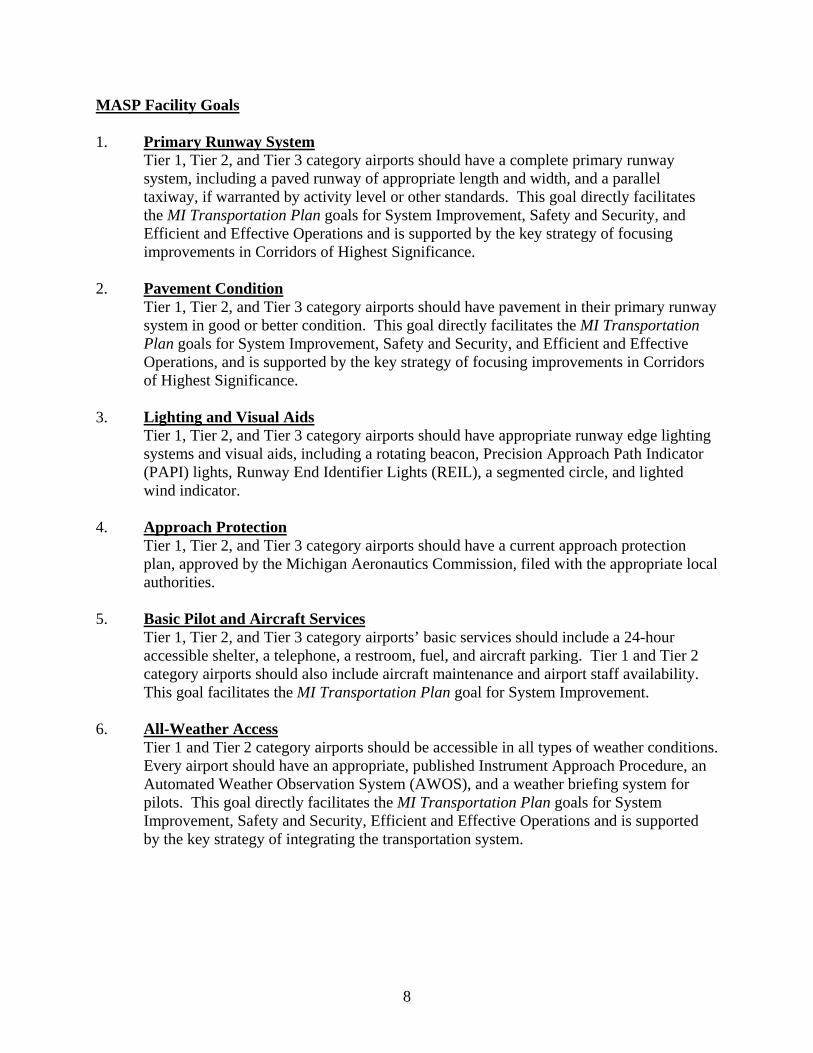
Relationship between MASP Goals and MI Transportation Plan Goals The correlation between the MI Transportation Plan goals and the goals of the Michigan Airport System Plan, System and Facility Goals, are displayed in Table 11. This link clearly shows that system preservation and service to business and tourism/convention centers should have a high emphasis throughout the plan.
Table 11 Relationship of Michigan Airport System Plan Goals to MI Transportation Plan Goals MASP Goals MI Transportation Plan
Stew
ards
hip
Syst
em
Impr
ovem
ent
Effic
ient
/Eff
ec-
tive
Ope
ratio
n Sa
fety
and
Se
curit
y
MASP System Goals Preserve Essential Regional Access H H H H Preserve Regional Capacity H H H M Serve Population Centers H H H H Serve Business & Tourism/Convention Centers
H H H M
Serve Isolated Areas H M H H MASP Facility Goals Primary Runway System H H H H Pavement Condition H H H H All Weather Access H H H H Year-Round Operation H H H M Pilot Services H H H M Lighting and Visual Aids Approach Protection
L L
M M
M M
H H
Airport Zoning H M M M Landside Access H H H M Notes: “H” indicates a high linkage between MASP and MI Transportation Plan. “M” indicates a moderate linkage between MASP and MI Transportation Plan. “L” indicates a low linkage between MASP and MI Transportation Plan.
10

1
GOAL DEVELOPMENT AND SYSTEM RECOMMENDATIONS Each of the seven MASP system goals has undergone a series of alternative analyses, resulting in a recommendation for the ultimate airport system for each goal in the year 2030. Alternative analyses consisted of establishing and testing various combinations of service standards for each goal. Included for each alternative was: 1) surface travel time; 2) minimum airport classification; and 3) service thresholds. Surface travel time combinations tested were 30 and 45 minutes. Generally, a surface travel time of 30 minutes resulted in a system that was considered appropriately responsive. Service threshold combinations were tested at 90, 95, and 100 percent. In most cases, a 90 percent service threshold left too many holes in the system; and a 100 percent threshold resulted in a system that would be overbuilt. Results of that analysis, including a summary of how well the current system is responding to future needs, are presented for each system goal in the following section of the MASP report. Serve Significant Population Centers Goal: Provide service to significant population centers through year-round general aviation facilities. Background: Population centers are defined as a minor civil division (MCD) of 5,000 or more people with a population density of 250 or more per square mile. In 2006, there were 259 population centers meeting these criteria. The 2030 forecast indicates that there will be 302 population centers meeting these criteria. Map 2 identifies the anticipated location of the population centers in 2030. Map 2 Population Centers in Michigan, 2030

2
System Standards: The population centers system standard relates to the proximity of an airport to a population center, the minimum classification of airport needed to adequately respond to population centers, and the performance target percent for population centers to be served by those airports. Table 12 summarizes the system standards for population centers.
Table 12 System Standards: Population Centers
Surface Travel Time 30 minutes Minimum Airport Classification C-II Tier 1 Performance Target 95 Percent Tier 2 Performance Target 100 Percent
As described previously, the statewide travel demand model is the analytical tool used to determine the proximity of airports to population centers. That tool was used to determine the service area coverage of all candidate airports and the number and size of population centers used by those airports. In summary, population centers in Michigan should be served within 30 minutes surface travel time by airports in the C-II classification. The airports needed to respond to 95 percent of the population centers are included in Tier 1. The airports needed to respond to 100 percent of the population centers are included in Tier 2. System Recommendation: to the extent possible, airports that were already serving population centers and had developed to the proper minimum airport classification were selected for inclusion in the population center alternative. Additional airports to be included in Tier 1 were selected based on a combination of population center size, remoteness from a previously included airport, and the number of additional population centers that would be served. The airports selected for inclusion in the preferred alternative and their 30-minute surface travel times are displayed in Map 3. Among the 32 airports, three require a reclassification to the C-II category. Those airports are:
Ionia County Airport Mt. Pleasant Municipal Airport Menominee – Marinette Twin County Airport
The other 29 airports currently meet the C-II airport classification standard. All 32 Tier 1 airports are identified in Table 13.

3
Map 3 Population Centers: Tier 1 Airport System Travel Times
4
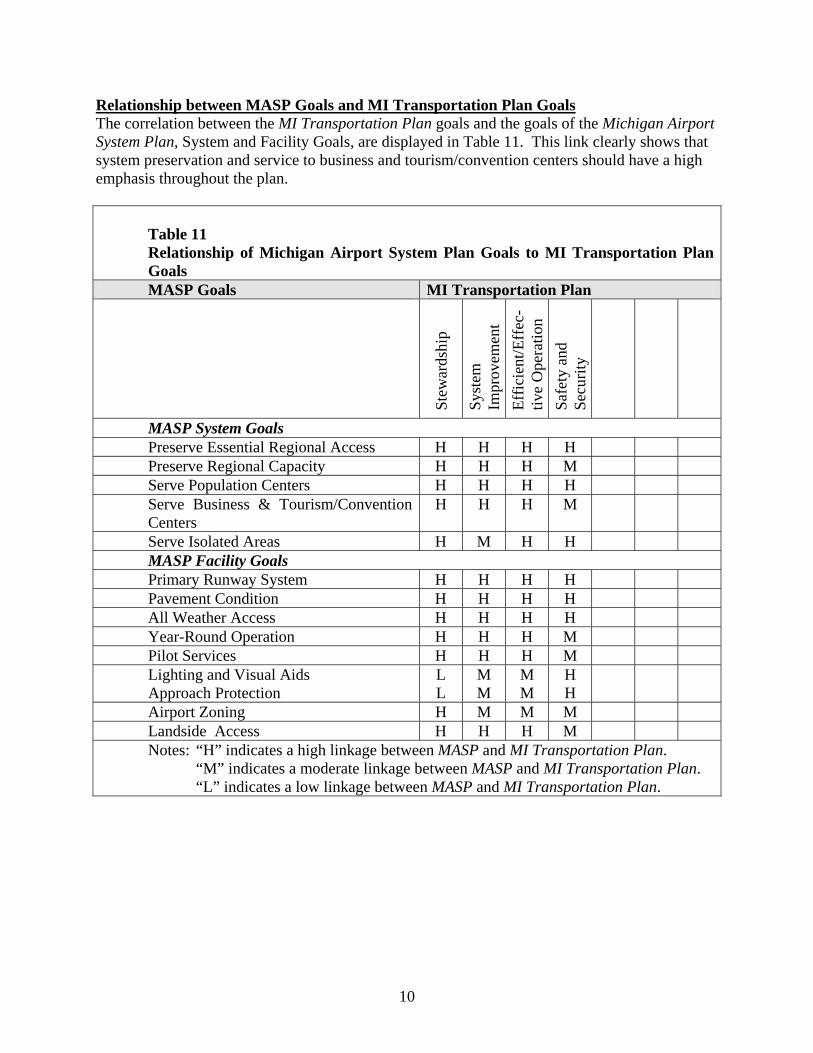
Table 13
Tier 1 Airport System: Population Centers Minimum Airport Classification Standard: C-II
City Airport Airport Reference Code
Adrian Lenawee County C-II Alpena Alpena County Regional C-VI Battle Creek W.K. Kellogg D-IV Benton Harbor Southwest Michigan Regional C-II Cadillac Wexford County C-II Detroit Detroit Coleman A. Young Municipal C-11 Detroit Detroit Metro Wayne County D-VI Detroit Willow Run D-IV Escanaba Delta County C-III Flint Bishop International D-IV Gaylord Gaylord Regional Airport C-III Grand Rapids Gerald R. Ford International D-IV Hancock Houghton County Memorial C-III Holland Tulip City D-II Howell Spencer J. Hardy-Livingston County C-II Ionia Ionia B-II Iron Mountain Ford C-III Ironwood Gogebic-Iron County C-II Jackson Jackson County-Reynolds C-II Kalamazoo Kalamazoo/Battle Creed International C-III Lansing Capital City D-IV Manistee Manistee County-Blacker C-II Marquette Sawyer D-V Menominee Menominee-Marinette Twin City B-II Mt. Pleasant Mt. Pleasant Municipal B-II Muskegon Muskegon County C-III Pellston Pellston Regional of Emmett County C-II Pontiac Oakland County International D-III Port Huron St. Clair County International C-III Saginaw M B S International D-IV Sault Ste. Marie Chippewa County International D-III Traverse City Cherry Capital C-III
The airports required to achieve 100 percent population center coverage are designated as Tier 2 and include the ten airports identified in Table 14. Nine of the ten airports do not currently meet the C-II airport classification for population centers.

5
Table 14
Tier 2 Airport System: Population Centers Minimum Airport Classification Standard: C-II
City Airport Airport Reference Code
Big Rapids Roben-Hood B-II Coldwater Branch County Memorial B-II Fremont Fremont Municipal C-II Hastings Hastings City/Barry County B-II Hillsdale Hillsdale Municipal B-II Ludington Mason County B-II Monroe Monroe Custer B-II Romeo Romeo B-II Sparta Sparta B-II Sturgis Kirsch Municipal B-II
Goal Achievement Summary: The system of airports identified in Table 15 results in the levels of performance achievement that follow:
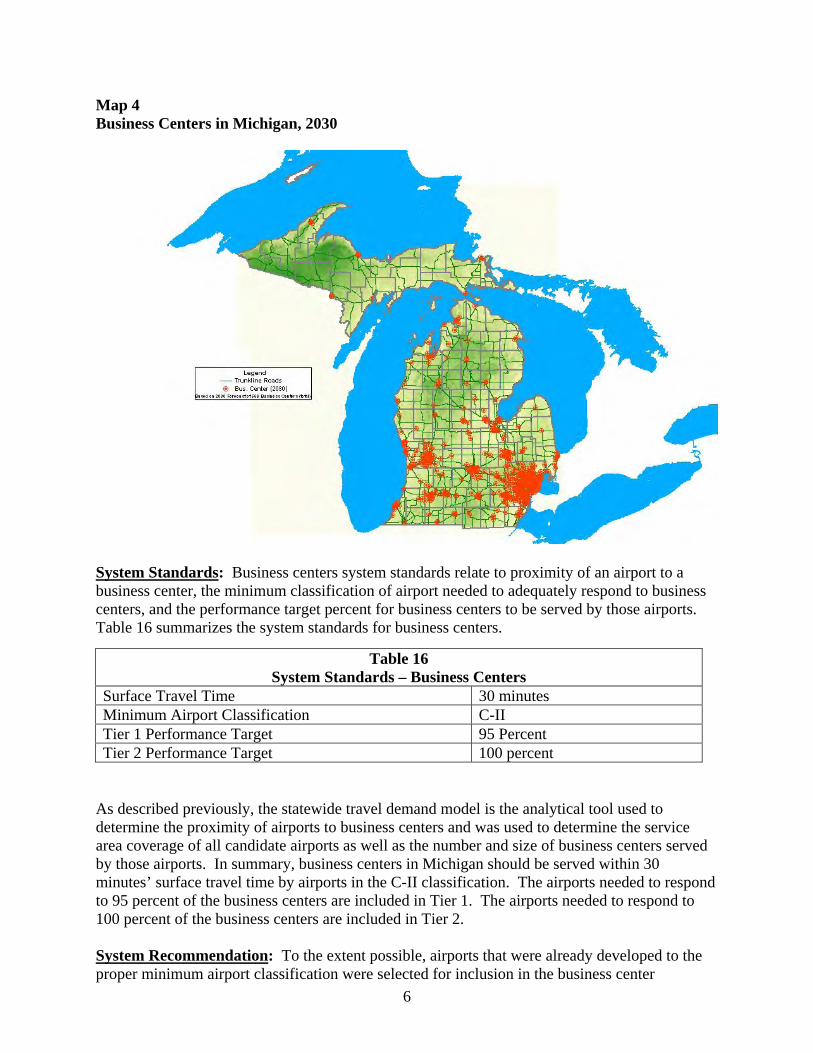
The 32 airports designated for inclusion Tier 1 nearly meet the target performance objective of 95 percent with 87 percent served. The 10 airports included in Tier 2 provide 93 percent service. Serve Significant Business Centers Goal: Support an airport system that adequately and effectively responds to the critical and essential business aviation needs of the state. Background: Business centers in Michigan, with 3,000 or more employees, are defined as Travel Analysis Zones (TAZ). There are forecasted to be 568 such zones in the year 2030, with 127 of those zones having 10,000 or more employees. These zones are concentrated in or near the state’s major metropolitan areas. A number of zones are also located in or near many Michigan communities across the state. Map 4 displays the location of business centers in Michigan.
Table 15 Goal Achievement Summary: Population Centers
Number of Tier 1 C-II Airports 32 Population Centers Served (percent) 87 Number of Tier 2 Airports 10 Population Centers Served (percent) 93
6
Map 4 Business Centers in Michigan, 2030
System Standards: Business centers system standards relate to proximity of an airport to a business center, the minimum classification of airport needed to adequately respond to business centers, and the performance target percent for business centers to be served by those airports. Table 16 summarizes the system standards for business centers.
As described previously, the statewide travel demand model is the analytical tool used to determine the proximity of airports to business centers and was used to determine the service area coverage of all candidate airports as well as the number and size of business centers served by those airports. In summary, business centers in Michigan should be served within 30 minutes’ surface travel time by airports in the C-II classification. The airports needed to respond to 95 percent of the business centers are included in Tier 1. The airports needed to respond to 100 percent of the business centers are included in Tier 2. System Recommendation: To the extent possible, airports that were already developed to the proper minimum airport classification were selected for inclusion in the business center
Table 16 System Standards – Business Centers
Surface Travel Time 30 minutes Minimum Airport Classification C-II Tier 1 Performance Target 95 Percent Tier 2 Performance Target 100 percent

7
alternative. Additional airports to be included in Tier 1 were selected based on a combination of factors: business center size; remoteness from previously included airport; and the number of additional business centers that would be served. Among the 36 airports included in Tier 1 for business centers are nine airports that would require a reclassification to the C-II category. Those airports are:
Big Rapids, Roben-Hood Airport Caro, Tuscola Area Airport Charlevoix, Charlevoix Municipal Airport Hillsdale, Hillsdale Municipal Airport Ionia, Ionia County Airport Grayling, Grayling Army Airfield Mt. Pleasant, Mt. Pleasant Municipal Airport Sturgis, Kirsch Municipal Airport West Branch, West Branch Community Airport
Map 5 Business Centers: Tier 1 Airport System Travel Times
The other 28 airports currently meet the C-II airport classification standard. All 36 Tier 1 airports are shown in Map 5 and identified in Table 17.
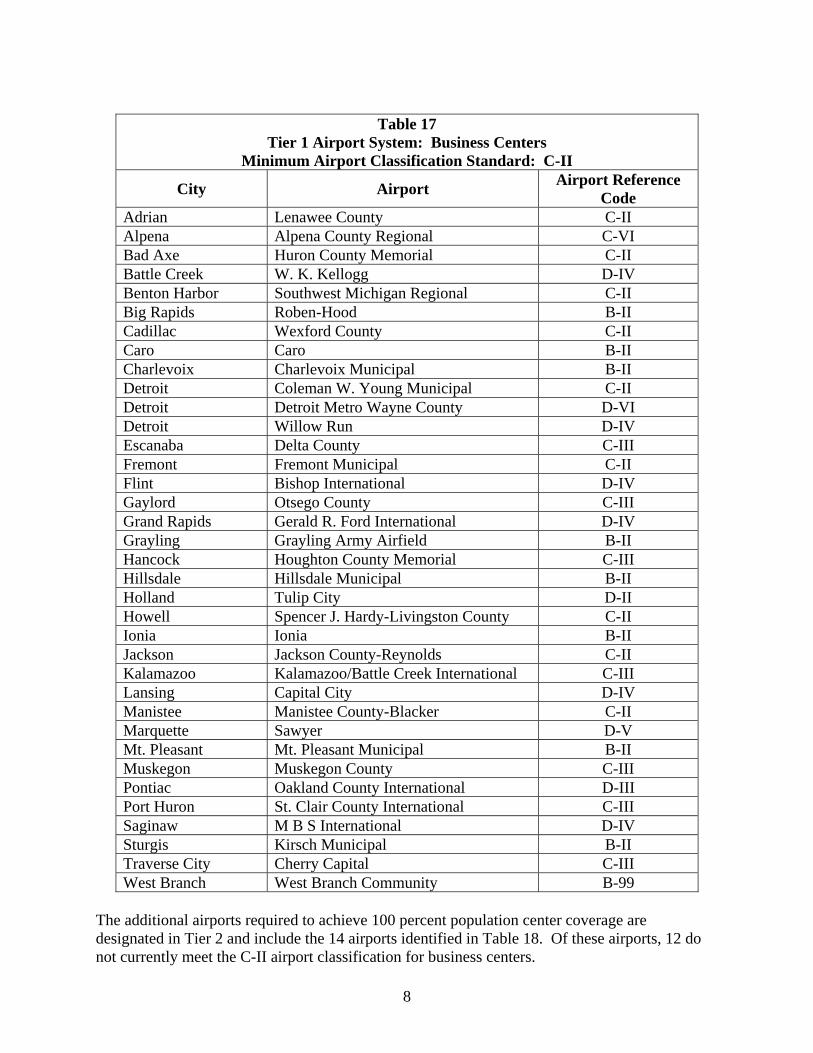
8
Table 17
Tier 1 Airport System: Business Centers Minimum Airport Classification Standard: C-II
City Airport Airport Reference Code
Adrian Lenawee County C-II Alpena Alpena County Regional C-VI Bad Axe Huron County Memorial C-II Battle Creek W. K. Kellogg D-IV Benton Harbor Southwest Michigan Regional C-II Big Rapids Roben-Hood B-II Cadillac Wexford County C-II Caro Caro B-II Charlevoix Charlevoix Municipal B-II Detroit Coleman W. Young Municipal C-II Detroit Detroit Metro Wayne County D-VI Detroit Willow Run D-IV Escanaba Delta County C-III Fremont Fremont Municipal C-II Flint Bishop International D-IV Gaylord Otsego County C-III Grand Rapids Gerald R. Ford International D-IV Grayling Grayling Army Airfield B-II Hancock Houghton County Memorial C-III Hillsdale Hillsdale Municipal B-II Holland Tulip City D-II Howell Spencer J. Hardy-Livingston County C-II Ionia Ionia B-II Jackson Jackson County-Reynolds C-II Kalamazoo Kalamazoo/Battle Creek International C-III Lansing Capital City D-IV Manistee Manistee County-Blacker C-II Marquette Sawyer D-V Mt. Pleasant Mt. Pleasant Municipal B-II Muskegon Muskegon County C-III Pontiac Oakland County International D-III Port Huron St. Clair County International C-III Saginaw M B S International D-IV Sturgis Kirsch Municipal B-II Traverse City Cherry Capital C-III West Branch West Branch Community B-99
The additional airports required to achieve 100 percent population center coverage are designated in Tier 2 and include the 14 airports identified in Table 18. Of these airports, 12 do not currently meet the C-II airport classification for business centers.

9
Table 18
Tier 2 Airport System: Business Centers Minimum Airport Classification Standard: C-II
City Airport Airport Reference Code
Ann Arbor Ann Arbor Municipal B-II Cheboygan Cheboygan City-County B-II Coldwater Branch County Memorial B-II Gladwin Gladwin Zettel Memorial B-II Hart-Shelby Oceana County B-1 Hastings Hastings City/Barry County B-II Iron Mountain Ford C-III Ironwood Gogebic-Iron County C-II Lapeer DuPont-Lapeer B-II Niles Jerry Tyler Memorial B-II Rogers City Presque Isle County/Rogers City B-II Sandusky Sandusky City A-I Sault Ste. Marie Sault Ste. Marie Muni-Sanderson B-II Sparta Sparta B-II
Goal Achievement Summary: The system of airports identified in table 19 results in the levels of performance achievement that follow:
Table 19 Goal Achievement Summary: Business Centers
Number of Tier 1 C-II Airports 36 Business Centers Served (percent) 95 Number of Tier 2 Airports 14 Business Centers Served (percent) 97
The 36 airports designated for inclusion in Tier 1 met the target performance objective of 95 percent. The 4 airports included in Tier 2 results in 97 percent of business centers being served. All of the business centers not served in Tier 1 or Tier 2 are marginally outside of the 30-minute surface travel time. No business center in the state is more than 37 minutes from an airport designated in either Tier 1 or Tier 2. Additionally, all large business centers, those with 10,000 or more employees, are served by the airports selected for inclusion in Tier 1. Serve Significant Tourism/Convention Areas Goal: Support an airport system that adequately and effectively responds to the critical and essential tourism/convention aviation needs of the state. Background: Tourism and convention areas in Michigan are identified by allocating lodging use taxes generated in each county to the travel analysis zones within each county based on TAZ

10
employment as a percent of total county employment. TAZs with $30,000 or more of annual lodging use tax generated, as reported to the Michigan Department of Treasury, are designated as tourism/convention areas. There were 523 tourism/convention areas in Michigan (for 2006 lodging tax receipts. Generally, these centers are locate din or near major urbanized areas such as Detroit, Grand Rapids and Lansing, or somewhat concentrated in the northwestern parts of the Lower Peninsula and eastern portions of the Upper Peninsula. Map 6 displays the locations of tourism/convention areas in Michigan. Map 6 Tourism/Convention Areas in Michigan
System Standards: Tourism/convention areas system standards related to proximity of an airport to a tourism/convention center, the minimum classification of airport needed to adequately respond to tourism/convention areas, and the performance target percent for tourism/convention areas to be served by those airports. Table 20 summarizes the system standards for tourism/convention areas.
Table 20 System Standards: Tourism/Convention Areas
Surface Travel Time 30 minutes Minimum Airport Classification B-II Tier 1 Performance Target 95 Percent Tier 2 Performance Target 100 Percent

11
As described previously, the statewide travel demand model is the analytical tool used to determine the proximity of airports to tourism/convention areas. This tool was used to determine the service area coverage of all candidate airports and the number and size of tourism/convention areas served by those airports. In summary, tourism/convention areas in Michigan should be served within 30 minutes surface travel time by airports in the B-II classification. The airports needed to respond to 95 percent of the tourism/convention areas are include din Tier 1. The airports needed to respond to 100 percent of the tourism/convention areas are included in Tier 2. System Recommendation: To the extent possible, airports that were already developed to the proper minimum airport classification were selected for inclusion in the tourism/convention center alternative. Additional airports to be included in tier 1 were selected based on a combination of tourism/convention center size, remoteness from a previously included airport, and the number of additional tourism/convention areas that would be served. Among the 39 airports included in Tier 1 for tourism/convention areas are two airports that would require a reclassification to the V-II category. Those airports are:
Baraga, Baraga Munising, Hanley field
The other 37 airports currently meet the B-II airport classification standard. All 39 Tier 1 airports are shown in Map 7 and identified in Table 21. Map 7 Tourism/Convention Areas: Tier 1 Airport System Travel Times

12
Table 21
Tier 1 Airport System: Tourism/Convention Areas Minimum Airport Classification Standard: B-II
City Airport Airport Reference Code
Alpena Alpena County Regional C-II Baraga Baraga A-I Beaver Island Beaver Island B-II Bellaire Antrim County C-II Big Rapids Roben-Hood B-II Cadillac Wexford County C-II Charlevoix Charlevoix Municipal B-II Detroit Coleman A. Young Municipal C-II Detroit Detroit Metro Wayne County D-VI Drummond Island Drummond Island B-II Escanaba Delta County C-III Flint Bishop International D-IV Frankfort Dow Memorial B-11 Gaylord Gaylord Regional Airport C-III Grand Rapids Gerald R. Ford International D-IV Grayling Grayling Army Airfield B-II Hancock Houghton County Memorial C-III Harbor Springs Harbor Springs Municipal B-II Holland Tulip City C-II Iron Mountain Ford C-III Ironwood Gogebic-Iron County C-II Jackson Jackson County-Reynolds C-II Kalamazoo Kalamazoo/Battle Creek International C-III Lansing Capital City D-IV Ludington Mason County B-II Mackinac Island Mackinac Island B-II Manistique Schoolcraft County C-II Marquette Sawyer D-V Mt. Pleasant Mt. Pleasant B-II Munising Hanley Field A-I Muskegon Muskegon County C-III Oscoda Oscoda-Wurtsmith D-V Pontiac Oakland County International D-III Port Huron St. Clair County International C-III Rogers City Presque Isle County/Rogers City B-II Saginaw M B S International D-IV St. Ignace Mackinac County B-II Sault Ste. Marie Chippewa County International D-III Traverse City Cherry Capital C-III

13
Those airports required to achieve 100 percent tourism/convention center coverage are designated in Tier 2 and include the nine airports identified in Table 22. Of these airports, three do not currently meet the B-II Airport Classification for tourism/convention areas.
Table 22 Tier 2 Airport System: Tourism/Convention Areas
Minimum Airport Classification Standard: B-II
City Airport Airport Reference Code
Clare Clare Municipal B-II Fremont Fremont Municipal C-II Manistee Manistee County-Blacker C-II Newberry Luce County B-II Northport Woolsey Memorial A-I Ontonagon Ontonagon County B-I Paradise Paradise B-1 Proposed South Haven South Haven Area Regional B-II Sault Ste. Marie Sault Ste. Marie Muni-Sanderson B-II
Goal Achievement Summary: The system of airports identified in Table 23 results in the levels of performance achievement that follow:
Table 23 Goal Achievement Summary: Tourism/Convention Areas
Number of Tier 1 B-II Airports 39 Tourism/Convention Areas Served (percent) 96 Number of Tier 2 Airports 9 Tourism/Convention Areas Served (percent) 99
The 39 airports designated for inclusion in Tier 1 meet the target performance objective of 95 percent. The nine airports included in Tier 2 result in 99 percent of tourism/convention areas being served. All of the tourism/convention areas not served by either Tier 1 or Tier 2 are marginally outside of the 30-minute surface travel time. No tourism/convention center in the state is more than 35 minutes from an airport designated in either Tier 1 or Tier 2. General Population Access Goal: Preserve/develop the system of airports necessary to respond to essential/critical aviation needs of the general population. Background: A basic level of air transportation service to all Michigan residents is important. System Standards: General population access system standards relate to proximity of an airport to the general population, the minimum classification of airport needed to adequately respond to general population access, and the performance target percent for general population access to be served by those airports. Table 24 summarizes the system standards for general population access.

14
Table 24
System Standards: General Population Access Surface Travel Time 45 minutes Minimum Airport Classification B-II Tier 1 Performance Target 95 Percent Tier 2 Performance Target 100 Percent
As described previously, the statewide travel demand model is the analytical tool used to determine the proximity of airports to the general population. That tool was used to determine the service area coverage of all candidate airports and the population served by those airports. In summary, general population access in Michigan is provided by 45 minutes surface travel time by airports in the B-II classification. The airports needed to respond to 95 percent of the general population access are included in Tier 1. The airports needed to respond to 100 percent of the general population access are included in Tier 2. System Recommendation: To the extent possible, airports that were already developed to the proper minimum airport classification were selected for inclusion in the general population access alternative. Additional airports to be included in Tier 1 were selected based on a combination of remoteness from a previously included airport and the amount of additional population that would be served. None of the 28 airports included in Tier 1 for general population access would require a reclassification to the B-II category. The 28 airports included in Tier 1 for general population access are shown in Map 8 and identified in Table 25. Map 8 General Population Access: tier 1 Airport System Travel Times

15
Table 25 Tier 1 Airport System: General Population Access Minimum Airport Classification Standard: B-II
City Airport Airport Reference Code
Alpena Alpena County Regional C-VI Bad Axe Huron County Memorial C-II Battle Creek W.K. Kellogg D-IV Benton Harbor Southwest Michigan Regional C-II Big Rapids Roben-Hood B-II Cadillac Wexford County C-II Coldwater Branch County Memorial B-II Detroit Detroit Metro Wayne County D-VI Escanaba Delta County C-III Flint Bishop International D-IV Gaylord Gaylord Regional C-III Grand Rapids Gerald R. Ford International D-IV Hancock Houghton County Memorial C-III Holland Tulip City D-11 Iron Mountain Ford C-III Ironwood Gogebic-Iron County C-II Jackson Jackson County-Reynolds C-II Lansing Capital City D-IV Marquette Sawyer D-V Muskegon Muskegon County C-III Oscoda Oscoda-Wurtsmith D-V Pellston Pellston Regional of Emmet County C-II Pontiac Oakland County International D-III Port Huron St. Clair County International C-III Saginaw M B S International D-IV Sault Ste. Marie Chippewa County International D-III Traverse City Cherry Capital C-III West Branch West Branch Community B-II
Those airports required to achieve 100 percent general population coverage are designated as Tier 2 and include the four airports identified in Table 26. All of these airports currently meet the B-II airport classification for service to the general population.
Table 26
Tier 2 Airport System: General Population Access Minimum Airport Classification Standard: B-II
City Airport Airport Reference Code
Manistee Manistee County-Blacker C-II Manistique Schoolcraft County C-II

16
Marlette Marlette Township B-II Mt. Pleasant Mt. Pleasant Municipal B-11
Goal Achievement Summary: The system of airports identified in Table 27 results in the following level of performance achievement:
Table 27 Goal Achievement Summary: General Population Areas
Number of Tier 1 B-II Airports 28 General Population Served (percent) 96 Number of Tier 2 Airports 4 General Population Served (percent) 99
The 28 airports designated for inclusion in Tier 1 meet the target performance objective of 95 percent. The four airports included in Table 27 result in a 99 percent service coverage rate of the state’s population. By extending the service area coverage to 60 minutes rather than 45 minutes, virtually all Michigan residents would have access to an airport include din either Tier 1 or Tier 2. Land Area Coverage Goal: Preserve and develop the system of airports necessary to provide basic land area coverage. Background: General aviation pilots operating their aircraft in Michigan should have access to an airport with a paved runway within 30 minutes in the event of a pilot or passenger emergency or an aircraft malfunction. These airports provide a network of facilities that are reachable in many emergency situations. Airports in adjacent states located near Michigan borders were included in determining land area coverage percentages. System Standards: Unlike many of the previous system standards where surface travel time is a key variable, with land area coverage the system standards relates uses a 30 mile radius as a key variable. As with the other system goals, the target for goal achievement is 95 percent of land area coverage in Tier 1 and 100 percent in Tier 2.
Table 28 System Standards: Land Area Coverage
Surface Travel Time 30 miles Minimum Airport Classification B-I Tier 1 Performance Target 95 Percent Tier 2 Performance Target 100 Percent
System Recommendation: To the extent possible, airports that were already developed to the proper minimum airport classification were selected for inclusion in the land area coverage alternative. Additional airports to be included in tier 1 were selected on a combination of remoteness from a previously included airport. Among the 50 airports included in Tier 1 for land area coverage are three airports that would require a reclassification to the B-I category. Those airports are:

17
Baraga, Baraga Mio, Oscoda County Munising, Hanley Field
The other 48 airports currently meet the B-I airport classification standard. All 50 Tier 1 airports are shown in Map 9 and are identified in Table 29. Map 9 Land Area Coverage: Tier 1 Airport System Travel Times

18
Table 29
Tier 1 Airport System: Land Area Coverage Minimum Airport Classification Standard: B-I
City Airport Airport Reference Code Adrian Lenawee County C-II Alpena Alpena County Regional C-VI Bad Axe Huron County Memorial C-II Baraga Baraga A-I Battle Creek W.K. Kellogg D-IV Benton Harbor Southwest Michigan Regional C-II Big Rapids Roben-Hood B-II Cadillac Wexford County C-II Charlevoix Charlevoix Municipal B-II Coldwater Branch County Memorial B-II Detroit Coleman A. Young Municipal C-II Detroit Detroit Metro Wayne County D-VI Detroit Willow Run D-IV Drummond Island Drummond Island B-II Escanaba Delta County C-III Flint Bishop International D-IV Gaylord Otsego County C-III Grand Rapids Gerald R. Ford International D-IV Hancock Houghton County Memorial C-III Holland Tulip City D-II Houghton Lake Roscommon County-Blodgett Memorial B-II Howell Spencer J. Hardy-Livingston County C-II Ionia Ionia B-II Iron Mountain Ford C-III Iron River Stambaugh B-I Ironwood Gogebic-Iron County C-II Jackson Jackson County-Reynolds C-II Kalamazoo Kalamazoo/Battle Creek International C-III Lansing Capital City D-IV Ludington Mason County B-II Manistee Manistee County-Blacker C-II Manistique Schoolcraft County C-II Marlette Marlette Township B-II Marquette Sawyer D-V Menominee Menominee-Marinette Twin City B-II Mio Oscoda County A-I Mt. Pleasant Mt. Pleasant Municipal B-II Munising Hanley Field A-I Muskegon Muskegon County C-III Newberry Luce County B-11 Ontonagon Ontonagon County B-1 Oscoda Oscoda-Wurtsmith D-V Pellston Pellston Regional of Emmett County C-II Pontiac Oakland County International D-III Port Huron St. Clair County International C-III Rogers City Presque Isle County/Rogers City B-II Saginaw M B S International D-IV Sault Ste. Marie Chippewa County International D-III Traverse City Cherry Capital C-III West Branch West Branch Community B-II

19
Goal Achievement Summary: The system of airports identified in Table 29 results in the levels of performance achievement that follow:
Table 29 Goal Achievement Summary: Land Area Coverage
Number of Tier 1 B-I Airports 50 Land Area Covered (percent) 98 Number of Tier 2 Airports 0 Land Area Covered (percent) 98
The 50 airports designated for inclusion in Tier 1 meet the target performance objective of 95 percent. No additional airports are included in Tier 2 since the practical maximum coverage has been attained by those airports in selected in Tier 1. By expanding the service area coverage to 40 miles rather than 30 miles, virtually all Michigan land areas would have an airport with a paved runway within the coverage areas. Preserve Regional Capacity Goal: Preserve adequate airport capacity in each region of the state to assure continued defective air transportation. Background: There are 235 public use airports currently in operation throughout Michigan. At any given time several of these facilities are under pressure from local officials and/or developers to close and be converted to an alternate use. These pressures are most often exerted on small general aviation airports operating in or adjacent to their service communities. This is a particular concern for airports operating in southeast Michigan where additional airport closures would threaten overall regional capacity. From a regional capacity perspective, a public-use airport is needed when:
The airport is the only public-use facility serving the area and should be preserved because of the access it provides to the community and access it provides the community to outside services.
The airport is in an area where regional aircraft capacity is stressed and the facility needs to be preserved to assure continued regional capacity.
The airport functions as a reliever to a larger airport by allowing lower performance aircraft to utilize the smaller airport rather than the larger airport and the number of operations by high performance aircraft would be inhibited by the smaller aircraft. At busy airports, a mix of slower and faster aircraft adversely affects airport operational capacity. Preservation of a smaller airport would benefit both ty0es of aircraft operations.
In southeast Michigan, regional demand currently threatens regional capacity. Recent airport closures and the prospect of additional airport closures continue to put stress on regional aviation capacity.

20
Sixty-one of the airports included in tier 1 for regional capacity are currently at the B-I classification or higher. Three airports included in Tier 1 for regional capacity are A-I. Those airports are:
Plymouth, Canton-Plymouth-Mettetal Ray, Ray Community Tecumseh, Meyers-Diver’s
All 64 airports are identified in Map 10 listed in Table 31. Map 10 Regional Capacity: Tier 1 Airport system Travel Times

21
Table 31
Tier 1 Airport System: Regional Capacity Minimum Airport Classification Standard: B-I
City Airport Airport Reference Code Adrian Lenawee County C-II Allegan Padgham Field B-II Alma Gratiot Community C-II Alpena Alpena County Regional C-VI Ann Arbor Ann Arbor Municipal B-II Bad Axe Huron County Memorial C-II Battle Creek W.K. Kellogg D-IV Bay City James Clements B-II Bellaire Antrim County B-II Benton Harbor Southwest Michigan Regional C-II Big Rapids Roben-Hood B-II Cadillac Wexford County C-II Charlevoix Charlevoix Municipal B-II Charlotte Fitch H. Beach Municipal B-II Coldwater Branch County Memorial B-II Detroit Detroit City C-II Detroit Grosse Ile Municipal B-II Detroit Detroit Metro Wayne County D-VI Detroit Willow Run D-IV Escanaba Delta County C-III Flint Bishop International D-IV Fremont Fremont Municipal C-II Gaylord Otsego County C-III Grand Haven Memorial Airpark B-II Grand Ledge Abrams Municipal B-II Grand Rapids Gerald R. Ford International D-IV Hancock Houghton County Memorial C-III Hillsdale Hillsdale Municipal B-II Holland Tulip City D-II Houghton Lake Roscommon County-Blodgett Memorial B-II Howell Spencer J. Hardy-Livingston County C-II Ionia Ionia B-II Iron Mountain Ford C-III Jackson Jackson County-Reynolds C-II Kalamazoo Kalamazoo/Battle Creek International C-III Lambertville Toledo Suburban B-I Lansing Capital City D-IV Linden Price’s B-II Ludington Mason County B-II Manistee Manistee County-Blacker C-II Marine City Marine City B-I Marlette Marlette B-II Marquette Sawyer D-V Mason Mason Jewett Field B-II Midland Jack Barstow B-II
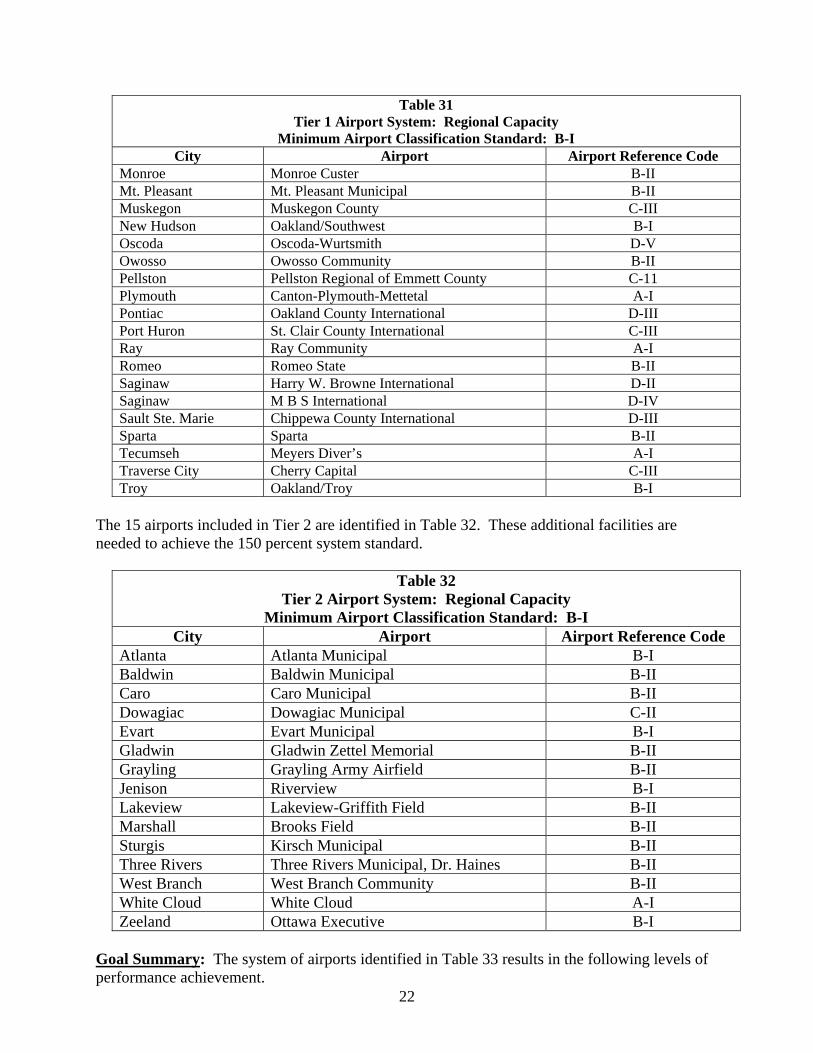
22
Table 31 Tier 1 Airport System: Regional Capacity
Minimum Airport Classification Standard: B-I City Airport Airport Reference Code
Monroe Monroe Custer B-II Mt. Pleasant Mt. Pleasant Municipal B-II Muskegon Muskegon County C-III New Hudson Oakland/Southwest B-I Oscoda Oscoda-Wurtsmith D-V Owosso Owosso Community B-II Pellston Pellston Regional of Emmett County C-11 Plymouth Canton-Plymouth-Mettetal A-I Pontiac Oakland County International D-III Port Huron St. Clair County International C-III Ray Ray Community A-I Romeo Romeo State B-II Saginaw Harry W. Browne International D-II Saginaw M B S International D-IV Sault Ste. Marie Chippewa County International D-III Sparta Sparta B-II Tecumseh Meyers Diver’s A-I Traverse City Cherry Capital C-III Troy Oakland/Troy B-I
The 15 airports included in Tier 2 are identified in Table 32. These additional facilities are needed to achieve the 150 percent system standard.
Table 32 Tier 2 Airport System: Regional Capacity
Minimum Airport Classification Standard: B-I City Airport Airport Reference Code
Atlanta Atlanta Municipal B-I Baldwin Baldwin Municipal B-II Caro Caro Municipal B-II Dowagiac Dowagiac Municipal C-II Evart Evart Municipal B-I Gladwin Gladwin Zettel Memorial B-II Grayling Grayling Army Airfield B-II Jenison Riverview B-I Lakeview Lakeview-Griffith Field B-II Marshall Brooks Field B-II Sturgis Kirsch Municipal B-II Three Rivers Three Rivers Municipal, Dr. Haines B-II West Branch West Branch Community B-II White Cloud White Cloud A-I Zeeland Ottawa Executive B-I
Goal Summary: The system of airports identified in Table 33 results in the following levels of performance achievement.

23
Table 33 Goal Achievement Summary: Regional Capacity
Number of Tier 1 B-I Airports 64 MDOT Regions Served (percent) 100 Number of Tier 2 Airports 15 MDOT Regions Served (percent) 100 For planning purposes, MDOT has divided the state into seven geographical regions: Bay, Grand, Metro, North, Southwest, Superior, and University. The 64 airports designated for inclusion in Tier 1 result in each of the seven MDOT regions meeting the target of 125 percent of based aircraft demand. The 15 additional airports included in Tier 2 result in each of the regions meeting the target of 150 percent of based aircraft demand. Serve Isolated Areas Goal: Support airports capable of providing essential transportation services during those times of the year when other transportation modes are unavailable to seasonally isolated areas. Background: In 1996, the State Transportation Commission and the Michigan Aeronautics Commission adopted an Island Transportation Policy. This policy indicated that year-round air access between the mainland and each of the populated Great Lakes Island that were seasonally isolated due to weather conditions was important. Seven islands meet the criteria: Beaver, Bois Blanc, Drummond, Harsens, Mackinac, Neebish, and Sugar islands. System Standards: A year-round airport with a paved primary runway is the preferred facility to provide the necessary all-weather link to the mainland. Recognizing that not all islands are capable of developing an appropriate airport facility, in some instances a helipad can be developed to provide the necessary mainland link.
Table 34 System Standards: Isolated Areas
Surface Travel Time On the Island Minimum Airport Classification B-I or Heliport Tier 1 Performance Target 100 Percent System Recommendation: Four of the seven island currently have an appropriate airport facility: Beaver, Bois Blanc, Drummond, and Mackinac islands. Three islands do not have a public-use airport: Neebish, Sugar, and Harsens.
Table 35 Tier 1 Airport System: Isolated Area
Minimum Airport Classification Standard: B-I or Heliport Island Airport Airport Reference Code
Beaver Beaver Island B-II Bois Blanc Boise Blanc Island B-I Drummond Drummond Island B-II Harsens Harsens Island B-I proposed

24
Mackinac Mackinac Island B-II Neebish New Heliport Sugar New Heliport
Goal Achievement Summary The system of airports identified in table 36 results in the levels of performance achievement that follow:
Table 35 Goal Achievement Summary: Isolated Areas
Number of Tier 1 B-I Airports or Helipads 7 Islands Served (percent) 100
The five airports and two helipads designated for inclusion in Tier 1 result in each of the seven seasonally isolated, populated islands being served. Goal Achievement Summary Table 37 provides a summary of how the recommended system responds to each of the seven MASP system goals. In each case the recommended system meets or exceeds the target goal for Tier 1 airports. The Tier 1 target for each of the first five system goals is 95 percent. For Regional Capacity and Isolated Areas, the target is 100 percent. Although the Tier 2 target of 100 percent is reached for just two of the system goals, the system identified represents a reasonable and practical optimal system in Michigan. Generally, in those instances where the T 2 goal is not met, the areas not served are marginally outside of the service area. In some cases it is far more prudent to accept a deficiency than attempt to improve and airport with severe site limitations or build a new airport in a physically constrained location.
Table 37 Goal Achievement Summary
Tier 1 Tier 2 Goal Airports Percent Served Airports Percent ServedPopulation Centers 32 87 10 93 Business Centers 36 95 14 97 Tourism/Convention Areas 39 96 9 99 General Population Access 28 96 4 99 Land Area Coverage 50 99 0 99 Regional Capacity 64 100 15 100 Isolated Areas 7 100 0 100 System Recommendation Summary All of the airports designated in Tier 1 for each goal should be developed to their full and appropriate classification. In many cases this means development efforts will focus on completing requirements for an airport’s current classification. In a limited number of cases, system recommendations indicate that an airport should be reclassified to a higher class. Airport development efforts will focus on meeting the requirements for the higher classification. The nine Tier 1 airports recommended for reclassification to a higher class are identified in Table 38.

25
Reclassifications to the C-II category are indicated for five of these airports based on population center and/or business center goals. Reclassifications to the B-II category are recommended for two of these airports based on tourism center and/or population access goals. The three remaining reclassifications are based on the “serve isolated islands” goal and call for either a reclassification to the B-I category or development of a new helipad.
Table 38 System Reclassification Summary
City Airport Airport Reference Code Future Class
Baraga Baraga A-I B-II Big Rapids Roben-Hood B-II C-II Charlevoix Charlevoix Municipal B-II C-II Harsens Island Harsens Island -- B-I Hillsdale Hillsdale Municipal B-II C-II Ionia Ionia A-I B-II Neebish Island New -- Heliport Sugar Island New -- Heliport
Map 11 Composite Map
Composite Alternative The following section identifies the airports that are designated for inclusion in Tier 1, Tier 2 or Tier 3.
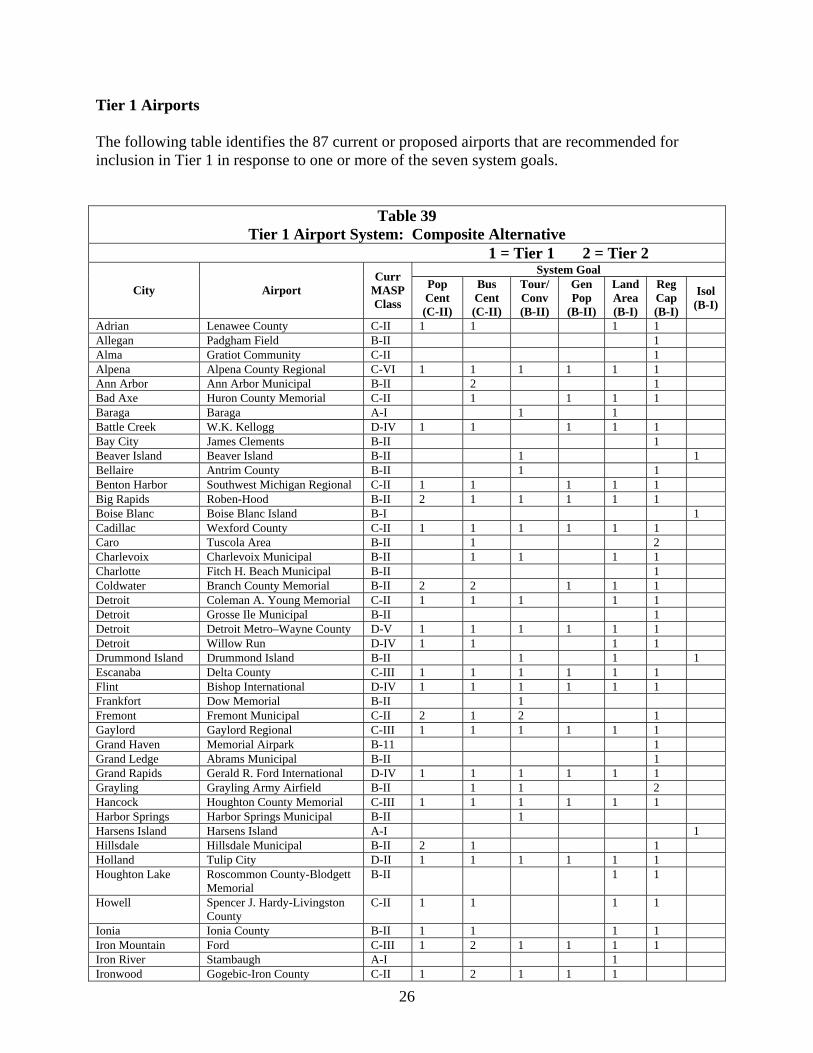
26
Tier 1 Airports The following table identifies the 87 current or proposed airports that are recommended for inclusion in Tier 1 in response to one or more of the seven system goals.
Table 39 Tier 1 Airport System: Composite Alternative
1 = Tier 1 2 = Tier 2 System Goal
City Airport Curr
MASP Class
Pop Cent (C-II)
Bus Cent (C-II)
Tour/ Conv (B-II)
Gen Pop
(B-II)
Land Area (B-I)
Reg Cap (B-I)
Isol (B-I)
Adrian Lenawee County C-II 1 1 1 1 Allegan Padgham Field B-II 1 Alma Gratiot Community C-II 1 Alpena Alpena County Regional C-VI 1 1 1 1 1 1 Ann Arbor Ann Arbor Municipal B-II 2 1 Bad Axe Huron County Memorial C-II 1 1 1 1 Baraga Baraga A-I 1 1 Battle Creek W.K. Kellogg D-IV 1 1 1 1 1 Bay City James Clements B-II 1 Beaver Island Beaver Island B-II 1 1 Bellaire Antrim County B-II 1 1 Benton Harbor Southwest Michigan Regional C-II 1 1 1 1 1 Big Rapids Roben-Hood B-II 2 1 1 1 1 1 Boise Blanc Boise Blanc Island B-I 1 Cadillac Wexford County C-II 1 1 1 1 1 1 Caro Tuscola Area B-II 1 2 Charlevoix Charlevoix Municipal B-II 1 1 1 1 Charlotte Fitch H. Beach Municipal B-II 1 Coldwater Branch County Memorial B-II 2 2 1 1 1 Detroit Coleman A. Young Memorial C-II 1 1 1 1 1 Detroit Grosse Ile Municipal B-II 1 Detroit Detroit Metro–Wayne County D-V 1 1 1 1 1 1 Detroit Willow Run D-IV 1 1 1 1 Drummond Island Drummond Island B-II 1 1 1 Escanaba Delta County C-III 1 1 1 1 1 1 Flint Bishop International D-IV 1 1 1 1 1 1 Frankfort Dow Memorial B-II 1 Fremont Fremont Municipal C-II 2 1 2 1 Gaylord Gaylord Regional C-III 1 1 1 1 1 1 Grand Haven Memorial Airpark B-11 1 Grand Ledge Abrams Municipal B-II 1 Grand Rapids Gerald R. Ford International D-IV 1 1 1 1 1 1 Grayling Grayling Army Airfield B-II 1 1 2 Hancock Houghton County Memorial C-III 1 1 1 1 1 1 Harbor Springs Harbor Springs Municipal B-II 1 Harsens Island Harsens Island A-I 1 Hillsdale Hillsdale Municipal B-II 2 1 1 Holland Tulip City D-II 1 1 1 1 1 1 Houghton Lake Roscommon County-Blodgett
Memorial B-II 1 1
Howell Spencer J. Hardy-Livingston County
C-II 1 1 1 1
Ionia Ionia County B-II 1 1 1 1 Iron Mountain Ford C-III 1 2 1 1 1 1 Iron River Stambaugh A-I 1 Ironwood Gogebic-Iron County C-II 1 2 1 1 1

27
Table 39 Tier 1 Airport System: Composite Alternative
1 = Tier 1 2 = Tier 2 System Goal
City Airport Curr
MASP Class
Pop Cent (C-II)
Bus Cent (C-II)
Tour/ Conv (B-II)
Gen Pop
(B-II)
Land Area (B-I)
Reg Cap (B-I)
Isol (B-I)
Jackson Jackson County-Reynolds C-II 1 1 1 1 1 1 Kalamazoo Kalamazoo/Battle Creek
International C-III 1 1 1 1 1
Lambertville Toledo Suburban B-I 1 Lansing Capital City D-IV 1 1 1 1 1 1 Linden Price’s B-II 1 Ludington Mason County B-II 2 1 1 1 Mackinac Island Mackinac Island B-II 1 1 Manistee Manistee County-Blacker C-II 1 1 2 2 1 1 Manistique Schoolcraft County C-II 1 2 1 Maine City Marine City B-I 1 Marlette Marlette Township B-II 2 1 1 Marquette Sawyer D-V 1 1 1 1 1 1 Mason Mason Jewett Field B-II 1 Menominee Twin County B-II 1 1 Midland Jack Barstow B-II 1 Mio Oscoda County A-I 1 Monroe Monroe Custer B-II 2 1 Mt. Pleasant Mt. Pleasant Municipal B-II 1 1 1 2 1 1 Munising Hanley Field A-I 1 1 Muskegon Muskegon County C-III 1 1 1 1 1 1 Neebish Island New NA 1 New Hudson New Hudson B-I 1 Newberry Luce County B-II 2 1 Ontonagon Ontonagon Co. Shuster Field B-I 2 1 Oscoda Oscoda-Wurtsmith D-V 1 1 1 1 Owosso Owosso Community B-II 1 Pellston Pellston Regional C-II 1 1 1 1 Plymouth Canton-Plymouth-Mettetal A-I 1 Pontiac Oakland County International D-III 1 1 1 1 1 1 Port Huron St. Clair County International C-III 1 1 1 1 1 1 Ray Ray Community A-! 1 Rogers City Presque Isle County B-II 2 1 1 Romeo Romeo B-II 2 1 Saginaw Harry W. Browne D-II 1 Saginaw M B S International D-IV 1 1 1 1 1 1 St. Ignace Mackinac County B-II 1 Sault Ste. Marie Chippewa County
International D-III 1 1 1 1 1
Sparta Sparta B-II 2 2 1 Sturgis Kirsch Municipal B-II 2 1 2 Sugar Island Sugar Island NA 1 Tecumseh Meyers-Diver’s A-I 1 Traverse City Cherry Capital C-III 1 1 1 1 1 1 Troy Oakland/Troy B-I 1 West Branch West Branch Community B-II 1 1 1 2 Tier 2 Airports The following table identifies the 24 airports that are recommended for inclusion in Tier 2. None of these airports was identified for inclusion in Tier 1 for any of the seven system goals.

28
Table 40 Tier 2 Airport System: Composite Alternative
2 = Tier 2 System Goal
City Airport Curr
MASP Class
Pop Cent (C-II)
Bus Cent (C-II)
Tour/ Conv (B-II)
Gen Pop
(B-II)
Land Area (B-I)
Reg Cap (B-I)
Isol (B-I)
Atlanta Atlanta Municipal B-I 2 Baldwin Baldwin Municipal B-II 2 Cheboygan Cheboygan County B-II 2 Clare Clare Municipal B-II 2 Dowagiac Dowagiac B-II 2 East Tawas Iosco County B-II 2 Evart Evart Municipal B-I 2 Gladwin Gladwin Zettel Memorial B-II 2 2 Greenville Greenville Municipal B-II 2 Hart-Shelby Oceana County B-1 2 Hastings Hastings City/Barry County B-II 2 2 Jenison Riverview B-I 2 Lakeview Lakeview-Griffith B-II 2 Lapeer Dupont-Lapeer B-II 2 Marshall Brooks Field B-II 2 Niles Jerry Tyler Memorial B-II 2 Northport Woolsey Memorial A-I 2 Paradise New NA 2 Sandusky Sandusky City A-I 2 Sault Ste. Marie Sault Ste. Marie Muni-
Sanderson B-II 2 2
South Haven South Haven Area Regional B-II 2 Three Rivers Three Rivers Municipal, Dr.
Haines B-II 2
White Cloud White Cloud A-I 2 Tier 3 Airport The remaining 133 public-use airports are all designated for inclusion in Tier 3. Almost all of these airports are either privately owned and/or have turf primary runways. Activity Centers** Overview: The use of Activity Centers within the MASP allows a direct link to the MI Transportation Plan (MTP). MTP identifies a total of 50 activity centers within Michigan (see Table 44). The activity center approach is focused on identifying places, from the perspective of the State of Michigan, where population, employment, tourism, transportation, and other economically important activities are concentrated. The approach begins with the premise that the Michigan transportation system, including roads, transit, non-motorized facilities, aviation, marine, and inter-modal facilities, exists to serve as the connecting linkages between these centers of economic activity. MDOT developed a process to connect these activity centers. The grouping of activity centers was accomplished by identifying concentrations of activity within the state and then connecting these centers via various modes. The resulting connections were then labeled as MDOT State Long-Range Transportation Plan corridors and International Borders Report corridors and

29
defined as either a Corridor of Highest Significance or Regionally or Locally Significant Corridors. **Note: A detailed explanation of activity center development and an overall introduction to the MTP can be found on line at http://www.michigan.gov/slrp. Proceed to the complete Corridors and International Borders Report for more detail on specific activity centers. Activity Center Defined: Geographic locations with concentrations of people, jobs, educational and health service facilities, tourist attractions, or other similar economically based facilities or services. Within the State of Michigan, there are 50 defined activity centers (see Map 12). Consult Appendix XX for a complete list of activity center criteria. System Standards: Activity center system standards relate to proximity of an airport to an activity center, the minimum classification of airport needed to adequately respond to activity centers and the performance target percent for activity centers to be served by those airports. Table 43 summarizes the system standards for activity centers. Map 12 Activity Centers
Table 43 System Standards: Activity Centers
Surface Travel Time 30 minutes Minimum Airport Classification B-II Tier 1 Performance Target 95 percent Tier 2 Performance Target 100 percent
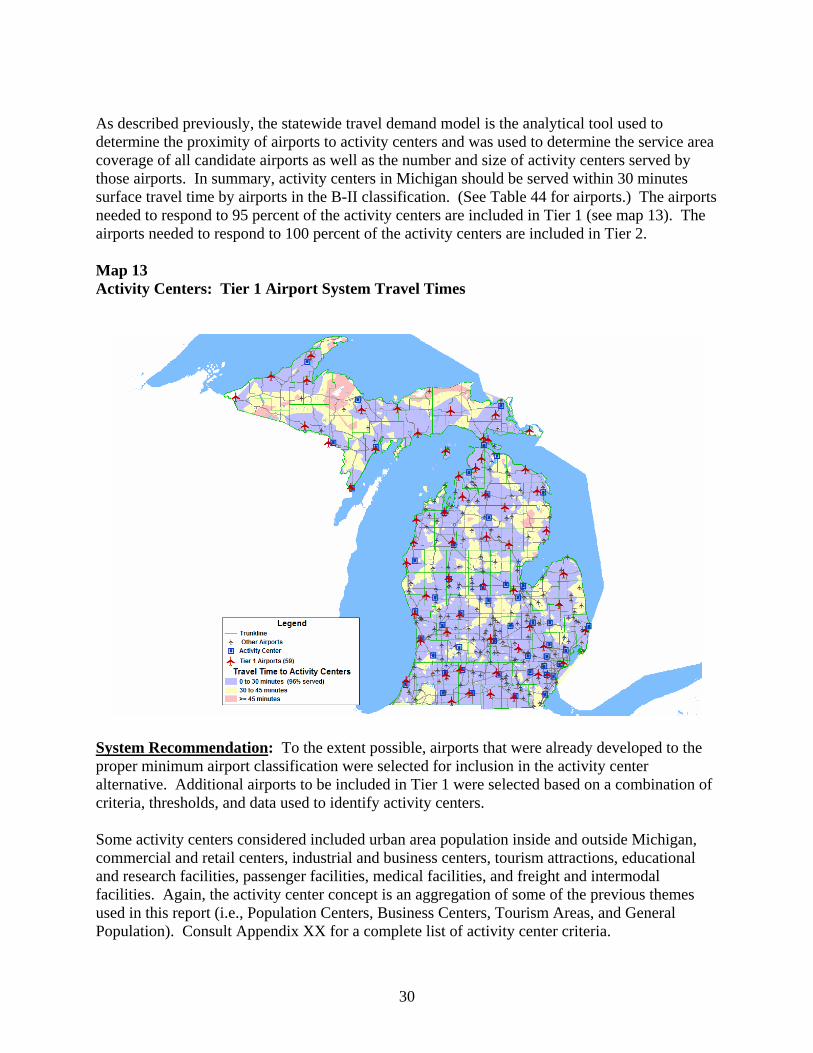
30
As described previously, the statewide travel demand model is the analytical tool used to determine the proximity of airports to activity centers and was used to determine the service area coverage of all candidate airports as well as the number and size of activity centers served by those airports. In summary, activity centers in Michigan should be served within 30 minutes surface travel time by airports in the B-II classification. (See Table 44 for airports.) The airports needed to respond to 95 percent of the activity centers are included in Tier 1 (see map 13). The airports needed to respond to 100 percent of the activity centers are included in Tier 2. Map 13 Activity Centers: Tier 1 Airport System Travel Times
System Recommendation: To the extent possible, airports that were already developed to the proper minimum airport classification were selected for inclusion in the activity center alternative. Additional airports to be included in Tier 1 were selected based on a combination of criteria, thresholds, and data used to identify activity centers. Some activity centers considered included urban area population inside and outside Michigan, commercial and retail centers, industrial and business centers, tourism attractions, educational and research facilities, passenger facilities, medical facilities, and freight and intermodal facilities. Again, the activity center concept is an aggregation of some of the previous themes used in this report (i.e., Population Centers, Business Centers, Tourism Areas, and General Population). Consult Appendix XX for a complete list of activity center criteria.

31
Table 44 Tier 1 Airport System: Activity Centers
City Facility Name Class Adrian Lenawee County B-11 Alpena Alpena County Regional D-III Bad Axe Huron County Memorial B-II Baraga Baraga A-I Battle Creek W.K. Kellogg D-III Beaver Island Beaver Island B-I Bellaire Antrim County C-II Benton Harbor Southwest Michigan Regional C-III Big Rapids Roben-Hood B-II Cadillac Wexford County C-II Charlevoix Charlevoix Municipal B-II Coldwater Branch County Memorial B-II Detroit Detroit Metropolitan Wayne County D-III Detroit Coleman A. Young Municipal C-III Detroit Willow Run D-III Drummond Island Drummond Island B-II Escanaba Delta County D-III Flint Bishop International D-III Frankford Dow Memorial B-II Fremont Fremont Municipal C-II Gaylord Otsego County C-III Grand Rapids Gerald R. Ford International D-III Greenville Greenville Municipal B-II Gwinn Sawyer D-III Hancock Houghton County Memorial D-III Harbor Springs Harbor Springs Municipal B-II Hillsdale Hillsdale Municipal B-II Holland Tulip City C-III Houghton Lake Roscommon County B-II Howell Livingston County B-II Iron Mountain Ford D-III Ironwood Gogebic County D-III Jackson Jackson County-Reynolds C-III Kalamazoo Kalamazoo/Battle Creek International D-III Lansing Capital City D-III Lewiston Garland B-II Ludington Mason County B-II Mackinac Island Mackinac Island B-II Manistee Manistee County-Blacker C-II Manistique Schoolcraft County C-II Marlette Marlette Township B-II

32
Table 44 Tier 1 Airport System: Activity Centers
City Facility Name Class Menominee Menominee-Marinette Twin County C-III Mt. Pleasant Mt. Pleasant Municipal C-II Munising Hanley Field A-I Muskegon Muskegon County D-III Newberry Luce County B-II Ontonagon Ontonagon County B-II Oscoda Oscoda-Wurtsmith D-III Pellston Pellston Regional of Emmet County D-III Pontiac Oakland County International D-III Port Huron St. Clair County International C-II Rogers City Presque Isle County B-I Saginaw M B S International D-III Sault Ste. Marie Chippewa County International D-III St. Ignace Mackinac County B-II Stambaugh Stambaugh B-I Sturgis Kirsch Municipal C-II Traverse City Cherry Capital D-III West Branch West Branch Community C-II

AIRPORT DEVELOPMENT STANDARDS Airport development standards must be identified in order to compare existing airport facilities to standard development templates. This enables the MASP 2008 to identify airport development items necessary to respond to system deficiencies. Various airport development items were evaluated for consideration as basic standards to Michigan’s public-use airports. The items that were selected were determined to be from eight specific areas of airport development: Primary Runway System Pavement Condition Lighting and Visual Aids Approach Protection Basic Pilot and Aircraft Services All-Weather Access Year-Round Access Landside Access
In Chapter 3, “System Description,” six Approach Category/Design Group combinations are presented. The MASP 2008 outlines a set of basic developmental standards that are considered to be applicable to each of the six airport classifications. The basic standards that have been identified for each of the six airport classifications are further sorted by the three tier categories of Michigan’s airports. Tier categories are further defined in Chapter 3, System Description. Tier 1 Airport Development Standards A series of individual items from each of the eight areas of airport development noted above have been identified as being applicable basic standards to the Tier 1 category of airports. The individual development items contained within each area are listed in Table 43, “Tier 1 and Tier 2 Airport Development Standards.” Detailed definitions of each of the eight areas and their individual development items are included in the subsequent section of this report, Chapter 8, Facility Goals. Tier 2 Airport Development Standards All eight of the Tier 1 airport development areas and their individual standard development items are considered significant and applicable to the Tier 2 category of airports as well. Therefore, Tier 2 airport development standards are identical to Tier 1 standards. Both are listed in Table 43. The only distinction between the Tier 1 and Tier 2 standards is that Tier 1 category airports carry a higher priority over Tier 2 category airports in receiving state and federal funding towards development of any of the eligible development items.
1

Table 43 Tier 1 and Tier 2 Airport Development Standards Airport Classification
Airport Development Item D-IV/V C-III C-II B-II B-I A-I Primary Length (feet) 6,000+ 5,000+ 5,000 4,300 3,500 2,500 Runway Width (feet) 150 100 100 75 75 100 System Surface Type Paved Paved Paved Paved Paved Turf
Primary Taxiway System Full Parallel Full Par if 20,000+
Ops None Pavement Primary Runway PCI 75 70 70 70 70 N/A Condition Primary Taxiway PCI 70 65 65 60 60 N/A Lighting and Runway Lighting System HIRL HIRL MIRL MIRL MIRL Markers Visual Aids PAPI Yes Yes Yes Yes Yes No REIL Yes Yes Yes Yes Yes No MALSR Yes Yes Yes No No No Rotating Beacon Yes Yes Yes Yes Yes No Lighted Wind Indicator Yes Yes Yes Yes Yes No Segmented Circle Yes Yes Yes Yes Yes No Approach Approach Protection Plan Yes Yes Yes Yes Yes Preferred Protection Filed with Local Authorities Yes Yes Yes Yes Yes Preferred Basic Pilot Pilot Shelter (24-hr) Yes Yes Yes Yes Yes Yes and Aircraft Telephone Yes Yes Yes Yes Yes No Services Restrooms Yes Yes Yes Yes Yes No Fuel Yes Yes Yes Yes Yes No Aircraft Parking Yes Yes Yes Yes Yes Yes Aircraft Maintenance Yes Yes Yes Yes No No Available Staff Yes Yes Yes Yes Yes Yes All-Weather Instrument Approach Precision Precision Precision Non-Prec Visual Visual Access Weather Reporting (AWOS) Yes Yes Yes Yes Preferred Preferred Weather Briefing Access Yes Yes Yes Yes Preferred Preferred Year-Round Open Year-Round Yes Yes Yes Yes Yes Yes Access Snow Removal Yes Yes Yes Yes Yes Yes Landside Access
Public/Private Transportation Yes Yes Yes Yes No No
Notes: At A-1 Airports, an unlit wind indicator is acceptable. Airports having a VASI instead of a PAPI are acceptable. An Airport Zoning Ordinance is considered an acceptable Approach Protection Plan. Aircraft parking consists of either a hanger, tie-down or parking area.
2
Tier 3 Airport Development Standards Most of the Tier 1 and Tier 2 airport development standards apply to the Tier 3 category airports, but there are some exceptions: In the area of Basic Pilot and Aircraft Services, the aircraft maintenance and airport staffing standards are not considered applicable to Tier 3 airports. The other items from this area (pilot shelter, telephone, restrooms, fuel, and aircraft parking) still apply as targeted standards for Tier 3 airports. In the areas of All-Weather Access, Year-Round Access, and Landside Access, none of the associated individual development items is considered to be an applicable standard for Tier 3 airports. Tier 3 category airport development standards are listed in Table 44, “Tier 3 Airport Development Standards.” Shaded areas of the table are the Tier 1 and Tier 2 airport development standards that do not apply to Tier 3 airports.
3
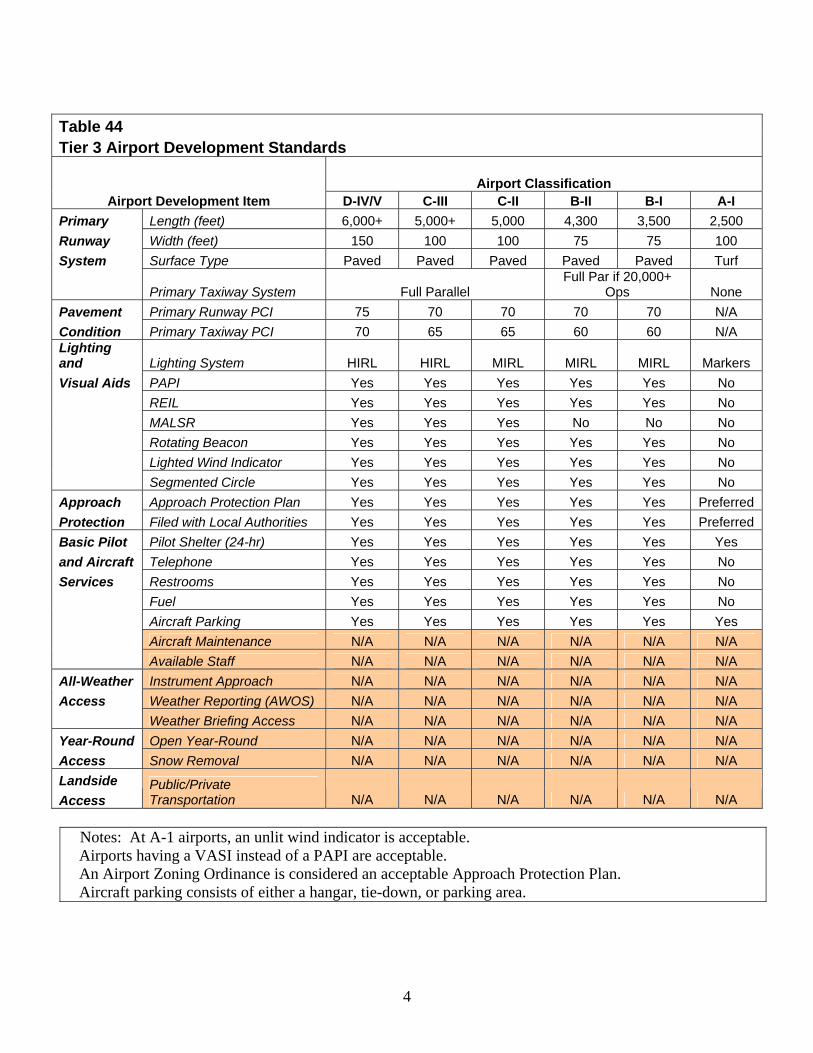
Table 44 Tier 3 Airport Development Standards Airport Classification
Airport Development Item D-IV/V C-III C-II B-II B-I A-I Primary Length (feet) 6,000+ 5,000+ 5,000 4,300 3,500 2,500 Runway Width (feet) 150 100 100 75 75 100 System Surface Type Paved Paved Paved Paved Paved Turf
Primary Taxiway System Full Parallel Full Par if 20,000+
Ops None Pavement Primary Runway PCI 75 70 70 70 70 N/A Condition Primary Taxiway PCI 70 65 65 60 60 N/A Lighting and Lighting System HIRL HIRL MIRL MIRL MIRL Markers Visual Aids PAPI Yes Yes Yes Yes Yes No REIL Yes Yes Yes Yes Yes No MALSR Yes Yes Yes No No No Rotating Beacon Yes Yes Yes Yes Yes No Lighted Wind Indicator Yes Yes Yes Yes Yes No Segmented Circle Yes Yes Yes Yes Yes No Approach Approach Protection Plan Yes Yes Yes Yes Yes Preferred Protection Filed with Local Authorities Yes Yes Yes Yes Yes Preferred Basic Pilot Pilot Shelter (24-hr) Yes Yes Yes Yes Yes Yes and Aircraft Telephone Yes Yes Yes Yes Yes No Services Restrooms Yes Yes Yes Yes Yes No Fuel Yes Yes Yes Yes Yes No Aircraft Parking Yes Yes Yes Yes Yes Yes Aircraft Maintenance N/A N/A N/A N/A N/A N/A Available Staff N/A N/A N/A N/A N/A N/A All-Weather Instrument Approach N/A N/A N/A N/A N/A N/A Access Weather Reporting (AWOS) N/A N/A N/A N/A N/A N/A Weather Briefing Access N/A N/A N/A N/A N/A N/A Year-Round Open Year-Round N/A N/A N/A N/A N/A N/A Access Snow Removal N/A N/A N/A N/A N/A N/A Landside Access
Public/Private Transportation N/A N/A N/A N/A N/A N/A
Notes: At A-1 airports, an unlit wind indicator is acceptable.
Airports having a VASI instead of a PAPI are acceptable. An Airport Zoning Ordinance is considered an acceptable Approach Protection Plan. Aircraft parking consists of either a hangar, tie-down, or parking area.
4

Description of Existing Michigan Airport System Facilities A description and assessment of the existing Michigan airport system provide valuable input for development of the MASP 2008. The primary uses of this assessment are: Establishment of baseline operational data useful in developing forecasts of based aircraft and operations. Establishment of baseline airport facility data useful in identifying current airport and system deficiencies. Establishment of an evaluation mechanism for measuring how effectively MASP airports are responding to identified goals and objectives. The ultimate goal of the assessment of the Michigan airport system can be described as follows: A current and dynamic inventory of airport features as they relate to MASP airport classification and airport development standards. Data Bases Currently, there are two active data bases within MDOT where aviation-related data is maintained: The Transportation Management System (TMS) is the official department repository for a vast array of data on all transportation modes, including aviation. The TMS has historically been the data source for MASP efforts, and analysis tools for the MASP 2008 utilize the TMS. The Airport Information Management System (AIMS) maintains aviation data and is an effective tool in communicating with the FAA and aviation agencies in other states. Currently, a need exists to maintain the data in both the TMS and AIMS. Therefore, in support of the MASP 2008 effort, a link between the two systems has been developed, which will result in one data set and eliminate the existence of two independent versions. The data stored in both systems will be maintained through either TMS or AIMS, with a link between the programs, making it readily available to any user on the system.
5


FACILITY GOALS The Michigan Airport System Plan (MASP 2008) defines the location and appropriate classification of all of the state’s public-use airports and the key facility elements that are considered essential to a properly developed state and national aviation system. The MASP 2008 does not attempt to identify which of the eight facility goals are more important relative to other facility goals, nor does it attempt to establish the relative importance among the seven previously discussed system goals. Rather, establishing a hierarchy between facility goals and system goals will occur in an airport investment strategy, which will be developed subsequent to publication of the MASP 2008. The following section describes in detail the eight facility goals that were determined to be applicable to all the Tier 1 and Tier 2 category airports in the state. Also discussed are the individual developmental items that make up each of the facility goals. The facility goals and development items that are applicable to the Tier 3 band of airports are also discussed. Current achievement rates for each of the facility goals are shown in this chapter for the high-priority Tier 1 band of airports. Considerable progress has been made in goal achievement rates for the majority of the facility goals since the previous publication of this report (MASP 2000). The figures and tables included in this chapter depict the current achievement rates for each of the eight facility goals, based on the seven MASP 2008 system goals. Each individual facility goal is represented by an associated bar graph and table. Bar graphs show the specific facility goal achievement rates for each system goal, based on a percentage of the 88 total Tier 1 airports. Tables show the specific facility goal achievement rates for each system goal, based on a percentage of the number of airports within the specific system goal (32 total population center airports, 36 total business center airports, et cetera). 1. Primary Runway System Tier 1, Tier 2, and Tier 3 category airports should have a complete primary runway system, including a paved runway of appropriate length and width, and a parallel taxiway, if warranted by airport classification, activity level, or type of instrument approach procedure. Airports classified with an approach category A are an exception, as a turf surface is considered acceptable and a parallel taxiway is not required. Current FAA standards require parallel taxiways for all airports with Instrument Approach Procedure (IAP) visibility minimums of less than one mile and recommend parallel taxiways for all airports with IAP visibility minimums of one-mile or greater. For operational safety enhancements, all approach category C and D airports should have a full-length parallel taxiway. Approach category B airports, those with over 20,000 annual operations should also have a full-length parallel taxiway.
1

Tier 1 Airports that currently meet this standard completely: 76 percent (67 out of 88). Figure 92008 Facility Goal Achievement:Primary Runway System
Table 452008 Facility Goal Achievement: Primary Runway SystemMASP Population Business Tourism General Land Regional
System Goal Center Center Center Population Cover Capacity Isolation
Number of Tier 1 Airports within System Goal 32 36 39 28 50 64 7
Development Item Percentage of Tier 1 Airports Meeting the Facility StandardRunway Length 97% 86% 77% 100% 94% 94% 57%
Runway Width 97% 83% 92% 100% 96% 94% 71%
Surface Type 100% 100% 95% 100% 94% 100% 57%
Primary Taxi System 84% 75% 92% 96% 98% 100% 71%
84%75% 77%
96% 94% 94%
57%
0%
10%
20%
30%
40%
50%
60%
70%
80%
90%
100%
MASP System Goal
Perc
enta
ge o
f Airp
orts
Mee
ting
Faci
lity
Stan
dard
Population CenterBusiness CenterTourism CenterGeneral PopulationLand CoverRegional CapacityIsolation
2

2. Pavement Condition Tier 1, Tier 2, and Tier 3 category airports should have pavements in their Primary Runway System in good or better condition. Pavement Condition Index values, where available, will be used as a standardized means of quantifying overall pavement conditions at each airport. The Pavement Condition Index (PCI) was developed by the U. S. Air Force, and it is the nationally recognized method used in the evaluation of pavement conditions by a numbers-based system. PCI values range from a high of 100 for new or defect-free pavements, to a low of 0 for pavements that have completely failed. Target minimum-level PCI values have been established for various airport pavements as part of the MASP 2008 study. The threshold values for good pavement conditions for runways and taxiways at the six different MASP classifications of airports are listed in Tables 43 and 44. Tier 1 Airports that currently meet this standard completely: 82 percent (72 out of 88).
3
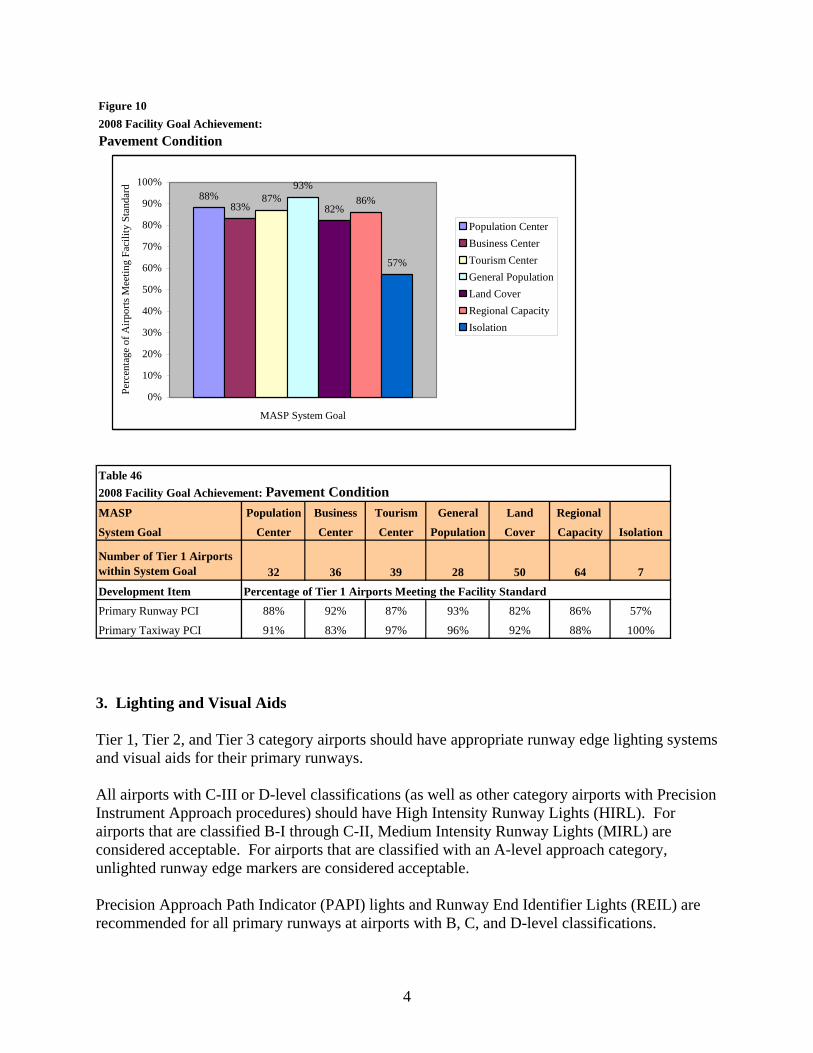
Figure 102008 Facility Goal Achievement:Pavement Condition
Table 462008 Facility Goal Achievement: Pavement ConditionMASP Population Business Tourism General Land Regional
System Goal Center Center Center Population Cover Capacity Isolation
Number of Tier 1 Airports within System Goal 32 36 39 28 50 64 7
Development Item Percentage of Tier 1 Airports Meeting the Facility StandardPrimary Runway PCI 88% 92% 87% 93% 82% 86% 57%
Primary Taxiway PCI 91% 83% 97% 96% 92% 88% 100%
88%83%
87%93%
82%86%
57%
0%
10%
20%
30%
40%
50%
60%
70%
80%
90%
100%
MASP System Goal
Perc
enta
ge o
f Airp
orts
Mee
ting
Faci
lity
Stan
dard
Population CenterBusiness CenterTourism CenterGeneral PopulationLand CoverRegional CapacityIsolation
3. Lighting and Visual Aids Tier 1, Tier 2, and Tier 3 category airports should have appropriate runway edge lighting systems and visual aids for their primary runways. All airports with C-III or D-level classifications (as well as other category airports with Precision Instrument Approach procedures) should have High Intensity Runway Lights (HIRL). For airports that are classified B-I through C-II, Medium Intensity Runway Lights (MIRL) are considered acceptable. For airports that are classified with an A-level approach category, unlighted runway edge markers are considered acceptable. Precision Approach Path Indicator (PAPI) lights and Runway End Identifier Lights (REIL) are recommended for all primary runways at airports with B, C, and D-level classifications.
4

A Medium Intensity Approach Lighting System with Runway Alignment Indicator Lights (MALSR) is recommended for all C and D-level approach category runways that have Precision Instrument Approach procedures. Rotating beacons, lighted wind indicators, and segmented circles are considered standard development items for all airports with B, C, and D-level MASP classifications. Tier 1 Airports that currently meet this standard completely: 81 percent (71 out of 88).
5
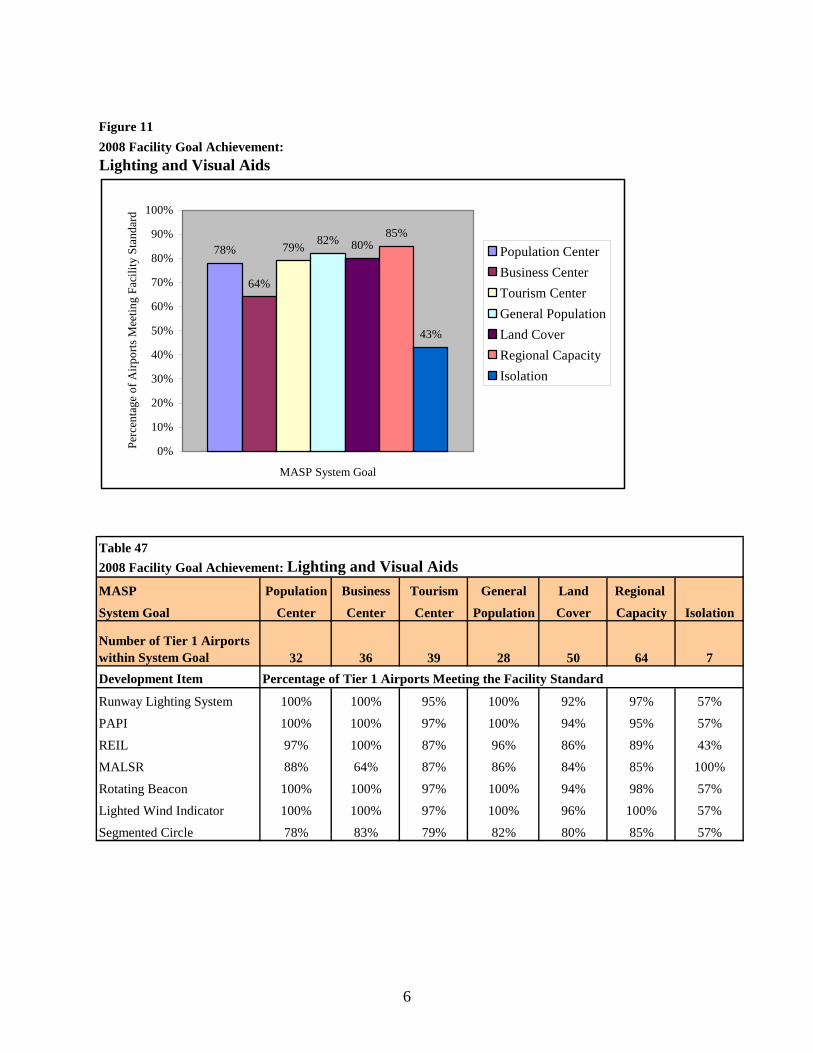
Figure 112008 Facility Goal Achievement:Lighting and Visual Aids
Table 472008 Facility Goal Achievement: Lighting and Visual AidsMASP Population Business Tourism General Land Regional
System Goal Center Center Center Population Cover Capacity Isolation
Number of Tier 1 Airports within System Goal 32 36 39 28 50 64 7Development Item Percentage of Tier 1 Airports Meeting the Facility Standard
Runway Lighting System 100% 100% 95% 100% 92% 97% 57%
PAPI 100% 100% 97% 100% 94% 95% 57%
REIL 97% 100% 87% 96% 86% 89% 43%
MALSR 88% 64% 87% 86% 84% 85% 100%
Rotating Beacon 100% 100% 97% 100% 94% 98% 57%
Lighted Wind Indicator 100% 100% 97% 100% 96% 100% 57%
Segmented Circle 78% 83% 79% 82% 80% 85% 57%
78%
64%
79% 82% 80%85%
43%
0%
10%
20%
30%
40%
50%
60%
70%
80%
90%
100%
MASP System Goal
Perc
enta
ge o
f Airp
orts
Mee
ting
Faci
lity
Stan
dard
Population CenterBusiness CenterTourism CenterGeneral PopulationLand CoverRegional CapacityIsolation
6

4. Approach Protection Tier 1, Tier 2, and Tier 3 category airports should have a current airport approach plan approved by the Michigan Aeronautics Commission (MAC), or an Airport Zoning Ordinance adopted under the provisions of the Michigan Airport Zoning Act (Act 23 of 1950). At time of publication of the MASP 2008, all public-use airports in the state had appropriate airport approach plans in place that were approved by the MAC. It is recommended that all MAC-approved airport approach plans be filed with the appropriate local authorities or agencies. Beginning in January 2008, MDOT Airports Division, requested written confirmation from airport managers that their airport approach plans have been filed with their local authorities. At time of publication of the MASP 2008, not all of the confirmation letters had been received by MDOT. However, it is recommended that for future updates of the MASP, verification that the approved approach plans are on file locally be considered a standard approach protection item.
7

Tier 1 Airports that currently meet this standard completely: 100 percent (88 out of 88). Figure 122008 Facility Goal Achievement:Approach Protection
Table 482008 Facility Goal Achievement: Approach ProtectionMASP Population Business Tourism General Land Regional
System Goal Center Center Center Population Cover Capacity Isolation
Number of Tier 1 Airports within System Goal 32 36 39 28 50 64 7
Development Item Percentage of Tier 1 Airports Meeting the Facility StandardApproach Protection Plan 100% 100% 100% 100% 100% 100% 100%
Filed with Local Authorities TBD TBD TBD TBD TBD TBD TBD
TBD - As of January 2008, we have requested written notification from the airport manager.
100% 100% 100% 100% 100% 100% 100%
0%
10%
20%
30%
40%
50%
60%
70%
80%
90%
100%
MASP System Goal
Perc
enta
ge o
f Airp
orts
Mee
ting
Faci
lity
Stan
dard
Population CenterBusiness CenterTourism CenterGeneral PopulationLand CoverRegional CapacityIsolation
5. Basic Pilot and Aircraft Services All public-use airports in the state airport system should have an appropriate range of pilot and aircraft services. For Tier 1, Tier 2, and Tier 3 category airports, basic pilot and aircraft services include a 24 hour-per-day accessible pilot and passenger shelter, a telephone, a restroom, avgas availability, and aircraft parking. Aircraft parking includes either hangar space, apron space, or a tie-down area for based or itinerant aircraft parking accommodation. In addition to the services mentioned above, Tier 1 and Tier 2 category airports should also include the availability of aircraft maintenance services and at least one available airport staff
8
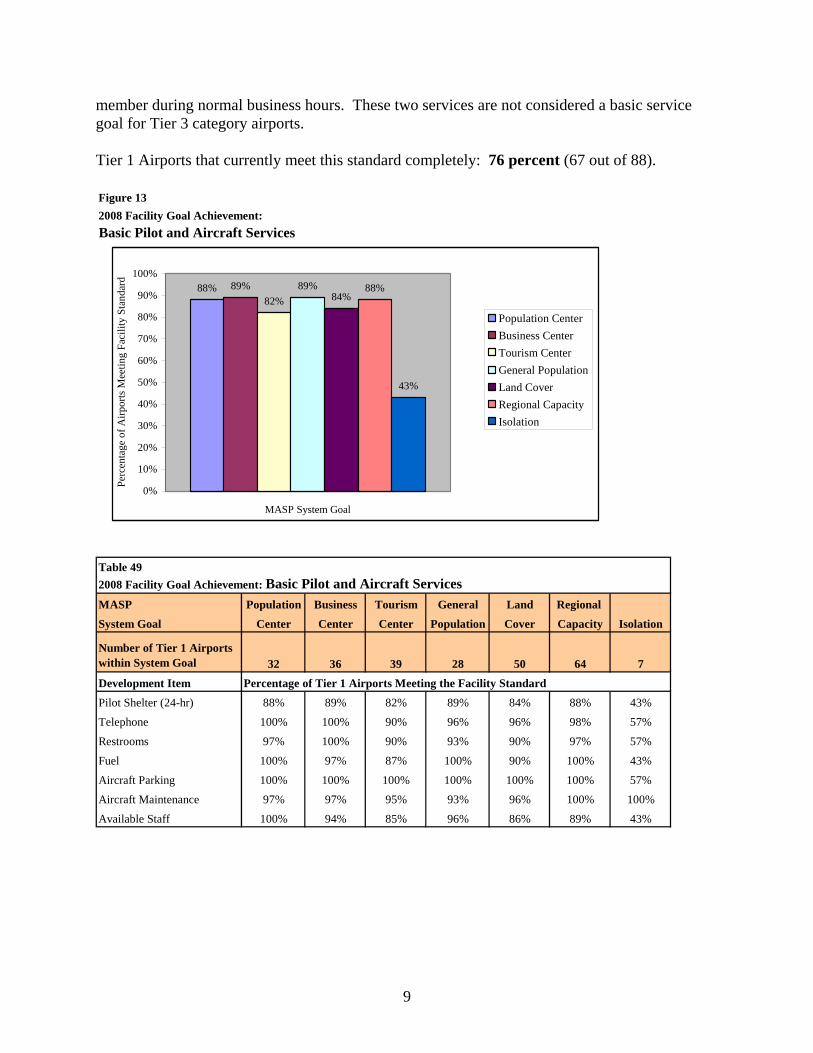
member during normal business hours. These two services are not considered a basic service goal for Tier 3 category airports. Tier 1 Airports that currently meet this standard completely: 76 percent (67 out of 88). Figure 132008 Facility Goal Achievement:Basic Pilot and Aircraft Services
Table 492008 Facility Goal Achievement: Basic Pilot and Aircraft ServicesMASP Population Business Tourism General Land Regional
System Goal Center Center Center Population Cover Capacity Isolation
Number of Tier 1 Airports within System Goal 32 36 39 28 50 64 7
Development Item Percentage of Tier 1 Airports Meeting the Facility Standard
Pilot Shelter (24-hr) 88% 89% 82% 89% 84% 88% 43%
Telephone 100% 100% 90% 96% 96% 98% 57%
Restrooms 97% 100% 90% 93% 90% 97% 57%
Fuel 100% 97% 87% 100% 90% 100% 43%
Aircraft Parking 100% 100% 100% 100% 100% 100% 57%
Aircraft Maintenance 97% 97% 95% 93% 96% 100% 100%
Available Staff 100% 94% 85% 96% 86% 89% 43%
88% 89%82%
89%84%
88%
43%
0%
10%
20%
30%
40%
50%
60%
70%
80%
90%
100%
MASP System Goal
Perc
enta
ge o
f Airp
orts
Mee
ting
Faci
lity
Stan
dard
Population CenterBusiness CenterTourism CenterGeneral PopulationLand CoverRegional CapacityIsolation
9

6. All-Weather Access Tier 1 and Tier 2 category airports should be accessible in all types of weather conditions. These airports should have published Instrument Approach Procedures that are considered appropriate for the size, activity level, and specific needs of each particular airport. Airports in these categories should also have weather reporting capabilities and provide pilot access to weather briefing sources. Weather reporting can be accomplished by Automatic Terminal Information Service (ATIS) broadcasts or by Automated Weather Observation System (AWOS) broadcasts at airports that have these capabilities. Weather briefing information can be made accessible to pilots by means of computer terminal, wireless/landline internet provision, or telephone. Tier 1 airports that currently meet this standard completely: 70 percent (62 out of 88). Figure 142008 Facility Goal Achievement:All Weather Access
Table 502008 Facility Goal Achievement: All Weather AccessMASP Population Business Tourism General Land Regional System Goal Center Center Center Population Cover Capacity IsolationNumber of Tier 1 Airports within System Goal 32 36 39 28 50 64 7Development Item Percentage of Tier 1 Airports Meeting the Facility StandardInstrument Approach 91% 67% 95% 100% 92% 97% 43%Weather Reporting 97% 94% 92% 96% 84% 77% 43%Weather Briefing Access 100% 100% 100% 100% 100% 100% 71%
91%
67%
92%96%
84%77%
43%
0%
20%
40%
60%
80%
100%
120%
MASP System Goal
Perc
enta
ge o
f Airp
orts
Mee
ting
Faci
lity
Stan
dard
Population CenterBusiness CenterTourism CenterGeneral PopulationLand CoverRegional CapacityIsolation
10

7. Year-Round Access Tier 1 and Tier 2 category airports should be open throughout the year. Each airport should have timely snow removal capabilities and a primary runway that is unaffected by spring thaw conditions. Tier 1 Airports that currently meet this standard completely: 94 percent (83 out of 88).
Table 512008 Facility Goal Achievement: Year-Round AccessMASP Population Business Tourism General Land Regional
System Goal Center Center Center Population Cover Capacity Isolation
Number of Tier 1 Airports within System Goal 32 36 39 28 50 64 7
Development Item Percentage of Tier 1 Airports Meeting the Facility StandardSnow Removal 100% 100% 95% 100% 96% 100% 57%
Open Year-Round 100% 100% 95% 100% 96% 100% 57%
100% 100%95%
100%96%
100%
57%
0%
10%
20%
30%
40%
50%
60%
70%
80%
90%
100%
MASP System Goal
Perc
enta
ge o
f Airp
orts
Mee
ting
Faci
lity
Stan
dard
Population CenterBusiness CenterTourism CenterGeneral PopulationLand CoverRegional CapacityIsolation
8. Landside Access Tier 1 and 2 category airports should have at least one mode of landside transportation service between the airport and the surrounding community, whether those services are made available by private firms or public transportation systems.
11

It is recommended that sponsors of public-use airports coordinate with state or local road agencies to ensure public roadway access is provided at surface conditions and service levels consistent with airport user needs. Tier 1 airports that currently meet this standard completely: 88 percent (77 out of 88). Landside Access
Table 522008 Facility Goal Achievement: Landside AccessMASP Population Business Tourism General Land Regional
System Goal Center Center Center Population Cover Capacity Isolation
Number of Tier 1 Airports within System Goal 32 36 39 28 50 64 7Development Item Percentage of Tier 1 Airports Meeting the Facility Standard
Public/Private Transportation 97% 97% 95% 96% 86% 89% 57%
97% 97% 95% 96%86% 89%
57%
0%
20%
40%
60%
80%
100%
120%
MASP System Goal
Perc
enta
ge o
f Airp
orts
Mee
ting
Faci
lity
Stan
dard
Population CenterBusiness CenterTourism CenterGeneral PopulationLand CoverRegional CapacityIsolation
12

PROJECTED AVIATION NEEDS AND FUNDING OVERVIEW The MASP 2008 lays out a number of system and facility goals aimed at improving air service in Michigan. Many of the goals included in the MASP 2008 are broad in nature, which makes it difficult to create or define metrics that can be used to measure or assess progress in attaining the goals. Likewise, it would be equally difficult to assess the funding necessary to fully and completely meet the goals described in this document. However, MDOT’s long range plan – MI Transportation Plan – includes an estimate of the funding necessary to meet the capital improvement needs of Michigan’s airports through 2030, as requested by individual airport sponsors. If funding were identified to meet all the capital needs required to keep Michigan’s airports running safely and efficiently, it would likely ensure that virtually all of the goals of this plan are met. Based on the capital development plans submitted to MDOT, the MI Transportation Plan estimates aviation needs over the next 25 years to be $5.3 billion. This is split into backlogged needs and accruing needs. Backlogged needs are transportation improvements or services that are currently deficient or currently require additional funds to bring them up to standard. Accruing needs assume the backlogged needs are taken care of early and include the needs that arise over the next 25 years. Needs estimates include anticipated capital improvements that have been historically funded through a combination of federal, state and local sources. The cost of airport operations and maintenance are not included in these needs. Examples of aviation needs include preservation and improvement of airport infrastructure, including pavement, apron, taxiway, terminal, lighting system, and other items essential to the effective delivery of aviation services. Construction and engineering costs are also included. For more details regarding how these needs were determined, please see the technical note at the end of this section. The chart below shows the breakdown of backlog and accruing needs.
Aviation Needs Though 2030
Accruing $3.7 billion70%
Backlogged$1.6 billion
30%
Source: MI Transportation Plan
Funding Overview
There are a number of federal and state programs that provide financial assistance to airports in
1
maintaining, improving or expanding service to fill their vital role in Michigan’s transportation system. While many of these programs operate independent of the MASP, they are all very important in moving Michigan closer to attaining the goals outlined in this report. These programs as they exist today, along with selected information on historical funding levels, are summarized below. FEDERAL PROGRAMS The federal aviation program consists of a number of large and small programs targeted for specific purposes and regularly evaluated for their effectiveness by Congress. The specific provisions of each federal program (such as qualifying criteria and project eligibilities), funding levels for these programs, and the revenue sources used to support them (which currently consist primarily of user fees and fuel taxes) are re-examined by Congress at least every four years. This re-examination can, and usually does, result in changes to federal aviation programs. Therefore, the programs described below represent only those currently authorized to distribute funding to airports and are subject to change or discontinuation. Airport Improvement Program Established in 1982, this is the largest federal program that provides funds directly to airports or to states for further distribution to airports. In order to be eligible to receive Airport Improvement Program (AIP) funding, an airport must be included in the National Plan of Integrated Airport Systems (NPIAS), of which 94 Michigan airports are included. AIP funds generally must be used for capital projects, which include equipment purchases or planning activities. Federal AIP funds cannot be used to pay for the entire cost of an eligible project and must be matched with funds from other sources, such as state, local or private funds. For all but medium and large hub airports, the federal funds can be used to pay for up to 95 percent of a project’s eligible costs. The federal share of project costs for all other airports varies. Funds in the AIP are apportioned to airports or states in several different program categories, described below:
Primary Airport Entitlements – Airports with commercial service that enplane at least 10,000 passengers in a calendar year are eligible for this category of funding. The amount of funding provided to each eligible airport is generally determined by a formula that relies on the number of passenger boardings. The minimum amount for each eligible airport is currently $1,000,000.
Non-Primary Airport Entitlements – Airports that are not eligible for Primary Entitlements are eligible to receive funding from the available Non-Primary Entitlements. All eligible airports receive a minimum of $150,000 and possibly, more depending on the availability of funding and the actual documented needs of each specific airport.
Cargo Airport Entitlements – Funding in this category is provided to airports served by aircraft providing air transportation of cargo with a total annual landed weight of more than 100,000,000 pounds. Funding for each eligible airport is based on available funding and the nationwide share of the total annual landed weight of aircraft at each eligible airport. It is important to note that all airports that meet the annual landed weight criteria
2

mentioned above are eligible for funding under this program, regardless of whether they handle only cargo or a mix of cargo and passenger traffic. State Apportionments – Funds are apportioned to states based on population and total land area. States may use these funds as they see fit among Non-Primary Airports.
Discretionary Categories – Funds not apportioned though the categories above are competitively awarded by the FAA to certain airports through a few different discretionary programs. These programs include a noise program, military airport program, and a program intended to address high priority needs.
Historical Airport Improvement Funding Levels
Fiscal Year
Michigan’s AIP Amount
Growth Over Prior Year
Nationwide AIP Amount
Growth Over Prior Year
1998 $46,355,235 1% $1,503,468,689 2% 1999 $59,401,407 28% $1,958,744,219 30% 2000 $60,396,420 2% $1,872,677,035 -4% 2001 $118,123,406 96% $3,114,947,971 66% 2002 $108,601,415 -8% $3,396,324,904 9% 2003 $88,412,636 -19% $3,274,175,485 -4% 2004 $102,198,006 16% $3,374,673,698 3% 2005 $102,299,634 0% $3,409,031,636 1% 2006 $101,419,065 -1% $3,411,416,175 0% 2007 $118,281,074 17% $3,340,947,531 -2%
10 year Total $905,488,298 $28,656,407,343
Essential Air Service The Essential Air Service (EAS) program was created in 1978, when Congress deregulated the airline industry. When market forces were set to replace governmental control of fares and service routes there was concern that air service to small communities would suffer as a result. Congress ensured that all communities that were served by air carriers before deregulation would continue to receive some level of scheduled air service, and they created the EAS program to subsidize the service if the air carriers could not provide it without incurring a loss. The funds flowing through this program are provided directly to the air carrier. Currently, four airports in Michigan are eligible for subsidies through the EAS program.
3

Historical EAS Subsidies
Fiscal Year Delta County Airport, Escanaba
Ford Airport, Iron Mountain
Gogebic County Airport, Ironwood
Manistee County-Blacker Airport
1998 NA $473,599 $357,588 $361,808 1999 NA $473,599 $544,269 $361,808 2000 NA $473,599 $544,269 $542,168 2001 NA $478,693 $479,879 $484,545 2002 NA $478,693 $479,879 $484,545 2003 NA $478,693 $479,879 $484,545 2004 $290,952 $602,761 $409,242 $776,051 2005 $290,952 $602,761 $409,242 $776,051 2006 $908,903 $602,761 $409,242 $776,051 2007 $960,627 $1,067,067 $710,945 $893,295
10 year Total $2,451,434 $5,732,226 $4,824,434 $5,940,867 Small Community Air Service Development
The Small Community Air Service Development program was established in 2000 to help small communities improve their air service. Participation in this program is limited to 40 communities nationwide, or consortia of communities, per year. In order to be eligible for the program, the airport serving the community must be no larger than a primary small hub airport (based on calendar year 1997 data); it must have insufficient air carrier service, unreasonably high air fare, geographic diversity, or unique circumstances that will demonstrate the need for the program. No more than four grant recipients may be located in the same state in any year. Program funds may be spent on a wide range of activities, including marketing, air carrier start-up subsidies, revenue guarantees, or market studies. The table below shows the airports in Michigan that have received funding through this program in the past.
SCASD Funding to Michigan Airports Fiscal Year Airport Amount of Award
2002 Houghton County $80,000 2002 Pellston Regional of Emmet County $80,000 2003 Muskegon County $600,000 2004 Alpena County Regional $583,000 2004 Kalamazoo/Battle Creek Int’l $500,000 2004 Sawyer International $700,000 2005 Chippewa County International $587,000 2005 Houghton County $516,000 2007 Gogebic County Airport $135,000 2007 MBS International $500,000
4

STATE FUNDING ASSISTANCE Much like the federal government, the State of Michigan also receives revenue to support aviation programs and services from a mix of aviation fuel taxes and user fees. Some of this revenue is used to provide a portion of the non-federal matching fund requirement associated with the federal AIP program. For all but medium and large hub airports, the federal funds can be used to pay for up to 95 percent of a project’s eligible costs. The federal share of project costs for all other airports varies. For both categories of airports, the state generally requires 2.5 percent of eligible costs to be paid by the local airport, and the remainder of the eligible costs is paid by the state. The state administers four other programs, which are described below, that provide funding to a specific group of airports or for a specific purpose. Crack Sealing and Paint Marking The state provided up to 50 percent of a project’s eligible cost for crack sealing and paint marking for runways. Funding is limited to $15,000 over any consecutive three year period. Small Airports Program This program is open to airports with less than 100 based aircraft and/or one with less than 10,000 annual commercial emplacements. This opens up funding opportunities for some airports that are not eligible for federal assistance. The program provides funding for up to 90 percent of the eligible cost of projects that are important to the airport and Michigan’s Airport System Plan. Airport Loan Program Publicly owned airports in Michigan may borrow up to $100,000 for capital improvements through this program (i.e., the outstanding balance of any airport is limited to $100,000). Loans must be paid back within 10 years and each airport must pay at least 10 percent of the cost of the project for which funds are borrowed. Safety and Security Program This program provides state funds for safety and security projects, which are matched with local funds on a 90/10 percent basis for non-hub primary and large general aviation airports and on a 95/5 percent basis for small general aviation airports. Michigan Air Service Program The goals of the Air Service program are to sustain and/or improve existing levels of commercial air service to increase accessibility of Michigan’s recreational, business and industrial centers, improve efficiency of handling scheduled passengers and cargo at air carrier airports, heighten awareness of the airport’s role in supporting community growth and economic development, and secure increased federal entitlement funds for airport improvements through increased passenger enplanements. The program funds projects for capital improvement and equipment, carrier recruitment and retention, and airport awareness activities. Local matching requirements apply and the amount of match required varies by project type and the size of the airport (as measured by the number of enplanements).
5

LOCAL FUNDING Local funds, which are required for all state and federally assisted capital projects, come from a variety of sources. Local governments, airport authorities, other airport owners, airport user groups and business groups are just some of the entities that can provide airports with local funds. Local funding sources are diverse and can include funds provided from a local government’s operating budget, dedicated millage levy, or user fees, such as hanger rentals and fuel sales. Passenger Facility Charges In addition to the local funding sources mentioned above, in 1992 Congress began allowing individual airports to impose a Passenger Facility Charge (PFC) on enplaning passengers. Proceeds from PFCs may be used by the airports to fund FAA-approved airport improvement projects that fit within the programs broad objectives of: (1) preserving or enhancing airport safety, security, or capacity; (2) reducing noise; or (3) enhancing airline competition. Airports generally have far more flexibility in using these funds than they have using some of the other major funding sources, such as AIP funding. The FAA must approve an airport’s request to levy the fee, and the fee is limited to $4.50 per ticket. Despite the federal role in approving and administering PFCs, the funds collected are essentially treated as local funds.
Technical Note on Calculating Aviation Needs This appendix provides greater detail on how the aviation system needs that are reported in the Projected Aviation Needs and Funding Overview section of the MASP 2008 were determined. The backlog of needs is based upon a compilation of Five-Year Plans, a federally required planning document for all airports in the NPIAS. An assumption of $250 million in 2006, with annual growth of five percent annually over the subsequent five years, was used for the backlogged needs costs. An annual accrual, starting at $115 million (in 2005 dollars), with a five percent annual increase, is assumed through the life of the plan. Here is an example of the difference between backlog and accruing needs. Some facilities are currently congested; the cost to improve these facilities would be included in the backlogged needs. The facilities that become congested as the population grows or shifts would be included in the accruing needs. Important assumptions were made in the development of the needs estimates, and those are described below: 1. Backlogged costs were calculated by taking the full backlog units, or dollars, spreading them
over the first six years of the plan (2006-2011), and increasing the rate to account for increasing unit cost rates.
2. Accruing costs were calculated by two methods: (1) if the year of implementation is known
over the life of the plan, these units by year were multiplied by the increasing MDOT State Long-Range Transportation Plan “Revenue Gap and Investment Packages” report’s unit cost rates; or (2), if these distributions are unknown, the units were spread evenly over the 25 years of the plan.
6

3. All costs were calculated in year of expenditures ($YOE), or the actual value of the years
they will be utilized in, and then these $YOE are discounted to 2005 dollars using a discount rate of 3.1 percent.
4. Unit costs were developed for many of the categories. The unit costs were escalated at
different rates, depending on the type of improvement category. 5. Some categories did not have unit costs but had 2005 base year expenditures. These
expenditures were also escalated using various escalation rates.
7


MASP MODIFICATION PROCESS One of the features of the MASP 2008 is the ability to modify system recommendations to reflect changes in system goals, system standards, or additions and deletions to the public-use airport system, et cetera. A variety of analyses in the years ahead, some potentially unforeseen, may necessitate changes to the MASP 2008. The purpose of this chapter is to indicate how formal changes to the MASP 2008 will occur. Goals and ObjectivesAny changes to the MASP 2008 goals and objectives, including new goals, or refocusing of goal emphasis will be to undergo an analysis by the MDOT Bureaus of Transportation Planning and Aeronautics. These changes will require Michigan Aeronautics Commission approval. Likewise, any changes to system standards, including airport classification, service standards or performance target, will require Michigan Aeronautics Commission approval. Tier 1/Tier 2 Airport DesignationDesignation of an airport into either Tier 1 or Tier 2, or movement of an airport from one tier to another tier requires Michigan Aeronautics Commission approval. Staff recommendations to the Commission will be based on criteria established for each system goal. From time to time, as more current data become available, or techniques improve, staff analyses may indicate that a shift in select airport tier placement may be appropriate. Tier 3 Airport DesignationAll public-use airports are included in the MASP 2008. Those facilities not included in either Tier 1 or Tier 2 are designated as Tier 3 airports. In any given year a number of airports may be added to the system or dropped from the system based on their current licensing designation. No formal action is required from the Michigan Aeronautics Commission regarding these airports. However, the Commission will be periodically advised of additions and deletions to the Tier 3 airport system. Facility GoalsAny modifications to MASP 2008 facility goals will require Michigan Aeronautics Commission approval. Staff will report to the Commission periodically on the number of airports meeting facility standards.


GLOSSARY This section defines the terms used in the MASP 2008 and provides a list of acronyms used in the report. Glossary Air Carrier Report – An airport that has regularly scheduled passenger service
licensed by Bureau of Aeronautics and Freight Services or certificated by FAA
Aircraft Operation – An aircraft takeoff or landing. Airport Approach Plan – A plan established by the MAC that includes height
restrictions and land use guidelines for areas surrounding licensed public-use airports.
Airport Infrastructure – Any and all physical facilities of a given airport. Airport Zoning – A zoning ordinance established in accordance with the
Airport Zoning Act. Apron – The portion of the runway system that is adjacent to the
terminal building, for boarding the aircraft. A paved area of the airport used for the loading, unloading or parking of aircraft.
Arterial Road – A major road that carries automotive traffic through regions
and cities. Based Aircraft – The number of aircraft located at an airport as reported
through airport inspections. Normally designation as a based aircraft means that an aircraft is located at an airport for at least six months in a year.
Collector Road – A road that carries intra-city traffic or carries traffic from
local roads to arterials. Connecting Taxiway – A taxiway between a runway to either another Taxiway or
apron. Endangered Airport – An airport that is in a situation of imminent closure. Heliport – A facility that allows for helicopter takeoff and landing.

Instrument Approaches – Instrument approach procedures established by the FAA for the purpose of accommodating aircraft arriving under instrument flight rules.
- Precision instrument approach - Non-precision instrument approach
Itinerant Operation – An aircraft operation in which the aircraft departs from one
airport and lands at a different airport. General Aviation Airport – An airport established primarily for the accommodation of
other than air carrier aircraft. Local Operation – An aircraft operation in which the aircraft departs and
returns to the same airport without an intermediate stop. Local Road – A road that only carries traffic directly to and from a
destination. There is very little through traffic on a local road.
Navigational Aid – A general term for all facilities that assist a pilot in
operating an aircraft, such as runway lighting and other approach aids.
NonPrecision approach (NP) – An approach that gives only horizontal guidance. Parallel Taxiway – A taxiway that is placed beside and parallel to a runway
allowing aircraft to taxi from one end of the runway to the other without being on the runway.
Precision approach – An approach that provides both horizontal and vertical
guidance to the runway. Primary Runway – The main runway used at an airport; Generally, the longest
and widest of the runways. Segmented Circle – A navigational aid that indicates the runway alignment and
any non standard traffic pattern in use at the airport. Normally contains a wind indicator.
Statewide Travel Demand Model – The Statewide travel Demand model is a tool to support the
transportation planning process. It is a series of analytical techniques used to predict travel behavior and resulting demand on transportation facilities and services for a specific future time frame.

Taxistreet – A taxiway that leads from another taxiway directly into and serving an aircraft hangar.
Transportation Analysis Zone – Are typically small area neighborhoods or communities
that serve as the smallest geographic basis for travel demand model forecasting systems.
Visual approach – An approach that does not provide either horizontal and
vertical guidance to the runway.

Common Acronyms ADO Airports District Office (FAA) AIMS Aviation Information Management System ARC Airport Reference Code (e.g. B-II) AVGAS Aviation fuel for piston powered aircraft AWOS Automated Weather Observation System ASOS Automated Surface Observation System BAFS Bureau of Aeronautics and Freight Services BTP Bureau of Transportation Planning, Michigan Department of Transportation FAA Federal Aviation Administration GIS Geographic Information System GPS Global Positioning System GCO Ground Communication Outlet ILS Instrument Landing System Jet A Aviation fuel for turbine powered or jet powered aircraft MAC Michigan Aeronautics Commission MALSR Medium intensity Approach Light System with runway alignment indicator lights MCD Minor Civil Division NPIAS National Plan of Integrated Airport Systems PAPI Precision Approach Path Indicator PCI Pavement Condition Index REIL Runway End Indicator Lights TAZ Transportation Analysis Zone TMS Transportation Management System TSA Transportation Security Administration VASI Visual Approach Indicator