Embed Size (px)
Citation preview
McGraw-Hill/Irwin
Chapter 29: Aggregate Demand and Aggregate Supply
Copyright © 2010 by The McGraw-Hill Companies, Inc. All rights reserved

Aggregate Demand – Aggregate Supply Model
The AD-AS model enables us to analyze changes in real GDP and price level simultaneously.
The AD-AS model provides keen insights on inflation, recession, unemployment, and economic growth.
LO: 14-1
Aggregate Demand – Aggregate Supply (AD-AS) model is the macroeconomic model that uses aggregate demand and aggregate supply to determine and explain the price level and level of real domestic output.
14-2

Aggregate Demand and Aggregate Demand Curve
LO: 14-1
Aggregate demand curve is a schedule that shows the total quantity of goods and services demanded at difference price levels.
There is an inverse relationship between the price level (as measured by the GDP price index) and real output demanded (real GDP). Real Domestic Output, GDP
Pri
ce L
evel
AD
AggregateDemand
14-3

Changes in Aggregate Demand
LO: 14-1
Determinant: Factor(s) of Determinant: AD shifts:
Consumer Spending
Consumer wealth increases
Consumers’ real incomes rise
Household indebtedness rises
Tax increases
RIGHT
LEFT
Investment Spending
Increases in real interest rate
Higher expected returns
LEFT
RIGHT
Government Spending
Increase in government spending RIGHT
Net export Spending
Rising national income abroad
Depreciation of the dollarRIGHT
14-4

Shifts in Aggregate Demand Curve
Real Domestic Output, GDP
Pri
ce L
evel
AD1
Increase inAggregateDemand
AD3
AD2Decrease inAggregateDemand
LO: 14-1
14-5

Aggregate Supply
LO: 14-2
Aggregate supply curve is a schedule that shows the total quantity of goods and services supplied at difference price levels.
The aggregate supply curve in the short run and in the long run vary by degrees of wage adjustment In the immediate short run, output and input prices are
fixed, and the AS curve is horizontal In the short run, output prices are flexible while input prices
are sticky, thus the AS curve is positively sloped In the long run, all prices are flexible, economy is at the full
employment (output is equal to potential), the AS curve is vertical
14-6

Immediate Short Run Aggregate Supply
Real Domestic Output, GDP
Pri
ce L
evel ASISR
Immediate Short RunAggregate Supply
LO: 14-2
14-7

Short RunAggregate Supply
Real Domestic Output, GDP
Pri
ce L
evel
0 Qf
Aggregate Supply(Short Run)
LO: 14-2
14-8
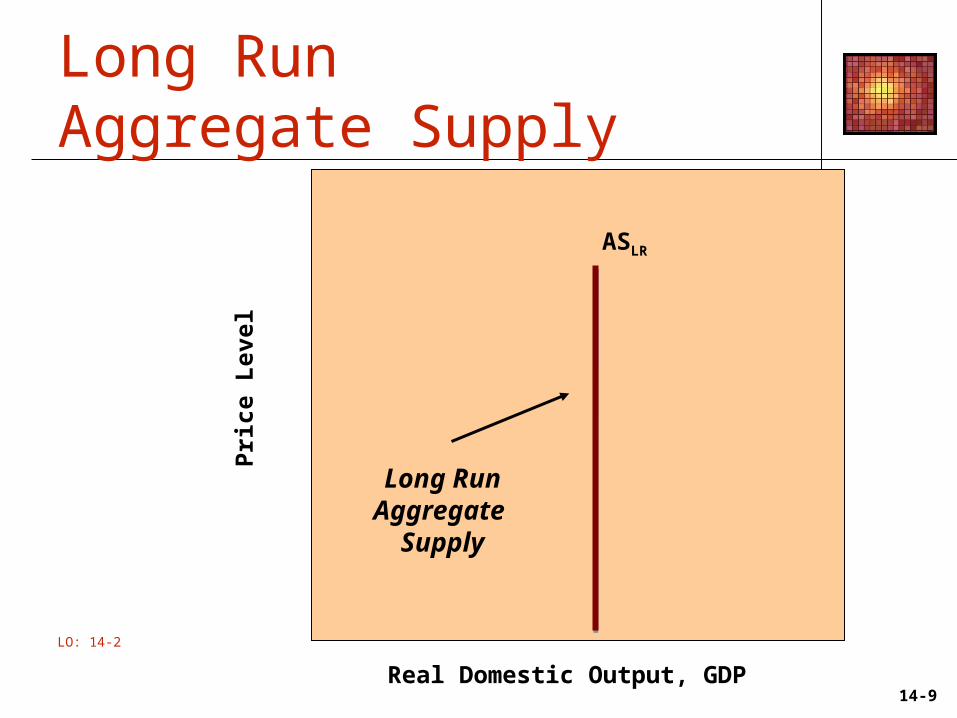
Long Run Aggregate Supply
Real Domestic Output, GDP
Pri
ce L
evel
ASLR
Long RunAggregate
Supply
LO: 14-2
14-9
Changes in Aggregate Supply
LO: 14-2
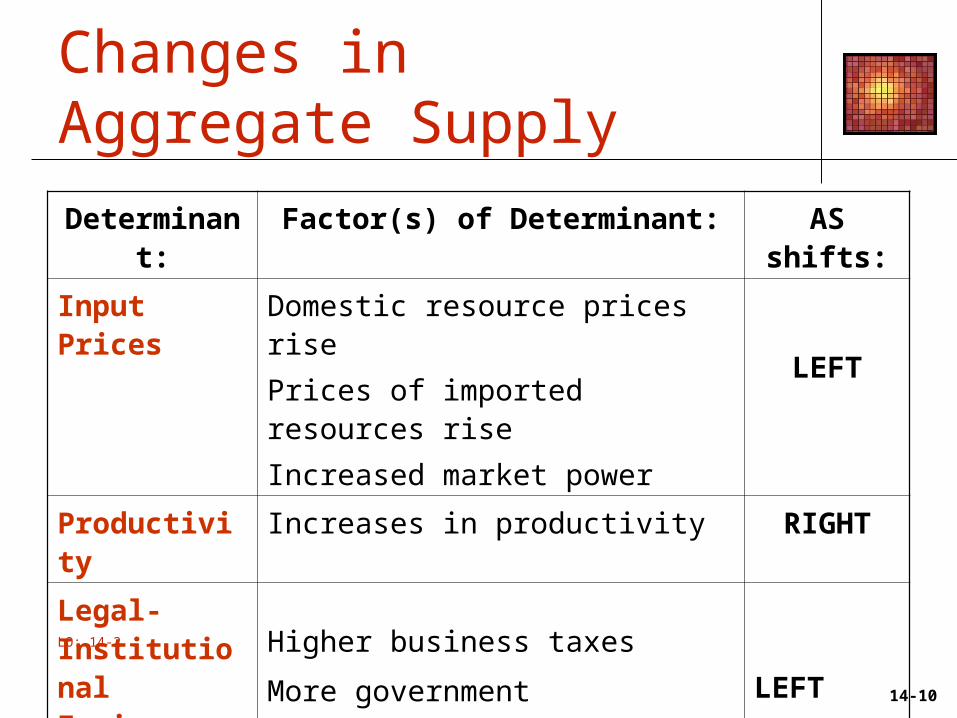
Determinant: Factor(s) of Determinant: AS shifts:
Input Prices Domestic resource prices rise
Prices of imported resources rise
Increased market power
LEFT
Productivity Increases in productivity RIGHT
Legal-Institutional Environment
Higher business taxes
More government regulationLEFT
14-10

Shifts in Aggregate Supply Curve
Real Domestic Output, GDP
Pri
ce L
evel
AS1
Increase inAggregate
Supply
AS3
AS2Decrease inAggregate
Supply
LO: 14-2
14-11

Equilibrium Price Level and Real GDP
Equilibrium occurs at the price level that equalizes the amount of real output demanded and supplied.
Equilibrium point is the intersection of the aggregate demand curve and aggregate supply curve.
This intersection determines the equilibrium price level and equilibrium real output.
LO: 14-3
14-12

Equilibrium
Real OutputDemanded(Billions)
Price Level(Index Number)
Real OutputSupplied(Billions)
$506
508
510
512
514
108
104
100
96
92
$513
512
510
507
502Equilibrium Price Level and
Equilibrium Real GDPLO: 14-3
14-13

Equilibrium
Real Domestic Output, GDP (Billions of Dollars)
Pri
ce L
evel
100
510
AD
AS
Equilibrium
LO: 14-3
14-14

Using AD-AS Model to Explain Inflation and Recession
When aggregate supply and aggregate demand change, inflation and recession can occur in the short run.
Demand-pull inflation occurs when aggregate demand increases (AD curve shifts to the right).
Cost-push inflation occurs when costs of production rise (AS curve shifts to the left).
Recession occurs when aggregate demand falls (AD curve shifts to the left) and prices are sticky downwards.
LO: 14-4
14-15
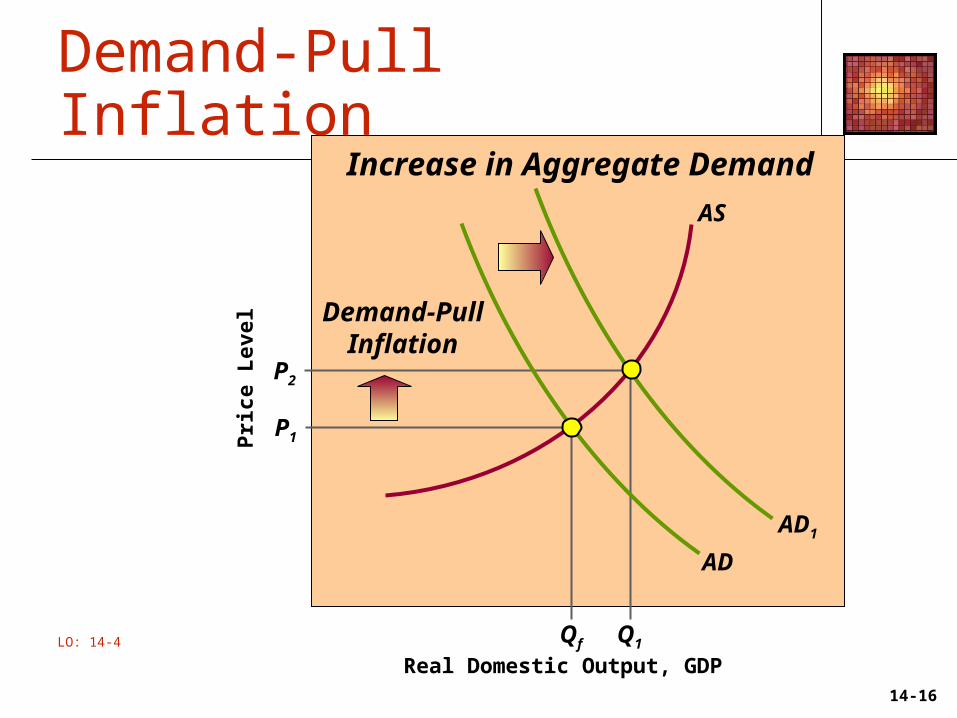
Demand-Pull Inflation
Real Domestic Output, GDP
Pri
ce L
evel
AD
AS
P1
P2
Q1Qf
AD1
Increase in Aggregate Demand
Demand-PullInflation
LO: 14-4
14-16

Cost-Push Inflation
Real Domestic Output, GDP
Pri
ce L
evel
AD
AS
P1
P2
Q1 Qf
Decrease in Aggregate Supply
Cost-PushInflation
AS1
a
b
LO: 14-4
14-17

Recession
Real Domestic Output, GDP
Pri
ce L
evel
AD1
AS
P1
Q2 Qf
AD2
Decrease in Aggregate Demand
Creates aRecession
ab
LO: 14-4
14-18