Embed Size (px)
Citation preview

MB MC
Inflation and Aggregate Supply
Inflation and Aggregate Supply

Chapter 15: Inflation and Aggregate Supply Slide 2
MB MC
Copyright c 2004 by The McGraw-HillCompanies, Inc. All rights reserved.
Inflation, Spending, and Output: The Aggregate Demand Curve
Aggregate Demand (AD) CurveShows the relationship between short-run
equilibrium output Y and the rate of inflation,
The name of the curve reflects the fact that short-run equilibrium output is determined by, and equals, total planned spending in the economy
Chapter 15: Inflation and Aggregate Supply Slide 3
MB MC
Copyright c 2004 by The McGraw-HillCompanies, Inc. All rights reserved.
Inflation, Spending, and Output: The Aggregate Demand Curve
Aggregate Demand (AD) CurveIncreases in inflation reduce planned
spending and short-run equilibrium output, so the aggregate demand curve is downward-sloping

Chapter 15: Inflation and Aggregate Supply Slide 4
MB MC
Copyright c 2004 by The McGraw-HillCompanies, Inc. All rights reserved.
Inflation, Spending, and Output: The Aggregate Demand Curve
Inflation, the Fed, and the AD CurveThe Keynesian model assumes output
adjusts to demand at preset prices in the short run.
Prices do not remain fixed indefinitely.The Keynesian model does not explain the
behavior of inflation.
Chapter 15: Inflation and Aggregate Supply Slide 5
MB MC
Copyright c 2004 by The McGraw-HillCompanies, Inc. All rights reserved.
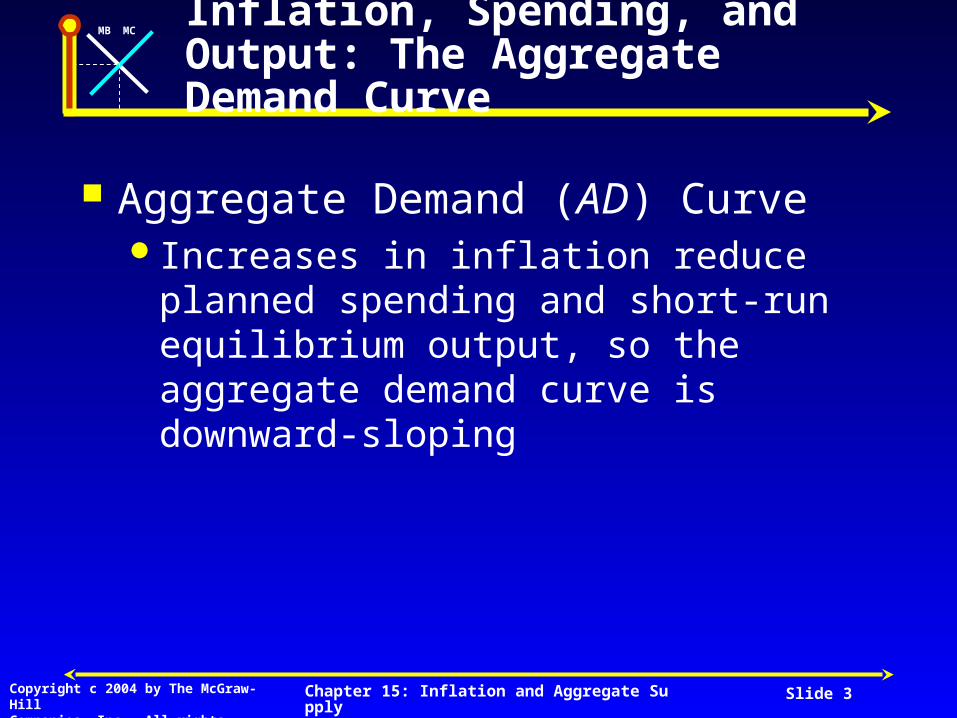
The Aggregate Demand Curve
Output Y
AD
Aggregate Demand Curve
An increase in reduces Y(all other factors held constant)
Infl
atio
n

Chapter 15: Inflation and Aggregate Supply Slide 6
MB MC
Copyright c 2004 by The McGraw-HillCompanies, Inc. All rights reserved.
Inflation, Spending, and Output: The Aggregate Demand Curve
Inflation, the Fed, and the AD CurveA primary objective of the Fed is to
maintain a low and stable inflation rate.Inflation is likely to occur when Y > Y*.To control inflation, the Fed must keep Y
from exceeding Y*.

Chapter 15: Inflation and Aggregate Supply Slide 7
MB MC
Copyright c 2004 by The McGraw-HillCompanies, Inc. All rights reserved.
Inflation, Spending, and Output: The Aggregate Demand Curve
Inflation, the Fed, and the AD CurveThe Fed can reduce autonomous
expenditure by raising the interest rate. increases r increases autonomous
spending decreases Y decreases (AD curve)

Chapter 15: Inflation and Aggregate Supply Slide 8
MB MC
Copyright c 2004 by The McGraw-HillCompanies, Inc. All rights reserved.
Inflation, Spending, and Output: The Aggregate Demand Curve
Other Reasons for the Downward Slope of the AD CurveReal value of moneyDistributional effectsUncertaintyPrices of domestic goods and services sold
abroad

Chapter 15: Inflation and Aggregate Supply Slide 9
MB MC
Copyright c 2004 by The McGraw-HillCompanies, Inc. All rights reserved.
Effect of An Increase In Exogenous Spending
Output Y
ADExogenous Spending: spending unrelated to Y or r• Fiscal policy•Technology•Foreign demand
AD’
An increase in exogenous spending shifts AD to AD’ and vice versaIn
flat
ion

Chapter 15: Inflation and Aggregate Supply Slide 10
MB MC
Copyright c 2004 by The McGraw-HillCompanies, Inc. All rights reserved.
A Shift In The Fed’s Policy Reaction FunctionR
eal i
nte
rest
rat
e se
t b
y F
ed, r
Output YInflation
Infl
atio
n
New policy reaction function
Fed “tightens” monetary policy – shifting reaction curve
Old policy reaction function
AD
AD’
The new Fed policy increases r and AD shifts to AD’

Chapter 15: Inflation and Aggregate Supply Slide 11
MB MC
Copyright c 2004 by The McGraw-HillCompanies, Inc. All rights reserved.
Inflation, Spending, and Output: The Aggregate Demand Curve
Movements Along the AD Curve and Y are inversely relatedChanges in cause a change in Y or a
movement along the AD curve increases r increases planned
spending decreases Y decreases
Chapter 15: Inflation and Aggregate Supply Slide 12
MB MC
Copyright c 2004 by The McGraw-HillCompanies, Inc. All rights reserved.
Inflation, Spending, and Output: The Aggregate Demand Curve
Shifts of the AD CurveAny factor that changes Y at a given
shifts the AD curve.Shifts of the AD curve can be caused by:
Changes in exogenous spending.Changes in the Fed’s policy reaction function.

Chapter 15: Inflation and Aggregate Supply Slide 13
MB MC
Copyright c 2004 by The McGraw-HillCompanies, Inc. All rights reserved.
Inflation andAggregate Supply
Inflation will remain roughly constant, or have inertia, if operating at Y* and there are no external shocks to the price level.

Chapter 15: Inflation and Aggregate Supply Slide 14
MB MC
Copyright c 2004 by The McGraw-HillCompanies, Inc. All rights reserved.
Inflation andAggregate Supply
Three factors that can increase the inflation rateOutput gapInflation shockShock to potential output
Chapter 15: Inflation and Aggregate Supply Slide 15
MB MC
Copyright c 2004 by The McGraw-HillCompanies, Inc. All rights reserved.
Inflation andAggregate Supply
Inflation InertiaIn industrial economies (U.S.), inflation
tends to change slowly from year to year.The inflation inertia occurs for two reasons:
Inflation expectationsLong-term wage and price contracts
Chapter 15: Inflation and Aggregate Supply Slide 16
MB MC
Copyright c 2004 by The McGraw-HillCompanies, Inc. All rights reserved.
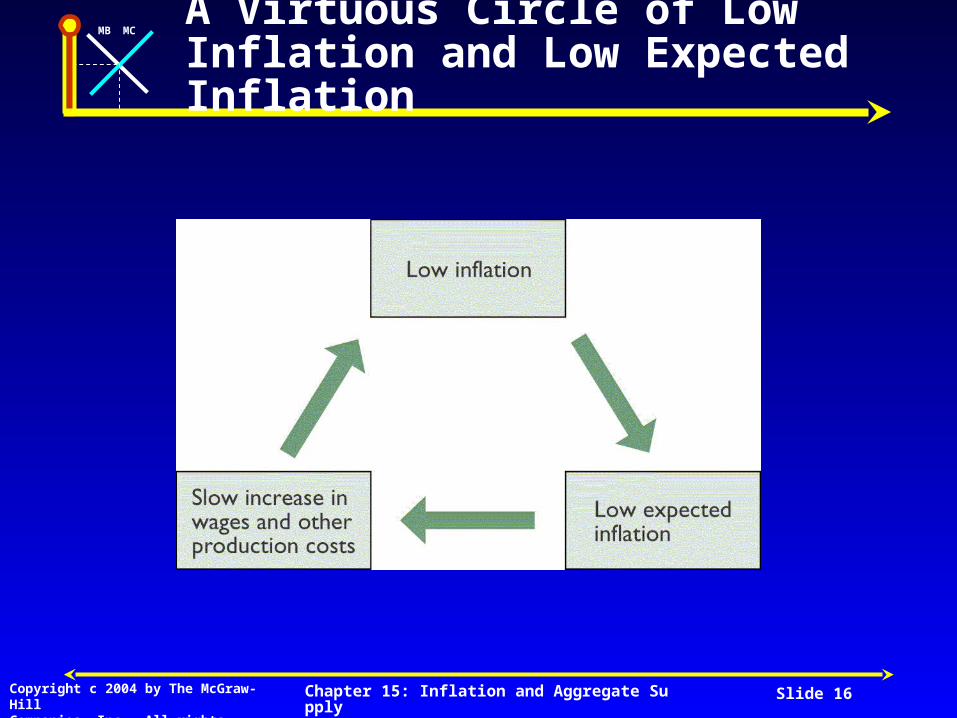
A Virtuous Circle of Low Inflation and Low Expected Inflation
Chapter 15: Inflation and Aggregate Supply Slide 17
MB MC
Copyright c 2004 by The McGraw-HillCompanies, Inc. All rights reserved.
Inflation andAggregate Supply
Long-term Wage and Price ContractsUnion wage contracts set wages for
several years.Contracts setting the price of raw materials
and parts for manufacturing firms also cover several years.
These long-term contracts reflect the inflation expectations at the time they are signed.

Chapter 15: Inflation and Aggregate Supply Slide 18
MB MC
Copyright c 2004 by The McGraw-HillCompanies, Inc. All rights reserved.
The Output Gap and Inflation
Relationship of outputto potential output Behavior of inflation
1. No output gap Inflation remains unchangedY = Y*
2. Expansionary gap Inflation rises
Y > Y*
3. Recessionary gap Inflation falls
Y < Y*

Chapter 15: Inflation and Aggregate Supply Slide 19
MB MC
Copyright c 2004 by The McGraw-HillCompanies, Inc. All rights reserved.
Inflation andAggregate Supply
The Output Gap and InflationIf Y* = Y
An increase in exogenous spending creates and expansionary gap (Y > Y*) – inflation increases
A decrease in exogenous spending creates a recessionary gap (Y < Y*) and inflation decreases

Chapter 15: Inflation and Aggregate Supply Slide 20
MB MC
Copyright c 2004 by The McGraw-HillCompanies, Inc. All rights reserved.
Inflation andAggregate Supply
The Aggregate Demand—Aggregate Supply DiagramLong-run aggregate supply (LRAS)
A vertical line showing the economy’s potential output Y*

Chapter 15: Inflation and Aggregate Supply Slide 21
MB MC
Copyright c 2004 by The McGraw-HillCompanies, Inc. All rights reserved.
Inflation andAggregate Supply
The Aggregate Demand—Aggregate Supply DiagramShort-run Aggregate Supply (SRAS)
A horizontal line showing the current rate of inflation, as determined by past expectations and pricing decisions

Chapter 15: Inflation and Aggregate Supply Slide 22
MB MC
Copyright c 2004 by The McGraw-HillCompanies, Inc. All rights reserved.
Inflation andAggregate Supply
The Aggregate Demand—Aggregate Supply DiagramShort-run Equilibrium
A situation in which inflation equals the value determined by past expectations and pricing decisions and output equals the level of short-run equilibrium output that is consistent with that inflation rate
Graphically, short-run equilibrium occurs at the intersection of the AD curve and the SRAS line

Chapter 15: Inflation and Aggregate Supply Slide 23
MB MC
Copyright c 2004 by The McGraw-HillCompanies, Inc. All rights reserved.
The Aggregate Demand-Aggregate Supply (AD-AS) Diagram
Output
Infl
atio
n π
Aggregate demand, AD
Long-run aggregate
supply, LRAS
A
Y*Y
Short-run aggregate supply, SRAS
Short-run equilibrium•Y: SRAS() = AD•Y < Y* -- recessionary gap and Y adjust to the gap
decreases & Y increases
Long-run equilibrium• AD, SRAS (*), LRAS (Y*)
will intersect at the same point

Chapter 15: Inflation and Aggregate Supply Slide 24
MB MC
Copyright c 2004 by The McGraw-HillCompanies, Inc. All rights reserved.
Inflation andAggregate Supply
The Aggregate Demand—Aggregate Supply DiagramLong-run Equilibrium
A situation in which actual output equals potential output and the inflation rate is stable
Graphically, long-run equilibrium occurs when the AD curve, the SRAS line, and the LRAS line all intersect at a single point

Chapter 15: Inflation and Aggregate Supply Slide 25
MB MC
Copyright c 2004 by The McGraw-HillCompanies, Inc. All rights reserved.
Inflation andAggregate Supply
A Review of the Adjustment Process to a Recessionary GapFirms that are selling less than they want
to will start to lower prices.As falls the Fed lowers r and AD
increases.Falling reduces uncertainty which also
increases AD
Chapter 15: Inflation and Aggregate Supply Slide 26
MB MC
Copyright c 2004 by The McGraw-HillCompanies, Inc. All rights reserved.
Inflation andAggregate Supply
A Review of the Adjustment Process to a Recessionary GapAs Y increases, cyclical unemployment
falls (Okun’s Law)Adjustment continues until long-run
equilibrium is reached.

Chapter 15: Inflation and Aggregate Supply Slide 27
MB MC
Copyright c 2004 by The McGraw-HillCompanies, Inc. All rights reserved.
The Adjustment of Inflation When A Recessionary Gap Exists
Output
Infl
atio
n
AD
LRAS
A
Y
SRAS
Y*
SRAS’B
*

Chapter 15: Inflation and Aggregate Supply Slide 28
MB MC
Copyright c 2004 by The McGraw-HillCompanies, Inc. All rights reserved.
The Adjustment of Inflation When A Expansionary Gap Exists
Output
Infl
atio
nLong-run aggregate
supply LRAS
A
AD
Y* Y
SRAS
B
Short-run Eq. Y•Expansionary gap Y > Y* rises, AD falls – Y falls•Long-run equilibrium at Y*, *
* SRAS’

Chapter 15: Inflation and Aggregate Supply Slide 29
MB MC
Copyright c 2004 by The McGraw-HillCompanies, Inc. All rights reserved.
Inflation andAggregate Supply
The Self-Correcting EconomyIn the long-run the economy tends to be
self-correcting.The Keynesian model does not include a
self-correcting mechanism.

Chapter 15: Inflation and Aggregate Supply Slide 30
MB MC
Copyright c 2004 by The McGraw-HillCompanies, Inc. All rights reserved.
Inflation andAggregate Supply
The Self-Correcting EconomyThe Keynesian model concentrates on the
short-run with no price adjustment.The self-correcting mechanism
concentrates on the long-run with price adjustments.
Chapter 15: Inflation and Aggregate Supply Slide 31
MB MC
Copyright c 2004 by The McGraw-HillCompanies, Inc. All rights reserved.
Inflation andAggregate Supply
The Self-Correcting EconomyA slow self-correcting mechanism
Fiscal and monetary policy can help stabilize the economy.
A fast self-correcting mechanismFiscal and monetary policy are not effective
and may destabilize the economy.
Chapter 15: Inflation and Aggregate Supply Slide 32
MB MC
Copyright c 2004 by The McGraw-HillCompanies, Inc. All rights reserved.
Inflation andAggregate Supply
The Self-Correcting EconomyThe speed of correction will depend on:
The use of long-term contracts.The efficiency and flexibility of labor markets.
Fiscal and monetary policy are most useful when attempting to eliminate large output gaps.

Chapter 15: Inflation and Aggregate Supply Slide 33
MB MC
Copyright c 2004 by The McGraw-HillCompanies, Inc. All rights reserved.
War and Military Buildup As A Source of Inflation
Output
Infl
atio
n
Output
Infl
atio
n
Y
B
AD’
Y
B
AD’
•Increase in military spending causes AD to increase•Creates an expansionary gap -- Y > Y*
AD
LRAS
A
Y*
SRAS
LRAS
A
Y*
SRAS
’SRAS’C
increases shifting SRAS to SRAS’•Long-run equilibrium back to Y* with *
Chapter 15: Inflation and Aggregate Supply Slide 34
MB MC
Copyright c 2004 by The McGraw-HillCompanies, Inc. All rights reserved.
Sources of Inflation
What Do You Think?Does the Fed have the power to prevent
the increased inflation that is induced by a rise in military spending?
Hint: Can the Fed reduce AD?
Chapter 15: Inflation and Aggregate Supply Slide 35
MB MC
Copyright c 2004 by The McGraw-HillCompanies, Inc. All rights reserved.
Sources of Inflation
What Do You Think?What is the cost of avoiding inflation during
a military buildup?

Chapter 15: Inflation and Aggregate Supply Slide 36
MB MC
Copyright c 2004 by The McGraw-HillCompanies, Inc. All rights reserved.
Sources of Inflation
Economic NaturalistHow did inflation get started in the United
States in the 1960s?1959-63 inflation averaged about 1%By 1970 inflation was 7%

Chapter 15: Inflation and Aggregate Supply Slide 37
MB MC
Copyright c 2004 by The McGraw-HillCompanies, Inc. All rights reserved.
Sources of Inflation
Economic NaturalistHow did inflation get started in the United
States in the 1960s?Fiscal policy
o Increases in defense spending» 1965 = $50.6 billion or 7.4% of GDP» 1968 = $81.9 billion or 9.4% of GDP

Chapter 15: Inflation and Aggregate Supply Slide 38
MB MC
Copyright c 2004 by The McGraw-HillCompanies, Inc. All rights reserved.
Sources of Inflation
Economic NaturalistHow did inflation get started in the United
States in the 1960s?Fiscal policy
o Increased spending on Great Society and war on poverty initiatives
Monetary policyo The Fed did not try to offset the increase in
government spending

Chapter 15: Inflation and Aggregate Supply Slide 39
MB MC
Copyright c 2004 by The McGraw-HillCompanies, Inc. All rights reserved.
Sources of Inflation
Inflation ShockA sudden change in the normal behavior of
inflation, unrelated to the nation’s output gap

Chapter 15: Inflation and Aggregate Supply Slide 40
MB MC
Copyright c 2004 by The McGraw-HillCompanies, Inc. All rights reserved.
Sources of Inflation
Inflation Shock -- ExamplesOPEC embargo of 1973Drop in oil prices in 1986

Chapter 15: Inflation and Aggregate Supply Slide 41
MB MC
Copyright c 2004 by The McGraw-HillCompanies, Inc. All rights reserved.
Sources of Inflation
Economic NaturalistWhy did inflation escalate in the United
States in the 1970s?
Chapter 15: Inflation and Aggregate Supply Slide 42
MB MC
Copyright c 2004 by The McGraw-HillCompanies, Inc. All rights reserved.
The Effects of An Adverse Inflation Shock
Output
Infl
atio
n
AD’
C
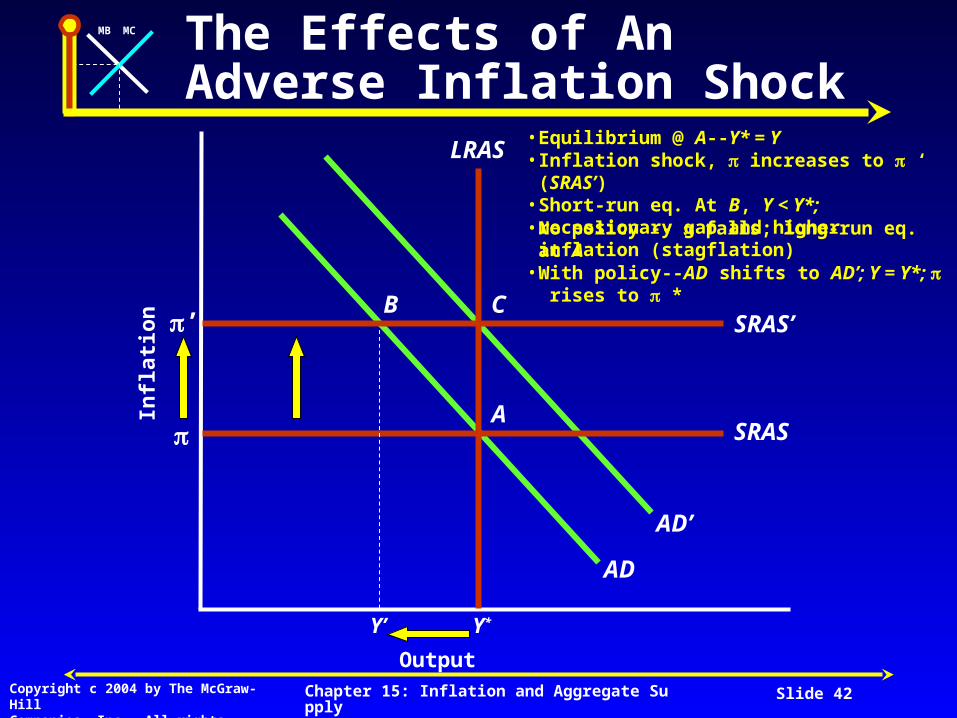
• No policy -- falls; long-run eq. at A• With policy--AD shifts to AD’; Y = Y*; rises
to *
AD
LRAS
A
Y*
SRAS
• Equilibrium @ A--Y* = Y
Y’
BSRAS’
• Inflation shock, increases to ‘ (SRAS’)• Short-run eq. At B, Y < Y*; recessionary gap
and higher inflation (stagflation)
’

Chapter 15: Inflation and Aggregate Supply Slide 43
MB MC
Copyright c 2004 by The McGraw-HillCompanies, Inc. All rights reserved.
Sources of Inflation
ObservationSustained inflation is possible only if
monetary policy is sufficiently expansionary.

Chapter 15: Inflation and Aggregate Supply Slide 44
MB MC
Copyright c 2004 by The McGraw-HillCompanies, Inc. All rights reserved.
The Effects of a Shock To Potential Output
Output
Infl
atio
n
AD
LRAS
A
Y*
SRAS
•Equilibrium at A -- Y* = Y
Y*’
BSRAS’
LRAS’ •Y* falls to Y*’•Y > Y* -- expansionary gap increases--SRAS rises to SRAS’•Equilibrium at B
•Y = Y*’ increased to ‘ •Decline in output is permanent
’

Chapter 15: Inflation and Aggregate Supply Slide 45
MB MC
Copyright c 2004 by The McGraw-HillCompanies, Inc. All rights reserved.
Sources of Inflation
Aggregate Supply ShockEither an inflation shock or a shock to
potential outputAdverse aggregate supply shocks of both
types reduce output and increase inflation

Chapter 15: Inflation and Aggregate Supply Slide 46
MB MC
Copyright c 2004 by The McGraw-HillCompanies, Inc. All rights reserved.
Sources of Inflation
Shocks to Potential OutputAggregate supply shock
Inflation shockso Stagflationo Temporary reduction in output
Chapter 15: Inflation and Aggregate Supply Slide 47
MB MC
Copyright c 2004 by The McGraw-HillCompanies, Inc. All rights reserved.
Sources of Inflation
Shocks to Potential OutputAggregate supply shock
Potential output shockso Stagflationo Permanent reduction in output

Chapter 15: Inflation and Aggregate Supply Slide 48
MB MC
Copyright c 2004 by The McGraw-HillCompanies, Inc. All rights reserved.
Sources of Inflation
Economic NaturalistWhy was the United States able to
experience rapid growth and low inflation in the latter part of the 1990s?

Chapter 15: Inflation and Aggregate Supply Slide 49
MB MC
Copyright c 2004 by The McGraw-HillCompanies, Inc. All rights reserved.
U.S. Macroeconomic Data, Annual Averages, 1985-2000
% Growth in Unemployment Inflation ProductivityYears real GDP rate (%) rate (%) growth (%)
1985-1995 2.8 6.3 3.5 1.4
1995-2000 4.0 4.6 2.4 2.5

Chapter 15: Inflation and Aggregate Supply Slide 50
MB MC
Copyright c 2004 by The McGraw-HillCompanies, Inc. All rights reserved.
Economic Naturalist
Output
Infl
atio
n
AD
•Equilibrium at B -- Y*’ = Y
Y*’
BSRAS’
LRAS’
’
LRAS
A
Y*
SRAS
•Productivity increases•Y*’ shifts to Y*•Recessionary gap -- Y*’ < Y* falls to •Equilibrium at A
•Lower inflation; higher output
Chapter 15: Inflation and Aggregate Supply Slide 51
MB MC
Copyright c 2004 by The McGraw-HillCompanies, Inc. All rights reserved.
AD
LRAS
A
Y*
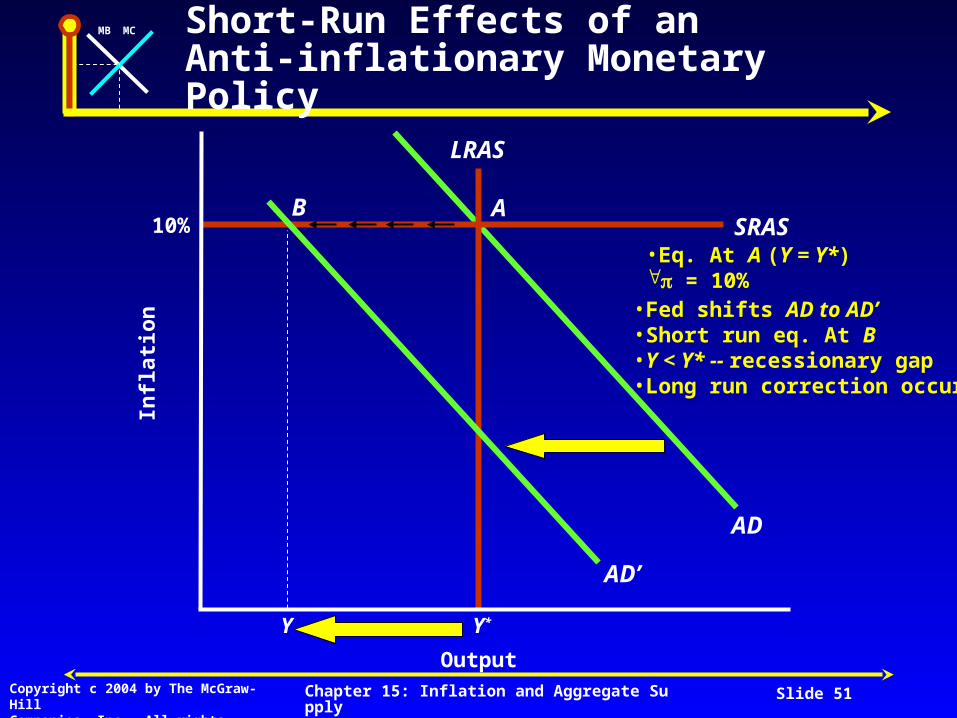
SRAS10%•Eq. At A (Y = Y*) = 10%
Short-Run Effects of an Anti-inflationary Monetary Policy
Output
Infl
atio
n
Y
B
AD’
•Fed shifts AD to AD’•Short run eq. At B•Y < Y* -- recessionary gap•Long run correction occurs

Chapter 15: Inflation and Aggregate Supply Slide 52
MB MC
Copyright c 2004 by The McGraw-HillCompanies, Inc. All rights reserved.
Long-Run Effects of an Anti-inflationary Monetary Policy
Output
Y*
Infl
atio
nLRAS
C
Y
SRASB
AD’
10%
•Short-run eq. at B•Recessionary gap -- Y < Y*
SRAS’3%
falls to 3% and Y rises to Y*•Long-run eq. -- lower prices @ Y*
Chapter 15: Inflation and Aggregate Supply Slide 53
MB MC
Copyright c 2004 by The McGraw-HillCompanies, Inc. All rights reserved.
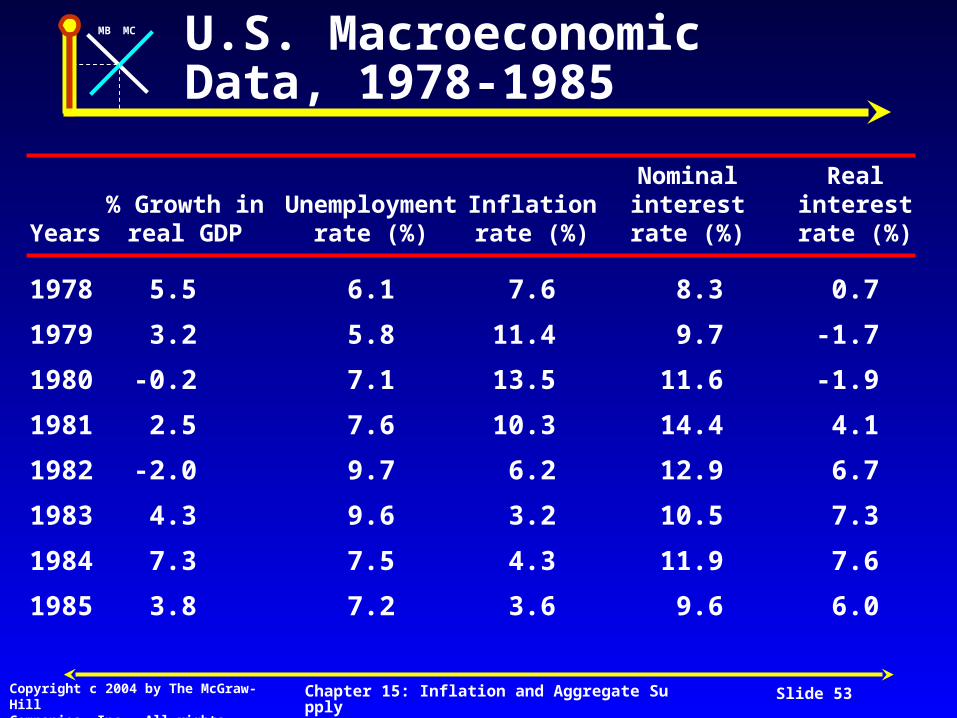
U.S. MacroeconomicData, 1978-1985
Nominal Real% Growth in Unemployment Inflation interest interest
Years real GDP rate (%) rate (%) rate (%) rate (%)
1978 5.5 6.1 7.6 8.3 0.7
1979 3.2 5.8 11.4 9.7 -1.7
1980 -0.2 7.1 13.5 11.6 -1.9
1981 2.5 7.6 10.3 14.4 4.1
1982 -2.0 9.7 6.2 12.9 6.7
1983 4.3 9.6 3.2 10.5 7.3
1984 7.3 7.5 4.3 11.9 7.6
1985 3.8 7.2 3.6 9.6 6.0
Chapter 15: Inflation and Aggregate Supply Slide 54
MB MC
Copyright c 2004 by The McGraw-HillCompanies, Inc. All rights reserved.
Sources of Inflation
Economic NaturalistCan inflation be too low?

MB MC
End ofChapterEnd of
Chapter