Embed Size (px)
Citation preview

UNIVERSITY OF ZAGREB - FACULTY OF GEODESY
Institute of Applied Geodesy; Chair of Spatial Information Management Kačićeva 26; HR-10000 Zagreb, CROATIA
Web: www.upi.geof.hr; Phone.: (+385 1) 46 39 222; Fax.: (+385 1) 48 28 081
Master Study of Geodesy and Geoinformatics
Specialization: Geoinformatics
MASTER THESIS
The Role of Geoinformation in Crisis Situations
Author:
Marina Giljanović
Mike Tripala 4
21000 Split
Supervisors:
assoc. prof. dr. sc. Vlado Cetl
prof. dr. eng. Temenoujka Bandrova
Zagreb, September 2015

2
I. Author
Name: Marina Giljanović
Date and place of birth: January 12th 1992
II. Master Thesis
Subject: Risk Management
Title: The Role of Geoinformation in Crisis Situations
Supervisors: assoc. prof. dr. sc. Vlado Cetl
prof. dr. eng. Temenoujka Bandrova
III. Grade and Defence
Date of theme assignment: January 19th 2015
Date of thesis defence: September 18th 2015
Defence committee members: assoc. prof. dr. sc. Vlado Cetl
prof. dr. sc. Siniša Mastelić – Ivić
dr.sc. Ana Kuveždić Divjak

3
Acknowledgments
I am thankful to my supervisor assoc. prof. dr. sc. Vlado Cetl for his guidance and
support during the creation of this thesis.
I am also thankful to prof. dr. eng. Temenoujka Bandrova and eng. Stefan
Bonchev from University of Architecture, Civil Engineering and Geodesy in Sofia,
Bulgaria for their assistance and patience, but also for the nice time spent with
them during my study visit abroad.
Last, but not least, thanks to my family, friends, teammates and colleagues for
being there for me during the past five years.

4
The Role of Geoinformation in Crisis Situations
Marina Giljanovi ć
Abstract: The topic of this thesis is the role of geoinformation in crisis situations, with special emphasis on 3D models. Different types of maps and mapping in all phases of crisis management are elaborated, as well as application of 3D models in crisis situations. The task of the practical part of the thesis was to produce a 3D cartographic model of part of Student town in Sofia, Bulgaria, as well as 3D symbols that can be used in crisis. The produced symbols are used for showing evacuation route in case of earthquake.
Keywords: crisis situations, maps, 3D model, 3D symbols
Uloga geoinfomacija u kriznim situacijama
Sažetak: Tema ovoga rada je uloga geoinfomacija u kriznim situacijama, s posebnim naglaskom na 3D modele. U radu su obrađene vrste karata i načini kartiranja u svim fazama upravljanja krizom, kao i primjene 3D modela u kriznim situacijama. Zadatak praktičnog dijela bio je izraditi 3D kartografskim model dijela Studentskog grada u Sofiji, u Bugarskoj, kao i 3D simbole koji se primjenjuju u kriznim situacijama. Primjena izrađenih simbola prikazana je na primjeru evakuacije u slučaju potresa.
Klju čne rije či: krizne situacije, karte, 3D model, 3D simboli

5
The Role of Geoinformation in Crisis Situations
Marina Giljanovi ć
T a b l e o f C o n t e n t s
1. INTRODUCTION ............................................................................................. 6
2. CRISIS SITUATION MANAGEMENT ............................................................. 7
2.1. DEFINITION OF TERMS .................................................................................. 7
2.2. CLASSIFICATION OF DISASTERS .................................................................... 8
2.2.1. Natural disasters ................................................................................. 9
2.2.2. Human – caused disasters ............................................................... 13
2.3. PHASES OF CRISIS MANAGEMENT ............................................................... 14
2.4. DISASTERS IN BULGARIA ............................................................................ 15
3. MAPS IN CRISIS SITUATIONS .................................................................... 19
3.1. THE ROLE OF MAP IN CRISIS ........................................................................ 19
3.2. TYPES OF MAPS USED IN CRISIS .................................................................. 20
3.2.1. Maps according to phase of crisis management ............................... 20
3.2.2. Web - maps in crisis ......................................................................... 23
3.2.3. 3D maps in crisis .............................................................................. 24
4. RISK ASSESSMENT AND MAPPING IN CRISIS MANAGEMENT ............. 27
4.1. RISK ASSESSMENT ..................................................................................... 27
4.2. MAPPING WITHIN CRISIS MANAGEMENT ....................................................... 29
4.3. COPERNICUS EMERGENCY MANAGEMENT SERVICE – MAPPING ..................... 34
5. 3D MODELS FOR THE NEEDS OF CRISIS MANAGEMENT ..................... 36
5.1. GENERALLY ABOUT 3D MODELS .................................................................. 36
5.2. APPLICATIONS OF 3D MODELS IN CRISIS SITUATIONS ..................................... 38
6. 3D CARTOGRAPHIC MODELING OF STUDENT TOWN ........................... 42
6.1. STUDY AREA.............................................................................................. 42
6.2. SOFTWARE FOR 3D MODELING .................................................................... 42
6.3. DATA SOURCE ........................................................................................... 43
6.4. THE CREATION OF 3D MODEL ...................................................................... 44
6.5. 3D MODEL OF STUDENT POLYCLINIC ........................................................... 46
6.6. 3D SYMBOLS FOR CRISIS MANAGEMENT ....................................................... 49
6.7. VISUALIZATION IN GOOGLE EARTH .............................................................. 54
6.8. CONTENT OF ATTACHED MEDIA (CD, DVD) .................................................. 57
7. CONCLUSION .............................................................................................. 58
References
URL List
List of Figures
CV
6
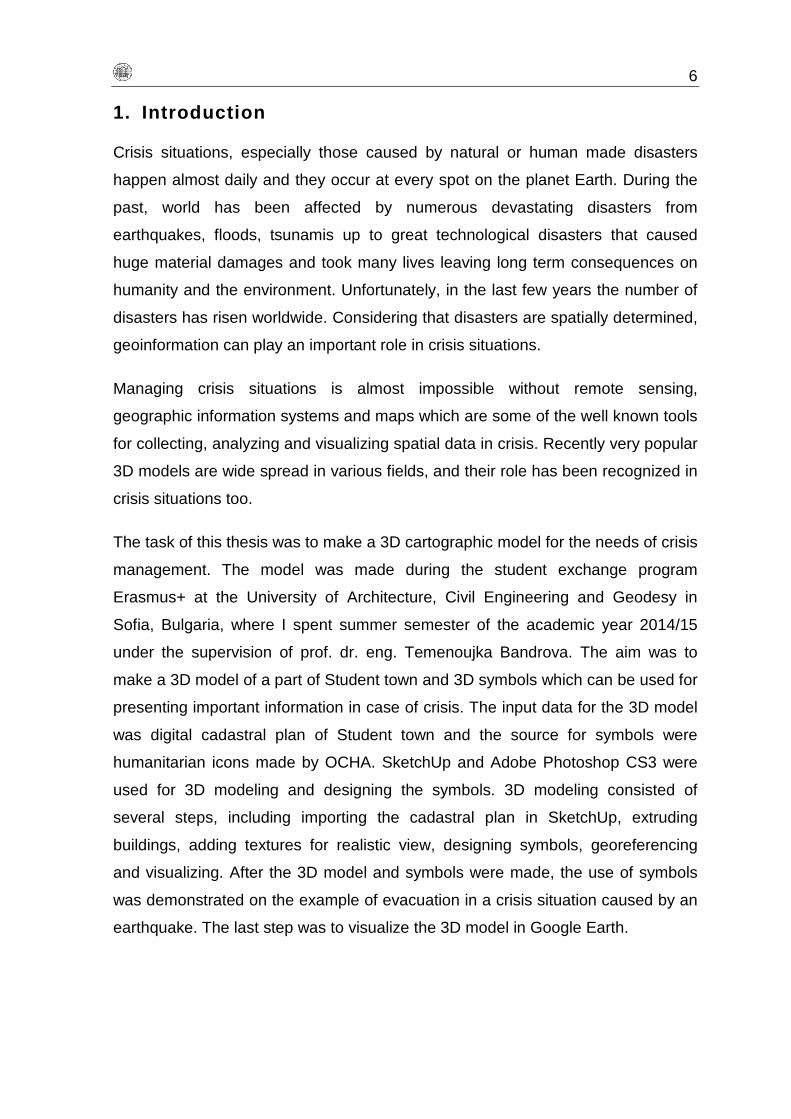
1. Introduction
Crisis situations, especially those caused by natural or human made disasters
happen almost daily and they occur at every spot on the planet Earth. During the
past, world has been affected by numerous devastating disasters from
earthquakes, floods, tsunamis up to great technological disasters that caused
huge material damages and took many lives leaving long term consequences on
humanity and the environment. Unfortunately, in the last few years the number of
disasters has risen worldwide. Considering that disasters are spatially determined,
geoinformation can play an important role in crisis situations.
Managing crisis situations is almost impossible without remote sensing,
geographic information systems and maps which are some of the well known tools
for collecting, analyzing and visualizing spatial data in crisis. Recently very popular
3D models are wide spread in various fields, and their role has been recognized in
crisis situations too.
The task of this thesis was to make a 3D cartographic model for the needs of crisis
management. The model was made during the student exchange program
Erasmus+ at the University of Architecture, Civil Engineering and Geodesy in
Sofia, Bulgaria, where I spent summer semester of the academic year 2014/15
under the supervision of prof. dr. eng. Temenoujka Bandrova. The aim was to
make a 3D model of a part of Student town and 3D symbols which can be used for
presenting important information in case of crisis. The input data for the 3D model
was digital cadastral plan of Student town and the source for symbols were
humanitarian icons made by OCHA. SketchUp and Adobe Photoshop CS3 were
used for 3D modeling and designing the symbols. 3D modeling consisted of
several steps, including importing the cadastral plan in SketchUp, extruding
buildings, adding textures for realistic view, designing symbols, georeferencing
and visualizing. After the 3D model and symbols were made, the use of symbols
was demonstrated on the example of evacuation in a crisis situation caused by an
earthquake. The last step was to visualize the 3D model in Google Earth.

7
2. Crisis Situation Management
A crisis situation is every event that deviates from normal circumstances. Those
are mostly unexpected, unstable and dangerous situations which require
emergency intervention, and can leave negative consequences on society,
property and the environment. In this thesis, crisis situations refer to natural and
human-caused disasters.
2.1. Definition of Terms
A disaster can be defined in various ways. However, all of them are related to
natural and human caused events that result in loss of life, injury or other health
impacts, property damage, loss of livelihoods and services, social and economic
disruption, or environmental damage.
The United Nations for Disaster Risk Reduction defines disaster as a serious
disruption of the functioning of a community or a society involving widespread
human, material, economic or environmental losses and impacts, which exceeds
the ability of the affected community or society to cope using its own resources.
According to International Federation of Red Cross and Red Crescent Societies, a
disaster is combination of hazard, vulnerability and capacity of society to cope with
negative consequences of hazard events.
(VULNERABILITY+ HAZARD ) / CAPACITY = DISASTER
Hazard refers to every phenomenon, substance, human activity or condition that
may have negative consequences on people, property, environment, economy
and society. It can arise from a variety of geological, meteorological, hydrological,
oceanic, biological, and technological sources, sometimes acting in combination.
Vulnerability describes the susceptibility of community to disaster arising from
different physical, social, economic, and environmental factors like insufficient
level of information and awareness of people, poor construction of buildings,
inadequate protection of assets etc. Vulnerability varies significantly within
community and over time.
Coping capacity is ability to deal with emergency situations and react when
disaster happens. Coping capacities contribute to the reduction of disaster risks.
8
Early warning system is used for timely and profound warning people and
communities at risk in a threatened region in order to prepare and respond to a
disaster and thus reduce the possibility of harm and losses. Early warning system
necessarily comprises four key elements: knowledge of the risks; monitoring,
analysis and forecasting of the hazards; communication or dissemination of alerts
and warnings; and local capabilities to respond to the warnings received.
Mentioned definitions are according to UNISDR terminology (2009).
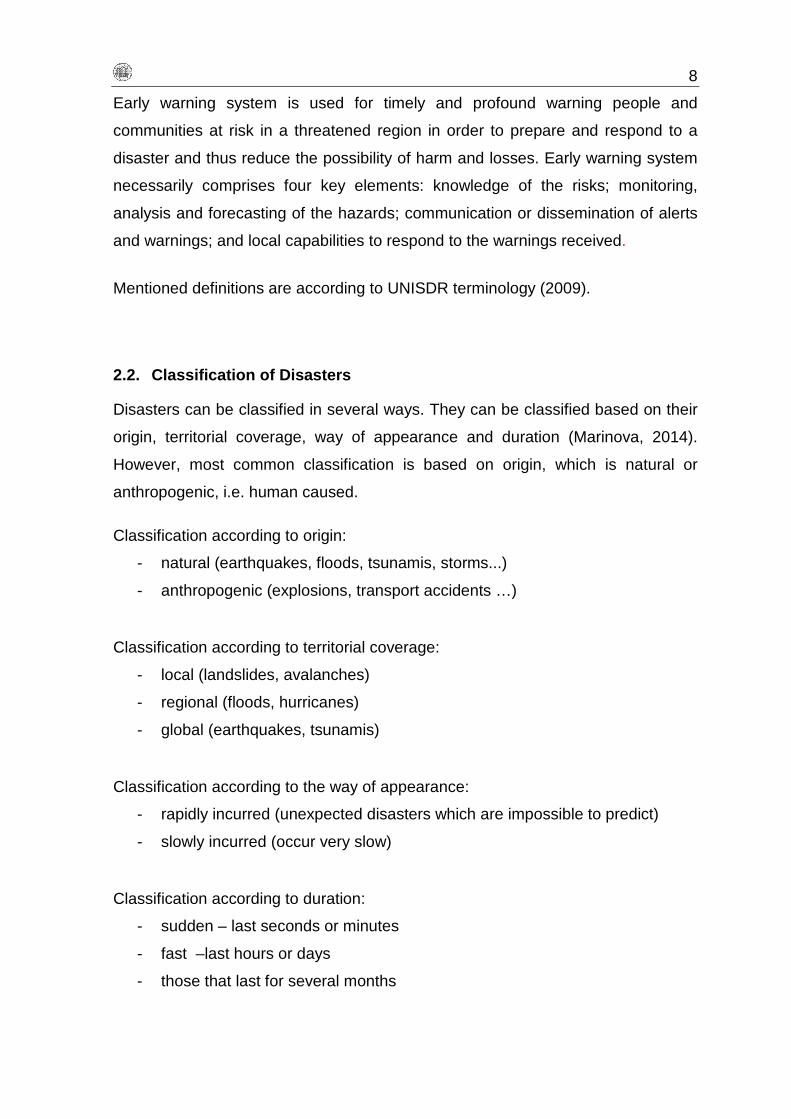
2.2. Classification of Disasters
Disasters can be classified in several ways. They can be classified based on their
origin, territorial coverage, way of appearance and duration (Marinova, 2014).
However, most common classification is based on origin, which is natural or
anthropogenic, i.e. human caused.
Classification according to origin:
- natural (earthquakes, floods, tsunamis, storms...)
- anthropogenic (explosions, transport accidents …)
Classification according to territorial coverage:
- local (landslides, avalanches)
- regional (floods, hurricanes)
- global (earthquakes, tsunamis)
Classification according to the way of appearance:
- rapidly incurred (unexpected disasters which are impossible to predict)
- slowly incurred (occur very slow)
Classification according to duration:
- sudden – last seconds or minutes
- fast –last hours or days
- those that last for several months

9
2.2.1. Natural disasters
Natural disasters are result of natural hazards whose consequences have an
impact on humanity, property and the environment. During the past, the number of
natural disasters has increased which can be attributed to climate change, people
growth and economic development.
According to EM - DAT, the number of natural disasters is 6873 including 1.35
million of deaths in the period of 1994 - 2013. Natural disasters hit every continent,
however the most affected was Asia. When it comes to national level, the USA
and China were the most affected which can be due to size of their territory,
heterogenic landmasses and densely populated regions. The impact on humanity
depends on the type of hazard, location, duration, size and vulnerability of
population. Climate changes are the main reason why the number of natural
disasters has increased, but greater impact is a result of population growth and
economic development.
Earthquakes are by far the deadliest natural disasters including tsunamis, but less
frequent than storms and floods. The number of deaths caused by earthquakes
amounts 750 000 people, which represent 55% of total deaths caused by natural
disasters. Floods are the most frequent natural disasters, but less deadly than
earthquakes and storms. They include 43% of all natural disasters most often
occurring in Africa and Asia. Storms are the second most frequent and second
most deadly natural disasters which cause the greatest economic losses. One
billion of people were affected by drought in the specified period. It affected 25% of
population, mostly in Africa (41%), but it has a low mortality rate of 2%. The
frequency of disaster and caused effects, deaths and economic losses depend on
the income level of the country. Thus, 56% of natural disasters affected high and
upper middle income countries, causing 1/3 of all deaths while 43% of them are
the cause of 2/3 deaths in low and lower middle income countries. However, 90%
of total economic losses were in high and upper middle income countries (CRED,
2015).

10
Figure 1. Number of natural disasters per country for period 1994-2013
Natural disasters are classified based on their origin, which can be geophysical,
meteorological, hydrological, biological and climatological.
Geophysical disasters are earthquakes, volcanoes and mass movements
(landslides, avalanche, subsidence and rockfalls) which originate from the solid
earth. Meteorological disasters are caused by atmospheric processes and include
different types of storms (tropical storm, sandstorm, thunderstorm, blizzard,
tornado etc.). Hydrological disasters are a consequence of deviations of the water
cycle. The most frequent ones are floods, but also wet mass movements.
Climatological disasters are extreme temperature (heat and cold wave), drought
and wildfires incurred by long - term processes as a result of climate changes.
Biological disasters include various types of infectious diseases caused by viruses,
bacteria, parasites, fungi and prions, then insect infestation and animal stampede
(URL 1).
The most frequent natural hazards such as earthquakes, floods, landslides,
storms, tsunamis, avalanches and wildfires are further explained in the text bellow.
11
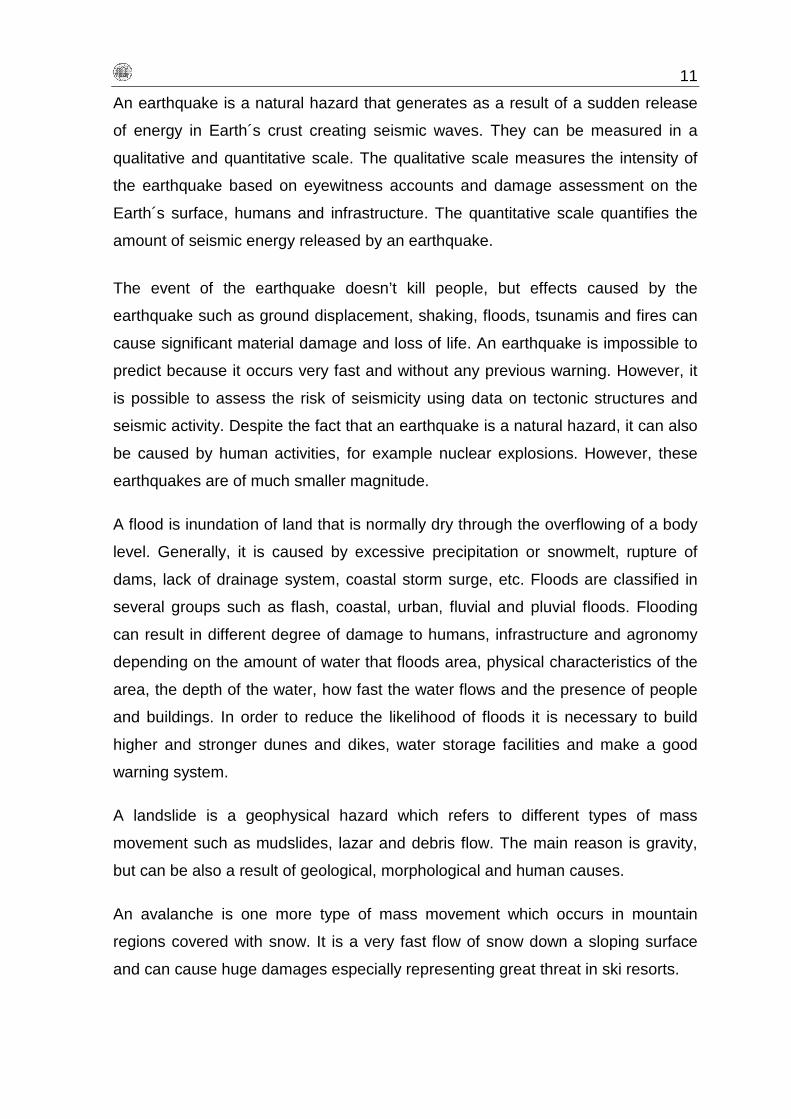
An earthquake is a natural hazard that generates as a result of a sudden release
of energy in Earth´s crust creating seismic waves. They can be measured in a
qualitative and quantitative scale. The qualitative scale measures the intensity of
the earthquake based on eyewitness accounts and damage assessment on the
Earth´s surface, humans and infrastructure. The quantitative scale quantifies the
amount of seismic energy released by an earthquake.
The event of the earthquake doesn’t kill people, but effects caused by the
earthquake such as ground displacement, shaking, floods, tsunamis and fires can
cause significant material damage and loss of life. An earthquake is impossible to
predict because it occurs very fast and without any previous warning. However, it
is possible to assess the risk of seismicity using data on tectonic structures and
seismic activity. Despite the fact that an earthquake is a natural hazard, it can also
be caused by human activities, for example nuclear explosions. However, these
earthquakes are of much smaller magnitude.
A flood is inundation of land that is normally dry through the overflowing of a body
level. Generally, it is caused by excessive precipitation or snowmelt, rupture of
dams, lack of drainage system, coastal storm surge, etc. Floods are classified in
several groups such as flash, coastal, urban, fluvial and pluvial floods. Flooding
can result in different degree of damage to humans, infrastructure and agronomy
depending on the amount of water that floods area, physical characteristics of the
area, the depth of the water, how fast the water flows and the presence of people
and buildings. In order to reduce the likelihood of floods it is necessary to build
higher and stronger dunes and dikes, water storage facilities and make a good
warning system.
A landslide is a geophysical hazard which refers to different types of mass
movement such as mudslides, lazar and debris flow. The main reason is gravity,
but can be also a result of geological, morphological and human causes.
An avalanche is one more type of mass movement which occurs in mountain
regions covered with snow. It is a very fast flow of snow down a sloping surface
and can cause huge damages especially representing great threat in ski resorts.

12
Storm is the main type of meteorological disaster which also encompasses
tornados, hurricanes, blizzards, thunderstorms, dust storms, strong winds etc.
However, the most devastating from listed disasters are tornados and hurricanes.
A tornado, also known as a twister is a violent, dangerous, rotating column of air
that is in contact with both the surface of the earth and a cumulonimbus cloud or,
in rare cases, the base of a cumulus cloud. A hurricane or a tropical cyclone is an
area of closed circular fluid motion rotating. It is characterized by low pressure
center, strong winds and a spiral arrangement of thunderstorm that produce heavy
rain.
A tsunami is a series of huge waves in the ocean usually caused by undersea
earthquakes, but can be also by a volcanic eruption or an underwater explosion or
a landslide. Sometimes waves reach a height of over 30 meters and cause
massive damage when they crash ashore. The Pacific Ocean´s “Ring of Fire” is a
geologically active area where most of the tsunamis occur. Tsunami warning
systems are used in areas with huge risk of tsunamis to warn people so they can
escape before it hits the coast.
A drought is deficiency in water supply in some area during a longer period. It can
last for a few months or even years and it is usually consequence of a lack of
precipitation. It has the greatest impact on the ecosystem and agriculture and can
cause huge economic losses, environmental, health and social consequences.
A wildfire refers to every uncontrolled fire caused by lightening, volcanic eruption,
sparks from rockfalls or human activities (cigarettes, grill). Although fires are
usually caused by people, weather conditions like dry weather, drought, warm
temperatures and strong winds enable that a single spark can trigger a huge fire
which spreads rapidly causing deaths of people, material damage, destroying the
wildlife and has bad influence on the global ecosystem and air quality.
13
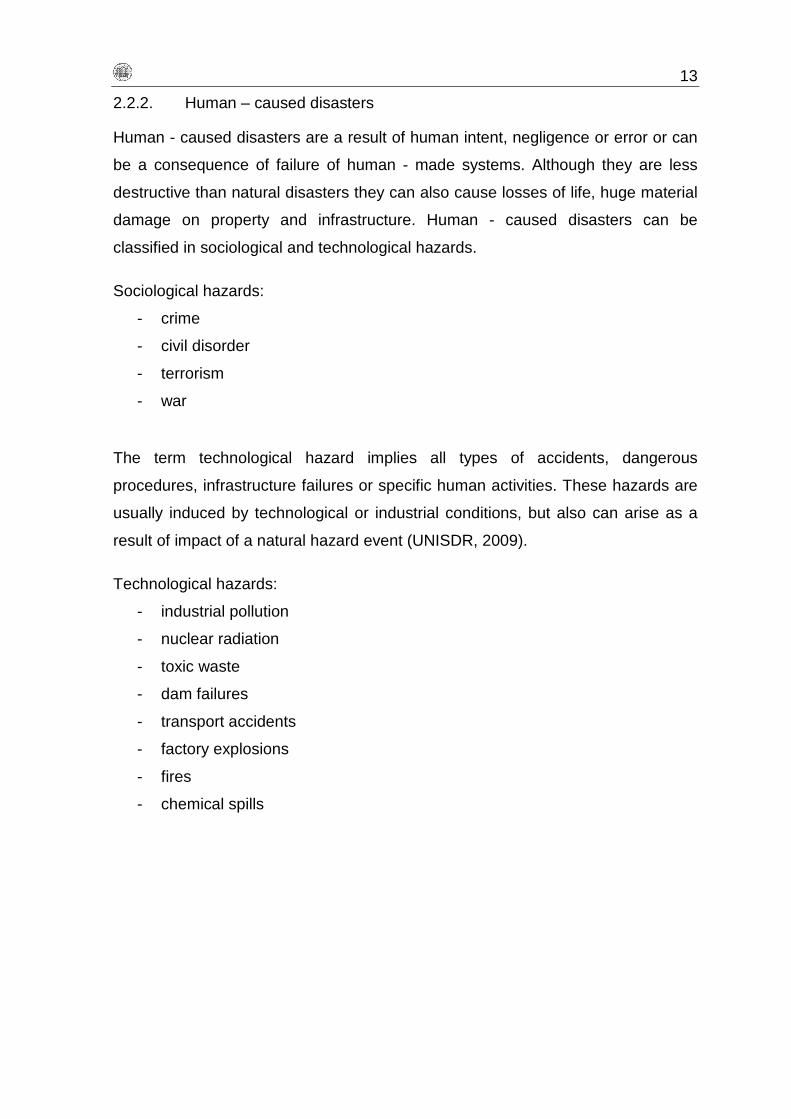
2.2.2. Human – caused disasters
Human - caused disasters are a result of human intent, negligence or error or can
be a consequence of failure of human - made systems. Although they are less
destructive than natural disasters they can also cause losses of life, huge material
damage on property and infrastructure. Human - caused disasters can be
classified in sociological and technological hazards.
Sociological hazards:
- crime
- civil disorder
- terrorism
- war
The term technological hazard implies all types of accidents, dangerous
procedures, infrastructure failures or specific human activities. These hazards are
usually induced by technological or industrial conditions, but also can arise as a
result of impact of a natural hazard event (UNISDR, 2009).
Technological hazards:
- industrial pollution
- nuclear radiation
- toxic waste
- dam failures
- transport accidents
- factory explosions
- fires
- chemical spills

14
2.3. Phases of Crisis Management
Disasters usually occur unexpectedly and very fast, so without an early warning
system and good protection measures it is very difficult to avoid an adverse impact
on humanity, assets and the environment. That requires activities before, after and
during the crisis situation.
Crisis management consists of four phases: mitigation, preparedness, response
and recovery (Figure 2). Each of these phases has its own tasks and has to be
carefully planned and well organized to react in time and in an appropriate way.
Figure 2. Phases of Crisis Management
The main goal of the mitigation phase is to reduce and eliminate the adverse
impact of hazards. Very often these impacts can’t be fully prevented, but it is
possible to substantially lessen their severity and scale using various activities.
This includes mitigation measures like engineering techniques and hazard
resistant construction as well as improved environmental policies and public
awareness.
Preparedness refers to knowledge and capacities developed to anticipate,
respond and recover the imminent or current hazard events. In this phase,
cooperation of the government, professional organizations, the community and
individuals is very important so they can develop plans to save lives and minimize
disaster damage. Preparedness measures include emergency training, warning
systems, evacuation plans, resources inventories, public education etc.

15
Once disaster occurs, it is important to provide immediate assistance to a victim
which is a task of the response phase. It is essentially to supply them with
provision of food, water, shelter, medical care in order to prevent further losses.
The last phase of disaster management is recovery, when disaster is under control
and the affected population is capable to take over all activities aimed at restoring
their lives. Thus, during this phase it is necessary to enhance prevention, increase
preparedness and reduce vulnerability. This phase lasts until the system returns to
normal or better (UNISDR, 2009).
2.4. Disasters in Bulgaria
As already mentioned, disasters occur everywhere and no country is spared from
influence of a disaster. The only difference is that some are more and some are
less vulnerable to disaster depending on geographical and socio-economic
characteristic of a country. Bulgaria also wasn’t spared, and during the past
suffered from various disasters especially earthquakes and floods.
Bulgaria is a Southeastern European country settled at the Balkan Peninsula and
surrounded by five countries (Romania, Serbia, Greece, Turkey and the Republic
of Macedonia) and by the Black Sea to the east of the country. Despite the fact
that with the area of 110,990 km2 it belongs to territorially smaller countries,
Bulgaria is notable because of great diversity of its geographical and climate
characteristics. Bulgarian relief abounds with various topographic features such as
extensive lowlands, plains, hills, low and high mountains, many valleys and deep
gorges where continental and Mediterranean climate prevail. It is characterized
with a landscape ranging from the snow-capped peaks of Rila and Pirin in the
south-west, and of the Balkan Mountains, to the mild and sunny weather of the
Black Sea coast; from the typically continental Danubian Plain in the north, to the
strong Mediterranean influence in the valleys of Macedonia, and the lowlands in
the southernmost parts of Thrace.

16
Hilly country and plains are found in the south-east, along the Black Sea coast in
the east, and along Bulgaria’s main river, the Danube, in the north. Other major
rivers include the Struma and the Maritsa River in the south. There are around 260
glacial lakes situated in the Rila and Pirin mountains, several large lakes on the
Black Sea coast, and more than 2,200 dam lakes. Bulgaria comprises portions of
the classical regions of Thrace, Moesia and Macedonia.
Figure 3. Map of Bulgaria
In the past 50 years, Bulgaria was mostly affected by floods, but the majority of
deaths were caused by transport accidents. According to EM - DAT, in the period
between 1964 and 2014, floods occupy 35% of all happened disasters, but there
are also present extreme temperatures (17%), storms (15%), earthquakes (10%),
wildfires (6%) and landslides (2%). Industrial (4%) and transport (10%) accidents
dominate among human caused disasters while transport accidents caused the
highest number of deaths, even 39%.

17
0
20
40
60
80
100
120
140
160
Events count
Total deaths
Figure 4. Number of disaster events and caused death per disaster (1964-2014)
Bulgaria is a country with height seismic activity. 97 % of the territory is threatened
by earthquakes. The most dangerous zones are Kresna, Plovdiv, Sofia, Gorna
Oryahovitsa and Shabla with potential magnitude of 7.0 and higher (Karagyozov,
2012). Earthquakes in Bulgaria are caused by seismic activity of the country, but
also by seismic activity in neighboring countries and the Black Sea. Although
without devastating earthquakes in recent history, such as the one in Plovdiv in
1928 which caused 107 deaths and one in 1977 in the northern Bulgaria (Svishtov
and Ruse) which killed 20 people warn that Bulgaria is at risk of earthquakes in the
future (UN, 2008).
Bulgaria is more vulnerable to floods than to any other disaster due to climate
characteristics of the country. Floods in Bulgaria are result of rains, intensive snow
melting and rising of rivers. One of the worst flooding was in 2005 when 70% of
territory was affected and 31 people died. The first wave in July and the second
one in August caused together damage over USD 474 million (Karagyozov, 2012).
Bulgaria was also hit by European floods in 2006 and flood in 2012 in the territory
of Romania. Recent floods in June 2014 across northeastern Bulgaria caused 15
deaths. The most affected were province of Varna, Dobrich, Veliko Tarnovo and
Shumen.

18
Because of hilly and mountainous terrain, landslides are also common in Bulgaria.
In 1965, one major landslide occurred and killed 11 people in the Rila Mountain
(UN, 2008). Landslides are typical for the area of the Pre-Balkan mountain region,
Eastern Rhodopes, Pernik and Sofia valley (Karagyozov, 2012).
When it comes to human caused disasters, most common are transport accidents,
with 10%. But also, in near past, Bulgaria was affected with two industrial
catastrophes, in 2008 and 2014. The first one, Chelopechene explosion was 10
km far from center of Sofia, but no one died. In 2014, there was explosion in
factory in village near Gorni Lom in Bulgarian North West in which 15 people died.
Various organizations at global and national level act in order to reduce disasters
or respond properly when they occur. At global level those are, for example, UN
associations like The United Nation Office for Disaster Risk Reduction (UNISDR)
and Office for the Coordination of Humanitarian Affairs (OCHA). National disaster
management authority for Bulgaria since 2012 is Fire Safety and Civil Protection
Chief Directorate. The authority is national specialized structure of Ministry of
Interior for ensuring fire safety, rescue and protection in case of disaster.

19
3. Maps in Crisis Situations
During the crisis, whether caused by natural or human - caused disasters,
information related to the location is extremely important. The spatial information
like geographic areas affected or threatened by crisis, location of the shelters, the
nearest rescue services, places where affected population is, damaged and
passable roads are essential in a crisis for successful and timely response. All of
this information can be displayed on a map. However, map has role, not just
during the crisis, but also before and after crisis occurs.
3.1. The role of map in crisis
According to International Cartographic Association map is a symbolized image of
geographical reality, representing selected features or characteristics, resulting
from the creative effort of its author's execution of choices, and is designed for use
when spatial relationships are of primary relevance.
Usually, maps are used for navigation and orientation in the space and for finding
specific locations. In the crisis situations, map has two important roles. First is to
serve as communication tool and the second one as visualization tool. During or
immediately after a crisis, they serve all participants in crisis as means of
communication. In the phases before and after a crisis occurs they also serve to
assist their visual thought processes (Kuveždić Divjak, 2013).
Communication in crisis situations differs then communication under the normal
circumstances. During the crisis, panic prevails, and the lack of time disables
detailed planning and preparation so information which has to be transmitted is
devised urgently in order to reduce the time to respond and reduce potential
damages.
Communication is performed between the various actors of crisis. It can be carried
out between individuals and/or small groups, such as rescue services. For
example, ambulance, police, firefighters, crisis headquarters etc. Also,
communication can be focused towards the public, when information is transmitted
indirectly via mass and social media in which civilians and/or victims exchange
information (Kuveždić Divjak, 2013).

20
Maps used in a crisis are made with special purpose which is to communicate
predetermined messages like where are shelters for caring the population, how to
get to the place where assistance can be provided to the injured people, how to
properly act in the new situation, how to carry out the evacuation and similar
actions. Such communication can be the source of information to all participants in
the crisis and help to respond to the crisis and mitigate its consequences in order
for quick normalization of life in the affected area. In the period before crisis
occurs, the aim is to reduce the likelihood of crisis occurring or alleviate potential
damage. The role of maps used in that period is to disseminate the awareness
and information about the hazards which can affect the certain area. During or
immediately after the occurrence of a crisis, maps are the source of information to
all participants in the crisis and help to respond on crisis situation and mitigation of
consequences. After the crisis, maps which shows the affected area are used for
assess the caused damage and plan activities to be undertaken in order to return
the affected area to its original condition (Kuveždić Divjak, 2013).
3.2. Types of maps used in crisis
Different types of maps are used in crisis situations. If we consider the phase of
crisis situation management, maps can be classified based on time of their
production or on maps made before, during and after the crisis. Furthermore,
thanks to the development of technology and Internet possibilities, maps are
shared through web, so-called web maps which are very helpful in crisis. Besides
the traditional two-dimensional maps, there is an increasing popularity of 3D maps.
3.2.1. Maps according to phase of crisis management
Maps are present during the whole process of crisis management. Depends on
the phase of crisis, different types of maps can be produced. According to
Marinova (2014), three groups of maps can be distinguished, maps made before,
during and after crisis (Figure 5).

21
Figure 5. Types of maps in the period before, during and after crisis
Maps made before crisis will show dangerous area and potential consequences,
introduce and prepare residents with the potential risk and impacts and help to
train them how to avoid negative consequences. Several types of maps can be
produced in this period like hazard maps, risk maps, statistic data maps, forecast
maps and protection maps.
Hazard maps show potential of hazard occurring across a geographic area. They
differ according the type of hazard, so various types of hazard map can be
produced. Some of them are flood hazard map, seismic hazard map, landslide
hazard map etc. Also, hazard map can show a several hazards occurring across
a geographic area, so-called multi-hazard maps.
Figure 6. Seismic hazard map of Croatia

22
Risk maps display possible consequences across a geographic area. Statistic data
maps are used for analysis and evaluation of vulnerable area. Protection maps
show a critical infrastructure, services and rescue resources (Marinova, 2014).
When crisis occurs, maps are used to evaluate the situation and according to
conditions plan rescue and evacuation activities. Immediately after crisis event,
rapid maps are made and after few hours reference maps also. For example, after
tsunami in Japan in 2011, triggered by earthquake, rapid map was produced. The
map shows the areas that could have been affected by the tsunami, according to
JRC SWAN model which estimates the tsunami wave height (Figure 7). These
maps will provide insight into resulting situation so rescue maps can be produced.
Rescue maps will show evacuation routes.
Figure 7. Rapid map after tsunami in Japan
Maps also have important role in loss and damage assessment and during relief,
rehabilitation and recovery phases after a disaster. Damage assessment maps
can be made immediately after disaster, in the period of 24 hours after disaster or
more, and can be updated daily if it is necessary. They show total extent of
damage, damaged structures like roads, buildings etc. Recovery maps illustrate
the relief and rehabilitation activities.

23
Figure 8. Damage assessment map after earthquake in Haiti
3.2.2. Web - maps in crisis
One of the significant characteristics of web maps, especially important in crisis
situations, is the availability. Web allows to every user, who has Internet
connection to share or access any kind of data. It is one of the recent media for
display and dissemination of spatial data. Web maps are classified on static and
dynamic maps and both can be interactive and view only (Frančula, 2004).
In their paper, Kuveždić Divjak et al (2011) give an overview of cartographic
products in crisis situations, including web maps. Very often, in crisis, due to lack
of time and the need for fast exchange of information, existing maps are scanned
and published on the Internet. Such maps are static, and the only options are
zoom and pan, but also a quite illegible, because of very high density of
information. For static interactive web maps, a user initiates a certain actions or
select layers which lead to additional information and content such as images,
audio or video. This can give an insight into an affected area, show consequences
or other information that are important for crisis management.

24
Dynamic web map visualizes its content using animation and usually is used for
displaying some processes which have time characteristics. In crisis situation it
can be used for showing the spread of radiation gas and vapor. The National
Oceanic and Atmospheric Administration (NOAA) published interactive map which
shows data about past tsunamis sources like earthquakes and volcanoes and also
location where tsunami waves where observed (Figure 9). This can help better
understanding the past of tsunamis, where they occurred, how often and severity
in order to prepare for future events.
Figure 9. Natural hazard interactive map (URL 2)
3.2.3. 3D maps in crisis
According to Bandrova (2005) 3D map is computer, mathematical defined, three-
dimensional high realistic virtual representation of the world surface or other
heavenly body, the objects and phenomena in the nature and society. The
represented objects and phenomena are classified, designed and visualized
according the specific purpose. 3D maps are widespread and used for different
purposes. In crisis situations it is necessary to adapt the map to user´s cognitive
abilities and shorten the time necessary to extract required information from the
map (Bandrova et al, 2012). Because of the fact that 3D maps provide better
perspective view and easier understanding the cartographic content they can be
used in crisis situations.

25
Prepprnau and Bernhard (2015) claim that hazard maps featuring 3D models are
more intuitive to users than those using contour maps. Their research is based on
comparison of two types of volcanic hazard map, 2D contour line map and 3D
map. Using 3D map (Figure 10), users where able to more successfully read the
most important information like how the hazard interacts with the terrain and how
they can most quickly escape from it.
Figure 10. 3D Volcanic hazard map
The content of 3D map can be subdivided in three categories, main, secondary
and additional content. Main content consist of large topographic or landscape
objects such as relief bodies, roads and buildings. Secondary content provides
basic information about small objects like traffic lights, trees, transport elements,
information signs etc which are represented by symbols. Additional content
provides qualitative and quantitative information about objects which are created
and stored in a textual database, linked to each of designed objects or map as a
whole (Bandrova, 2005).

26
What will be included in 3D map indented for crisis management purposes
depends on several things. First of all, it is necessary to define who will use the
map, phase of crisis management, type of disaster and visualization (Bandrova et
al, 2012). Different types of users are involved in crisis management, from experts
to non-experts and all of them require understandable and clear information. Also,
role of map is different according to phase of crisis management and different
information should be shown according to that.
Then, level of detail is also important. 3D maps can be made in different levels of
details which depend on necessary amount of data needed for making decisions.
According to this, the main content is sufficient for visualization of flood or fire. The
secondary content will be included if it is necessary to make high level decisions,
and additional content will enable to make detail analysis (Bandrova et al, 2012).

27
4. Risk Assessment and Mapping in Crisis Management
4.1. Risk assessment
Predicting the potential consequences of disasters can help to determine activities
that need to start before the disaster strikes and reduce the impact of disaster. The
aim of risk assessment is to provide objective and transparent information that
help to determine levels of risk and to make decisions that require
countermeasures and priorities (Tiwai et al 2015).
According to ISO, risk is combination of consequences of hazards and the
associated likelihood of its occurrence. Consequences are negative adverse
effects of a disaster expressed as human impacts, economic and environmental
impacts and political/social impact.
Risk assessment is a methodology used to determine the nature and extent of risk
by analyzing potential hazards and evaluating existing conditions of vulnerability
that together could affect exposed people, property, livelihoods, environment etc
(UNISDR, 2009).
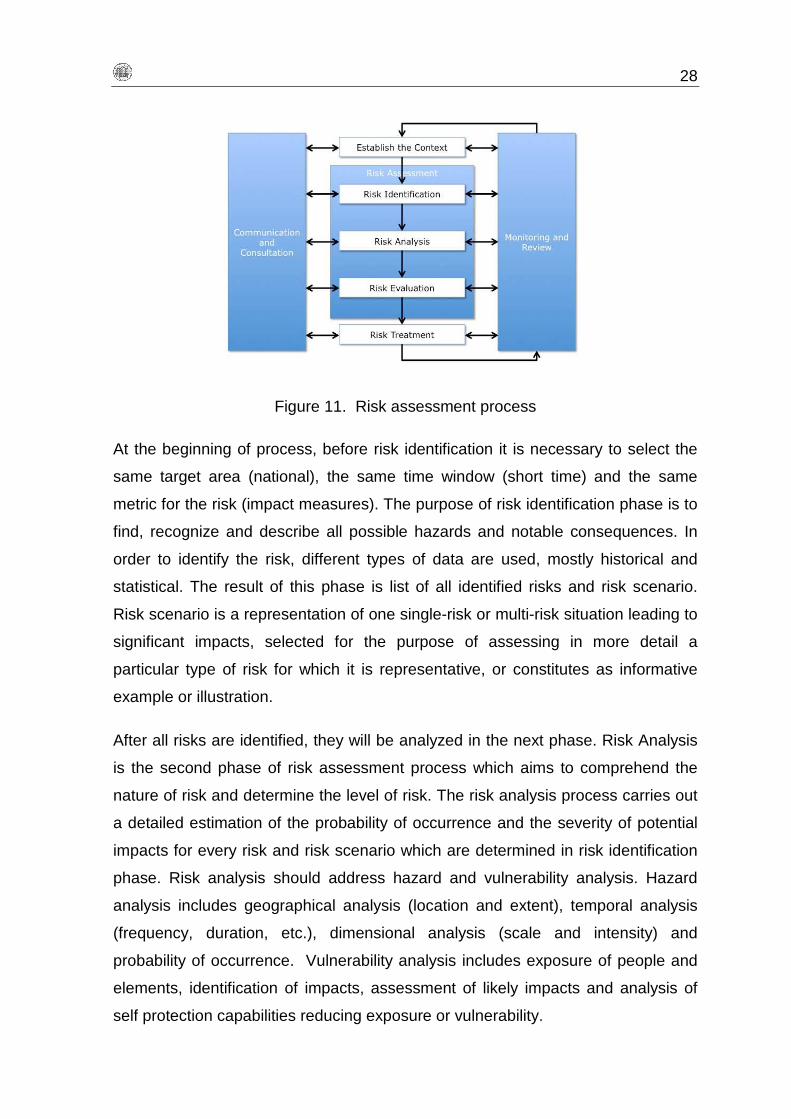
It is an overall process of risk identification, risk analysis and risk evaluation
(Figure 11). Normally, during the risk assessment process only one risk, i.e.
likelihood and consequences of one particular hazard in specific geographic area
is determined. But, sometimes it is necessary to determinate the total risk from
several hazards occurring at the same time or shortly following each other. They
can be dependent from one another like earthquake which cause tsunamis, or can
be caused by the same triggering event.
28
Figure 11. Risk assessment process
At the beginning of process, before risk identification it is necessary to select the
same target area (national), the same time window (short time) and the same
metric for the risk (impact measures). The purpose of risk identification phase is to
find, recognize and describe all possible hazards and notable consequences. In
order to identify the risk, different types of data are used, mostly historical and
statistical. The result of this phase is list of all identified risks and risk scenario.
Risk scenario is a representation of one single-risk or multi-risk situation leading to
significant impacts, selected for the purpose of assessing in more detail a
particular type of risk for which it is representative, or constitutes as informative
example or illustration.
After all risks are identified, they will be analyzed in the next phase. Risk Analysis
is the second phase of risk assessment process which aims to comprehend the
nature of risk and determine the level of risk. The risk analysis process carries out
a detailed estimation of the probability of occurrence and the severity of potential
impacts for every risk and risk scenario which are determined in risk identification
phase. Risk analysis should address hazard and vulnerability analysis. Hazard
analysis includes geographical analysis (location and extent), temporal analysis
(frequency, duration, etc.), dimensional analysis (scale and intensity) and
probability of occurrence. Vulnerability analysis includes exposure of people and
elements, identification of impacts, assessment of likely impacts and analysis of
self protection capabilities reducing exposure or vulnerability.
29
The last phase is risk evaluation in which results of risk analysis are compared
with risk criteria. Risk criteria are terms of reference against which the significance
of a risk is evaluated. It may include associated costs and benefits, legal
requirements, socioeconomic and environmental factors, concerns of
stakeholders, etc. Risk evaluation is used to determine whether significance of risk
is acceptable or should be treated (European Commission, 2010).
4.2. Mapping within Crisis Management
During a crisis situation, any information, which is timely and accurate, is crucial,
especially if it is georeferenced. Specialist and stakeholders, and very often
volunteers collect data from various sources, process, analyze and display them.
Depending on phase of crisis management, different roles of mapping are, from
hazard and vulnerability analysis, planning response actions to damage
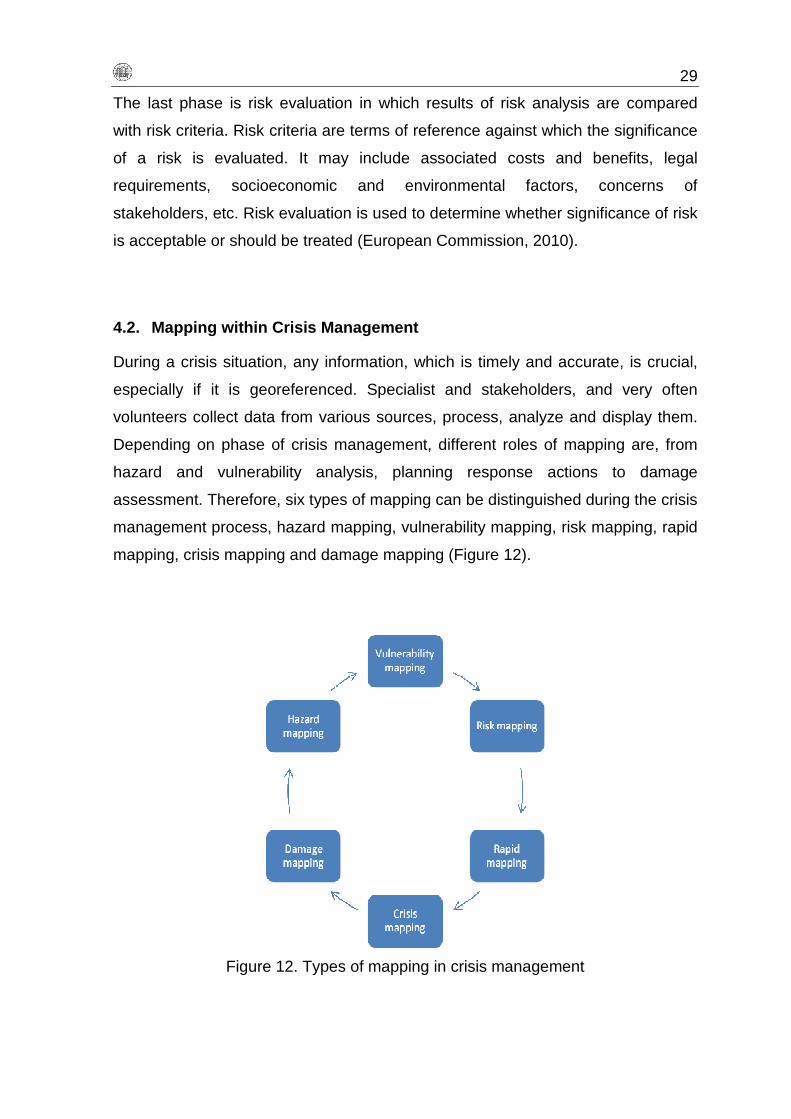
assessment. Therefore, six types of mapping can be distinguished during the crisis
management process, hazard mapping, vulnerability mapping, risk mapping, rapid
mapping, crisis mapping and damage mapping (Figure 12).
Figure 12. Types of mapping in crisis management

30
In the period before crisis, it is necessary to identify geographical areas that are
likely to be affected by hazards. Also, vulnerable and risky areas need to be
identified and mapped in order to plan prevention, mitigation and response
(Mishra, 2002). According to this, three types of mapping, hazard, vulnerability and
risk mapping are carried out in this period.
Hazard mapping is the process of identifying the spatial variation of hazard events.
Based on the type of hazard, different input data can be used for hazard mapping.
For example in flood scenario, data about topography, land use and historical data
will be used. The output data can display different scenarios which will show low,
medium of height probability of flood.
Vulnerability mapping is process of identifying the vulnerable areas. Vulnerable
areas are those where people live, work and visit, but also can be places which
are difficult to replace or rebuild as well as those with historical and cultural values.
According to results of vulnerability mapping, crisis managers will know precise
locations where people, the natural environment or property are at risk due to
potentially catastrophic event that could result in death, injury, pollution or other
destruction (Edwards et al, 2007).
Risk mapping is process of identifying the areas that are potentially at risk.
Normally, it is part of results of risk analysis and follows on from hazard and
vulnerability mapping (Figure 13).
Figure 13. Risk map resulting from hazard and vulnerability analysis

31
Immediately after a crisis occurs, it is necessary to estimate the affected area, in
order to define the extent of event, the most damaged parts and places where aid
and supplies are the most needed.
Rapid mapping provides impact assessment as soon as possible after a
catastrophic event, focusing especially on high impacted places. The aim of rapid
mapping outputs is to contribute in planning emergency response actions,
therefore have to be delivered timely, if possible within 24 hours (Lemoine et al,
2013). In order to provide data as soon as possible, mostly satellite are used for
capturing information about affected area especially for spatially extensive events.
Figure 14. Rapid mapping workflow
Information about damaged buildings and roads are the most important. Damage
buildings will indicate where provide help and information which road is passable
is necessary to plan rescue operations.
After typhoon in Philippines, rapid damage assessment was carried out soon after
the event by Copernicus Emergency Management Service (EMS), coordinated by
the European Commission's Joint Research Centre (JRC). Pre and post event
satellite images were compared. The results showed that 70% of built up area is
affected, of which 58 % is destroyed or highly affected and that roads are blocked
at 113 different locations (Figure 15).

32
Figure 15. Rapid damage assessment after typhoon (URL 6)
Very often, the relief workers don’t know where the medical help and other
supplies like food and water are the most needed. In that situation, the important
role can plan volunteers and social media. The term is known as crisis mapping
and one of the first utility of it was in 2010 during the crisis in Haiti.
Crisis mapping is a process of creating, analyzing, visualizing and using real time
data for humanitarian response as well as for reconstruction and development.
This allows large numbers of people, mostly volunteers from all over the world to
contribute information. During the crisis in Haiti, caused by devastating
earthquake, a crisis map that provided a visual representation of real-time reports
and information was launched. The information about damages, requests for
assistance and the establishment of relief centers were gathered by affected
community through SMS and social media (Gray, 2013). Since Haiti earthquake,
crisis mapping has been contributing in relief actions during the several crises,
including recent earthquake crisis in Nepal (Figure 16).

33
Figure 16. Crisis map, Nepal 2015
Damage mapping carries out beyond the response phase, in order to assess the
economic damage and losses caused by the disaster. This requires more time for
delivery mapping products then rapid mapping, at least a week or even more. The
assessment should be detailed, cover the whole geographic area that is affected
as far as possible and capture the impact on specific built-up categories or land
use classes as complete as possible.
However, to obtain a total cost estimate, these data should be combined with other
geospatial covariates and economic parameters. For example, if the subject of
damage assessment are buildings, information like building size, building type,
cost per unit area, building material, relocation cost and so on, are necessary for
total cost estimation. These cost estimates are important parameters in
establishing financial and institutional support in recovery and reconstruction
phase that follows the disaster (Lemoine et al, 2013).

34
4.3. Copernicus Emergency Management Service – Mapp ing
Copernicus, formerly known as Global Monitoring for Environment and Security
(GMES) is European program for observing the Earth. It consists of complex set of
systems which collect and process data and then provides users using a set of six
services. The data is collected from Sentinels, earth observation satellites and in
situ sensors like ground stations, airborne and sea-borne sensors. The services,
Atmosphere Monitoring, Climate Change, Emergency Management, Land
Monitoring, Marine Environment, Monitoring and Security provides users with
reliable and up-to date information.
The Copernicus Emergency Management Service serves to all actors in crisis
management by providing maps and analyses based on satellite imagery before,
during and after crisis as well as early warning services for flood and fire risks. The
service consists of two main modules, Early Warning and Mapping, but there is
also a dedicated component for the validation of the mapping products.
Copernicus EMS - Mapping supports all phases of the emergency management
cycle: preparedness, prevention, disaster risk reduction, emergency response and
recovery with timely and accurate geospatial information derived from satellite
remote sensing and completed by available in situ or open data sources.
Figure 17. Maps shows the latest Copernicus EMS - Mapping activations

35
The service consists of two modules:
• Rapid Mapping
• Risk and Recovery Mapping
Rapid mapping service supports response activities in emergency situations by
providing users with maps and brief analysis within hours or days following a
catastrophic event. The mapping products of this service are reference,
delineation and grading maps. Reference maps provide a rapid acquisition of
situation/condition of territory and assets at area affected by disaster. It is usually
based on image taken just before catastrophic event. Delineation maps are based
on satellite imagery taken immediately after catastrophic event and provide an
assessment of the event extent.
Depending on the type of disaster, some of the delineation maps are burnt area
maps, flooded area maps, earthquake impact area etc… Grading maps provide a
damage assessment of affected area caused by disaster based on satellite
images taken before and after event. The maps display the extent, type and
disaster grade specific to the disaster, but also roads, hospitals, shelters,
gathering area can be included.
Risk and Recovery mapping support activities dealing with prevention,
preparedness, disaster risk reduction and recovery phases. It provides information
about different types of hazards and risk, exposure, vulnerability and resilience of
people and assets, but also assists in developing the recovery plan and monitoring
the reconstruction and recovery progress. Three types of products, reference, pre-
disaster and post-disaster situation maps are available within weeks or months.
Reference maps provide comprehensive information about territory and assets in
context of prevention, preparedness, disaster risk reduction and recovery. Pre-
disaster situation maps provide relevant and up-to-date thematic information like
hazard exposure, vulnerability and resilience, as well as evacuation plans. This
can help civil protection and humanitarian agencies to plan for contingencies in
order to minimize the loss of life and damage on vulnerable area. Post-disaster
situation maps provide relevant and up-to-date thematic information like used for
planning reconstruction and progress monitoring (URL 3).

36
5. 3D models for the needs of crisis management
The interest in 3D models is constantly growing. The reasons for that are primarily
the developments of measurement technology for collecting 3D data as well as
software for manipulation of 3D data. The first 3D models were used only for
visualization, but today’s possibilities for simulations, analysis and operations with
3D models has enabled the wider application of it in various fields. Some of them
are cadastral, real estate, facility management, urban planning, tourism, crisis
management, etc.
5.1. Generally about 3D models
3D model is a mathematical representation of the three-dimensional space.
Essentially, it is a set of data about points in 3D environment and other information
which computer interprets into a virtual object and visualizes it on the screen or
other output device of the computer (Cetl et al, 2013).
Generally, three are types of 3D models: Digital Terrain model (DTM), Digital
Building Model (DBM) and Digital Surface Model (DSM). Digital Terrain Model
describes the Earth´s bare surface without any features placed on it. Digital
Building model represents a set of 3D objects which are not connected to each
other. Digital Surface Model describes Earth´s surface including all static features
placed on it (Cetl el al, 2013 according to INSPIRE).
3D models are made from spatial data acquired with different surveying methods
like terrestrial survey for example laser scanner, Aero-Photogrammetry, airborne
laser scanning, satellites or existing cartographic products. 3D modeling consists
of following steps, collection of data, manipulation, interpretation, visualization and
finally application of 3D model in various fields (Cetl et al, 2013).
In scholarly literature, 3D models are mostly referring to 3D city models
implemented in various fields. Essentially, 3D city models are Digital Surface
Modes. 3D city models represent a spatial and geo-referenced urban data
including terrain, buildings, vegetation, roads, basically everything what is visible in
real world. Generally, they are used for presenting, exploring, analyzing and
managing urban data (Dollner et al, 2006).

37
3D city models can be made for whole cities, urban areas, districts or just small
parts of the city and with different levels of detail which mainly depends on user’s
requirements and the purpose of a model.
Figure 18. 3D city model of Dubrovnik, Croatia
One of the most famous standards, CityGML provides five different levels of
details, starting from LoD0 to LoD4 (Kolbe et al, 2005). LoD0 is the coarsest level
which presents only surface, i.e. 2.5 dimensional Digital Terrain Model. LoD1
presents a block model without roof structures, in contrast to LoD2 which contains
roof structures. The model with detailed walls, roof structures, balconies or
textures matches to LoD3 model, as well as detailed vegetation and transportation
objects. The most detailed model is LoD4, which contains interior structures like
rooms, doors, stairs, furniture etc (Figure 19).
Figure 19. Five Level-of-Detail (LoD) defined by CityGML

38
5.2. Applications of 3D models in crisis situations
3D models represent an important source of information in crisis situations. Some
of the possibilities are visualizations and simulations of various disasters, planning
evacuation, training rescue teams for emergency situations etc. Also, 3D models
record the shape and configuration of the city and they can be used to assess the
extent of the damage, guiding helpers and rebuild the damaged area after severe
disaster (Kolbe et al, 2005). Different groups of users require different types of 3D
models and different functionalities. According to Kolbe et al (2005), 3D models in
crisis management can be used for:
- 3D visualization, localization and orientation (indoor and outdoor)
- Visualization of occluded dangers (augmented reality)
- Planning operations like determination of escape routes
- Simulations of disasters like floods, fire, pollution dispersion
- Training of personnel (virtual reality)
- Assess extent of damage
- Rebuilding destroyed facilities
3D visualization can be used for presentation of hazards, vulnerabilities, and
risks. It can help and improve efficiency in decision-making process because it
reduces the amount of cognitive effort. 3D modeling depends very much on type
of disaster to be presented and group of user. The user is related to elements of
risk, because various users are interested in different elements of risk. The type
of objects that will be modeled for disaster situation, their representation and
resolution/level of Detail are crucial in 3D modeling (Kermec et al, 2010).
Furthermore, 3D visualization can be used for a rapid assessment of dangerous
situations. For example, in case of bomb threat, using 3D visualization instead of
2D can help to estimate how many buildings must be evacuated and which types
of buildings these are (Figure 20). It is big difference if small building is affected
or big one with large number of people who have to be evacuated.

39
Also, it allows the user to capture information about street widths which is
important if some big and heavy equipment has to be transported to the affected
location (Walenciak et al, 2009).
Figure 20. 3D visualization of bomb threat
Probably one of the most significant roles of 3D models in crisis management is
planning evacuation routes, especially in complex building structures. Namely, in
case of fire, terrorist attack or any other type of crisis which occurs in large
buildings, emergency evacuation is an important issue. Many of them, like airports,
office buildings, shopping centers have complex floor plans. In case of some crisis
situation, when panic prevails and huge masses of people are trying to rescue,
that can be an aggravating factor in planning evacuation and determination of the
shortest path. Two-dimensional map can help people navigate but they are not
adequate for planning optimal routes. A better solution is to use 3D models and
network analysis methods.
Especially useful are 3D models with interior design like rooms, doors, windows,
stairs, halls (LoD4). Building interior is modeled by rooms which are topologically
connected by doors or closure surfaces. Due to this adjacency, it is possible to
make accessibility graph and determine evacuation route based on the shortest
path algorithms (Kolbe et al, 2007).

40
Figure 21. Building interior and accessibility graph
Simulations are generally used to assess damaged objects, estimate possible
shelters and to predict the spreading of water, gas, fire, smoke, etc (Kolbe et al,
2007). It can provide a valuable tool in assessing the potential risk. Digital terrain
model and built-up structures above and below ground with information about
storey heights are important in determining to which degree building will be
affected. This can be used in planning evacuation routes or assessing potential
damage.
Figure 22. Simulation of flood scenario in the city of Brisbane, Australia
41
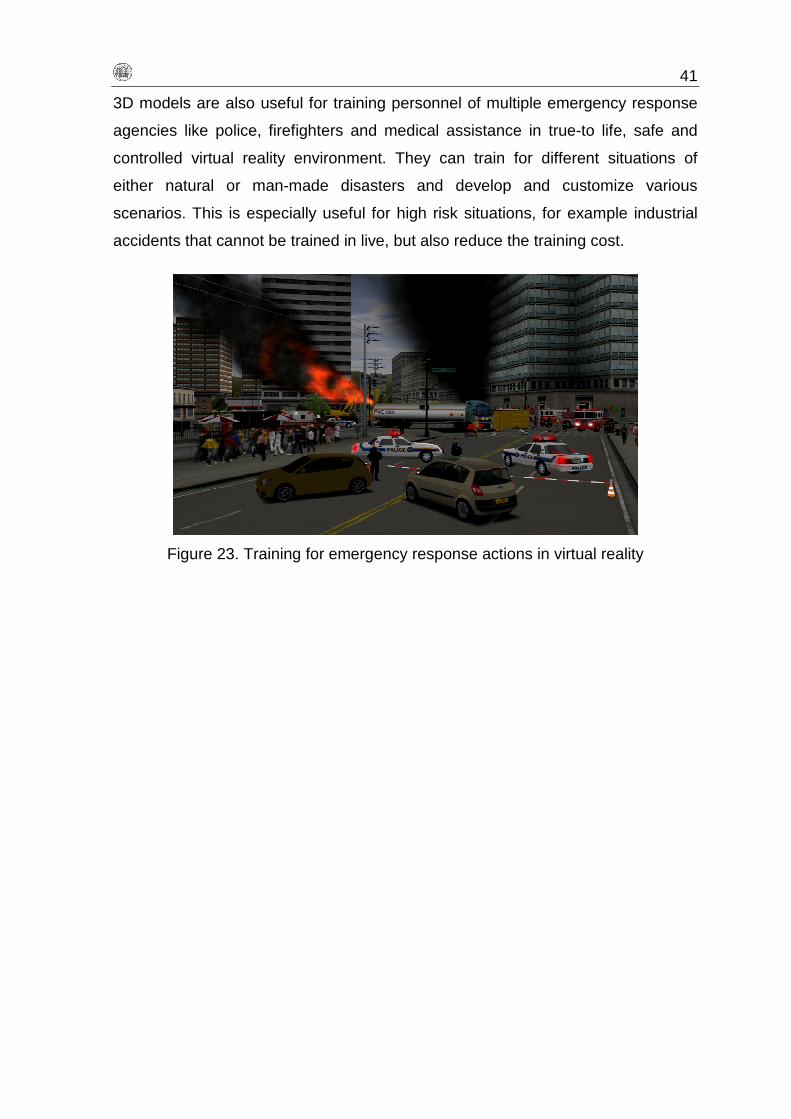
3D models are also useful for training personnel of multiple emergency response
agencies like police, firefighters and medical assistance in true-to life, safe and
controlled virtual reality environment. They can train for different situations of
either natural or man-made disasters and develop and customize various
scenarios. This is especially useful for high risk situations, for example industrial
accidents that cannot be trained in live, but also reduce the training cost.
Figure 23. Training for emergency response actions in virtual reality

42
6. 3D cartographic modeling of Student town
6.1. Study area
Student town is the student campus area in Sofia, the capital of Bulgaria placed on
the western part of the country, at the foot of Vitosha Mountain. It is also one of the
24 districts of Sofia. Area of Student town is approximately 2.4 km2, but for 3D
modeling was chosen smaller area (Figure 24). The selected area comprises
several student blocks, student hospital and other facilities like shops, clubs and
restaurants.
Figure 24. Studen town in Sofia
6.2. Software for 3D modeling
SketchUp is software for making 3D models. It was originally developed by @Last
Software, later bought by Google and currently is owned by Trimble Navigation. It
is intended for a wide range of users who make 3D models for architecture,
construction, engineering, urban planning, interior design, game design etc. It is
easy to use and contains a lot of video tutorials which enable anyone to create 3D
model. The users can choose between two versions of program, SketchUp Make
which is free of charge, and SketchUp Pro which requires license.

43
It has possibility to import and export different types of formats like CAD,
COLLADA, KMZ, IFC, VRML etc. There is also a free library, 3D Warehouse
which contains 3D models made in SketchUp and enables everyone to search,
upload, download and share models (URL 4).
Figure 25. SketchUp interface
6.3. Data source
The source for creating the model was a digital cadastral plan of Student town in
*.dwg format (Figure 26). The file consists of vector data for roads, buildings and
parcels and information about number of floors for each building.
Figure 26. Digital cadastral plan of Student town
44
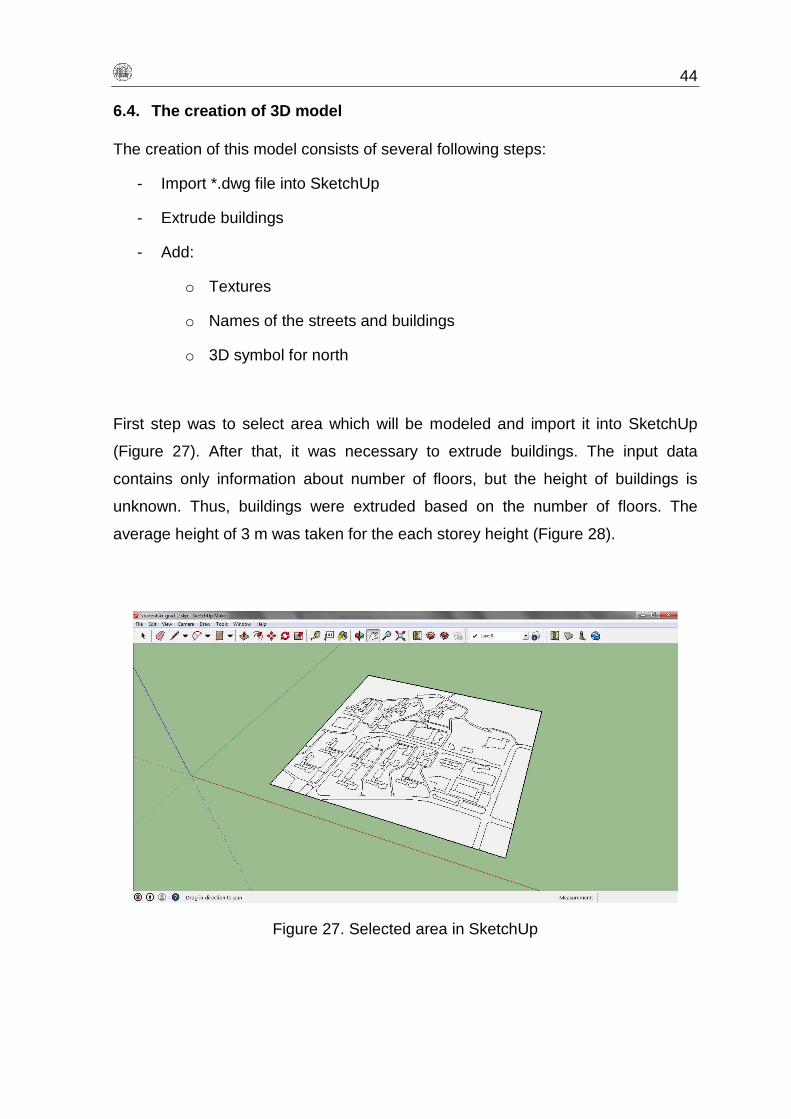
6.4. The creation of 3D model
The creation of this model consists of several following steps:
- Import *.dwg file into SketchUp
- Extrude buildings
- Add:
o Textures
o Names of the streets and buildings
o 3D symbol for north
First step was to select area which will be modeled and import it into SketchUp
(Figure 27). After that, it was necessary to extrude buildings. The input data
contains only information about number of floors, but the height of buildings is
unknown. Thus, buildings were extruded based on the number of floors. The
average height of 3 m was taken for the each storey height (Figure 28).
Figure 27. Selected area in SketchUp

45
Figure 28. Extruded buildings in SketchUp
Textures for roads, grass and sidewalk are added in order to achieve more
realistic view of model. The user will understand information easier in the model if
it looks more realistic. Also, the names of the streets and buildings were added as
well as 3D symbol for north.
Figure 29. Names of the streets and buildings

46
After all steps are done, the 3D model of Student town looks as it shown at the
picture below (Figure 30).
Figure 30. 3D model of Student town – final
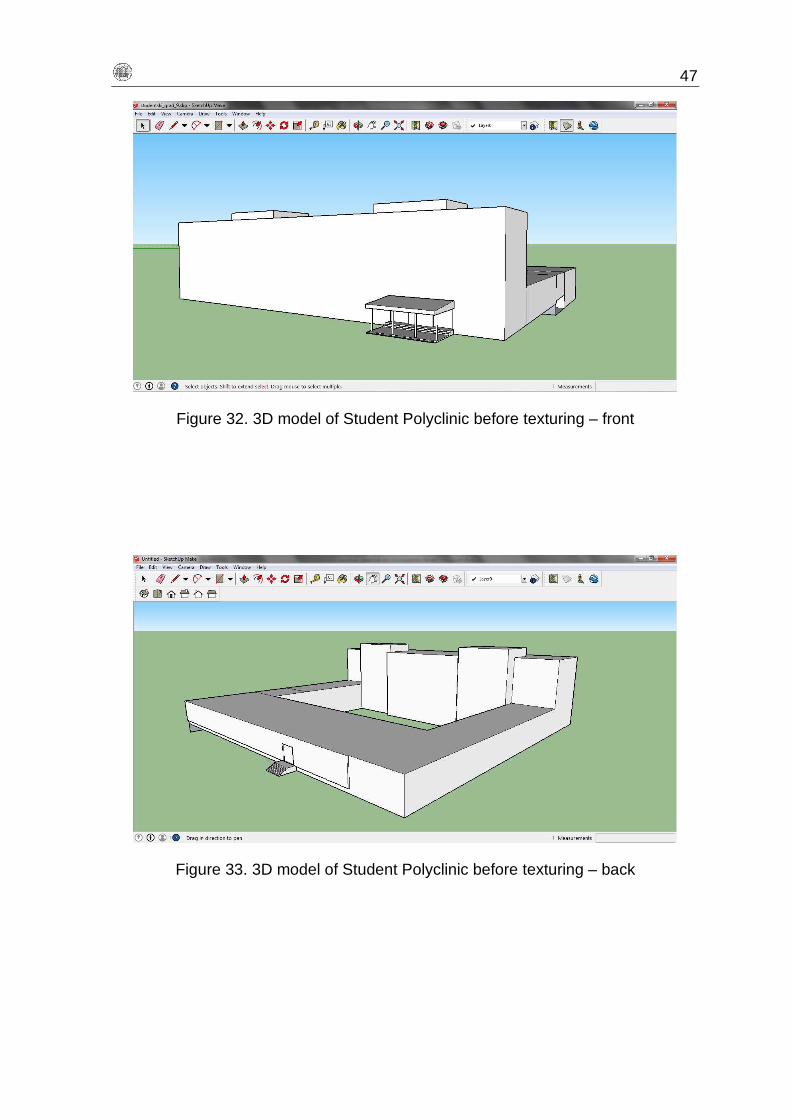
6.5. 3D model of Student Polyclinic
Student Polyclinic is one of the buildings located in the Student town. 3D model for
this building was made more detailed and with textures for building façade. The
exact height of building was measured using handheld laser rangefinder Bosch
GML 100 C. After the model was made, it was necessary to add textures. Pictures
for textures were captured by digital camera and processed using Adobe
Photoshop CS3.
Figure 31. Height measurement
47
Figure 32. 3D model of Student Polyclinic before texturing – front
Figure 33. 3D model of Student Polyclinic before texturing – back

48
Figure 34. 3D model of Student Polyclinic after texturing – front
Figure 35. 3D model of Student Polyclinic after texturing - back

49
6.6. 3D symbols for crisis management
In crisis situations, symbols are used for presenting important, non-topographic
information. Generally, those are types of disasters, rescue units, shelters,
evacuation places etc. In contrast to 2D symbols, 3D symbols more accurately
represent real objects and phenomena. Also, the user can easier navigate through
and orientate in the 3D model (Bandrova et al, 2012). The task was to made 3D
symbols which can be used in crisis situations. Sixteen symbols were made which
are:
• Five represent type of disaster
o earthquake, storm, flood, epidemic, fire
• Two represent rescue items :
o helipad and first aid
• Two represent infrastructure
o police and hospital
• Six represent damage assessments of the building and roads
o destroyed, affected and not affected
• Evacuation arrow

50
For all symbols, except for evacuation arrow, it was necessary to make textures.
The source for textures was *.pdf with humanitarian icons in editable vector format
published by United Nations Office for the Coordination of Humanitarian affairs
(OCHA). The symbols are freely available with aim to help relief workers present
information quickly and simply in case of emergency or crisis (URL 5). Symbols
are divided in 16 groups which are disasters/hazards and crisis, socioeconomic
and development, people, activities/strategy, product type, food and non-food
items, water sanitation and hygiene, camp, security and incident, physical barrier,
damage, general infrastructure, logistics, clusters and others.
Figure 36. OCHA symbol for fire
The textures were made in Adobe Photoshop CS3. Different colors were used
according to what they present. Red color is used for disasters, blue for police and
hospital, green color for rescue items and orange color for presentation of damage
assessment.
At first, textures were made without names. Considering that 3D map doesn’t have
a legend, and 3D symbols should be understandable without it, survey was
conducted. The results showed that the participants have a problem with
understanding the created symbols. Also, some of the symbols, like symbol which
represents epidemic requires some knowledge for understand it. In crisis
situations, quick response is crucial, and misinterpretation of symbols can lead to
wrong decisions and slow down decision making process. According to this, new
textures were made including the names or short description.
The created textures are displayed below.

51
Disaster
Infrastructure
Rescue items
Damage (roads and buildings)

52
The application of 3D symbols in crisis situations is demonstrated in an example of
evacuation in case of an earthquake. The 3D model shows evacuation route,
affected and destroyed buildings, destroyed road, place where medical help will be
provided to injured people and place where helicopter can land.
Figure 37. Building affected by earthquake
Figure 38. Red arrows show evacuation route

53
Figure 39. shows two possible routes which lead to place where injured people
can receive medical help or to helipad.
Figure 39. Two possible routes
Figure 40. 3D symbol for destroyed road

54
Figure 41. 3D symbol represents hospital
6.7. Visualization in Google Earth
Very often in crisis situation, there is a problem how to distribute the data to
different users and make it available to everyone, from geospatial professionals,
first responders, humanitarian relief agencies to ordinary people. One of the
possible solutions is Google Earth, virtual globe which provides a powerful
visualization tool and makes it possible for user to understand better a geospatial,
temporal, and social dimensions of a disaster, before, during, and after it occurs.
Google Earth is free, easy to use, and interactive and enables anyone to lay and
access data from various sources which helps in predicting, preparing and
responding to disaster. In that way varied users from all over the world can
collaborate and combine their data on one interface in order to make informed
decisions in relating to effective disaster prevention and response (URL 7).
Google Earth allows importing 3D models as KML or KMZ file. In order to import
SketchUp model in Google Earth it is necessary to georeference the model and
export to KMZ file.
The model in SketchUp is georeferenced by importing a geo-location snapshot
into SketchUp file. A geo-location snapshot provides information which includes
geographic coordinates, color aerial imagery and 3D terrain (URL 4).

55
The first step for assign information about location for SketchUp model is to add
the location using Add location dialog box which allows navigating a two-
dimensional view of the world and finding a location for model in two possible
ways. One of them is to manually navigate to the location, and the other one is to
search the address.
Figure 42. Selecting region in SketchUp
After finding the location, i.e. selecting the accurate region, a 2D image of the
selected region is placed in SketchUp. The next step is to fit the model on the top
of the location to associate model with geographic location.
Figure 43. Information about geographic location

56
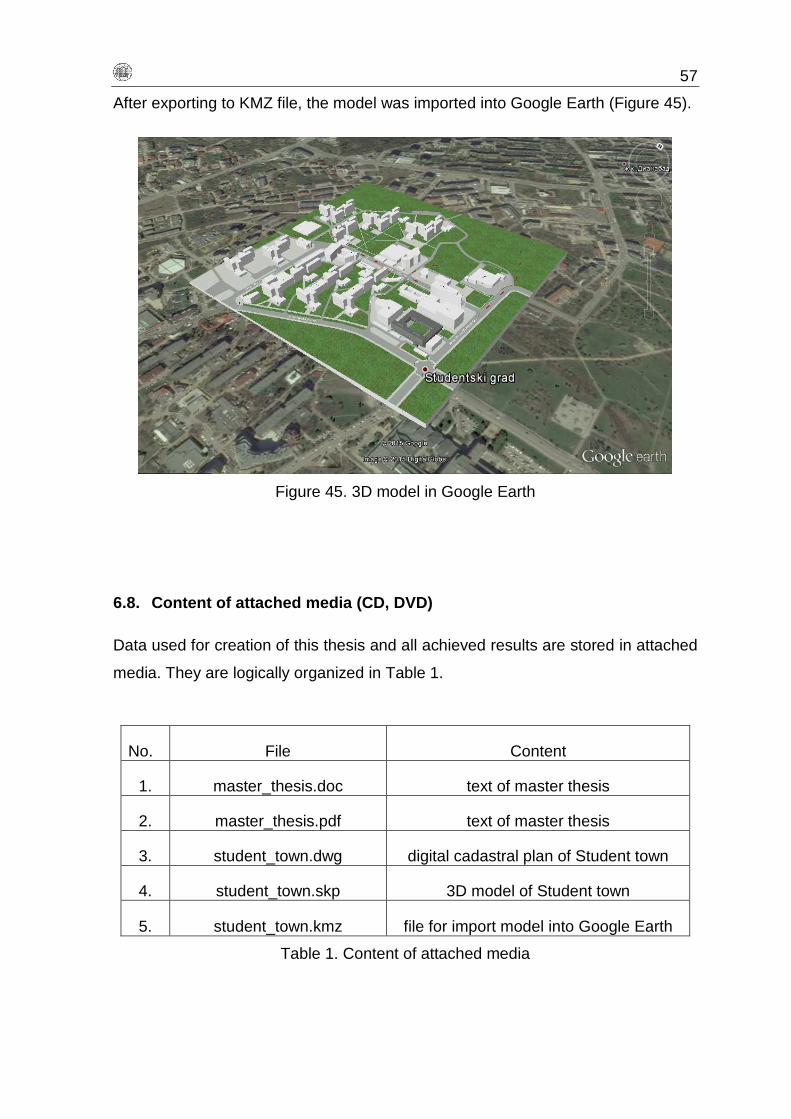
3D model of Student town is modeled from 2D cadastral plan and there is no
information about terrain. This model will be visualized in Google Earth, which
contains information about terrain. Therefore, in order to avoid overlapping of
model or part of model with Google Earth surface, the platform was made between
model and terrain.
Figure 44. Georeferenced 3D model
When model is georeferenced, it is necessary to export it in KMZ file. KMZ file is
compressed KML file (Keyhole Markup Language), XML based language for
visualization of geospatial data in map applications such as Google Maps and
Google Earth. The content of KMZ file is a main KML file (doc.kml) and zero or
more supporting files like images, icons, COLLADA 3D (*.dae) models, textures,
sound files which are referenced in the doc.kml file (URL 8).
57
After exporting to KMZ file, the model was imported into Google Earth (Figure 45).
Figure 45. 3D model in Google Earth
6.8. Content of attached media (CD, DVD)
Data used for creation of this thesis and all achieved results are stored in attached
media. They are logically organized in Table 1.
No. File Content
1. master_thesis.doc text of master thesis
2. master_thesis.pdf text of master thesis
3. student_town.dwg digital cadastral plan of Student town
4. student_town.skp 3D model of Student town
5. student_town.kmz file for import model into Google Earth
Table 1. Content of attached media

58
7. Conclusion
Regardless the progress of mankind, crisis is still a major problem in the world.
Their occurrence mostly can’t be predicted, but the general aim is to reduce the
number of crisis situations and avoid or at least mitigate the negative
consequences which they leave behind. The role of geoinformation is important in
all phases of crisis management, mitigation, preparedness, response and
recovery.
In crisis situations, all the activities are timely limited but consequences depend on
proper timely reaction. The creation of 3D models used to be a long-term process.
However, the development of technology of collecting and processing data made
possible that today 3D models can be made much faster and easier than before.
This thesis is mostly focused on maps and 3D models in crisis situations. Maps
represent important source of information during the crisis. They enable to
visualize spatial data and serve for communication between all actors in crisis. 3D
models used in crisis situations are very useful because of several reasons.
Primarily because of various possibilities that are not possible with conventional
2D maps since there is a need for third dimension. Furthermore, they reduce the
amount of cognitive effort which can speed up the decision making process.
3D cartographic model or 3D map for the needs of crisis was made as a part of
this thesis. Some of the essential information in crisis situations is visualized using
3D symbols. However, the shown situation is only one of the possible scenarios,
considering that such information is not known by the time of crisis.
The fact is that creation of 3D models is demanding, both in time and financially,
and that most of services involved in managing crisis still continue to rely on 2D.
However, 3D models can significantly contribute to crisis management but their
use in crisis is not yet sufficiently explored and exploited.
59
References:
Bandrova T. (2005): Innovative Technology for the Creation of 3D maps, Data Science Journal, Volume 4, August (2005)
Bandrova T., Zlatanova S., Konecny M. (2012): Three - Dimensional Maps for Disaster Management, ISPRS Annals of Photogrammetry, Remote Sensing and Spatial Information Science, Volume 1 - 4, 2012
Cetl V., Tomić H., Lisjak J. (2013): Primjena 3D modela u upravljanju gradom, University of Zagreb, Faculty of Geodesy
CRED (2015): The Human Cost of Natural Disasters: A global perspective
Dollner J., Baumann K., Buchholz H. (2006): Virtual 3D City Models as Foundation of Complex Urban Information Spaces
Edwards J., Gustafsson M., Naslund-Landenmark B. (2007): Handbook for Vulnerability Mapping
European Commission (2010): Risk Assessment and Mapping Guidelines for Disaster Management
Frančula N. (2004): Digitalna kartografija, University of Zagreb, Faculty of Geodesy
Gray B. (2013): Crisis Mapping and its use in Disaster Management, Metropolitan Fire Brigade
Karagyozov K., (2012): Impact of Natural Disasters on Transport Systems – Case Studies from Bulgaria, Report from the International Panel of the WEATHER project funded by the European Commission’s 7th framework programme. Sofia, April 2012
Kermec S., Zlatanova S., H.S. Duzgun (2010): A Framework for Defining a 3D Model in Support of Risk Management
Kolbe T.H., Groger G., Plumer L. (2005): City GML – Interoperable Access to 3D City Models In: van Oosterom P., Zlatanova S., Fendel E. (2005) Geo-information for Disaster management, Springer Verlag (pp. 883-899)
Kolbe T.H., Groger G., Plumer L. (2007): City GML – 3D City Models and their Potential for Emergency Response IN: Zlatanova S., Li J. (2007): Geospatial Information Technology for Emergency Response, Taylor & Francis (pp. 143 -168)
Kuveždić Divjak A., Župan R., Lapaine M. (2011): Kartografija u službi ranog upozoravanja i upravljanja u kriznim situacijama, IV. Međunarodna konferencija „Dani kriznog upravljanja“, Zbornik radova, Ivan Toth (pp.124-144),

60
Kuveždić Divjak A. (2013): Kartografska komunikacija u kriznim situacijama, PhD thesis, University of Zagreb, Faculty of Geodesy
Lemoine G., Corbane C., Louvrier C., Kauffmann M. (2013): Intercomparison and validation of building damage assessments based on post-Haiti 2010 earthquake imagery using multi-source reference data
Marinova S. (2014): Tematichno kartografirane i vizualizatsiya za ranno preduprezdenie i upravlenie pri krizi, PhD thesis, University of Architecture, Civil Engineering and Geodesy, Faculty of Geodesy
Mishra P.K. (2002): Maps and Disaster Management, Indian Cartographer 2002
Preppernau C.A., Bernhard J. (2015): Three - dimensional versus conventional volcanic hazard maps, Springer Science+Business Media Dordrecht 2015
UN (2008): South Eastern Europe Disaster Risk Mitigation and Adaptation Initiative, Risk Assessment for South Eastern Europe
UNISDR (2009): Terminology on disaster risk reduction
Tiwari A., Jain K. (2015): A Detailed 3D GIS Architecture for Disaster management, Cloud Publications, International Journal of Advanced Remote Sensing and GIS 2015, Volume 4, Issue 1, pp. 980-989
Walenciak G., Stollberg B., Neubauer S., Zipf A. (2009): Extending Spatial Data Infrastructures 3D by Geoprocessing Functionality: 3D Simulations in Disaster Management and environmental Research IN: Advanced Geographic Information Systems & Web Services, 2009. GEOWS '09 International Conference on, IEEE

61
URL List:
URL 1.The International Disaster Database, http://www.emdat.be/, (15.03.2015.)
URL 2. Natural hazards interactive map http://maps.ngdc.noaa.gov/viewers/hazards/#, (7.8.2015.)
URL 3. Copernicus, http://www.copernicus.eu/, (10.07.2015.)
URL 4. SketchUp, http://www.sketchup.com/, (19.07.2015.)
URL 5. OCHA humanitarian icons, (26.05.2015.) http://reliefweb.int/report/world/world-humanitarian-and-country-icons-2012,
URL 6. First post-damage assessment for Tacloban City, Philippines https://ec.europa.eu/jrc/en/news/first-post-typhoon-damage-assessment-tacloban-city-philippines, (07.08.2015.)
URL 7. Google Earth; Disaster management, http://sites.duke.edu/tlge_eg80/disaster-management/, (11.07.2015.)
URL 8. KMZ file, (25.07.2015.), https://developers.google.com/kml/documentation/kmzarchives?hl=en,

62
List of Figures
Figure 1. Number of natural disasters per country for period 1994-2013 ..........................10
Figure 2. Phases of Crisis Management ..........................................................................14
Figure 3. Map of Bulgaria .................................................................................................16
Figure 4. Number of disaster events and caused death per disaster (1964-2014) ............17
Figure 5. Types of maps in the period before, during and after crisis ...............................21
Figure 6. Seismic hazard map of Croatia .........................................................................21
Figure 7. Rapid map after tsunami in Japan .....................................................................22
Figure 8. Damage assessment map after earthquake in Haiti ..........................................23
Figure 9. Natural hazard interactive map (URL 2) ............................................................24
Figure 10. 3D Volcanic hazard map ................................................................................25
Figure 11. Risk assessment process ..............................................................................28
Figure 12. Types of mapping in crisis management .........................................................29
Figure 13. Risk map resulting from hazard and vulnerability analysis ..............................30
Figure 14. Rapid mapping workflow .................................................................................31
Figure 15. Rapid damage assessment after typhoon (URL 6) ..........................................32
Figure 16. Crisis map, Nepal 2015 ...................................................................................33
Figure 17. Maps shows the latest Copernicus EMS - Mapping activations .......................34
Figure 18. 3D city model of Dubrovnik, Croatia ................................................................37
Figure 19. Five Level-of-Detail (LoD) defined by CityGML ...............................................37
Figure 20. 3D visualization of bomb threat .......................................................................39
Figure 21. Building interior and accessibility graph ..........................................................40
Figure 22. Simulation of flood scenario in the city of Brisbane, Australia ..........................40
Figure 23. Training for emergency response actions in virtual reality ...............................41
Figure 24. Studen town in Sofia .......................................................................................42
Figure 25. SketchUp interface ..........................................................................................43
Figure 26. Digital cadastral plan of Student town .............................................................43
Figure 27. Selected area in SketchUp ..............................................................................44

63
Figure 28. Extruded buildings in SketchUp ......................................................................45
Figure 29. Names of the streets and buildings .................................................................45
Figure 30. 3D model of Student town – final ....................................................................46
Figure 31. Height measurement .......................................................................................46
Figure 32. 3D model of Student Polyclinic before texturing – front ...................................47
Figure 33. 3D model of Student Polyclinic before texturing – back ...................................47
Figure 34. 3D model of Student Polyclinic after texturing – front ......................................48
Figure 35. 3D model of Student Polyclinic after texturing - back ......................................48
Figure 36. OCHA symbol for fire ......................................................................................50
Figure 37. Building affected by earthquake ......................................................................52
Figure 38. Red arrows show evacuation route .................................................................52
Figure 39. Two possible routes ........................................................................................53
Figure 40. 3D symbol for destroyed road .........................................................................53
Figure 41. 3D symbol represents hospital ........................................................................54
Figure 42. Selecting region in SketchUp ..........................................................................55
Figure 43. Information about geographic location ............................................................55
Figure 44. Georeferenced 3D model ................................................................................56
Figure 45. 3D model in Google Earth ...............................................................................57
List of Tables
Table 1. Content of attached media .................................................................................57

64
C U R R I C U L U M V I T A E
E U R O P E A N C U R R I C U L U M V I T A E
F O R M A T
PERSONAL INFO
Name GILJANOVIĆ, Marina Address MIKE TRIPALA 4, 21 000 SPLIT , CROATIA
Phone +385 99 600 35 25 Fax
E-mail [email protected]
Nationality Croatian
Date of birth January 12th 1992
WORK EXPERIENCE
• Date (from – to) SEPTEMBER 2014 – FEBRUARY 2015 • Name and address of firm Paying Agency for Agriculture, Fisheries and Rural Development
Ulica grada Vukovara 269 d, Zagreb • Type or field of work Geoinformatics in agronomy
• Occupation or position held Consultant • Basic activities and responsibilities Control of agricultural areas with remote sensing,
Update Land Parcel Identification System (LPIS)
• Date (from – to) OCTOBER 2014 – FEBRUARY 2015 • Name and address of firm University of Zagreb, Faculty of Geodesy,
Institute of Applied Geodesy, Chair for Spatial Data Management Kačićeva 26, Zagreb
• Type or field of work Spatial data management support • Occupation or position held Teaching fellow
• Basic activities and responsibilities Student assistant in laboratory work
EDUCATION
• Date (from – to) SEPTEMBER 2013 – SEPTEMBER 2015 • Educational institution University of Zagreb, Faculty of Geodesy
• Occupation Geoinformatics (Master Study) • Academic title mag. ing. geod. et geoinf.

65
• Date (from – to) SEPTEMBER 2010 – JULY 2013
• Educational institution University of Zagreb, Faculty of Geodesy • Occupation Geodesy and Geoinformatics (Bachelor Study)
• Academic title univ. bacc. ing. geod. et geoinf.
• Date (from – to) SEPTEMBER 2006 – JULY 2010 • Educational institution 3rd Gymnasium Split
• Occupation Gymnasium graduate of natural sciences and mathematics • Academic title /
OTHER LANGUAGE(S)
ENGLISH • reading B2 • writing B2
• speaking B2
SOCIAL SKILLS AND ABILITIES
BASKETBALL PLAYER FOR 12 YEARS ( ŽKK SPLIT, ŽKK CROATIA 2006, UNIVERSITY OF ZAGREB TEAM) MEMBER OF STUDENT HIKING CLUB (FACULTY OF GEODESY) STUDENT EXCHANGE PROGRAM IN SOFIA, BULGARIA (ERASMUS 2015)
ORGANIZATION SKILLS AND
ABILITIES
REGIONAL GEODETIC STUDENT MEETING ZAGREB 2012 (ORGANIZING COMMITTEE)
TECHNICAL SKILLS AND ABILITIES COMPUTER SKILLS (MICROSOFT OFFICE, AUTOCAD, SKETCHUP, QGIS)
OTHER SKILLS, ABILITIES AND
ACTIVITIES
BASKETBALL REFEREE PARTICIPATION IN: REGIONAL GEODETIC STUDENT MEETING NOVI SAD 2013 INTERNATIONAL GEODETIC STUDENT MEETING ISTANBUL 2014 3RD FIG YOUNG SURVEYORS EUROPEAN MEETING SOFIA 2015 INTERNATIONAL GEODETIC STUDENT MEETING HELSINKI 2015 CONTRIBUTION TO THE DEVELOPMENT OF UNIQUE GIS SYSTEM FOR EMERGENCY SERVICES IN THE CITY OF ZAGREB CONSTRUCTION OF TOURIST WEB MAP OF DUGA RESA WITH GIS CLOUD TECHNOLOGY, PUBLISHED IN EKSCENTAR, STUDENT MAGAZINE NO. 17, JUNE 2014
PERSONAL SKILLS AND
ABILITIES
MOTHER TONGUE CROATIAN
DRIVING LICENSE B