Embed Size (px)
Citation preview
VTT TIEDOTTEITA - MEDDELANDEN - RESEARCH NOTES 1750
Market for electronic informationservices for professional purposes
in Finland in 1994
MSSTUDY Finland
Merja LehtiVTT Information Service
TECHNICAL RESEARCH CENTRE OF FINLANDESPOO 1996

2
ISBN 951-38-4905-8ISSN 1235-0605Copyright © Valtion teknillinen tutkimuskeskus (VTT) 1996
JULKAISIJA – UTGIVARE – PUBLISHER
Valtion teknillinen tutkimuskeskus (VTT), Vuorimiehentie 5, PL 42, 02151 ESPOOpuh. vaihde (90) 4561, telekopio 456 4374, teleksi 125 175 vttin sf
Statens tekniska forskningscentral (VTT), Bergsmansvägen 5, PB 42, 02151 ESBOtel. växel (90) 4561, telefax 456 4374, telex 125 175 vttin sf
Technical Research Centre of Finland (VTT), Vuorimiehentie 5, P.O.Box 42, FIN–02151 ESPOO,Finlandphone internat. + 358 0 4561, telefax + 358 0 456 4374, telex 125 175 vttin sf
VTT OFFSETPAINO, ESPOO 1996

3
Lehti, Merja. Market for electronic information services for professional purposes in Finland in 1994:MSSTUDY Finland [Sähköisten tietopalvelujen markkinat Suomessa: MSSSTUDY Finland]. Espoo 1996,Technical Research Centre of Finland, VTT Tiedotteita – Meddelanden – Research Notes 1750. 141 p. +app. 34 p.
UDC 002:681.3Keywords information services, market, Finland, online services
ABSTRACT
During 1995, a multinational study, initiated under the The European Commission’sIMPACT 2 -programme, was done to assess the markets for electronic informationservices (EIS) for professional purposes in 1994 in the countries of the EuropeanEconomic Area (EEA). The participating 17 countries covered the supply and demandsides of the EIS market, as well as various infrastructure sections related to thesemarkets.
Finland covered the supply and demand sides of the markets for electronic informationservices by quantitative means. The supply questionnaire was sent to 147 recipients, a)Finnish database producers and hosts of online information systems, includingrepresentatives of foreign hosts, b) suppliers of telematic services and c) audiotexservices, d) electronic mail services and Internet connections, and to e) producers ordistributors of offline information products, mostly of CD-ROMs. The demandquestionnaire was sent to 108 recipients in four target groups, a) information brokersand external information intermediaries and to b) the main scientific and researchlibraries, acting as information brokers in their special fields; also to c) the main publiclibraries and d) an industrial group, i.e. intermediaries in the chemical andpharmaceutical industry in Finland. The quantitative surveys were supplemented byqualitative information gathered from various printed sources and in discussions withexperts of the branches concerned. - The overall response rate of the supply side was29%, that of the demand side 36%.
In addition, Finland covered the following infrastructure sections related to the marketsfor electronic information services: library services, printed media infrastructure,professional associations, education and training, research and development, tele-communications infrastructure, computer infrastructure, economic and politicalinfrastructure, national information policy, legal and regulatory issues. The sections werecovered up to a varying scope and by means of printed sources and expert opinions. Achapter about future visions of communications is also included. - The present reportabout Finland is a modification of the one delivered to CEC in November, 1995.

4
Lehti, Merja. Market for electronic information services for professional purposes in Finland in 1994:MSSTUDY Finland [Sähköisten tietopalvelujen markkinat Suomessa: MSSSTUDY Finland]. Espoo 1996,Valtion teknillinen tutkimuskeskus, VTT Tiedotteita – Meddelanden – Research Notes 1750. 141 s. + liitt.34 s.
UDK 002:681.3Avainsanat information services, market, Finland, online services
TIIVISTELMÄ
EU:n komission IMPACT 2 -ohjelman aloitteesta tehtiin 1995 kansainvälinen selvityssähköisten tietopalvelujen markkinoista ammatillisiin tarkoituksiin vuonna 1994.Selvitykseen osallistui 17 maata Euroopan talousalueelta (ETA). Osallistujat analysoivatsähköisten tietopalvelujen tarjontaa ja kysyntää sekä alaan liittyvää infrastruktuuriaomassa maassaan.
Suomi selvitti tarjontaa ja kysyntää kvantitatiivisin menetelmin. Tarjontaa kartoittavakyselylomake lähetettiin 147 organisaatiolle: a) kotimaisille tietokantojen tuottajille jatiedonhakujärjestelmien ylläpitäjille, myös ulkomaisten järjestelmien edustajille, b)telemaattisten palvelujen tarjoajille, c) audiotex-palvelujen tarjoajille, d) sähköposti- jaInternet-yhteyksiä tarjoaville organisaatioille ja e) muilla välineillä kuin suorakäyttöisestitarjottavien tietopalvelujen tuottajille tai jakeluorganisaatioille. Kysyntää kartoittavalomake lähetettiin 108 vastaanottajalle neljässä eri kohderyhmässä: a) tietokonsulteille javälittäjille (information brokers, external information intermediaries), b) tieteellistenkirjastojen yhteistilastoon osallistuville kirjastoille, c) yleisille kirjastoille (maakunta-kirjastot ja muutamat muut) sekä elinkeinoelämän kohderyhmälle, kemian ja farmasianalan teollisuuden informaatiopalveluille. Kvantitatiivisia menetelmiä täydennettiinkeräämällä tietoja painetuista lähteistä ja asiantuntijoita haastattelemalla. - Tarjonta-kyselyn vastausprosentti oli noin 29% ja kysyntäryhmien 36%.
Suomi selvitti lisäksi seuraavia infrastruktuurin aloja: kirjastot, painettu media, alanjärjestöt, koulutus, tutkimus, tietoliikenne, tietojenkäsittely, taloudellinen ja poliittineninfrastruktuuri, kansallinen informaatiopolitiikka ja lainsäädännölliset kysymykset sekäviestinnän tulevaisuudennäkymät. - Tämä VTT Tiedotteita on muokattu EU:n komis-siolle marraskuussa 1995 toimitetusta raportista.

5
PREFACE
During 1995, VTT Information Service carried out the Finnish study about the situationof the markets for electronic information services for professional purposes in 1994. Itwas part of a multinational study initiated under the European Commission’s IMPACT 2-programme and carried out in 17 member states of the European Economic Area to getan overall picture about the national as well as the pan-European market for electronicinformation services.
Representatives of the Finnish sponsors of the study formed the leading group whichcomprised of Mr. Juhani Hakkarainen from the Ministry of Education, Mr. IlmariPietarinen from the Ministry of Finance, Mr. Henry Haglund from TELMO (the FinnishAssociation for Network Services) and Mr. Sauli Laitinen from VTT InformationService. The project leader wishes to thank the leading group for their valuable support.The author expresses her sincerest thanks to the internal support group at VTTInformation Service, Ms. Elisabet Mickos and Dr. Pirkko Eskola, for their valuableadvice. A warm thank-you also belongs to all the colleagues and experts whocontributed to the MSSTUDY work, both at VTT and elsewhere, too numerous to bementioned here. The author herself is, however, solely responsible for the result of thework, presented here as the report about Finland, as well as any conclusions made.
Espoo, April 1996
Merja Lehti
6
TABLE OF CONTENTS
ABSTRACT 3TIIVISTELMÄ 4PREFACE 5
1 INTRODUCTION 10 1.1 THE AIM, OBJECTIVES AND SCOPE OF THE MEMBER STATES STUDY 10 1.2 METHODOLOGY OF THE STUDY AND STRUCTURE OF THE REPORT 10
2 SUPPLY SIDE SURVEY 12 2.1 RESPONSE RATES 13 2.2 CHARACTERISATION OF RESPONDENTS 13 2.3 TURNOVER 15 2.3.1 Overall figures 15 2.3.2 Analysis of turnover by different service or product categories 16 2.3.3 Analysis geographically and by subject area 17 2.4 COST ANALYSIS 18 2.5 OUTSOURCING ACTIVITIES 19 2.6 FURTHER INFORMATION ABOUT THE SUPPLY SIDE 19 2.6.1 Supply of real-time financial and news information 20 2.6.2 Audiotex services 21 2.6.3 Internet 22 2.6.4 Telematic information networks 25 2.6.5 Electronic mail suppliers 27
3 DEMAND SIDE SURVEY 29 3.1 ALL DEMAND SIDE TARGET GROUPS 29 3.1.1 Response rates and characterisation of respondents 31 3.1.2 Revenues 33 3.1.3 Analysis by type of customer 34 3.1.4 Analysis of budgets or expenditures 35 3.1.5 Barriers of using electronic information services 38 3.2 INFORMATION BROKERS 39 3.2.1 Response rates and characterisation of respondents 39 3.2.2 Revenues and customers 41 3.2.3 Analysis of budgets or expenditures 42 3.3 SCIENTIFIC AND RESEARCH LIBRARIES 43 3.3.1 Response rates and characterisation of respondents 43 3.3.2 Revenues and customers 45 3.3.3 Analysis of budgets or expenditures 46 3.3.4 Use of electronic information services by scientific and research libraries 47

7
3.4 PUBLIC LIBRARIES 47 3.4.1 Response rates and characterisation of respondents 47 3.4.2 Revenues and customers 49 3.4.3 Analysis of budgets or expenditures 49 3.5 INFORMATION INTERMEDIARIES IN THE INDUSTRIAL TARGET GROUP 50 3.5.1 Response rates and characterisation of respondents 50 3.5.2 Revenues and customers 52 3.5.3 Analysis of budgets or expenditures 52
4 INFORMATION SERVICES INSTITUTIONAL INFRASTRUCTURE 54 4.1 LIBRARY SERVICES 54 4.1.1 General 54 4.1.2 Scientific or research libraries 54 4.1.3 Public libraries 57 4.1.3.1 Current statistics 58 4.1.3.2 Library automation in municipal libraries in 1994 59 4.1.4 Archives and museums 59 4.2 PRINTED MEDIA INFRASTRUCTURE 60 4.2.1 Finnish mass media market 60 4.2.2 Publishing of books, magazines and newspapers 64 4.2.2.1 Books 64 4.2.2.2 Sales channels 65 4.2.2.3 Magazines and periodicals 66 4.2.2.4 Newspapers 67 4.2.2.5 Electronic publishing 68 4.3 PROFESSIONAL ASSOCIATIONS 69 4.3.1 Associations of information specialists and librarians 69 4.3.2 Information industry associations 70 4.3.3 Resolution of the Finnish information and knowledge sectors 73 4.4 EDUCATION AND TRAINING IN LIBRARY AND INFORMATION SCIENCE 76 4.5 RESEARCH AND DEVELOPMENT IN INFORMATION SERVICES 77
5 TECHNOLOGICAL INFRASTRUCTURE 78 5.1 TELECOMMUNICATIONS INFRASTRUCTURE AND POLICY 78 5.1.1 Telecommunications operators 78 5.1.1.1 Telephony 80 5.1.1.2 Mobile communications and paging 82 5.1.1.3 Teleprinters and telefaxes 83 5.1.1.4 Data transmission 84 5.1.1.5 Value-added services 85 5.1.2 Overall situation and telecommunications policy 86 5.1.2.1 Mobile communications 86 5.1.2.2 Legislation 87 5.1.2.3 International cooperation 87 5.1.3 Competition and telecommunications companies 87 5.1.4 State-of-the-art and prospects of telematics applications 88 5.1.4.1 Open scene 88

8
5.1.4.2 Applications in transport, urban and rural areas and environment 89 5.1.4.3 Applications in healthcare 90 5.1.4.4 Research 91 5.1.4.5 Information engineering and language engineering 91 5.2 COMPUTER INFRASTRUCTURE 92 5.2.1 Member companies of the Finnish Computing Services Association 92 5.2.2 Production, sales and use of microcomputers in Finland 92 5.2.3 Hardware and software establishments 94
6 ECONOMIC AND POLITICAL INFRASTRUCTURE 96 6.1 POLITICAL INFRASTRUCTURE 96 6.2 GENERAL ECONOMIC SITUATION IN FINLAND IN 1994 96 6.3 NATIONAL INFORMATION POLICY 99 6.3.1 Development of scientific libraries and information services in Finland 99 6.3.2 Finland’s way to the information society 99 6.3.3 Finland’s strategy, a vision for the future 101 6.3.4 Government position on measures for the information strategy 103 6.3.4.1 Aims of information society policies 103 6.3.4.2 Information society and the new government 106 6.4 R&D EXPENDITURE 107 6.5 LEGAL AND REGULATORY ISSUES 109 6.5.1 Data protection (privacy protection) in Finland 109 6.5.2 Database protection in national copyright legislation 110 6.5.3 Computer-related crime 111
7 FURTHER QUALITATIVE ASSESSMENTS 115 7.1 STRENGTHS AND WEAKNESSES OF SUPPLY AND DEMAND IN THE NATIONAL MARKET 115 7.2 INTERNET AND THE CHANGING SOCIETY 116 7.3 VISIONS OF COMMUNICATIONS 116 7.3.1 General 116 7.3.2 Prospects in Finland 118 7.3.2.1 General 118 7.3.2.2 The press 120 7.3.2.3 Internet 121
8 PREVIOUS FINNISH SURVEYS AND PRESENT CONCLUSIONS 122 8.1 PREVIOUS SURVEYS ABOUT THE USE OF ONLINE INFORMATION SERVICES IN FINLAND 122 8.2 BACKGROUND INFORMATION ON THE PRESENT SURVEY 123 8.3 FINLAND 124 8.4 PRELIMINARY COMPARISONS ABOUT EUROPE 126
EXECUTIVE SUMMARY 128SOURCES 136

9
ANNEXES1. Supply: Questionnaire about the supply of electronic information services for professional purposes in Finland in 19942. Demand: Questionnaire about the use of electronic information services for professional purposes in Finland in 1994, with cover notes for the target groups

10
1 INTRODUCTION
1.1 THE AIM, OBJECTIVES AND SCOPE OF THE MEMBER STATESSTUDY
MSSTUDY Finland is part of a multinational study for assessing the situation of the
markets for electronic information services (EIS) for professional purposes in the
member states of the European Economic Area, covering 17 European countries and
initiated under the European Commission's IMPACT 2 -programme. The participating
countries were Austria, Belgium, Denmark, Finland, France, Germany, Greece, Iceland,
Ireland, Italy, Luxembourg, the Netherlands, Norway, Portugal, Spain, Sweden and the
United Kingdom.
The main aim and objective of the multinational MSSTUDY was to make it possible to
assess the competitive strengths and weaknesses of the European market of electronic
information services, compared to the corresponding markets in North America and
Japan. For this purpose, the national studies have been coordinated and the results
aggregated at the European level to enable comparisons nationally and internationally
and to enable the players in the markets to draw strategic conclusions. During the study
the participating countries got an overall picture of the national market and were also
able to make international comparisons.
The participating countries, including Finland, covered the supply side of the markets for
electronic information services for professional purposes and, according to the scope of
their contract, the demand side. The participating countries also covered various sectors
of infrastructure relating to the EIS markets, according to their own choice.
1.2 METHODOLOGY OF THE STUDY AND STRUCTURE OF THEREPORT
Finland covered the supply side of the markets for electronic information services by
quantitative means. A questionnaire was sent to Finnish database producers and hosts of
online information systems (including representatives of foreign hosts), suppliers of
telematic services and audiotex services, electronic mail services and Internet

11
connections, and to producers or distributors of offline information products, mostly
CD-ROMs.
In addition to her original MSSTUDY contract, Finland also covered the demand side of
the markets by quantitative means, by a questionnaire sent to four different target
groups. The demand questionnaire was sent to a) information brokers and external
information intermediaries and to b) the main scientific and research libraries, acting as
information brokers in their special fields. The other target groups were c) the main
public libraries and d) and industrial group, i.e. intermediaries in the chemical and
pharmaceutical industry in Finland.
The quantitative surveys had to be supplemented by qualitative information gathered
from various printed sources and in discussion with experts of the branches concerned.
Finland covered the following infrastructure sections related to the markets of electronic
information services: library services, printed media infrastructure, professional
associations, education and training, research and development, telecommunications
infrastructure, computer infrastructure, economic and political infrastructure, national
information policy, legal and regulatory issues. Qualitative assessments on certain
branches and issues were also studied. The sections were covered up to a varying scope
and by means of printed sources and expert opinions.
The Finnish national report entitled "MSSTUDY Finland" was delivered to CEC in
November, 1995. It was divided into the following main sections: supply side survey,
demand side surveys, infrastructure sections and statistical annexes. A section of future
issues in some fields and other qualitative assessments as well as conclusions and a list
of sources are included. There is also a section about the markets for printed
information. The exchange rate used in the study for FIM/ECU is 6,19 (6,19077). The
present report is a modification of the one delivered to CEC.

12
2 SUPPLY SIDE SURVEY
Publicly available databases, containing professional information, are produced by
approximately 140 databases producers in Finland. The number of databases is currently
about 240. They are available either online or on CD-ROM, diskettes or tapes (or on
two different media), according to 1995 update of Nordguide, the database of Nordic
databases. The Nordguide database is a survey of databases and hosts in the Nordic
countries. It was last updated in the spring of 1995. The number of Finnish hosts is about
70. Some of the organizations engaged in electronic information services are both a host,
a database producer and an information broker. They received both the supply and the
demand questionnaire.
In MSSTUDY Finland, 147 supply questionnaires were distributed: 107 copies to Finnish
hosts and database producers and agencies for foreign hosts, 13 to suppliers of
electronic mail and Internet services, 22 to producers and distributors of CD-ROM
products and 5 to suppliers of telematic open information network services (value-added
or kiosk services) or videotex services. An organization that is engaged in various
activities and belongs to two groups has, nevertheless, been counted only once. This
concerns e.g. database producers being hosts, as well as CD-ROM distributors or
producers or electronic mail or videotex suppliers having other kinds of supplier
activities.
Almost 40 database producers also act as hosts (or vice versa), many online database
producers also sell or produce CD-ROM diskettes. Some videotex suppliers also act as
suppliers of electronic mail or Internet connections. Companies working in the
production or sales of CD-ROM diskettes (original count 27), are usually very small and
some only survive for a year or two. Many of the suppliers of electronic mail or Internet
connections are voluntary organizations, various microcomputer user groups or
associations with actually no revenue at all. Most of them did not answer the supply
questionnaire.
In the supply questionnaire, the following categories of the supplier organizations were
used: private companies, public companies, public institutions (government or municipal
administration, universities etc.) and semi-public organizations (e.g. associations,
chambers of commerce).

13
2.1 RESPONSE RATES
The response rate was 29% as a whole, i.e. 42 respondents returned the questionnaire.
Based on the address lists used, 33 respondents of hosts and database producers (30%)
answered the questionnaire. Five of the suppliers of electronic mail and Internet
connections (38%) answered, and so did almost 14% of CD-ROM producers or
distributors. Among the suppliers of videotex or similar services, 40% answered.
One respondent had ceased to produce a database, and two returned a blank
questionnaire saying they consider the information a trade secret. Two organizations
sent two kinds of answers which were then combined into the same questionnaire. Seven
representatives of foreign hosts received the supply questionnaire. Almost all of them
informed that they do not answer the questions for Finland alone and referred to the
international parent company for further information.
There are about 70 national hosts in Finland, a dozen of them the major hosts. Despite
our efforts, some of the major national hosts in Finland declined to answer the supplier
questionnaire. Many a supplier of electronic mail or Internet connections is a voluntary
organization, a pc user group or an association, only starting such activities or with
actually no revenue at all. Most of them did not answer the questionnaire.
The above response rates correspond to the original address lists used. In the supplier
questionnaire (Annex No. 1) the respondents were asked to tick as many boxes of types
of activity as apply (question No. 2.1). Based on later instructions, a main type of
activity had to be chosen, which necessitated another round of telephone calls. The
above response rates of the various supplier groups do not, therefore, necessarily in
every case correspond to the main categories of activity that the respondents later
indicated.
In addition to the questionnaires, information has been gathered from other sources
about some suppliers.
2.2 CHARACTERISATION OF RESPONDENTS
Legal statusThe respondents' organizations were listed into four alternative legal status categories.
Most of them, 19 respondents, (over 45%) were public institutions. The next biggest

14
group was that of private companies, 15 (almost 36%) of the respondents. There were
four respondents (9,5%) each from public companies or semi-public institutions.
Main activityMany a respondent is engaged in various activities in the electronic information services
field. It was not easy in every case to determine the one and only main activity, since
some of the respondents had even percentages in two or more activities. More than half
of the respondents, 24 organizations (57%), were database producers (cf. table 1). The
second biggest group was that of retrospective online information services, with 5
respondents (12%). Three organizations were grouped into hosts of real-time financial
information services and another three into electronic mail service suppliers. The rest
was evenly distributed into five different categories, one or two in each of them.
Table 1. Supply survey: main activity of the respondents.
Number %
Database producers 24 57 Retrospective online database services 5 12 Real-time information services, hosts: financial 3 7,1 Real-time information services, hosts: news 1 2,4 Audiotex services 1 2,4 Electronic mail services 3 7,1 Services delivered via Internet 2 4,8 CD-ROM distributors 1 2,4 Distributors of other offline services 2 4,8
Total: 42 100
StaffAlmost all of the respondents answered the question about full-time staff. Altogether, 38
respondents employed 11 356 employees. The mean value (average) of the total staff
was 298. The average number of staff in the departments related to electronic
information services (37 respondents) was 17 employees.
Nearly two thirds of the respondents (27 out of 42) indicated the breakdown of their
staff in electronic information services into the functions mentioned in question No. 3.3
(Annex No. 1). Sales and marketing, data gathering and editorial, and technical

15
functions all had shares of 20 through 29% of the total. Data gathering and editorial
functions form the most important category. Management and administration together
with other functions are less important in percentages (cf. table 2).
Table 2. Supply survey: respondents’ staff in electronic information services by
functions.
Function Mean value, %
Management, administration 16
Sales, marketing 20
Data gathering, editorial 29
Technical 24
Other staff function 12
2.3 TURNOVER
2.3.1 Overall figures
Nearly all of the respondents (38 out of 42) gave figures for their total turnover in 1994.
Some of the respondents were big organizations with most of their activity other than
supplying electronic information services or products in the sense meant in the
MSSTUDY. No conclusions can be drawn from these figures, since there is a huge
variety and the figures include all activities of the responding organizations. They are by
no means purely market revenue figures, because quite many suppliers (database
producers or online hosts) in Finland are public institutions financed mostly by public
subsidies.
Percentages of the break-down of the turnover into categories of market income, public
subsidies and other income were given by 35 respondents (83% of the total population).
Comparing the percentages for the total population does not either make sense since
there are great differences depending on the type of supplier in question.
Growth rates, positive or negative, of the suppliers' income showed great differences,
too, but an average growth rate from 1993 to 1994 was about 24% (only 24 responses).

16
2.3.2 Analysis of turnover by different service or product categories
Overall percentagesAbout three out of four respondents indicated the break-down of their total turnover by
types of services or products. Besides the given categories of electronic information
services and printed products, we added a third category (other) for other kinds of
services, because some of the responding suppliers earned the major part of their
income from other activities. This means that the supply of electronic information
services is the principal activity of the organization in only very few cases. Those few
suppliers who get the majority of their turnover from electronic information services,
however, are among the big suppliers in the branch in Finland.
If we mark the value of the suppliers' other activities by 94, the next most important
share of turnover comes from printed products, and is only 18% of the prime activity.
Electronic information services, for their part, form only a minor percentage of the total
turnover, with about 5% of the prime value. This percentage is confirmed by counting
the money values of the various services/products. Based on the percentages given in
question No. 6.1 (Income by types of services and products, cf. Annex No. 1) for
electronic information services, the money value was indeed counted from the
responding organizations' total turnover figures. This gives an average turnover (mean
value) of 11,9 million FIM (1,9 million ECU) for supplying electronic information
services and an average turnover of 44 million FIM (7,1 million ECU) for printed
products.
Break-down of electronic information servicesThere were 30 respondents (71%) who indicated the further break-down of the
percentage of electronic information services into various activities. The given
percentages were weighted with the turnover and averaged. Hosting retrospective online
information services was the prime activity, the weighted mean value was 18%. The
next most important activity was supplying magnetic information media (discs, tapes
etc.), 53% of the prime activity. Database production came right after that, representing
about 48% of the volume of the prime activity (weigth factor 8). Next in line were CD-
ROMs, electronic mail services and real-time information services (financial as well as
news). The importance of the activities is summed up in table 3.
Only five respondents gave percentages of their turnover for multimedia products. The
weighted mean here was only 0,6%. This portion of turnover was almost totally (97%)

17
due to multimedia type 1 (text with graphs, tables and pictures), only 2% was due to
multimedia type 2 (text with audio).
Table 3. Supply survey: breakdown of electronic information services of the
respondents.
Weighted mean value, %
Hosting retrospective database services 18 Magnetic information media 9,6 Database production 8,8 CD-ROMs 6,3 Electronic mail services 4,3 Real-time information services 3,0 Further online services 2,0
2.3.3 Analysis geographically and by subject area
Question No. 5 (Income by geographic distribution in 1994) was answered by 40
respondents (about 95% of the total). Amost all of them got the largest part of their
income from the domestic market (mean value 98). The remaining income comes largely
from EEA countries (other EU and EFTA countries). Their mean value was 1.6.
Practically only two to three of the respondents get any considerable share of their
income from countries outside Finland. All of them are real-time information service
hosts. One is a supplier of real-time tailor-made business news, with subsidiaries in
Europe and elsewhere in the world.
More than half of the respondents (24 out of 42) indicated the break-down of their
income in various categories (cf. table 4). Scientific, technical and medical information
(STM) was the most important category (weigth factor 57). No other categories came
even near such percentages in the answers.

18
Table 4. Supply survey: breakdown of income of the supplier respondents by subject
area.
Weighted mean, %
Scientific, technical, medical information 57 Other information 13 Finance, stock exchange, banking 9 Further business and economic information 8 Company profiles, credit ratings 3 Legal information 3 Government information, political news 3
2.4 COST ANALYSIS
ProfitabilityThe suppliers were asked two questions about profitability. One of them was about the
profitability of the electronic information services sector in their organizations and the
other about covering these activities. Out of a total of 28 answers, 16 (about 57%) stated
that their activities in the electronic information services sector were profitable in terms
of operating costs only, in 12 cases they were not. Nearly two out of three respondents
stated that the corresponding activities were not profitable at all in terms of full costs
(20 respondents out of 31).
The majority (9 respondents, i.e. 60%) of the 15 respondents who answered the other
question said they expect to cover their operating costs of electronic information
services activities only at a later date or never. Only six respondents of 15 (40%)
expected to have their full costs covered either in 1996 or 1997, while a great majority
(16 out of 19) did not expect ever to cover the full costs.
CostsFewer respondents (19 out of 42, i.e. 45%) stated their total costs in the corresponding
question. The sum total of their total costs in 1994 amounted to 269,2 million FIM (43,5
million ECU). The mean value then was almost 14,17 million FIM (2,28 million ECU).
Staff costs accounted for the greatest part (61%) of all the respondents' costs, based on
answers from 23 respondents. Investment expenditure had a share of 6% and other costs
33%.

19
Costs of gathering, processing and editing data played the major part in the break-down
of the respondents' costs, an average of 41%. User service and training accounted for
about 30% of the costs, technical operation for 17%.
2.5 OUTSOURCING ACTIVITIES
About 76% of all the 42 respondents (32 organizations) indicated their outsourcing
activities. About half of them carried out their data gathering, processing and editorial
activities internally (15 respondents), as well as their technical operations (16
respondents). The majority of PR activities was handled internally, and so was also
marketing.
In software development and maintenance 45% of the respondents relied on external
expertise, and 29% carried out these activities both internally and externally. Data
gathering, processing and editorial activities were also carried out both ways by 40% of
the respondents. Further activities not listed in the questionnaire were indicated by
seven respondents, and mostly carried out by the responding organizations themselves.
2.6 FURTHER INFORMATION ABOUT THE SUPPLY SIDE
It was not possible to draw conclusions from the responses to the supply questionnaires
about the total market of the supply side of electronic information services in Finland in
terms of money. Among 70 Finnish hosts, there are about a dozen major ones in the
supply market. One of the national hosts, VTKK Information Service Ltd. (nowadays
TT-Information Service Ltd.), as host of the retrospective online information system
MINTTU, is the leader in the market since the 1980's in supplying retrospective
scientific, technical and legal information, together with business news. They host about
80 databases. Several university libraries in Finland are producers, and some of them
also hosts of retrospective databases in science, technology, medicine, economy and
business.
The major international online hosts used in Finland are likely to be Knight-Ridder with
Dialog and Data-Star, STN International, ESA-IRS, FT Profile and Questel/Orbit.
Reuters is the leader in the real-time supply side, competing with a major Finnish and
some other international hosts. Almost all the representatives of foreign hosts declined
to answer the questionnaire and, instead, referred to the parent company. Since they

20
play an important part in the market in Finland, it wasn't either possible to come to any
reasonable figures in terms of money.
Information was gathered from printed sources and from experts about the markets for
real-time and audiotex services as well as the advanced supply and use of telematic
information services in Finland. The following chapters deal with both supply and
demand.
2.6.1 Supply of real-time financial and news information
A summary publication entitled "Joukkoviestinnän talous 1993. English summary: The
Finnish Mass Media Economy" was given out by Statistics Finland in 1994. According
to this publication the turnover for electronic media total in 1993 was 2 987 million FIM,
representing 20,1% of the mass media total of 14 838 million FIM (cf. chapter 4.2.1).
Electronic media in this statistics consists of nationwide television and radio, local radio,
cable television and electronic data services. The share of electronic data services
accounted for 1,6% of the mass media total in 1993, remaining at about the same level
as in the previous year. The estimated turnover of electronic data services was 235
million FIM (205 million FIM in 1992).
Hosts of real-time financial and news services accounted for most of the 235 million
FIM (38 million ECU) mentioned in the statistics. There are both national and
international suppliers on this market in Finland. One of them is likely to cover about
half of the total turnover. Based on information about the turnover of the major
suppliers, and even if we consider that they represent at least 80% of the market, the
turnover of 235 million FIM seems to be too high. The sum includes other kinds of hosts,
too, and so does not comply with the categories of MSSTUDY. Based on other sources
(database references, annual reports etc.) we would estimate that the turnover of the
major hosts, international as well as national, for real-time financial and news services
supplied in Finland amounts to something around 200 - 220 million FIM (32 - 35 million
ECU).

21
2.6.2 Audiotex services
Audiotex services here denote automatic value-added telephone services, based either
on speech or voice transmission. They may be dial-and-listen services or interactive
services and either subject to charge or free-of-charge to the caller. They may be
grouped to a) those giving some kind of information on a particular subject and b) other
services.
Audiotex services that are subject to charge, so called premium rate services, and are
usually grouped into services giving information (telephone numbers in Finland usually
beginning with 9600 or 0600) and other kinds of premium rate services (numbers
beginning with 9700 or 0700). Services free-of-charge to the caller (in Finland beginning
with 9800 or 0800) are paid for by the one receiving the call. Some examples of
audiotex services are time and date information, news and weather, tax and medical
information, traffic and road information, telephone numbers, wake-up service, bonds
and securities information and poetry telephone.
In spring 1994 there were approximately 6300 audiotex telephone numbers, of which
2800 subject to charge and 3500 free-of-charge to the caller. Table 5 and 6 give an
overview of the use of premium-rate audiotex services in Finland.
Table 5. Use of premium-rate audiotex services in Finland (Televiestintätilasto 1995,
p. 55).
Year 1993 Year 1994
Number of telephone calls 20 million 23 million Number of minutes 48 million 52 million
Two groups of operators supply audiotex services, Telecom Finland and the Finnet
group of regional telecommunications companies. Telecom Finland provides for about
70% of the audiotex service numbers in Finland. The number of users of audiotex
services is about tenfold that of videotex services.
In Finland it is not the operators who determine the prices of audiotex services that the
caller pays, but the producers of audiotex information. The producers then pay the
operators their share of the price. This kind of situation is contrary to general practice
elsewhere in Europe. Therefore, the turnover of the telecom operators does not give a

22
good overall picture about the audiotex market in Finland. One should rather talk about
the money that consumers spend for audiotex services. According to expert estimates,
the market for audiotex services in Finland in 1994 amounted roughly to 375 million
FIM, i.e. about 60 million ECU (there are estimates from 300 to 375 million FIM).
According to an estimate, entertainment services account for about 180 million FIM (29
million ECU). The remaining 195 million FIM (31,5 million ECU) would then account
for other kinds of services, more or less for professional purposes.
Table 6. Use of Telecom Finland's premium-rate audiotex services in 1994 (Televies-
tintätilasto 1995, p. 55).
Service Percentage, %
Customer services 10 Subscription services 5 Banking services 9 Expert services 21 Media services 10 Voting services 1 Contact and other entertainment services 44 Total: 100
Controlling the use of audiotex services has become a major topic in the branch in
Finland. Members of the working group set up by the Ministry of Communications have
proposed that audiotex services be divided into four groups. These would be 1) services
of general usefulness, 2) those for transacting business, 3) those for pastime and 4)
contact services. The user could tell his teleoperator, if he wishes to have access barred
to some of the groups from his telephone, from 1996 onwards.
2.6.3 Internet
Internet services are provided in four major nationwide networks, those of Telecom
Finland, the Finnet Group of regional telecommunications companies, Helsinki
Telephone Company and Eunet Finland. FUNET, the academic network of Finnish
universities, financed in cooperation by the Ministry of Education and universities,
handles a significant part of the operations. Besides, two dozen smaller suppliers,
including commercial companies and various user associations, buy their lines from the
bigger operators.

23
In July, 1995 (acc. to information from TELMO, the Finnish Association for Network
Services, originally from Network Wizards) there were about 111 000 Internet servers in
Finland. Growth from July, 1994 to July, 1995 has been tremendous, about 125%. In
Sweden the growth rate in the corresponding period was about 100%. As to the number
of Internet hosts (servers) per 1000 inhabitants, Finland is No. Two in the world (see
table 7). There is an estimate about the percentages of the number of registered hosts
within the .fi domain. According to this estimate EUnet Finland would have a 54% share
of the number of such .fi hosts. The next biggest share would be taken by Telecom
Finland. There are also other estimates with different percentages.
Internet users may be estimated to number about 200 000, about 5% of the population
of Finland. Half of the usage of Internet is commercial usage. Some 50 000 people user
Internet daily in Finland. FUNET has about 50% share of the microcomputers connected
to Internet. EUNET Finland about 35%. The rest of the microcomputers are connected
to Internet via Telecom Finland, the Kolumbus network of Finnet Group or a company
called Clinet Oy.
The networks are alive with versatile activities: municipalities, schools and other
educational institutions build their own local area networks. These LANs will be
connected to commercial networks, and there are plans for connections from e.g.
schools
to municipal libraries.
Telecom FinlandTelecom Finland supplies interfaces in Datanet. New Internet services for SMEs have
been launched in 1995. They are the iNET service directory, Internet user package,
new connections via Internet kiosk and the value-added public network service
Telesampo, as well as various electronic mail and News services. Information providers
can market their services to Finnish Internet users in the new iNET directory. Access to
Internet is also available as a kiosk service without a user ID.
EUnet FinlandEnterprises account for the major part of EUnet Finland's turnover. Some 300 to 350
enterprises among EUnet's customers have a leased line. About 2500 customers have
private lines, even some companies have a separate modem line. With companies going
over to multiservice networks, EUnet Finland estimates that Internet becomes one
service among many.

24
Regional telecommunications companiesThe regional telecommunications companies have lately been grouped into Finnet
Group. Kolumbus is the brand name of the national network service (LanLink) of
regional telecommunications companies. It is marketed by the bigger regional telecom
companies. The package consists of Helsinki Telephone Company's router network
which includes electronic mail service Elisa, public information network Infotel (kiosk
service) and Internet connections.
FUNETAll Finnish universtities and most polytechnic institutes are members of FUNET,
together with over 30 other public and industrial research institutes. - FUNET's future
plans include a new server. The trunk-line network will be updated into an ATM
network, with the speed multiplying from the present. It will then be possible to include
new applications in the network, e.g. those for distance learning and medical purposes.
Freenet, Internet and schoolsFreenet is an educational network project that started in 1993. Freenet provides
electronic mail and bulletin board services and Internet connections for pupils, students
and teachers in primary, secondary and vocational schools. By the end of 1994, there
were 27000 Freenet user IDs, in May 1995 as much as 32000, of which boys account
for about 60%. Freenet has been developed with the aim of providing future citizens
with basic skills in electronic communications and new technologies as early as
possible.
The national information strategy for education and research was launched in January,
1995. All the pupils at comprehensive schools will be taught the basic skills in word
processing, sending electronic mail messages and looking for information in Internet and
other networks. The Ministry of Education regards libraries as important knots in the
network of the Information Society.
The Ministry of Education has plans to connect schools and other educational
institutions to international information network by the year 2000. The Government
aims at proving 20 000 new microcomputers to schools, the first in 1996. The cost of the
four-year-project will be 720 million FIM (116 million ECU), with all the equipment,
network connections, educational material and training of teachers.

25
Table 7. Number of Internet servers in relation to population in July, 1995 (Internet
statistics from TIEKE, Information Technology Development Centre, Aug. 14, 1995;
based on Statistical Yearbook of Finland 1995 and on information by Network
Wizards).
Servers/hosts per 1000 inhabitants
Iceland 26,15 Finland 22,19 USA 16,74 Norway 15,54 New Zealand 12,85 Sweden 12,30 Denmark 7,15 Great Britain 5,03
The figure for USA includes "country codes" edu, com, gov, mil, org, net, us and int; some ofthese are in international use. The corresponding codes are not included in the target country'sfigures.
2.6.4 Telematic information networks
Finland is highly advanced in supplying interactive open information networks for public
use. Two major suppliers of such value-added telematic information networks share the
market in Finland, Telecom Finland with its Telesampo network and the group of
regional telecommunications companies with the Infotel network. Infotel is divided into
two services, one for private ditizens and Business Infotel for enterprises. Access to
Telesampo or Infotel is available to a microcomputer user either with a user ID or as a
kiosk service, where the costs will be charged in the user's telephone bill. Both
Telesampo and Infotel are menu-based service networks where the users from their
computers can access online databases, videotex services and messaging services.
Truly telematicTelesampo started as early as 1987, at that time by videotex technology. At present,
videotex technology is hardly used at all any more in Finland. Nowadays over 90% of
Telesampo services are in ASCII form, including banking services. Telematic services in
Finland are thus truly "telematic" also by technology, combining the data transmission
capacity of telecommunications networks with the intelligence of computers. There are

26
only a couple of suppliers left in Finland who offer services based on videotex
technology which has slowly but surely been replaced by more advanced telematic
technologies.
These telematic networks provide a variety of information to private citizens and
enterprises in Finland. The choice ranges from marketing channels and public forums of
discussion to supplying news and weather forecasts, telephone catalogues, electronic
mail and banking facilities as well as entertainment. They also give information about
timetables and travelling, business and companies, health and social security, adp
services, agriculture, municipalities and parishes, government institutions and other
organizations, and provide gateways to national and international online and videotex
information services.
TELMO, the Finnish Association for Network Services, annually gathers information
about and estimates the usage of publicly available telematic value-added networks.
According to TELMO, 215 000 Finns used the service networks in 1994, i.e. more than
4% of the population. It may be estimated that the total turnover of telematic services in
Finland, of Telesampo and Infotel, amounts to something between 45 and 55 million
FIM (from 7,27 million to 8,88 million ECU).
Altogether, the Finns spent about 715 000 hours in using telematic information networks
in 1993 and 985 000 hours in 1994, a growth rate of about 38%. It is estimated that
about 80% of the use of telematic services comes via kiosk services. Usage of kiosk
services has also shown the most rapid growth rate in the past few years. Telematic
services were mostly used for banking, for over 42% of the minutes spent in the
services. Tables 8 and 9 show the number of users, user groups and use by services.
Table 8. Users of telematic information networks in Finland, 1993 and 1994 (Televies-
tintätilasto 1994, p. 52 and Televiestintätilasto 1995, p. 54).
1993 % 1994 %
Number of users 175 000 100 215 000 100User groups:- large companies 52 000 29,7 56 000 26,1- SMEs 28 000 16 32 500 15,1- public administration 27 000 15,4 31 000 14,4- organizations, associations 6 000 3,4 6 500 3- households 62 000 35,5 89 000 41,4

27
Table 9. Use of telematic information networks in Finland, 1993 and 1994, in %
(Televiestintätilasto 1995, p. 54).
1993 1994Use by services:- tourism, travel information 0,4 0,5- banking 48,3 42,5- telephone catalogues 3,9 4,2- economy 5,4 4,3- subsribing services and electronic markets 12,5 12,7- news and weather 3,1 4,8- messages, electronic mail 11,4 15,8- entertainment 11,2 10,3- other 3,8 4,9
Total: 100 100
2.6.5 Electronic mail suppliers
There are many kinds of players in the electronic mail services market in Finland. They
include both public and private companies, as well as many voluntary organizations, pc
user groups or associations. The user groups or associations do not work on a
commercial basis so they don't usually have any revenue.
Major commercial electronic mail services are provided by big telecommunications
operators and computing centres, big public companies and also by hardware and
software suppliers. Based on the supply survey and some other information, a rough
estimate may be made that turnover of the major four to five electronic mail suppliers
amounts to approx. 45 to 50 million FIM (7 to 8 million ECU). These figures do not,
however, include e.g. all the computing service companies which offer electronic mail
services as part of their activity.
It is estimated that about 350 000 Finns use electronic mail services. Besides the
services on a commercial basis, there are dozens of services that are not commercial.
FUNET, the Finnish universities' network, provides electronic mail services and Internet
connections. Tens of thousands of pupils and teachers in schools use Internet and

28
electronic mail services via the Freenet network, tens of thousands of university students
also have access to electronic mail and Internet services.

29
3 DEMAND SIDE SURVEY
3.1 ALL DEMAND SIDE TARGET GROUPS
In the demand side survey Finland chose to survey the compulsory group of a)
information brokers and three other target groups. These were b) the main scientific,
research and special libraries, c) the main public libraries and d) companies in the
chemical or pharmaceutical industry with their own information service units.
Altogether, 108 demand questionnaires (Annex No. 2) were sent out in Finland in May,
1995, about the use of electronic information services for professional purposes. The
target groups consisted of 33 information brokers or external information intermediaries,
10 enterprises in the chemical and pharmaceutical industry, 41 scientific, research or
special libraries and 24 main public libraries.
Chapter 3.1 gives a general overview of all the demand side groups that were covered
by quantitative means. Chapters 3.2 through 3.5 characterize each target group
separately.
No overall conclusions about the demand for electronic information services in
Finland in 1994 can be made, based on the responses alone. Figures given below refer
only to the corresponding group and are based on the number of answers to that specific
question.
Information brokersThere is only a minor number of private information brokering firms in Finland, and
their revenues, if any, are of no significance. Most of the brokers are public
organizations, big scientific, research or special libraries with information service units.
Some branch organizations or industry federations also act as information brokers and
intermediaries for their members, e.g. in the pulp and paper and food industry. The
number of questionnaires sent out totalled 33, including 13 scientific or research
libraries which participate in the Union statistics of research libraries in Finland and can
also be regarded as brokers. In counting and analyzing the responses they are part of the
brokers' group.
Information intermediaries in the industrial target groupFor the demand survey, Finland chose one target group in industry which represents
users and information intermediaries traditionally active. Enterprises in the chemical and

30
pharmaceutical industry have been, and still are, pioneers and some of the most active
users of online information in our country. The major companies in the branch have
long established information service units or departments of their own. Based on the
member register of the Finnish Society for Information Services and personal knowledge
about the branch, 10 participants were chosen for the survey, nine major companies
with their own information intermediaries and the branch federation. The main
information service unit of the company was to include in the response also any
subsidiaries with information service units.
Scientific and research librariesFinland has a very well organized network of libraries, both public and scientific. The
major scientific, research and special libraries also act as information brokers so they
were a natural choice for the demand side survey. The Guidebook to scientific libraries
in Finland 1993 (Suomen tieteellisten kirjastojen opas 1993) lists as many as 784
scientific, research or special libraries. Since this was too large an amount to be covered,
a decision was made to send the demand questionnaire to the libraries that participate in
the annual research library statistics (Tieteellisten kirjastojen yhteistilasto, Union
statistics of research libraries) for the Ministry of Education. They numbered 47 in the
year 1993, 20 academic (university) libraries and 27 other kinds of research or special
libraries. In 1993 the total number of library units participating in the annual statistics
was 514.
It is in most cases the main library of the academic institution that acts as an information
broker or intermediary, offering services to external customers, too. For the demand
survey the main libraries were asked to gather relevant information from the libraries of
the institutes or other units concerned. In most cases, though, the main libraries only
answered for themselves.
Public librariesThe term 'district library' is used for the Finnish term 'maakuntakirjasto'. A district
library is a central library for a province or other larger area, and it coordinates certain
library functions within that area, e.g. interlibrary loans, and is responsible for holdings
of literature concerning that specific area. There are 18 district libraries in Finland.
Among public libraries, the district libraries, greater in size and importance and
corresponding to the central libraries elsewhere, were chosen for the demand side
survey. The questionnaire was also sent to Helsinki City Library (National Central
Library of the public libraries) and a few other major municipal libraries, together with

31
those public libraries that until March, 1995 had published their own World-Wide Web
pages.
The number of public libraries participating in the survey totalled 40. Some of the
libraries with WWW pages were, however, the same as the district and other major
municipal libraries so that the final number of participating libraries was 24.
3.1.1 Response rates and characterisation of respondents
The overall response rate was about 36% (cf. table 10), out of the 108 questionnaires
sent, 39 were returned. Response rates in the four target groups varied, and not all of the
respondents answered all the questions.
Table 10. The response rates of the demand survey.
Number of questionnaires Response rate
sent %
Information brokers 33 36
Scientific libraries 41 27
Public libraries 24 46
Industrial intermediaries 10 50
Total: 108 36
Legal status and staffThe respondents were given four alternatives in stating the legal status of their
organization: a) private company, b) public company (the majority of the shares owned
by the State, a special feature in Finland), c) public institution and d) semi-public
institution (e.g. chamber of commerce, branch organization). Five respondents were
from private companies, two from public companies. Among information brokers and
external intermediaries in Finland, 29 respondents were from public institutions. In
addition, three answers came from respondents in semi-public institutions. The average
number of full-time staff employed in the respondent's organization, based on 34
answers, was 508. The respondent' s department employed an average of 11 persons
(34 answers).

32
Information intermediary activities, services offeredThe respondents were asked to tick “yes” or “no” to a list of information intermediary
activities offered (demand survey questionnaire, question No. 2.1). Since all of them do
not carry out all kinds of activities, the number of “yes” responses to each alternative
naturally varied. Table No. 11 shows the variety of services offered.
Table 11. Demand survey: information intermediary activities in 1994 - services
offered.
Valid cases Yes (service offered)
Service:
Online electronic information services 39 37
Offline electronic information services 36 32
Offline library services, archival services 36 31
Training courses, further education 33 19
Consulting 33 23
Database production, input in databases 35 29
Software programmes, packages 28 4
Other information services 7 7
The alternatives of training and consulting were both answered by 33 respondents, 19 of
whom included training and further education in their services and 23 consulting
activities. Only four out of 28 respondents distributed software programmes or
packages, 24 did not have this activity.
Sources usedAll the respondents indicated which sources they used and how frequently (question No.
2.2). Printed media was used in 10 - 50% of the requests by 15 respondents, and in more
than 50% of the requests by 16 respondents. The most frequently used sources (in more
than 50% of the requests) included also internal online electronic information sources
and external online electronic information sources. Table No. 12 lists sources used in
more than 50% or in 10 to 50% of the requests (number of responses).

33
Table 12. Demand survey: information sources used in preparing and answering
requests.
Valid cases Frequency:
More than 50 % 10 to 50 % Less than 10 %
of requests
Source used:
Printed media 38 13 15 9
Personal contacts 37 16 20
Internal online EIS 38 22 8 6
External online EIS 38 15 19 4
External offline EIS 38 10 14 12
Other media 1 1
EIS = electronic information services
3.1.2 Revenues
Overall figuresOnly 19 out of 39 respondents gave their total turnover (revenue) figures for electronic
information services in 1994. The revenue figures given showed a huge variety. The
average turnover amounted to 703 400 FIM (113 600 ECU) in 1994, and the median
value to 225 000 FIM (about 36 300 ECU).
About half of all the respondents (20 out of 39) indicated the allocation of their total
turnover (revenue) to information services offered. Because of the customers' varying
needs for information, various services are used and money allocated in various shares.
Groups used in the questionnaire to indicate money allocation were the following: less
than 10%, 11 to 30%, 31 to 50%, 51 to 75% and 76 to 100%. Retrieval in online
electronic information services was allocated more than 50% of the total in five
organizations, retrieval in offline library services in four organizations. Five other
respondents allocated a share of 11 - 50% to retrieval in online electronic information
services, four to retrieval in offline electronic information services and three to retrieval
in offline library services. Most of the services were, however, allocated less than 10%
of the total revenue in most cases. Table 13 lists the allocation of total revenue to
information services offered.

34
Table 13. Demand survey: allocation of total revenue to information services offered (rough
estimates).
Valid Less than 11 - 30 % 31 - 50 % 51 - 75 % 76 - 100 %
cases 10 %
Service:
Retrieval in online EIS 18 8 3 2 1 4
Retrieval in offline EIS 14 9 2 2 1
Retrieval in offline library
services 15 8 2 1 2 2
Consulting 11 11
Database production/input 7 5 1 1
Software programmes/packages 5 5
Other information services 5 1 2 2
EIS = electronic information services
3.1.3 Analysis by type of customer
About 90% of the respondents (35 out of 39) answered the question about groups of
customers. Internal customers had an average share of 45% and external an average
share of almost 53% of the total number of the respondents’ customers. Most of the
respondents said that their revenue from both internal and external customers increased
in 1994 compared to 1993. Less than 20% reported a decrease, and for a couple of the
respondents the figures had remained the same.
The respondents were asked to indicate the most important sectors from which their
external customers came. The sectors given were a) manufacturing industries, b) service
industries, c) public sector and d) others. The response rate for this question was about
90%. Percentages given for the answer were as follows: less than 10%, 11 to 50%, 51 to
75% and 76 to 100%. External customers from the public sector were quite evenly
distributed in all the percentage categories, with a slight majority in the category of 11
to 50%.
External customers from service industries had a share of less than 10% in most of the
responding organizations. A total of 33 respondents indicated they had external

35
customers from the manufacturing industries sector. This sector accounted for less than
10% of the external customers of 10 respondents, and 11 - 50% by 5 respondents, but 9
respondents had more than 50% of their external customers from the manufacturing
industries.
3.1.4 Analysis of budgets or expenditures
Total budget according to functionsAbout 82% of the respondents indicated percentages of their total budget according to
functions listed in the questionnaire. Nearly all the functions were allocated less than
10% of the total budget, with only a few exceptions. The two most important exceptions
were internal database production and maintenance (11 - 75% of the budget by 15
respondents) and printed media (11 - 75% of the budget by 20 respondents); see table
14.
Total budget and expenditure for electronic information servicesMost of the respondents (32 out of 39) indicated their total budget. An average budget
in 1994 amounted to about 7 227 000 FIM (1 167 000 ECU), but the differences were
very great (standard deviation 11 million FIM). The median value of the total budget
was 2 350 000 FIM (about 379 600 ECU).
Total expenditure for electronic information services was given by 29 respondents. The
average expenditure in 1994 was 305 320 FIM (about 49 319 ECU), the median 150 000
FIM (24 200 ECU). Variations here were very great, too, see table 14.
Analysis of expenditure by type of product and subject areaMost of the respondents indicated percentages of their use of electronic information
services by type of product (32 respondents out of 39, i.e. 82%) and by subject area (31
respondents out of 39, i.e. 79%).
As to type of product or service, more than 51% of the total expenditure was used for
retrospective online information services by 15 respondents out of the 29 who gave
percentages to this alternative. Most of the respondents, however, indicated that less
than 10% was used for most of the product types. The respondents’ total expenditure for
the use of CD-ROMs ranged from less than 10% (11 responses) to 11 - 50% (nine
responses).

36
Table 14. Demand survey: total budget allocated to different functions (rough
estimates).
Valid cases Less than 10 % 11 to 50 % 51 to 75 % 76 to 100 %
Function:
Online EIS 30 21 7 2
Internal DPM 28 13 14 1
External DPM 21 20 1
Offline EIS 24 20 4
Printed media 29 7 16 4 2
Management,
administration 25 17 5 3
Outsourcing 19 17 2
Administration
of archives 19 17 2
Further education
and training 26 25 1
EIS = electronic information services, DPM = database production and maintenance
Considering the subject areas and expenditure categories which were listed in the
corresponding question (No. 3.3.3 in the demand survey), scientific, technical or medical
information was mostly ticked in the category of over 50% (14 respondents). The
expenditure for almost all other subject areas was less than 10% (responses ranging from
14 to 16 in each category). Table 15 shows the expenditure for the use of EIS by type of
product or service, table 16 by subject area in 1994.

37
Table 15. Demand survey: expenditure for the use of electronic information services
by type of product or service in 1994.
Valid Less than 11 - 50 % 51 - 75 % 76 - 100 % cases 10 %
Product:
Retrospective online
database serv. 29 10 4 8 7
Real-time
information serv. 20 12 5 2 1
Videotex serv. 11 11
Audiotex serv. 13 13
E-mail services 18 15 3
Other online serv. 2 2
CD-ROMs 24 11 9 4
Other offline EIS 7 5 1 1
Other optical media 4 4
Magnetic inform.
media 6 6
EIS = electronic information services
Table 16. Demand survey: expenditure for electronic information services by subject
area in 1994 (see notes on p. 38).
Valid cases Less than 10 % 11 - 50 % 51 - 75 % 76 - 100 %
Subject area:
Finance 15 14 1
Company 17 14 3
Further business 20 13 7
Legal inform. 21 16 4 1
Patent inform. 22 18 2 2
STM inform. 29 7 8 3 11
Government 18 16 2
Travel 13 12 1
Other subjects 7 3 1 3

38
Notes to table No. 16:
Finance = finance/stock exchange/banking; Company = company profiles and credit ratings; Further
business = further business and economic information; STM = scientific/technical/medical information;
Government = government information/political news.
3.1.5 Barriers of using electronic information services
Over 89% (35 respondents out of 39) answered the question about barriers hindering
their customers from using electronic information services by themselves. Combining
the two most important barriers (ratings 4 and 5) and the two least important barriers
(ratings 1 and 2) we come to the figures in table No. 17.
The most significant reasons for not using electronic information services were lack of
awareness from the user's point of view, technical barriers, lack of user-friendliness and
too high prices of host services. Language, resistance from management, staff costs or
lack of experienced staff were not considered barriers by the respondents. The following
could be barriers in some cases, and no barriers in some others: lack of awareness, lack
of experienced staff, lack of user-friendliness, technical problems and cost-benefit
relations as well as the fact that information required is not available.
Respondents in the different target groups listed the barriers slightly differently. More
than 80% of the brokers answered this question. They did not usually consider technical
problems or network deficiencies a problem. There is a well-functioning packet-
switched data communications network in Finland, and a high standard of information
technology. Staff costs were not either any barrier. Information brokers regarded lack of
user-friendliness of electronic information services and lack of awareness from the
user’s point of view as the most important barriers. Information intermediaries in the
industrial target group (chemical/pharmaceutical industry) found lack of experienced
staff and the user’s lack of awareness important barriers. Technical problems were also
mentioned. Language was not a problem, nor was the price of services. Staff costs,
resistance from management, network deficiencies or budgetary reasons were not
regarded as very important barriers.

39
Table 17. Barriers of using electronic information services (35 responses).
Most important Least important
barrier barrier Lack of awareness from the user's point of view 19 responses 3 responses Lack of experienced staff 7 14 Technical barriers 15 8 Lack of user-friendliness 13 7 Information required is not available 6 15 Language problems 4 25 Cost-benefit relation 6 14 Prices too high 13 11 Staff costs 8 17 Resistance from management 1 19 Budget reasons 14 9 Network deficiencies 9 13 Other reasons 1
All scientific and research libraries that sent their responses also listed the most and least
important barriers. Lack of experienced staff, language problems, resistance from
management or cost-benefit relations were not regarded as barriers. Instead, lack of
awareness from the user’s point of view, lack of user-friendliness, budget reasons and
the high prices of host services were considered significant barriers. - Respondents in
public libraries shared the opinion of the scientific libraries in that they considered lack
of awareness from the user’s point of viewhe most important barrier. The following were
usually not considered significant barriers: too high staff costs, resistance from
management, cost-benefit relations, language skills, lack of experienced staff or the fact
that information required is not available.
3.2 INFORMATION BROKERS
3.2.1 Response rates and characterisation of respondents
The demand questionnaire was sent to 33 organizations which can be considered
information brokers. Seven of them also are scientific libraries, but were in MSSTUDY
listed and regarded as brokers in analyzing the answers. The response rate of the brokers
was 36%.

40
Almost all information brokers in Finland are public institutions. There is only a minor
number of private brokering enterprises in Finland, with hardly any significant revenues.
In addition to the most important university and other scientific or research libraries,
some branch organizations and industry federations also act as information brokers for
their members.
The brokers' organizations employed an average of 152 persons. About nine persons
were employed in the department as intermediaries or information professionals. - All
the information brokers are members of either the Finnish Society for Information
Services or the Finnish Research Library Association, or both.
Services offeredAll the brokers who answered the questionnaire are engaged in retrieval in online
electronic information services. Retrieval in offline electronic information services as
well as retrieval in offline library services was offered by 77% of the respondents. Most
of the respondents were also engaged in training, consulting or database
production/input in databases..
Sources usedAll the respondents indicated which sources they used in their intermediary activities.
External online electronic information services were used in over 50% of the requests
by the respondents (58%), in 10 - 50% of the requests by over 41% of the brokers. One
third of the respondents used internal online electronic information services or external
offline electronic information services in more than 50% of the requests received.
Printed media was used in 10 - 50% of the requests by almost 54% of the brokers,
personal contacts nearly to the same frequency. Internal or external online or external
offline electronic information sources were used in more than 10% but less than 50% of
the request by about 40% of the respondents). Table 18 gives an overview of the
sources used in requests.

41
Table 18. Demand survey: information sources used in requests by information
brokers, according to frequency.
More than 10-50 % Less than
50 % of requests of requests 10 % of requests
% % %
Printed media 54 31
Personal contacts 46 46
Internal online electronic
information sources 33 42 8
External online electronic
information sources 58 42
External offline electronic
information sources 33 42 17
3.2.2 Revenues and customers
Among the brokers, nine respondents stated their total revenue from information
services in 1994. The sum total was about 4 393 000 FIM (almost 709 800 ECU), an
average revenue 488 200 FIM (78 900 ECU). Standard deviation here, however, was as
much as 605 000 FIM (97 800 ECU).
Eight brokers gave the allocation of their total revenues. Retrieval in online electronic
information services accounted for 76 - 100% of the revenues of three respondents, and
less than 50% in the revenues of four respondents. Consulting accounted for less than
10% of the revenues of all the five brokers who mentioned it in their answers. So did
retrieval in offline electronic information services; four respondents altogether ticked
various alternatives for this alternative.
Analysis by type of customerAbout 45% of the brokers’ customers (by the number of customers) were internal, i.e.d
from their own organizations, and 52% external customers.
All the brokers indicated the sectors from which their most important external customers
come. The majority of them had external customers from the public sector. For half of

42
them, the public sector accounted for 11-50% of the external customers, for 16% less
than 10% of their external customers. University staff is included in public sector
customers.
Manufacturing industries accounted for the majority of external customers, more than
75% of all the external customers the information brokers had. One third of the
respondents indicated that one of every three external customers came from the
manufacturing industry. For half of the respondents, service industries only accounted
for less than 10% of the external customers.
3.2.3 Analysis of budgets or expenditures
Total budget according to functionsAlmost 85% of the brokers indicated percentages by functions of their total budget.
Less than 10% of budget money was used for online electronic information services by
about 66% of the respondents. Less than 10% was also used for external database
production and maintenance, outsourcing and administration of archives. More than
80% of the respondents allocated less than 10% of budget money to offline electronic
information services.
Only 11% of the respondents allocated more than 76% of budget money for online
electronic information services. About 22% of the respondents allocated 11 - 75% for
this purpose. About half of the respondents allocated the same percentage of their
budget to printed media. About two out of three respondents allocated 11 to 75% of
their budget money to internal database production and maintenance. External database
production and maintenance, outsourcing, administration of archives and management
and administration also had a share of 11 - 75% of the budget, as stated by about one
third of the respondents.
Total budget and expenditure for electronic information servicesThe figures for the total budget were given by 85% of the respondents. There were great
differences in the amounts given, but an average budget amounted to 5 665 000 FIM
(915 000 ECU).
The total expenditure for using electronic information services, in running costs only,
was indicated by about 70% of the respondents. This expenditure also varied a lot. An
information broker used an average of 377 000 FIM (61 000 ECU) for electronic
information services (running costs only) in 1994.

43
Analysis of expenditure by type of product and subject areaAs to expenditure by products/services, more than 76% of the total expenditure was
spent for retrospective online database services by half of the respondents. One third of
the respondents used 51-75% for this purpose. All the respondents used less than 10%
for audiotex services, and three quarters of them used less than 10% of their total
expenditure to real-time information services, e-mail services or CD-ROMs.
Ten brokers gave percentages by subject areas. Scientific, technical or medical
information was stated by 9 brokers. Six of them spent 76% or more of their total budget
for these subject areas, mostly scientific or technical. Patent information was indicated
by eight respondents, but the majority of them (5 out of 8) spent less than 10% of the
total budget for this subject area. The other subject areas listed in the question were
replied by one to three brokers each. It is, of course, natural that if a broker is
specialized in a certain area, e.g. scientific and technical information or legal or patent
information, the majority of the expenditure takes more than 75% of the total for this
special area.
3.3 SCIENTIFIC AND RESEARCH LIBRARIES
3.3.1 Response rates and characterisation of respondents
The number of scientific and research libraries in the address list for the demand survey
consisted of 54 libraries. Since 12 of them could also be regarded as information brokers
and one of them also belonged to the industrial target group, the final amount of
questionnaires sent to scientific or research libraries was 41. The response rate of this
target group was 27%.
According to the Guidebook to scientific libraries in Finland 1993 (Suomen tieteellisten
kirjastojen opas 1993) there are almost 800 scientific, research or other special libraries
in Finland. The demand questionnaire was sent to the libraries that participate in the
annual research library statistics (Tieteellisten kirjastojen yhteistilasto, Union statistics of
research libraries) for the Ministry of Education (47 in the year 1993).
It is in most cases the main library of the academic institution that acts as an information
broker or intermediary, offering services to external customers, too. For the demand
survey the main libraries were asked to gather relevant information from the libraries of

44
the institutes or other units concerned. In most cases, though, the main libraries only
answered for themselves.
One of the responding scientific or research libraries was a semi-public organization, all
the other were public institutions. Since most of the respondents were libraries of big
universities, the number of staff employed by the university was given as the number of
staff employed by the company. The average figure was 620. Standard deviation here
was very great. The department employed about 8 persons.
Services offeredAll the respondents indicated the services they offered. Almost all of them are engaged
in retrieval in both online and offline electronic information services and database
production or input in databases. More than 80% of the respondents, naturally, offer
retrieval in offline library services, as well as training and consulting.
Sources usedAll the respondents mentioned the sources they used for requests, and the frequency of
use. Printed media was used in 10 to 50% of the requests by most respondents. Internal
online electronic information sources, the libraries' own online catalogues and registers,
were used for more than 50% by half of the respondents. External online electronic
information services were used for more than half of the requests by almost 42% of the
cases. In 10 to 50% of the requests they were used by the same percentage of the
respondents, too. Table 19 gives an overview of the sources used by scientific and
research libraries, according to frequency.

45
Table 19. Demand survey: information sources used in requests from customers by
scientific and research libraries, according to frequency.
More than 10-50 % Less than
50 % of requests 10 % of requests
% % %
Printed media 8 58 33
Personal contacts 55 46
Internal online electronic
information sources 50 17 33
External online electronic
information sources 42 42 17
External offline electronic
information sources 33 33 33
3.3.2 Revenues and customers
Two thirds of the respondents gave their revenues for 1994. The average figure was
about 469 600 FIM (75 800 ECU). The standard deviation was as much as 594 800 FIM
(96 000 ECU) which signifies great variations in the amounts.
Three quarters of the responding libraries estimated the allocation of their total turnover.
Only two respondents indicated that more than 76% of the total was allocated to
retrieval in offline library services. Consulting and distribution of software programmes
both accounted for less than 10% in all the answers. Retrieval in online or offline
electronic information services were both allocated less than 10% of the total turnover
by most respondents, and from 11 to 50% in about equally many cases (3 to 4
respondents each).
Analysis by type of customerAll but one of the respondents indicated the percentages of their internal and external
customers, counted from the number of customers. Almost 38% of the customers were
external, and 62 internal. Public sector (including also universities etc. institutions) was
46
the most important external customer sector (over 51%). External customers from
manufacturing or service industries, instead, accounted for less than 50% of the total
number of customers.
3.3.3 Analysis of budgets or expenditures
Total budget according to functionsMost of the libraries indicated percentages by functions of the total budget. The
different alternatives received in average 7 to 10 answers each. Less than 10% of budget
money was used by the majority for online electronic information services, external
database production and maintenance, and also for management, outsourcing or
administration of archives. Printed media and internal database production and
maintenance both were allocated 11 to 75% of budget money by more than 60% of the
respondents. Further education was allocated less than 10% by most of the responding
libraries.
Total budget and expenditure for electronic information servicesTen respondents gave the figures of their total budget. There were great differences in
the amounts given, but an average total budget of a scientific/research library amounted
to about 2 588 000 FIM (418 000 ECU). The median value was 1 431 000 FIM
(231 000 ECU).
The total expenditure for using electronic information services, running costs only, was
given by 75% of the respondents. Again, the amounts varied a lot. Among the
respondents, an average scientific library used about 216 000 FIM (almost 35 000 ECU)
for electronic information services in 1994.
Analysis of expenditure by type of product and subject areaAs to expenditure by type of product or service, the majority (83%) of the respondents
indicated percentages of their expenditure by type of product and by subject area. Less
than 10% of the total expenditure was used by most of the respondents for
restrospective online database services, real-time information services, videotex,
audiotex or e-mail services, i.e.most of the products or services listed in the question.
Percentages from 11 to 50 or more than 51% were only mentioned by one to two
respondents each for retrospective online database services, e-mail services, CD-ROMs
or other offline electronic services.

47
Among the central research libraries in Finland each is a specialist in a certain area of
science or technology. Considering the total expenditure for electronic information
services by subject areas we note, however, that acting as a central research library
does not necessarily show in the percentages of expenditure. Over 80% of the
responding libraries spent less than 10% for company profiles, business and economic
information, patent or legal information. University libraries are not the places one turns
to for finance or stock information or company profiles or political news so that these
subject areas had almost nothing of the total expenditure for electronic information
services. Shares of less than 10% or 11-50% of the total expenditure were spent for
scientific, technical or medical information in about 22% of the cases each, whereas
44% of the respondents indicated an expenditure of more than 76% for scientific,
technical or medical areas.
3.3.4 Use of electronic information services by scientific and research libraries
The following further information is based on the annual Union statistics of research
libraries from 1993, the latest available at the time of collecting the information. The
Union statistics of Finnish research libraries consists of 20 academic library
organizations and 27 special libraries. The total number of library units participating in
1993 was 514.
Volume information is also gathered for the annual statistics about searches (counted as
loggings-in) from external online databases. In 1993 the Finnish research libraries made
a total of 28 286 searches (loggings-in) from external online databases. Academic
libraries made 18 612 searches and special libraries 9 674 searches. No money values
for this activity are, however, given, nor can they be estimated. Besides, all libraries do
not charge their customers for online searches.
3.4 PUBLIC LIBRARIES
3.4.1 Response rates and characterisation of respondents
Public libraries in municipalities in Finland form an internationally excellent network of
information providers, for private citizens and also for local business and industry.
Among the network of 998 public libraries, there are 18 district libraries, greater in size
and importance and corresponding to the central libraries elsewhere. They were chosen

48
for the demand side survey. The term 'district library' is used for the Finnish term
'maakuntakirjasto'. A district library is a central library for a province or other larger
area, and it coordinates certain library functions within that area, e.g. interlibrary loans,
and is responsible for holdings of literature concerning that specific area. The
questionnaire was also sent to Helsinki City Library (National Central Library of the
public libraries) and a few other major municipal libraries, together with those public
libraries that until March, 1995 had published their own World-Wide Web pages.
The number of public libraries in the demand survey totalled 40. Some of the libraries
with WWW pages were, however, the same as the district and other major municipal
libraries so that the final number of participating libraries was 24. - The response rate in
this group was almost 46%, with 11 respondents.
All the public libraries are, of course, public institutions. They are usually members of
the Finnish Library Association, some also members of other associations. - Ten public
libraries in this survey indicated the number of staff employed, an average of 112
persons. The total number of staff showed great variations since a big public library
which also acts as a district library, may have more than 100 employees. The
departments concerned employed an average of 20 persons.
Services offeredAll the respondents indicated the services they offered. Retrieval in online electronic
information services (mostly Finnish databases) was done by all, retrieval in offline
electronic information services or offline library services also by practically all. Nine
libraries were engaged in input in databases, but none in distribution of software
programmes. Four libraries offered consulting services, five did not. The majority of the
respondents did not give training courses.
Sources usedAll the libraries also indicated which information sources they used, and how frequently.
Printed media and internal online electronic information services were used most
frequently, in more than 50% of the requests by 7 respondents out of 10 and by all 11
respondents. External online information services were relied upon in 10 - 50% by 9
respondents, and external offline electronic information services in 10 - 50% by 6
respondents. Personal contacts were used in less than 10% of the requests by the
majority of libraries concerned.

49
3.4.2 Revenues and customers
Public libraries are mostly financed by public funding. Therefore no figures for revenue
or turnover can be given, nor any allocation according to services offered. - Most of the
public libraries' customers were external, of course. In only very few libraries, any
customer sector had more than 10% of the customers. In three cases the service industry
accounted for 11 - 50% of external customers.
3.4.3 Analysis of budgets or expenditures
Total budget according to functionsOver 72% of the responding public libraries indicated their budget allocations according
to functions listed in the questionnaire. Printed media was allocated 11 - 75% in the
budget of 75% of the libraries, and the same percentage was allocated to internal
database production and maintenance in four libraries. Less than 10% was allocated to
most other functions in public libraries in average, i.e. to online and offline electronic
information services, external database production and maintenance, management,
administration of archives, further education and training, and to outsourcing.
Total budget and expenditure for electronic information servicesAmong the respondents, almost 73% gave information about their total budget in 1994.
The average budget was 17 607 500 FIM (2 844 000 ECU), while the median value was
9 million FIM (almost 1 454 000 ECU).
Seven respondents (almost 64%) indicated their total expenditure for using electronic
information services, running costs only, in 1994. The average sum spent was about
524 000 FIM (almost 84 600 ECU), and the median 220 000 FIM (35 500 ECU). There
were again great variations in the sums given.
Analysis of expenditure by type of product and subject areaThe response rate for the question about the total expenditure for the use of electronic
information services by type of product was almost 73%. The same response rate applies
to the question about expenditure by subject area. By type of product, 11 - 50% of the
expenditure was used for CD-ROMs by five respondents out of seven who indicated
that they use this media. In almost all other types of products, the expenditure was less
than 10% each.

50
By subject area, 8 respondents gave their estimates. The total expenditure for scientific,
technical or medical information was 11 - 50% in the majority of the responses. All the
other subject areas had less than 10% of the total expenditure for electronic information
services by the respondents.
3.5 INFORMATION INTERMEDIARIES IN THE INDUSTRIAL TARGET GROUP
The sum of gross value of production in SIC classes (Standard Industrial Classification)
18, 19 and 21 (chemicals and chemical products manufacture, petroleum and coal
products and nuclear fuel manufacture, rubber and plastics products manufacture) in
1993 amounted to 37 360 million FIM, according to the Statistical Yearbook of Finland
1995. Altogether, these industries in 1993 had 457 establishments and employed over
14 000 salary earners and over 18 000 wage earners (cf. table No. 20 on the following
page).
There are 230 members in the Chemical Industry Federation of Finland, from small and
medium-sized companies (SMEs) to large conglomerations working both in Finland and
abroad. Their total turnover is a concept somewhat larger in scope than the gross value
of production of the above SIC classes.
The total turnover of the organizations in the chemical and pharmaceutical branch which
responded to the demand survey was about 40 762 million FIM (6 584 million ECU) in
1994.
3.5.1 Response rates and characterisation of respondents
Enterprises in the chemical and pharmaceutical industry are pioneers and traditionally
some of the most active users on online information sources in Finland. The big
companies in the branch have long established information service units or departments
of their own. Therefore, inter-mediaries in 10 big companies in the chemical and
pharmaceutical branches were chosen for the industrial target group of the demand
survey, and 50% of them filled in the questionnaire.

51
There were great differences in the numbers of staff employed in the respondents’
companies and in the departments concerned. The average number of staff employed in
the company was 2 063 persons and in the respondent's department about 6 persons.
Services offeredMore than half of the respondents offered retrieval in online electronic information
services and offline library services, as well as training courses. More than half of them
were, however, not engaged in retrieval in offline electronic information services, nor in
database production.
Sources usedAll the respondents indicated which sources they used for requests. In more than 50% of
the requests, most of them relied on printed media and external online electronic
information services. External offline electronic information services were used in less
than 10% of the requests by the majority. Personal contacts were mostly used in 10 to
50% of the requests.
Table 20. Manufcturing, data by branch of industry, 1993 (Statistical Yearbook of
Finland 1995, table 150, p. 166 - 169).
Total Manu- SIC 18 SIC 19 SIC 21industry facturing
Establishments 6 240 5 596 187 20 250
Owners (working in
the establishment) 1 443 1 424 4 - 45
Salary earners 122 020 110 613 9 286 2 259 3 045
Wage earners 245 871 231 318 8 773 1 478 8 506
Gross value of
production (million FIM) 321 610 281 493 17 925 12 610 6 825

52
3.5.2 Revenues and customers
Three respondents indicated their turnover from information services in 1994. The
average turnover was 2 300 000 FIM (371 500 ECU). There were great differences in
the figures.
Three respondents also indicated the allocation of their revenue to information services
offered. Retrieval in offline electronic information services and offline library services,
as well as database production and distribution of software programmes were each
allocated less than 10% by the majority of the respondents. The allocation in the
retrieval in online electronic information services was evenly distributed in three
categories, that of less than 10%, that of 11 to 50% and that of more than 76%.
Analysis by type of customerAlmost 75% of the customers of the intermediaries in the chemical and pharmaceutical
companies were internal, from their own company. Some of the respondents had 11 to
50% of their external customers from the public sector.
3.5.3 Analysis of budgets or expenditures
Total budget according to functionsAll the responding industrial intermediaries indicated the allocation of their budget
according to functions mentioned in the questionnaire. Most of the functions were
allocated less than 10% in most cases. Printed media was allocated 11 - 75% of the
budget in most cases.
Total budget and expenditure for electronic information servicesIndividual total budgets of the respondents showed great variations; the standard
deviation was as much as 2 516 000 FIM (406 000 ECU). An industrial intermediary in
the chemical and pharmaceutical target group had an average budget of 1 900 000
FIM (309 000 ECU) in 1994. The median value, however, was only 120 000 FIM
(19 000 ECU).
An industrial intermediary in the target group used electronic information services in
1994 to the average sum of 129 000 FIM (20 800 ECU). The sums again varied a great

53
deal, and the standard deviation was almost 124 000 FIM (20 000 ECU). The median
value for using electronic information services in the target group was 100 000 FIM
(about 16 000 ECU).
Analysis of expenditure by type of product and subject areaAll five intermediaries in the industrial target group indicated percentages of their use of
electronic information services by type of product and by subject area. Most of them
(80%) used more than half of the expenditure for retrospective online information
services. The rest of the various product types had a less than 10% share of the
expenditure. Notably audiotex, videotex and e-mail services were hardly used at all for
professional requests by the industrial intermediaries. This holds good for the other
demand survey groups as well. Real-time information services had a share of 11 - 50%
in three respondents' expenditure.
Requests vary a lot in industrial enterprises, and so do subject areas. The majority of
the respondents indicated shares of less than 10% for all the subject areas listed in the
demand side questionnaire. Only further business and economic information had a
bigger than 10% share of the expenditure in 40% of the responses. Expenditure for
electronic information services in the scientific, technical or medical area had varying
shares of the respondents' budgets, with 40% in the lowest category of less than 10%,
and with 20% evenly in all the other categories.

54
4 INFORMATION SERVICES INSTITUTIONAL INFRASTRUCTURE
4.1 LIBRARY SERVICES
4.1.1 General
Finland has a closely-knit library network. All the libraries and information service units
with their holdings and services, open for public use, belong to this well-functioning
library network (see figure 1). It consists of central research libraries, district libraries
(regional central libraries for provinces or other large areas), other regional, central and
research libraries, information service units in firms, archives and, to a certain extent,
also of museums. Library holdings altogether consist of more than 54 million volumes of
books and serials, and of an increasing amount of audiovisual and other non-book
material and computer records.
All of the most important scientific and research libraries are open to the public, and act
as information brokers in their special fields of knowledge. Helsinki University Library is
the National library of Finland, and Helsinki City Library is the National central library
for public libraries. There is an information system connecting about 800 scientific
library units, and another system which serves public libraries. All local systems are
interconntected, and national databases serve all users.
4.1.2 Scientific or research libraries
University libraries se up the main part of the almost 800 scientific, research and other
special libraries of Finland. The principle of free access to sources of information holds
good also here: all of the most important scientific and research libraries in Finland are
open to the public.
The total number of library units participating in the 1993 library statistics of Finnish
research libraries was 514. The Union statistics of Finnish research libraries consists of
20 academic library organizations and 27 special libraries.
Due to general economic depression in Finland, public funding of research libraries (the
term refers to scientific, research and other special libraries) was largely reduced. Most

55
libraries had to take rationalizing measures and work with limited resources. Research
library allowances were reduced by 3% from 1992 to1993. In 1993 the total expenditure
was 335,9 mill. FIM (not including housing), of which 269,9 million FIM was allocated
to research libraries. Staff salaries accounted for over 60% of the allowances,
acquisitions about 28%. In 1993, research libraries employed about 1220 persons
permanently full-time and 25 part-time.
In 1993 a total of 95,3 mill. FIM was used for acquisitions (compared to 107 mill. FIM
in the previous year). Monograph acquisitions in most libraries decreased by 30%
Altogether, 477 000 monograph volumes were acquired in 1993. The total stock of the
Finnish research libraries remained constant and was 18 mill. volumes at the end of
1993, of which about 15,3 mill. volumes in university or other academic libraries.
The total number of loans increased by 600 000 in 1993 compared to the figures of
1992. In 1993, over 4,4 mill. loans were supplied. Interlibrary loans received and
supplied amounted to 291 000 volumes. Interlibrary loans are chargeable, and thus the
numbers decreased by 27%. Libraries supplied about 3,6 million photocopies. It is
estimated that the number of photocopies taken by the customers themselves at the
library was more than 10 million (all libraries do not gather statistics about these
photocopies).
Research libraries do online searches for their internal and external customers. Based on
the number of loggings-in to databases, the number amounted to 35 000 searches
(loggings-in to a database) in 1993, with about 28 000 loggings-in to external databases.
The rest of the searches is done using the libraries' own databases and online registers.
All research libraries do not specify their user groups. Nevertheless, more than 6,8
million people used the various resources of the research libraries in 1994, with the
percentage of external users being 16,6. The share of external users in academic libraries
was about 15% and in special libraries as much as 47%.
Summary statistics about scientific libraries is shown in table No. 21. Information about
the activities of university libraries in relation to resources and student numbers is shown
in table No. 22.

56
Figure 1. The Finnish library netwowrk in 1990 (Laaksovirta & Haavisto 1990, p. 16).

57
Table 21. Scientific and research libraries in Finland, summary statistics from 1993
(Kirjastot 1993, p. 58 - 63 and 75- 76).
Library units 514 Working years 1 575 Permanently employed, full-time 1 224 (+ part-time 25) Loans supplied 4 437 000 volumes, of which:
291 000 interlibrary loans received and supplied
Number of online searches altogether 35 000, of which: from external databases 28 000 (loggings-in to a database)
References made to online bibliographic databases 375 000 to Finnish databases
13 000 to foreign databases Library holdings, total 18 178 000 volumes, of which
15 231 000 volumes in academic libraries
Table 22. Activities of university libraries in relation to resources and student
numbers in 1993 (Kirjastot 1993, p. 86).
Total expenditures 4,7 billion FIM (20 university libraries) Number of students enrolled 125 900 Library staff 22 500 Number of students in relation to library staff positions 121,5 Loans per student 30,6 Acquisitions per student 0,8 (book volumes) Library acquisitions in relation to the universities' total expenditure 1,7% Library staff in relation to the universities' total staff 5,5%
4.1.3 Public libraries
In Finland, public libraries have been an information resource for all kinds of purposes,
professional and other, for 200 years. They started as book clubs, the first of which was
founded as early as 1794 by members of the Vaasa Court of Appeal "for their own
amusement and recreation". The club members got books from all over Europe,
circulated them and then met to discuss the contents.

58
Finland's first Library Act came into force in 1929, with revisions in 1962 and 1986.
Members of the Parliament, at a debate in 1992, clearly voted in favour of continuing
the free-of-charge principle: "Use in the library of the library's own collections, and
loans therefrom, are free of charge". All libraries, both scientific, research and public,
are in principle open to everyone.
Public libraries in municipalities in Finland form an internationally excellent network of
information providers. They fulfill the cultural, recreational and information needs of
citizens and also support studying and information provision of one's own. Many public
libraries also are important sources of information to local business and industry.
Helsinki City Library is the National central library of public libraries in Finland. There
are another 17 district libraries in Finland. The term "district library" is used for the
Finnish term "maakuntakirjasto". A district library is a central library of a province or
other larger area, and it coordinates certain library functions within that area, e.g.
interlibrary loans, and is responsible for holdings of literature concerning that specific
area.
In 1994 Finland, with about 5 million inhabitants, housed 998 main and local municipal
libraries in over 450 municipalities. In addition, there were about 860 other lending units
and 200 mobile libraries (library buses) serving the readers, and 860 other units for
lending books. The number of libraries has decreased in the past few years, due to
economic recession; in 1993 there were 1025 public libraries, in 1989 the number was
1174.
4.1.3.1 Current statistics
Volumes in public libraries in 1994 totalled over 39 million issues, of which 36 million
books. New acquisitions totalled 1,8 milli on, including books, records and other audio-
visual material. (In 1993 new acquisitions totalled 1,9 million pieces and in 1989 they
totalled 2,5 million pieces.) People locally made more than 101 million loans in 1994.
Interlibrary loans received numbered 152 000, and interlibrary loans supplied amounted
to 133 000 pieces.
Finland's public libraries are internationally well-known for their high standard and
heavy use. The Finns and the Danes are the world's most active library users. Of the five
million Finns, about two thirds use library services regularly and 49% have a library

59
card. In 1994 they made 63 million visits to a library - every inhabitant about 12 times.
An average annual number of loans per inhabitant amounted to 20,2.
Operating expenditure of public libraries in 1994 was 1 016 million FIM, an average of
201 FIM per inhabitant. The top two libraries spent over 400 FIM per inhabitant, and
those with the least resources only about 70 FIM per inhabitant. Cuts in subsidies have
hit literature acquisitions the hardest in the past few years. Nevertheless, number of
loans has been growing by over 15% and visits to a library by over 20%.
4.1.3.2 Library automation in municipal libraries in 1994
Library automation is doing well in Finland. There are 29 clusters of 131 municipalities
engaged in the joint use of automated data processing for libraries. About 30% of the
municipalities belong to a library adp area. About one third of the libraries in Finland
belong to an adp cluster. In the spring of 1994, 68% of the municipalities had in use or
were about to start using computerized library systems, and 280 of them used databases.
Many municipalities have plans for the schools to access the public library catalogues
with their terminals - and some 15 of them have already carried out this plan.
Helsinki City Library is the first public library in the world to have established a WWW
server for a pilot project. The aim of the project is to promote equal access to electronic
information. The project also functions as a network publisher, and the application is
multilingual. There are also a few other pilot projects or consortiums of public libraries
for pilot networks.
The Ministry of Education has a project with the Finnish Library Association, called
Tiedon talo (House of Information), with allowances for libraries to give access to
Internet to the citizens. The project has been granted 1,5 million FIM from the national
budget in 1995. About fifty libraries already have access to or plan to have access to
Internet.
4.1.4 Archives and museums
ArchivesThe system of archives in Finland mainly comprise the National Archives of Finland and
seven provincial archives. In information provision for research purposes, the central
archives of social movements and the biggest archives of public administration form the
core of other important archives.

60
Since long, the resources of archives have remained at the same level, measured in real
terms. Since 1992, there has been a decrease total expenditure. Compared to other
Scandinavian countries, staff resources of Finnish archives, however, fare quite well.
During the last years of the 1980's, demand for the central services of archives
(research) remained at about the same level, but has since the beginning of 1990's shown
a downward turn. Holdings of archives consist of 90 shelf kilometres of documents in
paper, microfiche and electronic records. Public administration annually produces about
60 shelf kilometres of new documents.
The main problems and possibilities of archives arise from the development of computer
technology. Information stored in electronic files pose a problem and, on the other hand,
open new possibilities to handle and use information.
MuseumsAltogether, there are over 900 museums in Finland. Statistics of the National Board of
Antiquities list about 125 main museums with full-time personnel according to
administrative units. In 1993, these 125 museums had a total expenditure of 362 million
FIM, with 98 million FIM as government grants. Over 3,6 million people visited almost
1000 exhibitions arranged by these museums.
4.2 PRINTED MEDIA INFRASTRUCTURE
4.2.1 Finnish mass media market
Mass media total turnover in Finland in 1994 amounted to about FIM 16 billi on. Print
media total accounts for about FIM 12 billi on. Mass media turnover in 1993 was about
14,8 million FIM, contributing by 3,1% to GNP. Print media had a 73% share of the
total. Figures about several branches in table 23 are estimates. A comparison of the
structure of mass media economy in Finland, Sweden and Europe as a whole can be
seen in table 24.

61
Table 23. Summary of the mass media market in Finland in 1992 and 1993, million
FIM (Joukkoviestinnän talous 1993. The Finnish Mass Media Economy 1993, p. 6).
1992 1993
% %
Mass media as % of GNP 3,2 % 3,1 %
(mill. FIM) (%) (mill. FIM) (%)
Mass media total 15 137 100 14 838 100
Print media total 11 110 73,4 10 870 73,3- dailies (7 to 4 times a week) 4 090 27 3 980
26,8- non-dailies 630 4,2 610 4,1- free sheets 245 1,6 230 1,6- magazines & periodicals 2 670 17,6 2 670 18- books 2 025 13,4 1 930 13- printed advertising material 1 450 9,6 1 450 9,8
Electronic media total 3 014 19,9 2 987 20,1- nationwide TV & radio 2 283 15,1 2 267 15,3- local radio 190 1,3 180 1,2- cable TV 321 2,1 305 2,1- electronic data services 220 1,5 235 1,6
Recorded media total 1 013 6,7 981 6,6- phonograms 580 3,8 530 3,6- videos 255 1,7 255 1,7- cinemas 178 1,2 196 1,3

62
Table 24. Structure of mass media economy in Finland, Sweden and Europe, in %
(Joukkoviestinnän talous 1993, p. 8).
Finland Sweden Europe inin 1993 in 1993 early 1990's
Print media 73 69 73TV and radio 19 23 15Cinemas and videos 3 6 3Electronic data services 2 .. 4Phonograms 4 4 4Total: 100 100 100
Mass media's share of the work force has remained constant since the beginning of the
1980's, at about 2%. In 1992 it was 2,1%, as shown in table 25. Print media companies
are the biggest employers in the branch. Posts and telecommunications as employers
contribute to the national economy by a smaller share than mass media.
Table 25. Mass communication as employer in 1992, 1000 persons (Joukkoviestinnän
talous 1993, p. 13).
Publishing 14,6 Printing 19,3 Radio & television 5,8 Films, videos & phonograms 1,5 Manufacture of entertainment electronics 1,1 Advertising, news agencies 3,9
Mass communication total 46,2 (Telecommunications total 40,6)
National economy 2174
Contribution of mass communication to national economy, % 2,1
Aamulehti Group and TS Group are big newspaper publishers with also electronic
media. Alexpress of Aamulehti Group is a pioneer in many fields of new technology,
especially in delivering electronic news service by GSM technology. A-lehdet and

63
Yhtyneet Kuvalehdet are two of the main magazine publishers in Finland. WSOY and
Otava are both major book publishers. MTV is engaged in television broadcasting.
Sanoma GroupThe activities of Sanoma Group, the major player in the media market in Finland, were
reorganized in 1993 into Sanoma Oy (dailies) and Helsinki Media (electronic media and
magazines). At present, the Sanoma Group consists of the dailies Helsingin Sanomat and
Iltasanomat, together with the printing house. Electronic mass media (e.g. cable
television PTV, Startel news agency with online activities, and the publishing of
magazines) was reorganized into Helsinki Media company. In addition to magazines and
periodicals, Helsinki Media also publishes children's books and fact books. The company
employs about 1100 persons, and the turnover amounts to 957 million FIM. Book
publishing has a staff of eight persons and a turnover of 73 million FIM, with about 100
titles. Table 26 gives figures for the turnover of the biggest mass media companies in
Finland in 1993 and 1994.
Table 26. Turnover of the biggest mass media companies in Finland in 1993 and 1994
(Joukkoviestinnän talous 1993. The Finnish Mass Media Economy 1993, p. 16, about
1993, and Mr. Tuomo Sauri, Statistics Finland, about 1994).
1993 1994
Million FIM
Sanoma Group 1939 Sanoma Oy 1647 Helsinki Media 958 Finnish Broadcasting Company YLE 1855 1897 Aamulehti Group 1288 1329 TS Group 681 922 (figures from
15 months) MTV / MTV3 Finland 709 810 A-lehdet 596 671 WSOY 592 643 Yhtyneet Kuvalehdet 451 440 Otava 328 328

64
4.2.2 Publishing of books, magazines and newspapers
4.2.2.1 Books
There were 66 members in the Finnish Association of Publishers (Suomen
Kustannusyhdistys) in 1994 (60 members in 1992). The seven major publishers are
WSOY, Otava, Weilin+Göös, Gummerus, Tammi, Kirjayhtymä and Karisto, altogether
accounting for 70% of the total sales of the member companies (total sales in 1992:
1244 million FIM). In January, 1995, WSOY bought the publisher Weilin+Göös.
According to the statistics of the Finnish Assn. of Publishers, WSOY and Weilin+Göös
together dominate the market with a 35% market share. Otava comes next, with a 15%
market share in book publishing. Two major magazine publishers, Helsinki Media and
Valitut Palat (the Finnish Reader's Digest) are also among the biggest book publishers in
Finland. Helsinki Media has a 5% market share and Valitut Palat 10% of the markets.
Both Helsinki Media and Valitut Palat are companies with diversified activities in all the
areas of publishing.
Members of the Finnish Book Publishers' Assocation annually publish about half of the
new titles in Finland. In 1992, as well as in 1994, one third of the titles was fiction (half
of that children's and teenagers' books), one third schoolbooks and textbooks and one
third factbooks and encyclopaedias. In 1994, a book cost about 121 FIM in average and
had 187 pages (average price per page: 0,65 FIM). The average edition was about 3500
copies.
The seven biggest book publishers in 1994 published half of the new titles and about
77% of the new editions in Finland. Their average edition was about 4100 copies and
had 211 pages. The average book cost 131 FIM (average price per page: 0,62 FIM). The
seven major book publishers last year sold 14 389 000 copies, worth about 796 500
FIM. They had 13 239 000 books in stock. See table 27 on the following page.
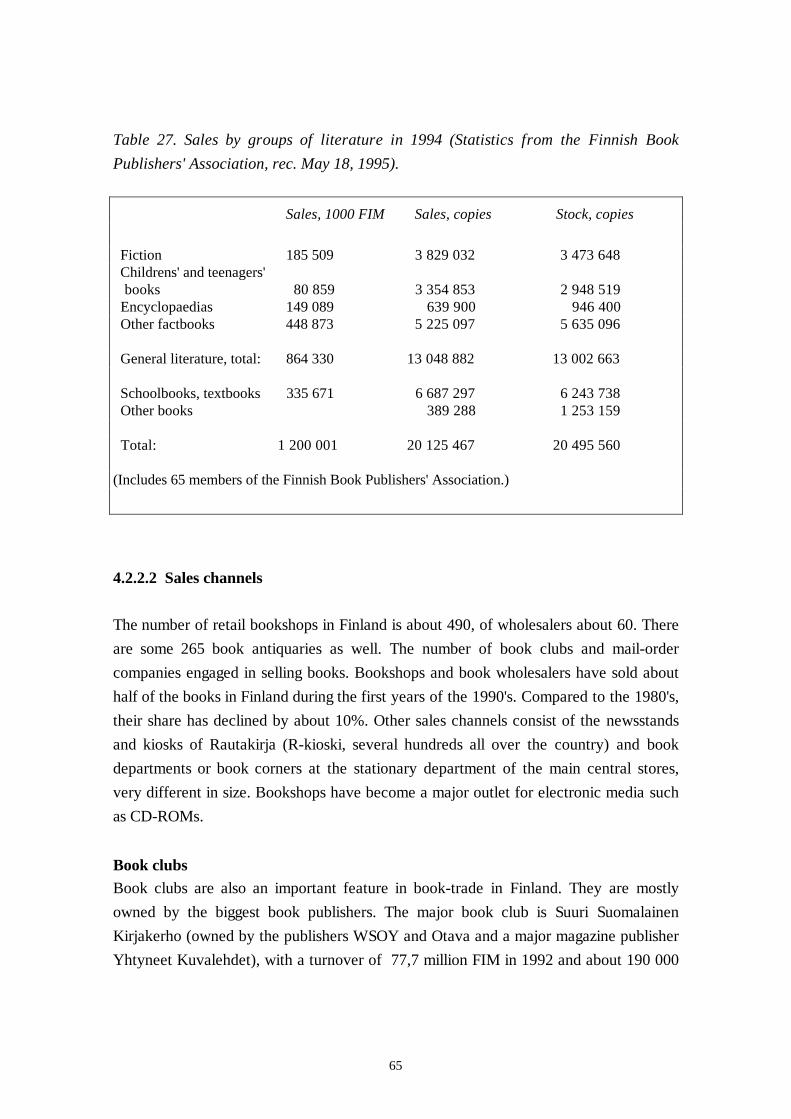
65
Table 27. Sales by groups of literature in 1994 (Statistics from the Finnish Book
Publishers' Association, rec. May 18, 1995).
Sales, 1000 FIM Sales, copies Stock, copies
Fiction 185 509 3 829 032 3 473 648 Childrens' and teenagers' books 80 859 3 354 853 2 948 519 Encyclopaedias 149 089 639 900 946 400 Other factbooks 448 873 5 225 097 5 635 096
General literature, total: 864 330 13 048 882 13 002 663
Schoolbooks, textbooks 335 671 6 687 297 6 243 738 Other books 389 288 1 253 159
Total: 1 200 001 20 125 467 20 495 560
(Includes 65 members of the Finnish Book Publishers' Association.)
4.2.2.2 Sales channels
The number of retail bookshops in Finland is about 490, of wholesalers about 60. There
are some 265 book antiquaries as well. The number of book clubs and mail-order
companies engaged in selling books. Bookshops and book wholesalers have sold about
half of the books in Finland during the first years of the 1990's. Compared to the 1980's,
their share has declined by about 10%. Other sales channels consist of the newsstands
and kiosks of Rautakirja (R-kioski, several hundreds all over the country) and book
departments or book corners at the stationary department of the main central stores,
very different in size. Bookshops have become a major outlet for electronic media such
as CD-ROMs.
Book clubsBook clubs are also an important feature in book-trade in Finland. They are mostly
owned by the biggest book publishers. The major book club is Suuri Suomalainen
Kirjakerho (owned by the publishers WSOY and Otava and a major magazine publisher
Yhtyneet Kuvalehdet), with a turnover of 77,7 million FIM in 1992 and about 190 000

66
members (203 000 members in 1994). Book clubs are estimated to sell about a fifth of
all general literature in Finland.
Suomalainen KirjakauppaSuomalainen Kirjakauppa, one of the major bookshop chains and an agency for FT
Profile in Finland, also belongs to the Rautakirja Group. Rautakirja is engaged in many
kinds of media. Europa Vision, the leader in the wholesale distribution of videos and,
from 1994, the leading cinema company Finnkino also belong to Rautakirja Group. The
main owners are WSOY, Otava and Sanoma Group. Rautakirja is the leader in
retailsales of mass media products in Finland. It has several hundreds of R-kiosks which
sell about 100% of newspapers and magazines in single copies all over Finland.
Akateeminen kirjakauppaAkateeminen kirjakauppa, Academic Bookstore, the biggest bookstore in Finland, is part
of the big department store company Oy Stockmann Ab. All the commercial units of
Stockmann made profit in 1994. Stockmann's total turnover was 4 507 million FIM,
growing by 23% from the year 1993. In 1994, Akateeminen kirjakauppa had a turnover
of 342 million FIM (332 million FIM in 1993). Akateeminen kirjakauppa made a profit
of 9,7 million FIM in 1994, more than double that of 1993.
4.2.2.3 Magazines and periodicals
Magazines and periodicals in 1993 accounted for 18% (2670 million FIM) of mass
media total turnover. The major publishers are Yhtyneet Kuvalehdet, Sanoma Group
(reorganized: Helsinki Media), Valitut Palat and A-lehdet Oy.
About 2500 different magazines and periodicals (regularly, at least four times a year) are
published in Finland. Subscriptions and newsstand sales account for the major part of
the revenues. There are three major publishers: Yhtyneet Kuvalehdet, Sanoma Group
and A-lehdet Oy.
Valitut Palat is active in publishing magazines, books, music and videos. The company
has a turnover of 210 million FIM and a staff of 95, including 9 persons in book
publishing. The magazine itself, the Finnish Reader's Digest, is No. One in circulation of
magazines in Finland. In addition, Valitut Palat has about 50% market share in the sales
of classical music recordings in Finland.
67
4.2.2.4 Newspapers
Newapapers (dailies and non-dailies) accounted for 31% of the total turnover of mass
media in 1993. The major newspaper publishers are Sanoma Oy with Helsingin Sanomat
and Ilta-Sanomat, TS Group with Turun Sanomat and Aamulehti Group with the daily
Aamulehti.
In 1994, 190 publishers with 225 newspaper titles were affiliated to the Finnish
Newspaper Publishers Association, Sanomalehtien Liitto. Of the titles, 57 were dailies
(published four to seven times a week) and 168 non-dailies (published one to three times
a week). In 1995, the members consist of 227 newspapers and two cable television and
videotex companies.
The aggregate circulation of newspapers in 1994 was about 3,5 milli on. Newsstand sales
accounted for about 13,2% of all dailies' total circulation figures. More than half of the
total circulation of dailies is delivered through the papers' own or joint distribution
networks, with three out of four subscribers receiving their dailis to their homes early in
the morning. Most non-dailies reach their subscribers by ordinary daily postal delivery.
The share of dailies (published every day) is 2 405 000, i.e. 48% of the total circulation
of newspapers in Finland.
Aggregate newspaper circulation declined by 3,6%. Declining household purchasing
power has contributed to the total fall in newspaper circulation of almost 10% during
the past three years. Finland is a country of regular newspaper subscribers, and during
the economic recession of the past years people have ceased to subscribe to as many
newspapers as previously. Nevertheless, not a single title ceased publication in 1994.
Six newspapers had a circulation of over 100 000 in 1994. Helsingin Sanomat has the
largest circulation (469 000), next comes Iltasanomat (circulation 215 000), both
published by Sanoma Oy. The third in circulation is Aamulehti in the Tampere region
(circulation 131 000), and the fourth Turun Sanomat (115 000). Helsingin Sanomat and
Ilta-Sanomat also are the biggest newspapers according to net sales figures. The net sales
of Helsingin Sanomat was (in 1000 FIM) 1 151 000 and that of Ilta-Sanomat 339 000.
The dailies had an editorial staff of 1 695 persons at the end of 1994. Helsingin sanomat
employed 323 persons in the editorial staff, Aamulehti 151 and Kaleva, the biggest daily
in northern Finland, had 102 editorial employees (circulation 87 000).

68
Members of the Finnish Newspaper Publishers Association used 139 000 tonnes of
newsprint in 1994, showing a decrease of 2 000 tonnes from 1993. The advertising
revenues of newspaper companies amounted to 2,3 billion FIM (483 million USD).
Newspapers' share of total media advertising sales in 1993 was 59%.
4.2.2.5 Electronic publishing
Different kinds of publishers are engaged in electronic publishing in Finland: the
traditional publishing houses, small hypermedia companies and newspaper publishers.
Public and private sector work in cooperation for educational material. Electronic
publishing consists of records (data and storage media), network-based services and
applications of radio communications. Electronic publishing is also a major theme in the
programmes for continuous education in universities, e.g. in the Departments of
Information Studies in the universities of Oulu and Tampere.
There are more than 10 small hypermedia/multimedia companies, some just entering the
market, offering tailor-made publishing products for customers. One one of major
companies is Sansibar Oy in Tampere. The major newspaper publishers engaged in
electronic publishing are Helsinki Media and Aamulehti Group. Otava and WSOY of the
traditional publishing houses are active in electronic publishing. They have both
published encyclopaedias on CD-ROM.
Up to the end of 1994 some 20 titles of CD-ROM discs had been produced in Finland.
Before 1993, there were some 3000 CD-ROM drives, but in 1993 more than 10 000
drives were sold. The total number of CD-ROM drives at the end of 1994 was 30 000
pcs, not including game and toy players. CD-ROM drives more and more become
standard equipment to microcomputers, and more and more programmes are distributed
on CD-ROM.
Internet is becoming more important in electronic publishing. Especially the private
sector takes a akeen interest in Internet (sales material, brochures and interactive trade).
There are about 30 WWW magazines in Finland, published by a variety of
organizations, associations, schools and universities, student unions etc. - including the
WWW magazine of Valamo orthodox monastery!

69
4.3 PROFESSIONAL ASSOCIATIONS
4.3.1 Associations of information specialists and librarians
There are three major associations in the information service and library branch in
Finland, the Finnish Society for Information Services (Tietopalveluseura), the Finnish
Research Library Association (Suomen tieteellinen kirjastoseura ry.) and the Finnish
Library Assocation (Suomen kirjastoseura ry). In addition, there are a number of special
organizations, associations and trade unions in the branch.
Finnish Research Library Association (Suomen tieteellinen kirjastoseura)Library Association was founded in 1929 and nowadays has about 600 members. It is a
learned society emphasizing the importance of information provision as a prerequisite
for research and education and as a factor of production in the Finnish economy. The
association promotes research and PR in the branch as well as the professional skills of
its members. The Finnish Research Library Association is an active member in the
International Federation of Library Associations and Institutions (IFLA), the European
Bureau of Library, Information and Documentation Associations (EBLIDA) and the
association of Nordic research librarians, Nordiska vetenskapliga bibliotekarieförbundet
(NVBF).
The association is divided into four sections, those for interlibrary lending, serial
publications, education and study trips. There are also ad hoc working groups, e.g. for
special libraries, user training and international affairs. The activities of the association
consist of further education, study trips, discussions and lectures on the development of
the branch, and participating in international cooperation. The association publishes its
journal Signum 8 times a year. It also gives out the Guidebook to research libraries in
Finland and publishes other handbooks, research reports and studies in its own
publication series.
Finnish Society for Information Services (Tietopalveluseura)The Finnish Society for Information Services, founded in 1947, brings together
information professionals in Finland. In 1995 the society has about 840 members and 35
institutional members. The main goals of the society are to form a network of
information professionals and specialists in enterprises, public administration,
universities and research organizations, to develop professional skills and to promote
development in the information service field.

70
Members of the society are active in several working groups, e.g. in commercial and
industrial life, banking and insurance, education and training, information resources
management, patents etc. The working groups organize most of the seminars and
maintain national and international contacts. The main international contacts are the
International Federation for Information and Documentation (FID) and the European
Association of Information Services (EUSIDIC).
High quality information services in Finland are based on education and training. The
society has established and for many years administered a further education programme
for people with academic background who want to specialize in information
management and information services. Since 1968, more than 700 information
specialists have graduated from the one-year programme. At present the programme is
administered by the Centre of Continuing Education at the Helsinki University of
Technology.
Finnish Library Association (Suomen kirjastoseura)Finnish Library Association (FLA), founded in 1910, now has about 2300 members,
including 33 institutional members (mainly other than libraries). It is a nation-wide
cultural body and a society open to any library supporter, library staff, municipal library
committee members and library users themselves. The association provides Finnish
decision-makers with expert information about the branch. FLA actively participates in
shaping library policy, in delivering reports and recommendations and in putting forward
proposals and issuing statements.
FLA arranges workshops and seminars and publishes Kirjastolehti, the monthly journal,
as well as a range of handbooks and other works on the library field. It is a member of
the International Federation of Library Associations and Institutions (IFLA) and has
close ties with other library associations in the Scandinavian countries and in Estonia.
4.3.2 Information industry associations
Three major associations promote the cooperation of industry, public administration and
users in information technology and data transmission. They are the Information
Technology Development Centre (Tietotekniikan kehittämiskeskus), the Finnish
Association for Network Services (TELMO) and the Finnish Data Communication
Association (Suomen tiedonsiirtoyhdistys). In addition, there are other associations for
information processing and computing services.

71
These associations work actively in various fields, e.g. in standardization in information
technology and data transmission in Finland and in international cooperation. They
promote R & D work and exports of EDI software and applications and take a keen
interest in the development of information network services and technology, with
project in quality, user interfaces and methods of information management and systems.
The associations issue reports and working papers and organize seminars on current
themes.
Information Technology Development Centre (Tietotekniikan kehittämiskeskus,
TIEKE)Information Technology Development Centre (Tietotekniikan kehittämiskeskus, TIEKE)
aims at increasing the use of information technology in Finland, and works with
standardization, process development, strategies and information services. The members
of the Centre are the State of Finland, the Finnish Information Processing Association
(Tietotekniikan liitto) and the association supporting the ADP Institute (ATK-instituutin
kannatusyhdistys).
A "driver's licence" for pc, forecasting methods for software projects, quality issues in
software production and databases about tenders and training are some examples of the
products and services of TIEKE.
Finnish Data Communication Association (Suomen tiedonsiirtoyhdistys STY ry)The Finnish Data Communication Association aims at promoting electronic data
transmission, particularly EDI and standardization of data transmission. There are 80
members in the association, telecommunications operators, ministries and companies in
the field of data communication and transmission.
Finnish Association for Network Services (TELMO)TELMO, the Finnish Association for Network Services is a cooperative body of the
users and providers of information network services, telecommunications operators and
authorities, with 70 members organizations. TELMO makes recommendations and takes
a keen interest in the development and high quality of network services and technology
both in Finland and abroad. TELMO promotes the production and use of information
network services and the compatibility of open information networks with easy-to-use
and standardized applications for citizens, companies and various institutions. - TELMO
is a member of a French and an American association, the Association Francaise de
Telematique (AFTEL) and the Interactive Services Association (ISA).

72
Finnish Information Processing Association (Tietotekniikan liitto ry)The Finnish Information Processing Association is an independent umbrella organization
of various associations in information processing, with the aim of promoting the
productive use of information technology from a human and socio-ethical point of view.
There are eight member associations with about 12000 members and 500 institutional
members. The Association is active in research and development, standardization,
education and PR, preparation of laws and decrees and various ad hoc working groups.
The association is a member of Nordisk Dataunion and of the International Federation
for Information Processing (IFIP) and participates in European cooperation in CEPIS.
The association itself or its various member organizations are engaged in research,
development, education and training, PR and communication and various activities of
national and international organizations. It makes an active contribution to the
preparation and application of laws and statutes and in promoting the execution of
various decisions and measures that have an effect in the activities of the branch. The
associatn finances standardization as well as terminology work. It has played an active
role in the working group of "Finland's way to the information society", drawn up the
general contractual terms of ADP 1994 and financed a programme for promoting
Finnish software exports. There are experts in special issues concerning the branch, e.g.
in adp contractual terms, personal data file act, data protection and copyright issues. The
Research Foundation of Information Processing (Tietotekniikan tutkimussäätiö) and a
publisher of adp literature, Suomen ATK-kustannus Oy have their offices at the
premises of the Finnish Information Processing Association.
Finnish Computing Services Association (Tietojenkäsittelyn Palveluyritysten
Liitto, TIPAL r.y.)The Finnish Computing Services Association is the branch organization of 120 member
companies that represent almost 80% of the total Finnish market for computing and
professional services and software products. Almost all significant computing services
companies are members of the Finnish Computing Services Association. They represent
almost 80% of the total Finnish market for computing and professional services and
software products. In 1993 the members recorded a growth rate of 6,4% (in 1992 it was
a decrease of -2,8%). The total turnover of the member companies in 1993 was over 7
000 million FIM, and the number of employees about 8500.
TIPAL is an interest group that represents the employers. It aims at promoting the
activities of the member companies, the development of Finnish computing services and
software industry, collecting statistical and other information and organizing training.

73
The association makes statements about official decrees and statutes of authorities. It
has also contributed to drawing up the contractual terms of the companies and the
manual of contract law in the branch.
4.3.3 Resolution of the Finnish information and knowledge sectors
The resolution of the Finnish information and knowledge sectors, given to the Finnish
minister of culture in February, 1994, was presented in the 47th international congress
of FID in Tokyo in October, 1994, as a model of the common strategies of information
and knowledge sectors. It was the only national example related to the Tokyo
international resolution, the Strategic Alliance of International Information
Organizations to serve better the World Community.
During eight months, 25 Finnish associations that represent 100 000 professionals
working in the information and knowledge sectors, evaluated the strengths and
weaknesses, the threats and opportunities of the branch. They agreed on common goals
and cooperation in practice. The resolution is an analysis of the present situation and
future targets of these sectors and has already resulted in practical collaboration
projects.
Strengths in Finland consists of an internationally high level of education and technology
and a highly developed infrastructure, also a varied printed media and press and the high
standard of information services and systems, as well as active participation in
international cooperation. Information and knowledge professions are also well
integrated into other kinds of know-how. - Weaknesses in Finland include scattered
production and use of information, copyright issues, avoiding discussion of ethical
issues, and suppliers' and producers' unawareness of user's needs.
The text of the resolution is in figure No. 2. The undersigned organizations were:
Information Technology Development Center (Tietotekniikan kehittämiskeskus ry),
Finnish Council for Information Provision (Tietohuollon neuvottelukunta), Finnish
Business Archives Association (Liikearkistoyhdistys), Communication Education
Society (Viestintäkasvatuksen seura ry), National Board of Education (opetushallitus),
Finnish Association of Organizational Communicators (Suomen Tiedottajien Liitto ry) ,
Finnish Association of Marketing Research Agencies (Suomen Markkinatutkimusliitto
ry), Finnish Association for Network Services (TELMO ry), Union of Journalists in
Finland (Suomen Journalistiliitt o), Advisory Board for Information Management
Training (Info-koulutuksen neuvottelukunta), Helsinki University of Technology,

74
Lifelong Learning Institute Dipoli (TKK-Koulutuskeskus Dipoli), Finnish Society for
Futures Studies (Tulevaisuuden tutkimuksen seura), Finnish Association of Graduate
Engineers TEK (Tekniikan Akateemisten Liitto TEK ry), Finnish Library Association
(Suomen kirjastoseura), Finnish Information Processing Association (Tietotekniikan
liitto ry), Finnish Society for Information Services (Tietopalveluseura ry), Finnish
Research Library Association (Suomen tieteellinen kirjastoseura ry) and University of
Tampere, Department for Information Studies (Tampereen yliopiston
informaatiotutkimuksen laitos).
The folllowing are some examples of various collaboration projects relating to the
resolution:
- the Information and Knowledge Cooperation Forum, meeting twice a year to discuss
issues relating the these sectors
- joint training for professionals in different information and knowledge sectors,
organized by the Lifelong Learning Institute Dipoli at the Helsinki University of
Technology, together with the organizations drafting the resolution
- various seminars on information policies of the future
- communication camps for school children and summer seminars
- collaboration in the data technology sector
- the Finnish Software Exports Development Programme by 30 leading software firms.

75
Figure 2. Resolution of the Finnish information and knowledge sectors (Resolution of
the Finnish information and knowledge sectors, 1994).

76
4.4 EDUCATION AND TRAINING IN LIBRARY AND INFORMATION SCIENCE
Academic levelLibrary and information science is taught in three universities in Tampere, Oulu and
Turku/Åbo. About 335 graduate students and 40 postgraduate students study the subject
in these three universities. In the University of Tampere, Department of Information
Studies, there are 270 graduate students and 24 postgraduate students. Academic staff
numbers 10, research fellows 8 and administration two persons. In the University of
Oulu, Department of Information Studies and Sosiology there are 30 graduate students,
10 postgraduate students, 6 persons of academic staff and one in administration. The
corresponding numbers for Åbo Akademi University, Department of Library and
Information Science are: 35 graduate and eight postgraduate students and five persons
of academic staff.
Professional training is given in the centres of continuing education of the above
mentioned universities for persons already working in the field. Summerschools in
library and information science are also arranged by the universities of Tampere, Turku
and Oulu, specially for students doing their doctoral dissertations.
Polytechnical level (Fachhochschulen) and business college levelEducation in library and information skills is given in five business polytechnics
("Fachhochschulen") and three business colleges. The business polytechnics are
situated in Helsinki, Joensuu, Jyväskylä, Oulu and Seinäjoki. The business colleges are
situated in Kerava, Raisio and Vaasa.
SchoolsBasic library and information skills are taught in every school. There are 4177
comprehensive schools for primary education in Finland. The number of secondary day
schools and secondary evening schools is 477. Information technology is a popular
optional subject at the two last grades of the comprehensive school, being chosen by
over half of the pupils. On an average of three hours per week the pupils are instructed
in using the computer as a tool and in the basics of information technologies and
programming. Information technology is also an optional subject in the upper secondary
schools, also chosen by over half of the students.

77
Courses, seminars and conferencesSpecial courses and seminars in Finland are given by various organizations, e.g. by VTT
Information Service, University of Tampere - Department of Information Studie,
University of Oulu -Department of Information Studies and Sosiology, Åbo Akademi
University - Department of Library and Information Science, the Finnish Society for
Information Services and the Nordic Council for Scientific Information. International
and national conferences are arranged by the same organizations.
4.5 RESEARCH AND DEVELOPMENT IN INFORMATION SERVICES
Research and development work is done in four universities in Finland. They are the
University of Tampere (Department of Information Studies), University of Oulu
(Department of Information Studies and Sosiology), Åbo Akademi University in Turku
(Department of Library and Information Science, education in Swedish) and University
of Jyväskylä (Department of Computer Science and Information Systems).
The more professional level of R&D work in the branch is done by the following
organizations: VTT Information Service, Nokia Research Centre, Helsinki University of
Technology, Information Technology Development Center (TIEKE ry) and the Finnish
Association for Network Services (TELMO ry).
Central research and develoment areas are networked information, electronic
publishing, user needs, information retrieval, document management, international
standards related to electronic documents, and socio-economical issues.
Paths of implementation/effectivenes of the innovation cycle can be estimated as
follows: basic research 40%, applied research 50% and R&D work leading to
commercialised products 10%. The budjets of the R & D projects vary from 10 000 FIM
to 5 million FIM.

78
5 TECHNOLOGICAL INFRASTRUCTURE
5.1 TELECOMMUNICATIONS INFRASTRUCTURE AND POLICY
In 1992, transport and communications accounted for 9,2% of Finland’s GDP; in 1993,
the figure was 9,4% (table 28).
Table 28. Contribution of transport and communications to Finland’s GDP in 1992
and 1993 (Liikennetilastollinen vuosikirja 1994, p. 23).
1992 1993 (FIM million)
Transport and storage 25 886 2 712 Post and telecommunications 10 618 10 428 of which: telecommunications 6 197 6 185
Total: 38 031 39 100 Transport and communications
Proportion of total,% 9,2% 9,4%
5.1.1 Telecommunications operators
The Telecommunications Act defines telecommunications as the building and
maintenance of telecom networks and the practice of telecommunications in those
networks. The licence needed for such operations is granted by the Government, in
certain cases by the Ministry of Transport and Communications. In 1994, public telecom
operations were conducted by the State-owned Telecom Finland, 48 telecommunication
companies, the Finnish Broadcasting Company YLE and five other organizations. Of
these latter, Datatie, a company established by telecommunication companies and firms
using telecom services, offers data transmission services and internal connections to its
corporate clients nationwide. Telivo, which is owned by the energy company Imatran
Voima, offers long-distance telecom connections both in Finland and abroad. Radiolinja,
which engages in national GSM mobile phone operations, is owned partly by
telecommunication companies and partly by nationwide wholesale and retail chains,

79
banks and insurance companies. Kaukoverkko Ysi is engaged in long-distance network
telecommunications and is owned by regional telecommunication companies. Finnet
International, another firm owned by regional telecommunication companies, has been
engaged in international telecommunications since July 1994. - Tables 29 and 30
present statistics on common carriers in Finland.
Table 29. Statistics on common carriers in Finland in 1993 and 1994 (Televiestintä-
tilasto 1995, pp. 60, 63 and 64).
1993 1994 Staff employed by common carriers, full-time - Telecom Finland 6 445 6 210 - regional telecom companies 8 653 8 276
Staff/1000 telephone subscriptions: - Telecom Finland 8,6 8,1 - regional telecom companies 4,3 4,1
Regional telecommunications companies - telephone subscriptions 2 019 878 - staff 8 276 Telecom Finland: - telephone subscriptions 770 789 - staff 6 210
Roughly as large as Telecom Finland, the Finnet Group is a consortium of private
telecommunication companies set up in August 1995. It is made up of 52 local telecom
companies that will retain their independence while sharing a joint nationwide strategy
in telecommunications, product development and marketing. Estimated Finnet Group
turnover for 1995 is FIM 5,2 billi on, and it has a staff of 8900. Two million of Finland’s
2,8 million client connections are in the Finnet Group network.
The turnover of Finland’s telecommunications will total FIM 12 billion in 1995. The
Finnet Group will account for as large a slice of this as Telecom Finland, that is, 43%
(equipment sellers 13%). Turnover is expected to rise to FIM 15 billion by 2000. The
brisk pace of investment in the telecoms field continues, with FIM 3 billion being
invested in 1995. The Finnet Group will account for over half of this.
The turnover of common carriers in Finland in 1994 totalled FIM 9,4 billi on, which
accounted for FIM 5,1 million of GDP. The ratio of turnover to GDP was 1,85. In 1992
the average was 1,86 in Finland and 2,12 in the OECD.

80
Table 30. Common carriers in Finland, by turnover in 1994 (Televiestintätilasto 1995,
pp. 67 - 68).
Telecom Finland 4 927 million FIM Helsinki Telephone Company 1 712 million FIM Other telecom operators 2 827 million FIM
Telecom Finland and regional telecommunication companies are the major players in
public telecom operations in Finland. Table 31 lists the main market shares in the
various sectors of the branch in 1993 and 1994.
5.1.1.1 Telephony
The number of subscriber connections in the fixed network in Finland is 2,8 milli on, of
which 72% are in the networks of regional telecommunications companies and 28% in
that of Telecom Finland. Some 70% of phones are in homes, and over 10% in the
corporate and public sector. The estimated number of handsets is 4 million.
Finland is divided into 12 telecommunications regions. The telephone networks offer fax
transmission, surveillance and control services and ISDN multiservices as well as local
and long-distance calls and data transmission. Almost 80% of local networks are digital,
which is a slightly lower percentage than that for Sweden, but appreciably higher than
e.g. that for Denmark.
Statistics about telephone subscriptions per 100 inhabitants in some OECD countries is
given in table 32.

81
Table 31. Main market shares of public telecom operations in Finland in 1993 and
1994, FIM million (Televiestintätilasto 1995, p. 70).
1993 1994 FIM million
Local telephony, total 2 899 2 954 of which: - Telecom Finland 928 892 - regional telecommunications 1 971 2 062
Domestic trunk-line telephony, total 793 475 of which: - Telecom Finland 739 218 - Telivo 36 12 - Kaukoverkko Ysi 240 (invoicing) - others 18 5
International telecom operations, total 1 052 958 of which: - Telecom Finland 1 051 935 - Finnet 16 - Telivo 5 - other 1 2
Mobile communications, total 1 460 1 711 of which: - Telecom Finland 1 434 1 637 - Radiolinja 7 55 - regional telecommunications 18 18 - others 1 1
Data transmission, total 524 590 of which: - Telecom Finland 282 319 - local telephone companies 184 189 (only partly) - Datatie 58 60 - others 22
Total public telecom operations in Finland 6 728 6 688 of which: - Telecom Finland 4 434 4 001 - regional telecommunications 2 173 2 269 - others 121 418

82
Table 32. Telephone subscriptions per 100 inhabitants in some OECD countries in
1993 and 1994 (Televiestintätilasto 1995, p. 82).
1993 1994
Sweden 68,5 67,7 Switzerland 62,8 61,0 Canada 59,7 Denmark 58,4 59,9 Iceland 54,7 55,6 Finland 54,5 54,9 France 53,8 Norway 52,9 53,9
5.1.1.2 Mobile communications and paging
Telecom Finland constructs and maintains several mobile phone networks; regional
telecommunications companies have only one. There are two GSM networks in Finland,
one built and maintained by Telecom Finland and the other by Radiolinja, a privately
owned company. There were 110 000 GSM connections in these two networks in 1994,
and 173 000 on May 1, 1995. Telecom Finland constructs and maintains a paging
network covering almost the whole country. The biggest regional telephone company,
the Helsinki Telephone Company (HPY), has a paging network of its own in its area.
The total value of mobile communications traffic in Finland is about FIM 2,1 billion.
There are around 800 000 cellular phones in the country. Growth is fastest in use of the
GSM network. The Finnet Group provides about half of the calls in the GSM network.
Table 33 gives statistics about mobile communications and paging in Finland.

83
Table 33. Mobile phone subscriptions and subscribers to paging networks (Televies-
tintätilasto 1995, pp. 37, 38 and 40).
1993 1994 May 1, 1995
Mobile phone subscriptions, number 489 000 675 000 781 000
Connections per 100 inhabitants 9,63 13,24
Number of mobile phone calls 292,8 million
of which
- in NMT network 256,1 million
- in GSM networks 36,7 million
Subscribers to paging networks
(Tele and HPY), number 45 800 47 400
5.1.1.3 Teleprinters and telefaxes
With the increasing number of faxes, the number of teleprinters has declined in the past
few years; see table 34.
Table 34. Teleprinters and telefaxes in Finland (Televiestintätilasto 1995, p. 47 and
Liikennetilastollinen vuosikirja 1994, p. 133).
1992 1993 1994
Telex exchanges, number 7 6 Built-in number capacity 9 973 9 823 Teleprinters: - used by telex subscribers 3 409 2 718 - used by P&T 254 234 - total 3 663 2 952 2 587 Teleprinter traffic in 1000 minutes: - domestic 2 772 2 200 1 753 - international 3 984 3 383 2 883 - total 6 756 5 583 4 636
Telefaxes, number 105 000 115 000 124 000
(Estimates only; not all card and LAN faxes included.)

84
5.1.1.4 Data transmission
Nationwide data transmission services are supplied by Telecom Finland, the private
company Datatie, and Telivo, a company owned by Imatran Voima. Local connections
are offered by the telecommunication companies and Telecom Finland. Several
companies offer nationwide switched connections. Packet data transmission services are
supplied by Telecom Finland in the Datapak network and by regional
telecommunication companies in the Finpak network. Datex is the service for the
switched data transmission connections offered by Telecom Finland. Access to
international networks is possible from all these networks.
There were over 11 000 network terminals in Finland’s data transmission networks in
1994 (cf. table 35). The number of online banking terminals per 1000 inhabitants is 0,56.
Table 35. Number of network terminals in data transmission networks in Finland
(Televiestintätilasto 1995, p. 42).
1993 1994
Datex 3 571 2 692 Datapak 3 274 4 311 Finpak 3 700 4 220
Total: 10 545 11 223
Table 36 gives statistics about modems and online banking terminals, table 37 about the
public data transmission network in Finland.
Table 36. Modems and online banking terminals in Finland (Televiestintätilasto 1995,
p. 42).
1993 1994
Number of modems, estimate 265 000 320 000 Number of online banking terminals 2 994 2 833 Online banking terminals per 1000 inhabitants 0,59 0,56

85
Table 37. Public data transmission network in Finland (Statistical Yearbook ofFinland 1994, p. 266 and 1995, p. 268).
Connections by transmission rate bit/s
1992 1993 1994 Datex 2400 bps 1 851 1 489 1 197 4800 bps 2 074 1 566 1 126 9600 bps 559 516 369
Total: 4 484 3 571 2 692
Datapak Async< 9600 115 836 1 584 2400 bps 52 48 47 4800 bps 171 148 125 9600 bps 1 564 1 778 1 921 19200 bps 262 353 478 48000 bps 22 24 26 64000 bps 58 87 130
Total: 2 244 3 274 4 311
User identifiers 6 799 6 988 6 873
5.1.1.5 Value-added services
With the convergence of telecommunications and information technology, the basic
telecom services have been supplemented with increasingly refined data network
services. These include value-added telephone services (e.g. answerphone, voice mail
and voice recognition), message handling for E-mail, EDI services, menu, that is open
service networks (Telecom Finland’s Telesampo and regional telecom companies’
Infotel), video services and various data services offered by government, universities
and firms.
An estimated 215 000 inhabitants used telecom data services in 1994, with households
accounting for 41,4% of users and businesses for 41,2%.

86
5.1.2 Overall situation and telecommunications policy
The full force of competition in telecommunications hit Finland in early 1994. At least
two alternative domestic carriers are available all over the country and there are three
independent long-distance operators. Telecom Finland, a member of the Suomen PT Oy
Group, became an independent company at the end of 1993, and in June 1994 Telecom
Finland and Kaukoverkko Ysi, a consortium of regional telecommunications companies,
divided the long-distance telecoms market more or less equally between them; Telivo
had a market share of a few per cent. The competition in long-distance telecoms
operations had stabilized by spring 1995, and no immediate changes are foreseen in the
distribution of market shares.
The burgeoning competition in international telecoms has had little impact on turnover
from Telecom Finland’s international operations. The market share is transferring to new
enterprises more slowly than in long-distance competition.
In autumn 1994 the first public telecommunications licence that did not include the right
to build a telecoms network was granted. By summer 1995 six such licences had been
granted. Elsewhere in Europe these new telecommunications companies are known as
service providers. Some of them handle only resales services acquired from other
carriers; others use their own equipment.
5.1.2.1 Mobile communications
Common carriers have continued to upgrade their radio applications as a way of
competing with carriers offering services on the fixed telecoms network. The Ministry of
Transport and Communications aims to promote competition in this area, too, through
legislative means.
Mobile communications continues to advance apace. The number of cellular subscribers
is growing at the cost of wire-line subscribers, and mobile communications are beginning
to pose a major challenge to the fixed home telephone. The whole sector is marked by
aggressive campaigning and very attractive offers for new subscribers. In 1994 Sweden,
Norway and Finland had the highest mobile phone penetration in the world; the number
of phones per 100 inhabitants in Finland was 13,24 (9,63 in 1993) and in Sweden 16,5.
The number of GSM subscribers in Finland grew particularly fast in the first half of
1995.

87
5.1.2.2 Legislation
The Ministry of Transport’s draft proposal to amend the telecommunications legislation
was completed in May 1995. The objective of the proposal is to facilitate entry into the
telecoms branch, relax payment controls and organize the status of service operators.
The aim is that telecommunications should be treated like any other business and made
subject to the same competition and consumer protection laws. The proposal and its
reception show that full liberalization of telecommunications is much closer in Finland
than anywhere else in Europe.
5.1.2.3 International cooperation
The position of telecommunications in Finland is very different from that in other EU
countries. Here the market share of the biggest domestic carrier is around 55%; in
Sweden and the UK it is 90%, and elsewhere even higher. At the meeting of the council
of EU telecommunications ministers held in June 1995 Finland came down strongly in
favour of the speedy opening of mobile communications networks to competition in
Europe. At Finland’s request, competition will be considered in the preparation of future
EU legislation. Likewise the size of common carriers will be restricted. Nor need Finland
return to trade regulation in public telephone operations.
5.1.3 Competition and telecommunications companies
Regional telecommunications companies offer their clients all telecom services locally,
nationally and internationally. Apart from the local nature of operations, their strength
lies in the fact that users own almost 80% of subscriber connections. With the
deregulation of the market introduced in 1994, the range of services expanded.
The Finnet Group comprises telecommunication companies, their subsidiaries and
national associate companies. Finland has 46 telecommunications companies that build
telecoms networks and provide telecoms services. National telecoms operations are
carried out by four associate companies established by the telecommunications
companies: Datatie (data transmission services), Radiolinja (GSM-based service -
Europuhelin 950), Kaukoverkko Ysi (long-distance traffic) and Finnet International
(international telecommunications).
The Association of Telephone Companies in Finland (Puhelinlaitosten Liitto) founded
in 1921 is the central organization and cooperation body of telecommunication
88
companies. The total turnover of the Finnet Group approaches FIM 5 billion (as does
that of Telecom Finland). Companies’ own business operations account for FIM 4,2
billion of Group turnover. Over 70% of Finland’s 2,8 million telephone subscribers are
connected to Finnet networks. The Group handles around 60% of long-distance traffic;
its goal is a 30% market share of foreign calls. Half of all cellular phones using the GSM
system are connected to Finnet’s network and well over half of all GSM calls are made
in this network. At the end of 1994, Telecom Finland accounted for 44% of long-
distance traffic; in foreign calls, its share rose to around 80%.
The high level of telecommunications in Finland has always been based on private
entrepreneurship and know-how. The liberalization process in the branch is only a
logical conclusion of this. Internationally Finland is a leader in telecommunications
services, a few years ahead of other EU countries. The competitive situation between
two kinds of ‘groups’, private and publicly owned, has contributed to the high level of
telecommunications technology and services in Finland.
The liberalization of network competition in Finland got under way in 1985 and was
completed in 1994. As a result, data transmission charges are lower in Finland than
anywhere else in the world. For example, charges for switched data transmission are a
mere fifth of the OECD average.
5.1.4 State-of-the-art and prospects of telematics applications
Telematics applications, based on telecommunications and information technology, are a
vital field in the outlook of the future society. This chapter profiles Finland's high and
versatile state-of-the-art in telematics applications, a strategic industry. Examples of
Finland's participation in EU's research programmes and frame programmes are given in
"Finland, a pioneer in telematics applications" from March, 1995.
5.1.4.1 Open scene
Finland has an open telecommunications architecture, high density cabling, a mobile
telephone network and a high level of modern computers. Finland has a liberal
legislation about tele-communications, and has applied free market conditions in end-
user products since the 1980's. The scene is also free for competition in all
telecommunications services nowadays. The networks have evolved in a multi-operator
field and the supply of telecommunications services is growing rapidly. ATM networks
have been launched by both major operators in the 1990's.

89
A national R&D programme concentrates on multimedia, another specially for SMEs in
the telecommunications indstry. The Finnish Network Programme in Telecommuni-
cations for Small and Medium Size Enterprises from 1994 to 1997, initiated by the
Technology Development Centre, aims at high-quality telecommunications products and
services by creating a national network of small and large companies. At present, 50
SMEs and many large companies have joined in. The National Multimedia Programme
started this year, promoting the advancement of new telecommunications and
multimedia service industry. An open multimedia pilot network will be built. During the
next three years the expenditure for the programme is expected to amount to 100
MECU. - In addition, several dozen industrial telecommunications projects have been
initiated by industry.
Telecommunications industry employs several subcontractors and service enterprises
indirectly. There has bee a rapid growth in the production and exports of PCs and all
kinds of software products. The Nokia Group has the biggest market share in Europe in
cellular telephone equipment market and the second biggest in the United States. Many
SMEs in Finland focuse on special products and are leaders of the world in their market
sectors, e.g. cable TV equipment, components for video-conferencing and paging and
voice mail systems.
Finland is one of the leading countries in telecommunications services in the world. The
penetration rate in fixed telephone networks is the fifth highest in the world, in mobile
communications the second highest. In 1992, fault density in public telephone networks
was the fourth lowest in the world.
5.1.4.2 Applications in transport, urban and rural areas and environment
TransportDue to sparse population, long distances and the country's northern location Finland
faces several transport problems in costs, economic efficiency and level of service of
public transport, long winter season, road safety and temporary capacity problems in
urban areas. Finland has built advanced transport telematics platforms for mobile, radio
and television based services and roadside information systems. Road weather
conditions are monitored by 200 automatic weather stations and road condition
monitoring cameras. Traffic flow is also monitored by an automatic system. There are
trip planning services through a public information network (TELMO). Smart-card
technology is used in long-distance buses.

90
Urban and rural areasSolutions to the problems of rural areas have been sought by new techniques. In the
early 1990’s there were about one hundred telehouses in Finland. The use of telework
centres has, however, proved modest. Public funding has been diminishing, and so has
the number of telehouses. They are now turning into providers of supportive services
for enterprises.s The main telehouse projects have been the experiments carried out in
1991-1994 by the University of Turku and some national trials by the Ministry of
Labour.
In the development project for TELMO service architecture was created and promoted
for telematic services. With respect to population, Finland is the second after France
measured by the number of users of telematic information services.
EnvironmentEnvironmental administration consists of the Ministry, the Environment Centre of
Finland (up to the end of February, 1995, the National Board of Waters and the
Environment), together with the Environment Data Centre (EDC), and the district
offices. They all form a nationwide IT network. The E-NET connects to all other
governmental networks via public telecommunic-ations networks (Internet and
NORDUnet). The EDC has vast experince particularly in handling graphical data.
Recently, the E-NET has been enhanced to include a Regional information network
specialising in environmental information about the eastern and southern neighbouring
countries of Finland.
5.1.4.3 Applications in healthcare
Finland's health system provides equal access to all citizens, and the majority of health
service providers are public institutions owned by communities. SMEs mostly account
for health information systems industry in Finland. Currently Finland uses almost 10%
of its GDP on healthcare. Measures have been taken to improve the outcome and
quality of healthcare services, and they include networking across institutional
boundaries. Information and telematics systems are widely used in healthcare at primary
and secondary levels.
The industry in assistive technology comprises about 100 enterprises, mostly very small.
The Finnish healthcare system is very advanced and has taken up several telematic
systems, e.g. mobile telephones and computers in the social care sector, and various
devices to support the disabled and elderly people in independent living at home.

91
Finland is the only country in the world with a nationwide security telephone system for
the elderly and the disabled.
5.1.4.4 Research
Finland is one of the most advanced countries in the world in research networks. The
Finnish University and Research Network (FUNET) was established as early as 1984 by
the Ministry of Education, to organize telecommunications connections between
universities in Finland.
FUNET soon joined and became a provider of EARN, and is also part of the NORDUnet
research network. At present, all Finnish universities and most polytechnics are
members of FUNET, together with 30 other public and industrial research institutes. All
universities have Internet connections through FUNET. The number of Finnish Internet
hosts (ip-hosts within the .fi-domain) is one of the highest per capita in the world.
Center for Scientific Computing (CSC), the administrator of FUNET and its
supercomputers, is owned by the Ministry of Education. FUNET has long traditions in
cooperation with the Nordic Council of Ministers.
In 1993, FUNET was the first in Europe in implementing new technology. An ATM pilot
project was launched between FUNET, Tampere University of Technology and Telecom
Finland. The connection has been in production since October, 1994. FUNET plans to
update the whole core network to ATM technology during 1995.
5.1.4.5 Information engineering and language engineering
Information engineeringMany companies in Finland specialize in designing and programming multimedia
presentations, with special attention to interfaces and information retrieval methods.
Finland is a European pioneer in producing and delivering electronic books, available for
over 10 years in major Finnish bookstores. CD-ROM technology is widely applied in
offices. Books publishers apply modern techniques in their publishing process, as do
magazine and newspaper publishers, too. Publishing through networks (Internet /
WWW) is a growing area. Another increasingly interesting area is the use of a mobile
telephone for information searching, specially with voice input.

92
Language engineeringFinland compares well with other European countries in the high level of research and
available language engineering tools and products. Awareness in and use of
computational and telematic aids in the language and translation professions is growing
with the spreading of digital electronic text interchange. There are two long-term
research-centred players (Kielikone and the University of Helsinki) and a few
specialized commercial operators, as well as some major IT companies and R&D
organizations (Nokia, IBM ICL) engaged in language engineering in Finland. The
project of developing a series of programmes for the computational analysis of Finnish,
was commercialized as a company, Kielikone Ltd.
5.2. COMPUTER INFRASTRUCTURE
5.2.1 Member companies of the Finnish Computing Services Association
About 630 000 people of the work force of two million Finns use computers or
computing services at work. There are 120 member companies at a branch organization,
the Finnish Computing Services Association (TIPAL, Tietojenkäsittelyn Palveluyritysten
Liitto), accounting for about 80% of the total Finnish market for computing and
professional services, software and hardware products. The total turnover of the
member companies in 1993 was more than FIM 7000 milli on, with a growth rate of
6,4%. The member companies employ about 8500 persons.
5.2.2 Production, sales and use of microcomputers in Finland
Production of the electronics and electrical sector in Finland in 1994 increased with
29% and amounted to 35 billion FIM. The production of communications equipment
increased as much as 55%. Table 38 shows the percentages of the various branches of
the total production of the electronics and electrical sector in Finland in 1994.
Estimates of VTT Automation give two alternatives of growth up to the year 2000. In
the alternative of rapid growth the production of microromputers would increase
annually by 12% from 1996 to the end of the century, and domestic markets would grow
annually by 7%. In the alternative of slow growth the production of microcomputers
would grow by 6% and domestic markets by 3%.

93
Table 38. Production of the electronics and electrical sector in Finland in 1994
(Tieto-viikko, April 7, 1995).
%
Telecommunications equipment 39 Electrical power industry 15 Computers 13 Automation 8 Components 8 Others 17
The value of microcomputer production in Finland in 1994 was about 4,5 billion FIM. It
is estimated that the growth rate in 1995 will be 22%. Two biggest manufacturers (ICL
Personal Systems and Salcomp Oy, manufacturing microcomputer displays) account for
almost FIM 3,5 billion of the total turnover. In addition, there are several smaller
manufacturers (e.g. Mikrolog, Computec, Elektrobit). Mikrolog, the company
assembling Osborne microcomputers in Finland, believe it will sell 16 000
microcomputers in 1995. In 1994, with the sales of 10 500 microcomputers and a
turnover of 208 million FIM, Mikrolog had a 6% share of the market and employed
about 100 persons.
There are about 30 micromputers per 100 inhabitants in the United States, whereas in
Finland and Sweden there are about 15 microcomputers per 100 inhabitants. The growth
rate of the markets for microcomputers in Finland is estimated to be 40% in 1995.
Households will become more and more important customers in the branch.
At the end of 1993 about 21,5% of Finnish households had a microcomputer, at the end
of 1994 as many as 26%. It is estimated that 570 000 Finnish households own about
600 000 microcomputers (most of them, anyhow, older and less efficient models). About
14% of the microcomputers have a modem connection, but all modems are not used
very actively. One third of the households use their microcomputers for professional
purposes at home, 70% for word processing and 60% for games. About 205 000 new
microcomputers were sold in 1994, of which 45 000 for household use.
According to IDC, sales of new microcomputers to households in 1995 would amount to
66 000 microcomputers, i.e. 26 000 more than in 1994. In addition, there are the used
microcomputers and those given by companies to their personnel for use at home. The
94
main brands at home use are Compaq, IBM and ICL. Last year, Compaq sold 6 500
Presario microcomputers, with 15% of the total sales to households.
Combining the estimates of IDC and Market-Vision about sales of microcomputers in
Finland from 1987 to 1994, we arrive at 1,2 million pcs. The number of microcomputers
that are not in use any more may be estimated at 500 000 pcs. This gives an estimate of
15 microcomputers per 100 inhabitants. I.R.O. Research estimates that 308 000
households acquire a microcomputer during the next two years. Only half of the
equipment, however, will be new. In 1994, about 205 000 microcomputers were sold, 45
000 of them for household use.
In 1994, about 123 000 printers were sold in Finland, of which 34% were laser printers
and 53% ink-jet printers. Hewlett-Packard is No. One with 50% share of the market,
next comes Canon with 30% of the market.
Estimation of the total number of CD-ROM drives at the end of 1994 is about 30 000
pcs, excluding game and toy players. With game and toy players, the numbers may total
100 000 drives.
5.2.3 Hardware and software establishments
In the Register of Enterprises (database YRTI, Yritysrekisteri) of Statistics Finland,
category 3002 contains information about the manufacture of computers and other
information processing apparatus, category 722 about software supply and consultancy.
An enterprise may have several establishments.
According to information from 1993, there were 36 establishments manufacturing
computers and other information processing apparatus. Their total turnover amounted to
4 057 million FIM, and the number of personnel to 2 257. In 1993, 1 207 establishments
were engaged in software consultancy and supply, with a total turnover of 3 533 million
FIM. They employed 7 642 people.
Manufacture of computers and other information processing apparatusThe 36 establishments in SIC 3002 made an average turnover per person of about 1,8
million FIM. The companies and establishments were quite evenly distributed in various
classes of turnover, mostly five or six companies in each size class of turnover. Six
establishments were listed in the turnover class from 200 000 FIM to 499 000 FIM,
another six in the turnover class from one million FIM to 4,9 million FIM. - Classifying
according to number of personnel, the majority (15 ) of the 36 establishments employed

95
less than four persons. The 15 small companies made an average turnover of 555 000
FIM per employee. Only four companies or establishments employed more than 100
persons.
Software consultancy and supplyCompanies in SIC 722 (a total of 1207 establishments) made an average turnover of
462 000 FIM per personnel. There were over 200 establishments each in the following
turnover classes: 1 000 FIM to 99 000 FIM, 200 000 FIM to 499 000 FIM and 500 000
FIM to 999 000 FIM. Most of the establishments belonged to the turnover class from
one million to 4,9 million FIM (343 establishments). They made an average turnover of
345 000 FIM per employee.
According to number of personnel, 70% of the companies and establishments employed
less than four people. They made an average turnover of 341 000 FIM per employee.
Companies employing five to nine people were the second biggest category (194 of
them). Only eight companies employed more than 100 persons.

96
6 ECONOMIC AND POLITICAL INFRASTRUCTURE
6.1 POLITICAL INFRASTRUCTURE
Finland has a surface area of 338 000 sq km and a population of 5 098 000 people (Dec.
31, 1994), with an average population density of 16,6 per square kilometre. There are
two official languages; Finnish as the mother tongue is spoken by over 93% of the
population and Swedish by about 6% of the population.
Finland is a parliamentary democracy with a republican constitution. From the twelfth
century to 1809 Finland was part of the Kingdom of Sweden. In 1809, Finland was
annexed to Russia as an autonomous Grand Duchy. On Dec. 6, 1917, Finland declared
her independence. The republican constitution of 1919 remains essentially unchanged
today. The legislative power is exercised by the Parliament and the President of the
Republic. The 200 members of the Parliament are elected by universal suffrage for a
period of four years. Finland is divided into 461 self-governing municipalities. Members
of the municipal councils are elected by universal suffrage for a period of four years.
During the election period from March, 1991 to March, 1995 the seats of the various
parties in the Parliament were distributed as follows: Center Party (agrarian) 55, Social
Democratic Party 48, National Coalition Party (conservative) 40, Left Wing Alliance
19, Swedish People’s Party 11, Green League 10, Christian League 8, Rural Party 7,
Liberal Party 1 and others 1. In the elections of 1995, the distribution of the seats was
the following: Social Democratic Party 63, National Coalition Party 39, Center Party of
Finland 44, Left Wing Alliance 22, Swedish People’s Party 11, Christian League 7,
Finnish Rural Party 1, Green League 9, Progressive Finnish Party 2, Ecological Party 1
and others 1 seat.
6.2 GENERAL ECONOMIC SITUATION IN FINLAND IN 1994
In 1994 the Gross Domestic Product (GDP in purchasers' values) in Finland was
511 600 million FIM. The growth rate of GDP was 3,9%, compared to the previous
year. In 1993, GDP decreased by 1,6% compared with the year 1992. For the current
year 1995, the rate of growth of GDP is predicted to be around 5% and for 1996 around
4,5%. GNP, the Gross National Product, amounted to 490 089 million FIM in 1994.

97
In the period from 1950 to 1959, the average annual (compounded) growth of real GDP
was 4,7% and from 1960 to 1969 it was 5%. From 1970 to 1979 the growth rate was
3,7% the same as from 1980 to 1989. The average annual growth of GDP in Finland has
been 3,6% from 1950 to 1993. Finland's GDP per capita in 1993 was USD 16 500.
Changes in the volume of GDP from 1985 to 1994 are shown in the following picture.
The unemployment rate in relation to the total work force in Finland amounted to 18,4%
in 1994 (17,9% in 1993). Various economic research centres in Finland expected the
unemployment rate to decrease in 1995, compared with that of 1994. The rate for 1995
was predicted to be at about 16,5% which still means an average of 400 000 Finns
unemployed.
The inflation rate in Finland for 1994 was exceptionally low at 1,1%. The Ministry of
Finance expected the inflation rate to stay at about 1,5% also in 1995.
Figure 3. Changes in the volume of GDP 1985 - 1994 (Statistics Finland: Tilasto-
uutisia 1995:15).
OutputIndustrial output grew by almost 12%. The development of output continued uneven in
different sectors. Output increased in wholesale and retail trade, hotel and restaurant
services, and certain other services. In contrast, construction and public services

98
continued to contract. Primary production grew by as much as 7,8%. Agricultural
output remained at the level of 1993 but that of forestry showed an increase of 14%.
The total of secondary production increased by 8,4% from the previous year.
Manufacturing expanded the most, by 12%. Of the manufacturing industries, the metal
and engineering industry showed the most of expansion, by as much as a fifth. As a
result of the expansion of manufacturing, there was an appreciable increase in market
fellings as well as in transport and communications. Output in electrical energy supply
increased by 7%, consumption by 4%.
Expenditure, investments and national incomeFinland's national income in nominal terms grew by 9,5% last year. National income per
capita amounted to FIM 79 240. Disposable income at households in nominal terms
increased a little but the real purchasing power of households fell by 1,3%.
Measured by the price index of gross domestic product, there was an increase of 2,5% in
the price level of the economy. The consumer price index grew by 1,1%. The nominal
national income showed a significant growth rate by 9,4%. Taxes and obligatory social
security costs account for a very high percentage of GDP in Finland, in 1994 as much as
47,2% (45,7% in the year 1993). Direct taxes showed an increase of 17% compared to
the previous year, and taxes of goods and services were paid by almost 5% more than
in 1993. Obligatory social security contributions also increased by almost 8%.
Disposable income in nominal terms grew by 9,5%. There was still a deficit of more than
11 billion FIM in the revenue of the state. The households' disposable income remained
at about the same level in 1994 as in 1993. The real purchasing power of the households
decreased by 1,3%, whereas in 1993 by almost 5%.
Private consumption expenditure grew by 2%. Acquisitions of durable goods increased
by 9% compared with 1993. Public consumption expenditure decreased by only 0,5%.
Investments started to recover after a downswing of four years, particularly investments
in machinery and fixtures.

99
6.3 NATIONAL INFORMATION POLICY
6.3.1 Development of scientific libraries and information services in Finland
Finland arising from the ruins after the Second world war placed a great emphasis on
creating a system of central libraries and on further developing information and
documentation services. Industry needed research, research needed scientific and
technical information. The Finnish Pulp and Paper Research Institute
(Keskuslaboratorio Oy, KCL) had started with information and documentation services
in the 1920’s. Information services were also one of the main services offered by the
Chemical Industry Federation of Finland to its members. Technical Research Centre of
Finland was founded in 1942, and in 1947 started with publication and documentation
services. The Minister of Education in 1954 set up a permanent board of scientific
libraries and ten years later a committee to plan the development of scientific
information services in Finland.
General development in the OECD on science and information policy have had a great
influence on the corresponding outlines in Finland. A permanent council was set up in
1969 for scientific information. Three years later, together with the board of scientific
libraries, it was formed into the Finnish Council for Scientific Information and Research
Libraries (tieteellisen informoinnin neuvosto, TINFO). The present well-functioning
information service network in Finland (cf. chapter 4.1) is based on the committee
reports of the TINFO council. From 1994 onwards, the Finnish Council for Information
Provision (tietohuollon neuvottelukunta), set up by the Ministry of Education, continues
the work of the former TINFO council.
6.3.2 Finland's way to the information society
Nearly all OECD countries and many international communities have drafted or are
preparing information society strategies. January, 1995, marked significant
developments towards the information society in Finland. A report commissioned and
approved by the Ministry of Finance outlines a national strategy. A position paper
outlined by the Cabinet Office on measures for the development of an information
society was approved by the Government on 18 January. The new Government, formed
in April, 1995 and led by Prime Minister Paavo Lipponen, has a number of information
society oriented objectives and tasks in its program.

100
In Finland, the concept of information society strategy dates back to the work of the
Information Technology Advisory Board (1976 to 1991) and a country review of
Finland's IT and telecommunications policies performed by the OECD in 1990 to 1992.
The OECD country review, the first of its kind in the world, concluded that Finland,
though having reached an astonishingly high level of IT and telecommunications
penetration and expertise, lacked a clear strategy in these areas. The Ministry of Finance
was given the task of preparing this kind of strategy and the teport, Finland Towards the
Information Society - a National Strategy, was completed at the end of 1994.
The work benefitted from the launching of concept of the Information Highway, from
the Bangemann report and the decisions of the European Council on Europe's way to
the Information Society.
The networked economy and the information societyTo secure the wellfare of citizens and the development of the society, there must be a
strive towards productivity and competitiveness throughout the society. This is the only
means of eliminating or reducing unemployment.
Information technology has been integrated in all procedures, products, and structures in
businesses and in communities. It is an essential competitive factor for products and
production. In implementing information technology to business and societal structures
information technology merges in information networks with data and communications.
It also integrates with publication and audio-visual technologies within culture and
entertainment. Thus information industry is becoming the leading economic sector in the
world. A networked economy provides a real opportunity for Finland.
An increase in digital presentation of information for all types of information (data, text,
sound, still pictures, and live pictures such as video) and the development of information
networks, as well as their reaching to work sites and households, are the most
significant trends in information technology.
Advanced technical development of information networks already guarantees the use of
enough transfer capacity to send text, pictures, voice and video images to terminals and
workstations within the network. Important further issues will be the security of the
information network, tariffs and the level of services. Information technology is seen to
penetrate all sectors of the society, public as well as private.

101
Based on the recommendations of the Bangemann report the EC Commission has
presented a work program called "Europe Towards the Information Society". The EU
information society strategy is significant for Finland. EU research projects provide an
important source of new expertise, and also provide employment for Finnish experts.
Finland has a lot to offer, e.g. its experience in liberalizing the telecommunications
market, as well as high level applications knowhow such as large national registers,
citizens' information networks, and geographical information systems.
6.3.3 Finland's strategy, a vision for the future
The objective of the strategy is to gain and maintain a competitive edge within the world
economy and to help solve domestic economic problems. Therefore, it is necessary for
Finland to equal, and in some areas, to exceed in sophistication the best IT applications
in competing countries. Finland's technological know-how and top level IT products
and applications give us reason to believe the ambition to be realistic.
The following future vision was created starting from the given premises:
* Finland is an advanced information society based on networking.* Finland is a world class competitor in the implementation of information and communications technology.
Finland's information society strategy is based on three main elements: 1) renewal into
an information society, 2) the development of information industry, and 3) the assurance
of necessary conditions, i.e. research, knowhow, and the development of an IT
infrastructure.
Outline for a national strategy and priority recommendationsThe following national guidelines have been drafted to point the way:
1. Information technology and information networks are to serve as tools in private and public sector renewal.2. Information industry is to become an important sector of economic activity.3. Professional expertise in information and communications technology is to be maintained at a high overall level, with selected peaks.4. Everyone is to have the opportunity and basic skills for using the services of information society.5. Finland's information infrastructure is to perform in all aspects as competitive and capable of providing high quality services.
102
The priority recommendations of action of each guideline are the following:
* Provide a strong impetus to the development of public information networks and Finland's Information Highway.* Encourage the innovative application of information and communications technologies in all areas of the private and public sectors.* Develop modern information network services to strengthen the competitive position of the SME's.* Improve the conditions for growth of the information industry into a major new sector.* Participate actively in the implementation of the EU information society program (including privacy protection and copyright).* Ensure that all have the opportunity and basic skills to use the services provided by the information society.* Make national information resources and public documents easily accessible to all citizens through public information networks.* Ensure that IT research and education are appropriate and encourage the formation of world class research units.* Promote the interoperability of Finland's information infrastructure and the export of information network services.
Implementation of the strategyThe following proposals for implementing the strategy were made in the report:
* The Council of Ministers should make a decision in principle about the aims and action for the development of a Finnish Information Society. An implementation plan should be drafted for the years 1995-1997.* An Information Society Advisory Board should be established.* The execution of the strategy should be supported by wide scale publicity campaigns and educational programs.* The implementation of the strategy, Finland's Way to the Information Society, primarily be seen as an investment in Finland's renewal. In addition to ordinary investments, it would require at least 0,2% of GNP, or approximately one billion FIM (about MECU 170) of new funding annually. The major portion would be realized the marketplace.* It is the responsibility of the government to guarantee the necessary prerequisites for renewal.* The most significant publicly funded investment comes from supplying schools libraries with adequate information technology and networking.
103
6.3.4 Government position on measures for the information strategy
The position paper of the Government of Mr. Esko Aho, of the Centre Party, dated 18
January, 1995, stipulates that each administrative branch prepare detailed action plans
to implement the information society strategy principles. The ministries are to redirect,
as necessary, their resource allocations to give effect to the Government decision.
The detailed planning phase is coordinated by the Ministry of Finance and overseen by
the meeting of permanent undersecretaries.
6.3.4.1 Aims of information society policies
Finland aims to secure its position as a leading information society in the year 2000. This
will mean that:
* Finland's information, communications and content industries contribute an important share of production and exports and Finland has a vibrant entrepreneur- ship in these areas.* All citizens have access to electronic information and communication services and possess the skills to use them; the services are easy to use.* Business and administrative functions, structures, products and services are being renewed.* IT professional skills are competitive at the world level.* Finnish information infrastructures are competitive and functional in all respects; this implies broadband capabilities.* Legislation and other norms should facilitate the information society and promote the use of networks and competition.* Every citizen has the right to information.* The availability of public sector information in networks and libraries must be improved.* The needs of people in all walks of life should be met equitably.* Finnish cultural and linguistic identity must be preserved.* Finland aims to accelerate the trend to telecommunications competition in Europe.
The role of government is to provide a favorable framework for building the information
society. The most important governmental activities in the years to come will be the
following:
Network infrastructures* Set of projects on "Finnish Information Highway" including pilot ATM and ISDN
environments for multimedia development
* Promotion of generic and support services, of network compatibility, and of
104
information security.
Applications in business and industry* Systematic studies of IT and network application potential
* Measures to improve conditions for SMEs
* Program to promote telework by networking.
Public sector* Projects to reform public service functions through advanced use of IT and networks
* Measures to promote and unify electronic information exchange among
administrations
and to create integrated customer-oriented public service systems
* Projects for direct customer access to public sector information
* User-friendly pricing of services provided via public networks.
Information and communication industries* Better access to risk financing
* A high quality supply of public braodcasting programs
* Start of digital radio and television broadcasting.
Education and training* Ensuring appropriate IT, information management and communication skills at all
levels of education
* Special attention to teacher training
* IT&C professional education to be increased in volume and kept up to date
qualitatively
* Measures to provide adult population with basic IT&C training
* Access to information network services for the entire school system
* Promote remote and multimedia studying at all levels.
Culture* Ensuring a supply of Finnish cultural products on the Finnish and international
information highway
* Encouraging the birth of multimedia enterprises.

105
Research and development* Spearhead projects, particularly by SMEs
* Active participation in international research work
* Sufficient national and international scientific networking and computing capacity to
research
* Research on economic, social and cultural aspects of the information society
* Results of projects on IT and working life to be made available to employers.
Transport* Program on transport telematics to lower logistics costs.
Social welfare and health* An information strategy for the welfare and health (WH) fields
* The formation of an economic WH cluster
* Improve real time information exchange in the WH field.
National information resources* Improved access to and utilization of national registers and statistical databases
* Clear division of responsibilities in the provision of national information services
* Support to public libraries as node points of an open information network.
Legislation and other framework conditions* Draft legislation allowing the use of electronic media for transactions by citizens and
firms with government agencies
* Develop private law to take account of the implications of electronic networking for
business
* International or internationally compatible solutions to problems related to protected
material, particularly copyright
* Unify legislation on confidentiality and business secrets
* Renew privacy legislation
* Increase input to national and international standardisation efforts
*A plan for a statistical system to measure the development of information society.
International Cooperation* Active participation in EU and other international IT&C and telematics projects
* Promote telecommunications competition in Europe
* Make Finland better known through information networks.
106
Directives for Implementation* Each ministry is responsible for the attainment of the objectives in its area of
competence and shall prepare a detailed action plan for the development of the Finnish
information society in its area of competence by the beginning of March, 1995.
6.3.4.2 Information society and the new government
The parliamentary election held in March resulted in the appointment, on 13 April 1995,
of a new Government led by Mr. Paavo Lipponen, a Social Democrat. The new
Government's programme places a special emphasis on education and research and
includes a number of references to information society policies, in accordance with the
principles stated in the above sections.
The Government will foster the development of a well functioning Information Society
and promote the utilization of information networks and the Information Highway. One
of the targets is a broadband Information Highway reaching homes, public services and
SMEs.
The school system will be connected to information networks and their services will be
made available to all schools. Basic skills needed in the information society will be made
available to all. The library system is to form an integral part of the IS strategy.
The Government promotes the use of electronic communications for education and for
telework and stresses the importance of networking of firms. The Government promotes
the enterprises' real competitiveness based on innovations, skilled labour, quality of
working life and high standard environment protection. One of the main aims is a
growing ratio of investments in research and development, specially concentrated on
such areas of industry and service expertise as energy, telecommunications and
environment.
The Government also promotes free and equitable competition in printed and electronic
communications. Telecommunications legislation will be further developed in a way
required by a versatile information strategy and to increase competition at home and in
Europe.
In education, science and culture the Government will, according to the principle of life-
long learning, foster the ability of the individual, the society and the industrial life to live
up to changes, internationalization and the enhanced importance of information. The
107
Government will utilize all the possibilities offered by the information networks and the
information highways.
Preliminary action plans of the ministries were submitted on 1 March to the Ministry of
Finance, which coordinates information technology programs in Government. After
consultations and further elaboration, implementation plans, including financial
implications for the 1996 budget, were submitted in May and June. They will be brought
together as a document by the Ministry of Finance.
6.4 R&D EXPENDITURE
Finland shows dramatic figures in the expenditure for high technology R&D and in the
share of high technology products in exports in 1994.
In 1994, Finland's exports amounted to 154 000 million FIM (32 000 million USD).
During the past 10 years Finland has shown a higher growth rate in exports of high-tech
products than any other country in Europe.The country's economy is growing a "third
leg", that of electronics, in addition to the wooden and metal legs. Electronic and
electrical industries totalled 18% of the exports, engineering and metal products 19%,
chemicals 10%, steel and metals industry 8%. Paper industry, however, still has the
major share of exports, as much as 27%, while wood products account for 9%.
Production and export of PCs and other kinds of software have increased rapidly.
Finland consumes 42% - which is more than any other Nordic country - of the
semiconductors imported to Scandinavia, indicating the transition to high-tech products
in Finnish industry. Many SMEs are world leaders in their high-tech market sectors, e.g.
paging and voice mail systems, components for video-conferencing and cable TV
equipment.
See figures 4 and 5 for R&D expenditure in OECD countries and for the percentage of
high-tech exports.

108
Figure 4. R&D expenditure in some OECD countries (Views on Finnish Technology
1995, p. 5).
Figure 5. The percentage of high-tech exports in some OECD countries, percentage of
the Gross National Product (Views on Finnish Technology 1995, p. 5).

109
Finnish R&D expenditure has risen from 1,3% of GNP in 1983 to 2,2% in 1993. The
share of high-tech exports has risen to 16% of the total exports of Finland, compared to
a share of 4% in 1980. The total expenditure for R&D in Finland in 1995 will be 11 560
million FIM (2 380 million USD). Companies finance 60% of this, Finnish government
contributes by 40%. Technology Development Centre (TEKES) , with an annual budget
of 1 600 million FIM (330 million USD) is the main financing organization for applied
and industrial R&D.
Finnish high-tech exports amounted to 23 900 million FIM in 1994 (5 100 million USD).
They comprise telecommunications equipment, mobile phones, computers, measurement
devices and pharmaceuticals.
6.5 LEGAL AND REGULATORY ISSUES
Telehallintokeskus (Telecommunications Administration Centre) is the central authority
in Finland to supervise the application of telecommunications regulations. It is
organizationally divided into various administrative sections. There is no central
authority to supervise electronic mass media.
6.5.1 Data protection (privacy protection) in Finland
General regulations about personal data files and protection of personal data in Finland
are included in the law about personal files (Act No. 471/87) and decree about personal
files (Decree No. 476/87). Attention has been paid to the principles of data protection
stated in the data protection agreement of the European Council (No. 36/92 in Finland).
Finland signed the data protection agreement in 1992. In addition, special statutes about
registering personal data are included in many other laws and decrees in various fields.
General access to government informationDemocracy in Scandinavia is based on freedom of information, and Finland is a well-
known supporter of this principle, together with the other Scandinavian countries. Act
No. 83/51 in Finland consists of statutes about the publicity of public documents. This
law states the general principle of freedom of information as to public documents. This
principle means that everyone has the right to get information about the activities of
public authority, local or governmental. Public documents mean documents drafted or
made out by public authority, also documents sent to or given to or at the disposal of
public authority. According to Act No. 83/51 documents can be divided into three

110
groups: 1) public documents, 2) documents to be kept secret/confidential and 3)
documents that are public subject to consideration.
The Act is also valid for documents on computer record that the authorities have at their
disposal. Access to information in this case means that the authorities place the relevant
equipment at the person's disposal to read, listen to or by other means understand the
document. It is also possible for the authorities to give in writing the information in the
record to the person asking for it. With the authorities' permission, the information can
also be given as a photocopy or by arranging technical access to the computer record
where the document is stored.
Many municipal libraries have a special section for administrative documents, agendas
and decisions of communal and town councils etc.
Legislative reforms have been initiated by the Ministry of Justice about publicity of
documents of public authorities. By reforming legislation about general access to
government information and about confidentiality the Ministry of Justice aims at more
open administration, by e.g. increasing the publicity of the drafting, preparation and
revising of laws, decrees and administrative affairs in general.
6.5.2 Database protection in national copyright legislation
The Copyright Act of Finland (No. 404/61) does not include special regulations about
protection of databases. Databases are not separately mentioned in the list of works in
paragraph 15 of the Copyright Act. According to the Act, a database is protected as a
piece of work, providing that general conditions for protecting a piece of work are valid,
i.e. when a piece of work is the genuine and original result of the creative work by the
its author.
It is possible for databases that do not fill the requirements for a piece of work, to be
protected as lists by particular list protection. In accordance with regulations mentioned
in paragraph 49 of the Copyright Act a list is protected against copying if it consists of a
vast amount of information. Protection extends to a period of 10 years from the end of
the year of producing the list.
Issues of special concern about copyright and electronic databases at present in Finland
are briefly mentioned in the following:

111
* right to reproduce a piece of work, digital copying* copying for private use* citation right* management of rights* control of distribution and transfer of works* the concept of publicity (public presentation, showing, reproduction.
6.5.3 Computer-related crime
A total reform of the Penal Code of Finland is under way. Almost all of the amendments
to legislation according to the Council of Europe Recommendation R(89)9 on
computer-related crime are included in phase I of the reform which entered into force
on Jan. 1, 1991. Amendments of phase II of the reform will enter into force on Sept. 1,
1995 (Government Proposal submitted to the Parliament in the spring of 1993).
Computer-related fraud and computer forgeryA provision on computer fraud is introduced in chapter 36, section 1 of the Penal Code
reformed in 1991. Accordingly, a person who, with the intention of obtaining unlawful
financial benefit or harming another, by entering false data into a computer or by
otherwise interfering with automatic data processing, falsifies the end result of data
processing and in this way causes another person financial loss shall be convicted for
fraud. An attempt shall also be punished.
Amendments in chapter 33 of the Penal code state that also a recording suitable for
automatic data processing can be an object of forgery. The definition of forgery
includes the following text: ...prepares a false document of other piece of evidence or
falsifies such a document or piece of evidence in order for it to be used as misleading
evidence or uses a false or falsified piece of evidence as such evidence...
Damage to computer data or computer programmes, computer sabotageAccording to chapter 35, a person who, in order to cause damage to another,
unjustifiably destroys, defaces, conceals or hides data recorded on an information device
or other recording, shall be convicted to for damage to property.

112
All the forms of computer sabotage are punishable as damage to property in accordance
with chapter 35. If the data recorded on an information device or another recording is
altered in a such a way as cannot be deemed damage to property, the act may be
punished according to chapter 28 of the Penal Code, dealing with unauthorized use.
Unjustifiable prevention of the transmission of messages by telecommunications or the
radio is punishable according to chapter 38, of the amended Penal Code (Section 5:
Interference with communications, Section 6: Aggravated interference with
communications, Section 7: Communications violation).
Unauthorized access and unjustified interceptionThe penalty provisions, already amended and entered into force on Jan 1, 1991, now
cover also the unauthorized off-site use of an information system via a
telecommunications link (chapter 28).
In phase II of the reform, entering into force on Sept. 1, 1995, section 8 of chapter 38
covers the unjustifiable entry into an information system by breaking the security
arrangements. Also the mere breaking into the system will be punishable, even if there
were no unauthorized use as such. Also the attempt will be punishable.
The entry into an information system is punishable as such, if the object is a personal
data file maintained with the assistance of automatic data processing, as defined in the
Personal Data File Act of Finland.
Provision in chapter 38, section 8 also cover the unjustified obtainment of information
about the contents of a telephone call, telegram, transfer of text, images or data or
another comparable form of telecommunications. It is not a prerequisite that the
interception be effected by technical means.
Section 8, with the title Breaking into a computer network, states that also a person who,
without breaking into an information system or a part thereof, uses a special technical
device to unjustifiably obtain information contained in the system shall be convicted for
breaking into a computer network.
113
Unauthorized reproduction or alteration of computer data or computer
programmesIn accordance with the amended provisions of the Finnish Copyright Act (No. 34/91)
also a computer programme is to be deemed a literary work protected by copyright.
Thus also a breach of copyright of a computer programme is punishable as a copyright
offence. The punishability covers the unjustified distributionk publication and
duplication of a computer programme protected by copyright.
The unauthorized reproduction of a semiconductor product from its legally protected
topography is punishable according to the Act on Exclusive Rights to the Topography of
a Semiconductor Product (32/91), which entered into force on July 1, 1991.
There are no particular penalty provisions in the Finnish legislation for the alteration of
computer data or computer programmes. The provisions dealing with forgery, damage to
property, unauthorized use and breaking into a computer network, will fulfill the need
for relevant and reasonable. penalties.
Computer espionage, unauthorized use of a computer or computer programme,
computer virusesChapter 30, section 4, of the Penal Code contain provisions on industrial espionage.
They state that a person who unjustifiably obtains information regarding the business
secret of another e.g. by entering without permission into a closed space prohibited to
unauthorized persons or into an information system protected from unauthorized
persons, shall be sentenced for industrial espionage to a fine or to imprisonment for at
most two years. An attempt also is punishable.
The unauthorized use of a computer is to be punished in Finland according to chapter
28 of the Penal Code. Copying of a computer programme is considered duplication of a
work protected by an exclusive right. This means that in accordande with the amended
Copyright Act the unauthorized use of a computer programme usually entails a
copyright offence.
Although Finnish provisions do not mention the distribution of computer "viruses" or
"worms" as a penalised form of conduct, the provisions in force and proposed already
quite extensively cover the most reproachable forms of distribution of computer viruses.

114
Usually the distribution of computer viruses or worms results in damage to the data
stored or to its usefulness, and makes the distributor liable for a punishable act of
damage to property according to chapter 35 of the Penal Code. The distribution of a
virus may require entry into the information system or unauthorized use of the same,
thus being punishable in accordance with chapter 28 of the Penal Code.
115
7 FURTHER QUALITATIVE ASSESSMENTS
7.1 STRENGTHS AND WEAKNESSES OF SUPPLY AND DEMAND IN THE NATIONAL MARKET
Despite her small population Finland is an internationally advanced country in supplying
and using electronic information services. Finland is a higly literate country and a high-
technology country with a high-standard educational system. The stable economic and
political situation provides good conditions for conducting and supporting high-level
research in various applications of modern technology. Finland has a high-quality
national packet-switched data communications network facilitating the use of online
information systems, and adp knowledge in Finland is at a high international level.
Attitudes towards information technology are favourable both among political
authorities and the Government and in the society in general. Information is a
traditionally valued factor of production, and there is a high-standard, well developed
institutional infrastructure to support the supply and use of electronic information
services (cf. the chapters about infrastructure). Common platforms exist for the
suppliers, producers and users of online electronic information to facilitate cooperation
and discussion about mutually interesting issues.
National and international suppliers of online or offline eletronic information do not
compete very intensely with each other, but rather complete each other's supply in
Finland. National hosts (about 70) mostly offer national information in Finnish to
Finnish customers. Competition, if any, is in the supply of factual information where
parallel versions of the same information are offered. The Finns have a good knowledge
of languages, especially English, which is the most widely used language in electronic
information services. There is not much sense in foreign hosts or database producers
entering the Finnish market with a Finnish version of their online databases or
information systems. They would have an internationally minor number of users and
views of profit would not be very good. Big international suppliers are strong in real-
time information services and in offering international information in about any line of
science, technology or business information.

116
7.2 INTERNET AND THE CHANGING SOCIETY
How to prevent a new class society in the Information Age? Information Cooperative
Katto-Meny argues there is a danger that information technology becomes a priviledge
for the elite, increasing inequality in the society. We should aim at changing the society's
structures so as to avoid such a danger. Public libraries, the trunk line of information,
would be the most natural channel of combining the traditional and the digital written
culture. Libraries also are the best services providers of Internet connections free-of-
charge. The first measures have already been taken in some libraries, as well as Internet
cafés in Finland.
It is vital to invest in information infrastructure. Public support is necessary for new
electronic cultural services via libraries; offering the services free-of-charge will be a
guarantee for the equality of citizens in the information society. Information
Cooperative Katto-Meny (abbreviated from the Finnish name Kansalaisjärjestöjen
TietoToimisto and the Swedish name Medborgarorganisationernas Nyhetsbyrå) is a
Finnish citizens' organization with 80 organizations as members. They are organizations
engaged in various electronic cultural activities, e.g. literature, arts, cinema, publishing
houses and magazines.
We live in a transition period; the beginning of a network society can be compared to
the beginning of the cooperative movement. Mr. Böök calls for citizens and
cooperatives to be active in bringing information technology to large circles in our
society. The Government of Finland and the ministries have already taken measures on
the set course.
7.3 VISIONS OF COMMUNICATIONS
7.3.1 General
The driving force behind the media is people’s needs, whether for information,
experiences (entertainment) or advertising. The liberalization of competition boosts the
need for advertising; the increase in leisure the need for entertainment and the ever
more complex and technical world in which we live the need for information. Advances
in communications frequently depend on the ways in which these often overlapping
needs are satisfied. Of particular interest is the combination of information and
entertainment, or ‘edutainment’, a process that makes learning fun.

117
In real terms, Finnish mass media grew one-and-a-half fold in the 1980s; it accounts for
about 3% of GDP. The printed media dominated this figure with a share of over 73%,
and yet the 1980s will be remembered as the decade of expansion in electronic and
recorded media.
Finland is a global leader in printed media. This country’s printing industry accounts for
around 3% of GDP, whereas the average for western Europe as a whole is 1 - 2%.
The dominant media have maintained their position well. Electronic and printed media
both have their advantages, but present consumer patterns can be expected to change
more drastically than they would have in earlier generations.
Literacy stands at over 99% in Finland. Newsprint consumption amounted to about 45
kg per person in 1990. Newspapers, almost invariably ordered by subscription and
delivered to homes early in the morning, are read by 96% of Finns every day; television
is watched by 72%. Measured in money terms, private consumer expenditure is
increasing but the proportion of the media relative to total expenditure is declining. The
Research Institute of the Finnish Economy (ETLA) expects annual growth of 2% in
consumer electronics by 1998. In the USA the average household spends around USD
915 on the media, telephones included, every year. In 1990, Finnish households spent
some FIM 4400 on the media, telephones excluded (table 40); with telephones, the
figure would have been almost the same as that for the USA. - Talb 39 shows patterns of
consumption of printing products in Finland and in industrial countries as a whole.
Table 39. Consumption of printing products in Finland (Joukkoviestintätilasto 1993,
p. 31, table 1).
Value in Typical valueFinland in industrial
countries Newspapers - circulation/1000 inhabitants 521 200 - 350 Magazines & periodicals - circulation/1000 inhabitants 2 500 600 - 2 000 Books - titles/10 000 inhabitants 20 8 - 15 Time spent on reading (minutes per day) - newspapers 40 30 - 45 - magazines 40 15 - 30 - books 25 20 - 35
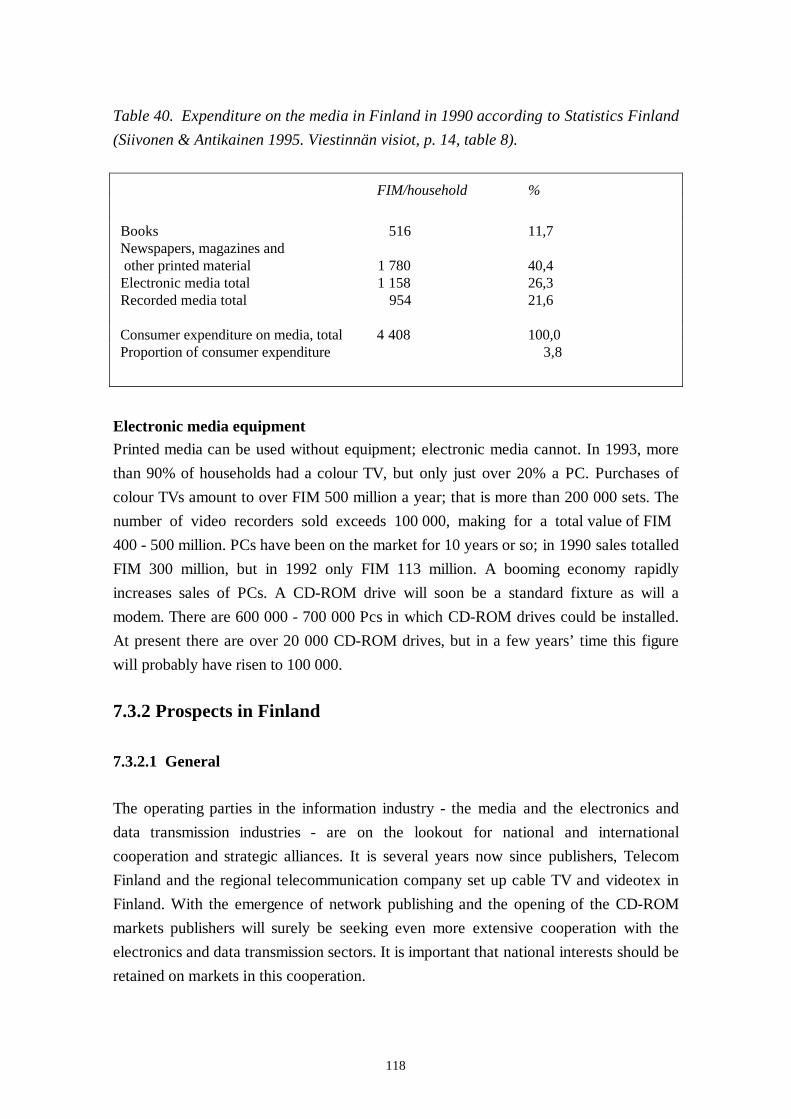
118
Table 40. Expenditure on the media in Finland in 1990 according to Statistics Finland
(Siivonen & Antikainen 1995. Viestinnän visiot, p. 14, table 8).
FIM/household %
Books 516 11,7 Newspapers, magazines and other printed material 1 780 40,4 Electronic media total 1 158 26,3 Recorded media total 954 21,6
Consumer expenditure on media, total 4 408 100,0 Proportion of consumer expenditure 3,8
Electronic media equipmentPrinted media can be used without equipment; electronic media cannot. In 1993, more
than 90% of households had a colour TV, but only just over 20% a PC. Purchases of
colour TVs amount to over FIM 500 million a year; that is more than 200 000 sets. The
number of video recorders sold exceeds 100 000, making for a total value of FIM
400 - 500 milli on. PCs have been on the market for 10 years or so; in 1990 sales totalled
FIM 300 milli on, but in 1992 only FIM 113 milli on. A booming economy rapidly
increases sales of PCs. A CD-ROM drive will soon be a standard fixture as will a
modem. There are 600 000 - 700 000 Pcs in which CD-ROM drives could be installed.
At present there are over 20 000 CD-ROM drives, but in a few years’ time this figure
will probably have risen to 100 000.
7.3.2 Prospects in Finland
7.3.2.1 General
The operating parties in the information industry - the media and the electronics and
data transmission industries - are on the lookout for national and international
cooperation and strategic alliances. It is several years now since publishers, Telecom
Finland and the regional telecommunication company set up cable TV and videotex in
Finland. With the emergence of network publishing and the opening of the CD-ROM
markets publishers will surely be seeking even more extensive cooperation with the
electronics and data transmission sectors. It is important that national interests should be
retained on markets in this cooperation.

119
The growth in electronic media is influenced by the widespread use of computers and
CD-ROMs and the introduction of broadband communications networks to homes and
work places, but also by conventions and consumer acceptance. Despite the possibility
of a certain polarization, consumption patterns are not likely to change very rapidly.
There are signs that people are dividing into two main groups as far as the media are
concerned: those who read printed material and those who read on screen.
In table 41, Timo Siivonen and Hannele Antikainen, two researchers in graphic arts
technology at the Technical Research Centre of Finland, present their subjective view of
future trend in the printed media and a cautious prognosis for electronic publishing in
2000. Their figures are based on recovery of the economy but also on the improbability
of a boom such as that of the 1980s. In their opinion, the printed media have almost
reached saturation point, and the figures for growth in the traditional publishing markets
and the proportion of electronic media are expected to be lower than in the CEC table
for all Europe (table 42).
Table 41. Publishing markets in Finland in 1993 and forecast for 2000 (Siivonen &
Antikainen 1995. Viestinnän visiot, p. 35, table 17).
Traditional publishing Potential of electronic1993 2000 publishing in 2000
(FIM million) (%) (million FIM)
Books 1 930 2 200 4-12 180 Magazines & periodicals 2 670 3 000 4-12 240 Newspapers 4 820 5 100 1-3 100 Printed advertising material 1 450 2 000 4-12 160
Total: 10 870 12 300 1-12 680
Newspapers include local papers and free sheets.

120
Table 42. Publishing markets in Europe in 1992 and forecast for 2000 (CEC)
(Siivonen & Antikainen 1995. Viestinnän visiot, p. 30, table 13).
Traditional publishing Potential of electronicpublishing in 2000
1992 2000 (MECU) (MECU) (%) (MECU)
Books 18 500 27 200 8-18 3 480
Magazines & periodicals 22 000 32 500 5-15 3 250
Newspapers 25 000 37 000 5-10 2 775
Company publications 10 000 15 000 10-25 2 625
Total: 75 700 111 700 6,5-15 12 130
According to this prognosis, by 2000 Finland will have 300 000 or more CD-ROM
drives. If an average 300 000 CD-ROM-drive owners spend FIM 500 on CD-ROMs, this
will amount to a turnover of FIM 150 milli on. In addition, households will probably
spend even more on CD-ROM games than on CD-ROM books, which will push total
sales of CD-ROMs even higher. At the same time the price of disks will probably come
down. A used CD-ROM market is foreseeable, implying a slight decline in sales of new
disks.
Small-scale publishers may publish books on ordinary computer diskettes, too, or store
books in data networks. Organizing profitable network publishing is a problem that will
have to be tackled at some point. The copyright and compensation rules for audiovisual
material will also have to be worked out.
7.3.2.2 The press
Largely thanks to their early delivery, newspapers enjoy a strong position on the Finnish
reader market. Nevertheless, the day will come when network services will augment or
even supplant newspapers, but not before 2010 at the earliest. With the spread of
broadband technology, the daily paper may end up as a fully electronic medium.

121
Finland has almost as many newspapers as it can handle; local papers and free sheets
included, turnover in 2000 is expected to be around FIM 5000 milli on. The turnover of
electronic papers will hardly increase to hundreds of millions of marks by the end of the
present decade. The CD-ROM presents no threat to the daily paper.
Publishers of magazines and periodicals will probably use computer and CD-ROMs as
ancillary products of the printed newspaper. The turnover of network and CD-ROM
versions is currently, however, marginally, small. Services are primarily used by special
groups only, not the general public. General interest magazines and a few speciality ones
(e.g. interior decorating and fashion magazines) can be expected to continue in printed
form long into the 21st century, whereas, many specialist and professional magazines
will, like scientific journals, increasingly be found on CD-ROMs and networks.
7.3.2.3 Internet
The speed of the Internet makes it an important data transmission channel, as it enables
advertisers and writers to bypass current media and publishers and to transmit their
messages or works direct to the target groups cheaply and rapidly. Charges for the
services will, however, probably restrict its use. Finland's information industry is
nevertheless going to find new players on its court.
By the year 2000 the present division of the media into graphic, and electronic and
recorded sectors will no longer be justified. Network publishing and paper publishing are
different branches of the same tree. Organizing the production and marketing of its
content and the profitability of operations will be left to publishers. Growth in demand
for the printed word is, however, a matter of life and death for printers.

122
8 PREVIOUS FINNISH SURVEYS AND PRESENT CONCLUSIONS
8.1 PREVIOUS SURVEYS ABOUT THE USE OF ONLINE INFORMATION SERVICES IN FINLAND
The use of online information services in Finland has been surveyd five times, covering
the years 1978, 1980, 1983, 1985 and 1989. All these user studies were sponsored by
the Finnish Council for Scientific Information and Research Libraries (TINFO,
Tieteellisen informoinnin neuvosto) and were performed a the Information Service of
the Technical Research Centre of Finland (VTT).
In the survey about 1989, an extensive questionnaire was sent to all the information
services in Finland and by the major Finnish hosts and network services to their
customers. Altogether 1186 responses were received, out of which 704 came from
active users, 180 from users who had access to online services but had not used them in
1989, and 302 responses from non-users. The number of responses had almost tripled
since the survey in 1985.
The usage of online services in 1989 was measured both in connect hours and in
expenditures. On the basis of the responses and by applying the 75-25 rule the total user
population (organizations and information service units) in Finland was estimated to
have been almost 3 000; they used altogether 73 000 connect hours in 1989. Out of this
usage 78% was for domestic services and 22% for foreign services. The total cost of the
online usage was estimated to have been 22 million FIM (cf. table 43).
The greatest number of the connect hours in 1989 was used by the governmental sector
(38%), universities and other academic institutions (27%) and by large industrial
companies (16%). If measured by expenditures, the most active user groups were the
large companies (47%), universities (29%) and research institutions (10%). The majority
of the users (40%) was located in Helsinki and its surrounding areas.
The growth rate of the use of online services in Finland was still very strong but had
slowed down since the survey in 1985. Until 1985, the growth rate was exponential
doubling in about two years, but since that it had turned to be more linear. The

123
comparision to Sweden and the United States revealed that per capita the hourly usage
in Finland in 1989 was on the same level as in the U.S and somewhat larger than in
Sweden. In expenditures, the usage in the U.S. was about twice as much as in Finland.
Table 43. The usage of online services in Finland 1978 - 1989 (Eskola & Lehti 1990).
Year Number of user Total Expendituresorganizations connect hours (million FIM)
1978 42 1 900 0,7
1980 80 4 600 2,1
1983 400 16 000 5,4
1985 1 000 37 000 9,6
1989 3 000 73 000 22
8.2 BACKGROUND INFORMATION ON THE PRESENT SURVEY
MSSTUDY Finland was part of a multinational study for assessing the situation of the
markets for electronic information services for professional purposes in 1994 in the
member states of the European Economic Area (MSSTUDY), covering 17 countries and
initiated under the European Commission’s IMPACT 2 -programme. The main level of
the study was the macro level. The main objective, according to IMPACT 2 and its
Information Market Observatory (IMO), was to identify the strengths and weaknesses
of existing electronic information services in the EU and to stimulate and reinforce the
competitive capability of European suppliers of electronic information services.
The study was done in the participating countries during the year 1995, according to a
common manual and a pre-survey made a year earlier by the coordinating committee of
MSSTUDY. The scope and depth of the study varied in each country, according to the
contract the country made with the European Commission. The same questionnaires
about supply and demand were used in each country in the quantitative part of the
study, to get an overview of the size, structure and dynamics of the national markets for
electronic information services. In addition to quantitative and qualitative study of the
markets, the participants were to cover the relating various infrastructure sectors. No
common agreement could be reached about the depth and intensity of the infrastructure

124
side of the study and each country was free to cover the sections considered the most
important for the national markets.
The participating countries delivered their national reports to the European Commission
by November, 1995. The coordinating group of the study was to aggregate the results
into a pan-European report about the markets for electronic information services for
professional purposes in ETA countries.
8.3 FINLAND
Suppliers were the only compulsory group to be covered by each country by
quantitative means. In addition to her original contract, Finland also chose to study
different groups on the demand side. No overall conclusions about the supply side could
be made, based alone on the questionnaires filled in by the respondents. All the
numbers given in the report about the overall markets for electronic information services
in Finland are estimates made by the author, by supplementing the information from the
questionnaires with further qualitative study from printed sources and in discussions
with experts in Finland.
The scene is changing rapidly with new technology and applications in
telecommunications, data transmission, hardware and software. Government measures
and national information policy and strategie support the development of the
infrastructure related to electronic information services, and the emerging information
society. Hosts and producers contribute to changes in the contents of electronic
information as well as the channels via which it is accessed.
It was, however, possible to give a rough estimate about the markets for electronic
information services in Finland in 1994. The figures are partly based on responses to the
supply side questionnaires - although the overall response rate was only 29% - and
partly on other printed sources and opinions of experts. Internet connections are
supplied on a commercial basis as well as, for a large part, on a not-commercial basis.
Turnover numbers then must be very rough estimates. The same also applies to a certain
part of e-mail supply. Besides, suppliers of e-mail services and Internet connections
often are the same organizations and it is not always possible to make a strict difference
between the two services.

125
Estimates presented in table 44 do not include international supply of retrospective
online information services (Dialog, STN International, ESA-IRS, Data-Star,
Questel/Orbit or others). The table does include an estimate about the international
supply of real-time information services in Finland, and partly of credit information. To
come to an overall market estimate, the above figures must be completed with
information about international supply.
Information about demand concerns only the target groups selected for the survey. No
overall conclusions have been made. Based on the latest previous demand survey in
Finland (usage in hours and expenditure) from 1989, and considering the rapid
development in the field, Finland can still be considered one of the most advanced
countries in the world in using electronic information services.
Table 44. Estimate of the markets for electronic information services for professional
purposes in Finland in 1994.
Million FIM Million ECU
Hosts of retrospective online information services 70 11 (international supply excluded) Hosts of credit information 85 14 Real-time information services, financial and news 200 to 220 32 to 35 Audiotex services for professional purposes (*) 195 31 Telematic information networks 45 to 55 7 to 9 Electronic mail services 45 to 50 7 to 8 Internet connections 10 1 to 2 CD-ROMs 11 2 Further optical and magnetic information media 5,5 to 6 0,9 Total: 666 to 702 106 to 113
(* Audiotex services altogether: 375 60)
Further qualitative assessments about the various infrastructure sections are given in the
corresponding chapters and in the executive summary.

126
8.4 PRELIMINARY COMPARISONS ABOUT EUROPE
A European report about the markets for electronic information services for professional
purposes will be published the Commission at the end of April, 1996. The coordinating
group of the multinational study measures the following main entities (estimates) for the
European Economic Area (EEA) as a whole and for each participating country: A =
total expenditure in the country for electronic information services (EIS) = total
market; B = worldwide revenues of domestic suppliers; C = exports (= revenues of
domestic suppliers in foreign countries); D = imports (revenues of foreign suppliers in
the country). The total market will thus be A = B - C + D.
Some preliminary figures (table 45) may be given about the total market in Europe and
in Finland. The total European market in the EEA countries is estimated at about 4
034,9 million ECU. The United Kingdom is estimated to have a 29,1% market share of
the total market, Finland a 2,9% market share.
Table 45. Preliminary data about the markets for electronic information services
(EIS) in the European Economic Area (EEA) in 1994: revenues (turnover) and market
share (MSSTUDY workshop in Luxembourg on Dec. 13, 1995).
Region/country Revenues in million European market
ECU (MECU) share in %
EEA 4 034,9 100
United Kingdom 1 174 29,1
Denmark 211,6 5,2
Norway 133,6 3,3
Sweden 128,8 3,2
Finland 116,7 2,9
Preliminary data about the total EIS expenditure in relation to the inhabitants (in ECU)
and about the total EIS in relation to GDP (%o) given in table 46.

127
Table 46. Preliminary data about the markets for electronic information services
(EIS) in the European Economic Area (EEA) in 1994: main indicators (MSSTUDY
workshop in Luxembourg on Dec. 13, 1995).
Region/country Total EIS expenditure in relation Total EIS in relation
to the inhabitants (in ECU) to GDP (‰)
EEA 10,8 0,65
United Kingdom 20,8 1,38
Norway 31,3 1,47
Sweden 15 0,79
Finland 22,9 1,63
Certain facts were specially emphasized in the preliminary overview of the national
studies given in the workshop. Finland is No. 2 in the world after Iceland as far as
Internet hosts/servers per 1000 inhabitants are concerned, 5% of the whole population
of Finland is connected to Internet (200 000 users), half of them for commercial use.
Audiotex has a significant share of the markets for electronic information services in
Finland. There is a well-functioning network of libraries, and all the most important
special and research libraries are also open to the public and act as information brokers
in their special fields of knowledge.
According to tables received from the coordinating group of the MSSTUDY via CEC in
March, 1996, the total market for EIS for professional purposes (A) in Finland in 1994
was estimated to be 116,7 million ECU (Sweden: 175,9); wordwide revenues of
domestic suppliers (B) 99,8 million ECU (Sweden: 123,5); exports (C) 5,7 million ECU
(Sweden: 6,1) and imports 22,6 million ECU (Sweden: 58,5). The corresponding figures
for all EEA would be: total market for EIS for professional purposes 3 956,8 million
ECU, worldwide revenues of domestic suppliers 6 225,5 million ECU, exports 3 471,8
million ECU and imports 1 203,1 million ECU.

128
EXECUTIVE SUMMARY
GENERAL
MSSTUDY Finland was part of a multinational study for assessing the situation of the marketsfor electronic information services for professional purposes in 1994 in the member states of theEuropean Economic Area, covering 17 European countries and initiated under the EuropeanCommission's IMPACT 2 -programme. This report is a modification of the national report whichFinland delivered to CEC in November, 1995.
Finland covered the supply and demand sides of the markets for electronic information servicesby quantitative means. The supply questionnaire was sent to 147 recipients, a) Finnish databaseproducers and hosts of online information systems, including representatives of foreign hosts, b)suppliers of telematic services and c) audiotex services, d) electronic mail services and Internetconnections, and to e) producers or distributors of offline information products, mostly of CD-ROMs. The demand questionnaire was sent to 108 recipients in four target groups, a)information brokers and external information intermediaries and to b) the main scientific andresearch libraries, acting as information brokers in their special fields; also to c) the main publiclibraries and d) an industrial group, i.e. intermediaries in the chemical and pharmaceuticalindustry in Finland. The quantitative surveys were supplemented by qualitative informationgathered from various printed sources and in discussions with experts of the branches concerned.
Finland covered the following infrastructure sections related to the markets of electronicinformation services: library services, printed media infrastructure, professional associations,education and training, research and development, telecommunications infrastructure, computerinfrastructure, economic and political infrastructure, national information policy, legal andregulatory issues. The sections were covered up to a varying scope and by means of printedsources and expert opinions. A chapter about future visions of communications is included.
SUPPLY
There are about 70 national online hosts in Finland, and a dozen of them are the major hosts.Almost 40 database producers also act as hosts or vice versa, many online database producersalso sell or produce CD-ROMs. Altogether, 147 supply questionnaires were distributed: 107copies to Finnish hosts and database producers and agencies for foreign hosts, 13 to suppliers ofelectronic mail and Internet services as well as audiotex services, 22 to producers anddistributors of CD-ROM products and 5 to suppliers of telematic open information networks(value-added or kiosk services) or videotex services.
The overall response rate was 29%. Over 45% of the respondents were public institutions,whereas private companies accounted for 36% of the respondents. The response rates of thevarious groups, based on the Finnish address lists, were the following: hosts and databaseproducers 30%; electronic mail and Internet suppliers 38%; CD-ROM producers or distributors14%, telematic or videotex services 40%. Most of the representatives of foreign hosts did notanswer for Finland alone but referred direct to the headquarters of their parent organization.Foreign hosts, however, play an important part in the market in Finland. Figures presented in thereport have to be supplemented with their share in order to come to the final size of the marketsin Finland.

129
It was not possible to draw conclusions from the questionnaires alone about the total marketof the supply of electronic information services in Finland in terms of money. Nevertheless, itwas possible to work out an estimate about the Finnish market, with supplementary informationfrom printed sources and expert discussions, not including import, i.e. the share of foreignhosts of retrospective online information systems.
The size of the markets for electronic information services for professional purposes inFinland in 1994 was estimated to amount to approx. 666 to 702 million FIM (106 to 113million ECU). The figures comprise the following estimates, in million FIM (brackets: millionECU): a) hosts of retrospective online information services (international supply excluded) - 70million FIM (11 million ECU); b) hosts of credit information services - 85 (14); c) real-timeinformation services, financial and news - 200 to 220 (32 to 35); d) audiotex services forprofessional purposes - 195 (31); e) telematic information networks - 45 to 55 (7 to 9); f)electronic mail services - 45 to 50 (7 to 8); g) Internet connections - 10 (1 to 2); h) productionand distribution of CD-ROMs - 11 (2); i) further optical and magnetic information media - 5,5 to6 (0,9).
There are both national and international suppliers of real-time information services in Finland.It may be estimated that the turnover of the major hosts, international as well as national, forreal-time financial and news services supplied in Finland amounts to approx. 200 to 220 millionFIM (32 to 35 million ECU).
Summing up: the turnover of domestic suppliers in Finland plus imports (revenues of foreignsuppliers in Finland) minus exports (revenues of domestic suppliers in foreign countries) equalsto the total market in Finland for electronic information services which is estimated to be 116,7million ECU in 1994 (according to aggregated figures by the MSSTUDY coordinating group ofCEC from March, 1996). The total European market in the EEA countries in 1994 is estimatedto amount to 4 034.9 million ECU (revenues with electronic information services in the EEAcountries). United Kingdom has a share of 29.1% of the market, Denmark a 5.2% share, Norway3.3, Sweden 3.2 and Finland 2.9%.
Electronic mail services and Internet connectionsTurnover numbers of the supply of electronic mail services and Internet connections are onlyrough estimates. Internet connections as well as electronic mail services are supplied on acommercial basis and, for a large part, on a non-commercial basis. The players in the market forelectronic mail services consist of both public and private companies as well as many voluntaryorganizations, pc user groups or associations. The major commercial electronic mail services areprovided by big telecommunications operators and computing centres and also by hardware andsoftware suppliers. It is estimated that about 350 000 Finns use electronic mail services. Besidesthe services on a commercial basis, there are dozens of non-commercial services. FUNET, theacademic network of Finnish universities, provides both electronic mail services and Internetconnections. Tens of thousands of pupils and teachers use Internet and electronic mail servicesvia Freenet, an educational network project which started in 1993. University students also haveaccess to electronic mail and Internet services. Internet services are provided in four majornationwide networks, those of Telecom Finland, Finnet Group of regional telecommunicationscompanies, Helsinki Telephone Company (HPY) and EUnet Finland. Internet users may beestimated to number about 200 000, 5% of the population of Finland. In July, 1995 there wereabout 111 000 Internet servers in Finland, a growth rate of 125% from July, 1994. The leadingfour countries in the world, based on the number of Internet servers/hosts per 1000 inhabitants inJuly, 1995, were: 1) Iceland - 26,15 Internet servers per 1000 inhabitants; 2) Finland - 22,19; 3)USA - 16,74 and 4) Norway - 15,54 (Statistics from TIEKE, Information TechnologyDevelopment Centre).
130
Audiotex servicesIn spring, 1994 there were about 6300 audiotex telephone numbers, of which 2800 premium-rateservices. Two groups of operators supply audiotex services, Telecom Finland (about 70% ofaudiotex service numbers) and the Finnet Group of regional telecommunications companies. InFinland it is not the operators that determine the price that the caller pays, but - in contrary togeneral practice elsewhere in Europe - the producers of audiotex information who then pay theoperators their share of the price. Rather than consider the suppliers' turnover one should talkabout the money that consumers spend for audiotex services. According to estimates, the marketfor audiotex services in Finland in 1994 amounted roughly to 375 million FIM (60 million ECU).Entertainment services account for 180 million FIM (29 million ECU); the remaining 195 millionFIM (31,5 million ECU) is spent on other kinds of services, more or less professional.
Value-added telematic information networksTwo major suppliers of value-added telematic information networks dominate the market oftelematic information services in Finland, Telecom Finland with its Telesampo network and thegroup of regional telecommunications companies with Infotel. Both Telesampo and Infotel aremenu-based service networks where the user from his computer can access a wider range ofservices, national and international online databases, videotex services and messaging services,from banking to forums of discussion, from news and weather forecasts to telephone cataloguesand marketing channels and entertainment. Telematic services in Finland are "truly telematic" bytechnology, combining the data transmission capacity of telecom networks with the intelligenceof computers. Videotex technology is hardly used at all any more in Finland. Over 90% ofTelesampo's services are in ASCII form, including banking services. According to TELMO, theFinnish Association for Network Services, 215 000 Finns, i.e. more than 4% of the population,spent 985 000 hours in using telematic information networks in 1994; some 80% of the use viakiosk services where no user ID is necessary. Telematic services were mostly used for banking,over 42% of the minutes spent in the services.
DEMAND
Finland covered the compulsory group of a) information brokers or external informationintermediaries (33 questionnaires) and, instead of information intermediaries in banks, three othertarget groups. They were b) the main scientific, research and special libraries (41), c) the mainpublic libraries (24) and d) intermediaries in the chemical and pharmaceutical industry (10enterprises). Altogether, 108 demand questionnaires were sent out about the use of electronicinformation services for professional purposes. Potential users were not surveyed. - The overallresponse rate was about 36%. Response rates in the four target groups varied, and not all of therespondents answered all the questions. - Based on the responses, no overall conclusions canbe made, but information gathered from the various target groups only refers to that specificresponding group's demand. Based on a previous demand survey (usage and expenditure ofonline information systems in Finland) from the late 1980's and considering the rapiddevelopment in the field, Finland can still be regarded as one of the leading countries in theworld in using electronic information services.
Information brokersThere is only a minor number of private information brokering firms in Finland, and theirrevenues, if any, are of no significance. Most of the brokers are public organizations, bigscientific, research or special libraries with information service units. Some branch organizationsor industry federations also act as information brokers and intermediaries for their members, e.g.

131
in the pulp and paper and food industry. The 33 questionnaires sent out to brokers also included13 scientific or research libraries that can be categorized as brokers, too.
Information intermediaries in the industrial target groupThe target group of enterprises in the chemical and pharmaceutical industry chosen for thedemand survey represents users and information intermediaries traditionally active, pioneers andsome of the most active users of online information in Finland. The major companies in thebranch have long established information service units or departments of their own. A totalnumber of 10 participants were chosen for the survey, nine major companies with their owninformation intermediaries and a branch federation.
Scientific and research librariesFinland has a very well organized network of libraries, both public and scientific. The majorscientific, research and special libraries also act as information brokers so they were a naturalchoice for the demand side survey. The Guidebook to scientific libraries in Finland 1993(Suomen tieteellisten kirjastojen opas 1993) lists almost 800 scientific, research or speciallibraries. A decision was made to send the demand questionnaire to libraries which participate inthe annual research library statistics (Tieteellisten kirjastojen yhteistilasto, Union statistics ofresearch libraries) for the Ministry of Education. They numbered 47 in the year 1993, 20 of themacademic (university) libraries and the remaining 27 other kinds of research or speciallibraries.The number of scientific, research and other special libraries in the address list for the surveyoriginally amounted to 54. Since twelve of them also belonged to the list of information brokersand one to the industrial target group, the remaining total was 41 libraries.
Public librariesAmong the network of public libraries, the 18 district libraries, greater in size and importanceand corresponding to the central libraries elsewhere, were chosen for the demand side survey.The questionnaire was also sent to Helsinki City Library (National Central Library of the publiclibraries) and a few other major municipal libraries, together with those public libraries that untilMarch, 1995 had published their own World-Wide Web pages. The final number of participatinglibraries was 24.
INFRASTRUCTURE
Library servicesAll Finnish libraries and information service units with their holdings and services, open forpublic use, belong to a closely-knit, well-functioning library network. It consists of centralresearch libraries, district libraries (regional central libraries), other regional, central and researchlibraries, information service units in firms, archives and, to a certain extent, also of museums.Library holdings altogether consist of more than 54 million volumes of books and serials, and ofan increasing amount of audiovisual and micro-fiche material and computer records. Due to thegeneral economic depression in Finland, public funding of research libraries has been reduced inthe past few years, compelling most libraries to rationalizing measures.
All of the most important scientific and research libraries are open to the public and act asinformation brokers in their special fields of knowledge. Helsinki University Library is theNational library of Finland, and Helsinki City Library is the National central library for publiclibraries. The national coverage of Finland's scientific libraries is the highest in the world.University libraries set up the main part of the almost 800 scientific, research and speciallibraries of Finland. The Union statistics of Finnish research libraries consists of 20 academic

132
library organizations and 27 other special libraries. The total number of library unitsparticipating in the Union statistics in 1993 was 514. The information system LINNEA connectsabout 800 scientific library units, and the MANDA system serves public libraries. All localsystems are inter-conntected, and national databases serve all users.
Public municipal libraries in Finland form an internationally excellent network of informationproviders. In 1994 Finland housed 998 main and local municipal libraries. Volumes in publiclibraries totalled over 39 million issues, of which 36 million books. Of the five million Finnsabout two thirds use library services regularly and 49% have a library card. The average annualnumber of loans per inhabitant was 20,2. There are 29 clusters of 131 municipalities engaged inthe joint use of automated data processing for libraries. In the spring of 1994, 68% of themunicipalities had in use or were about to use computerized library systems. Helsinki CityLibrary is the first public library in the world to have established a WWW server for a pilotproject. About 50 libraries already have access or plan to have access to Internet.
Printed media infrastructureMass media total turnover in Finland in 1994 amounted to 16 billion FIM (2.6 billion ECU).Print media accounted for 75% of the total, about 12 billion FIM (1.9 billion ECU). Massmedia's share of the total workforce has remained constant since the early 1980's, at about 2%.Print media companies are the biggest employers in the branch. The Finnish Association ofPublishers had 66 members in 1994. Members of the association annually publish about half ofthe new titles in Finland. The seven major publishers account for 70% of the total sales of themember companies (total sales in 1992: 1244 million FIM = 200 million ECU). They publishedhalf of the new titles in 1994 and about 77% of the new editions. Besides bookshops and bookwholesalers, book clubs (mostly owned by the big publishers) are an important feature in book-trade in Finland. The major bookstore chains, Suomalainen Kirjakauppa and Akateeminenkirjakauppa, also sell CD-ROMs. Suomalainen Kirjakauppa (also an agency for FT Profile)belongs to Rautakirja Group which is engaged in many kinds of media, including wholesaledistribution of videos, cinema theatres and retail sales of mass media products.
Magazines and periodicals accounted for 18% (2670 million FIM) of mass media total turnoverin 1993. About 2500 different magazines and periodicals are published regularly in Finland.There are four major publishers. Newspapers accounted for 31% of mass media total turnoverin 1993. In 1994, 190 publishers with 225 newspaper titles (57 dailies) were affiliated to theFinnish Newspaper Publishers' Association. In 1995, the members consist of 227 newspapersand two cable television and videotex companies. The aggregate circulation of newspapers in1994 was 3,5 million copies. More than half of the total circulation of dailies is deliveredthrough the papers' own or joint distribution networks, early in the morning to the subscribers'homes. Six newspapers had a circulation of over 100 000 copies in 1994.
Traditional publishing houses, small hypermedia companies and newspaper publishers areengaged in electronic publishing. There are more than ten small hypermedia or multimediacompanies which offer tailor-made products for customers. Up to the end of 1994 some 20 CD-ROM discs had been produced in Finland. The total number of CD-ROM drives was 30 000pcs, not including game and toy players. There are about 30 WWW magazines in Finland.
Professional associationsThere are three major associations in the information service and library branch in Finland,active in education, training and international cooperation. They are the Finnish ResearchLibrary Assocation (Suomen tieteellinen kirjastoseura), the Finnish Society for InformationServices (Tietopalveluseura) and the Finnish Library Association (Suomen kirjastoseura). TheFinnish Society for Information Services has established and for many years administered a
133
further education programme for people with academic background who want to specialize ininformation management and information services. Since 1968, more than 700 specilists havegraduated from the one-year programme which is at present administered by the Centre ofContinuing Education at Helsinki University of Technology.
Three major associations promote the cooperation of industry, public administration and users ininformation technology and data transmission. They are the Information TechnologyDevelopment Centre (Tietotekniikan kehittämiskeskus, TIEKE), the Finnish Association forNetwork Services (TELMO) and the Finnish Data Communication Association (Suomentiedonsiirtoyhdistys, STY). The Finnish Information Processing Association (Tietotekniikanliitto) is an independent umbrella organization of associations in information processing (eightmember associations with 12000 members and 500 institutional members). The FinnishComputing Services Association (Tietojenkäsittelyn Palveluyritysten Liitto, TIPAL) is thebranch organization of 120 member companies that represent 80% of the total Finnish market forcomputing and professional services and software products.
Education and trainingLibrary and information science is taught in three universities in Finland, in Tampere, Oulu andTurku (Åbo Akademi, education in Swedish). The total number of graduate students is about335, and of post-graduate students about 40. Professional training is given in the centres forcontinuing education of the three universities for persons already working in the field. Educationin library and information skills is also given in five business polytechnics and three businesscolleges. Basic library and information skills are taught in every school. There are more than4100 comprehensive schools for primary education, and over 470 secondary schools in Finland.
Research and developmentResearch of academic level in information science and information services in Finland is done atthe universities of Tampere, Oulu, Jyväskylä and Turku (Åbo Akademi). More professionallevel of R & D work is done at VTT Information Service, Nokia Reseach Centre, the TechnicalUniversity of Helsinki, Information Technology Development Center (TIEKE) and the FinnishAssociation for Network Services (TELMO). Central R & D areas are networked information,electronic publishing, user needs, information retrieval, document management, internationalstandards for electronic documents, and socio-economic issues.
Telecommunications infrastructureIn 1993 the GNP of transport and communications amounted to 39100 million FIM, contributingwith 9,4% to the total for the nation. The value of telecommunications was 6158 million FIM.In 1994 public telecommunications operations were conducted by State-owned Telecom Finland,48 telecommunications companies, the Finnish Broadcasting Company YLE and five otherorganizations. Telecom Finland and Finnet Group of regional telecom companies are roughlyequally large in turnover, about 5 billion FIM both. Internationally Finland is a leader intelecommunications services, a few years ahead of other EU countries. The turnover of Finland'stelecommunications will total 12 billion FIM in 1995 and is expected to rise to 15 billion FIM by2000. The brisk pace of investments in the field continues, with 3 billion FIM being invested in1995. - In 1994 the total number of network terminals in data transmission networks in Finlandwas 11223 pcs. There were 2587 teleprinters and 124000 telefax machines in use in Finland in1994. - Finland is one of the three leading countries in the world in relation of mobile phones per100 inhabitants. In 1994 the rate of mobile phones per 100 inhabitants was 13,24 in Finland (16,5in Sweden).The full force of competition in telecommunications hit Finland in early 1994. At least twoalternative domestic carriers are available all over the country and there are three independentlong-distance operators. In Finland, the market share of the biggest domestic carrier is around

134
55%, very different from the other EU countries. Data transmission charges are lower in Finlandthan anywhere else in the world.
Computer infrastructureAbout 630 000 people of the work force of 2 million Finns use computers or computing servicesat work. There are 120 member companies at the Finnish Computing Services Association,accounting for about 80% of the total Finnish market for computing and professional services,software and hardware products. The total turnover of the member companies in 1993 was morethan FIM 7000 million, with a growth rate of 6,4%. The member companies employ about 8500persons. The value of microcomputer production in Finland in 1994 was about 4,5 billion FIM. Itis estimated that the growth rate in 1994 was 22%. The two biggest manufacturers account foralmost FIM 3,5 billion of the total turnover. At the end of 1993 about 21,5% of Finnishhouseholds had a microcomputer, at the end of 1994 as many as 26%. There are about 30micromputers per 100 inhabitants in the United States, in Finland and Sweden about 15microcomputers per 100 inhabitants.
National information policyA report commissioned and approved by the Ministry of Finance outlines a national strategy,Finland Towards the Information Society, and a position paper outlined by the Cabinet Office onrelevant measures was approved by the Government of Finland on 18 Janury. Informationtechnology is an essential competitive factor for products and production, and a networkedeconomy provides a real opportunity for Finland. The objective of the national strategy is to gainand maintain a competitive edge withing the world economy and to help solve domesticeconomic problems. Finland's information society strategy is based on three main elements: 1)renewal into an information society, 2) development of information industry and 3) assurance ofnecessary conditions, research, knowhow and development of IT infrastructure. The followingvision was created: a) Finland is an advanced information society based on networking, b)Finland is a world class competitor in the implementation of information and communicationstechnology. The role of government is to provide a favourable framework for building theinformation socity. The strategy outlines national guidelines and priority recommendations aswell as governmental activities.
Economic and political infrastructureFinland measures 38 000 sq km and has about 5 million inhabitants, with an average populationdensity of 16,6 per square kilometre. The Gross Domestic Product (GDP, in purchasers' values)of Finland in 1994 was FIM 511 600 million, with a growth rate of 3,9% compared to theprevious year. In 1995, the growth rate was predicted to be about 5%. From 1950 to 1993 theaverage annual growth rate of GDP has been 3,6%. Finland's national income in nominal termsgrew by 9,5% in 1994. National income per capita amounted to FIM 79 240. The inflation ratein 1994 remained exceptionally low, at 1,1%. The unemployment rate in relation to the totalwork force in Finland reached the top figures of 18,4% in 1994, with an average of 456 000people unemployed. It was predicted that he rate of unemployment in 1995 would be 16,5%,which still means an average of 400 000 Finns unemployed.
R&D expenditureIn 1994, Finland's exports amounted to 154 000 million FIM (32 000 million USD). During thepast 10 years Finland has shown a higher growth rate in exports of high-technology products thanany other country in Europe. Finnish high-tech exports amounted to 23 900 million FIM in 1994(5100 million USD), comprising telecommunications equipment, mobile phones, computers,measurement devices and pharmaceuticals. Finland's economy is growing a third "leg", that ofelectronics, in addition to a wooden and a metal leg. Finnish R&D expenditure has risen from

135
1.3% of GNP in 1983 to 2.2% in 1993. The share of high-tech exports has risen to 16% of thetotal exports of Finland, compared to a share of 4% in 1980.
Legal and regulatory issuesTelehallintokeskus (Telecommunications Administration Centre) is the central authority inFinland that supervises the application of telecommunications regulations. There is no centralauthority to supervise electronic mass media.
General regulations about personal data files and protection of personal data in Finland areincluded in the law about personal files (Act No. 471/87) and decree No. 476/87. In addition,special statues about registering personal data are included in many other laws and decrees invarious fields. Act No. 83/51 in Finland states the general principle of freedom of information asto public documents. Accordingly, everyone has the right to get information about the activitiesof public authorities, local or governmental. The act is also valid for documents on computerrecord that the authorities have at their disposal.
Copyright law (Act. No. 404/61) in Finland does not separately mention electronic databases.They are protected as performances of creative work by the copyright law or under separatecover for catalogues. Amendments to the Copyright Act (No. 34/91) also cover unauthorisedreproduction of a protected computer programme. Amendments of phase I of the total reform ofthe Penal Code of Finland entered into force on Jan 1, 1991, amendments of phase II on Sept. 1,1995. Computer fraud, computer forgery, datage to computer data or computer programmes andcomputer sabotage will all be included in the amendments of the various chapters of the PenalCode. The penalty provisions also cover unauthorised entry into and off-site use of aninformation system via a telecommunications link.

136
SOURCES
Chapter 2.6.2- Televiestintätilasto 1995 (Telecommunications statistics 1995). Helsinki: Liikenne-
ministeriö (Ministry of Communications) & Painatuskeskus Oy, 1995. 89 p.
- Televiestintätilasto 1994. Helsinki: Liikenneministeriö & Painatuskeskus Oy, 1994.
89 p.
- Nyström, Sirkku. 1994. Palvelunumerot löytäneet paikkansa. Kauppalehti 18.2.1994.
- Työryhmä miettii telepalvelujen haittoja. Helsingin Sanomat 21.12.1994, p. A11.
- Sextelefonerna är ingen affär för HTF. Hufvudstadsbladet 10.9.1994, p. 10.
- The editorial of the daily Kainuun Sanomat about audiotex services. Kainuun
Sanomat Aug. 9, 1994, p. 2.
Expert information:
- Mr. Jyri Hagman, Telecom Finland Oy, Telemedia, Premium rate services (telephone
discussion on Sept. 17, 1995).
- Mr. Harri Johannesdahl, Telecom Finland Oy, Telemedia (e-mail message on July 5,
1995).
Chapter 2.6.3- Internet statistics from TIEKE, Information Technology Development Center, Aug.
14, 1995. 3 p. (Based on information from Network Wizards, http://www.nw.com/)
- Seppänen, Jouko. 1995. Halvan liittymän saa yliopistolta. Tietoviikko 7.4.1995, p. 18.
- Tele tarjoaa uusia Internet-palveluja yrityksille. A press release of Telecom Finland at
the fair Tieto 95, Feb. 8 - 9, 1995.
- Niemi-Jaskari, Pauli. 1995. Sotkeudummeko verkkoihin. Julkaisu-uutiset (Painatus-
keskus) nro 4/1995, p. 5.
- Lahti, Jarmo. 1995. Kiihdytyskisa tiedon valtateille. Infolinja nro 3/1995, p. 4.
- Freenetin Hallikas koulujen verkottumisesta. Tietoviikko 13.4.1995, p. 26. (search
from MINTTU, database News, Aug. 24, 1995).
- Internetin kasvu ja säätely puhuttaa. Salon Seudun Sanomat 12.3.1995, p. 8. (search
from MINTTU, database News, Aug. 24, 1995).
- Internetin käyttö kasvanut. Tekniikka & Talous 13.10.1994, p. 17. (search from
MINTTU, database News, Aug. 24, 1995).
- EUnet on suosituin Internet-operaattori. Tekniikka & talous 26.10.1995, p. 5.
- Kaikki Suomen koulut kytketään Internetiin. Helsingin Sanomat 21.6.1995.
- Brochures about Freenet.

137
Chapter 2.6.4- Televiestintätilasto 1995 (Telecommunications statistics 1995). Helsinki: Liikenne-
ministeriö (Ministry of Communications) & Painatuskeskus Oy, 1995. 89 p.
- Televiestintätilasto 1994. Helsinki: Liikenneministeriö & Painatuskeskus Oy, 1994.
89 p.
Chapter 4.1- Kirjastokalenteri 1995 (Library calendar 1995). Helsinki: Kirjastopalvelu Oy, 1994.
227 p.
- Kunnankirjastot 1994 (Municipal libraries 1994). Kirjasto nro 5/1995, p. 167.
- Valtakunnallinen kirjastoautomaatiotilanne 1994 kunnallisissa kirjastoissa. Muistio
(Library automation in municipal libraries in 1994. PM.). Helsinki: Uudenmaan
lääninhallitus, Elinkeino- ja koulutuspalvelut, 1994. 16 p.
- Kirjastot 1993 (Libraries 1993). Helsinki: Kirjastopalvelu Oy, 1994. 112 p.
- Laaksovirta, Tuula H. & Haavisto, Tuula: Knowledge and life experiences. Finland
seen through its libraries and information services. Helsinki: the Finnish Library
Assocation & al., 1990. 36 p.
- Information, education, recreation - 200 years of public libraries in Finland. Helsinki:
the Finnish Library Association, 1994. Brochure.
- Finland, a pioneer in telematics applications. Helsinki: Technology Development
Centre (TEKES), 1995, 58 p.
- Tietohuollon kehittämisstrategia (National strategy for information provision).
Helsinki: Tietohuollon neuvottelukunta (Finnish Council for Information Provision),
1994. 36 p.
- Suomen tilastollinen vuosikirja 1994 (Statistical yearbook of Finland 1994). Helsinki:
Statistics Finland, 1994.
Chapter 4.2- Mediabisneksen volyymi ja kannattavuus nousussa (Volume and profitability of
media business increasing). Markkinointi & mainonta nro 12/1995, 25.8.1995.
- Oy Stockmann Ab, tilinpäätöstiedote 1994 (Financial statements 1994). Startel
Express RN 95326.
- Tiedonhaku YRTIKA-tietokannasta (search from database YRTIKA) 10.10.1995.
- Kirjojen tuotantotilasto 1994 (Production statistics of books 1994). Suomen Kustan-
nusyhdistys ry. (the Finnish Book Publishers’ Association), 1995. 12 p.
- Sauri, Tuomo. Joukkoviestinnän talous 1993. English summary: The Finnish Mass
Media Economy. 19 p. Helsinki: Tilastokeskus, 1994. (Tilastokeskus, Kulttuuri ja
viestintä 1994:4.)

138
- Joukkoviestintätilasto 1993 (Mass media statistics 1993). Helsinki: Tilastokeskus,
1993. 303 p. (Tilastokeskus, Kulttuuri ja viestintä 1993:8.)
- Sanomalehtien Liitto: Toimintakertomus 1994 (Finnish Newspaper Publishers'
Association, Annual Report 1994). 46 p.
- Suomen Lehdistö - Finlands Press, nro 6-7/1995. 114 p.
- Alkio, Jyrki: Lukemista asiakkaiden makuun (Readings to the customers). Helsingin
Sanomat 12.4.1995, p. C6.
- Mediakenttä perataan uusiksi (Media field renewed). Kauppalehti 2.5.1995.
- Finnish WWW magazines. E-mail message from Ms. Anneli Heimbürger, Lic.Tech.,
Senior Research Scientist, VTT Information Service, from March 14, 1995.
Expert information:
- Telephone discussion with Mr. Tuomo Sauri, Statistics Finland, on Sept. 6, 1995.
- Discussion with Ms. Anneli Heimbürger, Lic.Tech., Senior Research Scientist, VTT
Information Service, on Jan. 4, 1995.
Chapter 4.3- Brochures and leaflets of the associations concerned
- Suomen informaatio- ja tietoalojen julkilausuma. Resolution of the Finnish
information and knowledge sectors. Helsinki: Tietopalveluseura (Finnish Society for
Information Services), 1994. 50 p.
Chapters 4.4 and 4.5- Expert information from Ms. Anneli Heimbürger, Lic.Tech., Senior Research
Scientist at VTT Information Service, on Aug. 4, 1995.
- ICCP Reviews of Information and Communications Policies: Finland. Paris: OECD,
1992.
Chapter 5.1- Televiestintätilasto 1995 (Telecommunications statistics 1994). Helsinki: Liikenne-
ministeriö (Ministry of Communications) & Painatuskeskus Oy, 1995. 89 p.
- Televiestintätilasto 1994 (Telecommunications statistics 1994). Helsinki: Liikenne-
ministeriö (Ministry of Communications) & Painatuskeskus Oy, 1994. 89 p.
- Suomen tilastollinen vuosikirja 1994. Statistical Yearbook of Finland 1994. Helsinki:
Tilastokeskus (Statistics Finland), 1994. 648 p.
- Suomen tilastollinen vuosikirja 1995. Statistical Yearbook of Finland 1995. Helsinki:
Tilastokeskus (Statistics Finland), 1995. 653 p.
- Liikennetilastollinen vuosikirja 1994. Transport and Communications Statistical
Yearbook for Finland 1994. Helsinki: Tilastokeskus (Statistics Finland), 1994. 142 p.

139
- Yksityinen tietoliikenne koottiin Finnet-yhtiöiksi (Private telecommunications
companies form the Finnet Group). Kauppalehti 18.8.1995, p. 10.
- EU on vuosikymmenen jäljessä. Yrityspuhelin (HPY) nro 2/95, pp. 6 - 7.
- Finland, a pioneer in telematics applications. Helsinki, Technology Development
Centre (TEKES) & Technical Research Centre of Finland (VTT), 1995. 58 p.
Chapter 5.2- Sokala, Hannu. Neljännes kotitalouksista omistaa mikrotietokoneen (A quarter of the
households owns a microcomputer). Helsingin Sanomat 15.3.1995.
- Pietiläinen, Tuomo. Multimediasta haetaan pelastajaa kovan kilpailun mikromarkki-
noille. Helsingin Sanomat 27.6.1995, p. A16.
- Yhä useampi mikro on Suomessa tehty. Tietoviikko 7.4.1995.
- Mikrolog uskoo reiluun myynnin kasvuun. Tekniikka ja talous 2.3.1995.
- Kotimarkkinat kasvaa ratkaisijan mittoihin. Tietoviikko 12.5.1995.
- Tietojenkäsittelypalvelut 1994-1995 (Computing services 1994-1995). Helsinki:
Tietojenkäsittelyn Palveluyritysten Liitto, 1994. 72 p.
- Yritysrekisterin tilastotietoja. Telekopio Tilastokeskuksesta 5.10.1995.
- Tuotanto voi nousta 80 miljardiin vuonna 2000. Kauppalehti 22.3.1995.
Chapters 6.1 and 6.2- Finland in brief. 1995. (Bank of Finland) Bulletin, No. 2, p. 16 - 17.
- Suomen tilastollinen vuosikirja 1995. Statistical Yearbook of Finland 1995. Helsinki:
Tilastokeskus (Statistics Finland), 1995. 653 p.
- Tilastokeskus (Statistics Finland), tiedotus, 1995. Rapid growth in output last year.
2 p. (Tilastouutisia 1995:15.)
- Tilastokeskus. 1995. Kansantalouden tilinpidon ennakkotietoja 1994. 12 p. (Kansan-
talous 1995:2.)
- Valtiovarainministeriön kansantalousosasto (Ministry of Finance, Economics Dept.).
1995. Suhdannekatsaus 1/1995. 6 p.
- Valtiovarainministeriö, tiedotus. 1995. Valtiontalouden näkymät vuosina 1995 - 1999.
3 p.
- Ministry of Finance, Economics Dept. 1994. Economic bulletin, Nov. 25, 1995. 7 p.
- Pöysä, Jorma. 1995. Talouskehitys jatkuu kohtuullisen hyvänä. Kauppalehti,
11.5.1995.

140
Chapter 6.3- Mäkinen, Ilkka. 1989. Puoli metriä mietintöjä: tieteellisten kirjastojen
informaatiopalvelujen suunnittelun kehitys Suomessa toisen maailmansodan jälkeen.
Tampere: Tampereen yliopisto, 1989. 181 p. (Tampereen yliopiston kirjastotieteen ja
informatiikan laitoksen tutkimuksia 31.)
- Extracts from the Programme of the Government of Prime Minister Paavo Lipponen.
April 13, 1995.
- Suomi tietoyhteiskuntaan - kansalliset linjaukset (Finland towards the Information
Society). Valtiovarainministeriö (Ministry of Finance), 1995. TIKAS-hankkeen
loppuraportin ja sen luovutuskirjeen tekstiä Painatuskeskuksen WWW-sivuilta (text
from the WWW pages of Painatuskeskus). 21 p.
- Finland's Way to the Information Society. Abstract of the National Information
Strategy, received by e-mail from the Ministry of Finance. June, 1995. 12 p.
Chapter 6.4- Finland: where nature and technology meet. Views on Technology 1995, p. 4.
- Rapid growth. Views on Technology 1995, p. 5.
- Finland, a pioneer in telematics. Helsinki: Technology Development Centre (TEKES),
1995. 58 p.
Chapter 6.5Expert information:
- Ms. Leena Vettenranta, Ministry of Justice, dept. of legislation: answers to legal
questions, received by fax on June 29, 1995 (central authorities, freedom of
information)
- Mr. Ilkka Rautio, Ministry of Justice, dept. of legislation: extracts from the Answer to
the Council of Europe questionnaire on the implementation of recommendation No.
R (89) 9 on computer-related crime, from March 9, 1995 (questions on computer
crime)
- Mr. Jukka Liedes, Ministry of Education, by fax on Aug. 14, 1995 (questions on
copyright)
Chapter 7.1- Palosuo, Eeva. Being a database host in a rare language area. In: Information,
knowledge, evolution. Proceedings of the 44th FID Congress, Helsinki, Finland, 28
Aug. - 1 Sept. 1988. Amsterdam, Elsevier Science Publishers, 1988, p. 351 - 456.

141
- Telephone discussion with Ms. Eeva Palosuo, VTKK Information Service Ltd.
(nowadays TT-Information Service Ltd.) on Oct. 23, 1995.
Chapter 7.2- Siltala, Tiina. 1995. Mikael Böök katsoo verkkoja filosofin silmin. Internet murtaa
julkisuuden rakenteita (Internet changes the society's structures). Tietoviikko nro 13,
7.4.1995.
- Informaatio-osuuskunta Katto-Meny: Kansalaisyhteiskunnan konsultti. WWW pages
of information cooperative Katto-Meny.
Chapter 7.3- Siivonen, Timo & Antikainen, Hannele. 1995. Viestinnän visiot (Visions of com-
munications). Espoo: Valtion teknillinen tutkimuskeskus, Graafinen tekniikka, 1995.
39 p. (GT-raportti nro 1, tammikuu 1995.)
Chapter 8.1Eskola, Pirkko & Lehti, Merja. 1990. Suorakäyttöisten tiedonhakujärjestelmien käyttö
Suomessa 1989 (The use of online services in Finland in 1989). Espoo: Valtion teknilli-
nen tutkimuskeskus, 1990. 52 p. + app. 30 p. (Valtion teknillinen tutkimuskeskus, Tie-
dotteita - Statens tekniska forskningscentral, Meddelanden - Technical Research Centre
of Finland, Research Notes 1169.)

ANNEX 1
SUPPLY: QUESTIONNAIRE ABOUT THE SUPPLY OFELECTRONIC INFORMATION SERVICES FORPROFESSIONAL PURPOSES IN FINLAND IN 1994

A Study for the Commission of the European Union
The Supply of Electronic Information Services for Professional Purposes inFinland in 1994
Strictly Confidential___________________________________________________________________________
This survey is carried out with the Support of the European Commission. Similar studies willbe carried out in the whole European Economic Area.
Reference Period: 1st January 1994 - 31st December 1994
This questionnaire has been developed for suppliers.
Please answer all the questions as fully as possible. Definitions to this survey are given on theback page of the questionnaire. For further assistance please contact us.
Note: Please give all money figures in national currency, FIM (net of any sales or turnovertax, where applicable) for the reference period.
Please return this questionnaire when completed to
Contact Person: Merja Lehti
Institute: VTT Tietopalvelu
Address: PL 200002044 VTT
Telephone: (90) 456 4382
Fax: (90) 456 4374
Palautus 20.5.1995 mennessä.
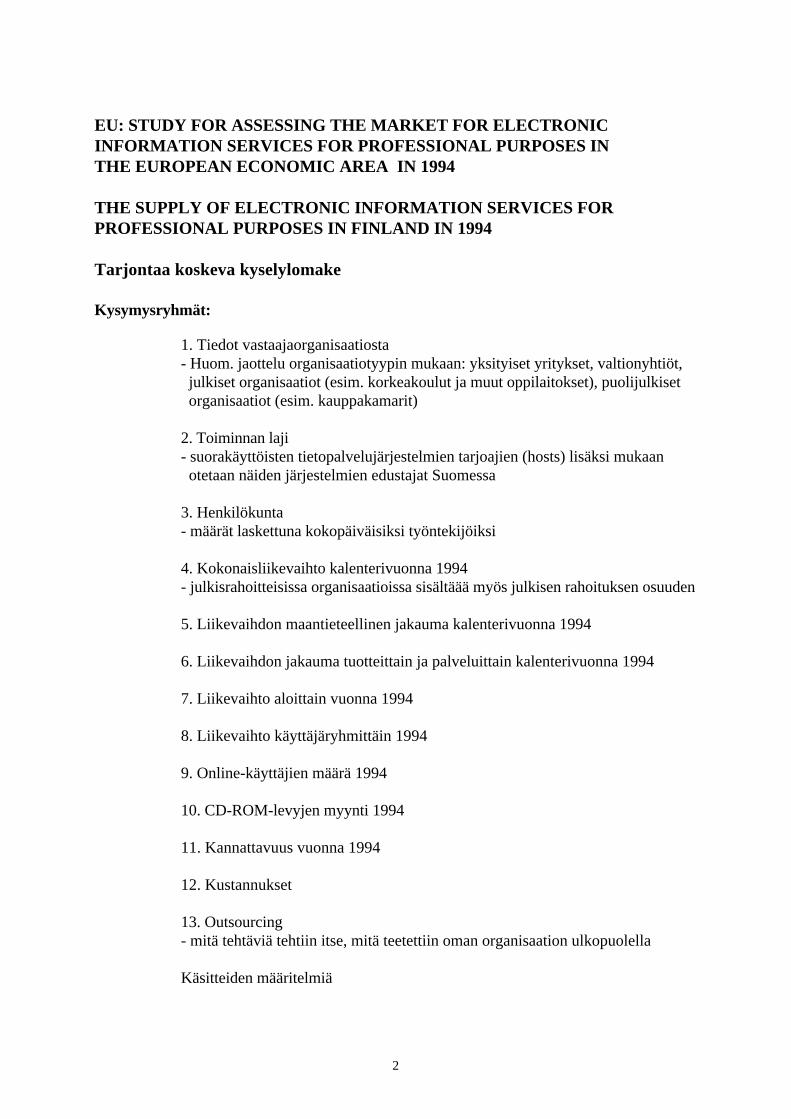
2
EU: STUDY FOR ASSESSING THE MARKET FOR ELECTRONICINFORMATION SERVICES FOR PROFESSIONAL PURPOSES INTHE EUROPEAN ECONOMIC AREA IN 1994
THE SUPPLY OF ELECTRONIC INFORMATION SERVICES FORPROFESSIONAL PURPOSES IN FINLAND IN 1994
Tarjontaa koskeva kyselylomake
Kysymysryhmät:
1. Tiedot vastaajaorganisaatiosta- Huom. jaottelu organisaatiotyypin mukaan: yksityiset yritykset, valtionyhtiöt, julkiset organisaatiot (esim. korkeakoulut ja muut oppilaitokset), puolijulkiset organisaatiot (esim. kauppakamarit)
2. Toiminnan laji- suorakäyttöisten tietopalvelujärjestelmien tarjoajien (hosts) lisäksi mukaan otetaan näiden järjestelmien edustajat Suomessa
3. Henkilökunta- määrät laskettuna kokopäiväisiksi työntekijöiksi
4. Kokonaisliikevaihto kalenterivuonna 1994- julkisrahoitteisissa organisaatioissa sisältäää myös julkisen rahoituksen osuuden
5. Liikevaihdon maantieteellinen jakauma kalenterivuonna 1994
6. Liikevaihdon jakauma tuotteittain ja palveluittain kalenterivuonna 1994
7. Liikevaihto aloittain vuonna 1994
8. Liikevaihto käyttäjäryhmittäin 1994
9. Online-käyttäjien määrä 1994
10. CD-ROM-levyjen myynti 1994
11. Kannattavuus vuonna 1994
12. Kustannukset
13. Outsourcing- mitä tehtäviä tehtiin itse, mitä teetettiin oman organisaation ulkopuolella
Käsitteiden määritelmiä

3
The Questionnaire
1. Details of Organisation (Status 1994)
Name of your organisation:
......................................................................................................................................
Principal activity of the organisation:
......................................................................................................................................
Contact person:
......................................................................................................................................
Address:
......................................................................................................................................
......................................................................................................................................
Telephone:......................................................................................................................................
Fax number:
......................................................................................................................................
E-Mail address:
......................................................................................................................................
Name of parent organisation:
......................................................................................................................................
Names of subsidiaries or branches included in the answers to this questionnaire:
......................................................................................................................................
......................................................................................................................................
Legal status of your organisation:
( ) private company (yksityinen yritys( ) public company (valtionyhtiö)( ) public institution (julkishallinnon organisaatio, esim. korkeakoulu)( ) semi-public institution (esim. kauppakamari)

4
2. Types of Activity
2.1 Please indicate in which of the following categories you would classify your organisation (for guidance, definitions are given on the back page of this questionnaire). Tick as many boxes as apply.
( ) Database Producers
Online Distributors( ) Retrospective online database services( ) Real-time information services/hosts: financial information( ) Real-time information services/hosts: other information, especially political and general
news( ) Videotex services suppliers( ) Audiotex services suppliers( ) Electronic-Mail (E-Mail) services suppliers( ) Information services delivered via the Internet( ) Other online services - please specify
...................................................................................................................................
...................................................................................................................................
Offline Distributors( ) CD-ROM distributors( ) Distributors of other offline services - please specify:
...................................................................................................................................
...................................................................................................................................
( ) Other Information Services - please specify:......................................................................................................................................................................................................................................................................
Definitions: see back page of the questionnaire
3. Staff
Number of staff employed in the calendar year 1994 (full-time equivalents) in the followingcategories
Absolute figures
................. 3.1 Total (including departments that are not related toelectronic information services, e.g. print products)
................. 3.2 Staff in the departments related to electronic informationservices

5
3.3 Staff by FunctionsPlease break down the staff related to electronic information servicesaccording to the following functions:
In %................. Management / administration................. Sales / marketing................. Data gathering / editorial................. Technical................. Other - please specify:
.......................................................................................................................100 % Total=========
4. Total Income in the Calendar year 1994 (kokonaisliikevaihto)(ks. selitystä lomakkeen sivulla 2)
FIM................. 4.1 Your total income in all countries of the world
In %................. 4.2 What was your growth rate in total income
between 1993 / 1994?
4.3 Please break down your total income according to the following categories
FIM................. Market income (revenues / turnover)................. Public subsidies................. Other income
Please specify: .....................................................................................
In %................. 4.4 What was your growth rate in market income
(revenues) between 1993 and 1994
5. Market Income (Revenues) by Geographic Distribution (1994)
Please break down your market income (revenues) accordingto the following categories:
In %................. In your country................. Other countries of the European Economic Area (EU and EFTA)................. North America................. Rest of the world.................100 % Total=========

6
6. Market Income (Revenues) by Types of Services and Products (1994)
Please break down your market income (revenues) according to the following categories:
6.1 Electronic and Non-Electronic Services (Print Media)
In %................. Electronic information services for professional purposes................. Printed products
.................100 % Total=========
6.2 Electronic Information Services
Here: Total of all electronic information services = 100 %. If exact figures are not available, please giveestimates.
In %................. Database production................. Retrospective online database services................. Real-time information services/hosts (including financial,
political and general news)................. Videotex services................. Audiotex services................. Electronic-Mail (E-Mail) services................. Fax-based information services................. Further online services - please specify:
.....................................................................................
...................................................................................................... CD-ROM................. Further optical information media................. Magnetic information media (discs, tapes, etc.)................. Document delivery (e.g. SDI services, full-text in printed
or electronic form)................. Information broking, consultancy................. Training, seminars................. Hardware and software relating to electronic information
services - please specify:.....................................................................................
.................100 % Total=========
Definitions: see back page of the questionnaire.
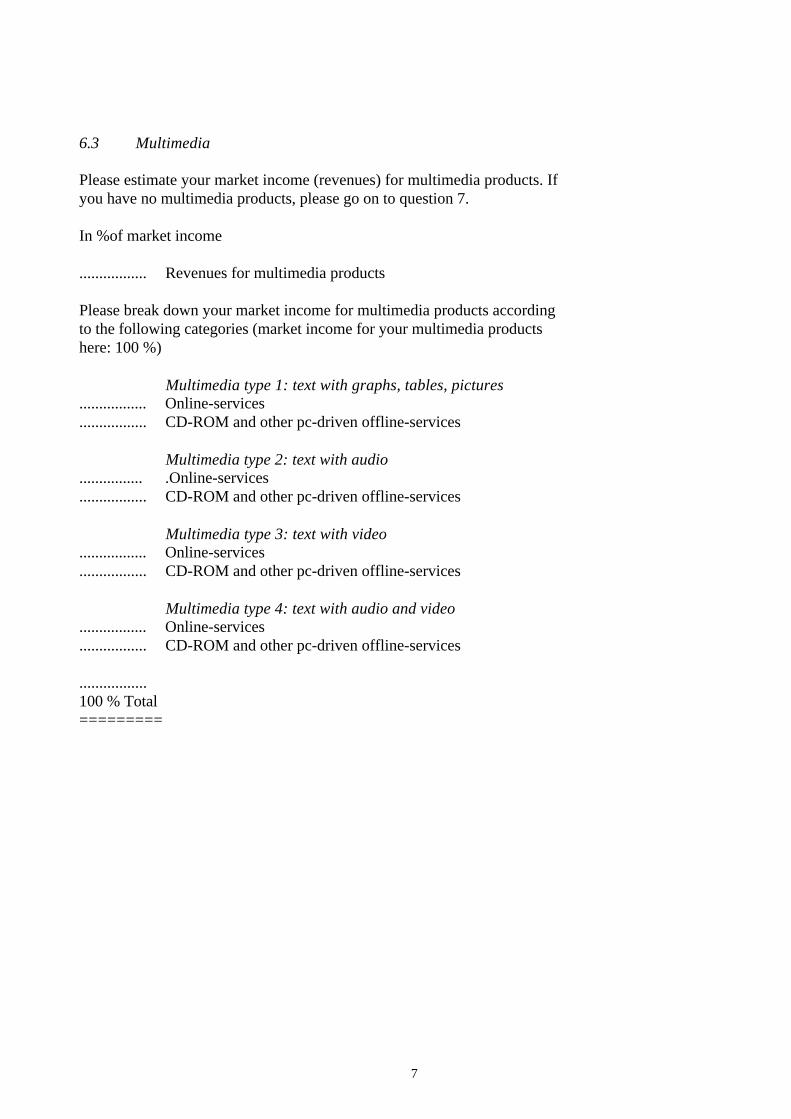
7
6.3 Multimedia
Please estimate your market income (revenues) for multimedia products. Ifyou have no multimedia products, please go on to question 7.
In %of market income
................. Revenues for multimedia products
Please break down your market income for multimedia products accordingto the following categories (market income for your multimedia productshere: 100 %)
Multimedia type 1: text with graphs, tables, pictures................. Online-services................. CD-ROM and other pc-driven offline-services
Multimedia type 2: text with audio................ .Online-services................. CD-ROM and other pc-driven offline-services
Multimedia type 3: text with video................. Online-services................. CD-ROM and other pc-driven offline-services
Multimedia type 4: text with audio and video................. Online-services................. CD-ROM and other pc-driven offline-services
.................100 % Total=========

8
7. Market Income (Revenues) by Subject Area (1994)
Please break down your market income (revenues) according to the following categories:
In %................. Finance / stock exchange / banking................. Company profiles and credit ratings................. Further business and economic information................. Legal information................. Patent information................. Scientific / technical / medical information................. Government information / political news................. Travel information................. Other information - please specify:
.....................................................................................
......................................................................................................
100 % Total=========
Definitions: see back page of the questionnaire.
8. Market Income (Revenues) by User Groups (1994)
Please break down your total revenues according to the following categories:
In %................. Most important user group - please specify: ...................................................... Second most important user group - please specify: ........................................... Third most important user group - please specify:
............................................................................................. Fourth most important user group - please specify: ........................................... Rest - if possible, please specify:
................................................................................................
................................................................................................
................................................................................................
.................100 % Total=========

9
9. Number of online-users (1994) *
Please estimate the number of users in the following categories:
Absolutefigures
................. Retrospective online database services
................. Real-time information services/hosts(including financial, political and general news)
................. Videotex services
................. Audiotex services
................. Further online services - please specify:........................................................................................................................................
* Note: Users of real-time should be taken to mean user terminals. Users ofother online services should be taken to mean active passwords (at least once a year in 1994).
If you charge your customers by any other volume criteria, please specify:......................................................................................................
10. Sales of CD-ROMs (1994)
Please provide estimates of CD-ROM sales as follows:
Absolutefigures................. Number of titles sold................. Number of units sold
If possible, break down your number of units sold in
................. Stand alone CD-ROMs
................. CD-ROMs for network use

10
11. Profitability (1994)
11.1 Were your activities in the electronic information service sector profitable in 1994?(profitable = at least total recovery of costs)
YES NO( ) ( ) In terms of operating costs only( ) ( ) In terms of full costs
11.2 If not, when do you except these activities to cover:
1995 1996 1997 Later or never( ) ( ) ( ) ( ) Your operating
costs( ) ( ) ( ) ( ) Your full costs
12. Costs
12.1 Total Costs
FIM................. Your total costs in 1994
12.2 Breakdown by Types of Costs (1994)Please break down your total costs in 1994 accordingto the following categories
In %................. Staff costs................. Investment expenditures - please specify
..................................................................................... Other costs
.................100 % Total=========
12.3 Breakdown of Costs by Types of Activity
................. Data gathering / processing / editorial
................. Technical operations
................. Sales / marketing
................. User service, training
................. Other costs - please specify........................................................................................................................................
.................100 % Total=========

11
13. Outsourcing (1994)
Which tasks did you carry out yourself and which were outsourced?
Internal External Both( ) ( ) ( ) Data gathering / processing /
editorial( ) ( ) ( ) Software development and
maintenance( ) ( ) ( ) Technical operations (e.g. host
service)( ) ( ) ( ) Public relations( ) ( ) ( ) Marketing( ) ( ) ( ) Further activities - please
specify:.......................................................................................................................................................................................................
--------------------------------------------------------------------------------------------------------------------
Kiitos yhteistyöstä!
Palauta lomake 20.5.1995 mennessä ensimmäisellä sivulla mainittuun osoitteeseen.

12
ANNEX 2
DEMAND: QUESTIONNAIRE ABOUT THE USE OF ELECTRONICINFORMATION SERVICES FOR PROFESSIONAL PURPOSES INFINLAND IN 1994, WITH COVER NOTES FOR THE TARGETGROUPS

13
Arvoisa vastaanottaja!
KANSAINVÄLINEN KYSELY: ELEKTRONISTEN TIETOPALVELUJEN MARKKINAT EUROOPANTALOUSALUEEN MAISSA VUONNA 1994
Kohde, tarkoitus
EU:n IMPACT 2 -ohjelmassa on tämän vuoden alussa käynnistetty kansainvälinen selvitys elektronistentietopalvelujen markkinoista ammatillisiin tarkoituksiin vuonna 1994 (Studyfor assessing the situationof the markets for electronic information services for professional purposes in the member states of theEuropean Economic Area).
Selvitys koskee elektronisten tietopalvelujen tarjontaa ja kysyntää sekä alaan liittyvää infrastruktuuria, jase tehdään yhtenäisin menetelmin viidessätoista Euroopan talousalueen maassa. Tarkoituksena on saadamakrotason kuva Euroopan tilanteesta (markkinoiden koko ja rakenne, alan vahvuudet ja heikkoudetyleiseurooppalaisella tasolla) vertailujen ja strategisten johtopäätösten tekemiseksi elektronistentietopalvelujen kehittämiseksi edel-leen. - EU:n komissio julkaisee työstä yhteiseurooppalaisen raportinvuoden 1995 lopussa.
Suomi
VTT Tietopalvelu on aikaisemmin useaan otteeseen selvittänyt Tieteellisen informoinnin neuvoston eliTINFOn (nykyinen tietohuollon neuvottelukunta) toimeksiannosta suora-käyttöistentiedonhakujärjestelmien käyttöä Suomessa (viimeksi vuonna 1985 ja 1989, VTT Tiedotteita 673 ja 1169).VTT Tietopalvelu kansallisena IMPACT-neuvontakeskuksena on valittu selvityksen tekijäksi Suomessa.- IMPACT 2 -ohjelman kansalliset neuvon-takeskukset toimivat Euroopan eri maissa ja niiden tehtävänäon edistää elektronisten tietopalvelujen käyttöä levittämällä asiaa koskevaa tietoa omassa maassaan.
Saatte kirjeen liitteenä kyselylomakkeen. Toivomme myönteistä suhtautumistanne kyselyyn.Osallistumisenne on tärkeää kokonaiskuvan saamiseksi Suomen ja edelleen kokoEuroopan tietopalvelujen markkinoista. Vastaustiedot käsitelllään luottamuksellisesti.
Palautus ja lisätiedot
Kysely pyydetään palauttamaan 15.6.1995 mennessä VTT Tietopalvelun osoitteeseen.Lisätietoja antaa Merja Lehti, VTT Tietopalvelu, puh. (90) 456 4382, telekopio (90) 456 4374,sähköposti (Internet): [email protected]
Tervetuloa mukaan kansainväliseen selvitykseen!
VTT Tietopalvelu
Merja Lehti, ekon., informaatikko
Liite Käyttöä koskeva kyselylomake
Jakelu Tietokonsultit (information brokers, intermediaries)

14
Study for the Commission of the European Union
The Use of Electronic Information Services for Professional Purposesin Finland
Strictly Confidential__________________________________________________________________________
This survey is carried out by VTT Information Service with the Support of the European Commission.Similar studies will be carried out in all the Member States of the European Union.
Reference Period: 1st January 1994 - 31st December 1994
This questionnaire has been developed for information brokers or external informationprofessionals / intermediaries offering information services for professional purposes for anycustomer.
Please answer all the questions as fully as possible. Definitions to this survey are given on the back pageof the questionnaire. For further assistance please contact VTT Information Service. .Note: Please give all money figures in your national currency, FIM (net of any sales or turnover tax,where applicable) for the reference period.
___________________________________________________________________________
Please return this questionnaire when completed to
Contact Person Merja Lehti
Company VTT Tietopalvelu
Address PL 2000
02044 VTT
Telephone (90) 456 4382Fax (90) 456 4374
Palautus 15.6.1995 mennessä.

15
Arvoisa vastaanottaja!
KANSAINVÄLINEN KYSELY: ELEKTRONISTEN TIETOPALVELUJEN MARKKINAT EUROOPANTALOUSALUEEN MAISSA VUONNA 1994
Kohde, tarkoitus
EU:n IMPACT 2 -ohjelmassa on tämän vuoden alussa käynnistetty kansainvälinen selvitys elektronistentietopalvelujen markkinoista ammatillisiin tarkoituksiin vuonna 1994 (Study for assessing the situationof the markets for electronic information services for professional purposes in the member states of theEuropean Economic Area).
Selvitys koskee elektronisten tietopalvelujen tarjontaa ja kysyntää sekä alaan liittyvää infrastruktuuria, jase tehdään yhtenäisin menetelmin viidessätoista Euroopan talousalueen maassa. Tarkoituksena on saadamakrotason kuva Euroopan tilanteesta (markkinoiden koko ja rakenne, alan vahvuudet ja heikkoudetyleiseurooppalaisella tasolla) vertailujen ja strategisten johtopäätösten tekemiseksi elektronistentietopalvelujen kehittämiseksi edel-leen. - EU:n komissio julkaisee työstä yhteiseurooppalaisen raportin vuoden 1995 lopussa.
Suomi
VTT Tietopalvelu on aikaisemmin useaan otteeseen selvittänyt Tieteellisen informoinnin neuvoston eliTINFOn (nykyinen tietohuollon neuvottelukunta) toimeksiannosta suorakäyttöistentiedonhakujärjestelmien käyttöä Suomessa (viimeksi vuonna 1985 ja 1989, VTT Tiedotteita 673 ja 1169).VTT Tietopalvelu kansallisena IMPACT-neuvontakeskuksena on valittu selvityksen tekijäksi Suomessa.- IMPACT 2 -ohjelman kansalliset neuvon-takeskukset toimivat Euroopan eri maissa ja niiden tehtävänäon edistää elektronisten tietopalvelujen käyttöä levittämällä asiaa koskevaa tietoa omassa maassaan.
Saatte kirjeen liitteenä kyselylomakkeen. Toivomme myönteistä suhtautumistanne kyse- lyyn.Osallistumisenne on tärkeää kokonaiskuvan saamiseksi Suomen ja edelleen koko Euroopantietopalvelujen markkinoista. Vastaustiedot käsitelllään luottamuksellisesti.
Palautus ja lisätiedot
Kysely pyydetään palauttamaan 15.6.1995 mennessä VTT Tietopalvelun osoitteeseen.Lisätietoja antaa Merja Lehti, VTT Tietopalvelu, puh. (90) 456 4382, telekopio(90) 456 4374, sähköposti (Internet): [email protected]
Tervetuloa mukaan kansainväliseen selvitykseen!
VTT Tietopalvelu
Merja Lehti, ekon., informaatikko
Liite Käyttöä koskeva kyselylomake
Jakelu Kemian ja lääketieteen alan yritykset, joilla on tietopalvelu

16
Study for the Commission of the European Union
The Use of Electronic Information Services for Professional Purposes inFinland
Strictly Confidential__________________________________________________________________________
This survey is carried out by VTT Information Service with the Support of the European Commission. Similarstudies will be carried out in all the Member States of the European Union.
Reference Period: 1st January 1994 - 31st December 1994
This questionnaire has been developed for information professionals / intermediaries working in chemicalor pharmaceutical industry and offering information services for professional purposes for any customer.
Please answer all the questions as fully as possible. Definitions to this survey are given on the back page of thequestionnaire. For further assistance please contact VTT Information Service. .Note: Please give all money figures in your national currency, FIM (net of any sales or turnover tax, whereapplicable) for the reference period.
Huom. Tiedot pyydetään keräämään myös tytäryhtiöiltä tms., jos niillä on kyselyyn kuuluvaa palvelua.Lomaketta voi monistaa tähän tarkoitukseen.
___________________________________________________________________________
Please return this questionnaire when completed to
Contact Person Merja Lehti
Company VTT Tietopalvelu
Address PL 2000
02044 VTT
Telephone (90) 456 4382Fax (90) 456 4374
Palautus 15.6.1995 mennessä.

17
Arvoisa vastaanottaja!
KANSAINVÄLINEN KYSELY: ELEKTRONISTEN TIETOPALVELUJEN MARKKINAT EUROOPANTALOUSALUEEN MAISSA VUONNA 1994
Kohde, tarkoitus
EU:n IMPACT 2 -ohjelmassa on tämän vuoden alussa käynnistetty kansainvälinen selvitys elektronistentietopalvelujen markkinoista ammatillisiin tarkoituksiin vuonna 1994 (Study for assessing the situation of themarkets for electronic information services for professional purposes in the member states of the EuropeanEconomic Area).
Selvitys koskee elektronisten tietopalvelujen tarjontaa ja kysyntää sekä alaan liittyvää infrastruktuuria, ja setehdään yhtenäisin menetelmin viidessätoista Euroopan talousalueen maassa. Tarkoituksena on saadamakrotason kuva Euroopan tilanteesta (markkinoiden koko ja rakenne, alan vahvuudet ja heikkoudetyleiseurooppalaisella tasolla) vertailujen ja strategisten johtopäätösten tekemiseksi elektronisten tietopalvelujenkehittämiseksi edelleen. - EU:n komissio julkaisee työstä yhteiseurooppalaisen raportin vuoden 1995 lopussa.
Suomi
VTT Tietopalvelu on aikaisemmin useaan otteeseen selvittänyt Tieteellisen informoinnin neuvoston eli TINFOn(nykyinen tietohuollon neuvottelukunta) toimeksiannosta suorakäyttöisten tiedonhakujärjestelmien käyttöäSuomessa (viimeksi vuonna 1985 ja 1989, VTT Tiedotteita 673 ja 1169). VTT Tietopalvelu kansallisenaIMPACT-neuvontakeskuksena on valittu selvityksen tekijäksi Suomessa. - IMPACT 2 -ohjelman kansallisetneuvontakeskukset toimivat Euroopan eri maissa ja niiden tehtävänä on edistää elektronisten tietopalvelujenkäyttöä levittämällä asiaa koskevaa tietoa omassa maassaan.
Saatte kirjeen liitteenä kyselylomakkeen. Toivomme myönteistä suhtautumistanne kyselyyn. Osallistumisenneon tärkeää kokonaiskuvan saamiseksi Suomen ja edelleen koko Euroopan tietopalvelujen markkinoista.Vastaustiedot käsitelllään luottamuksellisesti.
Palautus ja lisätiedot
Kysely pyydetään palauttamaan 15.6.1995 mennessä VTT Tietopalvelun osoitteeseen.Lisätietoja antaa Merja Lehti, VTT Tietopalvelu, puh. (90) 456 4382, telekopio(90) 456 4374, sähköposti (Internet): [email protected]
Tervetuloa mukaan kansainväliseen selvitykseen!
VTT Tietopalvelu
Merja Lehti, ekon., informaatikko
Liite Käyttöä koskeva kyselylomakeJakelu Tieteelliset kirjastot (yhteistilastoon osallistuvat)
Yleiset kirjastot: maakuntakirjastot sekä WWW-kirjastot
Error! Bookmark not defined.Error! Bookmark not defined.Error! Bookmark not defined.Error! Bookmark not defined.
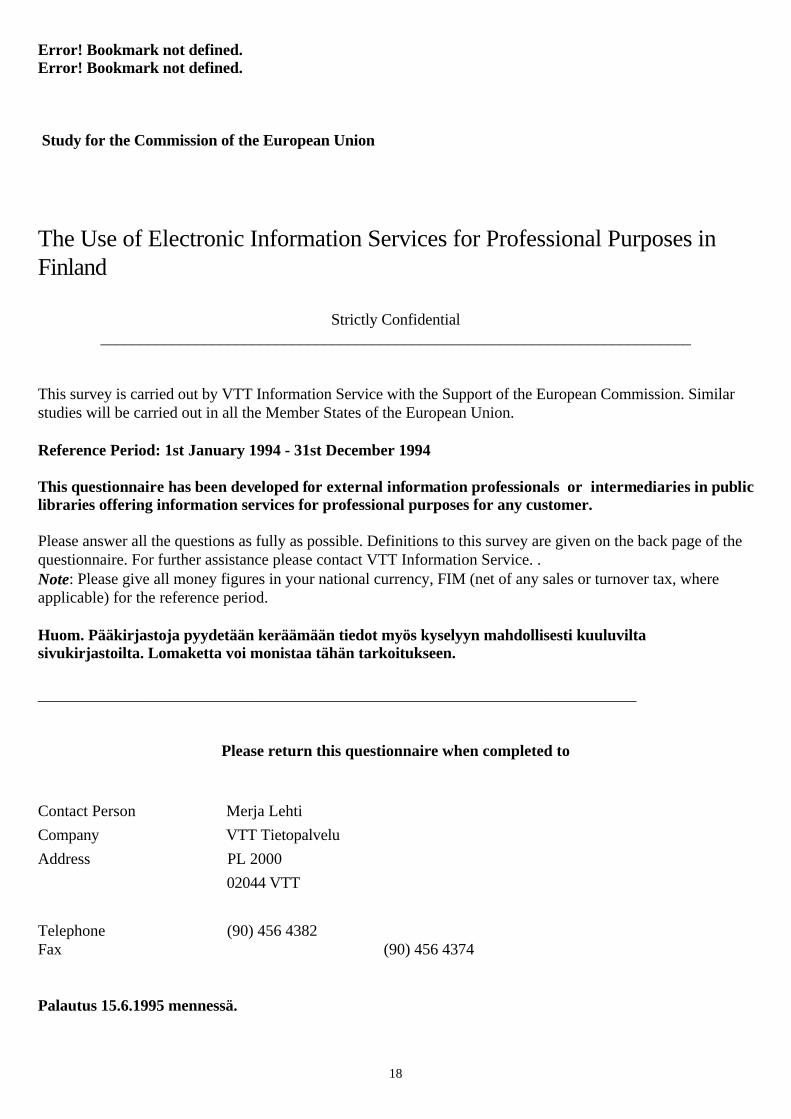
18
Error! Bookmark not defined.Error! Bookmark not defined.
Study for the Commission of the European Union
The Use of Electronic Information Services for Professional Purposes inFinland
Strictly Confidential__________________________________________________________________________
This survey is carried out by VTT Information Service with the Support of the European Commission. Similarstudies will be carried out in all the Member States of the European Union.
Reference Period: 1st January 1994 - 31st December 1994
This questionnaire has been developed for external information professionals or intermediaries in publiclibraries offering information services for professional purposes for any customer.
Please answer all the questions as fully as possible. Definitions to this survey are given on the back page of thequestionnaire. For further assistance please contact VTT Information Service. .Note: Please give all money figures in your national currency, FIM (net of any sales or turnover tax, whereapplicable) for the reference period.
Huom. Pääkirjastoja pyydetään keräämään tiedot myös kyselyyn mahdollisesti kuuluviltasivukirjastoilta. Lomaketta voi monistaa tähän tarkoitukseen.
___________________________________________________________________________
Please return this questionnaire when completed to
Contact Person Merja Lehti
Company VTT Tietopalvelu
Address PL 2000
02044 VTT
Telephone (90) 456 4382Fax (90) 456 4374
Palautus 15.6.1995 mennessä.

19
Study for the Commission of the European Union
The Use of Electronic Information Services for Professional Purposes inFinland
Strictly Confidential__________________________________________________________________________
This survey is carried out by VTT Information Service with the Support of the European Commission. Similarstudies will be carried out in all the Member States of the European Union.
Reference Period: 1st January 1994 - 31st December 1994
This questionnaire has been developed for external information professionals or intermediaries inscientific libraries offering information services for professional purposes for any customer.
Please answer all the questions as fully as possible. Definitions to this survey are given on the back page of thequestionnaire. For further assistance please contact VTT Information Service. .Note: Please give all money figures in your national currency, FIM (net of any sales or turnover tax, whereapplicable) for the reference period.
Huom. Yliopistojen ja korkeakoulujen pääkirjastoja pyydetään keräämään tiedot myös kyselyynmahdollisesti kuuluvilta osasto- ja laitoskirjastoilta. Lomaketta voi monistaa tähän tarkoitukseen._______________________________________________________________________
Please return this questionnaire when completed to
Contact Person Merja Lehti
Company VTT Tietopalvelu
Address PL 2000
02044 VTT
Telephone (90) 456 4382Fax (90) 456 4374
Palautus 15.6.1995 mennessä.

20
EU: STUDY FOR ASSESSING THE SITUATION OF THE MARKETS FOR ELECTRONICINFORMATION SERVICES FOR PROFESSIONAL PURPOSESIN THE EUROPEAN ECONOMIC AREA IN 1994
THE USE OF ELECTRONIC INFORMATION SERVICES FOR PROFESSIONAL PURPOSES INFINLAND IN 1994 / ELEKTRONISTEN TIETOPALVELUJEN KÄYTTÖ AMMATILLISIINTARKOITUKSIIN SUOMESSA 1994
Käyttöä koskeva kyselylomake
Huom. Kysymyksiin voi vastata myös suomeksi tai ruotsiksi. Kaikki rahamäärät Suomen markkoina.
Kysymysryhmät tarkennuksineen:
1. Tiedot vastaajaorganisaatiosta
- Organisaation nimi ja päätoiminnat- Jaottelu organisaatiotyypin mukaan: yksityiset yritykset, valtionyhtiöt, julkiset organisaatiot (esim. korkeakoulut ja muut oppilaitokset), puolijulkiset organisaatiot (esim. kauppakamarit)- Henkilökunnan lukumäärä- Osaston nimi ja päätoiminta- Vastaajan nimi ja osoitetiedot- Kuuluuko vastaaja johonkin tietopalvelu- tai kirjastoalan yhdystykseen?
2. Tiedonvälitystoiminnan jaottelu 1994
2.1 Mitä palveluita tarjoatte?2.2 Mitä tiedonlähteitä käytätte ja kuinka usein vastatessanne tietopalvelulle tulleisiin kysymyksiin? Huom. "internal" tarkoittaa omassa organisaatiossa käytettävissä olevia tiedonlähteitä.
3. Budjetti 1994
3.1 Kokonaisbudjetin jakaantuminen eri toiminnoille (karkea arvio prosentteina)3.2 Kokonaisbudjetti 1994 (kaikki kustannukset ilman arvonlisäveroa)3.3.1 Kokonaismenot elektronisten tietopalvelujen käytöstä osastollanne/orga-nisaatiossanne 19943.3.2 Kokonaismenot elektronisten tietopalvelujen käytöstä tuotetyypin mukaanvuonna 1994 (karkea arvio prosentteina)3.3.3 Kokonaismenot elektronisten tietopalvelujen käytöstä aihealueen mukaanvuonna 1994 (karkea arvio prosenteissa)
4. Kokonaisliikevaihto 1994
4.1 Kokonaisliikevaihto tietopalveluista4.2 Voitteko arvioida, miten kokonaisliikevaihto jakaantui erilaisten tietopal-velujen kesken (karkea arvio prosentteina)?
5. Asiakkaat
5.1 Kuinka monelle asiakkaalle tarjositte palveluja 1994 (prosentteina)? Erikseen sisäiset (oman organisaation) asiakkaat ja ulkopuoliset asiakkaat.

21
5.2 Nousiko vai laskiko liikevaihtonne sisäisten asiakkaiden kohdalla vuoteen1993 verrattuna?5.3 Nousiko vai laskiko liikevaihtonne ulkopuolisten asiakkaiden kohdallavuoteen 1993 verrattuna?5.4 Miltä toimialoilta tulivat tärkeimmät ulkopuoliset asiakkaanne (karkeaarvio prosentteina)?
6. Elektronisten tietopalvelujen käytön esteet
6.1 Mitkä ovat tärkeimmät esteet (ongelmat, haitat), jotka vaikuttavat siihen,että asiakkaanne käyttäisivät itse elektronisia tietopalveluja? Arvioikaa esteetasteikolla 5 - 1 (5 = hyvin merkitsevä este, 1 = ei ole este).6.2 Tärkeimmät markkinointitoimenpiteet, joita suunnittelette vuodeksi 1995. Arvioikaa asteikolla 5 - 1 (5 = hyvin merkitsevä toimenpide, 1 = ei lainkaanmerkitsevä).
Käsitteiden määritelmiä (englanniksi)

22
1. Details of Organisation (Status 1994)
Name of your company/organisation:
......................................................................................................................................
Main activities of your company/organisation:
......................................................................................................................................
Legal status of your company/organisation:
private company ____ public company ____
public institution ____ semi-public institution ____
Number of total staff employed in your company/organisation (at your location, in full time equivalents
in the calendar year 1994). Please indicate the exact number:
......................................................................................................................................
Name of your department:
......................................................................................................................................
Main function of your department:
......................................................................................................................................
Number of total staff employed in your department working as information intermediary/professional (in
full-time equivalents in the calendar year 1994). Please indicate the exact number:
......................................................................................................................................
Contact person: ......................................................................................................................................
Address:
......................................................................................................................................
......................................................................................................................................
Country: ..................................................................................................
Telephone: ..................................................................................................
Fax number: ..................................................................................................
E-Mail-address: ..................................................................................................

23
Are you a member of any information brokers' association? If yes, please indicate the full name/s.
1 .................................................................................................................................
2 .................................................................................................................................
3 .................................................................................................................................

24
2. Details of your information intermediary activities in 1994
2.1 Which services do you offer?
yes no
Retrieval in online electronic information services ( ) ( )
Retrieval in offline electronic information services ( ) ( )
Retrieval in offline library services, archival services ( ) ( )
Training courses / further education ( ) ( )
Consulting ( ) ( )
Database production, input in databases ( ) ( )
Distribution of software programmes / packages ( ) ( )
Other information services, please specify:
.....................................................................................
.....................................................................................
2.2 Which of the following sources do you use and how frequently whenpreparing and answering your requests?
Usein more than in less than 50% in less than never used50% of but more than 10% 10% of
Media searches of searches searches
Printed media (i.e. daily news- ( ) ( ) ( ) ( )papers, journals, books)
Personal contacts (i.e. experts, ( ) ( ) ( ) ( )colleagues, exchanges at meetings)
Internal online electronic information ( ) ( ) ( ) ( )services (i.e. in-house databases)
External online electronic informa- ( ) ( ) ( ) ( )tion services (i.e. online databases)
External offline electronic informa- ( ) ( ) ( ) ( )tion services (i.e. CD-ROM)
Others, please specify:
............................................... ( ) ( ) ( ) ( )
.............................................. ( ) ( ) ( ) ( )
Definitions: see back page of the questionnaire.

25
3. Budget in 1994
3.1 How was your total budget allocated to the following functions? Please give rough estimates.
0-10% 11-50% 51-75% 76-100%
Online electronic information services ( ) ( ) ( ) ( )
Internal database production and maintenance ( ) ( ) ( ) ( )
External database production and maintenance ( ) ( ) ( ) ( )
Offline electronic information services ( ) ( ) ( ) ( )
Printed media ( ) ( ) ( )
( ) Management, administration ( ) ( )
( ) ( )
Outsourcing ( ) ( ) ( ) ( )
Administration of archives ( ) ( ) ( ) ( )
Further education and training, seminars, ( ) ( ) ( )
( )
conferences
Other, please specify:
.............................................................................. ( ) ( ) ( ) ( )
............................................................................... ( ) ( ) ( ) ( )

26
3.2 What was your total budget in 1994?
(all costs you indicated in 3.1, exclusive of VAT)
approximately ...............................................................................................................(please indicate in national currency, FIM)
3.3.1 What was your total expenditure for using electronic information services in your department (organisation) in 1994?
approximately ...............................................................................................................(please indicate in national currency, FIM)
Please note: from this point onwards we are only interested in electronic informationservices.
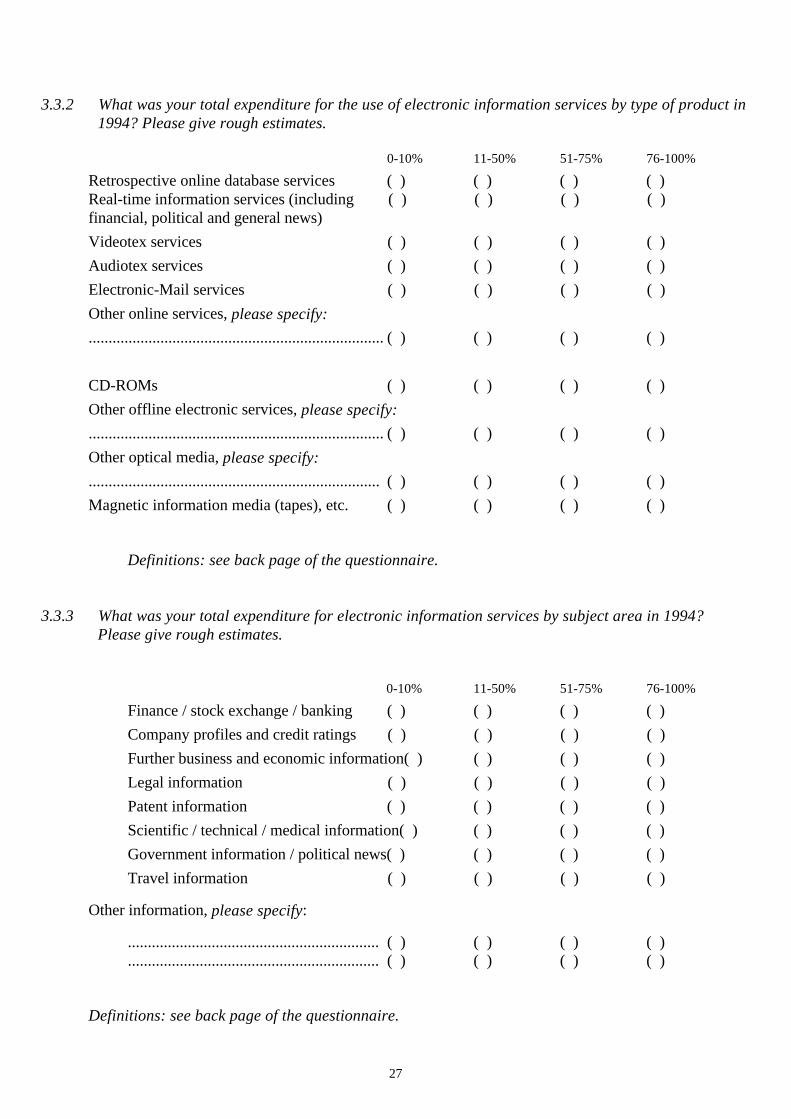
27
3.3.2 What was your total expenditure for the use of electronic information services by type of product in1994? Please give rough estimates.
0-10% 11-50% 51-75% 76-100%
Retrospective online database services ( ) ( ) ( ) ( )Real-time information services (including ( ) ( ) ( ) ( )financial, political and general news)
Videotex services ( ) ( ) ( ) ( )
Audiotex services ( ) ( ) ( ) ( )
Electronic-Mail services ( ) ( ) ( ) ( )
Other online services, please specify:
.......................................................................... ( ) ( ) ( ) ( )
CD-ROMs ( ) ( ) ( ) ( )
Other offline electronic services, please specify:
.......................................................................... ( ) ( ) ( ) ( )
Other optical media, please specify:
......................................................................... ( ) ( ) ( ) ( )
Magnetic information media (tapes), etc. ( ) ( ) ( ) ( )
Definitions: see back page of the questionnaire.
3.3.3 What was your total expenditure for electronic information services by subject area in 1994?Please give rough estimates.
0-10% 11-50% 51-75% 76-100%
Finance / stock exchange / banking ( ) ( ) ( ) ( )
Company profiles and credit ratings ( ) ( ) ( ) ( )
Further business and economic information( ) ( ) ( ) ( )
Legal information ( ) ( ) ( ) ( )
Patent information ( ) ( ) ( ) ( )
Scientific / technical / medical information( ) ( ) ( ) ( )
Government information / political news( ) ( ) ( ) ( )
Travel information ( ) ( ) ( ) ( )
Other information, please specify:
............................................................... ( ) ( ) ( ) ( )
............................................................... ( ) ( ) ( ) ( )
Definitions: see back page of the questionnaire.

28
4. Revenue
4.1 What was your total revenue in 1994 with information services?
......................................................................................................................................(please indicate in national currency, FIM)
4.2 Can you please estimate how this total revenue was allocated to your information services offered?Please give rough estimates.
0-10% 11-30% 31-50% 51-75% 76-100%
Retrieval in online electronic information ( ) ( ) ( ) ( ) ( )
services
Retrieval in offline electronic information ( ) ( ) ( ) ( ) ( )
services
Retrieval in offline library services,
archival services ( ) ( ) ( ) ( ) ( )
Consulting ( ) ( ) ( ) ( ) ( )
Database production, database input ( ) ( ) ( ) ( ) ( )
Distribution of software programmes /
packages ( ) ( ) ( ) ( ) ( )
Other information services, please specify:
.................................................................... ( ) ( ) ( ) ( ) ( )
.................................................................... ( ) ( ) ( ) ( ) ( )
5. Customers
5.1 For how many customers did you offer your services in 1994? Please indicate in percent.
......% internal customers / users
.......% external customers / users

29
5.2 In comparison to 1993, did your revenue from internal customers/usersincrease or decrease?
( ) increase ( ) decrease
5.3. In comparison to 1993, did your revenue from external customers/usersincrease or decrease?
( ) increase ( ) decrease
5.4 From which sectors did your most important external customers/users come?Please give rough estimates.
0- 10% 11-50% 51-75% 76-100%
Manufacturing industries ( ) ( ) ( ) ( )
Service industries ( ) ( ) ( ) ( )
Public sector ( ) ( ) ( ) ( )
Other sectors, please specify:
............................................................... ( ) ( ) ( ) ( )
................................................................ ( ) ( ) ( ) ( )

30
6. Barriers of Using Electronic Information Services
6.1 Which are the most significant barriers to your customer's use of electronic information services?Please rate the barriers according to a 5-point scale (5=very significant barrier, 1=no barrier).
Rating5 4 3 2 1
Lack of awareness from user's point of view ( ) ( ) ( ) ( ) ( )
Lack of experienced staff ( ) ( ) ( ) ( ) ( )
Technical barriers (software, hardware,retrieval language) ( ) ( ) ( ) ( ) ( )Lack of user-friendliness ( ) ( ) ( ) ( ) ( )Information required is not available ( ) ( ) ( ) ( ) ( )Language problems ( ) ( ) ( ) ( ) ( )Cost-benefit relation inadequate ( ) ( ) ( ) ( ) ( )Prices for host services too high ( ) ( ) ( ) ( ) ( )Staff costs too expensive ( ) ( ) ( ) ( ) ( )Resistance from management ( ) ( ) ( ) ( ) ( )Budget reasons ( ) ( ) ( ) ( ) ( )Network deficiencies ( ) ( ) ( ) ( ) ( )
Further reasons, please specify and rate:
................................................................................... ( ) ( ) ( ) ( ) ( )
................................................................................... ( ) ( ) ( ) ( ) ( )

31
6.2. What principal marketing activities do you plan during the next year? Please rate the importance ofactivities in a 5-point scale (5=very important activity,1=no important activity).
Rating 5 4 3 2 1
Visiting customers ( ) ( ) ( ) ( ) ( )
Active participation in congresses ( ) ( ) ( ) ( ) ( )Active participation in exhibitions ( ) ( ) ( ) ( ) ( )Presentation of services ( ) ( ) ( ) ( ) ( )Mailings, direct mail ( ) ( ) ( ) ( ) ( )Better presentation of research results ( ) ( ) ( ) ( ) ( )Publication of brochures, other materials describing your service ( ) ( ) ( ) ( ) ( )Improvement of customer service ( ) ( ) ( ) ( ) ( )Participation in information broker associations ( ) ( ) ( ) ( ) ( )Public Relations ( ) ( ) ( ) ( ) ( )Others, please specify:
.................................................................................. ( ) ( ) ( ) ( ) ( )
................................................................................... ( ) ( ) ( ) ( ) ( )
---------------------------------------------------------------------------------------------------
Kiitos yhteistyöstä!
Palauta lomake 15.6.1995 mennessä ensimmäisellä sivulla mainittuun osoitteeseen.

32
Definitions (alphabetical listing)Audiotex services (suppliers): organisations delivering online information services whereby the users receive information aurally("voice information services") - focused on so-called "premium rate services".
Distributors of offline information services/products: organisations offering for sale or lease unitised electronic informationproducts such as CD-ROMs, CD-Is, other optical products, diskettes, magnetic tapes, etc. The definition excludes organisations whichperform a role analogous to that of book shops or wholesalers, i.e.: which merely purchase offline information products and then resellthem to users.
Database producers: organisations producing one or more databases in an electronic form, which may be used in offering online andoffline information services/products.
Electronic information services (for professional purposes): The electronic delivery of information, not in a printed version. Thedelivery can be online or offline. Online means delivery via telecommunications links. Offline means delivery of information withoutthe usage of any telecommunications networks, i.e. CD-ROM.
Electronic (E)-mail services: services which permit users to send messages electronically to specified recipients or receive messagesfrom senders.
End user: customers who use the content of electronic information services and products for direct application in their own work.
External online database: see External electronic information services.
External electronic information services: all online and offline information services which are bought from external suppliers. Onlythe special case of Internet is not wholly covered by this definition.
Historical online database services: see Retrospective Online Database Services
In-house databases / internal online electronic information services: information services that are generated internally for internalusers and that are not commercially exploited.
Information services according to subject areas:Finance / stock exchange / banking: includes information on stocks and shares, banking, foreign exchange, insurance and otherfinancial services. Further business and economic information: includes business news, trade opportunities, market data, generaleconomic news and statistics, real estate, and multi-disciplinary or specialised industry services. Scientific / technical / medicalinformation: includes, in addition to the obvious subject topics, technology and standards and multi-disciplinary or specialisedscientific services.
Internal (online) electronic information services: information services that are generated internally for internal uses and that are notcommercially exploited.
Magnetic information media: information products such as tapes and discs of various sizes and formats which use magnetic storagetechnology, including magnetic tapes, diskettes, cassettes, microfilm, etc.
Online database: is used for the electronic storage of information (text, numbers, images, etc.).
Online electronic information services see: Electronic information services
Offline : see Electronic information services.
Optical information media: information products on various types of discs which use analogue or optical storage technology,including CD-ROM , CD-I (Compact Disc Interactive), CDTV (Commodore Dynamic Total Vision), Electronic Books, etc.
Real-time information services: this term, strictly speaking, refers to online information services which are updated immediately newdata become available, possibly several times a minute at peak times, and delivered to the users in real-time.
Request (synonym: search / query): an order by an internal or external customer which you work on for more than 10 minutes' timeor for which external electronic information services must be paid.
Retrospective Online Database Services: online information services delivering information from retrospective databases whichmay contain different kinds of data (reference, factual, numeric data, full-text, images, etc.) in a number of subject areas (news,financial and business data, scientific and technical information, legal information, etc.) and for a number of retrospective time spansor time periods.
Supplier: an organisation offering online or offline information services such as an online database producer, an online service / host,an electronic-mail service supplier, a CD-ROM supplier, etc.
Videotex services (suppliers): organisations delivering online information services page by page or screen by screen, rather thancharacter by character.
Excluded are:

33
Services broadcast with television transmission and accessible by any member of the public with a suitablereceiver. Bureau services for computing: call handling or other facilities provided under subcontract toprincipals engaged in the provision of electronic information services / products.