Embed Size (px)
Citation preview

Marco AnghileriDipartimento di Ingegneria Aerospaziale
Politecnico di MilanoItaly.
NCHRP 22_24 Interim report Meeting.Washington 2008-01-11
Robust: “Road Upgrade of Standards”

NCHRP 22_24 Interim Report meeting. Washington 2008-01-11
Robust
. G
RD
1-2
002-7
002
1
2
Robust
• EU FP5 sponsored three year project.
• Scope: create knowledge to improve EN-1317.
• Strong integration with CEN/TC226/Wg1/Tg1.
• The project covered 3 main items (referred to EN1317):
– 1 Study of the current situation.
– 2 Experimental procedures.
– 3 Computational mechanics.

NCHRP 22_24 Interim Report meeting. Washington 2008-01-11
Robust
. G
RD
1-2
002-7
002
1
4
Robust activities. 1 Study of the current situation
• To verify the relevance of 1317 on roadside safety.
– Statistical study of real life accidents and injuries to verify the contribution of 1317.
– Verification of the correspondence between testing procedures and real life accidents.
NCHRP 22_24 Interim Report meeting. Washington 2008-01-11
Robust
. G
RD
1-2
002-7
002
1
5
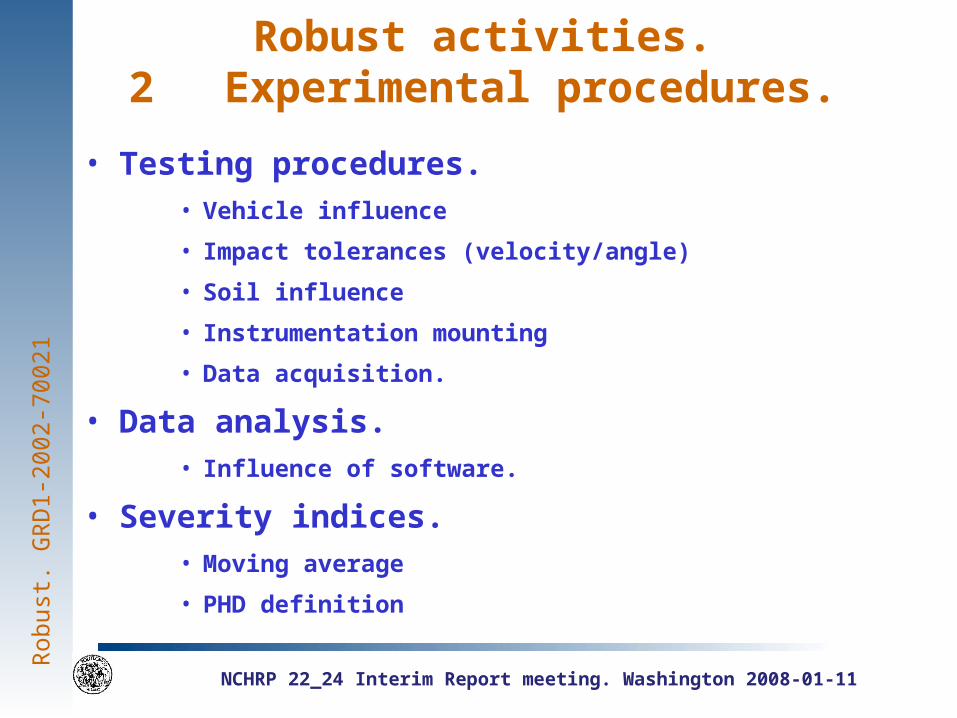
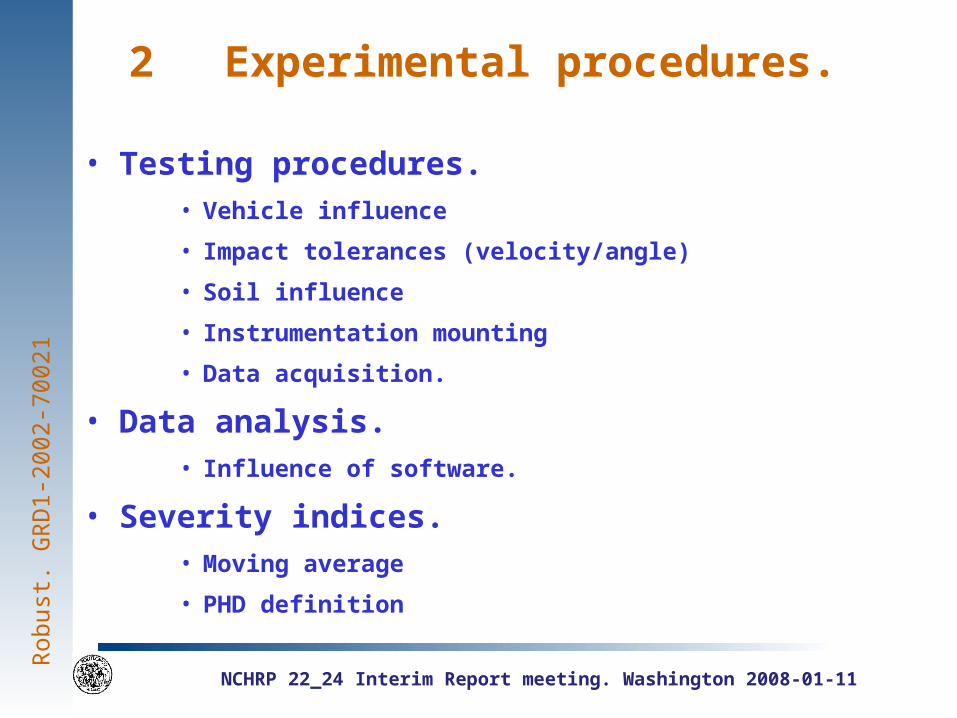
Robust activities.2 Experimental procedures.
• Testing procedures.• Vehicle influence
• Impact tolerances (velocity/angle)
• Soil influence
• Instrumentation mounting
• Data acquisition.
• Data analysis.• Influence of software.
• Severity indices.• Moving average
• PHD definition

NCHRP 22_24 Interim Report meeting. Washington 2008-01-11
Robust
. G
RD
1-2
002-7
002
1
6
Robust activities. 3 Computational mechanics.
• To improve the use of CM inside the certification process.
– Vehicle models improvement.
– Simulation procedures.
– Parametric studies.
– Validation procedures.

NCHRP 22_24 Interim Report meeting. Washington 2008-01-11
Robust
. G
RD
1-2
002-7
002
1
7
Item 1: Current situation.
• Statistical analysis of current level of safety around Europe.– Collection of data from real life accidents.
– Impacts only against EN1317 safety barriers.
– To investigate the application of EN1317 standards.
– To verify that EN1317 testing procedures is representative of real life.
• Incident data from:– Single vehicle incidents.
– Incidents an ALL roads
– Incidents which a VRS has been hit
– Only incidents from 1° Jan 1990

NCHRP 22_24 Interim Report meeting. Washington 2008-01-11
Robust
. G
RD
1-2
002-7
002
1
8
Data collection table.
• General incident information (date, road type, speed limit).
• Details of the vehicle (make, model, weight).
• Movement and damage to the vehicle.
• Severity and location of injuries to the occupant(s).
• Type of VRS.
• Impact speed and angle.
• Data source(s).

NCHRP 22_24 Interim Report meeting. Washington 2008-01-11
Robust
. G
RD
1-2
002-7
002
1
9
Current situation.Results and recommendations
• For all impact testing with cars, an impact speed of 110 km/h is recommended for all testing;
• The impact angle for cars remains at twenty degrees.
• The number of registered motorcycles be reordered, and the occurrence of such incidents analyzed in future years.
• It is recommended that the weight specified for the small car test (currently referred to as TB11) should be changed so as to be 950 ± 50 kg;

NCHRP 22_24 Interim Report meeting. Washington 2008-01-11
Robust
. G
RD
1-2
002-7
002
1
10
Current situation.Results and recommendations
• It is recommended that the vehicles used for the testing of VRS are no more than 5 years old;
• The data have shown that one dummy (either instrumented or not instrumented) should be seated in the vehicle during all testing between cars and VRS;
• It is further recommended that the dummy should be placed on the driver’s side of the vehicle and this should be the impact side. The dummy should be restrained by a seat belt;
NCHRP 22_24 Interim Report meeting. Washington 2008-01-11
Robust
. G
RD
1-2
002-7
002
1
11
2 Experimental procedures.
• Testing procedures.• Vehicle influence
• Impact tolerances (velocity/angle)
• Soil influence
• Instrumentation mounting
• Data acquisition.
• Data analysis.• Influence of software.
• Severity indices.• Moving average
• PHD definition

NCHRP 22_24 Interim Report meeting. Washington 2008-01-11
Robust
. G
RD
1-2
002-7
002
1
12
2 Testing procedures.
• Scope:
– Reduce scatter between labs.
– Improve testing procedures.
– Obtain benchmarks for computational mechanics activity.
• Activities:
– Round robin activity with rigid barrier
– Round robin activity with deformable barrier
– Round robin with heavy vehicles.
– Same test repeated in the same test house
– Collection of procedures used during testing inside the different test houses.
– Statistical analysis of already performed test (TB11 - 900 kg 100 km/h 20°) to investigate procedures for severity indices evaluation and possible correlation between existing severity indices.

NCHRP 22_24 Interim Report meeting. Washington 2008-01-11
Robust
. G
RD
1-2
002-7
002
1
13
Round robin with rigid barrier
• Rigid barrier:
– Same rigid barrier
– 900 kg 100 km/h 20°
– 6 tests with same new car
– 4 tests with test house standard cars
– 2 additional tests with the same new car and improved procedures
– In total 12 tests.
NCHRP 22_24 Interim Report meeting. Washington 2008-01-11
Robust
. G
RD
1-2
002-7
002
1
14
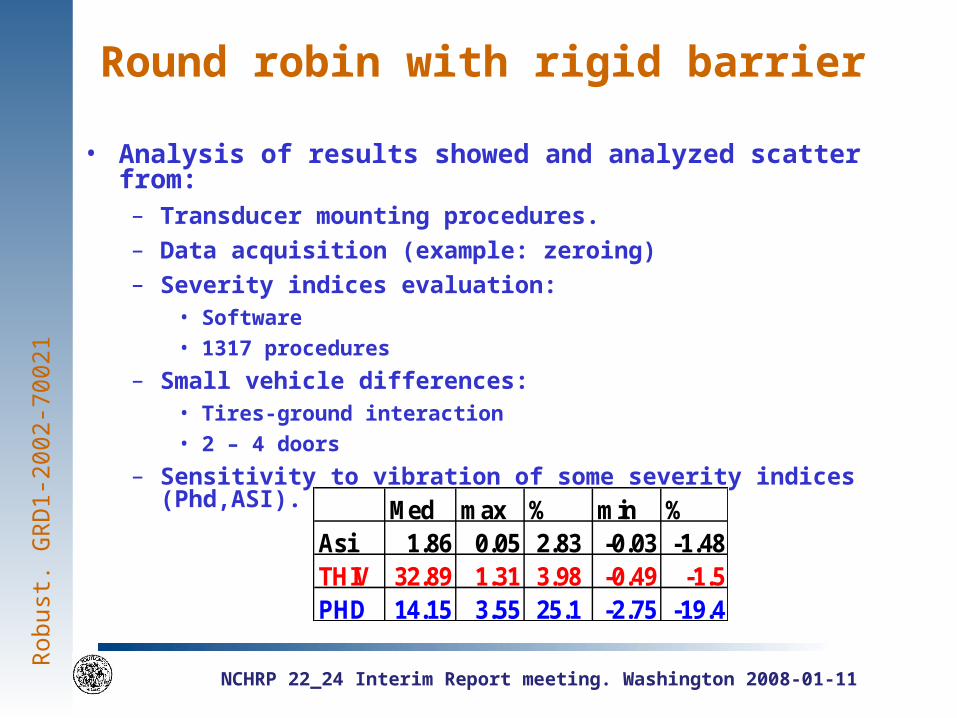
Round robin with rigid barrier
• Analysis of results showed and analyzed scatter from:– Transducer mounting procedures.
– Data acquisition (example: zeroing)
– Severity indices evaluation:• Software• 1317 procedures
– Small vehicle differences:• Tires-ground interaction• 2 – 4 doors
– Sensitivity to vibration of some severity indices (Phd,ASI).
Med max % min %Asi 1.86 0.05 2.83 -0.03 -1.48THIV 32.89 1.31 3.98 -0.49 -1.5PHD 14.15 3.55 25.1 -2.75 -19.4
NCHRP 22_24 Interim Report meeting. Washington 2008-01-11
Robust
. G
RD
1-2
002-7
002
1
15
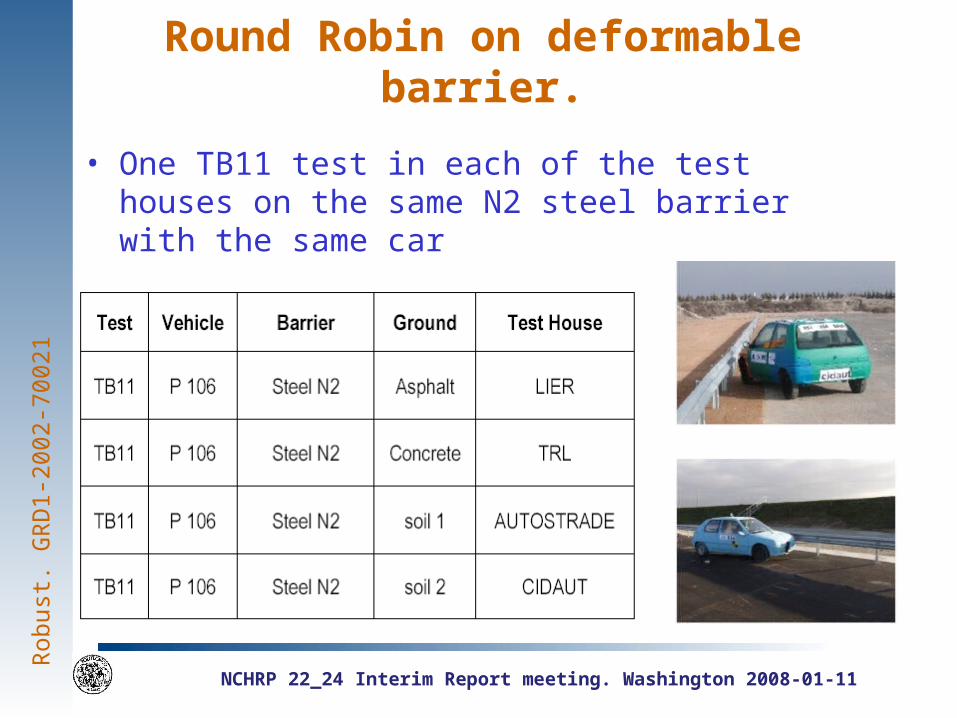
Round Robin on deformable barrier.
• One TB11 test in each of the test houses on the same N2 steel barrier with the same car

NCHRP 22_24 Interim Report meeting. Washington 2008-01-11
Robust
. G
RD
1-2
002-7
002
1
16
Round Robin on deformable barrier.

NCHRP 22_24 Interim Report meeting. Washington 2008-01-11
Robust
. G
RD
1-2
002-7
002
1
17
Round Robin on deformable barrier.
• Scatter for these series of tests is bigger than the scatter observed for Round Robin with rigid barrier.
• The only difference was the use of a soft barrier and different soils conditions.

NCHRP 22_24 Interim Report meeting. Washington 2008-01-11
Robust
. G
RD
1-2
002-7
002
1
18
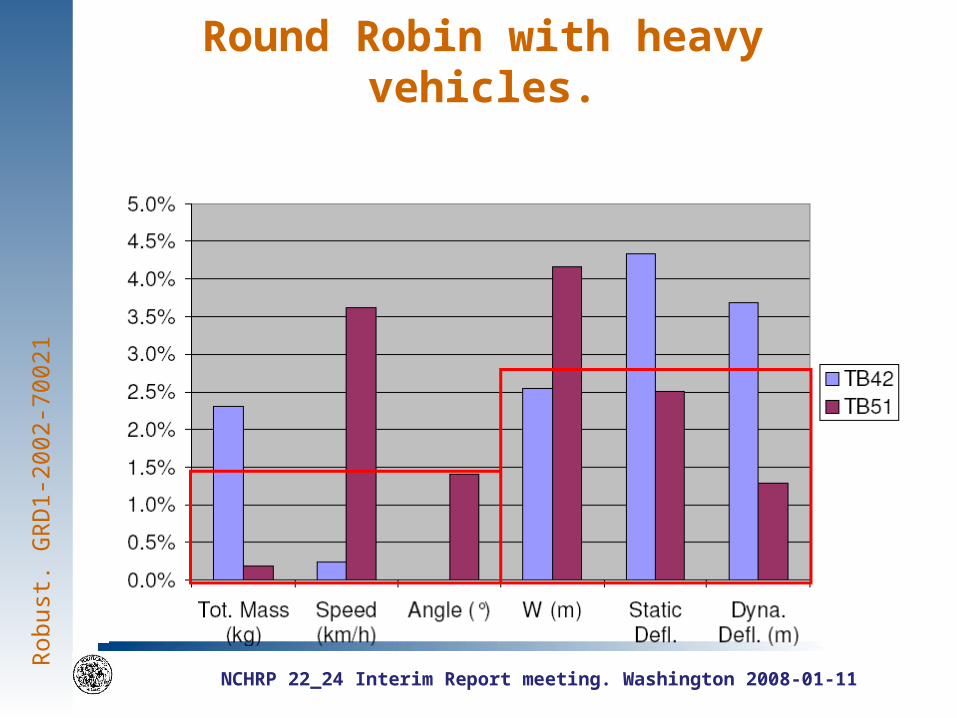
Round Robin with heavy vehicles.
• Tests with two different heavy vehicles, TB42 and TB51, one performed identically three times and one performed twice, to evaluate experimental result scatter
NCHRP 22_24 Interim Report meeting. Washington 2008-01-11
Robust
. G
RD
1-2
002-7
002
1
19
Round Robin with heavy vehicles.

NCHRP 22_24 Interim Report meeting. Washington 2008-01-11
Robust
. G
RD
1-2
002-7
002
1
20
Statistical analysis of existing data
• Example: Thiv-ASI correlation
Corrélation THIV - ASI (All data)
y = 13.748x + 11.409
R2 = 0.6359
0.00
5.00
10.00
15.00
20.00
25.00
30.00
35.00
40.00
45.00
50.00
0 0.5 1 1.5 2 2.5 3
ASI
THIV
THIV/ASI-All
VAL limites
Lineare (THIV/ASI-All)
Corrélation THIV/ASI
0.00
10.00
20.00
30.00
40.00
50.00
60.00
70.00
0.00 0.50 1.00 1.50 2.00 2.50 3.00
ASI
THIV
Autostrada
LIER
..
TRL

NCHRP 22_24 Interim Report meeting. Washington 2008-01-11
Robust
. G
RD
1-2
002-7
002
1
21
Statistical analysis of existing data
• ASI-dynamic deflection correlation:
y = 1.461e-0.688x
R2 = 0.589
0.00
0.40
0.80
1.20
1.60
2.00
0.00 0.50 1.00 1.50 2.00
Dynamic deflexion
AS
I ASI-DD
Espo. (ASI-DD)

NCHRP 22_24 Interim Report meeting. Washington 2008-01-11
Robust
. G
RD
1-2
002-7
002
1
22
Composite mounting fixing.• Installation of accelerometers can
affect measures and severity indices.
• The weight of the mounting block is a crucial problem

NCHRP 22_24 Interim Report meeting. Washington 2008-01-11
Robust
. G
RD
1-2
002-7
002
1
23
Deceleration tests.

NCHRP 22_24 Interim Report meeting. Washington 2008-01-11
Robust
. G
RD
1-2
002-7
002
1
24
Deceleration tests. Results.
• Frequency response of impact pulses:
– Strong differences between different mounting blocks.
– Differences at frequencies where severity indices work.
0 20 40 60 80 1000
1000
2000
3000
4000
5000
6000
7000
8000spectrum power density. y direction. 70° impact
AluminiumComposite
2 4 6 8 10 12 140
1000
2000
3000
4000
5000
6000
7000
spectrum power density. y direction. 70° impact
AluminiumComposite

NCHRP 22_24 Interim Report meeting. Washington 2008-01-11
Robust
. G
RD
1-2
002-7
002
1
25
ASI. Acceleration Severity Index
– “The index ASI is intended to give a measure of the severity of the vehicle motion for a person seated in the proximity of point P (CG) during an impact.”
– Steps:
• Measure three acceleration components of vehicle CG according with CFC180.
• Apply a 50 ms moving average on these acceleration.
• Evaluate Asi as:
2 22
lim lim lim
( ) y zx
x y z
a aaASI t
a a a
NCHRP 22_24 Interim Report meeting. Washington 2008-01-11
Robust
. G
RD
1-2
002-7
002
1
27
Moving average
• Questions:
– Can moving average distort signals?
– Can moving average give wrong information?

NCHRP 22_24 Interim Report meeting. Washington 2008-01-11
Robust
. G
RD
1-2
002-7
002
1
30
50 ms moving average – standard filtering gain.
• Gain=output/input
0 20 40 60 80 100
0.1
0.2
0.3
0.4
0.5
0.6
0.7
0.8
0.9
1
freq [Hz]
Gai
n
Butterworth filter

NCHRP 22_24 Interim Report meeting. Washington 2008-01-11
Robust
. G
RD
1-2
002-7
002
1
31
50 ms moving average – standard filtering attenuation.
• Attenuation.
100
101
102
103
104
-350
-300
-250
-200
-150
-100
-50
0
freq [Hz]
Am
plitu
de [D
b]
Moving averageFilter
0 20 40 60 80 100-350
-300
-250
-200
-150
-100
-50
0
50
100
freq [Hz]
Am
plitu
de [D
b]
Moving average

NCHRP 22_24 Interim Report meeting. Washington 2008-01-11
Robust
. G
RD
1-2
002-7
002
1
32
Moving average does not preserve energy.
• Velocity evaluation with:– Original signal
– Filtered signal (Butterworth)
– Moving Average
0 0.2 0.4 0.6 0.8 1-2
-1.5
-1
-0.5
0
0.5
1Velocity evaluation
time
velo
city
Moving average Original signalFiltered signal
0 0.2 0.4 0.6 0.8 1 1.2 1.4-1.4
-1.2
-1
-0.8
-0.6
-0.4
-0.2
0
0.2
0.4
0.6Velocity evaluation
time
velo
city
Moving average Original signalFiltered signal

NCHRP 22_24 Interim Report meeting. Washington 2008-01-11
Robust
. G
RD
1-2
002-7
002
1
35
Is this a real problem?
• To verify the presence of this problem:
– Test cases obtained from some standard crash tests.
• Acceleration time-history.
– Original
– Filtered with moving average.
– Filtered with a “correct” filter.

NCHRP 22_24 Interim Report meeting. Washington 2008-01-11
Robust
. G
RD
1-2
002-7
002
1
36
Example.
0 0.2 0.4 0.6 0.8 1-50
-40
-30
-20
-10
0
10
20
30TEST 3: accelerazione X
time [s]
g
0 0.2 0.4 0.6 0.8 1-20
-15
-10
-5
0
5
10
15
20TEST 3: accelerazione Y
time [s]
g 0 0.2 0.4 0.6 0.8 1-15
-10
-5
0
5
10
15TEST 3: accelerazione Z
time [s]g

NCHRP 22_24 Interim Report meeting. Washington 2008-01-11
Robust
. G
RD
1-2
002-7
002
1
37
0 0.2 0.4 0.6 0.8 1-16
-14
-12
-10
-8
-6
-4
-2
0
2
time [s]
gTEST 3:Confronto tra media mobile e filtraggio. Componente X
Media mobileFiltro
0 0.2 0.4 0.6 0.8 1-2
-1.5
-1
-0.5
0
0.5
1
1.5
2
2.5
time [s]
g
TEST 3:Confronto tra media mobile e filtraggio. Componente Y
Media mobileFiltro
0 0.2 0.4 0.6 0.8 1-1.5
-1
-0.5
0
0.5
1
1.5
2
2.5
3
time [s]
g
TEST 3:Confronto tra media mobile e filtraggio. Componente Z
Media mobileFiltro

NCHRP 22_24 Interim Report meeting. Washington 2008-01-11
Robust
. G
RD
1-2
002-7
002
1
38
Moving average
• The modification of original signals driven by the moving average has been demonstrated but:
• Is this strange behavior of moving average desired by the original designer of ASI?
• Or was simply not observed?

NCHRP 22_24 Interim Report meeting. Washington 2008-01-11
Robust
. G
RD
1-2
002-7
002
1
39
History of ASI.– I.Laker: “ A short summary of three vehicle Impact Severity
Measure- ASI THIV/PHD NCHRP 230” 1991.
• First step: the Shoemaker table

NCHRP 22_24 Interim Report meeting. Washington 2008-01-11
Robust
. G
RD
1-2
002-7
002
1
42
History
• 1955 Stapp tests.
• 1969 Limits in 3 direction from Cornell Aeronautical Laboratories
• 1971 Moving average.
• 1972 Ellipsoidal Envelope from US Air force documents

NCHRP 22_24 Interim Report meeting. Washington 2008-01-11
Robust
. G
RD
1-2
002-7
002
1
43
Acceleration time histories.
– Aeronautical deceleration:
• Source: Us Army “Aircraft Crash Survival Design Guide”.
• Single peak: from 15 to 30 g
• Time duration from 0.1 to 0.15 s
– Safety barrier deceleration.
0 0.2 0.4 0.6 0.8 1-15
-10
-5
0
5
10TEST 1: accelerazione X
time [s]
g

NCHRP 22_24 Interim Report meeting. Washington 2008-01-11
Robust
. G
RD
1-2
002-7
002
1
44
ASI History
• ASI was based on research on the injury assessment of vehicle and aircraft occupants in phenomena such as re-entry space capsule impacts and combat airplane maneuvers.
• These phenomena have limited or no oscillations throughout the event.
• For this reason, computing an average over a period of 50 ms was used to obtain an average value to be compared with the tolerable limits.
• Impacts against road restraint systems generally have a duration much greater than 50 milliseconds, and show strong oscillations at different frequencies.
• The 50 ms moving average when applied over such longer acceleration pulses becomes a low-pass filter, but it does not behave like filters used conventionally for crash analysis distorting randomly the original signals.

NCHRP 22_24 Interim Report meeting. Washington 2008-01-11
Robust
. G
RD
1-2
002-7
002
1
45
Modification of ASI formulation.
• 126 tests analyzed
• Evaluation of ASI using filtering instead of moving average.
• 2 poles Butterworth forward – backward filter (to avoid time shift). 4 total poles.
• Cut off frequencies tested:
10 – 12 – 14 – 16 – 18 – 20 hz
• The final cut off frequency has been identified as the one with the better correlation with the standard ASI formula. The idea is to avoid, if possible, modification of the current limits for the ASI formula.
NCHRP 22_24 Interim Report meeting. Washington 2008-01-11
Robust
. G
RD
1-2
002-7
002
1
46
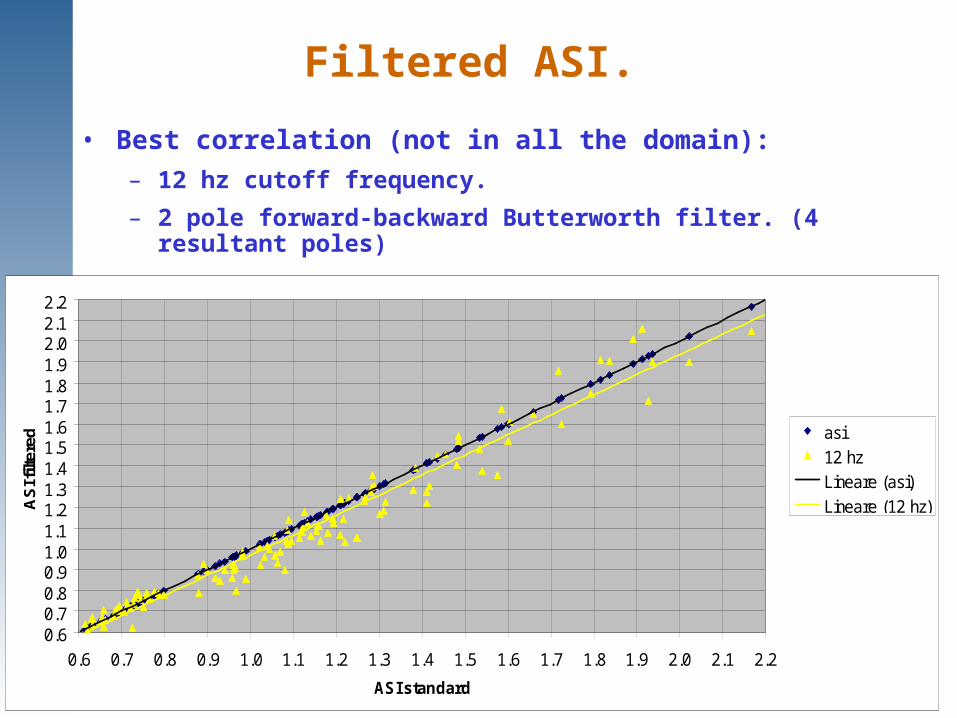
Filtered ASI.
• Best correlation (not in all the domain):
– 12 hz cutoff frequency.
– 2 pole forward-backward Butterworth filter. (4 resultant poles)
0.60.70.80.91.01.11.21.31.41.51.61.71.81.92.02.12.2
0.6 0.7 0.8 0.9 1.0 1.1 1.2 1.3 1.4 1.5 1.6 1.7 1.8 1.9 2.0 2.1 2.2
ASI standard
AS
I filt
ered
asi
12 hz
Lineare (asi)
Lineare (12 hz)

NCHRP 22_24 Interim Report meeting. Washington 2008-01-11
Robust
. G
RD
1-2
002-7
002
1
47
Experimental activities output
• Proposal of PHD deletion. (Phd has been deleted)
• Study on accelerometer mounting block (in the revision of 1317 mounting block will be deleted and accelerometers will be placed directly on the tunnel).
• Study on Asi evaluation procedure. (ASI formula has been modified deleting the moving average).
• Soil must be better defined and controlled during tests (TG1 is discussing how to measure soil variation before tests).

NCHRP 22_24 Interim Report meeting. Washington 2008-01-11
Robust
. G
RD
1-2
002-7
002
1
48
3 Computational mechanics
• Create a vehicle data base.
• Produce information for CME group.
• Identify procedures to be used during computational mechanics activity for certification.
– Vehicle modeling.
– Soil modeling.
– Materials.
– Numerical data acquisition and severity indices evaluation.
• Improve the level of confidence inside computational mechanics
• Study validation procedures.

NCHRP 22_24 Interim Report meeting. Washington 2008-01-11
Robust
. G
RD
1-2
002-7
002
1
49
Vehicle data base. Robust.

NCHRP 22_24 Interim Report meeting. Washington 2008-01-11
Robust
. G
RD
1-2
002-7
002
1
50
Geo metro models.
• Situation:
• R0: NPRA modification of NCAC
• R1: Polimi modification R0 (suspension, meshing).
• R2: R1+seats and gebod
• R3: R1+ steering
• R4: R3+gebod+seats

NCHRP 22_24 Interim Report meeting. Washington 2008-01-11
Robust
. G
RD
1-2
002-7
002
1
51
First modifications. Wheel/suspension problems.

NCHRP 22_24 Interim Report meeting. Washington 2008-01-11
Robust
. G
RD
1-2
002-7
002
1
52
Front suspensions and steering system
• The actual Geo-Metro front suspensions are McPherson type.

NCHRP 22_24 Interim Report meeting. Washington 2008-01-11
Robust
. G
RD
1-2
002-7
002
1
53
Front suspensions and steering system
• Original Geo Metro model has been strongly remeshed and than modified adding suspension and steering.
• In the old version of the Geo-Metro FE model the two front wheels were fixed to the respective side of the vehicle’s frame by a deformable beam
• Each wheel cannot steer unless the beam doesn’t fail.
• These two beams increased the stiffness of the suspensions assembly.
• Furthermore, in order to coordinate the steering movement of front wheels, a rigid link between the front rims was defined.
• Even if this link could synchronize the wheels during the steering action, it was not quite correct because it made the steering and suspension motion dependent: the suspension compression or rebound made the wheels steer, too!

NCHRP 22_24 Interim Report meeting. Washington 2008-01-11
Robust
. G
RD
1-2
002-7
002
1
54
Front suspensions and steering system
• Front suspensions of the model have been enhanced by the redefinition of old joints and the creation of new ones which now allow a steering capability of the vehicle.
• Simple simulation have been run to check the system
Lower A-arm
Spindle

NCHRP 22_24 Interim Report meeting. Washington 2008-01-11
Robust
. G
RD
1-2
002-7
002
1
55
Steering system
• Steering of front wheels under the application of a force to the right wheel only and the vehicle raised from the ground.

NCHRP 22_24 Interim Report meeting. Washington 2008-01-11
Robust
. G
RD
1-2
002-7
002
1
56
Handling capabilities.

NCHRP 22_24 Interim Report meeting. Washington 2008-01-11
Robust
. G
RD
1-2
002-7
002
1
57
Steering force removed after 0.5 sec
Steering force applied for all the time

NCHRP 22_24 Interim Report meeting. Washington 2008-01-11
Robust
. G
RD
1-2
002-7
002
1
58
Measure of severity indices and time histories
• The measure of severity indices and time histories requires two important verification:
– Numerical data acquisition behavior
– Numerical definition of the transducer
• The numerical data acquisition must be able to acquire data that can reconstruct properly the physics of the phenomenon.
• The definition of the transducer must be comparable to the behavior of a typical transducer used during crash tests.
NCHRP 22_24 Interim Report meeting. Washington 2008-01-11
Robust
. G
RD
1-2
002-7
002
1
62
Output frequency influence.
• Round Robin scenario. Small vehicle 100 km/h 20° rigid barrier.
• Ls-dyna 970 solver 5434a version.
• To verify the behaviour of the numerical data acquisition system, accelerations have been sampled at different frequencies.
• Three output frequencies were considered: • 854 kHz (sampling time equal to the integration timestep),
• 100 kHz
• 10 kHz.
• The data output in the NODOUT ASCII file were used to compute the occupant risk factors, as prescribed in the EN1317 specifications, by means of the Test Risk Assessment Program (TRAP).
• The output data were initially filtered with a standard CFC180 filter and then processed by the software.

NCHRP 22_24 Interim Report meeting. Washington 2008-01-11
Robust
. G
RD
1-2
002-7
002
1
63
Comparison.
• How can we define which is the proper acceleration and the wrong and why an acceleration sampled during a numerical simulation can be wrong?
• Besides the acceleration time history also the velocity and displacement time histories can be obtained from these nodes.
• To understand which is the right acceleration and which is the wrong, we must verify that:
– the velocity and the displacement obtained integrating the acceleration
– And– the velocity and displacement directly sampled.
– Must be equivalent

NCHRP 22_24 Interim Report meeting. Washington 2008-01-11
Robust
. G
RD
1-2
002-7
002
1
64
Lateral velocity comparison
• 854 kHz
• 100 Khz
• 10 Khz
0 0.025 0.05 0.075 0.1 0.125 0.15-8000
-7000
-6000
-5000
-4000
-3000
-2000
-1000
0
1000
Time [s]
Velo
city [
mm
/s]
Vy 854kHz SampledVy 854kHz Integrated
0 0.025 0.05 0.075 0.1 0.125 0.15-8000
-7000
-6000
-5000
-4000
-3000
-2000
-1000
0
1000
Time [s]
Velo
city [m
m/s]
Vy 100kHz SampledVy 100kHz Integrated
0 0.025 0.05 0.075 0.1 0.125 0.15-14000
-12000
-10000
-8000
-6000
-4000
-2000
0
2000
Time [s]
Velo
city [m
m/s]
Vy 10kHz SampledVy 10kHz Integrated

NCHRP 22_24 Interim Report meeting. Washington 2008-01-11
Robust
. G
RD
1-2
002-7
002
1
65
Vertical velocity comparison
• 854 kHz
• 100 Khz
• 10 Khz
0 0.025 0.05 0.075 0.1 0.125 0.15-1000
-500
0
500
1000
1500
2000
2500
3000
3500
4000
Time [s]
Velo
city [m
m/s]
Vz 854kHz SampledVz 854kHz Integrated
0 0.025 0.05 0.075 0.1 0.125 0.15-1000
-500
0
500
1000
1500
2000
2500
3000
3500
4000
Time [s]
Velo
city [
mm
/s]
Vz 100kHz SampledVz 100kHz Integrated
0 0.025 0.05 0.075 0.1 0.125 0.15-2000
0
2000
4000
6000
8000
10000
Time [s]
Velo
city [m
m/s]
Vz 10kHz SampledVz 10kHz Integrated

NCHRP 22_24 Interim Report meeting. Washington 2008-01-11
Robust
. G
RD
1-2
002-7
002
1
66
Comparison results.
• Acceleration sampled at 854 Khz and 100Khz are able to reconstruct correctly the velocity and the displacement of the vehicle.
• Acceleration sampled at 10 Khz (standard sampling rate used for experimental testing) is not able to reconstruct the motion of the vehicle.
• Signals sampled at 10 Khz have problems similar to aliasing.
NCHRP 22_24 Interim Report meeting. Washington 2008-01-11
Robust
. G
RD
1-2
002-7
002
1
67
Data acquisition conclusion.
• This problem showed that numerical data acquisition has the same typical problems of the experimental data acquisition.
• Care must be taken for the definition of the sampling rate. High sampling rate means huge amount of data.
• This problem is mesh sensitive and code sensitive (Pam crash has pre-sampling filtering).
• The requirement we included in our procedure is that, to prove the proper data acquisition, the reconstruction of the motion must be demonstrated starting from acceleration time histories.

NCHRP 22_24 Interim Report meeting. Washington 2008-01-11
Robust
. G
RD
1-2
002-7
002
1
68
Numerical accelerometer definition.
• Now that we have demonstrated the capability of our numerical data acquisition the problem is shifted to the transducer itself.
• This numerical transducer must be compared to a standard real transducer. If we want to compare these two output these transducers (numerical and experimental) must be equivalent.
NCHRP 22_24 Interim Report meeting. Washington 2008-01-11
Robust
. G
RD
1-2
002-7
002
1
69
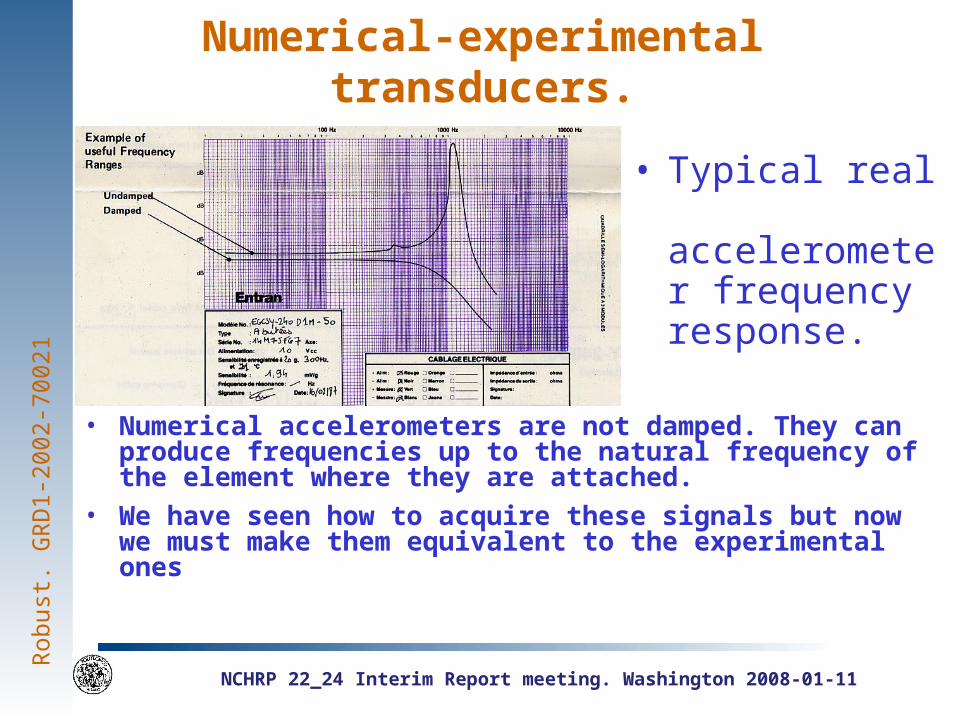
Numerical-experimental transducers.
• Numerical accelerometers are not damped. They can produce frequencies up to the natural frequency of the element where they are attached.
• We have seen how to acquire these signals but now we must make them equivalent to the experimental ones
• Typical real accelerometer frequency response.

NCHRP 22_24 Interim Report meeting. Washington 2008-01-11
Robust
. G
RD
1-2
002-7
002
1
70
Numerical accelerometer processing
– We have seen that sampling frequency must be adequate to avoid numerical aliasing problems (generally much higher that the experimental one).
– A new filtering (before the same filtering used during experimental data acquisition process) must be used to adequate the numerical frequency response to the real frequency response.
– Which frequency?

NCHRP 22_24 Interim Report meeting. Washington 2008-01-11
Robust
. G
RD
1-2
002-7
002
1
71
Example applied to the Round Robin Activity
• Round robin.
• Experimental sampling rate :10 kHz
• Numerical sampling rate: 100 kHz
0 0.5 1 1.5 2 2.5 3 3.5 4 4.5 5
x 104
0
0.5
1
1.5
2
2.5
3
3.5x 10
13
frequency [hz]
ampl
itude
Spectrum
Numerical original signal Numerical CFC1000 Numerical CFC600 NumericalCFC180 Numerical CFC60 Experimental unfiltered signal
0 0.5 1 1.5 2 2.5
x 104
0
2
4
6
8
10
12
14
16
x 1012
frequency [hz]
ampl
itude
Spectrum
Numerical original signal Numerical CFC1000 Numerical CFC600 NumericalCFC180 Numerical CFC60 Experimental unfiltered signal
0 2000 4000 6000 8000 10000 120000
1
2
3
4
5
6
7
8
x 1012
frequency [hz]
ampl
itude
Spectrum
Numerical original signal Numerical CFC1000 Numerical CFC600 NumericalCFC180 Numerical CFC60 Experimental unfiltered signal
0 1000 2000 3000 4000 5000 60000
0.5
1
1.5
2
2.5
3
3.5
4
x 1012
frequency [hz]
ampl
itude
Spectrum
Numerical original signal Numerical CFC1000 Numerical CFC600 NumericalCFC180 Numerical CFC60 Experimental unfiltered signal
0 500 1000 1500 2000 2500 30000
0.2
0.4
0.6
0.8
1
1.2
1.4
1.6
1.8
2
x 1012
frequency [hz]
ampl
itude
Spectrum
Numerical original signal Numerical CFC1000 Numerical CFC600 NumericalCFC180 Numerical CFC60 Experimental unfiltered signal
0 500 1000 15000
0.5
1
1.5
2
2.5
x 1011
frequency [hz]
ampl
itude
Spectrum
Numerical CFC180 Numerical CFC60 Experimental unfiltered signal
Frequencies relevant for severety indices
evaluation

NCHRP 22_24 Interim Report meeting. Washington 2008-01-11
Robust
. G
RD
1-2
002-7
002
1
72
Numerical accelerometer.
• To correctly sample acceleration time histories:
– Demonstrate that you are able to properly reconstruct the motion (with Geo Metro R4 100 kKhz).
• To correctly compare the numerical accelerometer to the experimental one:
– Pre-filter data to have a numerical frequency response similar to the experimental one (with Geo Metro R4 CFC60).

NCHRP 22_24 Interim Report meeting. Washington 2008-01-11
Robust
. G
RD
1-2
002-7
002
1
73
Parametric studies.
• The following points have been studied to better define procedures for the use of CM during the standardization process.
– Friction• between wheel / wearing course• between barrier and vehicle
– Boundary conditions for the barrier• Ground condition• Anchoring of the barrier• Length of the barrier
– Vehicle• Impact point• Speed of the vehicle• Weight of the vehicle• Spinning wheels• Instrumentation• Mounting Block• Location of the accelerometer

NCHRP 22_24 Interim Report meeting. Washington 2008-01-11
Robust
. G
RD
1-2
002-7
002
1
74
Other parametric studies.
• Parametric study on material properties
• ASI, THIV and Dynamic deflection variation on
– Material properties:
• E-module,
• Yield stress (S235 steel has a variation of yield stress from 235 to 360 Mpa)
– Material thickness based on % change
• The material properties should have an upper and a lower limit

NCHRP 22_24 Interim Report meeting. Washington 2008-01-11
Robust
. G
RD
1-2
002-7
002
1
75
Parametric study result.

NCHRP 22_24 Interim Report meeting. Washington 2008-01-11
Robust
. G
RD
1-2
002-7
002
1
76
Parametric study result.

NCHRP 22_24 Interim Report meeting. Washington 2008-01-11
Robust
. G
RD
1-2
002-7
002
1
77
Validation
• Validation methods have been studied using the benchmark cases obtained during the Round Robin activities.
• Validation has been identified not only on severity indices value but also on time histories.
• The method to be used for validation must be objective and able to validate also experimental tests performed inside the tolerances defined by the standards.

NCHRP 22_24 Interim Report meeting. Washington 2008-01-11
Robust
. G
RD
1-2
002-7
002
1
78
Validation based on velocity comparison.
• Accelerometers comparison does not fit for objective validation method.
• Was decided to use a global reference frame velocity comparison.
– Rotations of accelerations (unfiltered).
– Evaluation of global reference frame velocities.-0.05 0 0.05 0.1 0.15 0.2 0.25
-10
0
10
20
30
40
Ay filtered at 180 hz
AutostradeHut Cidaut Lier TRL

NCHRP 22_24 Interim Report meeting. Washington 2008-01-11
Robust
. G
RD
1-2
002-7
002
1
79
All RR tests.
• Same rigid barrier.
• Different vehicles.
• 12 tests
-0.4 -0.2 0 0.2 0.4 0.6 0.8 1-2
0
2
4
6
8
10
12Vy global Unfiltered
-0.2 0 0.2 0.4 0.6 0.8 1 1.214
16
18
20
22
24
26
28Vx global Unfiltered
-0.4 -0.2 0 0.2 0.4 0.6 0.8 1-3
-2
-1
0
1
2
3
4Vz global Unfiltered

NCHRP 22_24 Interim Report meeting. Washington 2008-01-11
Robust
. G
RD
1-2
002-7
002
1
80
Validation based on velocity comparison.
• To take into account the different importance of components, validation based on resultant velocity.
• After the point where the difference between simulated and measured resultant velocity is greater than:– Xx% of current velocity (suggestion:± 5% of initial
current velocity)?
– Xx% of initial velocity (suggestion:± 5% of initial velocity)?
The model is no longer validated.

NCHRP 22_24 Interim Report meeting. Washington 2008-01-11
Robust
. G
RD
1-2
002-7
002
1
81
Comparison based on resultant velocity.
-0.3 -0.2 -0.1 0 0.1 0.2 0.3 0.4 0.5 0.618
19
20
21
22
23
24
25
26
27
28reultant velocity

NCHRP 22_24 Interim Report meeting. Washington 2008-01-11
Robust
. G
RD
1-2
002-7
002
1
82
Validation. All requirements.
• Severity indices:
– ASI THIV
• Barrier behavior.• Deformation (WW, DD).
• Failures (number and location).
• Vehicle:• Trajectories.
• Failures ? (during RR different failures)
• Resultant velocity.
• Yaw rate

NCHRP 22_24 Interim Report meeting. Washington 2008-01-11
Robust
. G
RD
1-2
002-7
002
1
83
Computational mechanics.
• Techniques been developed inside Robust project have been applied to all experimental test case (each test repeated several times):
– Rigid barrier
– Deformable barrier
• Different numerical test houses.
• Results available at:
http://www4.vegvesen.no/ROBUSTDOC/

NCHRP 22_24 Interim Report meeting. Washington 2008-01-11
Robust
. G
RD
1-2
002-7
002
1
84
Conclusion
• Robust produced an huge amount of results that now can be used to revise standards.
• Regarding CM
– Benchmarks
– Procedures
– Experience
Are available for the integration of this method inside the certification process.

NCHRP 22_24 Interim Report meeting. Washington 2008-01-11
Robust
. G
RD
1-2
002-7
002
1
85
Questions?