Embed Size (px)
Citation preview

INFLUENCE OF URBAN LAND POLICIES ON LAND MARKETS AND PEOPLE’S LIVELIHOODS
IN URBAN RWANDAMarch 26th 2015
World Bank Conference on Lands and Poverty 2015Selina Khan

2
OUTLINE
1. Background and Objectives
2. Methodology & Data Collection
3. Survey Findings
4. Conclusions
5. Way Forward
3
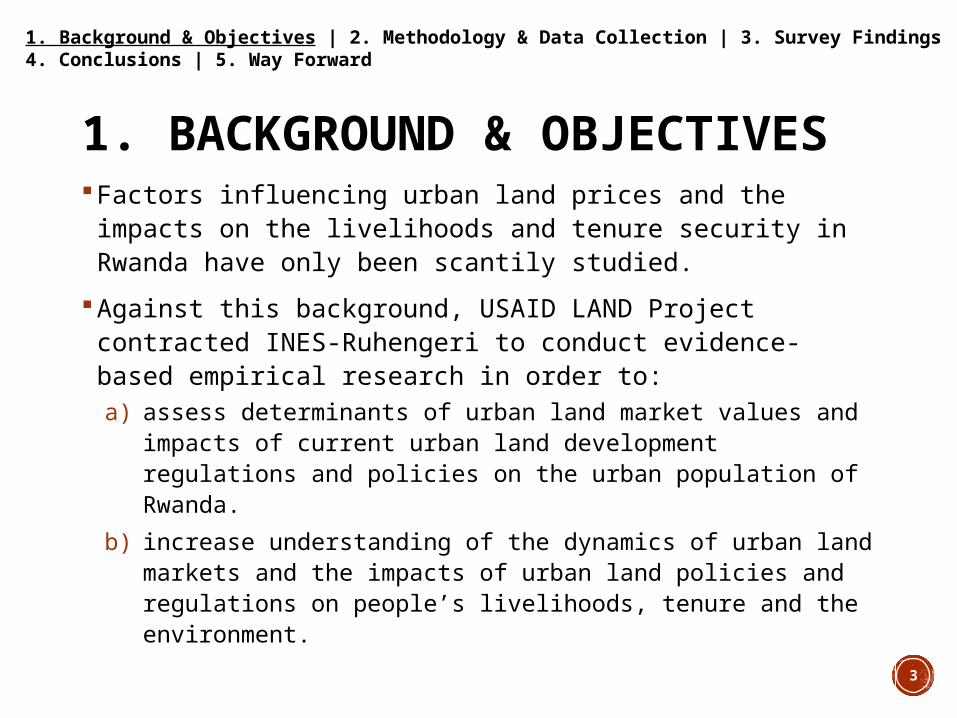
1. BACKGROUND & OBJECTIVES Factors influencing urban land prices and the impacts on the
livelihoods and tenure security in Rwanda have only been scantily studied.
Against this background, USAID LAND Project contracted INES-Ruhengeri to conduct evidence-based empirical research in order to: a) assess determinants of urban land market values and impacts of
current urban land development regulations and policies on the urban population of Rwanda.
b) increase understanding of the dynamics of urban land markets and the impacts of urban land policies and regulations on people’s livelihoods, tenure and the environment.
1. Background & Objectives | 2. Methodology & Data Collection | 3. Preliminary Results | 4. Conclusions | 5. Way Forward1. Background & Objectives | 2. Methodology & Data Collection | 3. Survey Findings | 4. Conclusions | 5. Way Forward

4
To investigate the determinants of urban land values in Rwanda this study employed the Hedonic pricing model (Asset pricing model).
The current situation of land sales and rental markets in urban centers of Rwanda was analyzed using data collected from the survey and available time series information.
The study evaluated impacts/outcomes of existing urban planning and policy measures (Titles, Zoning, Master Plans Expropriation/ Resettlement) and analyzed effects on the following type of outcomes: socioeconomic diversity (gender, income, occupation etc.) of urban population; access to public services and living conditions (education, health, transport etc.); land rights and tenure security; and environmental conditions including access recreational and green areas, water
and sanitation.
2. METHODOLOGY & DATA COLLECTION
1. Background & Objectives | 2. Methodology & Data Collection | 3. Survey Findings | 4. Conclusions | 5. Way Forward

5
Target: population in urban areas of Rwanda
Survey covered all 4 Provinces and the City of Kigali
Multi-Stage Stratified Random Sampling Method1. 1 major town, 1 medium town and 1 small town (sector level) in each province. For the
capital (Kigali City) we selected 15 towns (sectors)
2. Stratification of Cells within the Sectors into high and low income levels
3. Stratification of imidugudu (villages) within the Cells by distance from the main road (approximated by near and far from the main road)
4. Selection of households within the umudugudu (village) by random walk (because of the lack of a household list
Total Sample Size: 1260 households in 27 Sectors (15 in City of Kigali, 12 other Provinces)
1. Background & Objectives | 2. Methodology & Data Collection | 3. Preliminary Results | 4. Conclusions | 5. Way Forward
SAMPLING FRAMEWORK
1. Background & Objectives | 2. Methodology & Data Collection | 3. Survey Findings | 4. Conclusions | 5. Way Forward

6Sectors selected for the study
7
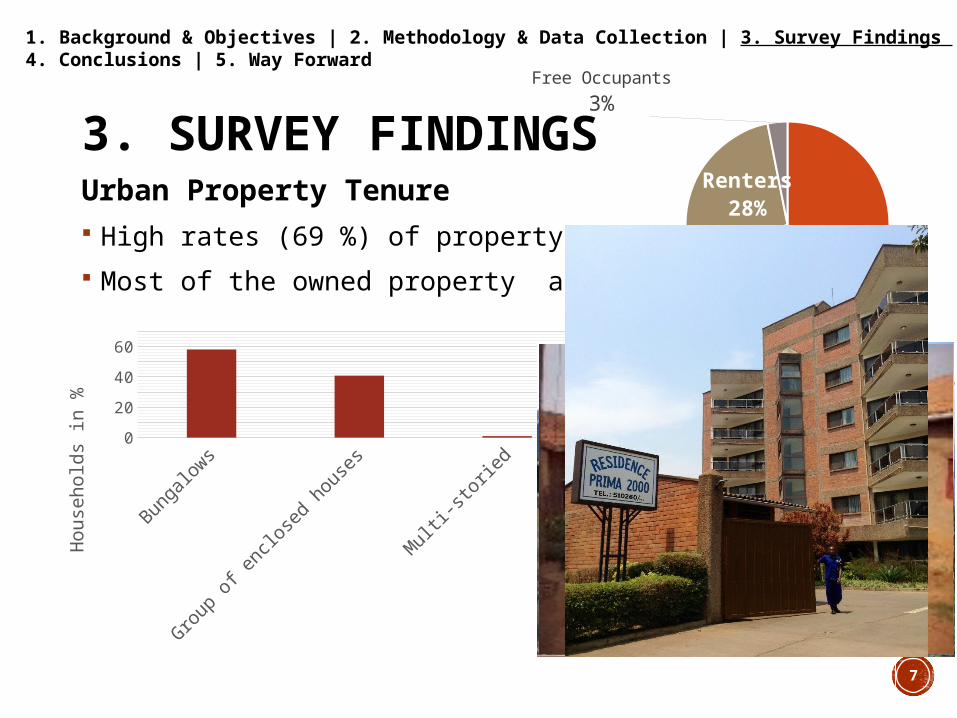
Urban Property Tenure High rates (69 %) of property ownership Most of the owned property are Bungalows
Owner69%
Renters28%
Free Occupants3%
Owner RentersFree Occupants
Bunga
lows
Group
of e
nclo
sed
hous
es
Mul
ti-st
orie
d0
20
40
60
Ho
use
ho
lds
in %
1. Background & Objectives | 2. Methodology & Data Collection | 3. Preliminary Results | 4. Conclusions | 5. Way Forward1. Background & Objectives | 2. Methodology & Data Collection | 3. Survey Findings | 4. Conclusions | 5. Way Forward
3. SURVEY FINDINGS

8
More than two thirds (67 %) of owned urban properties have been acquired through direct market transactions (either bought from owner or developers)
4%
63%8%
21%
4%
Bought from Developer
Bought from Owner
Government allocationDeveloped
26%
Unde-veloped
74%
Developed Undeveloped
Most owners who bought property acquired it as undeveloped land (74 %) compared to only 26 % who bought developed properties
1. Background & Objectives | 2. Methodology & Data Collection | 3. Preliminary Results | 4. Conclusions | 5. Way Forward1. Background & Objectives | 2. Methodology & Data Collection | 3. Survey Findings | 4. Conclusions | 5. Way Forward

9
Current Value of Urban Property Costs and affordability is a major reason behind choices made between
developed and undeveloped properties to buy:o Average current value of undeveloped land: 3.939 Rwf/m² (5,70 $/m²)o Average current value of developed land: 32.215 Rwf/m² (46.66 $/m²)
This pattern applies for all three kind of houses (Bungalow, Group of enclosed, and multi-storied houses)
Further analysis shows it is cheaper to buy undeveloped land and invest in building (i.e. purchase price plus development costs) than buying those properties already developed.
Multi-storied houses are the most expensive houses in terms of their current value:o Current value of multi-storied houses: 182.825 Rwf/m² (264.79 $/m²)o Current value of group of enclosed houses: 35.064 Rwf/m2 (50.78 $/m²)o Current value of bungalows: 26.748 Rwf/m2 (38.74 $/m²)
1. Background & Objectives | 2. Methodology & Data Collection | 3. Preliminary Results | 4. Conclusions | 5. Way Forward1. Background & Objectives | 2. Methodology & Data Collection | 3. Survey Findings | 4. Conclusions | 5. Way Forward

10
Current Value of Urban Property (2) A comparison of average purchase price, cost of development, current
value and total cost of owning properties by District shows:o Highest value is found in Kicukiro and Gasabo (Kigali City);o followed by Rubavu (Western Province);o And distantly followed by Nyarugenge (Kigali City), Musanze
(Northern Province) and Rusizi (Western Province).
Rent per month When it comes to rental rates: o Highest average rent reported in Western Province (e.g. Rubavu):
559 Rwf/m² (0.81 $/m²);o followed by Kigali City: 441 Rwf/m² (0.64 $/m²).
1. Background & Objectives | 2. Methodology & Data Collection | 3. Preliminary Results | 4. Conclusions | 5. Way Forward1. Background & Objectives | 2. Methodology & Data Collection | 3. Survey Findings | 4. Conclusions | 5. Way Forward

11

12
Mortgage Usage 85 % of the population, who
owns property, did not use a mortgage to acquire the same used mortgage to finance
multi-storied properties (36.4 %) – mostly commercial;
Followed by enclosed housing properties (20.5 %);
Only 10.5 % of bungalow owners used mortgages
Bungalow
Group of enclosed houses
Multi-storied
0 20 40 60 80 100
No mortgage used Mortgage used
The above findings suggest that access to mortgage financing of residential development in Rwanda is still limited and seems to be more available for wealthier buyers such as owners of multi-storied properties
1. Background & Objectives | 2. Methodology & Data Collection | 3. Preliminary Results | 4. Conclusions | 5. Way Forward1. Background & Objectives | 2. Methodology & Data Collection | 3. Survey Findings | 4. Conclusions | 5. Way Forward
13
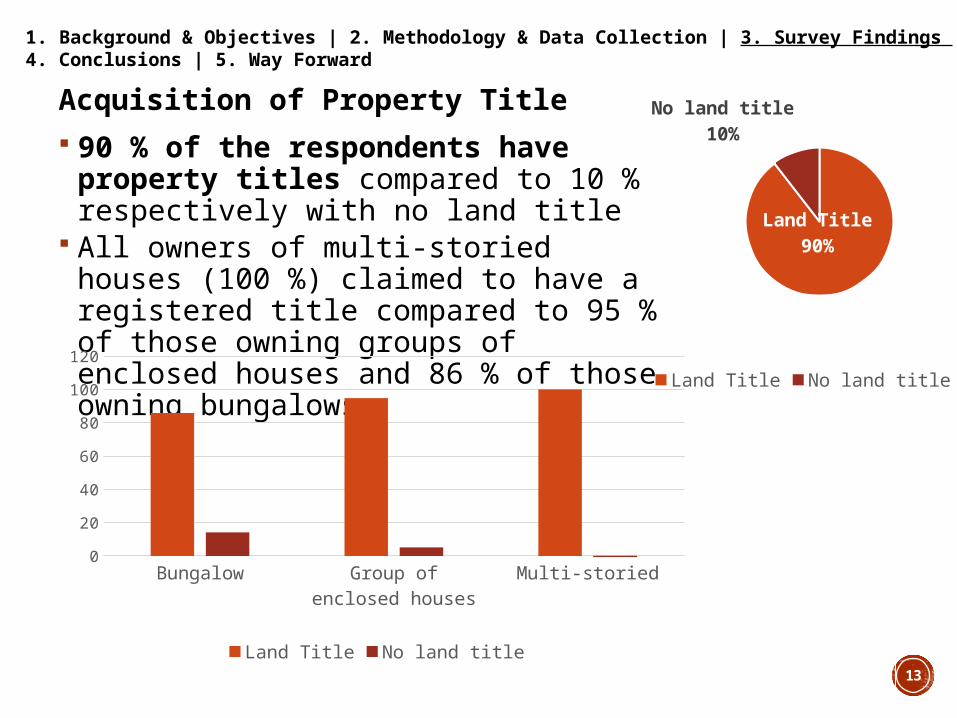
Acquisition of Property Title 90 % of the respondents have property titles
compared to 10 % respectively with no land title All owners of multi-storied houses (100 %)
claimed to have a registered title compared to 95 % of those owning groups of enclosed houses and 86 % of those owning bungalows
Land Title90%
No land title10%
Land Title No land title
Bungalow Group of enclosed houses
Multi-storied0
20
40
60
80
100
120
Land Title No land title
1. Background & Objectives | 2. Methodology & Data Collection | 3. Preliminary Results | 4. Conclusions | 5. Way Forward1. Background & Objectives | 2. Methodology & Data Collection | 3. Survey Findings | 4. Conclusions | 5. Way Forward

14
Acquisition of Property Title (2) Land title acquisition began increasing sharply from 2010 and
continued through 2012 Southern, Western Provinces and Kigali City have larger shares
compared to Eastern and Northern Provinces
2000 2002 2004 2006 2008 2010 2012 20140
50
100
150
200
250
300
350
400
1 4 2 4
36
206
368
143
6
Year of land title aquisition
Nu
mb
er
of
Inh
ab
ita
nts
1. Background & Objectives | 2. Methodology & Data Collection | 3. Preliminary Results | 4. Conclusions | 5. Way Forward1. Background & Objectives | 2. Methodology & Data Collection | 3. Survey Findings | 4. Conclusions | 5. Way Forward

15Institut d’Enseignement Supérieur (INES) – Ruhengeri 9/9

16
Trend Analysis of Urban Property Values and Associated Drivers
1. Background & Objectives | 2. Methodology & Data Collection | 3. Preliminary Results | 4. Conclusions | 5. Way Forward1. Background & Objectives | 2. Methodology & Data Collection | 3. Survey Findings | 4. Conclusions | 5. Way Forward

17
Trend Analysis of Urban Property Values and Associated Drivers (2) This suggests growth in demand for urban land following the return
of people to resettle after the Genocide of 1994 as the rapid urbanization trend line in the Figure reflects for the post 1995 period.
While urbanization rates slowed down after 2005, urban property values began faster growth rates that seem to be influenced by higher growth in income (GDP) as well as possible influences of changes in urban land policies, such as the LTR (Land Tenure Reform) process and planning during that period.
1. Background & Objectives | 2. Methodology & Data Collection | 3. Preliminary Results | 4. Conclusions | 5. Way Forward1. Background & Objectives | 2. Methodology & Data Collection | 3. Survey Findings | 4. Conclusions | 5. Way Forward

18
Trend Analysis of Urban Property Values and Associated Drivers (3) Results show that the two factors “major investments in property
development” and “possession of a property title” are important factor influencing property prices
Regression results depict a noticeable correlation between when the population moved (migration) and urban property value trends
Our survey data on migration seem to agree with secondary data from other sources on the high rate of urbanization
1. Background & Objectives | 2. Methodology & Data Collection | 3. Preliminary Results | 4. Conclusions | 5. Way Forward1. Background & Objectives | 2. Methodology & Data Collection | 3. Survey Findings | 4. Conclusions | 5. Way Forward

19
Trend Analysis of Urban Property Values and Associated Drivers (4)
1. Background & Objectives | 2. Methodology & Data Collection | 3. Preliminary Results | 4. Conclusions | 5. Way Forward1. Background & Objectives | 2. Methodology & Data Collection | 3. Survey Findings | 4. Conclusions | 5. Way Forward

20
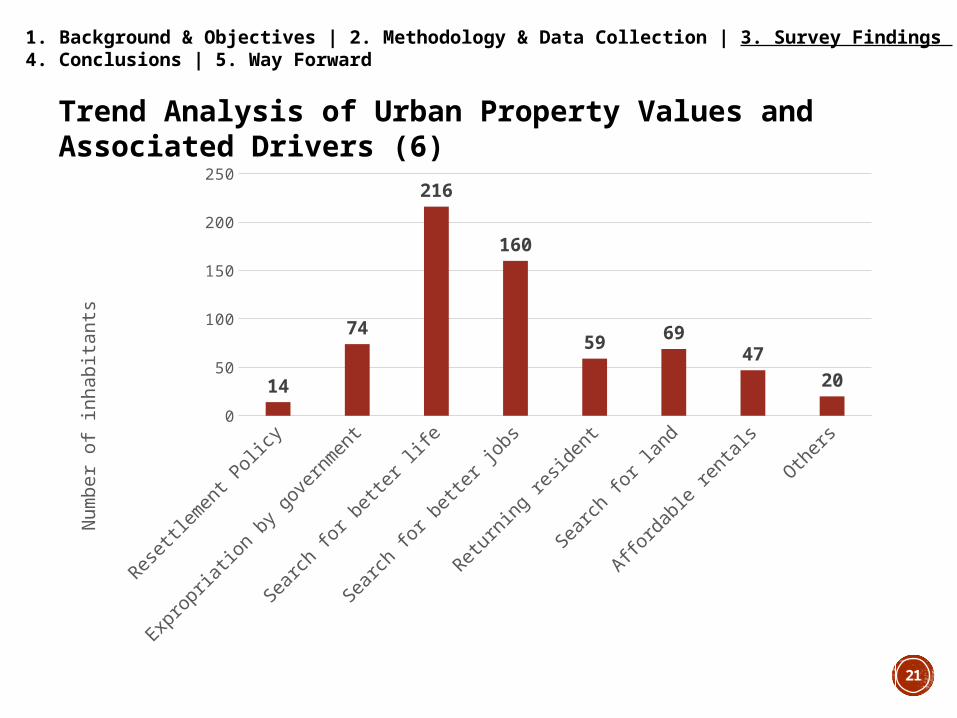
o in search of better life (32.4 %); o in search of better jobs (24 %);o in search for land (10.4 %) oro because they were returning (8.9 %). o The share of respondent who moved to their current urban location
due to resettlement or expropriation by government was 2.1 % and 11.1 %, respectively (high expropriation, low resettlement).
Trend Analysis of Urban Property Values and Associated Drivers (5) Most of those who reported moving from another area indicated that
they moved
1. Background & Objectives | 2. Methodology & Data Collection | 3. Preliminary Results | 4. Conclusions | 5. Way Forward1. Background & Objectives | 2. Methodology & Data Collection | 3. Survey Findings | 4. Conclusions | 5. Way Forward
21
Reset
tlem
ent P
olicy
Expr
opria
tion
by g
over
nmen
t
Sear
ch fo
r bet
ter l
ife
Sear
ch fo
r bet
ter j
obs
Retur
ning
resid
ent
Sear
ch fo
r lan
d
Afforda
ble
rent
als
Other
s0
50
100
150
200
250
14
74
216
160
59 6947
20
Nu
mb
er
of
inh
ab
ita
nts
Trend Analysis of Urban Property Values and Associated Drivers (6)
1. Background & Objectives | 2. Methodology & Data Collection | 3. Preliminary Results | 4. Conclusions | 5. Way Forward1. Background & Objectives | 2. Methodology & Data Collection | 3. Survey Findings | 4. Conclusions | 5. Way Forward
22
Determinants of Urban Property Values• The cost of further developments of the property as well as the time
when such investments were made had modest positive effects on current property values with very high statistical significance• The location of the property also matters as the effect of being in Kigali
has a positive significant effect of 17,866 Rwf (25.88 $) more per m² of property value compared to sampled urban areas in other Provinces. • The type of property (bungalow, group of enclosed house, multi-story
house) and presence of a flush toilets inside the house are the two structural property features showing positive, statistically significant effects.• Access to all weather roads and recreation facilities are two of the
many neighborhood attributes with statistically significant positive influences on property values of 35,103 Rwf (50.84 $) and 23,168 Rwf (33.55 $) per m² respectively.
1. Background & Objectives | 2. Methodology & Data Collection | 3. Preliminary Results | 4. Conclusions | 5. Way Forward1. Background & Objectives | 2. Methodology & Data Collection | 3. Survey Findings | 4. Conclusions | 5. Way Forward

23
Determinants of Urban Property Rental Prices• Rental prices are positively correlated with living in Kigali City
(compared to living outside Kigali in another province),• More structural attributes showed positive and statistically significant
influences on rentals, including number of toilets, number of rooms, and unit size.
• As expected, rents are lower on properties located farther away from the Central Business District and recreational facilities (playgrounds/parks)
• However, being further away from all weather roads seems to be a preferred property attribute as it associated with higher rental rates. This could be due to better environmental or safety conditions (e.g. lower noise, pollution, and traffic risks) when one resides further from primary roads.
1. Background & Objectives | 2. Methodology & Data Collection | 3. Preliminary Results | 4. Conclusions | 5. Way Forward1. Background & Objectives | 2. Methodology & Data Collection | 3. Survey Findings | 4. Conclusions | 5. Way Forward

24
Outcomes of Land Market Trends and Policy Measures
Housing Conditions in Urban Areas Surveys also revealed poor housing conditions in some areas where
24.4 % of houses are built with mud bricks and 8.4 % are built with tree trunks and mud Those living in houses build with such materials are unlikely to
meet city or town housing standards (What solutions?)
Mud Bricks
Mud Bricks with Cement
Burned Bricks
Cement Blocks
Wooden Planks
Stones
Tree Trunks with Mud
Tree Trunks with Mud and Cement
0 5 10 15 20 25 30
1. Background & Objectives | 2. Methodology & Data Collection | 3. Preliminary Results | 4. Conclusions | 5. Way Forward1. Background & Objectives | 2. Methodology & Data Collection | 3. Survey Findings | 4. Conclusions | 5. Way Forward

25
Outcomes of Land Market Trends and Policy Measures (2)
Main Characteristics (Outcomes) of Expropriated/Resettled Groups Expropriated or resettled persons have a lower education: 46.1 % of
respondents have only completed primary school or never went to school
More than 50 % (45 out of 89) of those expropriated or resettled are from low income groups and earning 100.000 Rwf (144.83 $) or less per month
Further gender seems to be a factor for being resettled or expropriated: 58.4 % of female headed households, against 41.6 % of male headed households
1. Background & Objectives | 2. Methodology & Data Collection | 3. Preliminary Results | 4. Conclusions | 5. Way Forward1. Background & Objectives | 2. Methodology & Data Collection | 3. Survey Findings | 4. Conclusions | 5. Way Forward

26
Outcomes of Land Market Trends and Policy Measures (3)
Main Characteristics (Outcomes) on Population in Planned Areas Results show that people possessing a land title are more likely to
reside in areas where zoning has been implemented as compared to areas where the zoning policy is not implemented
020406080
100
Yes, I have a land title No, I don't have a land title
1. Background & Objectives | 2. Methodology & Data Collection | 3. Preliminary Results | 4. Conclusions | 5. Way Forward1. Background & Objectives | 2. Methodology & Data Collection | 3. Survey Findings | 4. Conclusions | 5. Way Forward

27
Outcomes of Land Market Trends and Policy Measures (4)
Main Characteristics (Outcomes) of Population in Planned Areas Regression analysis results showing that the following socioeconomic
attributes are associated more with zoned areas than unzoned areas:o Safety;o Registered Land titles; o Possessing of a high value property (price/m²); o Living in a multi-story or in a group of enclosed houses;o Possessing of a higher level of education
Additional analysis results show that the closer the population lives to the CBD the more likely the population lives in a zoned area
We found no difference in terms of number of people/room between people living in zoned and unzoned areas
1. Background & Objectives | 2. Methodology & Data Collection | 3. Preliminary Results | 4. Conclusions | 5. Way Forward1. Background & Objectives | 2. Methodology & Data Collection | 3. Survey Findings | 4. Conclusions | 5. Way Forward

28
Outcomes of Land Market Trends and Policy Measures (5)
Main Characteristics (Outcomes) of Population in Planned Areas More than a half (56.7 %) of the surveyed population reported they
have not been affected by a Master Plan About 80 % (438 out of 545) of the affected respondents reported
positive effects
80%
14%
1% 5%
Affected positivley Affected negativleyNot affected No answer
1. Background & Objectives | 2. Methodology & Data Collection | 3. Preliminary Results | 4. Conclusions | 5. Way Forward1. Background & Objectives | 2. Methodology & Data Collection | 3. Survey Findings | 4. Conclusions | 5. Way Forward

29
Outcomes of Land Market Trends and Policy Measures (6)
Main Characteristics (Outcomes) of Population in Planned Areas
Bungalow71%
Group of enclosed houses
29%
Multi-storied0%
Zoning Regulations not implemented Bungalow
51%
Group of enclosed houses
48%
Multi-storied2%
Zoning Regulations implemented
BungalowGroup of enclosed housesMulti-storied
1. Background & Objectives | 2. Methodology & Data Collection | 3. Preliminary Results | 4. Conclusions | 5. Way Forward1. Background & Objectives | 2. Methodology & Data Collection | 3. Survey Findings | 4. Conclusions | 5. Way Forward
30
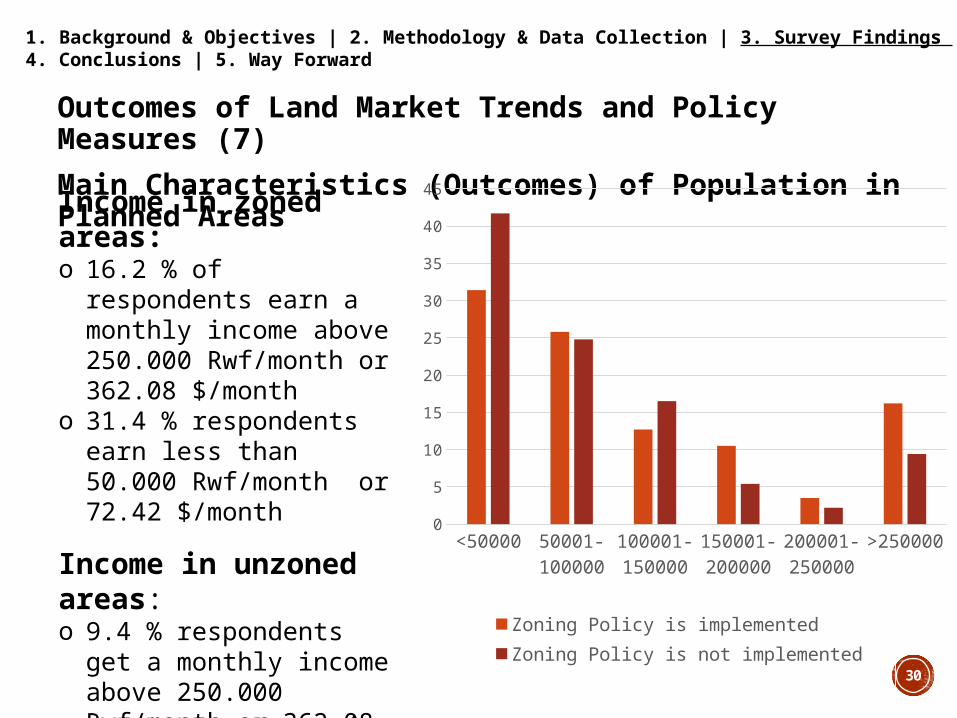
Outcomes of Land Market Trends and Policy Measures (7)
Main Characteristics (Outcomes) of Population in Planned Areas
<50
000
5000
1-10
0000
1000
01-1
5000
0
1500
01-2
0000
0
2000
01-2
5000
0
>25
0000
0
5
10
15
20
25
30
35
40
45
Zoning Policy is implemented Zoning Policy is not implemented
Income in zoned areas: o 16.2 % of respondents earn a
monthly income above 250.000 Rwf/month or 362.08 $/month
o 31.4 % respondents earn less than 50.000 Rwf/month or 72.42 $/month
Income in unzoned areas:o 9.4 % respondents get a
monthly income above 250.000 Rwf/month or 362.08 $/month
o 41.7 % earns less than 50.000 Rwf/month or 72.42 $/month
1. Background & Objectives | 2. Methodology & Data Collection | 3. Preliminary Results | 4. Conclusions | 5. Way Forward1. Background & Objectives | 2. Methodology & Data Collection | 3. Survey Findings | 4. Conclusions | 5. Way Forward

31
Major Achievements:1. Land registration and titling is a very successful process in
Rwanda Titles can be useful to access credit to finance small
business activities. But our study revealed very few used mortgage to acquire or develop property.
moreover an additional research is needed to find out why some people did not collect their land titles
2. In areas where Zoning Policies are implemented the population has better access to public facilities and enjoy better housing standards However, our survey suggest that people living in
unzoned areas have lower socioeconomic status (e.g. education, income, access to public services)
1. Background & Objectives | 2. Methodology & Data Collection | 3. Preliminary Results | 4. Conclusions | 5. Way Forward1. Background & Objectives | 2. Methodology & Data Collection | 3. Survey Findings | 4. Conclusions | 5. Way Forward
4. CONCLUSIONS

32
Major Challenges:
1. Rwanda lacks a National Resettlement Policy (policies only exist for particular projects, e.g. Resettlement Policy Framework for Lake Victoria Environnemental Management Project, 2011 and Rwanda Feeder Roads Development Project, 2013) It is important to have a National Resettlement Policy to
provide adequate compensation and access to main facilities and income and employment opportunities.
2. Expropriation Law/Valuation Law/Compensation Affected population: More than 50 % (45 out of 89) of those
who were expropriated or resettled are from low income groups and earning 100.000 Rwf (US$144.83) or less per month; Also more women (58.4 %) than men (41.6 %) headed HH's were resettled or expropriated
1. Background & Objectives | 2. Methodology & Data Collection | 3. Preliminary Results | 4. Conclusions | 5. Way Forward1. Background & Objectives | 2. Methodology & Data Collection | 3. Survey Findings | 4. Conclusions | 5. Way Forward
33
2. Expropriation Law/Valuation Law/Compensation (2) In our study we found most of the expropriated population
have been compensated financially, but the study could not establish if they had been compensated for other losses associated with the displacement (access to services, schools, transports, jobs etc.)
The study found that more than 30 % of the urban population live in low standard houses with high likelihood of being expropriated. This calls for special attention.
Effects on population: 60 % (9 of 15) in Kigali City reported that their socio-economic status had deteriorated since being expropriated. However, out of the 600 people surveyed, only 17 respondents (3 %) had been expropriated and still lived within Kigali City.
1. Background & Objectives | 2. Methodology & Data Collection | 3. Preliminary Results | 4. Conclusions | 5. Way Forward1. Background & Objectives | 2. Methodology & Data Collection | 3. Survey Findings | 4. Conclusions | 5. Way Forward
34
To improve urban development in Rwanda three major recommendation can be drawn by the research team:
1. Revise master plans to cater for more subsidized housing for low income groups.
Zoning for subsidized housing can be combined with appropriate standards for housing construction that are accessible to the poor.
If socioeconomically diverse and sustainable cities are to become a reality, social housing and other subsidy schemes (e.g. micro finance) for the poor must be made a priority in master planning policy.
2. While they are good reasons for expropriation in the public good, negative impacts particularly on vulnerable social groups
should be mitigated.
3. Further research is needed on those who have been expropriated to assess the impacts on their livelihoods.
1. Background & Objectives | 2. Methodology & Data Collection | 3. Preliminary Results | 4. Conclusions | 5. Way Forward1. Background & Objectives | 2. Methodology & Data Collection | 3. Survey Findings | 4. Conclusions | 5. Way Forward
5. WAY FORWARD

Institut d’Enseignement Supérieur (INES) – Ruhengeri
THANK YOU FOR YOUR ATTENTION!


![For Selina Wallis LC 05.09[1]](https://img.dokumen.tips/doc/110x75/577dac301a28ab223f8d8b51/for-selina-wallis-lc-05091.jpg)