Embed Size (px)
Citation preview

FEASIBILITY ANALYSIS OF VEGETABLE SEED PROPAGATION
TECHNOLOGIES IN ARUMERU AND MVOMERO DISTRICTS, TANZANIA
SELINA PATRICK NOMBO
A DISSERTATION SUBMITTED IN PARTIAL FULFILLMENT OF THE
REQUIREMENTS FOR THE DEGREE OF MASTER OF SCIENCE IN
AGRICULTURAL ECONOMICS OF THE SOKOINE UNIVERSITY OF
AGRICULTURE. MOROGORO, TANZANIA.

2017
ABSTRACT
Improved seed propagation technologies have been proposed as solution to the poor quality of
seedling experienced by vegetable farmers. The use of different technologies among farmers has
shown to have economic implications. This study, therefore, was carried out to assess the
economic advantages of seed propagation technologies and determine constraints facing farmers
in vegetable nursery management in Arumeru and Mvomero districts. The study adopted a cross-
sectional research design. A total of 240 vegetable farmers were randomly selected and
interviewed with the aid of structured questionnaire. Data were analysed using descriptive
statistics, partial budget and binary logit model. Results show that seedling trays and nursery
beds were technologies used to raise vegetable seedlings in the study areas. However, the use of
seedling trays was quite low whereby only about 13% of the vegetable farmers were using them.
The partial budget results show that the use of seedling trays have a positive net income of TZS
32 800/tray and TZS 33 700/tray for tomato and sweet pepper respectively, indicating that it will
be financially beneficial to switch from the use of nursery beds to seedling trays to raise
seedlings. Furthermore, binary logit model results revealed that access to seedling trays (p<0.05),
access to credit (p<0.05), marital status (p<0.05) and access to extension service (p<0.05)
positively and significantly influenced the choice of vegetable seed propagation technology. Pest
and diseases (99%), poor quality of seed (59%) and higher input prices (55%) were the
prominent constraints to nursery management in the study area. Based on the findings it can be
concluded that seedling trays could be used to raise vegetable seedlings with a view of increasing
the efficiency of transplant production.Therefore, it is recommended that the government and

development stakeholders should extend training on technical knowhow aspect of the seedling
trays to reach more vegetable farmers.
DECLARATION
I, Selina Patrick Nombo, do hereby declare to the Senate of neither the Sokoine University of
Agriculture that this dissertation is my own original work done within the period of registration
and that it has neither been submitted nor being concurrently submitted in any other institution.
………………………………. ……………………………..…
Selina Patrick Nombo Date
(MSc. Candidate)
The above declaration is confirmed by,
………………………………. ……………………………..…
Dr. Jeremia R. Makindara Date

(Supervisor)
COPYRIGHT
No part of this dissertation may be reproduced, stored in any retrieval system, or transmitted in
any form or by any means without prior written permission of the author or Sokoine University
of Agriculture in that behalf.


ACKNOWLEDGEMENTS
This dissertation is a product of God’s mercy and assistance. To Him alone belong all the praise
and glory.
I would like to express my sincere gratitudes to a number of contributors who made my study
successful. My special thanks go to my supervisor Dr. Jeremia. R. Makindara for his valuable
guidance, constructive advice, positive critiques and suggestions throughout this study.
Acknowledgment is also extended to Dr. Elias R. Mgembe and Mr. Charles P. Mgeni for their
invaluable pieces of advice and ideas.
I, greatly appreciate the financial and material support from Innovative Agriculture Research
Initiative (iAGRI) under the USAID Feed the Future program through the Sokoine University of
Agriculture, which funded my study.
I am indeed indebted to the districts, village agricultural officers and communities of Mvomero
and Arumeru for their assistance during data collection. My fellow students; Zena Babu, Hanney
Mbwambo, Mathew Mrema, Gloria Sumari, and Jocelyne Mushi for their cooperation during the
entire period of the course and importantly during data analysis. I thank them all.
I will forever be grateful to my dear husband Mr. Richard Nathaniel Moshi for encouraging me
to pursue my goals. His moral support, patient and advice made my journey successful. Last not
least I cannot forget my sister Francisca Nombo for her assistance and moral support during my

entire study, I really appreciate. However, I am entirely responsible for any shortcomings in this
study.
DEDICATION
First and foremost, this work is dedicated to God the Almighty for great things he has done in
my life. Second to my family especially my farther Patrick Josiah Nombo and my mother Jemma
Ernest Nzallawahe, for giving me full support and a lot of prayers while I was undertaking the
MSc. program. My special dedication goes to my lovely daughter Gabriela for her endless love
during my dissertation writing.

TABLE OF CONTENTS
ABSTRACT ......................................................................................................................... ii
DECLARATION................................................................................................................ iii
COPYRIGHT ..................................................................................................................... iv
ACKNOWLEDGEMENTS ............................................................................................... v
DEDICATION.................................................................................................................... vi
TABLE OF CONTENTS ................................................................................................. vii
LIST OF TABLES ............................................................................................................. xi
LIST OF FIGURES .......................................................................................................... xii
LIST OF PLATES ........................................................................................................... xiii
LIST OF APPENDIX ...................................................................................................... xiv
LIST OF ABBREVIATIONS AND SYMBOLS ............................................................ xv
CHAPTER ONE ................................................................................................................. 1
1.0 INTRODUCTION.................................................................................................... 1
1.1 Background Information ............................................................................................ 1
1.1.1 Major vegetable producing areas in Tanzania ............................................. 2
1.1.2 Vegetable production trends in Tanzania .................................................... 4
1.1.3 Characteristics of vegetable sub-sector in Tanzania .................................... 5
1.2 Problem Statement and Justification ......................................................................... 6
1.3 Research Objectives .................................................................................................. 8
1.3.1 Overall objective .......................................................................................... 8
1.3.2 Specific objectives ....................................................................................... 8
1.4 Hypotheses ................................................................................................................ 9
1.5 Organisation of the Study ......................................................................................... 9
CHAPTER TWO .............................................................................................................. 10
2.0 LITERATURE REVIEW .................................................................................... 10
2.1 Theoretical Framework and Empirical Methods ..................................................... 10
2.1.1 The theory underpinning the study ........................................................... 10
2.1.2 Analytical model ........................................................................................ 10
2.1.2.1 Assumptions underlying logistic regression analysis ................... 12
2.1.3 Analysis of cost and benefits associated with vegetable seed
propagation technologies ............................................................................ 12
2.2 Empirical Literature Review .................................................................................... 13
2.2.1 Seed propagation and nursery management .............................................. 13
2.2.1.1 Seeds and seedlings................................................................... 13
2.2.1.2 Nursery and nursery management ............................................ 14
2.2.1.3 Seed propagation ....................................................................... 14
2.2.1.4 Methods of seed propagation .................................................... 15
2.2.2 Review of studies on partial budget analysis ............................................. 18
2.2.3 Review of factors influencing choice and tools for analysis employed ..... 18
2.2.3.1 Farmer characteristics and socio-economic variables ............... 20
2.1.4.4 Institutional factors ................................................................... 21
2.3 Conceptual Framework ........................................................................................... 22
CHAPTER THREE .......................................................................................................... 24
3.0 METHODOLOGY ............................................................................................... 24
3.1 Description of the Study Areas ............................................................................... 24
3.2 Research Design...................................................................................................... 28
3.2.1 Sampling procedure and sample size determination ................................. 28
3.2.2 Types of data ............................................................................................. 29
3.3 Data Collection Methods ........................................................................................ 30
3.4 Data Processing and Analytical Methods ............................................................. 30
3.4.1 Specific objective one ............................................................................... 30
3.4.2 Specific objective two ............................................................................... 31
3.4.2.1 Estimation of components of partial budget ............................. 31
3.4.2.2 Procedure for preparing a partial budget .................................. 33
3.4.2.3 Assumption of the partial budget .............................................. 34
3.4.2.4 Limitation of partial budget ..................................................... 34
3.4.3 Specific objective three .............................................................................. 35
3.4.3.1 Definition of variables included in the model........................... 36
3.4.4 Specific objective four ................................................................................ 37
3.5 Limitation of the Study ............................................................................................ 38
CHAPTER FOUR ............................................................................................................. 39
4.0 RESULTS AND DISCUSSION ............................................................................ 39
4.1 Characterization of Seed Propagation Technology.................................................. 39
4.2.1 Vegetables grown in the study areas ........................................................... 41
4.2.2 Areas under vegetable cultivation in acres ................................................. 41
4.2.3 Type of seeds sown and propagation technologies ..................................... 42
4.2.5 Fertilizer and pesticide application ............................................................. 43

4.2.6 Socio-economic characteristics of surveyed vegetable farmers ................ 44
4.2.6.1 Source of labour ........................................................................ 47
4.2.6.2 Extension service contact and access to credit ......................... 48
4.3 Analysis of Costs and Benefits of Vegetable Seed Propagation Technologies ....... 49
4.3.1 Partial budget for tomato seed propagation in 2014-15 season ................. 49
4.3.2 Partial budget for sweet pepper seed propagation in 2014-15. season ...... 50
4.4 Factors Influencing the Choice of Vegetable Seed Propagation Technologies ....... 51
4.4.1 Marital status ............................................................................................. 52
4.4.2 Access to credit .......................................................................................... 52
4.4.3 Access to seedling trays ............................................................................. 53
4.4.4 Access to extension services ...................................................................... 53
4.5 Constraints Facing Vegetable Farmers in Seedlings Production ............................. 54
4.6 Summary of the Findings ......................................................................................... 55
CHAPTER FIVE .............................................................................................................. 57
5.0 CONCLUSIONS AND RECOMMENDATIONS ............................................... 57
5.1 Conclusions .............................................................................................................. 57
5.2 Recommendations ................................................................................................... 58
5.2.1 Recommendation to farmers ...................................................................... 58
5.2.2 Recommendations to policy makers .......................................................... 59
5.2.3 Area of further research ............................................................................. 59
REFERENCES .................................................................................................................. 60
APPENDENCES ............................................................................................................... 74


LIST OF TABLES
Table 1: Sample size of surveyed villages ..................................................................... 29
Table 2: Partial budget format ....................................................................................... 33
Table 3: Definition of independent variables and their expected results ....................... 37
Table 4: Vegetables grown and seed propagation technologies used ............................ 41
Table 5: Fertilizer and pesticide application in the nursery ........................................... 44
Table 6: Distribution of household characteristics by method of propagation .............. 46
Table 7: Source of labour .............................................................................................. 48
Table 8: Access to extension services and credit........................................................... 48
Table 9: Partial budget results for choosing seedling trays over nursery
beds (Tomato) .................................................................................................. 49
Table 10: Partial budget by choosing seedling trays over nursery beds
(sweet pepper) ................................................................................................. 51
Table 11: A binary logit model results showing factors influencing choice of seed propagation
technology in the study area ............................................................................ 52
Table 12: Constraints facing vegetable farmers in nursery management ........................ 55

LIST OF FIGURES
Figure 1: Major horticultural clusters in Tanzania .......................................................... 3
Figure 2: Trend of vegetable production in Tanzania from 2009-13 .............................. 4
Figure 3: A framework for choice of technology for vegetable seed propagation ........ 23
Figure 4: Map of Arumeru districts showing the study village ..................................... 25
Figure 5: Map of Mvomero district showing the study villages ................................... 27
Figure 6: Seed propagation technologies practiced in the study areas .......................... 40
Figure 7: Average area under vegetable production...................................................... 42
Figure 8: Type of seed used based on the technologies ................................................ 43

LIST OF PLATES
Plate 1: (a) Growers sowing tomato in the trays at Lake Tatu village (b) Seed emerging in
seed trays after 3-5 days (c.) Seedling in trays 20 days after emergence
......................................................................................................................... 40
Plate 2: A farmer display a packet of an improved tomato seed at Lake Tatu
village in Arumeru district............................................................................... 43

LIST OF APPENDIX
Appendix 1: Interview Schedule .................................................................................... 74

LIST OF ABBREVIATIONS AND SYMBOLS
AVRDC Asian Vegetable Research Development Centre
C.I Confidence Interval
CIMMYT Centro Internacional de Mejoramiento de Maíz y Trigo
Cm Centimeter
DAICO Districts Agriculture, Irrigation and Cooperative Officer
E East
ESRF Economic and Social Research Foundation
FAO Food and Agriculture Organization
FAOSTAT Food and Agriculture Organization Statistical Database
FYM Farm Yard Manure
GAP Good Agricultural Practices
GoT Government of Tanzania
Ha Hectare
HODECT Horticultural Development Council of Tanzania
IITA International Institute for Tropical Agriculture
Kg Kilogram
LPM Limited Dependent Model
M Meter
MAFC Ministry of Agriculture, Food Security and Cooperatives
MAFS Ministry of Agriculture and Food Security
Mm Millimeter
MMA Match Maker Associates

MT Metric Tons
NB Nursery Beds
NI Net income
OLS Ordinary Least Square
PASS Private Agriculture Sector Support
S South
S.E Standard Error
SEVIA Seeds of Expertise for the Vegetable Industry in Africa
SIG Significance
SNAL Sokoine National Agricultural Library
SSA Sub Sahara Africa
ST Seedling Trays
TAHA Tanzania Horticultural Association
TAPP Tanzania Agricultural Productivity Program
TR Total Revenue
TZS Tanzania Shillings
VAEO Village Agricultural Extension Officer
VC Variable Cost
VICOBA Village Community Banks
WUR Wageningen University and Research Centre

CHAPTER ONE
1.0 INTRODUCTION
1.1 Background Information
Vegetables are important components of daily diets and source of income, especially in urban
and peri-urban areas. These crops provide a cheap source of proteins, vitamins and other
nutrients which are essential for human health and well-being (James et al., 2010). In addition,
vegetables are effective in preventing micronutrient deficiencies and diseases. As a result, their
demand is high for people who cannot grow them and hence create opportunities for smallholder
farmers as a source of income (Xaba et al., 2013). Vegetables also create a number of job
opportunities in complementary businesses that arise such as marketing, processing, and
transportation (Ajewole and Folayan, 2008). According to Economic and Social Research
Foundation (ESRF), (2010) the demand for horticultural products is projected to grow
significantly in the coming decades, due to an increase in awareness of their nutritional
importance and the resultant increase in their consumption. This offers an opportunity to absorb
an ever-increasing unemployed labour force in Tanzania. Therefore, any efforts to boost
development of the vegetable sub- sector could have a positive impact on the living standard of
people and contribute to food security.
Vegetable could be defined as an edible, usually a succulent plant or a portion of it eaten with
staples as main course or as supplementary food in cooked or raw form (Asian Vegetable
Research Development Centre (AVRDC), 1990). Furthermore, vegetables can be classified into
three categories, depending on a planting practice: a) Vegetables that are usually transplanted,

e.g. chinese cabbage, broccoli, cauliflower, tomato, eggplant, pepper onion b) vegetables that are
usually direct-seeded, e.g. watermelon, cantaloupe, squash, cucumber and c) vegetables that
should be direct-seeded, e.g. radish, amaranth, carrots, beets (Guanzon and Holmer, 2003).
According to Tewari (2009) most of vegetables are self-pollinated plants thus, are propagated by
seed through natural or artificial means.
1.1.1 Major vegetable producing areas in Tanzania
Tanzania is endowed with favourable climatic conditions for growing different vegetable crops,
whereby major producing zones are; Northern Highland zone (Arusha, Kilimanjaro and Tanga)
which represent the highest potential for diverse horticultural investments, Eastern zone (Dar Es
Salaam, Morogoro, Coast and Tanga), Southern Highland zone (Iringa and Mbeya) and Central
and Lake zone (Dodoma, Singida and Mara) see Fig. 1 (MMA, 2017; ESRF, 2010;
Putter et al., 2007; Ministry of Agriculture and Food Security, 2002). It is estimated that
vegetables account for over 50% of all non-staple food production in the country and the average
annual consumption per person is about 30kg and 17 kg in urban and rural areas, respectively
(Private Agriculture Sector Support (PASS), 2013). According to FAOSTAT (2014) at national
level, area under vegetable is about 17.6% of all the crops.

Figure 1: Major horticultural clusters in Tanzania
(Source: MMA, 2017).
NB: The cycle though not draw to scale, provides a proxy of significance of the cluster in terms
of potential land availability and current production volume in different market.


1.1.2 Vegetable production trends in Tanzania
Vegetable production increased from 1.3 million metric tons in 2003 to 2.6 million metric tons in
2013, with an annual growth rate of 13.4% (FAOSTAT, 2014). However, these production
levels are way below the projected 10.3 million metric for the year 2000 (AVRDC, 1990). This
implies that despite the favourable climatic conditions for vegetable production in Tanzania the
potential is not fully realised. Moreover, compared to other East African countries, Tanzania is
not doing well in terms of productivity despite its comparative advantage of climatic conditions
(reliable and well distributed rainfall), and abundant manpower/labor supply (ESRF, 2010). For
instance, according to FAO statistics (2013) Kenya was ranked 90th
vegetable producer in the
world, producing about 142 000MT/ha whereas Tanzania was ranked 154th
with a
productivity level of about 72 000MT/ha (FAOSTAT, 2014).
Figure 2: Trend of vegetable production in Tanzania from 2009-13
(Source: FAOSTAT, 2014).
1.1.3 Characteristics of vegetable sub-sector in Tanzania
Vegetable sub-sector in Tanzania is dominated by small-scale farmers with less than 2 hectares,
who account for 70% of vegetable producers (Tanzania Horticulture Association (TAHA),
2011). Nonetheless, the dominance of small-scale farmers in vegetable production presents an
opportunity for poverty reduction through an increase in income and employment creation
(James et al., 2010; ESRF, 2010). Despite these facts vegetable crop productivity is low and this
is attributed partly to use of poor technologies such as use of traditional seed and propagation
methods which result in poor quality seedlings, among other factors (Temu, 2006; FAO, 2013;
AVRDC, 2014). Seed propagation technologies are the facilities for growing transplants

(AVRDC, 1990). The first step in propagating seedling is to acquire the seed and the conditions
may include, but are not limited, to placing of seeds close together in moist sand to help them
germinate, scarification, alternating temperatures and chemical treatments (Ratha et al., 2014).
Poor seed propagation technologies could result to the fungal infection of seedlings, commonly
known as damping-off which affects the quality of seedlings and is usually caused by excessive
moisture and more air circulation (Bok et al., 2006).
Moreover,vegetable production in Tanzania is also constrained by poor quality of seed and
planting materials (MAFS, 2002). This reduces potential for smallholder farmers to meet the
growing demand for vegetables in both developed countries and in their own urban centers
(FAO, 2003). Therefore, use of improved nursery technologies to raise vegetable seedlings such
as seedling trays could overcome the constraints in vegetable production.
However, it is argued that that many farmers use traditional farming methods of seed
propagation, including sowing by broadcasting untreated seeds in nursery beds which reduces
the possibility of obtaining good quality seedlings (Seeds of Expertise for the Vegetable Industry
in Africa (SEVIA), 2014; Horticultural Development Council of Tanzania (HEDOCT), 2010).
Seedling handling methods and management practices at nursery level contribute to their
survival rate after transplanting and their subsequent growth performance and productivity
(Munjunga et al., 2013). Therefore, this study intends to analyse vegetable seed propagation
technologies and factors driving smallholder vegetable growers to use new technologies in the
study areas.
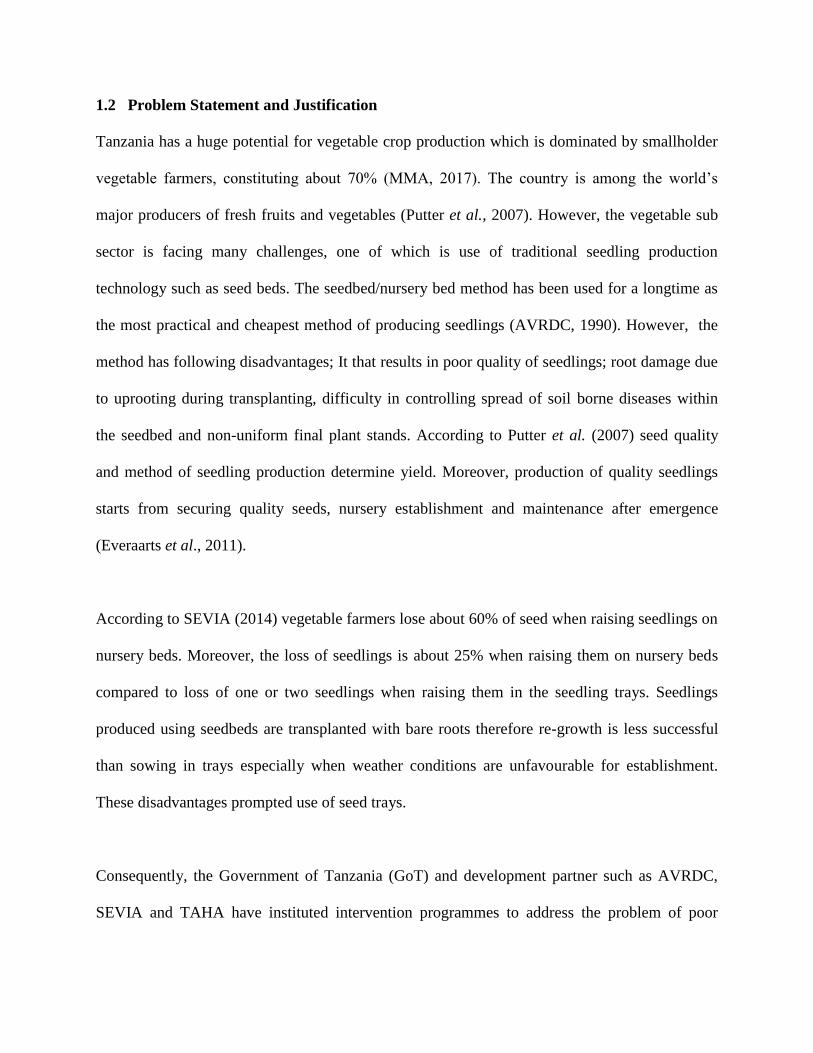
1.2 Problem Statement and Justification
Tanzania has a huge potential for vegetable crop production which is dominated by smallholder
vegetable farmers, constituting about 70% (MMA, 2017). The country is among the world’s
major producers of fresh fruits and vegetables (Putter et al., 2007). However, the vegetable sub
sector is facing many challenges, one of which is use of traditional seedling production
technology such as seed beds. The seedbed/nursery bed method has been used for a longtime as
the most practical and cheapest method of producing seedlings (AVRDC, 1990). However, the
method has following disadvantages; It that results in poor quality of seedlings; root damage due
to uprooting during transplanting, difficulty in controlling spread of soil borne diseases within
the seedbed and non-uniform final plant stands. According to Putter et al. (2007) seed quality
and method of seedling production determine yield. Moreover, production of quality seedlings
starts from securing quality seeds, nursery establishment and maintenance after emergence
(Everaarts et al., 2011).
According to SEVIA (2014) vegetable farmers lose about 60% of seed when raising seedlings on
nursery beds. Moreover, the loss of seedlings is about 25% when raising them on nursery beds
compared to loss of one or two seedlings when raising them in the seedling trays. Seedlings
produced using seedbeds are transplanted with bare roots therefore re-growth is less successful
than sowing in trays especially when weather conditions are unfavourable for establishment.
These disadvantages prompted use of seed trays.
Consequently, the Government of Tanzania (GoT) and development partner such as AVRDC,
SEVIA and TAHA have instituted intervention programmes to address the problem of poor

quality seedlings by introducing the seedling trays method in raising seedlings in the vegetable
potential zones (AVRDC, 2014; SEVIA, 2014; TAPP, 2012). The technology has shown to be
effective in improving quality of seedlings as they have been designed in a way that provide an
independent area for each seed to germinate and grow with good air circulation and drainage
(Bhimraj, 2011). Furthermore, Everaarts et al. (2011) argued that the efficiency of transplant
production could be increased by raising seedlings in trays. Moreover, research done by SEVIA
(2014) claim that the use of seedlings trays yielded about 25% to 48% more plants and seed use
efficiency of 70% more than nursery beds. However, despite the stated advantages of seedling
trays most farmers are still using the nursery beds and the reasons for that has not been fully
established (TAPP, 2012).
Several studies have been conducted on vegetable nursery management and adoption of
technologies such as (Emana et al., 2015; AVRDC, 2014; Odiaka et al., 2013; Asaduzzaman et
al., 2011; Nwalieji and Ajayi, 2009) but in Tanzania little has been done to assess benefits and
cost of seedling production technologies. Thus, farmers could be interested in shifting from
traditional to improved seedling production technology but are not well informed on the
economic advantages of these technologies.
Therefore, this study was initiated to address the gap by identifying factors influencing farmers’
choice of seed propagation technologies by focusing on seedling trays. Moreover, investing in a
given seed propagation technology may also provide information on expected profit to farmers
based on the technology used which is also lacking among farmers. Therefore, analysis of costs
and benefits would provide evidence of expected gains from the proposed technology. Findings

from this study are intended to be used by policy makers, farmers and other development
agencies with interest in increasing production and strengthening the vegetable sub- sector in the
study areas and in Tanzania in general.
1.3 Research Objectives
1.3.1 Overall objective
The overall objective of the study was to assess the economic potential of vegetable seed
propagation technologies and factors influencing their choice among farmers in Arumeru and
Mvomero districts.
1.3.2 Specific objectives
The specific objectives were:
To characterize vegetable nursery seed propagation technologies practiced in the study
areas;
To analyse costs and benefits associated with vegetable nursery seed propagation
technologies used in the study areas;
To determine factors influencing the choice of vegetable nursery seed propagation
technologies in the study areas; and
To determine constraints facing farmers in vegetable nursery management practices in
the study areas.
1.4 Hypotheses
The second and third objectives were addressed by testing research hypotheses as follows;
There is no significant difference in costs between seedling trays and nursery beds as
seed propagation technologies.

Years of experience, sex, age, access to trays, farm group membership, access to credit,
family size, marital status and access to extension service do not influence farmers’
choice of vegetable seed propagation technology.
1.5 Organisation of the Study
The study is organized into five chapters whereby chapter one provides an overview of the
horticultural and the vegetable sub-sector in Tanzania. Other sections included are the problem
statement, study objectives, hypotheses, and organization of the study. Chapter two presents,
theoretical framework, analytical model, empirical review and conceptual framework. Chapter
three outlines the methodologies including the sampling procedures, data collection and
analytical procedures. It also presents a theoretical and empirical model for determining the
relevance of the study. Chapter four presents the study findings and discussion. Finally, chapter
five presents the conclusion and recommendations.

CHAPTER TWO
2.0 LITERATURE REVIEW
2.1 Theoretical Framework and Empirical Methods
2.1.1 The theory underpinning the study
This study is guided by the theory of the firm. The theory of the firm is the micro economic
concept founded in neo-classical economic which states that firm/producer exists and makes
decisions to maximize profits (Nicholson and Snyder, 2007). From the neo- classical theory, a
firm/producer faces choice of what, how and how much to produce given the available scarce
resources and technology (Oliver, 2008). This means a farmer will try to combine the input
factors so as to maximize profit or minimizing cost of producing certain level of output.
In the theory of the firm, the behaviour of a particular farmer is said to be driven by profit
maximization (Nicholson and Snyder, 2007). Therefore, a farmer makes his decision based on all
his current information, his forward looking expectations and the relative costs and benefits of
the two types of seed propagation technologies. Moreover, farmers may be motivated to choose a
technology on the basis of their attitudes towards risk, the utility derived from production and for
profit reasons (Samboko, 2011). Therefore, a farmer is assumed to take account of available
information on potential costs and benefits in determining preference and to act consistently in
choosing the self-determined best choice of action. This means, vegetable growers will opt
whether or not to use the seedling trays to raise seedlings based on the information they have
about the technology.
2.1.2 Analytical model
Choice models are normally used to assess the behaviour of a decision maker when faced with a
set of alternative (Green, 2012). The model assumes that a decision maker, make a decision with
the objective of maximizing profit (Green, 2012). The model relates the probability of choosing a

given alternative which is specific to each individual and characteristics of the decision maker.
According to Green (2012) when the choice involves two alternatives the binary choice models
are normally used. Various studies have specified logit or probit model to explain whether or not
a farmer choose to use a given technology (Rasheli and Temu, 2014; Tesfu, 2014; Asaduzzaman
et al., 2011; Chaves and Riley 2001; Doss and Morris (2001); Adesina et al., 2000).
Amemiya (1981) argues that both probit and logit model are statistically similar, although the
parameter estimates may differ. He suggested that the difference between logit and probit model
lies on the assumption about the distribution of errors; the probit model assumes a standard
normal distribution while logit model assumes a standard logistic distribution of error. However,
Sellar et al. (1986) argued that a logit model has a number of advantages for binary choices; first,
its estimation is relatively simple; second, it usually provides a good approximation to the probit
model. Moreover, Montgomery et al. (2001) argued that probit models lack flexibility in that
they do not easily incorporate more than one prediction variable unlike logit models. However,
the choice between the two models is normally based on researcher’s convenience and the data
generating process which is unknown.
This study therefore, employed a binary logit model in empirical analysis because the dependend
variable (method of seed propagation) is categorical whereby a farmer choose the technology if
there is a positive marginal net benefit compared to that of not choosing it. Therefore, the
determination of the factors influencing the choice of agricultural technology using logit model
is appropriate but not indicated with the ordinary least square regression as the estimates may be
biased (Nchinda et al., 2010). Equally, the use of linear probability model (LPM) may end in

predicting values that may fall outside the 0 – 1 interval, thereby violating the basic tenets of
probability (Ajewole, 2010).
2.1.2.1 Assumptions underlying logistic regression analysis
Logistic regression does not assume a linear relationship between the dependent and
independent variables;
The dependent variable must be a dichotomy (2 categories);
The model is not sensitive to violation of the homoscedasticity and normality assumption
of error term.
The categories (groups) must be mutually exclusive and exhaustive; a case can only be in
one group and every case must be a member of one of the groups; and
Larger samples are needed than for linear regression because maximum likelihood
coefficients are large sample estimates (Gujarat, 2003).
2.1.3 Analysis of cost and benefits associated with vegetable seed propagation
technologies
The partial budget analysis is a simple but effective technique of analysing differences in costs
and benefits between two or more technologies and estimate profitability (Upton, 1987). Castle
et al. (1987) argue that a partial budget can be used on farms when changes are being made, such
as converting from one enterprise to another, or analysing several enterprises and their
interchangeability. According to CIMMYT (1988), the partial budget can go beyond just putting
figures together, to help a farmer to define the reason or reasons for a change. It gives alternative
changes that can be made and eventually help the farmer to decide whether the proposed change
will be worth it in the long run.
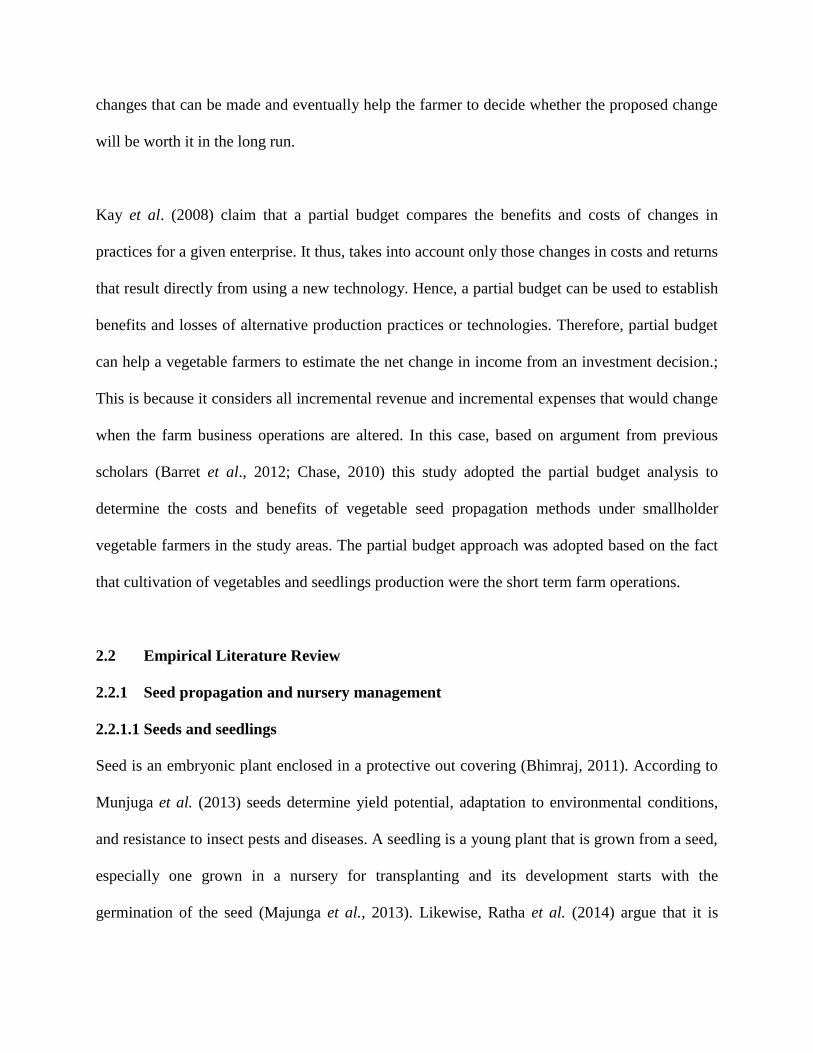
Kay et al. (2008) claim that a partial budget compares the benefits and costs of changes in
practices for a given enterprise. It thus, takes into account only those changes in costs and returns
that result directly from using a new technology. Hence, a partial budget can be used to establish
benefits and losses of alternative production practices or technologies. Therefore, partial budget
can help a vegetable farmers to estimate the net change in income from an investment decision.;
This is because it considers all incremental revenue and incremental expenses that would change
when the farm business operations are altered. In this case, based on argument from previous
scholars (Barret et al., 2012; Chase, 2010) this study adopted the partial budget analysis to
determine the costs and benefits of vegetable seed propagation methods under smallholder
vegetable farmers in the study areas. The partial budget approach was adopted based on the fact
that cultivation of vegetables and seedlings production were the short term farm operations.
2.2 Empirical Literature Review
2.2.1 Seed propagation and nursery management
2.2.1.1 Seeds and seedlings
Seed is an embryonic plant enclosed in a protective out covering (Bhimraj, 2011). According to
Munjuga et al. (2013) seeds determine yield potential, adaptation to environmental conditions,
and resistance to insect pests and diseases. A seedling is a young plant that is grown from a seed,
especially one grown in a nursery for transplanting and its development starts with the
germination of the seed (Majunga et al., 2013). Likewise, Ratha et al. (2014) argue that it is

important to raise insect pest and disease free seedlings from an early stage to ensure good plant
growth performance and avoid yield losses.
2.2.1.2 Nursery and nursery management
A vegetable nursery is a place or an establishment for raising or handling of young vegetable
seedlings until they are ready for more permanent planting (Munjuga et al., 2013). Very small
seeded vegetables require special care during their early growth stage. These are first sown in the
nursery for better care and thereafter can be transplanted in the main field (Tewari, 2009).
According to Bhimraj (2011) nursery is the best for future vegetable development and it depends
on its physical and financial resources. Therefore, nursery can be a profitable venture when
planned thoroughly. In this study farmers raised their own seedlings in the nursery before
transplanting them in the main field thereafter.
Nursery management refers to activities and practices undertaken to better care for younger
plants against pathogenic infections, insect pests, weeds, fertilization, watering, thinning and
hardening off (Munjunga et al., 2013). Good quality seedlings cannot be produced without care,
therefore nursery plants need to be protected from extremes environmental conditions until they
are strong enough (Munjuga et al., 2013). In this study, farmers were responsible for taking care
of the plants in the nursery. This involves insect pest and disease management through
application of agrochemicals.
2.2.1.3 Seed propagation
Seed propagation is the process of creating new more plants from seeds and the condition of the
seed is very important. The first step in successful vegetable production is to raise healthy and

vigorous seedlings (Kumar et al., 2004). According to Veiheij (2004) raising seedling is the most
important means of developing cultivars in plant breeding. This is because young plants
propagated from seeds require a lot of care, particularly during the early stages of growth (Ratha
et al., 2014). Therefore, they have to be protected from adverse climatic conditions such as
temperatures, heavy rains, drought, wind as well as pests and diseases. Consequently, to
overcome these problems, many vegetable crops are raised in nurseries before being transplanted
in the field. According to AVRDC (2014), there are three main facilities that are used for raising
seedlings in a nursery, which include; greenhouses where the environment is fully controlled, net
house whose environment is partially modified and open field where climatic conditions are
considered favourable for the crops grown. Thus, the choice for the facility are determined by
available resources and prevailing environmental conditions.
2.2.1.4 Methods of seed propagation
Generally, in this study four methods of seed propagation are discussed. These are direct field
planting, raising transplants in the nursery beds, raising seedlings in containers and raising
seedlings in seedling trays.
(i) Direct field planting
Direct field planting according to Verheij (2004) involves gathering of seeds by farmers and sow
them directly in the field. Before sowing the soil is loosened to improve water infiltration. This
facilitates germination and fast growth of the crop. According to Erika (2013), direct field
planting of small seeded vegetable crops often result in poor germination and stunted growth,
resulting in delayed maturity and low yield. Moreover, Hatutale (2010), argue that direct field
planting is more laborious and a costly activity, which should be carried out to ensure a good
plant, stand.
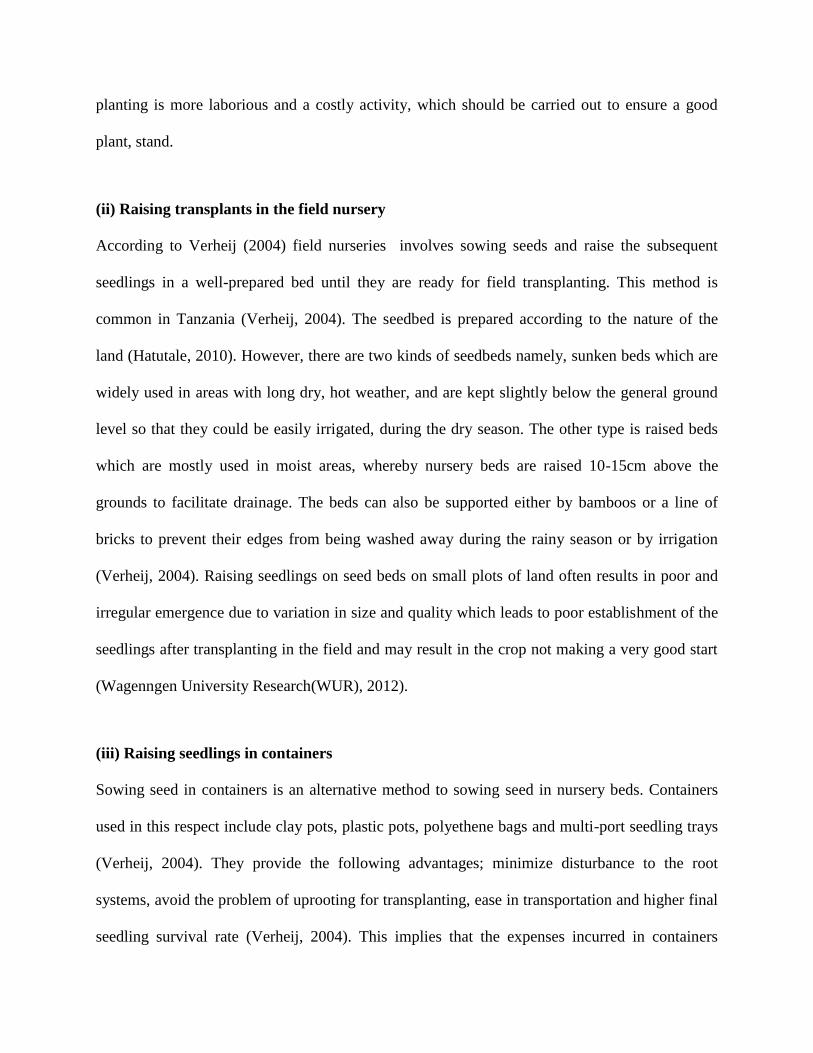
(ii) Raising transplants in the field nursery
According to Verheij (2004) field nurseries involves sowing seeds and raise the subsequent
seedlings in a well-prepared bed until they are ready for field transplanting. This method is
common in Tanzania (Verheij, 2004). The seedbed is prepared according to the nature of the
land (Hatutale, 2010). However, there are two kinds of seedbeds namely, sunken beds which are
widely used in areas with long dry, hot weather, and are kept slightly below the general ground
level so that they could be easily irrigated, during the dry season. The other type is raised beds
which are mostly used in moist areas, whereby nursery beds are raised 10-15cm above the
grounds to facilitate drainage. The beds can also be supported either by bamboos or a line of
bricks to prevent their edges from being washed away during the rainy season or by irrigation
(Verheij, 2004). Raising seedlings on seed beds on small plots of land often results in poor and
irregular emergence due to variation in size and quality which leads to poor establishment of the
seedlings after transplanting in the field and may result in the crop not making a very good start
(Wagenngen University Research(WUR), 2012).
(iii) Raising seedlings in containers
Sowing seed in containers is an alternative method to sowing seed in nursery beds. Containers
used in this respect include clay pots, plastic pots, polyethene bags and multi-port seedling trays
(Verheij, 2004). They provide the following advantages; minimize disturbance to the root
systems, avoid the problem of uprooting for transplanting, ease in transportation and higher final
seedling survival rate (Verheij, 2004). This implies that the expenses incurred in containers
would be offset by high profit margins emanating from good quality planting materials, and
consequently high yield (Kumar et al., 2004).
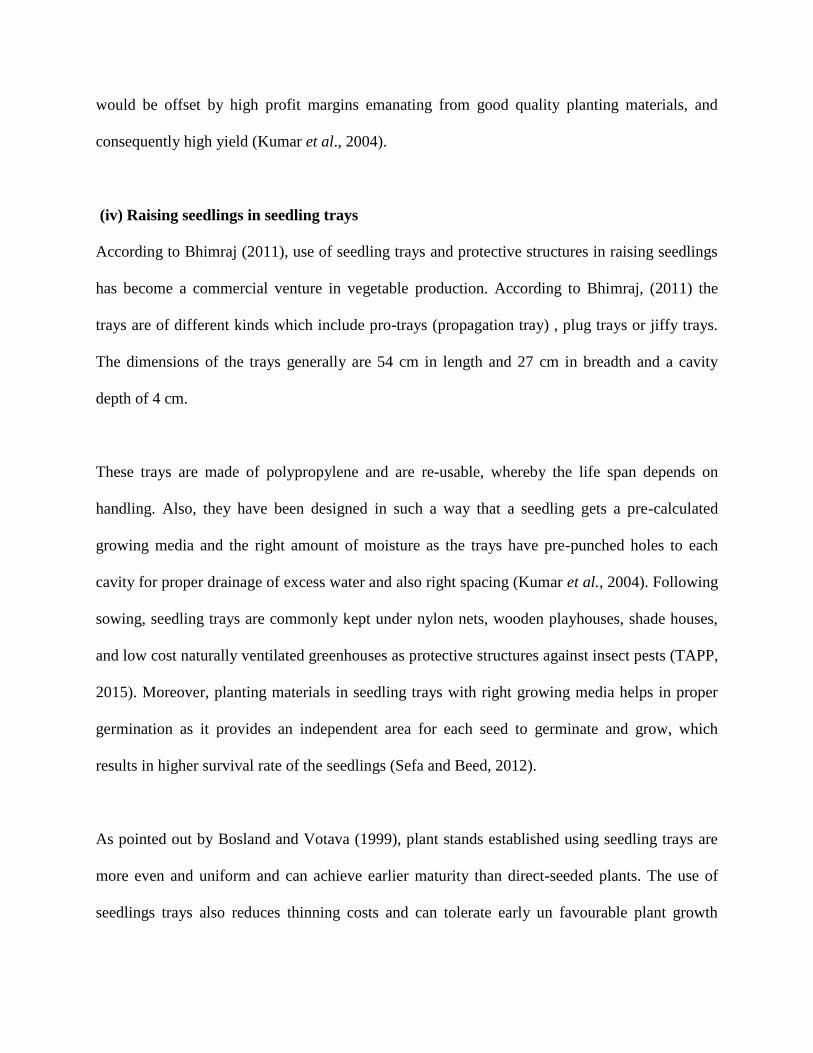
(iv) Raising seedlings in seedling trays
According to Bhimraj (2011), use of seedling trays and protective structures in raising seedlings
has become a commercial venture in vegetable production. According to Bhimraj, (2011) the
trays are of different kinds which include pro-trays (propagation tray) , plug trays or jiffy trays.
The dimensions of the trays generally are 54 cm in length and 27 cm in breadth and a cavity
depth of 4 cm.
These trays are made of polypropylene and are re-usable, whereby the life span depends on
handling. Also, they have been designed in such a way that a seedling gets a pre-calculated
growing media and the right amount of moisture as the trays have pre-punched holes to each
cavity for proper drainage of excess water and also right spacing (Kumar et al., 2004). Following
sowing, seedling trays are commonly kept under nylon nets, wooden playhouses, shade houses,
and low cost naturally ventilated greenhouses as protective structures against insect pests (TAPP,
2015). Moreover, planting materials in seedling trays with right growing media helps in proper
germination as it provides an independent area for each seed to germinate and grow, which
results in higher survival rate of the seedlings (Sefa and Beed, 2012).
As pointed out by Bosland and Votava (1999), plant stands established using seedling trays are
more even and uniform and can achieve earlier maturity than direct-seeded plants. The use of
seedlings trays also reduces thinning costs and can tolerate early un favourable plant growth

conditions. According to TAPP (2015), the advantages of trays include reduced damping-off
disease, improved germination and saving many expensive seeds. Damping-off is a fungal
seedling disease caused by Rhizoctonia and Pythium genera. The disease is favored by warm and
wet conditions, water-soaked lesions on the stem of seedlings at the point of contact with the soil
is one of the symptoms. The lesions soften the stem, causing the seedling to lodge and eventually
dry up and die (AVRDC, 1990).
2.2.2 Review of studies on partial budget analysis
Horton (1982) adopted a partial budget to assess the net gain of using recommended seed
technology in potato production and argued that the use of improved seed technology can be
considered to have an economic advantages over use of the farmers own seed technology. Barrett
et al. (2012) used partial budget analysis to estimate the cost benefits of using grafted transplants
for root-knot nematode management in organic heirloom tomato production whereby their
findings show that under severe root-knot nematode pressure, grafting may be an economically
feasible measure to help maintain a profitable production.
Adeayo et al. (2011) used farm budget analysis to estimate the production cost, revenue and
gross margin accruable to the farmers when examining the economic analysis of watermelon
based production system in Oyo State Nigeria. They argue that gross margin per hectare
generated by sole watermelon farms was lower than on farms that were intercropped between
watermelon with cassava. Also, Chase (2010) employed partial budget to determine the
profitability of changing carrots production practices and claimed that if the production change
was implemented it would increase yield and profitability by $38.50 per bed.

2.2.3 Review of factors influencing choice and tools for analysis employed
Doss (2006) suggested that a very important way of improving agricultural productivity in
developing countries is through use of improved technologies, which will provide force in
improving output and eventually improving lives of farmers. Bonabana-Wabi (2002) claims that
factors such as government policies toward a technology, technological changes, markets forces,
environmental factors, demographic factors and institutional factors do influence the choice of a
given technology.
Banerjee and Martin (2009) conducted a study on factors influencing the choice of cotton
modified seed using logit model whereby they claim that the decision as to whether or not to use
modified seed is influenced by age, sex, total land size owned by the household, access to
financial institutions, education level, and information flow. Moreover, Odiaka et al. (2013)
conducted a study on the adoption of technologies in vegetable production using logit model and
established that year of experiences, income and sex were significant and positively influenced
the choice of technology. In addition, Idrisa et al. (2012) estimated the determinants of adoption
of improved soybean seedling production technology and found that, farm size, access to credit,
farming experiences and expenditure on labour do influence the choice of a certain technology.
In a study conducted by Nchinda et al. (2010), using a tobit model, was found that age, mixed
cropping, hired labour and membership in farmers organizations positively and significantly
influenced adoption of improved yam seed technology. Furthermore, Schultz (1995) cited by
Tesfu (2014) claimed that the probability of adopting of a new technology will depend on the
difference in profitability between the new and old technologies, and the ability of farmers to
perceive the advantages and efficiently utilize a new technology.

Asaduzzaman et al. (2011) used a binary logit model to analyse factors that influence the choice
of different homestead vegetables gardening technologies in rural Bangladesh and established
that education, sex, and the garden size significantly influenced homestead gardening. In
additional, Rasheli and Temu (2014) study on the market governance among smallholder
vegetable farmers in Mgeta Tanzania, whereby they employed a binary logistic model to
determine socio- economic factors influencing farmers’ choice on market governance, and found
that education level, sex, and farming experience positively influenced the choice of market
governance.
Futhermore, Grove et al. (2006) argue that socio-economic characteristics have important
implications on the use of available technology and resources. They argue further that an
understanding of the general social and cultural behaviour and attitudes of the people in the areas
it is important since. these characteristics have some implications in farming decision making,
Therefore, it is important to describe household characteristics of the respondents so that a
general picture is understood. Therefore, based on the scholarly literature, data available and
from a theory, a range of household, farm characteristics, and institutional factors were
hypothesized to influence the choice of seed propagation technology by smallholder vegetable
farmers in the study areas. These factors are credit access, age, farm group membership and
contact with extension services, among other factors.
2.2.3.1 Farmer characteristics and socio-economic variables
(i) Age of the respondents
Age has been explained differently by different researchers on influencing choice of technology.
Some researchers found that age positively influence adoption whereby old farmers are assumed
to adopt a technology because they have accumulated capital or have greater access to credit, due
to their age (Bekele and Drake, 2003; Etoundi and Dia, 2008). In additional CIMMYT (1993)

claim that older farmers may have more experience, resources or authority that would give them
more possibilities for trying new innovations. However, as farmers advance in age, risk aversion
increases and adopting a new technology seems less likely (Simtowe et al., 2007).
(ii) Sex of respondents
Abunga et al. (2012) claims that the rate of technology adoption is higher among males
compared to female because of discrimination, suggesting that women have less access to
productive resources such as land, labour and capital, which are critical for adoption of
technologies. Nonetheless, males and females perceive situations differently. Moreover,
regarding sex, CIMMYT (1993) claimed that since women play a key role in most agricultural
systems, it is important to consider the degree to which a new technology reaches female
farmers.
(iii) Farming experience
Experienced farmers are assumed to have tried out a number of profitable technologies as
experience helps an individual to think of a better way (Rahman, 2007). With experience comes
knowledge, a universally accepted truth (Meijer et al., 2015). So experience can influence the
decision to use a new technology ceteris peribus.
(iv) Farm group membership
Affiliation to farmer groups increase social capital and allows exchange of new ideas between
farmers (Asaduzzaman et al., 2011). Farmer groups afford their members a wide opportunity for
educating each other. Nkamleu (2007) argues that group affiliation enables farmers to learn
about technology via other farmers and from development partners.
(v) Household size
Household size is used as proxy for labour availability in the family. According to Owombo et
al. (2012) farming in most rural areas depend on manpower and largely family labour; therefore
family size is associated with labour availability for timely operation of farm activities.
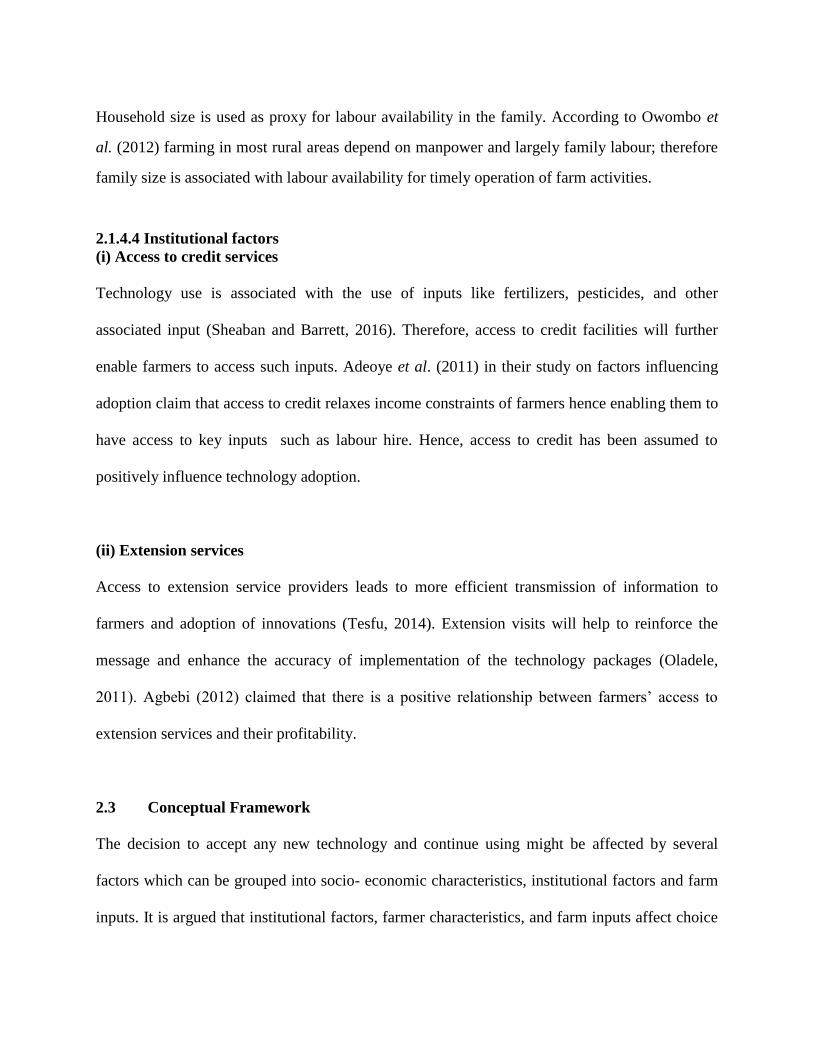
2.1.4.4 Institutional factors
(i) Access to credit services
Technology use is associated with the use of inputs like fertilizers, pesticides, and other
associated input (Sheaban and Barrett, 2016). Therefore, access to credit facilities will further
enable farmers to access such inputs. Adeoye et al. (2011) in their study on factors influencing
adoption claim that access to credit relaxes income constraints of farmers hence enabling them to
have access to key inputs such as labour hire. Hence, access to credit has been assumed to
positively influence technology adoption.
(ii) Extension services
Access to extension service providers leads to more efficient transmission of information to
farmers and adoption of innovations (Tesfu, 2014). Extension visits will help to reinforce the
message and enhance the accuracy of implementation of the technology packages (Oladele,
2011). Agbebi (2012) claimed that there is a positive relationship between farmers’ access to
extension services and their profitability.
2.3 Conceptual Framework
The decision to accept any new technology and continue using might be affected by several
factors which can be grouped into socio- economic characteristics, institutional factors and farm
inputs. It is argued that institutional factors, farmer characteristics, and farm inputs affect choice

decision indirectly by influencing knowledge, and perception, which in turn influence farmers
decisions of whether or not use an innovation Fig. 3. The role of knowledge, perception and
attitudes are central to the choice of seed propagation technology. The first phase in a choice of
improved seed propagation is the development of knowledge and acceptance ofinnovation.
Farmers can have knowledge about the existing new technology/innovation, how to apply it and
what the outcomes are in term of products, yield potential, environmental benefits, risks, and
costs. The information an individual has about innovation forms the basis of the perceptions and
attitudes this individual develops towards the technology (Meijer et al., 2015). The perception
farmers have about an innovation are very closely related to the knowledge they have about it.
Knowledge and perceptions about an innovation together determine the attitude towards an
innovation. In this case, positive attitudes towards an improved seed propagation technology will
increase the likelihood of choosing itwhile a negative attitude will reduce the probability of using
it. improved seed propagation technology.

Figure 3: A framework for choice of technology for vegetable seed propagation
CHAPTER THREE
3.0 METHODOLOGY
3.1 Description of the Study Areas
This study was conducted in six villages namely Mkuyuni, Manza, and Nyandira in Mvomero
district and in Lake tatu, Olkang’adu and Karangai in Arumeru district. Selection of the study
districts was based on their prominence in vegetable growing. According to PASS (2013) and
Everaarts et al. (2011) the districts have high vegetable potential thus ideal for studying methods
of seed propagation. Moreover, the districts are SEVIA, TAPP, AVRDC and TAHA priority
research area where the projects on intensification of farming system are being implemented
(SEVIA, 2014; Sefa and Beed, 2012; TAPP, 2012). The introduction of seedling tray technology
is among the activity that has been implemented in the districts addressing the problem of poor
quality of seedlings.
Arumeru district:
Arumeru district is located on North West of Arusha region between 3° 18ꞌ 18ꞌꞌ South of the
Equator and 36° 18ꞌ 3.6
ꞌꞌ East of Greenwich, (Kajembe et al., 2005). The district is bordered to the
North, West, and Southwest by Monduli district, Southeast by Arusha district and to the East by

Kilimanjaro region. Arumeru has two rainfall patterns, The short rains starting in September and
ending in December and thelong rains starting in March and ends in June. There are significant
variations in rainfall distribution between the highlands and the lowlands. The highlands receive
between 800 mm to 1 200 mm of rainfall while the lowlands receive between 500 mm to 700
mm of rainfall. The mean monthly temperature is 20℃ to 17℃ during the cooler season.
Arumeru district is divided into three agro- ecological zones which are upper, middle, and lower
zones (Kajembe et al., 2005). Main economic activities are agriculture, livestock grazing, and
forestry. Chinese cabbage, sweet pepper nightshade, tomato, and eggplant are some of the
vegetables grown in the district (TAPP, 2015).

Figure 4: Map of Arumeru districts showing the study village
(Source: Ministry of Land, Housing and Human Settlement, 2012)


Mvomero district:
Mvomero district is located North-East of Morogoro region between 8° 00'' and 10° 00
'' South of
the Equator and between longitudes 37° 00'' and 28° 22
'' East of Greenwich (Sefa and Beed,
2012). The district is bordered to the North by Tanga region, North-East by Coastal region, East
and South-East by Morogoro Municipality and Morogoro District and the West by Kilosa
district. The district has two rainfall patterns with short rains starting in October to December
and the long rains starting in March to May. There are significant variations in rainfall
distribution between the highlands and the lowlands. The highlands receive about 2 000 mm
while the lowlands receives more than 600 mm. Temperature range from 30℃ in lowlands and
18℃ in the highlands. The district is divided into three agro-ecological zones which are
highlands and mountain zone, Miombo woodland zone and Savannah River basin zone. These
zones have potential for growing food and cash crops such as horticultural crops (URT, 2012).
Among the horticultural crops, chinese cabbage, sweet pepper, nightshade, tomato, and eggplant
are grown in these zones (Sefa and Beda, 2012).

Figure 5: Map of Mvomero district showing the study villages
(Source: Mkonda, 2014)

3.2 Research Design
A cross - sectional design was employed whereby data were collected at a single point in time
from a representative sample to describe the larger population at that time. This research design
was used because of limited time in fieldwork and the fact that it was considered to be adequate
for addressing the study objectives.
3.2.1 Sampling procedure and sample size determination
Sampling procedure is the process of selecting a sub-set of people or social phenomena to be
studied, from the larger universe to which they belong in one of several ways so as to be a
representative of that population (Kothari, 2004). The study population was vegetable farmers
who engage in cultivation of transplanted vegetables in Arumeru and Mvomero districts. A
multi- stage sampling involving a combination of purposive and random sampling procedures
were used to select a representative sample of respondents. The first stage was purposive
selection of districts and the second stage was a random selection of wards and villages. The
final stage was random selection of respondents from the selected villages using a table of
random numbers.
Proportional to size technique was used to obtain the proportion of farmers to be included in
sample from each selected village (Table 1). The total population size of vegetable farmers from
the selected villages was 2415; therefore, the optimal sample size was obtained using the method
of determining sample size in Kothari (2004) as shown below in equation 1. The formula, which
is depicted in equation 1 assumes a degree of variability (proportion) of 5% and a confidence
level of 95%, which is appropriate to use in social science studies.

…………………………………………………….……………. (1)
Whereby;
n = sample size, z = Z score, p = proportion of the population, q = 1- p, е = allowable error, N=
population size.
However, a sample size of 240 respondents was used and considered sufficient for the statistical
analysis and model employed. This sample size was also predetermined depending on the
homogeneity of the population and the available time and financial resources. Moreover, Bailey
(1998) argues that a minimum sample size of 30 is normally sufficient for studies in which
statistical data analysis is to be done in social sciences (based on population size). Furthermore,
Matata et al. (2001) claimed that a sample size of 80-120 is adequate for soci-economic studies
in sub- Saharan Africa(SSA) household.
Table 1: Sample size of surveyed villages
Village Population Proportions(%) Sample size
Nyandira 480 19.87 48
Mkuyuni 290 12.00 29
Manza 399 16.52 41
Olkang’andu 492 20.37 49
Lake tatu 384 15.90 36
Karangai 370 15.32 37
Total 2415 100 240
3.2.2 Types of data
Both primary and secondary data were used in the study. Primary data were collected using a
household survey questionnaire and interviews. Primary data included farmer characteristics (for
example age, sex, education level attained, marital status, experience, family size and
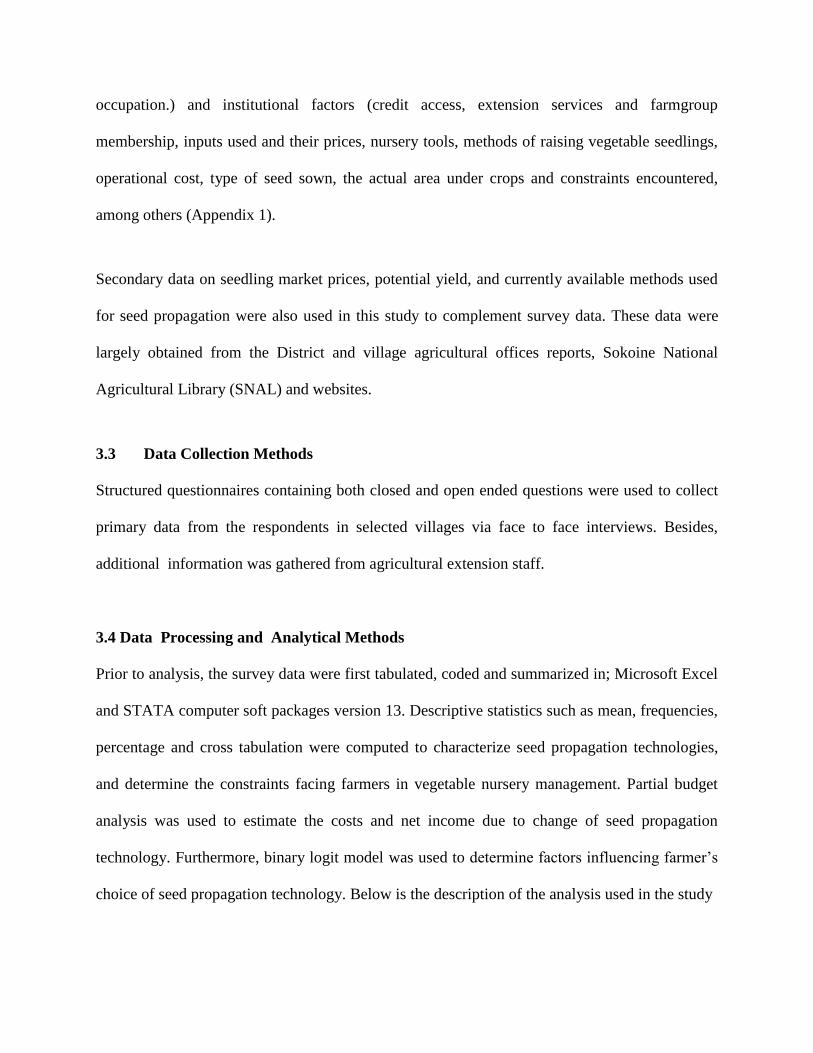
occupation.) and institutional factors (credit access, extension services and farmgroup
membership, inputs used and their prices, nursery tools, methods of raising vegetable seedlings,
operational cost, type of seed sown, the actual area under crops and constraints encountered,
among others (Appendix 1).
Secondary data on seedling market prices, potential yield, and currently available methods used
for seed propagation were also used in this study to complement survey data. These data were
largely obtained from the District and village agricultural offices reports, Sokoine National
Agricultural Library (SNAL) and websites.
3.3 Data Collection Methods
Structured questionnaires containing both closed and open ended questions were used to collect
primary data from the respondents in selected villages via face to face interviews. Besides,
additional information was gathered from agricultural extension staff.
3.4 Data Processing and Analytical Methods
Prior to analysis, the survey data were first tabulated, coded and summarized in; Microsoft Excel
and STATA computer soft packages version 13. Descriptive statistics such as mean, frequencies,
percentage and cross tabulation were computed to characterize seed propagation technologies,
and determine the constraints facing farmers in vegetable nursery management. Partial budget
analysis was used to estimate the costs and net income due to change of seed propagation
technology. Furthermore, binary logit model was used to determine factors influencing farmer’s
choice of seed propagation technology. Below is the description of the analysis used in the study

3.4.1 Specific objective one
Specific objective one intended to characterize seedling propagation technologies. The
technologies were mentioned by respondents and responses were summarized using descriptive
statistics (frequencies and percentages). Results were presented in graphical forms.
3.4.2 Specific objective two
The partial budget was used to analyse the costs and benefits associated with vegetable seed
propagation methods. Partial budget analysis focused only on those income and expenses that
change with the proposed new alternatives. Data on costs and benefits based on implemented
technologies were collected. It was important as farmers would prefer to evaluate all the changes
that are involved in adopting a new practice.
3.4.2.1 Estimation of components of partial budget
According to Lessley et al. (1999) there are several methods to organize a partial budget and in
each of the methods costs and incomes are calculated. However, a partial budget has seven
common components which include: increased revenue and reduced cost (total of positive
effects), reduced revenue and increased costs (total of negative effects) and net change (positive
minus negative effects). The components of partial budget were estimated as follows:
(i) Increased costs
These include seedling trays cost, prices paid for other inputs, depreciation cost for seedling trays
and wages for labourers employed in activities such as sowing, watering, seedbed preparation,
fertilizer application, media preparation and tray filling. However, following the standard
practice in nursery industry, expenses for purchasing planting materials (seeds) for seedling were
not included in the variable costs because seed price varies with cultivars (Myles et al., 2014).
Therefore, input costs were estimated as a product of unit price and quantities purchased. Family
labour was valued at hired labour wages per man- days on each activity in the study areas.
Depreciation cost was obtained using the straight line method where the salvage value was
assumed to be zero implying that the trays cannot be used for another purpose after its service
life. A seedling tray was considered to be used for three years, but this depends on the handling.
The conclusion of the service life of the seedling trays was made based on the survey data as
well as from previous studies such as (Bhimraj, 2011). Depreciation cost was included in the
partial budget because seedlings trays investment capital are variable to nursery beds. Therefore,
including depreciation cost allow to evaluate the cost of production with this tangible asset
expensed over it useful life in a rational and systematic manner (Garrison and Noreen, 2000 cited
by Myles et al., 2014)
Depreciation= …………………………….………. (2)
(ii) Reduced costs
This includes costs that will no longer be occurred as a result of using the new technology. These
include fertilizer and pesticide cost since the use of trays involved less use of fertilizer and
pesticides.
(iii) Increased revenue
Increase in revenue was estimated as the monetary value obtained from the sell of seedlings
produced when using seedling trays. There is distinction in the output market between seedlings

produced using seed trays and nursery beds. This is because other studies (TAPP, 2015; SEVIA,
2014; TAHA, 2012; AVRDC, 1990) have argued that seedlings raised in trays are vigorous,
healthy and free from diseases as compared to those raised in nursery beds, thus making them to
have higher market value.
3.4.2.2 Procedure for preparing a partial budget
Using the Castle et al. (1987) approach, the partial budget was calculated as the change in net
income as a result of use of given seed propagation technology. The net profit was computed as
the difference between total losses and total gains (Malaiyandi et al., 2010, Kraybill et al., 2009).
A partial budget was prepared by following the format in Table 2.
Table 2: Partial budget format
Negative effects Positive effects
Additional costs (costs incurred as a result of
using a new technology)
Reduced revenue (returns that are given up as a
result of no longer using the technology being
used)
A. Total additional costs and reduced revenue
TZS ––––
Additional revenue (returns received as a result
of using a new technology)
Reduced costs (costs that will no longer be
incurred as a result of using the +new
technology)
B.Total additional revenue and reduced cost TZS_
…………………………………………..TZS
Net change in profit (B-A)………………TZS––
Decision: If the net benefit is positive, then the alternative may have some economic advantages
while if the net benefit is negative a farmer would be better off staying with the current situation
or look for a different alternative.

Rate of Return in the partial budget was useful for evaluating the economics of using new
technology. It measures the increase in net income which is generated by each additional unit of
expenditure. Therefore, since the use of seedling trays is more costly, and then rate of return was
looked at.
Rate of Return= ∆Net Profit∕∆Variable Costs……………………………………… (3)

Whereby;
∆Net Profit = ∆TR- ∆VC………………………………………..……………………… (4)
Thus, the new technology should be accepted only if its Rate of Return is higher than 1.0 (Chase,
2010).
The independent T-test sample was then used to ascertain whether there was a statistical
difference in unit production costs between seedling trays and nursery beds users at 5 percent
level of significance. The prior expectation was that use of seedling trays to raise seedlings has
higher cost compared to nursery bed given the hypothesis below;
Ho: =
Ha:>
Where: = Means of seedling trays, = Means of nursery beds
3.4.2.3 Assumption of the partial budget
One important assumption was made in partial budget analysis. The study assumes that farmers
are rational seeking at maximizing profit, thus sell seedlings at the reasonable market prices to
cover their production costs. Therefore, although the original plan was to raise seedling for
transplanting them into their main plot, this study assume that farmers were selling the
seedlings. This assumption was made to capture the effect of the technology at nursery level
since post nursery activites were not the same and this study did not go further to undertake the
field experiments to control the variations.

3.4.2.4 Limitation of partial budget
The partial budget is not appropriate to longer term changes or purchases if so it suggested to use
capital budgeting. Moreover, the partial budget does not take into account the time value of
money (Kraybill et al., 2009). Despite of the limitations this study adopt the partial budget
because seedlings production is a short term operations.
3.4.3 Specific objective three
The determinants of farmers choice of seed propagation technology was analysed using binary
logit model. The choice between seedling trays and nursery bed technology was hypothesized to
be influenced by socio-economic and institutional factors. Therefore, the dependent variable was
the choice of seed technology given by latent variable Y* which is an index of the unobserved
propensity for an event to occur. In the binary logit model, seedling trays were taken as 1, while
nursery bed as 0 as a method for seed propagation.
The latent model was specified as follows:
…………………….……………………………..…………………..……… (5)
Whereby follows standard logistic distribution and unobservable.
=1 if 0 and unobservable
The probability of choosing an alternative over not choosing is expressed by logit equation as in
(6) where represents the cumulative distribution function of a standard logistic of random
variables
….…………………………………………………. (6)
Whereby;
= The probability of the ith
farmer choosing seedling trays and is influenced by explanatory
variables presented in equation (6) and β represent the vector of parameters associated with
explanatory variables.
The relationship between a specific variable and the outcome of the probability was interpreted
by means of the marginal effect, which accounts for the partial change in the probability. The
marginal effect associated with continuous explanatory variables Xk on the probability, holding
the other variables constant, was derived as follows;
Marginal Effect of Xk = limit [Pr(Y = 1|X, Xk+Δ) – Pr(y=1|X, Xk)] / Δ] …………..… (7)
As Δ gets closer and closer to 0
The marginal effect on dummy variables was estimated differently from continuous variables.
Since discrete changes in the predicted probabilities constitute an alternative to the marginal
effect when evaluating the influence of a dummy variable. Such an effect was derived from the
following;
Marginal Effect Xk = Pr(Y = 1|X, Xk = 1) – Pr(y=1|X, Xk = 0)……………….……… (8)
The marginal effects provide insights into how the explanatory variables shift the probability of
technology use. Using the econometric software STATA marginal effect was calculated for each
variable while holding other variables constant.

3.4.3.1 Definition of variables included in the model
Dependent variable: Choice of technology, categorical variable which takes the value of one if
the farmer chooses seedling trays and the value of zero if a farmer chooses nursery beds.
Independent variables: Variables that were hypothesized to influence the farmer’s choice of
technology were selected based on the empirical literature and data available. Below is the
summary of explanatory variables included in the model as shown below in (Table 3) with
detailed explanation of the expected relationship with the dependent variables.
Table 3: Definition of independent variables and their expected results
Variable Variable label Expected sign Theory/logic behind
X1= Sex Sex of respondent
(1=male, 0=female
Males and female perceived situations
differently also based on culture female
lack access to resources.
X2=EXPERI Number of years engage
in vegetable cultivation
+ With experience comes knowledge, a
universally accepted truth. Therefore,
experience can influence the decision to
use seedling trays ceteris peribus.
X3=ACCE_TRAY Easy access to trays
(1=easy, 0= otherwise
+ A farmer can use technology, which is
accessible so accessibility can influence
the use of trays.
X4=AGE Age of respondent
measured in years
± Age is the primary underlying
characteristic adoption decision. Age and
use of agricultural technologies depend
on the type of technology being
introduced.
X5= EX_CO Extension contact
(1=Yes, 0= No)
+ Contact with the extension service leads
to more efficient transmission of
information to farmers, and the adoption
of innovations.
X6=FARM_G If farmer belong in any
farming group
+ Groups create social capital and allow
exchange of ideas.

X7=CRED_ACCESS Access (1=Yes, 0=
Otherwise)
+ Credit helps farmers to purchase
technology and associated farm inputs.
X8= F_S Number of family
members in the
household
The use of tray requires labour.
Household member influence labours
availability.
X9=MARI_STA Marital status
(1=married, 0= not
married
+ Married household expected to be stable
and settled career-wise.
3.4.4 Specific objective four
In order to address the fourth objective, which was intended to determine constraints which
farmers are facing in nursery management activities, descriptive statistics were used. These
included percentages and frequencies for constraints mentioned by respondents during the survey
such as pest and diseases attacks, poor quality of seed, high input prices and lack of technical
knowhow.
3.5 Limitation of the Study
Studies focusing on vegetable seed propagation in Tanzania are inadequate to date, however the
study has reviewed relevant studies on nursery management and vegetable production in general.
Post nursery operations and input used are not the same therefore yield differences are not
limited to methods of seed propagation. The study therefore assume farmers sell the seedling and
partial budget was done at nursery level.

CHAPTER FOUR
4.0 RESULTS AND DISCUSSION
This chapter presents findings of the study. It is divided into four sections. Section one
characterizes nursery technologies and household characteristics of vegetable farmers in the
study areas. Section two present the results for partial budget. The third section presents factors
influencing the choice of technology and finally the constraints encountered by vegetables
farmers in nursery management is presented in section four.
4.1 Characterization of Seed Propagation Technology
The survey showed that the most of vegetable seeds were transplanted and some were directly
planted such as carrots and amaranth. The results show that nursery beds and seedling trays were
the mostly methods used for vegetable seed propagation in the study areas. Moreover, the
findings show that majority of vegetable farmer’s were using nursery beds (87%) for seed
propagation as shown in Fig. 6. These results suggests that the use of seedling trays was
relatively low, only about (13%) as compared to nursery beds, despite advantages associated
with seedling trays namely; good germination, disease free seedlings, intact root systems and
seed use efficiency. These results were similar to those of Everaarts et al. (2011) who found that
field nurseries were common used method for vegetable transplants production in Tanzania. Cost
of trays, lack of technical knowhow and lack of information on the economic advantages of
seedling trays were mentioned by farmers during the survey to be among the reasons for not
using it. The results therefore, suggest that agricultural technologies should be designed in such a
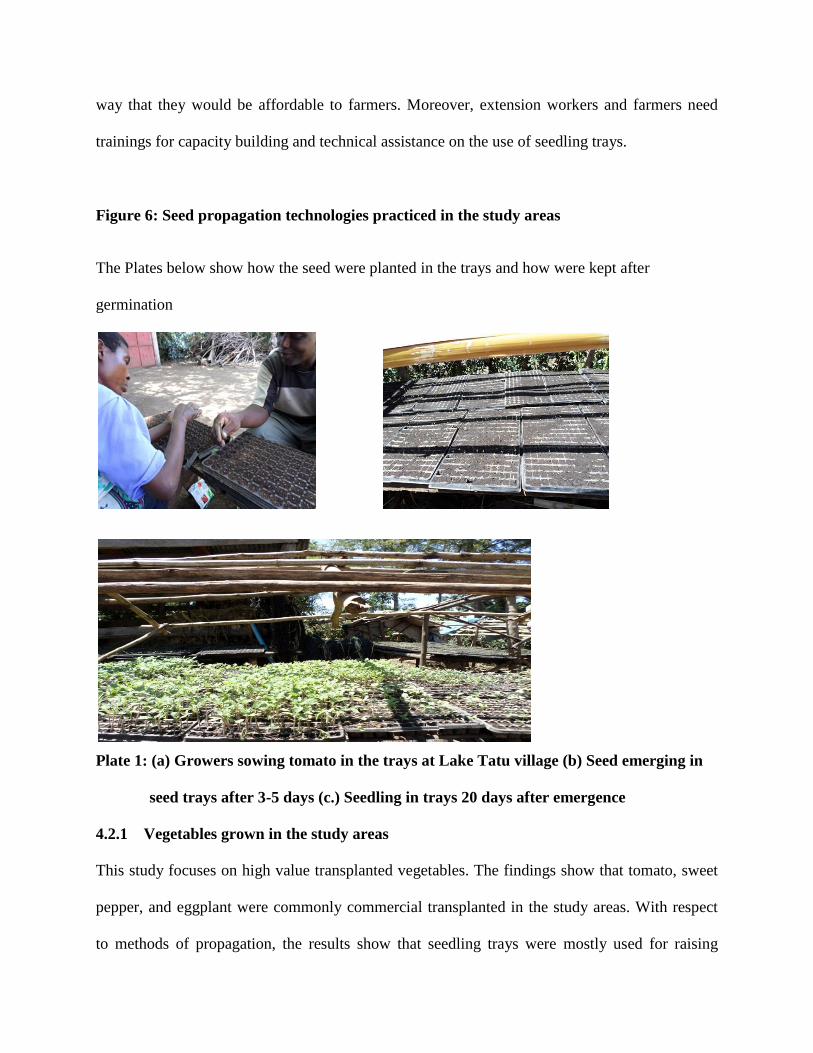
way that they would be affordable to farmers. Moreover, extension workers and farmers need
trainings for capacity building and technical assistance on the use of seedling trays.
Figure 6: Seed propagation technologies practiced in the study areas
The Plates below show how the seed were planted in the trays and how were kept after
germination
Plate 1: (a) Growers sowing tomato in the trays at Lake Tatu village (b) Seed emerging in
seed trays after 3-5 days (c.) Seedling in trays 20 days after emergence
4.2.1 Vegetables grown in the study areas
This study focuses on high value transplanted vegetables. The findings show that tomato, sweet
pepper, and eggplant were commonly commercial transplanted in the study areas. With respect
to methods of propagation, the results show that seedling trays were mostly used for raising

tomato seedlings (8.8%) as shown in Table 4. This suggests that tomato was the most important
vegetable commodity in terms of acreage, production and economic value. These results conform
with those of Mtui et al. (2010) who found that tomato is Tanzania’s main economic vegetable.
Moreover, the study found that some farmers were growing more than one type of vegetable in
the same season such as tomato and eggplant or sweet pepper and tomato. However for the case
of partial budget analysis This study, based on these three vegetables but for partial budget only
two crops i.e. tomato and sweet pepper were used since none of the farmers use seedling trays
for eggplant seed propagation.
Table 4: Vegetables grown and seed propagation technologies used
Variable Methods of propagation
Nursery beds Seedling trays Total
Vegetable grown N % N % N %
Tomato 132 55 21 8.8 153 63.8
Sweet pepper 30 12.5 2 0.8 32 13.3
Eggplant 15 6.3 0 0 15 6.3
Tomato and sweet pepper 24 10 8 3.3 32 13.3
Tomato and eggplant 8 3.3 0 0 8 3.3
Total 209 87.1 31 12.9 240 100
4.2.2 Areas under vegetable cultivation in acres
The findings show that the mean area under production for vegetables in the study areas was at
most one acre constituting 0.8 acre, 0.5 acre and 0.2 acre for tomato, sweet pepper and eggplant
respectively as shown in Fig. 7. This implies that the mean area under tomato was above half an
acre compared to other vegetables as shown in Fig. 7. These results were relatively similar to

Putter et al. (2007) who found that the area under vegetable production was on average, 0.5 acres
in Tanzania.
Figure 7: Average area under vegetable production
4.2.3 Type of seeds sown and propagation technologies
The findings show that majority of vegetable growers, were using improved seeds while others
were using recycled seeds as illustrated in Fig. 8. The survey found out that the amount of seeds
sown depended on the area of the main field, spacing, seed viability and seed emergence rate.
Moreover, during the survey it was observed that nursery size or number of trays for raising
seedlings depend on seed weight.
Figure 8: Type of seed used based on the technologies
Plate 2: A farmer display a packet of an improved tomato seed at Lake Tatu village in
Arumeru district

4.2.5 Fertilizer and pesticide application
The findings show that the majority of farmers (96%) who raise seedlings in the field nurseries
use fertilizers as compared to those who raise them in seedling trays as shown in Table 5. The
reason was that farmers who used seedling trays prepared growing media which is rich in
nutrients and organic matters. These results were similar to those of Yosef et al. (2013) who
found that farmers were using fertilizer in seedling production during establishment of
community nurseries in the Central Highlands of Ethiopia. Moreover, the study found that most
commonly used fertilizers for the seedlings in the nursery were industrial chemical fertilizers
(Nitrogen, Phosphorous and Potassium). The study observed that the use of farmyard manure in
the nursery was quite low since farmers complained that it caused damage to roots and burning
of seedlings when not prepared well. The findings also show that pesticides were mostly applied
by those farmers who raise seedlings in the nursery beds (Table 5). This results are similar to
those of Ratha et al. (2014); Manjunga et al. (2013) and Bhimraj, (2011) claimed that use of
trays leads to soilborne disease free seedlings (especially damping off disease). However, during
the survey it was observed that some of the farmers who raise seedlings in trays were using
pesticides for managing insect pest and airbones diseases.
Table 5: Fertilizer and pesticide application in the nursery
Description Methods of propagation
Nursery beds Seedling trays Total
N % N % N %
Fertilizer use
Yes 172 96.6 6 3.4 178 100
No 37 59.7 25 40.3 62 100
Total 209 87.1 31 12.9 240 100
Pesticide use
Yes 124 94.7 7 5.3 131 100

No 85 78 24 22 109 100
Total 209 87.1 31 12.9 240 100
4.2.6 Socio-economic characteristics of surveyed vegetable farmers
Results show that majority of vegetable farmers (16%) who use seedling trays were found to fall
within age group of 41-50 years while for the nursery beds (87%) were within age group of 18-
40 years (Table 6). This means that the use of seedling trays in the study areas was dominated by
middle aged vegetable farmers. Therefore, the implication is that the use of trays requires extra
cost and most of middle aged farmers could have enough capital to cover those costs at ceteris
peribus. The results are consistent to those of Nwalieji and Ajayi (2008) who claimed that
middle–aged farmers are highly involved in use of improved vegetable production practices.
However, the age difference in relation to the use of technology was not correlated (P>0.07). The
findings are supported by CIMMYT, (1993) which contends that choice of a given innovation
may not be strictly correlated with age.
The findings also show that most of farmers had six to 10 members per household (Table 6).
These results are relatively similar to those of URT (2014) that average people per household is
5 in Tanzania. This indicates that the family size of vegetable farmers was similar to the national
average. The average family size has got an impact on the availability of labour, especially
considering that most smallholder farmers depend on family labour (Asaduzzaman et al., 2011;
Edriss and Simtowe, 2003). However, the Chi-square test showed that there is no relationship
between family size and the choice of the technology.
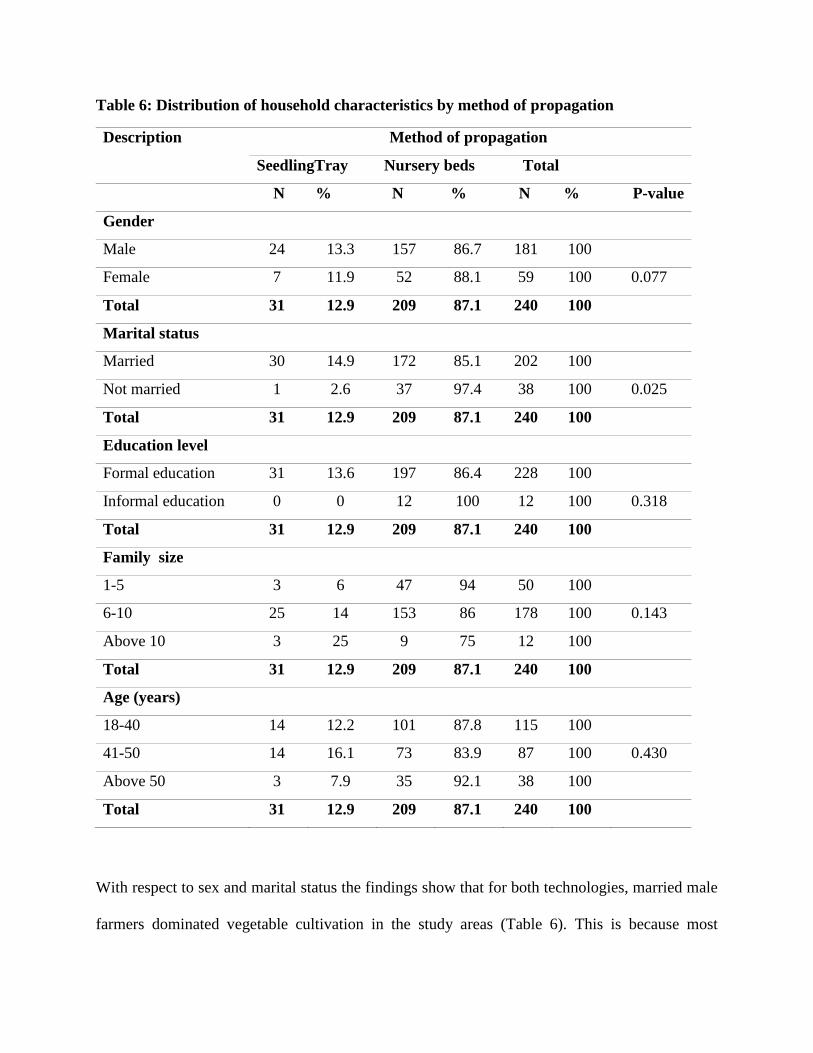
Table 6: Distribution of household characteristics by method of propagation
Description Method of propagation
SeedlingTray Nursery beds Total
N % N % N % P-value
Gender
Male 24 13.3 157 86.7 181 100
Female 7 11.9 52 88.1 59 100 0.077
Total 31 12.9 209 87.1 240 100
Marital status
Married 30 14.9 172 85.1 202 100
Not married 1 2.6 37 97.4 38 100 0.025
Total 31 12.9 209 87.1 240 100
Education level
Formal education 31 13.6 197 86.4 228 100
Informal education 0 0 12 100 12 100 0.318
Total 31 12.9 209 87.1 240 100
Family size
1-5 3 6 47 94 50 100
6-10 25 14 153 86 178 100 0.143
Above 10 3 25 9 75 12 100
Total 31 12.9 209 87.1 240 100
Age (years)
18-40 14 12.2 101 87.8 115 100
41-50 14 16.1 73 83.9 87 100 0.430
Above 50 3 7.9 35 92.1 38 100
Total 31 12.9 209 87.1 240 100
With respect to sex and marital status the findings show that for both technologies, married male
farmers dominated vegetable cultivation in the study areas (Table 6). This is because most

women did not own land and married women need consent of their husbands. Moreover,
according to World Bank (2009) studies in Africa, it is claimed that when a crop is perceived as
commercial, men are more likely to take over from women, leaving women with another
vegetable type for home consumption and other household activities. These results are similar to
those of Lavison (2013); Xaba et al. (2013); Adeayo (2011) who claimed the domination of
married males in vegetable production in West Africa. The status of being married in relation to
the use of technology was statistically significant (p< 0.05). This means married farmers can
easily make a unified decision with the minimum risk aversion to invest in new technology so as
to improve socio economic status of the households.
Education wise the majority of respondents for both technologies have formal education (Table
6). This suggests that a formal education is sufficient to understand the functioning of modern
technologies of seed propagation. These results are in agreement with that of TAHA (2011) who
claim that in Tanzania, most farmers have formal education particularly primary education and
rely on traditional farming methods. The Chi -square test results indicates that there is no
relationship between level of education and the use of seedling trays. This implies that having
formal or informal education do not differ in their level of seedling trays use.
4.2.6.1 Source of labour
The findings show that main source of labour for field nurseries was family labour (99%) while
for seedling trays were both family and hired labour (34%) as shown in Table 6. Hired labour
with the use of seedlings trays was associated with filling of trays and media preparation
activities. This findings is consistent with those in West Africa by Lavison, (2013); Owombo et

al. (2012); Asaduzzaman et al. (2011) and Edriss and Mshote (2003) who claim that the main
source of labour for vegetable farmers was family labour.

Table 7: Source of labour
Description Methods of propagation
Nursery beds Seedling trays Total
N % N % N %
Source of labour
Family labour 194 99 2 1 196 100
Family and hired labour 15 65.9 29 34.1 44 100
Total 209 87 31 13 240 100
4.2.6.2 Extension service contact and access to credit
With respect to extension services, the results show that more than half of farmers who used
seedling trays had access to extension services as compared to those who used field nurseries as
shown in Table 8. That was because farmers were eager to use the new technology, thus, sought
guidance from extension agents. Generally, extension services to vegetable farmers were quite
low due lack of enough extension officers at the village level. The findings also suggest that
farmers who use seedling trays have access to credit facilities as compared to farmers who raise
seedling on nursery beds (Table 8). This further suggests that they take credits to assist the
purchase of inputs. Generally, the availability of formal agricultural credit facility was limited in
the study areas. However, it was established that the main source of credit was from savings
scheme commonly known as (VICOBA). Moreover, it was reported that lack of collateral, higher
interest rates and fear to investment risks were among the constraints to credit access in the study
area.
Table 8: Access to extension services and credit
Description Methods of propagation
Nursery beds Seedling trays Total N % N % N %
Extension service
Yes 96 82.1 21 17.9 117 100
No 13 91.9 10 8.1 23 100
Total 209 87 31 13 240 100
Access to credit
Yes 48 72.7 18 27.3 66 100
No 161 92.5 13 7.5 174 100
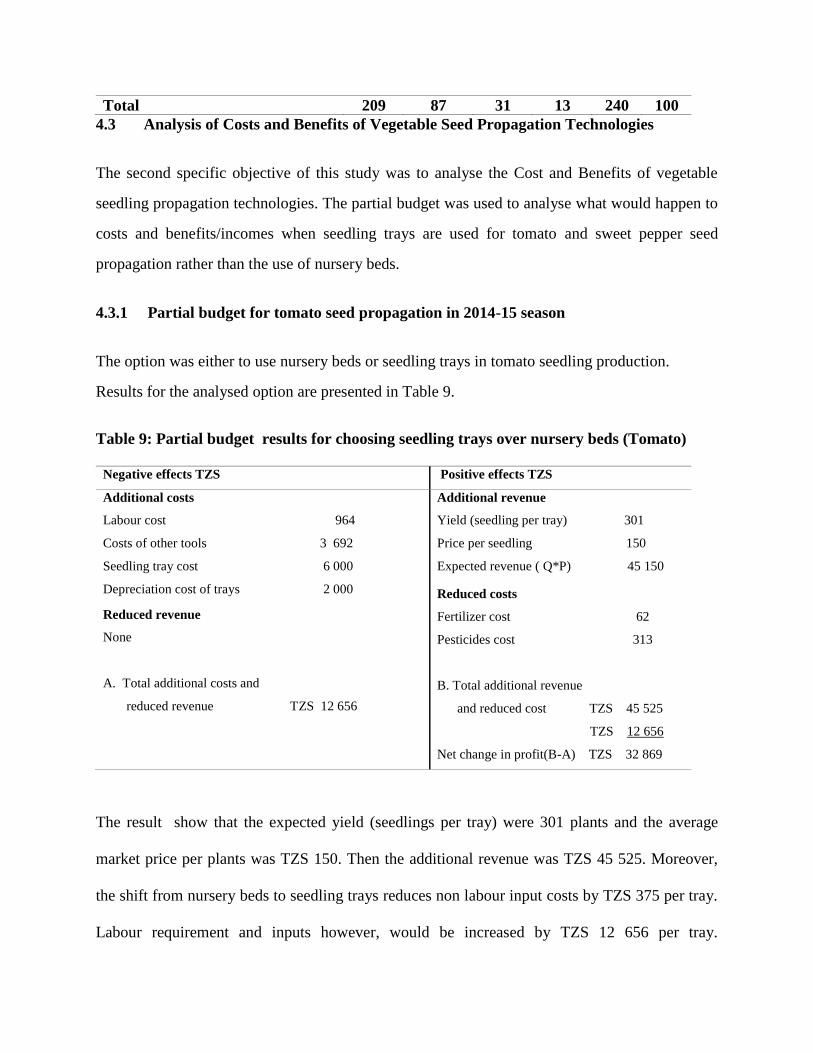
Total 209 87 31 13 240 100
4.3 Analysis of Costs and Benefits of Vegetable Seed Propagation Technologies
The second specific objective of this study was to analyse the Cost and Benefits of vegetable
seedling propagation technologies. The partial budget was used to analyse what would happen to
costs and benefits/incomes when seedling trays are used for tomato and sweet pepper seed
propagation rather than the use of nursery beds.
4.3.1 Partial budget for tomato seed propagation in 2014-15 season
The option was either to use nursery beds or seedling trays in tomato seedling production.
Results for the analysed option are presented in Table 9.
Table 9: Partial budget results for choosing seedling trays over nursery beds (Tomato)
Negative effects TZS Positive effects TZS
Additional costs
Labour cost 964
Costs of other tools 3 692
Seedling tray cost 6 000
Depreciation cost of trays 2 000
Reduced revenue
None
A. Total additional costs and
reduced revenue TZS 12 656
Additional revenue
Yield (seedling per tray) 301
Price per seedling 150
Expected revenue ( Q*P) 45 150
Reduced costs
Fertilizer cost 62
Pesticides cost 313
B. Total additional revenue
and reduced cost TZS 45 525
TZS 12 656
Net change in profit(B-A) TZS 32 869
The result show that the expected yield (seedlings per tray) were 301 plants and the average
market price per plants was TZS 150. Then the additional revenue was TZS 45 525. Moreover,
the shift from nursery beds to seedling trays reduces non labour input costs by TZS 375 per tray.
Labour requirement and inputs however, would be increased by TZS 12 656 per tray.

Considering the components of partial budget in this study there was no reduced income due to
change. Therefore, total positive effect outweigh total negative effects by TZS 32 800 per tray
indicating that it would be financially beneficial to switch from nursery beds to seedling trays
for raising seedlings.
Results also show that total mean nursery costs were TZS 12 600 and TZS 8 100 for the use of
seedling trays and nursery beds respectively. The results for testing significance differences in
nursery cost indicates that the mean difference for the alternative (nursery beds to seedling trays)
was statistically significant (p<0.05). This means that, unit production costs per tray was TZS 7
600 higher as compared to nursery beds. Furthermore, the estimated rate of return value was 3.02
which is greater than one. This indicates that the rate of return is 302% above the costs of
additional investments. Thus it seems likely that this technology would be chosen in spite of it
relatively initial investment cost.
4.3.2 Partial budget for sweet pepper seed propagation in 2014-15. season
The partial budget results show that when a farmer chooses to use seedling trays rather than
nursery beds to raise sweet pepper seedlings, he/she would make a net gain of TZS 33
800 per tray (Table 10) and costs for labour and other inputs would be increase by TZS 11 600.
The results also show total mean nursery cost for farmers who use seedling trays were TZS 4 300
and TZS 11 600 for raising plants in nursery beds and trays respectively. Therefore, the use of
trays has higher cost which was attributed to the purchase of trays and labour cost whereby more
labour was required to fill the trays and media preparation.

The results for testing significance differences in nursery cost indicates that the mean difference
for the alternative nursery beds to seedling trays was statistically significant (p<0.05). This
means that, unit production costs for seedling tray was 7 200 higher as compared to nursery beds.
The rate of return is 3.64 which means that net income will increase by 364% for each additional
unit of expenditure.
Table 10: Partial budget by choosing seedling trays over nursery beds (sweet pepper)
Negative effects Positive effects
Additional costs
Labour cost 1 080
Costs of other tools 2 261
Seedling tray cost 6 200
Depreciation cost of trays 2 066
Reduced revenue
None
A. Total additional costs
and reduced revenue TZS 11 607
Additional revenue
Yield (seedling per tray) 300
Price per seedling 150
Income 45 000
Reduced costs
Fertilizer cost 50
Pesticides cost 401
B. Total additional revenue
and reduced cost TZS 45 451
TZS 11 607
Net change in profit(B-A) TZS 33 844
4.4 Factors Influencing the Choice of Vegetable Seed Propagation Technologies
A binary logit model was used to determine factors influencing the choice of vegetable seed
propagation technologies whereby in this study, were the seedling trays and nursery beds. Table
11 provides results of the model estimated. The model was statistically significant (p=0.000).
Based on the results of estimated model, four variables significantly influenced farmer’s choice
of seed propagation technologies. These variables were access to trays (p<0.05), access to credit
(p<0.05), extension service contact (p<0.05) and marital status (p<0.05) as shown in Table 11.

Thus, based on the results there was enough evidence to reject the null hypothesis in favour of
the alternative hypothesis. Therefore, there is evidence that at least one of the independent
variables jointly has an influence on the probability of using seedling trays.
Table 11: A binary logit model results showing factors influencing choice of seed
propagation technology in the study area
Variables Coefficient P>|z| Std error Marginal effect P>|z| Std error
SEX -0.6000 0.345 0.6355 -0.0246 0.416 0.0302
EXPERI -0.0338 0.286 0.0317 -0.0012 0.322 0.0012
AGE 0.0186 0.512 0.0283 0.0007 0.508 0.0010
ACCE_TRAYS 2.2744 0.000 0.5573 0.1233 0.011** 0.0487
FARM_G 0.6657 0.231 0.5559 0.0242 0.272 0.0221
CRED_ACCESS 1.6345 0.001 0.5116 0.0845 0.036** 0.0403
HH_S 0.0458 0.848 0.2385 0.0016 0.850 0.0086
MARI_STA 2.7436 0.003 1.4144 0.0518 0.004** 0.0180
EX_CON 1.8978 0.000 0.6462 0.0735 0.012** 0.0311
Constant -8.2822 1.6434
* means significant at **=5% level of significance,Number of observation =240 Prob> chi2=0.0000
4.4.1 Marital status
As expected, the results show that marital status of the respondents has a positive influence on
the probability of using seedling trays to raise vegetable seedlings (p<0.05) as shown in (Table
11). The implication is that married smallholder farmers were 5% more likely to use seedling
trays in comparison to those who are not married holding other factors constant. This is because
a married couple usually has joint decision which intends to ensure they choose a propagation
method that could improve yield. Moreover, married farmers have more responsibilities of
ensuring the family has enough food. Therefore, any innovation that increases the yield of the
crop could be well chosen. These results conform to the findings by (Tesfu, 2014; Tesfay, 2010)

who reported that marital status has a positive influence on adoption of modern agricultural
technologies.
4.4.2 Access to credit
As expected, access to credit facilities was positive and significantly influenced the probability
of using seedling trays to raise seedlings at p<0.05 as shown in Table 11. This reveals that
farmers who had access to credit were more likely to use seedling trays by 8% in comparison to
those who have no access to credit facilities ceteris peribus. This implies that credit allows
farmers to have additional capital that could be used to invest in a new technology or to acquire
labour, seed, fertilizer and other inputs. Similar findings were reported by (Owombo et al., 2012
and Banerjee and Martin, 2009) showing that credit access significantly influenced the use of
improved seed in vegetable production among smallholder farmers. The results implies that
making agricultural credit available, coupled with technical support from extension officers, had
a high potential for increasing the number of farmers using seedling trays.
4.4.3 Access to seedling trays
The result shows that availability of seedling trays positively and significantly influences the use
of seedling trays as shown in Table 11. This implies that farmers with easy access to trays were
12% more likely to use trays compared to farmers who have no easy access to trays. Results
were similar to those of Badmus and Yekinni (2011); Tadesse (2009) who argued that
availability of exotic vegetable seeds and improved seed influence vegetable production and
profitability.

4.4.4 Access to extension services
The result as presented in Table 11 shows that access to extension services positively and
significantly influenced the use of seedling trays in seed propagation (p<0.05). At ceteris
peribus, a smallholder vegetable farmer who accessed extension services was more likely to use
seedling trays by 7% as compared with a smallholder farmer who did not contact an extension
agent. This implies that access to extension services impact knowledge of agronomic practices to
smallholder farmers (Rahman, 2007). Thus, a smallholder vegetable farmer with knowledge of
agronomic practice could have practiced the farming technique in a better way than the one
without knowledge. Therefore, current findings concur with those of Maponya et al. (2014) and
Alene and Manyong (2007) who argue that regular contact with extension agents enables to
acquire knowledge of improved vegetable production technologies. The results therefore, suggest
that there should be regular visits by extension agents to vegetable farmers for technical support
and information dissemination.
4.5 Constraints Facing Vegetable Farmers in Seedlings Production
Survey results revealed that vegetable farmers of selected villages encountered a number of
constraints during seedling production as shown in Table 12. This included insect pest and
disease incidences (96.3%), ineffective pesticides(68.8%), lack of assurance of good quality
seeds (59%), higher input prices (55%) and lack of extension officers (51%). Similar results were
also reported by (Emana et al., 2015; Maponya et al., 2014; AVRDC, 2012 and MAFC, 2008).
Nonetheless, it was reported that pests and disease destroy most seedlings before attaining
maturity. The pests were identified as Root-knot nematodes Meloidogyne spp) and red spider
mites (Tetranynchus spp). These were mostly reported in Nyandira and Mkuyuni villages in

Mvomero district and Karangai village in Arumeru district. Root-knot nematodes and damping
off disease were the most commonly reported diseases among farmers that raised seeldlings on
nursery beds due to poor drainage and air circulation. Others reported that lack of information on
weather conditions and theft of seedlings hinders nursery management as shown in Table 12.

Table 12: Constraints facing vegetable farmers in nursery management
Variable
Constraints in vegetable nursery
management
Frequency
Percent
Pest and diseases attack
Yes 231 96.3
No 9 3.8
Total 240 100
Ineffective pesticides
Yes 165 68.8
No
Total
75
240
31.3
100
Poor quality of seeds
Yes 142 59.2
No 98 40.8
Total 240 100
Higher input prices
Yes 131 54.6
No 109 45.4
Total 240 100
Inadequate extension support on
horticultural crops
Yes 122 50.8
No 118 49.2
Total 240 100
Lack of information on weather
conditions
Yes 121 50.4
No 119 49.6
Total 240 100
Theft of seedling in the nursery
Yes 92 38.3
No 148 61.7
Total 240 100
4.6 Summary of the Findings
Nursery beds and seedling trays were techniques employed by farmers to raise their seedlings.
However, the use of seedling trays is quite low compared to nursery beds. Among the reasons for
low use of seedling trays were the cost of trays and other associated activities such as media
preparation and tray filling. Moreover, some farmers were even not aware of the existence of the
technology.
With regard to the second specific objective, the partial budget for proposed change indicated a
positive net gain for both tomato and sweet pepper seedling when using trays. This implies that
the use of seedling trays has an economic advantage over current seedling production methods.
Nursery costs were higher for vegetable farmers who use seedling trays as compared to farmers
who use field nurseries.
To cater for the third objective results estimates showed that access to credit, ease access to
seedling trays, extension services as well as marital status was positively significantly influenced
the use of seedling trays to raise vegetable seedlings in the study areas holding other factor
constant. Moreover, other variables those were conceptualized, the analysis show that they were
positively but insignificant, this implies that farmers decision to use a new agricultural
technology in preference to other alternative technology were statistical not associated to them.
The most pressing constraint associated with vegetable nursery management is pest and disease
incidences, counterfeit seed and pesticides followed by higher input prices, lack of extension
officers based on horticultural crops, lack of information on weather and technical know-how.

CHAPTER FIVE
5.0 CONCLUSIONS AND RECOMMENDATIONS
5.1 Conclusions
Continous effort has been made for the development of vegetable crops, but still, the sector is
faced with many constraints related to seedling quality and nursery management. Taking these
issues into account the study sought to; (i) characterize vegetable seed propagation technologies,
(ii) analyse costs and benefits associated with the use of seed propagation technology, (iii)
determine factors that influence the choice of vegetable seed propagation technology (iv) identify
constraints facing vegetable farmers in nursery management. The following are the major
conclusions drawn from the findings of this study.
Based on the findings, it can be concluded that raising seedlings in seedling trays is the profitable
venture but the proportion of farmers using the technology is very low. This means that most of
the vegetable farmers in the study area are using field nurseries. Therefore, in order to increase
the level of technology use there is a need for government and other development partners to
promote the use of seedling trays technology to vegetable farmers by disseminating information
about the economic advantages and other benefits of the technology through trainings,
workshops, and farm field schools with support of extension workers. Although the initial
investements cost for the use of seedling trays are higher, however the cash outflow from the
investment is expected to be recovered from the cash inflows generated by investment.

The findings also show that the use of seedlings trays in the study areas is strongly influenced by
variables namely access to credit, extension services, access to trays and marital status at
constant. Therefore, it can be concluded that access to credit and extension services are very
important factors to promote adoption of the technology under consideration. Moreover,
financial institutions like banks should provide affordable credit facilities to the farmers. This
will encourage them to practice commercial farming and to adopt innovative technologies.
Furthermore, the study conclude that pest and disease incidences, higher input prices, counterfeit
seed and pesticides are the most pressing constraints in vegetable nursery management in the
study areas.Therefore, respective authorities should quickly solve these problems.
Generally, this study observed a great potential for vegetable production in Mlali and Mkuyuni
village in Mvomero and Lake Tatu and Karangai in Arumeru through improved technologies.
Therefore, government and relevant private stakeholders should support farmers in these villages
with low cost appropriate technologies and market linkages. It is therefore vital that agriculture
technologies introduced should meet the needs of small, medium and large scale farmers.
5.2 Recommendations
In view of the major findings and the above conclusion, the following recommendations are
drawn which may be useful to policy makers and other agencies who are directly or indirectly
involved in the development of the horticultural sub sector in Tanzania.

5.2.1 Recommendation to farmers
It is recommended that, farmers in the study area should use seedling trays seedling for seed
propagation in order to improve seedling quality since the technology is financially beneficial.
Although the technology has a challenge of higher initial investment costs, it is recommended to
farmers to find a best way to access affordable credits, such as village savings and loan groups.
This will support nursery business financially.
5.2.2 Recommendations to policy makers
Access to agricultural credit facilities is the most important factor influencing the choice of
seedling trays and which initial investment costs are higher in comparison to existing technology
that is nursery beds. Therefore, it is recommended that government should establish good
financial policies on agricultural credit facilities in order for vegetable farmers to access those
credits on time and at affordable rates. Moreover, it is recommended that extension services
should be strengthened in villages, the focus should be on training to extension agents to build
capacity to them since some practices are new to them. Focus should also be on dissemination of
information about new innovations, increasing number of extension workers because during the
survey some villages were not having extension agents and technical assistance on how to
control pests and diseases.
Furthermore, it is recommended that regulatory authorities for registering and certifying
agricultural inputs should explicitly enforce their policies on quality controls on seed and
pesticides market and hold accountable inputs dealers who are responsible for counterfeit seeds
and pesticides. These counterfeit seed and pesticides pose loss of money and crops to farmers.

5.2.3 Area of further research
This study analysed the costs and benefits of raising seedlings in seedlings trays at nursery level.
This study did not discuss the effect of produced transplants on main field yield. This was due to
lack of experimental data as post nursery operations and field conditions are not the same. Thus,
further studies are warranted to evaluate the impact of transplants raised in trays on main field
yield.
REFERENCES
Abunga, M., Emelia, A., Samuel, G. and Dadzie, K. (2012). Adoption of modern agricultural
production technologies by farm households in Ghana: What factors influence their
decisions? Journal of Biological Agriculture and Healthcare 2(3): 1–14.
Adeoye, L. B., Olajide-Taiwo, F. B., Adebis, A., Usman, J. M. and Badmus, M. A. (2011).
Economic analysis of watermelon based production system in Oyo State Nigeria.
Journal of Agricultural and Biological Science 6 (7): 53-59.
Adesina, A. A., Mbila, D., Nkamleu, G. B. and Endaman, D. (2000). Economic analysis of the
determinants of adoption of alley farming by farmers in the forest zone of Southwest
Cameroon. Journal Agriculture, Ecosystems and Environment 80: 255-265.
Agbebi, F. O. (2012). Assessment of the impact of extension services on fish farming in Ekiti
State, Nigeria. Asian Journal of Agriculture and Rural Development 2 (1): 62-68.

Ajewole, O. C. (2010). Farmer’s response to the adoption of commercially available organic
fertilizers in Oyo State, Nigeria. African Journal of Agricultural Research 5(18):
2497-2503.
Ajewole, O. C. and Folayan, J. A. (2008). Analysis of Technical Efficiency in Dry season Leaf
Vegetable Production among smallholders in Ekiti State, Nigeria. Agricultural
Journal 3(4): 252-257.
Akinlade, R. J., Olubunmi, L. B. and Adekemi, A. D. (2013). Commercialiazation of urban
farming: The case of vegetable farmers in southwest Nigeria AAAE fouth
international country 22-25 september 2013 Hammamet, Tunisia.
Alene, A. D. and Manyong, V. M. (2007). Gains from High-Yielding Varieties with and without
Complementary Technologies: The case of Improved Cowpea in Northern Nigeria.
Journal of Agricultural and Food Economics 2 (1): 1-14.
Amemiya, T. (1981). Qualitative Response Models. Journal of Economic Literature. The
American Economic Association 19: 1483-1536.
Asaduzzaman, M., Naseem, A. and Singla, R. (2011). Benefit-cost assessment of different
homestead vegetable gardening on improving household food and nutrition security
in Rural Bangladesh. Paper presented at the Agricultural and Applied Economics
Association 2011 AAEA and NAREA joint Annual Meeting Pittsburgh,
Pennsylvania, July 24-26, 2011.
AVRDC (1990). Vegetable Production Training Manual. Asian Vegetable Research and
Development Center. Shanhua, Tainan. 447 pp.
AVRDC (2014). Vegetable production training empowers farmers to achieve profitable growth
in Babati, Districts, Tanzania. [http://avrdc.org] site visited on 12/10/2015.
Badmus, M. A. and Yekinni, O. T. (2011). Economic analysis of exotic vegetable production
among urban fandama women farmers in Akinyele local government Area Oyo state,
Nigeria. International Journal of Agricultural economics and Rural Development
4(1): 19-24.
Bailey, D. K. (1998). Methods of Social Research. Collier Macmillan Publishers, London.
478pp.
Banerjee, S. B. and Martin, S. W. (2009). A Binary Logit Analysis of Factors Impacting
Adoption of Genetically Modified Cotton. Journal of AgBioForum 2009: 218-225.
Barrett, C. E., Zhao, X. and Hodges, A. (2012). Cost Benefit Analysis of Using Grafted
Transplants for Root-knot Nematode Management in Organic Heirloom Tomato
Production. Horticulture Technology 22(2): 252-257.
Bekele, W. and Drake, L. (2003). Soil and water conservation decision behavior of subsistence
farmers in the Eastern Highlands of Ethiopia: A case study of the Hunde-Lafto area.
Journal of Ecological Economics 46(3): 437 – 451.

Bhimraj, B. (Ed) (2011). Resource book on Horticulture, Nursery Management Yashwantrao
Chavan Maharashtra Open University, Nashik. 268pp.
Bok, I., Madisa, M., Machacha, D., Moamogwe, M. and More, K. (2006). Manual for Vegetable
Production, Department of Agricultural Research, Gaborone, Botswana. 57pp.
Bonabana-Wabbi, J. (2002). Assessing factors affecting adoption of agricultural technologies:
The case of Integrated Pest Management (IPM) in Kumi district, Eastern Uganda.
Thesis for Award of MSc Degree at Virginia Polytechnic Institute and State
University, Blacksburg Virginia, USA. 96-103.
Bosland, P. W. and Votava, E. J. (1999). Peppers: Vegetable, and Spice Capsicums. CABI
Publishing, New York. 56pp.
Castle, E. N., Berker, M. H. and Nelson, A. G. (1987). Farm Business Management (3rd
Ed)
McMillan Publishing. New York, USA. 220 pp.
Chase, C. (2010). Using Partial Budgets to Make Decisions [Decisions
[file:///C:/Users/user/Desktop/thesis/chase%20partila%20budget.etpdf] site visited on
22/7/2017.
Chaves, B. and Riley, J. (2001). Determination of factors influencing integrated pest
management adoption in coffee berry borer in Colombian farms. Agriculture,
Ecosystems and Environment 87: 159-177.

CIMMYT (1988). From Agronomic data to Farmer Recommendation. An Economics Training
Manual. Mexico DF. 79pp.
CIMMYT (1993). The Adoption of Agricultural Technology: A guide for survey design. 88pp.
Doss, C. R. (2006). Analysing technology adoption using micro studies: Limitations, challenges
and opportunities for improvement. Agricultural Economics Journal 34: 207-219.
Doss, C. R. and Morris, M. L. (2001). “How Does Gender Affect the Adoption of Agricultural
Innovation? The Case of Improved Maize Technologies in Ghana.” Journal of
Agricultural Economics 25: 27-39.
Edriss, A. K. and Simtowe, F. (2003). The Dynamics of Groundnut Production, Efficiency,
Profitability and Adoption of Technology in Sub-Saharan Africa: The Malawi Case.
International Publishers and Press, Las Vegas, USA.
Emana, B., Afari-Sefa, V., Dinssa, F. F., Ayana, A., Balemi, T. and Temesgen, M. (2015).
Characterization and Assessment Vegetable Production and Marketing Systems in
the Humid Tropics of Ethiopia. Journal of International Agriculture 54(2): 163-187.
Erika, O. (2013). Production Guidelines Sweet Pepper (capsicum annuum). Department of
Agricultural, forestry and Fisheries Pretoria. 20pp.
ESRF (2010). Strengthening Micro Enterprises in Tanzania: The Case of Small-Scale Vegetable
Farmers in Arusha. [http://www.tzonline. org/pdf/microenterprise. pdf] site visited on
22/9/2015.
Etoundi, S. M. N. and Dia, B. K. (2008). Determinants of the adoption of improved varieties of
maize. Proceedings of the African Economic Conference, 2008, Cameroon. 397 –
413.
Everaarts, A. P., Putter, H. and Amon, W. (2011). A survey of field vegetable production in
Tanzania, recommendations for improvement. [http://edepot.wur.nl /195026] site
visited on 22/7/2017.
FAO (2003). “Rise of Supermarkets Across Africa Threatens Small Farmers: Opportunities and
Challenges in a Changing Market”. [http://www.fao.org/
english/newsroom/news/2003/23060-en.html] site visited on 09/10/2015.
FAO (2013). Trends and impacts of Foreign Investment in Developing Country Agriculture.
[http://www.fao.org/docrep/017/i3112e/i3112e. pdf] site visited on 27/5/ 2015.
FAO (2014). FAOSTAT Database [http:// faostata.fao.org] site visited on 9on 9/9/2016.
Green, W. H. (2012). (7th
Ed) Econometric Analysis. Peason Education, Upper Saddle River,
New Jersey. 721-800pp.
Grove, J. M., Troy, A. R., O’Neil-Dunne, J. P. M., Burch, Jr., W. R., Cadenasso, M. L. and
Pickett, S. T. A. (2006). “Characterization of Households and Its Implications for the
Vegetation of Urban Ecosystems.”Journal of Ecosystems 9(4): 578.

Guanzon, Y. B. and Holmer, R. J. (2003). Peri- Urban vegetable Project, Xavier University
college of Agriculture [http:// puvep. com/ urban_ agriculture.html] site visited on
13/7/2016.
Gujarati, D. N. (2003). Basic Econometric (4th
Ed.). McGraw-Hill Higher Education. New York.
835pp.
Hatutale, G. (2010). The effect of plant population and mulching on green pepper (capsicum
annuum L) production under irrigation. Dissertation for Award of MSc Degree at
university of the free State Bloemfontein, South Africa. 65pp.
HODECT (2010). Tanzania Horticultural Development Strategy 2012-21. [http://int.
search.tb.ask.com/search/GGmain.jhtml?searchfor=HODECT+%282010%29.+Tanz
ania+Horticultural+Development+Strategy+2012-21] site visited 4/2/2016.
Horton, C. (1982). Partial budget analysis for on farm potato research. Technical information
bulletin 16, International Potato center Lima -Peru.
Idrisa, Y. L., Ogunbameru, B. O. and Madukwe, M. C. (2012). Logit and Tobit analyses of the
determinants of likelihood of adoption and extent of adoption of improved soybean
seed in Borno State, Nigeria. Greener Journal of Agricultural Sciences 2(2): 037-
045.
James, B., Ahowe A. C., Godono, U. I., Baimey, H., Goergen, H., Sikirou, R. and Toko, M.
(2010). Integrated Pest Management in Vegetable Production. A guide for extension
workers in West Africa IITA Ibadan Nigeria. 120pp.

Kajembe, G. C., Julius, F., Nduwamungu, J., Mtakwa, P. W. and Nyange, D. A. (2005). Impact
of indigenous-based interventions on land conservation: A case study of a soil
conservation and agro- forest project Arumeru Districts Tanzania. Journal of land
degradation and development (6): 311-325.
Kay, R. D., Willium, M. E. and Duffy, P. A. (2008). Farm Management (16 Ed), New York
City. Mc Graw-Hill Companies. 120pp.
Kothari, C. R. (2004). Research Methodology Methods and Techniques. (3rd
Ed.), New Age
Publisher, New Delhi, India. 401pp.
Kraybill, D. and Kidoido, M. (2009). Analysis of relative profitability of key Ugandan
agricultural enterprises by agricultural zone. Uganda Strategy Support Programme
(USSP) Background paper No. USSP04, November, 2009. IFPRI Kampala, Uganda.
Kumar, S., Josh, P. K. and Pal, S. (2004). Impact of Vegetable Research in India, National center
for Agricultural Economics and Policy Research, New Delhi. 243pp.
Lavison, R. K. (2013). Factors influencing the adoption of organic fertilizer in vegetable
production in Accra. Dissertation for Award of MSc. Degree at Legon University
Ghana. 90pp.
Lessley, B. V., Johnson, D. M. and Harison, J. C. (1999). Using partial budget to analyze farm
change, Maryland cooperative extension UMES, Collage, Collage of Agriculture
and Natural resources. [http://www.agrir.umd.edu/MCE/ publication/Fs 547.pdf]
site visited on 22/5/2016.

MAFC (2008). Agricultural Sector Review and Public Expenditure Review 2008/09 [http:
//www. kilimo. go. tz/ publications/ English pdf] site visited on 17/7/ 2016.
MAFS (2002). Study on the horticulture development in Tanzania [http:// www.
kilimo.go.tz/publications/swahili%20docs/Cps%20docs/Horti%20Final%20Report.
pdf] site visited on 30/10/2015.
Malaiyandi, S., Bayite-Kasule, S. and Mugana, S. (2010). Enterprise budget survey: An analysis
of crop and livestock Enterprises. Uganda Strategy Support Programme (USSP)
Background paper No. USSP05, June, 2010. IFPRI Kampala, Uganda.
Maponya, P., Modise, D., Heever, V. D., Mahlangu, S., Baloyi, N., Maluleke, M., Chauke, D.,
Manamela, K., Mphahlele, M., Mojapelo, M., Carstens, I. and Walt, M. V. D.
(2014). The establishment of vegetable and fruits markets and nurseries, a case
study in Greater Sekhukhune District, Limpopo province South Africa. Journal of
Agricultural Science 6: 144-174.
Matata, J., Anandajayasekawani, A., Kiriro, I. Wandara, E. O. and Dixon, J. (2001). Farming
Systems Approach to Technology Development and Transfer; FARMESA
GCP/RAF/334/SWE Harare Zimbabwe. 420pp.
Meijer, S. S., Catacutan, D., Ajayi, O. C., Sileshi, G. W. and Nieuwenhuis, M. (2015). The role
of knowledge, attitudes and perceptions in the uptake of agricultural and agroforestry
innovations among smallholder farmers in sub-Saharan Africa, International Journal
of Agricultural Sustainability 13(1): 40-54.
Mkonda, M. (2014). Rainfall variability and its association to the trends of crops production in
Mvomero district Tamzania. European Scientific Journal 10(20): 266-268.
MMA (2017). Horticultural study; Phase 1: Mapping of production of fruits and vegetables in
Tanzania [file:/// C:/ Users/ user/ Downloads/ Vegetable
%20Scooping%20Study%20in%20Tanzania%202017%20(20(1).pdf ]pdf] site
visited on 10/9/2017.
Montgomery, J. C., Tolimien, N. and Hainie, O. S. (2001). Active habitat selection by pre-
settlement reef fishes. Fish and Fisheries 2(3): 261-277.
Mtui, H. D., Maerere, A. P., Bennett., M. A. and Sibuga, K. P. (2015). Effect of mulch and
different fungicide spray regimes on yield of tomato (solanum lycopersicum l) in
Tanzania. African Journal of Food ,AgricultureFood, Agriculture, Nutrition and
Development 15(1): 9607-9619.
Munjuga, M. R., Gachuiri, A. N., Ofori, D. A., Mpanda, M. M., Muriuki, J. K., Jamnadass, R. H.
and Mowo, J. G. (2013). Nursery Management, Tree Propagation and Marketing: A
Training Manual for Smallholder Farmers and Nursery Operators. Nairobi: World
Agroforestry Centre. 60pp.
Myles, L., Kubota, C., Tronstand, R. and Junson, Y. (2014). Scenario-based cost analysis for
vegetable grafting nurseries of different technologies and sizes. Journal of
Horticulture Science 49(7): 917-930.
Nchinda, V. P., Ambe, T. E., Nathalie, H., Leke, W., Che, M. A., Nkwate, S. P., Ngassam, S. B.
and Njualem, D. K. (2010). Factors influencing the adoption intensity of improved
yam (Dioscorea spp.) seed technology in the western highlands and high guinea
savannah zones of Cameroon.Journal of Applied Biosciences 36: 2389- 2402.
Nicholson, W. and Snyder, C. (2007). Micro Economic Theory, Basic Principles and Extension.
Thomson Higher education, Natorp Boulevard USA. 763pp.

Nkamleu, G. B. (2007). Modelling Farmers’ Decisions on Integrated Soil Nutrient Management
in sub-Saharan Africa: A Multinomial Logit Analysis in Cameroon. In: (Editors by
Bationo, A., Waswa, B., Kihara, J. and Kimetu, J.), Advances in Integrated Soil
Fertility Management in Sub-Saharan Africa. Challenges and Opportunities.
Springer Publishers, Netherlands. pp. 891 – 903.
Nwalieji, A. H. and Ajayi, A. R. (2009). Farmer’s adoption of improved vegetable production
practices under fadama phase one development project in Anambra State of Nigeria.
African Journal of Biotechnology 8(18): 4395-4406.
Odiaka, O. E., Osupala, A. and Odiaka, N. I. (2013). Factors influencing the adoption of
technologies on vegetable crops by small scalesmall-scale farmers in makurdi local
government area of benue state, Nigeria. International Society for Horticultural
Science 4(2): 1-22.
Oladele, O. I. (2011). Contribution of indigenous vegetables and fruits to poverty alleviation in
Oyo State, Nigeria. Journal of Human Ecology 34(1): 1-6.
Oliver, H. (2008). An economic perspective on the theory of the firm. 1757-1774pp.
Owombo, P. T., Adiyeloja, D. K., Koledoye, G. F., Ijigbade, J. O. and Adeogbo, M. A. (2012).
Gross margin analysis of Amaranth vegetable production in Ondo State, Nigeria.
Journal of Agricultural and Biodiversity Research 1(6): 91-96.
PASS (2013). Investment Potential of Horticulture and floricultural Industry
[http://www.pass.ac.tz/index.php/focus-area/hortculture] site visited on 22/8/2016.

Putter, H., Van Koessveld, M. J. and De visser, C. L. M. (2007). Overview of the vegetable
sector in Tanzania. [http// www. library. wur.nl/ webQuery/ wurpubs /fulltext
30946] site visited on 22/10/2016.
Rahman, S. (2007). Adoption of improved technologies by the pig farmers of Aizawl district of
Mizoram, India. Journal of Livestock Research for Rural Development 19: 4-11.
Rasheli, G. A. and Temu, A. (2014). Market governance among vegetable smallholder farmers
of Mgeta, Tanzania. Journal of Co-operative and Business Studies 2(1): 22-27.
Ratha, K., Rajwant, P., Kalia, K., Tewari, J. C. and Roy, M. M. (2014). Plant Nursery
Management: Principles and Practices. Central Arid Zone Research Institute,
Jodhpur. 40pp.
Samboko, P. C. (2011). An Assessment of factors influencing the profitability of bean
production in Zambia. Dissertation for Award of Bachelor Degree at University of
Zambia. 9pp.
Sefa, V. A. and Beed, F. (2012). Enhancing vegetable value chains in rice-based and sole crop
production systems to improve household income and consumption in Morogoro.
Presented at Africa RISING East and Southern Africa Research Review and
Planning Meeting, Arusha, Tanzania, 1 to 5 October 2012. AVRDC, The World
Vegetable Center: Tainan.
Sellar, C., Chavas, J. P. and Stoll, J. R. (1986). Specification of the logit model; The case of
valuation of non, market goods. Journal of Environmental Economics and
Management, 1986: 382-390.
SEVIA (2014). Potential positive impact of production techniques on yield SEVIA
WORKSHOP [edepot.wur.nl/307747] site visite on 18/3/2015.
Sheaban, M. and Barrett, C. B. (2016). Ten striking facts about agricultural input use in sub-
Saharan Africa on press. Food Policy. 67: 12–25.
Simtowe, F., Mduma, J., Phiri, A., Thomas, A. and Zeller, M. (2007). Can Risk-aversion
Towards Fertilizer Explain part of the Non-adoption Puzzle for Hybrid Maize?
Empirical Evidence from Malawi. Journal of Applied Sciences 6(7): 1490 – 1498.
Tadesse, A. (2009). Analysis of factors determining the adoption of agricultural inputs through
multipurpose cooperatives in Tahtay-KoraroWoreda. North West Zone, Tigray,
Ethiopia. Dissertation for Award of MSc Degree at Mekelle Universty Ethiopia.
25pp.
TAHA (2011). Horticulture Value Chain in Tanzania. [file:///D:/ Files/Tanzania_TAHA.
pdfpercent20 Horticulturepercent 20overview .pdf] site visited on 12/11/2015.
TAPP (2012). Increased incomes through better farming. [http//www.tanzania-agric-org site]
visited on 27/10/2015.
TAPP (2015). Tanzania Agricultural productivity program final report 2009-15.
[http://crsps.net/wp-content/uploads/2015/9/25-M-5-Mruma-TAPP-.pdf] site visited
on 2/4/2016.
Temu, A. E. and Temu, A. A. (2006). High value agricultural products for smallholder market in
sub Saharan Africa: Trends, opportunities and research priorities. Report prepared for
international workshop on how can the poor benefit from the growing markets for
high value agricultural products? Held on 3-5 october, Colombia.

Tesfay, G. B. (2010). Economic analysis of smallholder vegetable production in Tigray
Ethiopia. Acase of IMPS′s Alamata Wereda Pilot Learning Project. Dissertation for
Award of MSc Degree at Makelle University Ethiopia. 33-38 pp.
Tesfu, M. H. (2014). Adoption of modern agricultural technologies in Urban agriculture; a case
study in Mekelle city- vegetable growers. Dissertation for Award of MSc Degree at
Mekelle University Ethiopia. 115pp.
Tewari, D. (2009). Foundation of Successful Vegetable Production System. University of
Chicago Press. [http:// agropedia. iitk.ac.in/ content/ nursery-management-
vegetables] site visited on 21/4/ 2016.
Upton, M. (1987). African farm management. Cambridge University Press Cambridge UK.
190pp.
URT (2012). Agricultural sector report. National Bureau of Statistics [www.nbs.go.tz/
nbs/takwimu/tsmp/TSMP_AWP2011-2012.pdf] site visited on 25/5/2015.
URT (2014). Basic Demographic and Socio Economic Profile Statistical Tables Tanzania
Mainland National Bureau of Statistics. National Bureau of Statistics. Ministry of
Finance. Dar es Salaam. 208pp.
Veiheij, Ed. (2004). Propagating Trees, Digigrati, Wageningen Netherland. 102pp.
World Bank (2009). The World Bank annual report 2009 year in review. [http://www.world
bank.org] site visited on 22/7/2016.

WUR (2012). Improved vegetable cultivation in Tanzania good for farmer and consumer.
[http://www.wur.nl/ en/show/ Improved-vegetable- cultivation- in-Tanzania-good-
for-farmer-and-consumer. htm] site visited on 22/4/2016.
Xaba, B. G. and Masuku, M. B. (2013). Factors affecting the productivity and profitability of
vegetable production in Swaziland. Journal of Agricultural Studies 1(2): 37-52.
Yosef, A., Bekele, K. and Albachew, M. (2013). Innovation platforms for establishment and
management of community nurseries in the central highlands of Ethiopia. Journal of
African Crop Science 21: 693-703.

APPENDENCES
Appendix 1: Interview Schedule
Questionnaire for household’s survey
Purpose: This questionnaire is prepared with the aim of collecting data about vegetable nursery
technologies in Arumeru and Mvomero district. This questionnaire will serve as an
input for the Master thesis research but also to farmers in vegetable cultivation. Hence,
the respondent is kindly required to provide his/her genuine responses to the sets of
questions being designed. Importantly, the respondent is rest assured with the
confidentiality of his/her responses. Thank you in advance for your cooperation.
Title: Feasibility Analysis of Vegetable Seed Propagation Technologies in Arumeru and
Mvomero Districts.
General information
Date of interview………………………
District……………… Ward…………………… Village……………………
Questionnaire Number………………………………
Name of enumerator…………………………………
Section 1: Household Socio-economic Characteristics
1.Name of respondent………………………………………………………
2. Respondent phone no…………………………………………………….
3. Is he/she the head of the family? 1. Yes……………2.No………………..
4. Age of respondent………………….

5. Sex………………… 1=Male, 2= Female
6. Marital status (Tick appropriate answer)
Marital status Tick Code
Single 1
Married 2
Divorced 3
Widowed 4
7. Education level (Tick appropriate)
Education level Tick Code
No education 1
Adult education 2
Primary education 3
Secondary education 4
Tertiary 5
8. Household size……………………………………..
9. Age of household members;
No Name Age Sex
1.male…2.female…
Education level Relation to HH 1.spouse
2.child 3.Others(specify)
1
2
Section 2: Nursery Activities for objective no I
10. Do you engage in vegetable production? 1. Yes……..2. No……………
11. If yes how many years have you been growing vegetables?
12. Are you a full time farmer in vegetable cultivation? 1. Yes…2. No……………
13. If no, what other activities do you undertake besides vegetable cultivation?
1. Petty cash business...2.Employed…3.Cultivation of grains…..4.Livestock
keeping….......5.Others (specify)………………………………………………

14. What types of vegetable did you grow in your plot for the last season 2014-15?
Type Plot area Location(slope of the plot)
1.flat 2.Medium 3.High 4.Both 1.Tomatoes
2.Sweetpepper
3.Eggplant
4.Varieties
5.Others (specify)
15. Farmer perception about soil fertility 1.Poor… 2.Medium…3.Fertile…4. Manured…
16. What is the source of seedlings for transplanting in your main field?
1. Own source….. 2. Buying from others………3. Both 1&2………………
17. What is the purpose for vegetable cultivation?...................
1. Subsistence farming 2. Selling of vegetable 3. selling of seed and seedlings
18. What is the size of your nursery for the particular vegetable grown?
Crop type Nursery size (seed bed, trays)
19. How many seasons per year did you raise the seedlings?...................
Which of the technologies did use for seed propagation for the planting season 2014-15
20. What type of seed did you sow?..........1. Adulterated seed 2. Improved seed 3. Hybrid seed.
21. Did you propagate seed direct in the nursery bed or by using containers?.....................
22. If containers which kind of container did you use?.........................
1= trays, 2=plastic bags 3= buckets, 4= pots, 5= clay pots, 6= seed boxes, 7= poly bags
23. What kind of plant media are you using?………………
24. What methods are you using in controlling pests and diseases in the nursery?.......... 1.Local
methods 2.Industrial chemicals 3.IPM 4.Others (specify)

25. What methods are you using in controlling weeds in the nursery?................1.Manual weeding
2. Chemical weeding 3.Others specify
26. What methods are you using in irrigating the seedlings plants in the nursery?.........
1= watering cans 2= drip irrigation 3.Plastic bucket 4.Others (specify)
27. Did you apply fertilizer to the plants in the nursery?....... 1.Yes 2. No
28. If yes, what kind of fertilizer are you applying?............................................
1= Farm yard manure, 2= Industrial fertilizer 3. Both 1&2
29. What is the nursery life span? (time between sowing and maturity for transplanting)…
30. Did you know any of vegetable seedling propagation technologies?......1.Yes 2.No
31. If yes, what are those technologies?............................................................
32. Did you use any of those technologies mentioned above?...........1.Yes 2.No If no skip to qn
36)
33. If yes what are the reasons for adoption?..................................................
1. It is profitable
2. It is easy to practice
3. Influenced by other farmers
4.Assisted by the project
5. Others (specify)
33. Can you describe survival percentage of seedling when using improved method compared to
traditional methods?...............................................
34. Can you describe changes in seedling vigour and health compared to when using local
methods………………………………………………

35. Can you describe changes in crop yield after transplanting since you started using improved
technologies? 1. Increased…..2. Decreased…….3. No change …………
36. Why did you decide not to use improved seed propagation technologies?
............................................................................................................................
1. They are so expensive
2. I have no knowledge on them
3. I am used to old practices and I have no interest on them
4. They are not profitable
5. I have no information
6. Others Specify……………………………………………………..
Section 3: Components of expenditure and revenue for objective no II
37. How did you acquire the land?.......1. Inherited 2.Purchased 3. Leased 4. Inherited and
leased
38. If leased, what is the rate per area (Tsh)……………………….
39. If purchased, what is the price per area…………………………..
40. What is your source of labor for nursery activities?......1.family labour 2. Hired and family
labour 4.Hired and communal labour
41. What are your expenses in the following fixed capital for the nursery
S/N Particulars Quantity Tsh/Unit Total
1 Fencing
2 Workshed
3 Irrigation with pipeline
4 Land preparation, nursery bed, roads
5 Water storage (water tank, drums)
42. Nursery labour use for seedling propagation technologies in 2014-15 planting season

Operations
Familly
labour Hired
labour Wage rate/day Total man
days Total cost
Seed bed preparation
Media preparation
Tray filling
Sowing seed
Weeding
Watering
Fertilizer application
Pesticides application
43. How much do you pay your labour force on nursery activity …..Tshs perday/ week/ month?
44. Non labour cost for the nursery activities
Crop Manure
Seeds Chemicals Fertilizer for
seedlings
Total cost
Amount cost Amount cost Amount cost Amount cost
44. Cost of Tools and Equipment’s
S/N Items Entity Price /unit Total cost
1 Spray pumps
2 Sprinklers
3 Axes/ hammer
4 Wheelbarrows
5 Boxes
6 Watering cans
7 Digging forks
8 Spade
9 Plastic buckets
10 Hoes
11 Trays/polybags
12 Other tools specify……………..

45. What level of output realized and benefits obtained from the sales of seedling (for the case of
commercial selling of seedlings)
Type of crop Yield(seedling) Price per unit Quantity sold Revenue
Section 4: for objective no III
47. Do you get extension services support?................ 1.Yes 2. No
48. If yes, how many times do extension officers visit in your area?………
49. Please indicate the type of extension services you get …………………
50. If no why……………………………………………………………
51. Do you receive training about practicing nursery management in vegetable
production?....................... 1.Yes 2. No
52. If yes from who?................... 1. Researcher 2.extension workers 3.Fellow trained farmers 4.
Project/NGOs………………………………….
53. Do you take credit for nursery management activities?................ 1.Yes 2.No
54. If yes, indicate the amount of credit obtained……………..
55. What was the source of credit?……1.Friends 2.Cooperative group 3.Financial institutional
56. What is the repayment period?..............................................................
57. If no for question no 55 why?.....................................................................
58. Do you think credit is helpful?.................1. Yes 2.No
59. What is the distance from nursery to water source? (time walked)…………
1. below 5min 2. 5 to 10min 3.10 to 20min 4. 20 to 30 min 5.above 30min

60. What is your farm category?....................... 1. Subsistence production of vegetables
2. Small-scale production of vegetables 3. Large scale production of vegetable
61. What is the condition in term of trays accessibility?
1= ease access 0= other wise
Section 5: Challenges and opinions in Nursery management practices for objective no IV
62. Do you face challenges in vegetable nursery management practices?............
1. Yes 2.No
63. If yes what are the major challenges in nursery management practices?
…………………………………………………………………………………
…………………………………………………………………………………
…………………………………………………………………………………..

64. What are your opinions concerning improved nursery technologies?
Opinion 1…………………………………………………………
Opinion 2…………………………………………………………
Opinion 3…………………………………………………………
65. In your own views, what do you think is the easiest (i.e. cheapest) practices for nursery
management
…………………………………………………………………………………………
…………………………………………………………
66. In your own views, what do you think is the best practices as far as nursery management is
concerned ……………………………………..
…………………………………………………………………


![For Selina Wallis LC 05.09[1]](https://img.dokumen.tips/doc/110x75/577dac301a28ab223f8d8b51/for-selina-wallis-lc-05091.jpg)